
Employment Insurance Monitoring and Assessment Report for the fiscal year beginning April 1, 2017 and ending March 31, 2018
Chapter 1: Labour market context
From: Employment and Social Development Canada
On this page
This chapter outlines key labour market developments and the economic situation in Canada during the fiscal year beginning on April 1, 2017 and ending on March 31, 2018 (FY1718), the period for which this Report assesses the Employment Insurance (EI) program.Footnote 1 Section 1.1 provides a general overview and historical context of the economic situation for FY1718. Section 1.2 summarizes key labour market developments in the Canadian economy during the reporting period.Footnote 2 Section 1.3 discusses recent trends in wage growth, hours worked and reasons for unemployment and their impacts on the EI program. More detailed tables related to elements discussed in this chapter can be found in Annex 1.
Chapter 1 - Labour market context
1.1 Economic overview
The Canadian economy experienced strong growth in the fiscal year beginning on April 1, 2017 and ending on March 31, 2018 (FY1718) as real Gross Domestic Product (GDP) increased by 3.0% which is the highest year-over-year change observed over the past five years (see Chart 1).
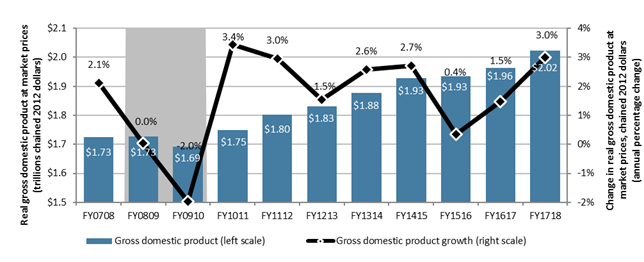
Chart 1 – Text version
| Fiscal year | Gross domestic product growth (right scale) | Gross domestic product (left scale) |
|---|---|---|
| FY0708 | 2.1% | 1.73 |
| FY0809 | 0.0% | 1.73 |
| FY0910 | -2.0% | 1.69 |
| FY1011 | 3.4% | 1.75 |
| FY1112 | 3.0% | 1.80 |
| FY1213 | 1.5% | 1.83 |
| FY1314 | 2.6% | 1.88 |
| FY1415 | 2.7% | 1.93 |
| FY1516 | 0.4% | 1.93 |
| FY1617 | 1.5% | 1.96 |
| FY1718 | 3.0% | 2.02 |
- Note: Shaded area(s) corresponds to recessionary period(s) in Canada's economy.
- Source: Statistics Canada, Table 36-10-0104-01.
The Canadian economy grew strongly in the first quarter of FY1718, before returning to more moderate growth levels in the other quarters of the fiscal year. Canada’s strong economic growth over the reporting period was driven by consumer spending, strong regional housing markets, robust global economic conditions, as well as supportive monetary and fiscal policies. Nonetheless, near the end of the fiscal year, the composition of growth began to shift away from household spending toward business investment and exports.Footnote 3 This shift is occurring as households adjust to higher interest ratesFootnote 4 and tighter mortgage rules.Footnote 5
When compared to other Group of Seven (G7) countries, Canada ranked first in real GDP growth in FY1718 (+3.0%), above France (+2.5%), Germany (+2.4%) and the United States (+2.4%). Furthermore, Canada continues to enjoy a high standard of living and ranked third among G7 nations in terms of real GDP per capita (using the fixed Purchasing Power Parity) with roughly USD 43,300 per capita.Footnote 6
Almost all industries contributed to year-over-year economic growth in FY1718. The GDP growth of the goods-producing industries (+4.9%) outpaced that of the service-producing industries (+2.8%), driven by the Mining, quarrying, and oil and gas extraction industry (+8.2%) and the Construction industry (+5.9%) (see Chart 2). Following the downturn in global commodity prices recorded in 2015 and 2016, resources-based industries started to recover in FY1718, notably attributable to a slight increase and then stabilization of global crude oil prices.

Chart 2 – Text version
| Industry | Change in gross domestic product |
|---|---|
| Goods-producing industries | 4.9% |
| Agriculture, forestry, fishing and hunting | -1.0% |
| Mining, quarrying, and oil and gas extraction | 8.2% |
| Utilities | 3.5% |
| Construction | 5.9% |
| Manufacturing | 4.1% |
| Service-producing industries | 2.8% |
| Wholesale and retail trade | 5.6% |
| Transportation and warehousing | 4.6% |
| Finance, insurance, real estate, rental and leasing | 2.5% |
| Professional, scientific and technical services | 3.1% |
| Business, building and other support services* | -0.7% |
| Educational services | 1.7% |
| Health care and social assistance | 2.4% |
| Information, culture and recreation** | 1.3% |
| Accommodation and food services | 4.0% |
| Other services (except public administration) | 1.1% |
| Public administration | 2.0% |
- * Includes management of companies and enterprises and administrative and support, waste management and remediation services.
- ** Includes information and cultural industries and arts, entertainment and recreation industries.
- Source: Statistics Canada, Table 36-10-0434-01.
1.2 The Canadian labour market in FY1718
Canada’s labour forceFootnote 7 increased by 1.0% (+199,300) to 19.8 million in FY1718, slightly over the rate recorded in the previous fiscal year (+0.8%).Footnote 8 Relative growth in labour force was more prominent in Prince Edward Island (+2.7%) and British Columbia (+2.4%), while Newfoundland and Labrador (-2.2%), New Brunswick (-1.2%) and Saskatchewan (-0.6%) saw declines. The remaining provinces posted relatively modest increases. The labour force participation rate stayed unchanged from FY1617 at 65.7% although it has been decreasing over the last 10 fiscal years. Population aging is the main factor behind this decline.Footnote 9
In FY1718, Canadian employment grew by 1.8%, surpassing the increase (+1.0%) recorded in the previous fiscal year. Almost all of the employment growth was due to an increase in full-time work. Job creation was higher in self-employment (+2.7%) and public sector (+2.6%) than in private sector (+1.4%).Footnote 10 The employment rate rose by 0.4 percentage points in FY1718 to reach 61.7%, but was still below its highest level of 63.5% recorded in FY0708.
The employment growth observed in FY1718 was spread across enterprises of all sizes.Footnote 11 Small-medium-sized and medium-large-sized firms registered the highest increases in number of employees (+2.7% for both categories), whereas small-sized enterprises recorded the lowest (+0.9%).Footnote 12 Large-sized firms observed a 1.9% rise over the same period. Meanwhile, the distribution of employees by enterprise size stayed relatively constant over recent years. In FY1718, large-sized firms employed 45.2% of workers, while the share of workers in the three other firm size categories ranged from 15.3% to 20.0%.
In addition to the increase in the number of employed individuals, the number of job vacancies (unoccupied jobs for which employers are actively seeking workers) posted a substantial increase in FY1718 (+18.8%) for a total of 464,800 vacant positions. Likewise, the job vacancy rate (the number of job vacancies expressed as a percentage of all occupied and vacant jobs) rose 0.4 percentage points to 2.9% during the reporting period. Along with the greater number of job vacancies, the duration of job vacancies also continued to rise slightly, suggesting that, in general, it took employers more time to fill their vacant positions relative to the previous year.Footnote 13Job vacancies usually become more difficult to fill when the available labour force declines relative to the number of vacant positions.
The number of unemployed individuals declined by 10.0% in FY1718, leading to a drop (-0.8 percentage points) in the national unemployment rate to 6.1%, just above the rate of 6.0% reported in FY0708 which was the lowest rate since 1976 (see Chart 3). There are nevertheless some significant regional variations, as outlined in subsection 1.2.1. In terms of EI eligibility, the lower the unemployment rate in an EI economic region, the higher the number of hours of insurable employment required to qualify for EI.
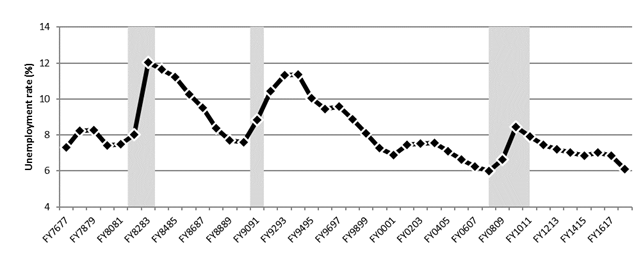
Chart 3 – Text version
| Fiscal year | Unemployment rate |
|---|---|
| FY7677 | 7.3% |
| FY7778 | 8.2% |
| FY7879 | 8.3% |
| FY7980 | 7.4% |
| FY8081 | 7.5% |
| FY8182 | 8.0% |
| FY8283 | 12.0% |
| FY8384 | 11.7% |
| FY8485 | 11.2% |
| FY8586 | 10.3% |
| FY8687 | 9.5% |
| FY8788 | 8.4% |
| FY8889 | 7.7% |
| FY8990 | 7.6% |
| FY9091 | 8.8% |
| FY9192 | 10.4% |
| FY9293 | 11.3% |
| FY9394 | 11.4% |
| FY9495 | 10.0% |
| FY9596 | 9.5% |
| FY9697 | 9.6% |
| FY9798 | 8.9% |
| FY9899 | 8.1% |
| FY9900 | 7.3% |
| FY0001 | 6.9% |
| FY0102 | 7.5% |
| FY0203 | 7.5% |
| FY0304 | 7.6% |
| FY0405 | 7.1% |
| FY0506 | 6.6% |
| FY0607 | 6.3% |
| FY0708 | 6.0% |
| FY0809 | 6.6% |
| FY0910 | 8.5% |
| FY1011 | 7.9% |
| FY1112 | 7.5% |
| FY1213 | 7.2% |
| FY1314 | 7.0% |
| FY1415 | 6.9% |
| FY1516 | 7.0% |
| FY1617 | 6.9% |
| FY1718 | 6.1% |
- Note: Shaded areas correspond to recessionary periods in Canada's economy.
- Source: Statistics Canada, Labour Force Survey, Table 14-10-0287-01.
Similar to the unemployment rate, the average duration of unemployment spells (continuous periods of unemployment where an individual is looking for work) decreased during the reporting period, falling by 1.2 weeks between FY1617 and FY1718 to 19.1 weeks.
In light of its generally strong labour market conditions in FY1718, Canada posted the strongest growth in employment and the sharpest decline in unemployment rate among the G7 countries. However, Canada continued to record the third highest unemployment rate, just below France and Italy (see Chart 4).Footnote 14
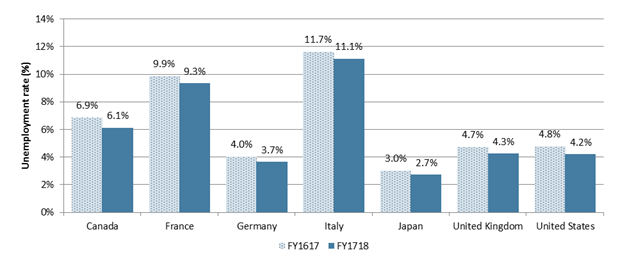
Chart 4 – Text version
| Country | FY1617 | FY1718 |
|---|---|---|
| Canada | 6.9% | 6.1% |
| France | 9.9% | 9.3% |
| Germany | 4.0% | 3.7% |
| Italy | 11.7% | 11.1% |
| Japan | 3.0% | 2.7% |
| United Kingdom | 4.7% | 4.3% |
| United States | 4.8% | 4.2% |
- Source: Organization for Economic Co-operation and Development, Short-term Labour Market Statistics, February 2019.
1.2.1 Changing regional labour markets
The strong Canadian labour market performance observed over the reporting fiscal year was essentially driven by Quebec, Ontario and British Columbia which recorded employment growth above the national average and posted among the lowest unemployment rates in FY1718. Provinces with economies more dependent on commodities (Newfoundland and Labrador, Saskatchewan and Alberta) continued recovering at different degrees from the downturn in commodity prices; Alberta being the only one recouping the jobs lost from the previous fiscal year. It also continued to post the highest labour force participation rate among all provinces.
In FY1718, Prince Edward Island, Quebec, British Columbia and Yukon presented strong labour market developments with employment and job vacancies growth rates above the national averages (see Table 1). Conversely, Newfoundland and Labrador saw declines in both employment and job vacancies, while Saskatchewan, Northwest Territories and Nunavut all recorded declines in employment over the same period.
| Province or territory |
Labour force participation rate (%) |
Employment (thousands) |
Year-over-year change in employment (%) |
Job vacancies (thousands) |
Year-over-year change in job vacancies (%) |
Job vacancy rate (%) |
|---|---|---|---|---|---|---|
| Newfoundland and Labrador | 58.8% | 223.6 | -3.3% | 3.5 | -2.5% | 1.7% |
| Prince Edward Island | 66.4% | 74.3 | +3.3% | 1.7 | +31.9% | 2.7% |
| Nova Scotia | 61.9% | 450.6 | +0.8% | 9.9 | +17.7% | 2.5% |
| New Brunswick | 61.4% | 353.1 | +0.1% | 7.7 | +19.7% | 2.6% |
| Quebec | 64.9% | 4,242.5 | +2.1% | 89.2 | +34.6% | 2.5% |
| Ontario | 64.7% | 7,155.6 | +1.9% | 185.4 | +10.2% | 3.0% |
| Manitoba | 67.1% | 645.0 | +1.5% | 14.0 | +25.6% | 2.4% |
| Saskatchewan | 68.7% | 567.2 | -0.3% | 10.1 | +11.4% | 2.2% |
| Alberta | 72.2% | 2,298.4 | +1.6% | 51.7 | +20.4% | 2.6% |
| British Columbia | 65.3% | 2,477.6 | +3.2% | 89.9 | +24.0% | 4.1% |
| Yukon | 75.8% | 21.2 | +2.4% | 0.7 | +28.7% | 4.0% |
| Northwest Territories | 70.5% | 21.2 | -4.9% | 0.6 | +14.7% | 2.8% |
| Nunavut | 63.6% | 13.4 | -0.7% | 0.4 | +23.8% | 3.1% |
| Canada | 65.7% | 18,543.4 | +1.8% | 464.8 | +18.8% | 2.9% |
- Note: Data may not add up to the total due to rounding. Percentage change is based on unrounded numbers.
- Sources: Statistics Canada, Labour Force Survey, Tables 14-10-0287-01 and 14-10-0292-01 (for data on participation rates and employment) and Job Vacancy and Wage Survey, Table 14-10-0325-01 (for data on job vacancies).
Moreover, in FY1718, most jurisdictions registered a decrease in their unemployment rate relative to the previous fiscal year; the largest declines were recorded in Yukon (-2.1 percentage points) and New Brunswick (-1.2 percentage points) (see Table 2). British Columbia continued to record the lowest unemployment rate (5.0%) among all provinces for a second consecutive fiscal year. Quebec and Ontario posted unemployment rates below the national average and for a rare occasion― first time ever for Quebec and first time since the onset of the recession of the early 1990s for Ontario― below those registered in Saskatchewan and Alberta. Indeed, even though the unemployment rates in Saskatchewan and Alberta declined in FY1718, they remained relatively high compared to what they were before the downturn in commodity prices. As for the Atlantic provinces, they still had higher unemployment rates than the rest of Canada, however two of them saw declines over the reporting period.
| Province or territory | Unemployment rate | Unemployment spell duration (weeks) | ||||
|---|---|---|---|---|---|---|
| FY1617 | FY1718 | Change (in ppts) | FY1617 | FY1718 | Change | |
| Newfoundland and Labrador | 13.7% | 14.7% | +1.0 | 17.9 | 18.7 | +0.8 |
| Prince Edward Island | 10.6% | 9.9% | -0.7 | 14.0 | 16.1 | +2.1 |
| Nova Scotia | 8.1% | 8.3% | +0.2 | 18.3 | 17.7 | -0.6 |
| New Brunswick | 9.2% | 8.0% | -1.2 | 19.5 | 18.4 | -1.1 |
| Quebec | 6.8% | 5.9% | -0.9 | 21.8 | 18.6 | -3.2 |
| Ontario | 6.4% | 5.8% | -0.6 | 20.2 | 18.6 | -1.6 |
| Manitoba | 6.1% | 5.5% | -0.6 | 18.1r | 15.9 | -2.2 |
| Saskatchewan | 6.4% | 6.1% | -0.3 | 17.8 | 18.7 | +0.9 |
| Alberta | 8.4%r | 7.4% | -1.0 | 21.9 | 22.7 | +0.8 |
| British Columbia | 5.7% | 5.0% | -0.7 | 18.4 | 18.3 | -0.1 |
| Yukon | 5.3% | 3.2% | -2.1 | not available | not available | not available |
| Northwest Territories | 7.1% | 7.3% | +0.2 | not available | not available | not available |
| Nunavut | 14.3% | 14.0% | -0.3 | not available | not available | not available |
| Canada | 6.9% | 6.1% | -0.8 | 20.3 | 19.1 | -1.2 |
- r Revised data.
- Sources: Statistics Canada, Labour Force Survey, Tables 14-10-0287-01, 14-10-0292-01 and 14-10-0056-01.
As a result of contrasting regional labour market developments in FY1718, the average duration of unemployment spells varied significantly across provinces. Both Alberta and Saskatchewan recorded a slight increase in their average unemployment spell duration despite lower unemployment rate relative to FY1617. The average unemployment spell duration in Alberta thus surpassed its highest level on record―hit over the previous fiscal year―to reach 22.7 weeks in FY1718 and stayed the highest across Canada (see Table 2). Saskatchewan also registered a small increase and posted its highest duration (18.7 weeks) since the early 2000s. In contrast, greater job opportunities and lower unemployment in Quebec, Ontario as well as Manitoba led to a moderate decrease in their average unemployment spell duration.
As opposed to the contrasting regional labour market developments above, all jurisdictions experienced a rise in their average nominal weekly earnings in FY1718, with the largest increases observed in Nunavut (+4.2%) and Quebec (+3.5%). However, when compared with the increase in the consumer price index (CPI), only eight jurisdictions recorded a greater rise in weekly earnings relative to the increase in the CPI, leading to a decline in the purchasing power of workers in the five remaining jurisdictions on average in FY1718 (see Table 3).Footnote 15
| Province or territory | Average nominal weekly earnings ($)* | Year-over-year change in nominal weekly earnings (%) | Year-over-year change in consumer price index (%) |
|---|---|---|---|
| Newfoundland and Labrador | 1,034 | +0.9% | +1.7% |
| Prince Edward Island | 828 | +0.9% | +1.9% |
| Nova Scotia | 863 | +1.8% | +1.3% |
| New Brunswick | 894 | +1.9% | +2.2% |
| Quebec | 912 | +3.5% | +1.2% |
| Ontario | 1,000 | +2.2% | +1.7% |
| Manitoba | 917 | +2.5% | +1.7% |
| Saskatchewan | 1,012 | +1.8% | +2.0% |
| Alberta | 1,139 | +2.1% | +1.5% |
| British Columbia | 950 | +2.7% | +2.1% |
| Yukon | 1,091 | +2.7% | +1.5% |
| Northwest Territories | 1,401 | +0.3% | +1.1% |
| Nunavut | 1,343 | +4.2% | +1.7% |
| Canada | 983 | +2.4% | +1.6% |
- * Earnings include overtime and apply to employees paid by the hour, salaried employees and other employees.
- Sources: Statistics Canada, Survey of Employment, Payrolls and Hours, Table 14-10-0203-01 (for data on nominal earnings), and Statistics Canada, Consumer Price Index Measures, Table 18-10-0004-01 (for data on CPI).
1.2.2 Interprovincial mobility trends
Every year, a substantial number of people in Canada (285,200 between July 1, 2017 and June 30, 2018) relocate across provincial and territorial borders. Almost half of this group (48.7%) is aged between 20 and 39 years old.Footnote 16 This movement across provinces is partly attributable to individuals in search of job opportunities and gives workers the possibility to access other labour markets and obtain a job or find one that may be better suited for their skillset. From a national perspective, interprovincial mobility can increase real GDP and aggregate labour productivity growth. It can also improve individual outcomes as workers from provinces with high unemployment and an excess of labour supply move to provinces with lower unemployment and labour shortages.
While several factors can influence an individual’s decision to move (including, but not limited to, job opportunities, education/school or family reasons) the desire to seek a higher standard of living is often a driving force. Since the mid-1990s, Western Canada, especially Alberta, was the destination of choice for a majority of Canadian interprovincial migrants. However, with the downturn in commodity prices and less favorable labour markets in Alberta, trends have somewhat shifted over recent years to Ontario and British Columbia (see Chart 5).
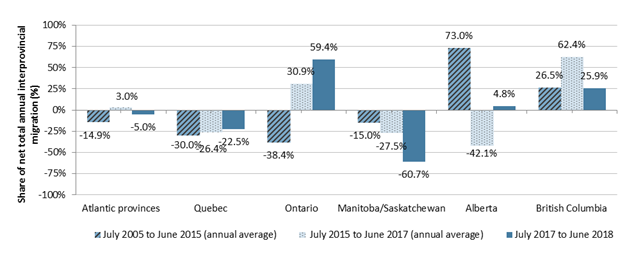
Chart 5 – Text version
| Region | July 2005 to June 2015 (annual average) | July 2015 to June 2017 (annual average) | July 2017 to June 2018 |
|---|---|---|---|
| Atlantic provinces | -14.9% | 3.0% | -5.0% |
| Quebec | -30.0% | -26.4% | -22.5% |
| Ontario | -38.4% | 30.9% | 59.4% |
| Manitoba/Saskatchewan | -15.0% | -27.5% | -60.7% |
| Alberta | 73.0% | -42.1% | 4.8% |
| British Columbia | 26.5% | 62.4% | 25.9% |
- Note: Annual is defined as the period from July 1 to June 30. Results for the territories are not presented to lighten the chart. Consequently, the total net migration doesn’t add up to zero.
- Source: Statistics Canada, Table 17-10-0021-01.
Labour market developments in Ontario and British Columbia have made those provinces the preferred destinations of interprovincial migrants since July 2015 (+13,400 and +17,700 on average per year respectively). The large negative net flow recorded in Alberta over the July 2015 to June 2017 period faded between July 2017 and June 2018, whereas it widened in Manitoba and Saskatchewan over the same period. The outflow from the Atlantic provinces is significantly lower since July 2015 than the previous ten years (-1,500 in the reporting period compared to 4,800 on average per year between July 2005 and June 2015).
1.3 Trends in labour market elements linked to the EI program
Along with the labour market developments presented in the previous section, changes in other labour market elements, such as wages and hours worked, could also have implications on some components of the EI program. For instance, earnings―which are most often a combination of hourly wages and hours worked―determine the EI premiums paid by employers and employees, as well as the level of benefits that claimants can receive. Hours worked are also important for the administration of the EI program because the number of hours of insurable employment worked in the previous year is used, in part, to establish EI eligibility and the number of weeks of benefits a claimant is entitled to receive. In addition, the composition of the unemployed population has evolved over the years which could have resulted in changes in reasons leading to unemployment, which are also a key characteristic in determining eligibility for EI benefits.
1.3.1 Wages
As in most developed countries, long-term trends―such as population aging, movement towards service-producing industries and technological improvements resulting in the automation of routine non-cognitive and manual tasks― have driven major transformations in Canada’s labour market. These trends have had profound impacts on the demand and supply of labour, and have influenced wage growth experienced by workers as well.
The hourly wages increased slowly during the 1980s and 1990s, before rising at a faster pace during much of the 2000s until the 2008 recession. Over the years, wage trends varied according to age group, gender, education level and industry. Young workers, men and less-educated workers generally recorded lower wage growth.Footnote 17
In FY1718, as outlined in section 1.2, the Canadian economy made considerable progress in job creation and the unemployment rate fell to a relatively low level. These significant improvements in labour market conditions contributed to rising wages but at a slower pace than expected.Footnote 18 As shown in Chart 6, average nominal hourly wages posted an average year-over-year growth rate of +2.6% between FY0809 and FY1718,Footnote 19 whereas they increased by 2.1% in FY1718.Footnote 20 Likewise, wage growth in the previous two fiscal years was below the average. Similar to Canada, wage growth in Organization for Economic Co-operation and Development (OECD) countries also remained remarkably lower than before the Great Recession for comparable levels of unemployment, and stayed low during the recovery period.Footnote 21
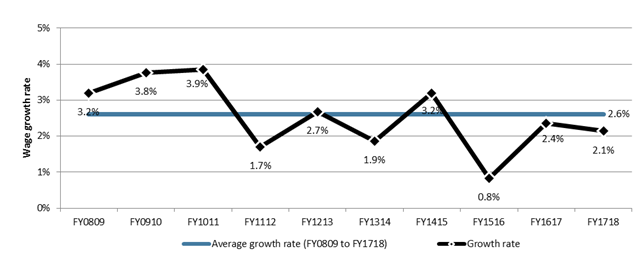
Chart 6 – Text version
| Fiscal year | Average growth rate (FY0809 to FY1718) | Growth rate |
|---|---|---|
| FY0809 | 2.6% | 3.2% |
| FY0910 | 2.6% | 3.8% |
| FY1011 | 2.6% | 3.9% |
| FY1112 | 2.6% | 1.7% |
| FY1213 | 2.6% | 2.7% |
| FY1314 | 2.6% | 1.9% |
| FY1415 | 2.6% | 3.2% |
| FY1516 | 2.6% | 0.8% |
| FY1617 | 2.6% | 2.4% |
| FY1718 | 2.6% | 2.1% |
- Source: Statistics Canada, Survey of Employment, Payrolls and Hours (SEPH), Table 14-10-0209-01.
Wage growth dynamics are linked to a variety of factors, notably labour productivity, labour market tightness (degree to which additional labour resources remain available) and inflation expectations. Demographic shifts, structural changes and minimum wages increases can also reflect on the aggregate wage growth.
After a negative growth in FY1516 (-1.6%), the labour productivity of Canadian businesses increased in FY1617 (+1.1%) and FY1718 (+1.1%) supporting wage growth.Footnote 22 Recent analysis has shown that labour productivity growth was a factor contributing to wage growth over that period, but only to a small extent.Footnote 23
The decline in commodity prices was also a factor slowing down wage growth, as both Alberta and Saskatchewan (see Chart 7A)Footnote 24 and goods-producing industries (see Chart 7B) experienced negative wage growth in FY1516. Wage growth in these areas rebounded in FY1617, associated with the end of the commodity price downturn, but that growth was not sustained in FY1718 and remained below the national average.
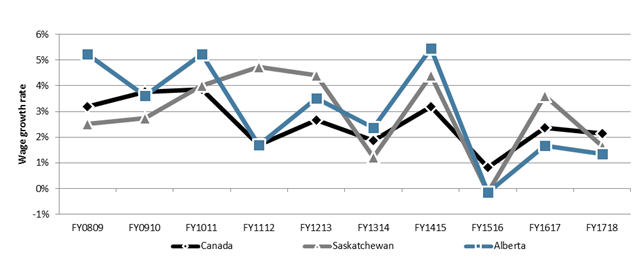
Chart 7A – Text version
| Fiscal year | Canada | Saskatchewan | Alberta |
|---|---|---|---|
| FY0809 | 3.2% | 2.5% | 5.2% |
| FY0910 | 3.8% | 2.7% | 3.6% |
| FY1011 | 3.9% | 4.0% | 5.2% |
| FY1112 | 1.7% | 4.7% | 1.7% |
| FY1213 | 2.7% | 4.4% | 3.5% |
| FY1314 | 1.9% | 1.2% | 2.4% |
| FY1415 | 3.2% | 4.4% | 5.5% |
| FY1516 | 0.8% | -0.1% | -0.1% |
| FY1617 | 2.4% | 3.6% | 1.7% |
| FY1718 | 2.1% | 1.7% | 1.3% |
- Source: Statistics Canada, Survey of Employment, Payrolls and Hours (SEPH), Table 14-10-0209-01.
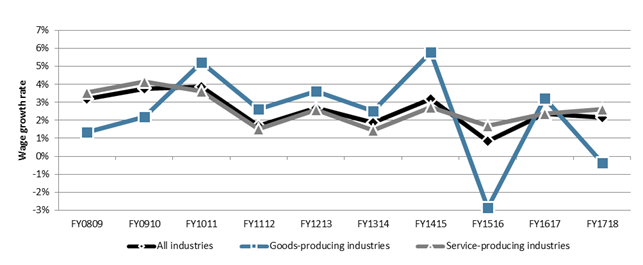
Chart 7B – Text version
| Fiscal year | All industries | Goods-producing industries | Service-producing industries |
|---|---|---|---|
| FY0809 | 3.2% | 1.3% | 3.5% |
| FY0910 | 3.8% | 2.2% | 4.1% |
| FY1011 | 3.9% | 5.2% | 3.6% |
| FY1112 | 1.7% | 2.6% | 1.5% |
| FY1213 | 2.7% | 3.6% | 2.6% |
| FY1314 | 1.9% | 2.5% | 1.5% |
| FY1415 | 3.2% | 5.8% | 2.7% |
| FY1516 | 0.8% | -2.9% | 1.7% |
| FY1617 | 2.4% | 3.2% | 2.4% |
| FY1718 | 2.1% | -0.4% | 2.6% |
- Source: Statistics Canada, Survey of Employment, Payrolls and Hours (SEPH), Table 14-10-0209-01.
The relative impact of the commodity prices decline on the overall wage growth rate depended not only on the extent to which wages and employment within those specific provinces and industries had evolved but also on changes in the overall composition of employment. For instance, while much of the decline in average earnings in Alberta from 2015 to 2016 was due to job losses in the high-wage resource extraction industry, a part was also attributable to a compositional shift towards jobs in lower-wage industries.Footnote 25 At the national level, the effect of the reallocation of workers from the goods-producing industries to the service-producing industries (where wages are lower) has been found to play a limited role on wage growth during the period of the commodity price decline.Footnote 26
The additional labour resources that remained available, despite a relatively low level of unemployment in FY1718, appeared to be a key factor contributing to wages rising somewhat more slowly than expected with an economy operating near capacity.Footnote 27 For example, long-term unemployment in the reporting fiscal year remained significantly higher than it was before the 2008 recession, whereas the participation rate of youth aged 15 to 24 years old stayed markedly lower (see Chart 8).Footnote 28 The average number of hours worked also remained slightly lower (see subsection 1.3.2).
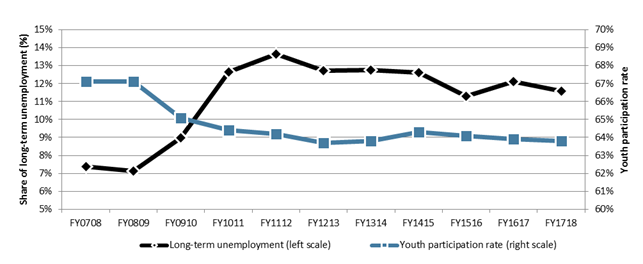
Chart 8 – Text version
| Fiscal year | Long-term unemployment (left scale) | Youth participation rate (right scale) |
|---|---|---|
| FY0708 | 7.4% | 67.1% |
| FY0809 | 7.1% | 67.1% |
| FY0910 | 9.0% | 65.1% |
| FY1011 | 12.7% | 64.4% |
| FY1112 | 13.6% | 64.2% |
| FY1213 | 12.7% | 63.7% |
| FY1314 | 12.8% | 63.8% |
| FY1415 | 12.6% | 64.3% |
| FY1516 | 11.3% | 64.1% |
| FY1617 | 12.1% | 63.9% |
| FY1718 | 11.6% | 63.8% |
- * Long-term unemployment is defined as unemployed individuals that have been searching for a job for a period of at least twelve consecutive months. The percentages presented in this chart are the long-term unemployed as a proportion of all unemployed individuals.
- Sources: Statistics Canada, Labour Force Survey, Table 14-10-0056-01 (for long-term unemployment) and Table 14-10-0287-01 (for youth participation rate).
In addition, Canada is also experiencing a demographic shift in the distribution of the workforce across different age groups such as the increase in the share of workers aged 55 years old and over in recent years. This change in age composition may have contributed to the trend in low wage growth in two ways. First, older workers recorded the lowest average wage growth rate between FY0809 and FY1718 relative to youth aged 15 to 24 years old and workers aged 25 to 54 years old. Second, retiring baby boomers hold high-paying jobs and their exit from employment could have restrained wage growth. Nevertheless, workers aged 25 to 54 years old were the main age group driving the weaker wage growth in FY1617 and FY1718 (see Table 4).
| Average annual growth rate (FY0809 to FY1718) |
Growth rate in FY1617 | Growth rate in FY1718 | |
|---|---|---|---|
| Gender | |||
| Men | +2.3% | +1.3% | +2.1% |
| Women | +2.7% | +2.2% | +2.2% |
| Age category | |||
| 15 to 24 years old | +2.5% | +1.7% | +2.7% |
| 25 to 54 years old | +2.4% | +1.4% | +2.1% |
| 55 years old and over | +2.2% | +2.0% | +2.1% |
| Skill level* | |||
| High-skilled employment | +2.4% | +2.8% | +1.5% |
| Middle-skilled employment | +2.2% | +0.2% | +2.1% |
| Low-skilled employment | +2.4% | +1.5% | +3.0% |
- Note: Results reported in this table are based on data from the Labour Force Survey (LFS). Figures on growth rate of average hourly wages by type of industries and region previously presented in this subsection are based on the Survey of Employment, Payrolls and Hours (SEPH). LFS data are used to provide results by age group, gender and skill level because SEPH doesn’t include information on characteristics of workers.
- * High-skilled jobs correspond to occupations associated with management and jobs usually requiring a university degree; middle-skilled jobs correspond to those usually requiring a college or high-school degree or apprenticeship training; while low-skilled jobs are those usually requiring on-the-job training.
- Sources: Statistics Canada, Labour Force Survey, Tables 14-10-0065-01 and 14-10-0306-01.
The highest wage growth rate in FY1718 was recorded by youth aged 15 to 24 years old, which could be partly attributable to increases in minimum wagesFootnote 29 (notably in Ontario), given the high proportion of young employees working at minimum wage rates (about one out of two youth aged 15 to 19 years old and one out of six youth aged 20 to 24 years old in 2013).Footnote 30 Furthermore, young workers experienced a relatively stronger average wage growth between FY0809 and FY1718. However, this hides some negative effects associated with graduating during recessions, such as, earnings penalty when entering the labour market and inability to recover lost wages for several years thereafter. Some studies have estimated the persistent earnings decline to range between 5% to 8% for those graduating at the time of the 2008 recession.Footnote 31
In addition to raising wages of young workers, recent increases in minimum wages also seemed to have greatly affected wages of workers in low-skilled jobs. Not only the average wage growth rate for those workers in FY1718 was higher than the one they have experienced since the 2008 recession, it was also greater than those registered by workers in high-skilled and middle-skilled jobs in FY1718 (see Table 4). The higher incidence of minimum wage raises on low-skilled jobs can be explained, in part, by the fact that almost half of low-skilled jobs are in the Retail trade and Accommodation and food services industriesFootnote 32, and that employees in those industries are more likely to be paid at minimum wage.Footnote 33
The recent increases in minimum wages also led to a larger proportion of workers earning minimum wage, from 6% in early 2017 to 10% in early 2018 in Canada.Footnote 34 As minimum wage rates increase, the proportion of employees paid at minimum wage also tends to increase because some employees who were earning wages marginally above the minimum wage rate before increases are introduced then join the population of those earning minimum wage, if their wages are not increased proportionately.
On the basis of gender, hourly wages were higher, on average, for men ($28.24) than women ($24.46) in FY1718, a pay rate of women equal to 86.6% of the pay rate of men.Footnote 35 However, the average wage growth between FY0809 and FY1718 was slightly higher for women (+2.7%) than men (+2.3%), reflecting that the gender wage gap has been narrowing over time.
Overall, from an EI perspective, the average EI weekly benefit rates have risen at a slower rates in the last few fiscal years (+2.8%, +0.7% and +1.6% in FY1516, FY1617 and FY1718, respectively, compared to +5.8% in FY1314 and +3.6% in FY1415). In addition to wages, other items such as changes in the average number of hours worked per week (as weekly earning is a combination of hourly wages and hours worked per week), differences between the labour force and the EI claimant population, shifts in the composition of EI claimants and the fact that the level of EI benefits is calculated with the variable best weeks provisionFootnote 36 had some repercussions on the average EI weekly benefit growth rates.
1.3.2 Hours worked
The number of hours of insurable employment is a key eligibility criterion of the EI program as claimants must have worked a minimum number of insurable hours, in the previous year, to qualify for EI benefits. It also determines, along with the regional unemployment rate, the maximum number of weeks of EI benefits a claimant is entitled to receive.
Different factors influence the trends in the number of hours people spend working. Union status, industrial structure, job conditions, demographic characteristics, macroeconomic conditions, taxation policies creating incentives or disincentives, preferences and labour market regulations have been identified in the literature as factors explaining differences and changes in hours worked.Footnote 37
Over the past four decades, average hours worked by Canadian workers have been on a downward trend, decreasing by 7.1% between FY7677 and FY1718 (see Chart 9).Footnote 38 More recently, despite a slight decrease at the time of the decline in commodity prices, average hours worked remained stable but below the 2008 pre-recession level. In FY1718, workers worked 35.8 hours per week on average. To qualify for EI regular benefits, potentially eligible unemployed individuals must have accumulated between 420 and 700 hours of insurable employment over the previous year.
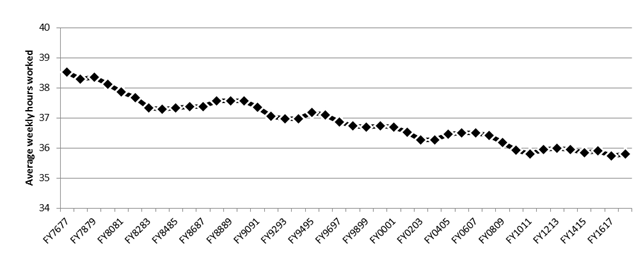
Chart 9 – Text version
| Fiscal year | Average weekly hours worked |
|---|---|
| FY7677 | 38.5 |
| FY7778 | 38.3 |
| FY7879 | 38.4 |
| FY7980 | 38.1 |
| FY8081 | 37.9 |
| FY8182 | 37.7 |
| FY8283 | 37.3 |
| FY8384 | 37.3 |
| FY8485 | 37.3 |
| FY8586 | 37.4 |
| FY8687 | 37.4 |
| FY8788 | 37.6 |
| FY8889 | 37.6 |
| FY8990 | 37.6 |
| FY9091 | 37.4 |
| FY9192 | 37.1 |
| FY9293 | 37.0 |
| FY9394 | 37.0 |
| FY9495 | 37.2 |
| FY9596 | 37.1 |
| FY9697 | 36.9 |
| FY9798 | 36.7 |
| FY9899 | 36.7 |
| FY9900 | 36.7 |
| FY0001 | 36.7 |
| FY0102 | 36.5 |
| FY0203 | 36.3 |
| FY0304 | 36.3 |
| FY0405 | 36.5 |
| FY0506 | 36.5 |
| FY0607 | 36.5 |
| FY0708 | 36.4 |
| FY0809 | 36.2 |
| FY0910 | 35.9 |
| FY1011 | 35.8 |
| FY1112 | 36.0 |
| FY1213 | 36.0 |
| FY1314 | 36.0 |
| FY1415 | 35.8 |
| FY1516 | 35.9 |
| FY1617 | 35.7 |
| FY1718 | 35.8 |
- Note: Average hours worked per week reflects the number of hours usually worked in the reference week of the Labour Force Survey at the main job occupied by Canadian employees.
- Source: Statistics Canada, Labour Force Survey, Table 14-10-0030-01.
Similar to Canada, other G7 countries have experienced a decrease in their hours worked per week since the beginning of the twenty-first century. For instance, Italy and Japan, who posted among the longest weekly hours worked on average, also recorded the largest declines since the year 2000. Canada ranked fourth among G7 countries in terms of the average number of hours worked per week in 2017.Footnote 39
The reduction in the average level of weekly hours worked in Canada is the result of shifts in the distribution of hours in the work week since the 1990s across all categories of hours. A larger share of individuals have worked less than 29 hours per week or between 30 to 39 hours per week between FY7677 and FY1718, while a smaller portion of individuals have worked between 40 to 49 hours per week or even very long hours (50 hours or more per week) during the same period (see Chart 10).
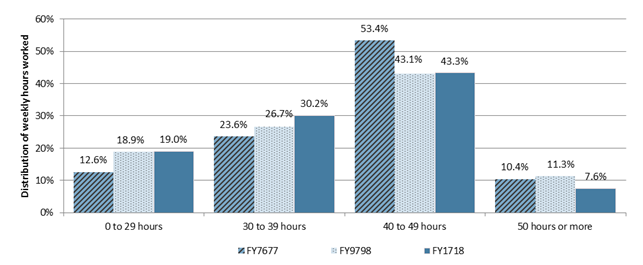
Chart 10 – Text version
| weekly hours worked | FY7677 | FY9798 | FY1718 |
|---|---|---|---|
| 0 to 29 hours | 12.6% | 18.9% | 19.0% |
| 30 to 39 hours | 23.6% | 26.7% | 30.2% |
| 40 to 49 hours | 53.4% | 43.1% | 43.3% |
| 50 hours or more | 10.4% | 11.3% | 7.6% |
- Source: Statistics Canada, Labour Force Survey, Table 14-10-0030-01.
Although weekly hours of work declined, the majority (81.0%) of Canadian workers continue to report working in full-time employment (defined as 30 hours or more per week) in FY1718. However, there has been a decline of 6.4 percentage points between F7677 and FY1718 in the share of employees occupying full-time jobs.Footnote 40
A greater share of those working part-time (less than 30 hours per week) in FY1718 did so by choice, because they were attending school (29.2%) or because of personal preference (28.1%). The proportion of part-time workers who reported that they would prefer full-time work—known as the “involuntary part-time rate”—was 23.6% in FY1718.Footnote 41 This is the lowest involuntary part-time rate recorded since the end of the 2008 recession.Footnote 42
On average, women worked fewer weekly hours than men (32.9 versus 38.4 hours in FY1718) and were less likely to be employed full-time (73.9% versus 87.5% for men over the reporting period). By age, as expected, individuals aged 25 to 54 years old reported working the longest hours per week on average (37.7 in FY1718) relative to young workers (27.2) and older workers aged 55 years old and over (35.3) (see Table 5). All age groups have seen declines in their average hours worked over the past four decades, but the drop has been most pronounced among youth aged 15 to 24 years old with a decrease of 22.0% between FY7677 and FY1718. This decline may be associated with rising secondary and postsecondary enrolment in the 1980s and 1990s, resulting in more youth working part-time while attending school, as opposed to leaving school and immediately starting full-time work.
| Average hours worked per week in FY1718 | Change in average hours worked per week FY7677 to FY1718 |
|
|---|---|---|
| Gender | ||
| Men | 38.4 | -7.3% |
| Women | 32.9 | -1.9% |
| Age category | ||
| 15 to 24 years old | 27.2 | -22.0% |
| 25 to 54 years old | 37.7 | -5.5% |
| 55 years old and over | 35.3 | -10.1% |
| Industry | ||
| Goods-producing industries | 40.5 | not available |
| Service-producing industries | 34.6 | not available |
| Canada | 35.8 | -7.1% |
- Sources: Statistics Canada, Labour Force Survey, Tables 14-10-0030-01 and 14-10-0034-01.
The growing share of older workers in the workforce―which almost doubled from 11.7% of employment in FY7677 to 21.3% in FY1718Footnote 43―also has an impact on the average hours worked. As weekly hours spent working by older workers have always been generally lower than the Canadian average and have declined at a faster pace than the national level over the past forty years, the rising share of older workers contributed to dragging down the average level of hours worked over time.
Along with the higher school enrolment among youth and the greater proportion of older workers, the growing share of employment in service-producing industries (from 65.5% in FY7677 to 78.9% in FY1718)Footnote 44 has also contributed to the reduction in average hours worked per week. As employees in service-producing industries work, on average, fewer hours per week (34.6 hours in FY1718) than workers in goods-producing industries (40.5 hours), the higher proportion of work in service-producing industries has led to lower weekly hours worked, on average, over the past forty years.
From an EI perspective, the fact that some individuals work fewer hours per week than others (for example, women and workers in service-producing industries compared to men and workers in goods-producing industries) makes them less likely to accumulate sufficient work hours to qualify for EI benefits. For those who qualify, they may receive lower benefit entitlements on average. In addition, as women and workers in service-producing industries often received lower hourly wagesFootnote 45, this may lead to lower weekly benefit rates when an EI claim is established and proportionally lesser total benefits paid to those workers on average.
At a regional level, as shown in Chart 11, hours worked per week in Alberta, Saskatchewan and in most Atlantic provinces were generally higher than the Canadian average in FY1718, while those worked in Quebec and British Columbia were lower on average. In terms of average hourly wages, Alberta was the only province posting a level significantly above the national average during the reporting period, whereas most Atlantic provinces registered levels below the national figure. These differences across provinces can be attributable to significant regional variations in economic and labour market conditions such as differences in economic sectors, labour force characteristics and employment patterns. Because the eligibility to the EI program is sensitive to economic and employment conditions in a given region, provinces with above-average number of hours worked did not always record high EI eligibility rates. For example, Alberta generally posted EI eligibility rates below the Canadian average in recent years (see section 2.2). It is important to note that eligibility to the EI program could also vary within a province.

Chart 11 – Text version
| Province | Average weekly hours worked | Average hourly wages |
|---|---|---|
| Newfoundland and Labrador | 38.1 | $24.89 |
| Prince Edward Island | 37.5 | $22.02 |
| Nova Scotia | 36.3 | $23.44 |
| New Brunswick | 37.3 | $22.54 |
| Quebec | 35.0 | $25.10 |
| Ontario | 35.9 | $26.66 |
| Manitoba | 35.9 | $24.23 |
| Saskatchewan | 37.0 | $26.96 |
| Alberta | 36.9 | $30.26 |
| British Columbia | 35.3 | $26.02 |
| Canada | 35.8 | $26.37 |
- Sources: Statistics Canada, Labour Force Survey, Table 14-10-0030-01 (for weekly hours worked) and Table 14-10-0065-01 (for hourly wages).
1.3.3 Reasons for unemployment
Changes in labour supply and labour demand over the last decades have resulted in new employment and unemployment dynamics leading to changes in the composition of the unemployed population. For instance, the share of youth aged 15 to 24 years old among the total unemployed population decreased by almost half in FY1718 compared to FY7677, while the share of individuals aged 55 years old and over more than doubled over the same period.Footnote 46 The events leading to a job separation (such as a layoff, retirement or return to school) might be different between both age groups. Likewise, unemployment can result from a number of factors and the reasons for a person’s unemployment are a key factor in determining eligibility for EI benefits.Footnote 47 Generally, EI regular benefits are only available to individuals who have lost their job for reasons outside their control or who left their job with just cause.
In FY1718, individuals who became unemployed because they lost their job (job losers) accounted for the largest share of the unemployed population in Canada (41.5%). Nine out of ten of those individuals became unemployed because of a permanent layoff. The proportion of 'job losers' has fluctuated since the early 2000s, increasing just over 50% at the end of the 2008 recession and raising also slightly during the downturn in commodity prices (see Chart 12). A higher share of men reported being unemployed following a job loss than women (46.1% for men compared to 35.6% for women in FY1718).
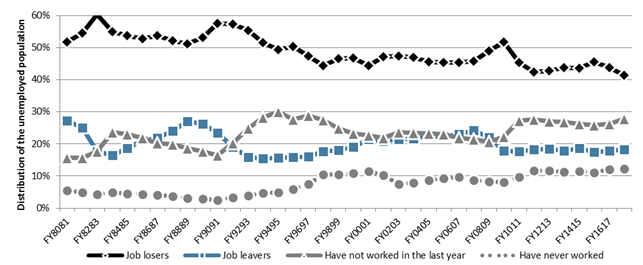
Chart 12 – Text version
| Fiscal year | Job losers | Job leavers | Have not worked in the last year | Have never worked |
|---|---|---|---|---|
| FY8081 | 51.7% | 27.2% | 15.7% | 5.4% |
| FY8182 | 54.5% | 25.0% | 15.6% | 4.9% |
| FY8283 | 60.3% | 17.6% | 17.7% | 4.3% |
| FY8384 | 55.0% | 16.5% | 23.6% | 4.9% |
| FY8485 | 53.8% | 18.6% | 23.0% | 4.5% |
| FY8586 | 52.8% | 21.1% | 21.9% | 4.2% |
| FY8687 | 53.8% | 21.9% | 20.3% | 4.1% |
| FY8788 | 52.2% | 24.1% | 19.9% | 3.8% |
| FY8889 | 51.2% | 27.0% | 18.6% | 3.2% |
| FY8990 | 53.1% | 26.2% | 17.7% | 2.9% |
| FY9091 | 57.6% | 23.4% | 16.5% | 2.5% |
| FY9192 | 57.3% | 19.1% | 20.2% | 3.4% |
| FY9293 | 55.3% | 15.9% | 24.8% | 4.0% |
| FY9394 | 51.5% | 15.5% | 28.3% | 4.8% |
| FY9495 | 49.4% | 15.7% | 30.0% | 4.9% |
| FY9596 | 50.4% | 15.9% | 27.6% | 6.0% |
| FY9697 | 47.5% | 16.2% | 28.8% | 7.6% |
| FY9798 | 44.4% | 17.7% | 27.4% | 10.5% |
| FY9899 | 46.5% | 18.0% | 24.9% | 10.6% |
| FY9900 | 46.9% | 19.0% | 23.2% | 10.9% |
| FY0001 | 44.4% | 21.5% | 22.6% | 11.5% |
| FY0102 | 47.2% | 20.8% | 21.8% | 10.2% |
| FY0203 | 47.3% | 21.5% | 23.6% | 7.5% |
| FY0304 | 47.0% | 21.7% | 23.4% | 7.9% |
| FY0405 | 45.6% | 22.5% | 23.4% | 8.6% |
| FY0506 | 45.4% | 22.2% | 23.1% | 9.3% |
| FY0607 | 45.4% | 23.1% | 21.8% | 9.7% |
| FY0708 | 45.7% | 24.2% | 21.5% | 8.7% |
| FY0809 | 48.9% | 22.1% | 20.7% | 8.3% |
| FY0910 | 51.7% | 18.0% | 22.3% | 8.1% |
| FY1011 | 45.4% | 17.6% | 27.3% | 9.7% |
| FY1112 | 42.4% | 18.3% | 27.7% | 11.7% |
| FY1213 | 42.9% | 18.4% | 27.0% | 11.7% |
| FY1314 | 43.8% | 17.9% | 26.9% | 11.4% |
| FY1415 | 43.5% | 18.6% | 26.3% | 11.6% |
| FY1516 | 45.6% | 17.5% | 25.9% | 11.1% |
| FY1617 | 43.8% | 17.9% | 26.2% | 12.1% |
| FY1718 | 41.5% | 18.3% | 27.9% | 12.4% |
- Source: Statistics Canada, Labour Force Survey, Table 14-10-0125-01.
Individuals who were unemployed because they left their job (job leavers) accounted for 18.3% of the unemployed population in FY1718. Following the 2008 recession, the share of 'job leavers' has declined and remained below 20%. In a period of strong economic growth, often people who are already employed become more willing to leave their current position and switch to a higher-paying job.Footnote 48 During previous economic recoveries in Canada, the share of unemployed workers defined as 'job leavers' increased, at different paces, after the recession of the early 1980s and of the early 1990s; however this situation has not been observed after the 2008 recession.
By age, a higher proportion of unemployed individuals aged 15 to 24 years old were 'job leavers' relative to unemployed individuals aged 25 to 54 years old and those aged 55 years old and over (see Chart 13), which may partly reflect the tendency to return to school in this age category, the dynamics of part-time student employment, as well as the school-to-work transitions of youth.
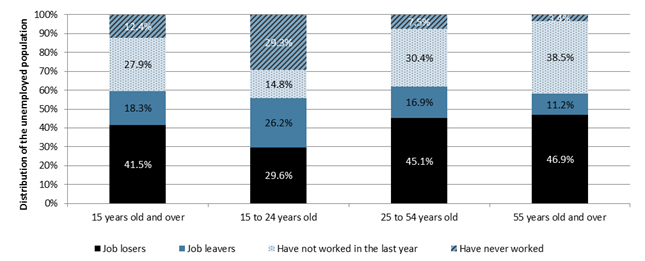
Chart 13 – Text version
| Age category | Job losers | Job leavers | Have not worked in the last year | Have never worked |
|---|---|---|---|---|
| 15 years old and over | 41.5% | 18.3% | 27.9% | 12.4% |
| 15 to 24 years old | 29.6% | 26.2% | 14.8% | 29.3% |
| 25 to 54 years old | 45.1% | 16.9% | 30.4% | 7.5% |
| 55 years old and over | 46.9% | 11.2% | 38.5% | 3.4% |
- Source: Statistics Canada, Labour Force Survey, Table 14-10-0125-01.
In addition to those who quit or lost their job, the unemployed population is also composed of individuals who have no recent work experience, either because they have not worked in the last year, or even for a longer period of time, or because they have never worked.Footnote 49
The first group, the unemployed individuals who have not worked in the last year, represented 27.9% of the unemployed population in FY1718. This proportion increased by 7.0 percentage points the years after the 2008 recession, and remained relatively unchanged thereafter (see Chart 12). In FY1718, a higher proportion of unemployed women fell in that category than men. Individuals aged 55 years old and over were also more likely to be in that situation relative to the other two age groups (see Chart 13).
Moreover, unemployed individuals aged 55 years old and over were more likely to be long-term unemployed (individuals that have been searching for a job for a period of at least twelve consecutive months), posting a rate of 18.9% in FY1718, compared to unemployed individuals aged 15 to 24 years old and those aged 25 to 54 years old (5.2% and 12.0%, respectively).Footnote 50 Older individuals might face particular challenges when looking for work including, among others, being generally less-educated and less likely to have recently attended school or taken job-related training than their younger counterparts.Footnote 51
Overall, the share of long-term unemployment in Canada was 11.6% in FY1718, which remained the lowest among G7 countriesFootnote 52, but was still well above the rate recorded at the onset of the latest recession (7.1% in FY0809). Prolonged periods of unemployment may negatively affect one’s odds of finding employment as well as future employment earnings reflecting, among other things, skill and knowledge losses during long unemployment spells.
The second group among unemployed individuals with no recent work experience, those who have never worked, accounted for 12.4% of the total unemployed population in FY1718. While this group represented less than 10% of the total unemployed population in the 2000s, its share increased above that level in FY1011 and remained relatively stable thereafter (see Chart 12). As expected, a larger proportion of unemployed youth aged 15 to 24 years old fell in that category. This could be partly attributable to their inherent lack of work experience and/or educational attainment, and also, as noted by the OECD, because they may not have developed some employability skills valued by employers.Footnote 53
From an EI perspective, the higher proportion of unemployed individuals with no recent work experience has an impact on the indicators of access and coverage of EI. Eligibility for EI regular benefits is based on the amount of hours of insurable employment that an individual has accumulated in the previous 52 weeks. Indicators used to estimate the coverage and access to EI benefits, such as the ratio of EI regular beneficiaries to the number of unemployed, are based on all unemployed (thus including those that have no recent work experience) and are impacted by this trend.
1.4 Summary
Canada’s labour market has undergone several changes over the past few decades. Among them, a greater concentration of employment within the service-producing industries and a shift in the age composition of the workforce have changed the nature of work and the makeup of the labour force which have influenced, to some extent, wage growth dynamics and trends in hours worked. These trends are relevant to the EI program and its administration.
In FY1718, the Canadian economy was characterized by a solid GDP growth (+3.0%)—the highest among the G7 countries. Moreover, Canada posted the strongest growth rate in employment and the sharpest decline in the unemployment rate compared with other G7 countries. However, Canada still had the third highest unemployment rate.
The reporting period was also marked by an increase in job vacancies as well as a relatively low unemployment rate in Canada—generally rising the number of hours of insurable employment required to qualify for EI regular benefits. Nevertheless, there were important regional variations in labour market conditions. While, the resources-based provinces (Newfoundland and Labrador, Saskatchewan and Alberta) continued recovering at different paces from the commodity price decline, British Columbia, Ontario and Quebec’s economies posted strong overall labour market performances. The impact of the changing economic situation in many of these regions on the EI program is seen in this report.