
Employment Insurance Monitoring and Assessment Report for the fiscal year beginning April 1, 2017 and ending March 31, 2018
Chapter 2 - 2 Employment Insurance regular benefits
From: Employment and Social Development Canada
On this page
- 2.2 Employment Insurance regular benefits
- 2.2.1 Employment Insurance regular claims and amount paid
- 2.2.2 Employment Insurance regular benefits: coverage, eligibility and access
- 2.2.3 Level of Employment Insurance regular benefits
- 2.2.4 Extension of Employment Insurance regular benefits for workers in regions affected by the downturn in commodity prices
- 2.2.5 Employment Insurance regular benefit entitlement
- 2.2.6 Employment Insurance regular benefits and seasonal claimants
- 2.2.7 Exhaustion of Employment Insurance regular benefits
- 2.2.8 Working While on Claim
2.2 Employment Insurance regular benefits
Employment Insurance (EI) regular benefits are designed to provide temporary income support to partially replace lost employment income for eligible claimants while they search for work or upgrade their skills. In order to qualify for EI regular benefits, unemployed individuals have to meet certain requirements; these include: the individuals must have paid EI premiums during their qualifying period (defined as either the 52 weeks prior to the establishment of the new claim or since the establishment of a previous claim, whichever is shorter), they must have been unemployed and without pay for at least 7 consecutive days, and they must have accumulated between 420 and 700 hours of insurable employment during the qualifying period (depending on the unemployment rate of the EI economic region in which they reside at the time of making their claim). Claimants must also be available for and actively seeking suitable employment while claiming benefits.Footnote 15
For the purpose of this section, EI regular claims refer to the ones for which at least one dollar of regular benefits was paid.
2.2.1 Employment Insurance regular claims and amount paid
The number of new EI regular claims established decreased by 1.6% from 1.32 million in FY1617 to 1.30 million in FY1718. This decline was largely attributable to the notable decline in new claims established in Alberta (-20.4%), reflecting the slight recovery in employment observed in that province.
The total amount of EI regular benefits paid in FY1718 decreased by 0.2% from $12.7 billion in FY1617 to $12.6 billion in FY1718. As illustrated in Chart 5, the decline in the total amount paid in FY1718 is observed after it had increased for the previous three consecutive years.
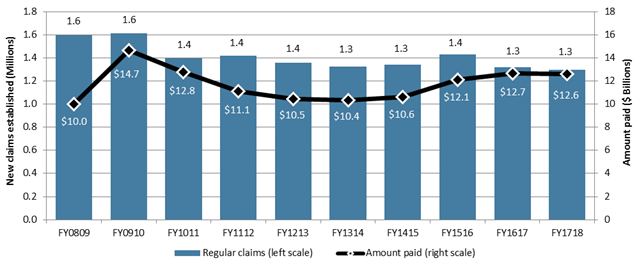
Chart 5 – Text version
| Fiscal year | Regular claims (millions) (left scale) | Amount paid ($ billions) (right scale) |
|---|---|---|
| FY0809 | 1.6 | $10.0 |
| FY0910 | 1.6 | $14.7 |
| FY1011 | 1.4 | $12.8 |
| FY1112 | 1.4 | $11.1 |
| FY1213 | 1.4 | $10.5 |
| FY1314 | 1.3 | $10.4 |
| FY1415 | 1.3 | $10.6 |
| FY1516 | 1.4 | $12.1 |
| FY1617 | 1.3 | $12.7 |
| FY1718 | 1.3 | $12.6 |
- Note: Includes claims for which at least $1 of EI regular benefits was paid.
- Source: Employment and Social Development Canada, Employment Insurance (EI) administrative data. Data are based on a 10% sample of EI administrative data.
The number of new claims established tends to be responsive to labour market conditions and overall economic conditions, as EI regular benefits are designed to provide temporary income support for eligible claimants during periods of unemployment. During periods of economic growth and robust labour market conditions, fewer claims for EI regular benefits are established, while the opposite is true during periods of economic stagnation and unfavourable labour market conditions. This is evident in Chart 5—the number of new claims established reached the peak of 1.6 million in FY0910 following the recession in FY0809. As discussed in Chapter I, the Canadian economy experienced strong growth in FY1718 as GDP increased by 3.0% compared to the previous year, while the labour force increased by 1.0% during the same time period. The national unemployment rate decreased from 6.9% in FY1617 to 6.1% in FY1718 as the number of unemployed individuals declined by 10.0% during the same time period, leading to the corresponding decrease in the volume of new claims established for EI regular benefits (-1.6%) (see Chart 6).
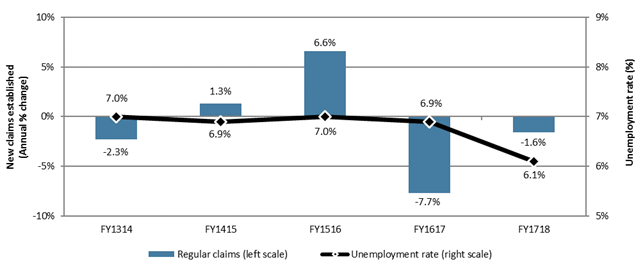
Chart 6 – Text version
| Fiscal year | Regular claims (left scale) | Unemployment rate (right scale) |
|---|---|---|
| FY1314 | -2.3% | 7.0% |
| FY1415 | 1.3% | 6.9% |
| FY1516 | 6.6% | 7.0% |
| FY1617 | -7.7% | 6.9% |
| FY1718 | -1.6% | 6.1% |
- Note: Includes claims for which at least $1 of EI regular benefits was paid.
- Source: Employment and Social Development Canada, Employment Insurance (EI) administrative data. Data are based on a 10% sample of EI administrative data.
On average, there were 511,800 beneficiaries receiving EI regular benefits each month in FY1718, compared to 566,000 beneficiaries each month in the previous year,Footnote 16 representing a decrease of 9.6%. Because the number of beneficiaries is based on previously established claims, these two measures tend to move in similar directions, with the count of beneficiaries usually lagging behind the number of new claims established. To illustrate this, suppose there is an increase in the number of claims established for EI regular benefits after an economic shock. The number of beneficiaries will increase following the increase in claims. However, the count of beneficiaries can still remain elevated even after the volume of new claims have subsided once the labour market conditions improve, as payments continue to be made on previously established claims until benefits are exhausted or the claimants have found employment.
Employment Insurance regular claims and amount paid by province or territory, gender and age
As illustrated in Chart 7, the number of claims established for EI regular benefits increased in six of the ten provinces, and in two of the three territories. Among the provinces, the number of claims increased significantly in magnitude in Newfoundland and Labrador (+6,580 claims or +11.8%). The most significant decrease in the number of claims was observed in Alberta (-28,740 claims or -20.4%).
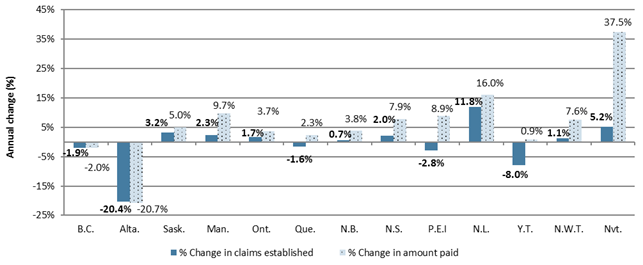
Chart 7 – Text version
| Province or territory | % Change claims established | % Change amount paid |
|---|---|---|
| British Columbia | -1.9% | -2.0% |
| Alberta | -20.4% | -20.7% |
| Saskatchewan | 3.2% | 5.0% |
| Manitoba | 2.3% | 9.7% |
| Ontario | 1.7% | 3.7% |
| Quebec | -1.6% | 2.3% |
| New Brunswick | 0.7% | 3.8% |
| Nova Scotia | 2.0% | 7.9% |
| Prince Edward Island | -2.8% | 8.9% |
| Newfoundland and Labrador | 11.8% | 16.0% |
| Yukon | -8.0% | 0.9% |
| Northwestern Territories | 1.1% | 7.6% |
| Nunavut | 5.2% | 37.5% |
- Note: Includes claims for which at least $1 of EI regular benefits was paid.
- Source: Employment and Social Development Canada, Employment Insurance (EI) administrative data. Data are based on a 10% sample of EI administrative data.
In terms of the total EI regular benefits paid in FY1718, it increased in all provinces and territories (see Chart 7) except Alberta (-20.7%) and British Columbia (-2.0%) compared to the previous year. On the other hand, the largest percentage increase in amount paid was observed in Nunavut (+37.5%), followed by Newfoundland and Labrador (+16.0%). Although the percentage increase in benefits payments was moderate in Ontario and Quebec, these two provinces continued to account for half (49.3%) of all EI regular benefits paid in FY1718.
Table 7 outlines the number of EI regular claims established and amount paid by gender and age groups. The number of claims established by both men and women decreased in the reporting period compared to the previous year (-2.2% and -0.7%, respectively). The share of claims established by gender remained stable year-over-year.
In terms of the total amount paid in EI regular benefits, men accounted for 66.1% of the total benefits paid in FY1718, down from 68.0% in the previous year. Consequently, the share of benefits paid to women increased from 32.0% in FY1617 to 33.9% in FY1718.
| Number of claims | Amount paid | |||||
|---|---|---|---|---|---|---|
| FY1617 | FY1718 | Change (%) | FY1617 | FY1718 | Change (%) | |
| Gender | ||||||
| Men | 806,660 | 788,880 | -2.2% | $8,612.3 | $8,359.3 | -2.9% |
| Women | 514,470 | 510,830 | -0.7% | $4,057.8 | $4,281.2 | +5.5% |
| Age category | ||||||
| 24 years old and under | 126,880 | 118,750 | -6.4% | $1,158.1 | $1,076.1 | -7.1% |
| 25 to 44 years old | 588,420 | 571,930 | -2.8% | $5,548.9 | $5,449.7 | -1.8% |
| 45 to 54 years old | 298,500 | 289,420 | -3.0% | $2,921.7 | $2,876.7 | -1.5% |
| 55 years old and over | 307,330 | 319,610 | +4.0% | $3,041.3 | $3,238.0 | +6.5% |
| Canada | 1,321,130 | 1,299,710 | -1.6% | $12,670.1 | $12,640.5 | -0.2% |
- Note: Data may not add up to the total due to rounding. Percentage change is based on unrounded numbers. Includes claims for which at least $1 of EI regular benefits was paid.
- Source: Employment and Social Development Canada, Employment Insurance (EI) administrative data. Data are based on a 10% sample of EI administrative data.
The number of claims established and amount paid for EI regular benefits decreased for all age groups in the reporting period compared to the previous year, except for the older claimants (aged 55 years and over). Claimants who were between 25 and 44 years old continued to account for the largest share of regular claims in FY1718, while the smallest share was for younger claimants aged less than 25 years.
One notable trend that has been observed over the past few years is that, while the shares of new claims established by different age groups has been relatively stable, the share of new claims established by older claimants aged 55 years and over has increased slowly but steadily over the past several years. The trends observed for older claimants are likely attributable in part to Canada’s aging population and the labour force composition. Individuals in this age category accounted for 21.1% of the labour force in FY1718, up from 14.9% in FY0708 (+6.2 percentage points).Footnote 17
Employment Insurance regular claims and amount paid by industry
As outlined in Table 8, the number of new claims established for EI regular benefits increased slightly in FY1718 compared to the previous year for the goods-producing industries (+17,360 claims or +3.6%), while for the service producing industries it remained stable. Among the goods-producing industries, the Construction industry accounted for more than half (57.5%) of all claims established, and exhibited the largest increase in FY1718 compared to the previous year. On the other hand, the largest decrease was in the Mining and oil and gas extraction industry where the number of claims declined by 12.6%. Among the services-producing industries, the Educational services industry accounted for the largest share of claims in FY1718 (20.6%). On a year-over-year basis, the largest percentage increase in the number of claims established in the services-producing sector was observed for the Finance and insurance industry (+6.7%), while the largest decrease was for the Wholesale trade industry (-8.7%).
The amount of benefits paid to claimants in the goods-producing sector decreased by $54.1 million (-1.0%) in the reporting period compared to the previous year, while it increased for claimants in the services-producing sector by $310.9 million (+4.6%). The decline in amount paid in the goods-producing industries was mainly attributable to the large decrease (-138.8 million or -30.9%) in the Mining and oil and gas extraction industry. The decrease was offset by increases in the Utilities industry (+14.3%) and the Agriculture, forestry, fishing and hunting industry (+12.2%).
The total amount of EI regular benefits paid to claimants in the services-producing industries increased by $310.9 million (+4.6%) in FY1718 compared to the previous year. This increase is mostly attributed to the Educational services industry where the claimants received $154.9 million (+22.3%) more in FY1718 than the previous year. The Accommodation and food services industry and the Information, culture and recreation industry also had significant increases in the amount paid for EI regular benefits (+12.8% and +12.0%, respectively). On the other hand, the largest percentage decrease in amount paid in the reporting year was observed in the Professional, scientific and technical services industry (-9.8% or -$65.4 million).
| Industry | Number of claims (% share of all claims) |
Amount paid - $ Million (% share of total amount paid) |
||||
|---|---|---|---|---|---|---|
| FY1617 | FY1718 | Change (%) | FY1617 | FY1718 | Change (%) | |
| Goods-producing Industries | 484,720 (36.7%) |
502,080 (38.6%) |
+3.6% | $5,397.7 (42.6%) |
$5,343.6 (42.3%) |
-1.0% |
| Agriculture, forestry, fishing and hunting | 51,910 (3.9%) |
53,760 (4.1%) |
+3.6% | $515.6 (4.1%) |
$578.2 (4.6%) |
+12.2% |
| Mining and oil and gas extraction | 24,430 (1.8%) |
21,340 (1.6%) |
-12.6% | $448.8 (3.5%) |
$310.0 (2.5%) |
-30.9% |
| Utilities | 3,980 (0.3%) |
4,150 (0.3%) |
+4.3% | $42.2 (0.3%) |
$48.2 (0.4%) |
+14.3% |
| Construction | 273,380 (20.7%) |
288,870 (22.2%) |
+5.7% | $3,001.5 (23.7%) |
$3,113.4 (24.6%) |
+3.7% |
| Manufacturing | 131,020 (9.9%) |
133,960 (10.3%) |
+2.2% | $1,389.6 (11.0%) |
$1,293.7 (10.2%) |
-6.9% |
| Services-producing Industries | 762,630 (57.7%) |
764,150 (58.8%) |
+0.2% | $6,687.7 (52.8%) |
$6,998.6 (55.4%) |
+4.6% |
| Wholesale trade | 43,600 (3.3%) |
39,790
(3.1%) |
-8.7% | $515.1 (4.1%) |
$492.3 (3.9%) |
-4.4% |
| Retail trade | 76,300 (5.8%) |
79,090 (6.1%) |
+3.7% | $712.3 (5.6%) |
$763.4 (6.0%) |
+7.2% |
| Transportation and warehousing | 59,470 (4.5%) |
60,190 (4.6%) |
+1.2% | $556.8 (4.4%) |
$533.3 (4.2%) |
-4.2% |
| Finance and insurance | 14,080 (1.1%) |
15,020 (1.2%) |
+6.7% | $177.9 (1.4%) |
$193.9 (1.5%) |
+8.9% |
| Real estate, rental and leasing | 18,640 (1.4%) |
17,720 (1.4%) |
-4.9% | $208.1 (1.6%) |
$207.3 (1.6%) |
-0.4% |
| Professional, scientific and technical services | 54,190 (4.1%) |
52,690 (4.1%) |
-2.8% | $666.4 (5.3%) |
$601.1 (4.8%) |
-9.8% |
| Business, building and other support services* | 88,740 (6.7%) |
86,380 (6.6%) |
-2.7% | $876.9 (6.9%) |
$871.4 (6.9%) |
-0.6% |
| Educational services | 153,460 (11.6%) |
157,110 (12.1%) |
+2.4% | $695.1 (5.5%) |
$850.0 (6.7%) |
+22.3% |
| Health care and social assistance | 45,740 (3.5%) |
46,590 (3.6%) |
+1.9% | $389.6 (3.1%) |
$424.0 (3.4%) |
+8.8% |
| Information, culture and recreation** | 38,030 (2.9%) |
39,080 (3.0%) |
+2.8% | $337.1 (2.7%) |
$377.7 (3.0%) |
+12.0% |
| Accommodation and food services | 60,630 (4.6%) |
63,840 (4.9%) |
+5.3% | $496.3 (3.9%) |
$559.9 (4.4%) |
+12.8% |
| Other services (excluding Public administration) | 42,020 (3.2%) |
40,340 (3.1%) |
-4.0% | $424.4 (3.3%) |
$421.5 (3.3%) |
-0.7% |
| Public administration | 67,730 (5.1%) |
66,310 (5.1%) |
-2.1% | $631.5 (5.0%) |
$702.7 (5.6%) |
+11.3% |
| Unclassified | 73,780 (5.6%) |
33,480 (2.6%) |
-54.6% | $584.7 (4.6%) |
$298.4 (2.4%) |
-49.0% |
| Canada | 1,321,130 (100.0%) |
1,299,710 (100.0%) |
-1.6% | $12,670.1 (100.0%) |
$12,640.5 (100.0%) |
-0.2% |
- Note: Data may not add up to the total due to rounding. Percentage change is based on unrounded numbers. Includes claims for which at least $1 of EI regular benefits was paid.
- * This industry sector comprises the industries with codes 55 (Management of companies and enterprises) and 56 (Administration and support, waste management and remediation services).
- ** This industry sector comprises the industries with codes 51 (Information and cultural industries) and 71 (Arts, entertainment and recreation).
- Source: Employment and Social Development Canada, Employment Insurance (EI) administrative data. Data are based on a 10% sample of EI administrative data.
Chart 8 illustrates the percentage changes in the number of new regular claims, amount paid and employment by industry grouping in FY1718 compared to the previous year. The employment gain in the goods-producing industries was slightly higher than that in the services-producing industries, whereas the increase in claims in the goods-producing industries was more significant than that in the services-producing industries. Changes in the amount paid in goods-producing and services-producing industries were in opposite direction—claimants in the goods-producing industries received 1.0% less in EI regular benefit payments in FY1718 compared to the previous year while those in the services-producing industries received 4.6% more in benefit payments.
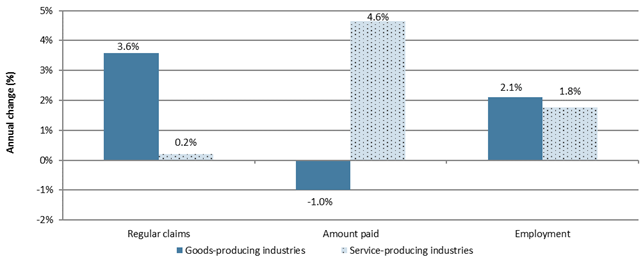
Chart 8 – Text version
| Industry | Regular claims | Amount paid | Employment |
|---|---|---|---|
| Goods-producing industries | 3.6% | -1.0% | 2.1% |
| Services-producing industries | 0.2% | 4.6% | 1.8% |
- Note: Includes claims for which at least $1 of EI regular benefits was paid.
- Source: Employment and Social Development Canada, Employment Insurance (EI) administrative data. Data are based on a 10% sample of EI administrative data. Statistics Canada, Labour Force Survey, Table 14-10-0022-01.
Employment Insurance regular benefits and firms
According to the 2016 tax dataFootnote 18 available from Canada Revenue Agency (CRA), the number of firms operating in Canada remained stable (0.4% increase) compared to 2015. Among the 1.2 million firms, 311,600 (representing 26.0% of all firms) employed at least one employee who had received EI regular benefits.
Table 9 outlines the number of firms, employment and EI regular claimants by sizeFootnote 19 of firms. The proportion of firms which employed at least one employee receiving EI regular benefits varied widely by firm size, with smaller firms being less likely to be the last employer of a claimant. For example, 20.5% of small-sized firms in 2016 had at least one former employee who received EI regular benefits, compared to 75.3% of small-to-medium sized firms, 95.2% of medium-to-large sized firms and 99.6% of large-sized firms.
However, when the number of claimants for EI regular benefits is compared with distribution of workforce by firm size, employees from smaller firms are found to be over-represented among EI regular claimants. As shown in Table 9, smaller firms accounted for 21.7% of the total workforce while they represented 26.3% of the total EI regular benefit claimants in 2016. Similarly, employees in the small-to-medium sized firms were also over-represented among EI regular claimants—these firms accounted for 19.7% of the total employees and 24.7% of the total EI regular claimants. This gap between the share of employment and the share of EI regular claimants narrows for the medium-to-large sized firms. For the large-sized firms, however, the opposite was observed—these firms represented 42.6% of the total workforce in Canada in 2016 but accounted for only 31.3% of the total EI regular claimants. The higher proportion of usage of EI regular benefits among employees in the smaller-sized firms suggest that smaller firms are more vulnerable to difficult business or economic conditions than larger firms, and need to make broader adjustments to their workforces, resulting in a larger share of their employees claiming EI regular benefits as a result of layoffs. Moreover, this trend can also be influenced by industry-related characteristics such as the greater prevalence of seasonal jobs in small-sized firms that are generally more likely to rely on EI, relative to the national average in some industries.Footnote 20
| Firm size | Number of firms | Employment distribution** (% share) | EI claimant distribution*** (% share) | |
|---|---|---|---|---|
| All firms | Firms with at least one employee receiving EI regular benefits | |||
| Small | 1,086,990 | 222,730 | 21.7% | 26.3% |
| Small-medium | 93,840 | 70,640 | 19.7% | 24.7% |
| Medium-large | 15,770 | 15,020 | 15.9% | 17.8% |
| Large | 3,210 | 3,190 | 42.6% | 31.3% |
| Canada | 1,199,800 | 311,590 | 100.0% | 100.0% |
- Note: Data may not add up due to rounding.
- * The categories of firm size reflect those found in Business Dynamics in Canada, a Statistics Canada publication. Small-sized firms are defined as those that employ 1 to 19 employees. Small-to-medium sized firms employ 20 to 99 employees. Medium-to-large sized firms employ 100 to 499 employees. Large-sized firms employ 500 employees or more.
- ** The number of workers in a firm is the number of individuals with employment income in that firm, as indicated on a T4 form. The number of workers is adjusted so that each individual in the labour force is only counted once and individuals who work for more than one firm are taken into account. For example, if an employee that earned $25,000 in firm 1 and $25,000 in firm 2, then he or she was recorded as 0.5 employees at the first firm and 0.5 employees at the second firm.
- *** These are based on the number of people receiving EI regular benefits in 2016.
- Source: Employment and Social Development Canada, Employment Insurance (EI) administrative data. Data are based on a 100% sample of EI administrative data. Canada Revenue Agency, CRA administrative data. CRA data are based on a 100% sample.
Employment Insurance regular claims and amount paid by EI claimant category
Table 10 outlines the number of claims established for EI regular benefits and amount paid by EI claimant category.Footnote 21 The number of claims established by long-tenured workers decreased by 5.8% in the reporting period compared to the previous year. During the same period, the total amount paid to long-tenured workers decreased by 9.2% to reach $3,343.6 million. On the other hand, both the number of claims established and amount paid for occasional claimants changed slightly in FY1718 compared to the previous year. Lastly, the number of claims established by frequent claimants had a slight increase in the reporting period; while the total amount paid to the claimants in this category increased more significantly (+$256.0 million or +9.2%).
It is also evident from Table 10 that long-tenured workers, who are more likely to have contributed substantially to the EI regime through premiums, continue to proportionally benefit more from EI regular benefits. In FY1718 they accounted for 23.9% of all new regular claims established while they received 26.5% of the total amount paid. Occasional claimants, on the other hand, proportionally benefited less—they accounted for 53.8% of all new claims established in FY1718 but received 49.6% of the total amount paid. Frequent claimants accounted for 22.3% of total new regular claims in the reporting year and received 23.9% of the total amount paid.
| Claimant category | Number of claims (% share of all EI regular claims) |
Amount paid (% share of total amount paid for EI regular benefits) |
||||
|---|---|---|---|---|---|---|
| FY1617 | FY1718 | Change (%) | FY1617 | FY1718 | Change (%) | |
| Long-tenured workers | 329,290 (24.9%) |
310,270 (23.9%) |
-5.8% | $3,681.5 (29.1%) |
$3,343.6 (26.5%) |
-9.2% |
| Occasional claimants | 706,150 (53.5%) |
699,370 (53.8%) |
-1.0% | $6,220.2 (49.1%) |
$6,272.5 (49.6%) |
+0.8% |
| Frequent claimants | 285,690 (21.6%) |
290,070 (22.3%) |
+1.5% | $2,768.4 (21.9%) |
$3,024.4 (23.9%) |
+9.2% |
| Canada | 1,321,130 (100.0%) |
1,299,710 (100.0%) |
-1.6% | $12,670.1 (100.0%) |
$12,640.5 (100.0%) |
-0.2% |
- Note: Data may not add up to the total due to rounding. Percentage change is based on unrounded numbers. Includes claims for which at least $1 of EI regular benefits was paid.
- * See Annex 2.1 for definitions of EI claimant categories referenced in this table.
- Source: Employment and Social Development Canada, Employment Insurance (EI) administrative data. Data are based on a 10% sample of EI administrative data.
Chart 9 and Chart 10 show the shares of EI regular claims established and the total amount paid by claimant categories from FY0910 to FY1718.
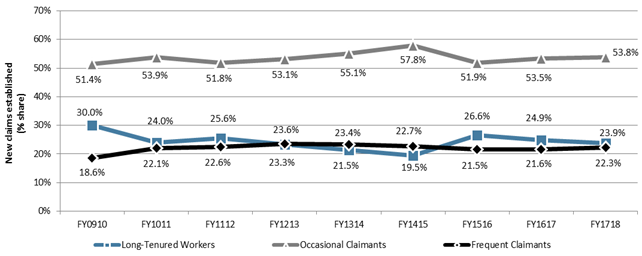
Chart 9 – Text version
| Fiscal year | Long-tenured workers | Occasional claimants | Frequent claimants |
|---|---|---|---|
| FY0910 | 30.0% | 51.4% | 18.6% |
| FY1011 | 24.0% | 53.9% | 22.1% |
| FY1112 | 25.6% | 51.8% | 22.6% |
| FY1213 | 23.3% | 53.1% | 23.6% |
| FY1314 | 21.5% | 55.1% | 23.4% |
| FY1415 | 19.5% | 57.8% | 22.7% |
| FY1516 | 26.6% | 51.9% | 21.5% |
| FY1617 | 24.9% | 53.5% | 21.6% |
| FY1718 | 23.9% | 53.8% | 22.3% |
- Note: Includes claims for which at least $1 of EI regular benefits was paid.
- * See Annex 2.1 for definitions of claimant categories referenced in this chart.
- Source: Employment and Social Development Canada, Employment Insurance (EI) administrative data. Data are based on a 10% sample of EI administrative data.
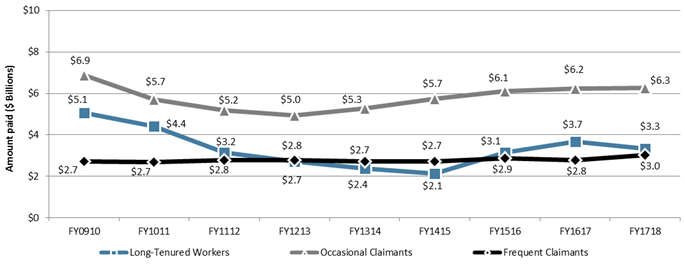
Chart 10 – Text version
| Fiscal year | Long-tenured workers | Occasional claimants | Frequent claimants |
|---|---|---|---|
| FY0910 | $5.1 | $6.9 | $2.7 |
| FY1011 | $4.4 | $5.7 | $2.7 |
| FY1112 | $3.2 | $5.2 | $2.8 |
| FY1213 | $2.7 | $5.0 | $2.8 |
| FY1314 | $2.4 | $5.3 | $2.7 |
| FY1415 | $2.1 | $5.7 | $2.7 |
| FY1516 | $3.1 | $6.1 | $2.9 |
| FY1617 | $3.7 | $6.2 | $2.8 |
| FY1718 | $3.3 | $6.3 | $3.0 |
- Note: Includes claims for which at least $1 of EI regular benefits was paid.
- * See Annex 2.1 for definitions of claimant categories referenced in this chart.
- Source: Employment and Social Development Canada, Employment Insurance (EI) administrative data. Data are based on a 10% sample of EI administrative data.
Employment Insurance regular claims by hours of insurable employment and unemployment rate in the Employment Insurance economic region of establishment
One of the eligibility conditions for EI regular benefits is the accumulation of enough hours of insurable employment during the qualifying period. The number of required hours depends on the unemployment rate in the EI economic region where the claim was established and known as the Variable Entrance Requirement (VER). The higher the unemployment rate in a given region, the lower the number of hours needed to qualify for EI regular benefits (see Annex 2.2 for the full breakdown of required number of hours of insurable employment with corresponding regional rate of unemployment). A detailed discussion is provided in subsection 2.2.2 on eligibility and access to EI regular benefits.
Variable entrance requirement
In order to establish a benefit period a worker must accumulate between 420 and 700 hours of insurable employment in the qualifying period depending on the applicable regional rate of unemployment. The higher the regional rate of unemployment, the lower the number of hours of insurable employment required.
| Unemployment rate | Entrance requirement |
|---|---|
| 6.0% and under | 700 hours |
| 6.1% to 7.0% | 665 hours |
| 7.1% to 8.0% | 630 hours |
| 8.1% to 9.0% | 595 hours |
| 9.1% to 10.0% | 560 hours |
| 10.1% to 11.0% | 525 hours |
| 11.1% to 12.0% | 490 hours |
| 12.1% to 13.0% | 455 hours |
| More than 13.0% | 420 hours |
Table 11 outlines the distribution of EI regular claims for the past 5 years by the number of hours of insurable employment during the qualifying period. Consistent with previous years, claimants who accumulated more than 1,820 hours of insurable employment accounted for the largest share (25.5%) of total new EI regular claims established in FY1718. This was relatively unchanged from the previous year. On the other hand, claimants with less than 700 hours of insurable employment represented the smallest share (5.1%), decreasing by 0.7 percentage points compared to the previous year. All of the categories shown in Table 11 experienced a change in their share in FY1718 that was less than 1.0 percentage point compared to the previous year.
| Number of hours of insurable employment in the qualifying period | FY1314 | FY1415 | FY1516 | FY1617 | FY1718 |
|---|---|---|---|---|---|
| Less than 700 hours | 68,880 (5.2%) |
64,390 (4.8%) |
67,170 (4.7%) |
76,340 (5.8%) |
66,150 (5.1%) |
| 700 to 979 hours | 201,280 (15.2%) |
203,690 (15.2%) |
207,610 (14.5%) |
216,650 (16.4%) |
215,600 (16.6%) |
| 980 to 1,259 hours | 252,600 (19.1%) |
256,210 (19.1%) |
264,500 (18.5%) |
242,610 (18.4%) |
234,850 (18.1%) |
| 1,260 to 1,539 hours | 244,230 (18.4%) |
245,530 (18.3%) |
260,870 (18.2%) |
239,030 (18.1%) |
239,600 (18.4%) |
| 1,540 to 1,819 hours | 219,660 (16.6%) |
218,840 (16.3%) |
235,120 (16.4%) |
207,440 (15.7%) |
211,880 (16.3%) |
| 1,820 hours and more | 339,150 (25.6%) |
353,950 (26.4%) |
395,820 (27.7%) |
339,060 (25.7%) |
331,630 (25.5%) |
| Canada | 1,325,810 (100.0%) |
1,342,610 (100.0%) |
1,431,090 (100.0%) |
1,321,130 (100.0%) |
1,299,710 (100.0%) |
- Note: Data may not add up to the total due to rounding. Includes claims for which at least $1 of EI regular benefits was paid.
- Source: Employment and Social Development Canada, Employment Insurance (EI) administrative data. Data are based on a 10% sample of EI administrative data.
Chart 11 shows the average number of hours of insurable employment per claim receiving EI regular benefits from FY0910 to FY1718 by gender. In the reporting period, on average in Canada, claimants had accumulated 1,369 hours of insurable employment during their qualifying period, up from 1,363 hours in FY1617. The difference between the average number of hours of insurable employment for men and women has stayed around 60 hours over the years. In FY1718, men on average had 59 more hours of insurable employment than women. This can be attributable to the fact that a higher proportion of women work in part-time and/or temporary jobs than men, and thus accumulate fewer hours of insurable employment on average.
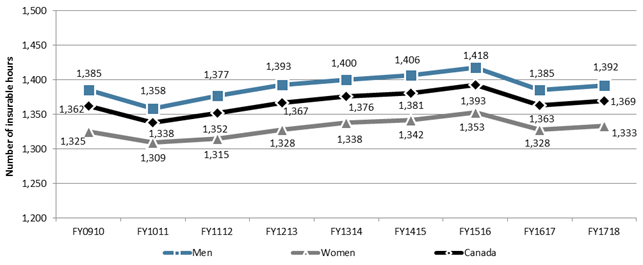
Chart 11 – Text version
| Fiscal year | Men | Women | Canada |
|---|---|---|---|
| FY0910 | 1,385 | 1,325 | 1,362 |
| FY1011 | 1,358 | 1,309 | 1,338 |
| FY1112 | 1,377 | 1,315 | 1,352 |
| FY1213 | 1,393 | 1,328 | 1,367 |
| FY1314 | 1,400 | 1,338 | 1,376 |
| FY1415 | 1,406 | 1,342 | 1,381 |
| FY1516 | 1,418 | 1,353 | 1,393 |
| FY1617 | 1,385 | 1,328 | 1,363 |
| FY1718 | 1,392 | 1,333 | 1,369 |
- Note: Includes claims for which at least $1 of EI regular benefits was paid.
- Source: Employment and Social Development Canada, Employment Insurance (EI) administrative data. Data are based on a 10% sample of EI administrative data.
In FY1718, claimants who were aged between 25 and 44 years accumulated the highest number of hours of insurable employment during their qualifying period (1,401 hours), followed by those who were 45 to 54 years old (1,397 hours). Younger claimants aged less than 25 years, on the other hand, accumulated the lowest number of hours of insurable employment (1,304 hours) in FY1718, closely followed by the older claimants above 55 years of age (1,309 hours).
Furthermore, the average number of hours of insurable employment per claim during the qualifying period in FY1718 varied by province and territory as well. Generally, the number of hours of insurable employment per claim in the Atlantic provinces and the Territories tend to be lower than other regions. This trend continued in the reporting period—the lowest average hours of insurable employment per claim among all provinces and territories was observed in Newfoundland and Labrador (1,165 hours), followed by Prince Edward Island (1,170 hours) and New Brunswick (1,226 hours). On the other hand, the highest average hours of insurable employment per claim in FY1718 was observed in Alberta (1,456 hours), followed by Ontario (1,441 hours) and British Columbia (1,400 hours).
Table 12 outlines the number and distribution of new claims established for EI regular benefits as well as the labour force and the unemployed population by regional unemployment rate. The share of new regular claims established in EI economic regions where the unemployment rate was between 0.1% and 7.0% was higher in FY1718 compared to previous fiscal years. This can be mainly attributable to the decrease, on average, in unemployment rates recorded in many regions in FY1718 compared to FY1617. Table 12 also shows that, in FY1718, EI regular claims established and the unemployed population were similarly spread across regional unemployment rate categories.
| Unemployment rate | Employment Insurance regular claims (% share of total claims) |
Labour force (% share of labour force) |
Number of unemployed (% share of unemployed) |
||||
|---|---|---|---|---|---|---|---|
| FY1314 | FY1415 | FY1516 | FY1617 | FY1718 | FY1718 | FY1718 | |
| 0.1% to 6.0% | 187,910 (14.2%) |
273,380 (20.4%) |
218,020 (15.2%) |
171,350 (13.0%) |
384,230 (29.6%) |
8,882,360 (44.6%) |
468,280 (35.0%) |
| 6.1% to 7.0% | 196,410 (14.8%) |
158,060 (11.8%) |
363,660 (25.4%) |
363,170 (27.5%) |
425,580 (32.7%) |
6,089,130 (30.6%) |
394,250 (29.5%) |
| 7.1% to 8.0% | 259,710 (19.6%) |
329,870 (24.6%) |
279,030 (19.5%) |
299,000 (22.6%) |
134,750 (10.4%) |
2,011,030 (10.1%) |
151,870 (11.4%) |
| 8.1% to 9.0% | 327,910 (24.7%) |
236,460 (17.6%) |
216,290 (15.1%) |
169,290 (12.8%) |
110,860 (8.5%) |
1,567,150 (7.9%) |
133,120 (10.0%) |
| 9.1% to 10.0% | 45,870 (3.5%) |
78,450 (5.8%) |
75,660 (5.3%) |
65,480 (5.0%) |
31,660 (2.4%) |
247,730 (1.2%) |
23,660 (1.8%) |
| 10.1% to 11.0% | 84,810 (6.4%) |
55,950 (4.2%) |
50,430 (3.5%) |
35,420 (2.7%) |
7,990 (0.6%) |
102,670 (0.5%) |
10,780 (0.8%) |
| 11.1% to 12.0% | 52,390 (4.0%) |
44,380 (3.3%) |
16,740 (1.2%) |
21,420 (1.6%) |
60,140 (4.6%) |
465,500 (2.3%) |
53,040 (4.0%) |
| 12.1% to 13.0% | 10,030 (0.8%) |
7,660 (0.6%) |
43,880 (3.1%) |
35,300 (2.7%) |
13,420 (1.0%) |
39,290 (0.2%) |
4,920 (0.4%) |
| 13.1% to 14.0% | 6,620 (0.5%) |
470 (0.0%) |
16,910 (1.2%) |
11,350 (0.9%) |
28,240 (2.2%) |
71,570 (0.4%) |
9,800 (0.7%) |
| 14.1% to 15.0% | 20,030 (1.5%) |
25,870 (1.9%) |
23,650 (1.7%) |
38,190 (2.9%) |
24,020 (1.8%) |
69,490 (0.3%) |
9,900 (0.7%) |
| 15.1% to 16.0% | 57,470 (4.3%) |
25,100 (1.9%) |
31,980 (2.2%) |
25,370 (1.9%) |
10,270 (0.8%) |
24,400 (0.1%) |
3,780 (0.3%) |
| 16.1% or higher | 76,650 (5.8%) |
106,960 (8.0%) |
94,870 (6.6%) |
85,790 (6.5%) |
68,550 (5.3%) |
340,380 (1.7%) |
73,230 (5.5%) |
| Canada | 1,325,810 (100.0%) |
1,342,610 (100.0%) |
1,431,090 (100.0%) |
1,321,130 (100.0%) |
1,299,710 (100.0%) |
19,910,700 (100.0%) |
1,336,630 (100.0%) |
- Note: Data may not add up to the total due to rounding. Includes claims for which at least $1 of EI regular benefits was paid.
- * Unemployment rates used for the Employment Insurance program are a moving average of seasonally adjusted rates of unemployment produced by Statistics Canada, as per section 17 of the Employment Insurance Regulations.
- Source: Employment and Social Development Canada, Employment Insurance (EI) administrative data and Statistics Canada, special tabulations from the Labour Force Survey. EI data are based on a 10% sample of EI administrative data.
Claimant obligations to search for and accept suitable employment
Under the Employment Insurance Act, claimants for EI regular benefits must generally be capable of and available for suitable employment and must demonstrate this by searching for and taking advantage of an opportunity for suitable employment in order to receive EI regular benefits.
As specified under section 27 of the Employment Insurance Act, a claimant is disqualified from receiving EI regular benefits in cases where he/she does not apply for suitable employment after becoming aware it is vacant, or fails to accept the employment after it being offered; has not taken advantage of an opportunity for suitable employment; or has not followed written direction by the Canada Employment Insurance Commission given to assist the claimant in finding suitable employment.
The Government made legislative and regulatory changes in July 2016 to simplify job search responsibilities for claimants of EI regular benefits. During the reporting period, the following criteria determine what constitutes suitable employment:
(a) the claimant’s health and physical capabilities allow them to commute to the place of work and to perform the work;
(b) the hours of work are not incompatible with the claimant’s family obligations or religious beliefs; and
(c) the nature of work is not contrary to the claimant’s moral convictions or religious beliefs.
While EI claimants are required to make reasonable and customary efforts to obtain suitable employment, they are not required to seek employment that is not suitable. Section 6(4) of the Employment Insurance Act also summarizes what constitutes employment that is considered not suitable:
(a) it arises in consequence of a work stoppage attributable to a labour dispute;
(b) it is in the claimant’s usual occupation and is either at a lower rate of earnings or on conditions less favourable than those observed by agreement between employers and employees or, in the absence of any such agreement, than those recognized by good employers; or
(c) it is not in the claimant’s usual occupation and is either at a lower rate of earnings or on conditions less favourable than those that the claimant might reasonably expect to obtain, having regard to the conditions that the claimant usually obtained in their usual occupation, or would have obtained if they had continued to be so employed.
Before the legislative change in July 2016, the Connecting Canadians with Available Jobs (CCAJ) initiative that started on January 6, 2013 was in effect. A recent departmental evaluation reportFootnote 22 found that the number of disqualifications or disentitlements due to inadequate job searches or failing to accept suitable jobs increased, but remained low relative to the total number of disqualifications and disentitlements during the period in which CCAJ was in effect (January 2013 to July 2016), indicating enhanced and more efficient monitoring of claimants by Service Canada.
Table 13 outlines the number of disqualifications and disentitlements related to refusal and failure to search for work in the past 5 years. In FY1718, there were a total of 1,730 disqualifications and disentitlements related to failure to search for work, compared to 1,340 incidents in the previous year. On the other hand, there were a total of 130 disqualifications and disentitlements related to refusal of suitable work in FY1718, compared to 170 incidents in the previous year. However, these two factors represent only a fraction (0.2%) of all disqualifications and disentitlements in FY1718, and do not take into consideration that benefits would generally have been reinstated in some situations once the claimants demonstrated that they were fulfilling their responsibilities.
| Type of disqualification or disentitlement | FY1314 | FY1415 | FY1516 | FY1617 | FY1718 | Change (%) FY1617 to FY1718 |
|---|---|---|---|---|---|---|
| Refusal of suitable work | 220 | 190 | 180 | 170 | 130 | -23.5% |
| Failure to search for work | 860 | 940 | 1,020 | 1,340 | 1,730 | +29.1% |
- Source: Statistics Canada, monthly Employment Insurance disqualifications and disentitlements, Table 14-10-0004-01.
2.2.2 Employment Insurance regular benefits: coverage, eligibility and access
As mentioned at the beginning of section 2.2, there are three eligibility criteria to qualify for EI regular benefits: the claimant must have had insurable employment and paid EI premiums within the previous 52 weeks; have a valid reason for job separation according to the Employment Insurance Act; and must have worked a minimum number of insurable hours (ranging from 420 to 700 hours, depending on the regional unemployment rate) within their qualifying period (defined as either the previous 52 weeks or since the establishment of their last claim, whichever is shorter). This subsection provides an overall picture of these three criteria in 2017 using results from the Employment Insurance Coverage Survey (EICS)Footnote 23 published annually by Statistics Canada. The survey provides statistics on the contributors and non-contributors to the EI program among the unemployed, as well as on the eligible recipients and those who did not qualify for EI regular benefits. The survey also provides information on the take-up of EI maternity and parental benefits in Canada (see sub-section 2.6.2).
Chart 12 illustrates the characteristics of the unemployed population in Canada in 2017 with respect to their eligibility criteria for EI regular benefits using estimates from the EICS. The survey shows that on average there were 1,189,900 unemployed individuals per month in Canada in 2017. Among them, 440,500 did not contribute to the EI program—these include people who did not work in the previous 12 months or never worked (398,400 individuals representing 33.5% of the total unemployed) and self-employed and unpaid family workers (42,100 individuals representing 3.5% of the total unemployed). On the other hand, an estimated 749,400 individuals had paid EI premiums in the 52 weeks prior to becoming unemployed in 2017. These individuals represent 63.0% of all unemployed, down slightly from 2016 (65.3%). Of these premium-paying workers, 142,700 were ineligible to receive EI benefits because of an invalid job separation—a total of 93,600 had quit their jobs without a cause acceptable to the EI program, while the other 49,100 had quit to go to school. The number of workers who contributed to the EI program and had a valid job separation was 606,700, representing 51.0% of the total unemployed—down 2.4 percentage points from 2016 (53.4%). Of these, an estimated 511,700 individuals had enough hours of insurable employment within their qualifying period (43.0% of total unemployed), down from 593,500 individuals in 2016 (45.6% of total unemployed). These individuals were eligible to receive EI benefits as they met all three core requirements of the EI program.
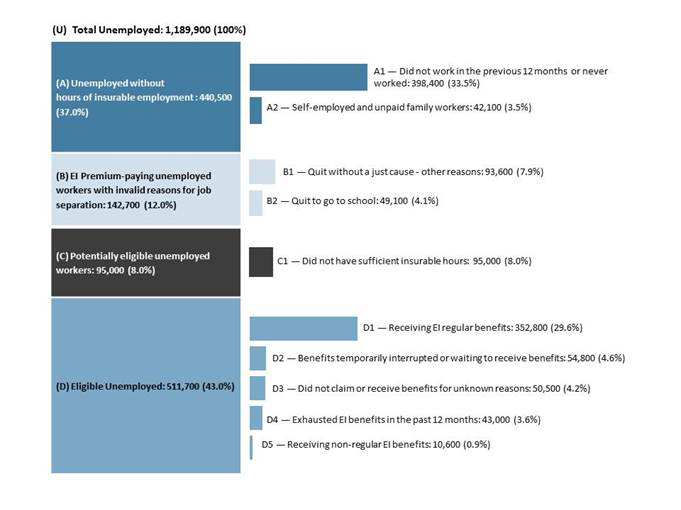
Chart 12 – Text version
| (U) Total Unemployed: 1,189,900 (100%) | |
|---|---|
| (A) Unemployed without hours of insurable employment: 440,500 (37.0%) | A1—Did not work in the previous 12 months or never worked: 398,400 (33.5%) |
| A2—Self-employed and unpaid family workers: 42,100 (3.5%) | |
| (B) EI Premium-paying unemployed workers with invalid reasons for job separation: 142,700 (12.0%) | B1—Quit without a just cause - other reasons: 93,600 (7.9%) |
| B2—Quit to go to school: 49,100 (4.1%) | |
| (C) Potentially eligible unemployed workers: 95,000 (8.0%) | C1—Did not have sufficient insurable hours: 95,000 (8.0%) |
| (D) Eligible Unemployed: 511,700 (43.0%) | D1—Receiving EI regular benefits: 352,800 (29.6%) |
| D2—Benefits temporarily interrupted or waiting to receive benefits: 54,800 (4.6%) | |
| D3—Did not claim or receive benefits for unknown reasons: 50,500 (4.2%) | |
| D4—Exhausted EI benefits in the past 12 months: 43,000 (3.6%) | |
| D5—Receiving non-regular EI benefits: 10,600 (0.9%) |
- Note: Data may not add up to the total due to rounding.
- Source: Statistics Canada, Employment Insurance Coverage Survey, 2017.
Chart 13 shows the distribution of the unemployed population by EI regular benefits eligiblity over the past 10 years. Following the recession in FY0809 and the downturn in commodity prices in 2015, the share of eligible unemployed increased. The share of unemployed individuals without hours of insurable employment trends upwards over time. The proportion of unemployed workers with invalid reasons for job separation who paid EI premiums decreased over time, whereas the proportion of potentially eligible unemployed workers with insufficient hours of insurable employment remained relatively stable.
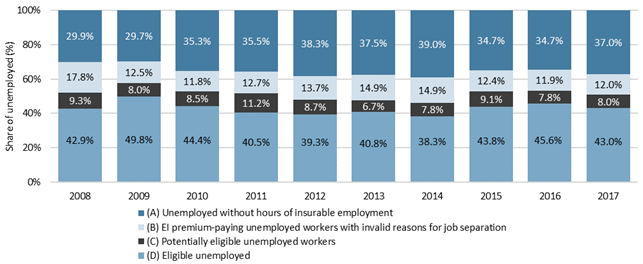
Chart 13 – Text version
| 2008 | 2009 | 2010 | 2011 | 2012 | 2013 | 2014 | 2015 | 2016 | 2017 | |
|---|---|---|---|---|---|---|---|---|---|---|
| (A) Unemployed without hours of insurable employment | 29.9% | 29.7% | 35.3% | 35.5% | 38.3% | 37.5% | 39.0% | 34.7% | 34.7% | 37.0% |
| (B) EI premium-paying unemployed workers with invalid reasons for job separation | 17.8% | 12.5% | 11.8% | 12.7% | 13.7% | 14.9% | 14.9% | 12.4% | 11.9% | 12.0% |
| (C) Potentially eligible unemployed workers | 9.3% | 8.0% | 8.5% | 11.2% | 8.7% | 6.7% | 7.8% | 9.1% | 7.8% | 8.0% |
| (D) Eligible unemployed | 42.9% | 49.8% | 44.4% | 40.5% | 39.3% | 40.8% | 38.3% | 43.8% | 45.6% | 43.0% |
- Source: Statistics Canada, Employment Insurance Coverage Survey, 2008 to 2017.
Coverage of Employment Insurance regular benefits
This section examines the coverage of EI regular benefits which is expressed as the share of EI unemployed contributors – unemployed who had insurable employment and contributed to the EI program by paying premiums within the previous 52 weeks - among total unemployed population in Canada. While the recipients of EI regular benefits are subject to three core eligibility requirements, as mentioned in the beginning of this section, the number of unemployed who had insurable employment and contributed to the EI program by paying premiums within the previous 52 weeks is an important factor in determining the program’s overall coverage of the unemployed population.
Chart 14 illustrates the coverage of EI regular benefits in Canada for the past 12 years. Higher EI coverage rates are usually observed during economic downturns, as slowing economic activities lead to layoffs that increase the share of unemployed EI contributors among all unemployed. The coverage rates within the past 12 years peaked in 2008 and 2009, corresponding with the FY0809 recession. After ranging between 61.0% in 2014 and 64.7% in 2010, the coverage rates increased to 65.3% in 2015 and remained unchanged in 2016, during the slowed down economic growth caused by the downturn in commodity prices in those two years. As the Canadian economy rebounded in 2017, the coverage rate returned to 63.0%.
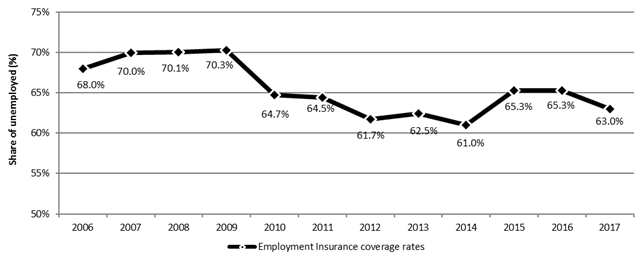
Chart 14 – Text version
| 2006 | 2007 | 2008 | 2009 | 2010 | 2011 | 2012 | 2013 | 2014 | 2015 | 2016 | 2017 | |
|---|---|---|---|---|---|---|---|---|---|---|---|---|
| Employment Insurance coverage rates | 68.0% | 70.0% | 70.1% | 70.3% | 64.7% | 64.5% | 61.7% | 62.5% | 61.0% | 65.3% | 65.3% | 63.0% |
- Source: Statistics Canada, Employment Insurance Coverage Survey, 2006 to 2017.
Table 14 shows the coverage rates for EI regular benefits by province, gender, age, and work pattern in 2017. Newfoundland and Labrador reported the highest share of unemployed (87.4%) who had paid EI premiums in the previous 52 weeks, while Alberta had the lowest share (55.8%). Historically, Atlantic provinces have higher coverage rates than the rest of the country—this can be explained by the prevalence of the seasonal employment pattern in that region.Footnote 24, Footnote 25, Footnote 26 On the basis of gender, 66.8% of unemployed men contributed EI premiums in 2017, compared to 58.1% of unemployed women. The lower contribution rate among women can be explained by the fact that women are more likely to experience frequent career interruptions than men, and also for longer total durations.Footnote 27
When the unemployed population is categorized by their previous work pattern, it can be seen that a lower share of unemployed who occupied permanent jobs contributed EI premiums (68.8%) than unemployed who were in non-permanent jobs (77.6%). This can be explained by the fact that the proportion of seasonal jobs among those unemployed who held non-permanent jobs is high. As these individuals work for few weeks or months on a cyclical pattern over a year, they are more likely to have paid EI premiums in the previous 52 weeks than other individuals who were in permanent jobs that might be unemployed for more than a year. Among the unemployed who held permanent jobs, those who had full-time jobs reported a higher coverage rate (70.6%) than those who had part-time jobs (65.9%). Among the unemployed who had non-permanent jobs, on the other hand, those who had seasonal employment had a much higher contribution rate (90.2%) than those who had another type of non-permanent paid jobs (69.0%).
| Coverage rate (unemployed contributors as a share of total unemployed) | |
|---|---|
| Province or territory | |
| Newfoundland and Labrador | 87.4% |
| Prince Edward Island | 78.8% |
| Nova Scotia | 69.3% |
| New Brunswick | 80.8% |
| Quebec | 65.0% |
| Ontario | 57.9% |
| Manitoba | 60.9% |
| Saskatchewan | 72.5% |
| Alberta | 55.8% |
| British Columbia | 69.8% |
| Gender | |
| Men | 66.8% |
| Women | 58.1% |
| Age category | |
| 24 years old and under | 50.9% |
| 25 to 44 years old | 65.7% |
| 45 years old and over | 67.1% |
| Work pattern | |
| Permanent | 68.8% |
| Full-time | 70.6% |
| Part-time | 65.9% |
| Non-permanent | 77.6% |
| Seasonal* | 90.2% |
| Other non-standard** | 69.0% |
| Canada | 63.0% |
- * Seasonal workers are those who are employed in temporary work that is expected to last only until the end of a ‘season’—the period for which services are in demand.
- ** Other non-standard refers to non-permanent paid jobs that were either temporary, term, contractual, casual or other non-permanent (but not seasonal) employment. These unemployed were not self-employed.
- Source: Statistics Canada, Employment Insurance Coverage Survey, 2017.
Eligibility for Employment Insurance regular benefits
Among the 749,400 unemployed EI contributors in 2017, an estimated 606,700 had valid job separations—making them potentially eligible to receive EI benefits. The number of unemployed contributors with valid job separations in 2017 represents a decrease of 88,100 compared to the previous year. Of these potentially eligible contributors, 511,700 had sufficient hours of insurable employment within their qualifying period, making them eligible to receive EI regular benefits.
The eligibility rate for EI regular benefits, expressed as the share of the potentially eligible unemployed population with enough hours of insurable employment to qualify for EI regular benefits (511,700 divided by 606,700), decreased from 85.4% in 2016 to 84.3% in 2017. As illustrated in Chart 15, the eligibility rate in Canada over the past 10 years has ranged from 86.2% to 78.4%.

Chart 15 – Text version
| 2008 | 2009 | 2010 | 2011 | 2012 | 2013 | 2014 | 2015 | 2016 | 2017 | |
|---|---|---|---|---|---|---|---|---|---|---|
| Eligibility rates | 82.2% | 86.2% | 83.9% | 78.4% | 81.9% | 85.8% | 83.1% | 82.8% | 85.4% | 84.3% |
- Source: Statistics Canada, Employment Insurance Coverage Survey, 2008 to 2017.
As mentioned, claimants who apply for EI regular benefits have to work a minimum number of hours of insurable employment (between 420 and 700 hours, depending on the regional unemployment rate) within their qualifying period in order to be eligible to receive benefits—this provision is known as the Variable Entrance Requirement (VER). Under the VER, EI claimants in higher unemployment regions need fewer hours of insurable employment than those in lower unemployment regions to qualify for EI benefits, as it is more difficult to accumulate hours of employment in regions with higher unemployment rates. An important consideration in this respect is that the eligible claimants who receive EI regular benefits accumulate varying hours of insurable employment. EI administrative data show that most of the claimants who receive EI regular benefits generally accumulate hours of insurable employment that are well beyond the minimum requirement under the VER in their respective regions. However, the share of claimants for EI regular benefits who qualified with hours of insurable employment near the minimum entrance requirement—defined as being within 70 hours of the VER—has been rising for the last two fiscal years.
Chart 16 illustrates the number and share of claims established for EI regular benefits that qualified within 70 hours of the minimum entrance requirement in the last five fiscal years. It can be seen that the number of such claims has been rising steadily, while the share of such claims to the total number of claims established for EI regular benefits has been increasing for the last 3 years. In FY1718, the number of regular claims that qualified within 70 hours of the minimum entrance requirement increased to 56,160 claims from 52,840 claims observed in FY1617. The share of these claims represented 4.3% of the total number of regular claims—up from 4.0% in FY1617. In general, claimants qualifying within 70 hours of their VER are disproportionately found in EI economic regions with higher unemployment rates (12.1% or greater).Footnote 28 This could be partly attributable to the importance of seasonal employment in those regions and the discrete period available to accumulate sufficient hours of insurable employment for workers to qualify for EI regular benefits.
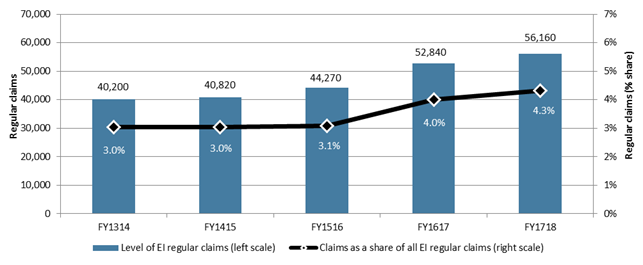
Chart 16 – Text version
| FY1314 | FY1415 | FY1516 | FY1617 | FY1718 | |
|---|---|---|---|---|---|
| Level of EI regular claims (left scale) | 40,200 | 40,820 | 44,270 | 52,840 | 56,160 |
| Claims as a share of all EI regular claims (right scale) | 3.0% | 3.0% | 3.1% | 4.0% | 4.3% |
- Note: Includes claims for which at least $1 of EI regular benefits was paid.
- Source: Employment and Social Development Canada, Employment Insurance (EI) administrative data. Data are based on a 10% sample of EI administrative data.
An alternate method to measure eligibility
A recent departmental study* used the Record of Employment (ROE)** data from 2001 to 2017 to estimate the proportion of job separators who met the required number of hours of insurable employment to qualify for EI regular benefits. The share of laid-off job separators (the reason for separation was shortage of work) with enough hours in the previous 52 weeks to meet the VER declined over time(75.4% in 2001 to 68.2% in 2017)— to the lowest proportion observed over this time period. The probability of accumulating enough insurable hours increased with regional unemployment rates (70.4% to 85.2%). This may not fully reflect potential eligibility where previous employment did not result in a ROE. This point is supported by another departmental study*** that examined ROE issuance for an interruption of earnings. It found that nearly one-third (30.2%) of earnings interruptions in 2014 were not associated with a ROE.
- * ESDC, Record of Employment-based Measures of Employment Insurance Eligibility: Update 2001 to 2017. (Ottawa: ESDC, Evaluation Directorate, 2019)
- ** A Record of Employment is a form completed by the employer when an employee stops working. It contains information on employment history, and is the single most important document used by employees to apply for EI benefits.
- *** ESDC, Record of Employment and Interruption of Earnings: Firms. (Ottawa: ESDC, Evaluation Directorate, 2018)
Eligibility for Employment Insurance regular benefits by province, gender and age
The eligibility rates for EI regular benefits are sensitive to economic conditions and specific employment patterns during the qualifying period, such as the incidence of full-time versus part-time hours, permanent versus temporary employment, etc. Because of this, significant variations are found when EI claimants are classified based on demographic and regional labour force characteristics.
Table 15 outlines the eligibility rates for EI regular benefits by province, gender and age groups over the past 5 years. Among all provinces in 2017, the highest eligibility rate was observed in Newfoundland and Labrador (96.7%) while the lowest was in Saskatchewan (69.7%). Compared with the previous year, the eligibility rate declined in six provinces and increased in the other four provinces in 2017. Generally, Atlantic provinces have the highest eligibility rate among all provinces in Canada, whereas Ontario and the Western provinces have comparatively lower eligibility rates. This trend has continued in 2017.
Historically, men have higher eligibility rates than women, which may be attributable to the fact that a higher proportion of men hold full-time and/or permanent jobs while a higher proportion women work in part-time and/or temporary jobs. In 2017, the eligibility rate for men was 85.8% compared to 82.1% for women.
In terms of age groups, unemployed young workers aged 24 years and under had the lowest eligibility rateFootnote 29 (40.7%) in 2017, compared to those aged between 25 and 44 years (89.4%) and older workers aged 45 years and over (90.2%). The largest variation in eligibility rates in 2017 compared to the previous year was observed for the younger workers (-10.1 percentage points), while the eligibility rate of unemployed workers in the other two age groups showed little change. The large decline in the eligibility rate of unemployed younger workers can be explained in part by the strong economic growth observed in 2017 which caused the unemployment rate to go down,Footnote 30 resulting in EI claimants having to accumulate more hours of insurable employment in order to qualify for EI regular benefits. This was particularly difficult for younger workers as they are over-represented in part-time and seasonal employment.
Among workers who were aged between 25 and 44 years, the eligibility rate for men (92.5%) was higher than that for women (84.0%); however, this reversed among workers aged 45 years and over—the eligibility rate was 87.7% for men, whereas for women it was 94.2%.
| 2013 | 2014 | 2015 | 2016 | 2017 | |
|---|---|---|---|---|---|
| Province or territory | |||||
| Newfoundland and Labrador | 93.9% | 94.1% | 93.7% | 95.9% | 96.7% |
| Prince Edward Island | 94.4% | 93.4% | 92.7% | 98.5% | 94.3% |
| Nova Scotia | 94.8% | 81.2% | 82.3% | 93.3% | 86.0% |
| New Brunswick | 96.4% | 90.5% | 96.2% | 94.6% | 93.1% |
| Quebec | 86.1% | 84.3% | 81.5% | 86.7% | 85.1% |
| Ontario | 83.1% | 81.0% | 84.8% | 81.3% | 79.6% |
| Manitoba | 85.6% | 91.4% | 82.9% | 75.3% | 84.9% |
| Saskatchewan | 82.3% | 85.4% | 89.9% | 78.9% | 69.7% |
| Alberta | 87.9% | 80.4% | 78.6% | 84.9% | 85.2% |
| British Columbia | 81.5% | 77.3% | 75.2% | 87.3% | 90.0% |
| Gender | |||||
| Men | 89.8% | 84.0% | 82.0% | 87.2% | 85.8% |
| Women | 80.0% | 81.3% | 84.3% | 81.6% | 82.1% |
| Age category | |||||
| 24 years old and under | 54.5% | 44.0% | 54.0% | 50.8% | 40.7% |
| 25 to 44 years old | 89.7% | 86.9% | 82.1% | 88.4% | 89.4% |
| 45 years old and over | 90.8% | 88.8% | 90.7% | 94.0% | 90.2% |
| Canada | 85.8% | 83.1% | 82.8% | 85.4% | 84.3% |
- Source: Statistics Canada, Employment Insurance Coverage Survey, 2013 to 2017.
Eligibility for Employment Insurance regular benefits by type of employment
As discussed, applicants for EI regular benefits need to accumulate a minimum number of hours of insurable employment, depending on the regional unemployment rate in the previous 52 weeks or since the start of their last claim, whichever is shorter. Intuitively, workers who previously held full-time positions are more likely to have accumulated the required number of hours of insurable employment and have a higher eligibility rate than part-time workers. Similarly, applicants who previously had permanent jobs are more likely to report a higher eligibility rate than those who had temporary employment.
Chart 17 illustrates the eligibility rates for EI regular benefits by previous employment characteristics for the past 10 years. During this time, the eligibility rate for permanent workers ranged between 92.8% and 87.2%, while the eligibility rate for temporary workers ranged between 79.0% and 68.3%. Eligibility rates for temporary workers show comparatively more variability than that for permanent workers over this period.
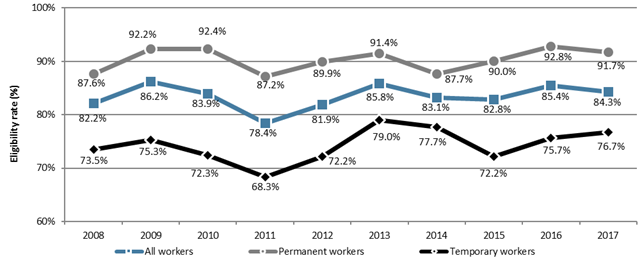
Chart 17 – Text version
| 2008 | 2009 | 2010 | 2011 | 2012 | 2013 | 2014 | 2015 | 2016 | 2017 | |
|---|---|---|---|---|---|---|---|---|---|---|
| All workers | 82.2% | 86.2% | 83.9% | 78.4% | 81.9% | 85.8% | 83.1% | 82.8% | 85.4% | 84.3% |
| Permanent workers | 87.6% | 92.2% | 92.4% | 87.2% | 89.9% | 91.4% | 87.7% | 90.0% | 92.8% | 91.7% |
| Temporary workers | 73.5% | 75.3% | 72.3% | 68.3% | 72.2% | 79.0% | 77.7% | 72.2% | 75.7% | 76.7% |
- Source: Statistics Canada, Employment Insurance Coverage Survey, 2008 to 2017.
In terms of previous work pattern, permanent workers can further be classified in two categories—those who had full-time employment and those who had part-time employment. Similarly, temporary workers can be classified in two categories as well—those who were seasonal workers and those whose previous employment was non-seasonal.Footnote 31 Chart 18 shows the eligibility rates for EI regular benefits by previous work pattern for the past 10 years. The eligibility rates for permanent full-time workers show little variability over this period, while the eligiblity rates for permanent part-time workers and temporary non-seasonal workers show much higher variability. The eligibilty rate for permanent full-time workers decreased slightly from 95.3% in 2016 to 94.5% in 2017, while the eligibility rate for permanent part-time workers notably increased from 62.4% in 2016 to 69.3% in 2017. Among temporary workers, the eligibility rate for temporary seasonal workers decreased slightly from 87.5% in 2016 to 86.7% in 2017 while the eligibility rate for temporary non-seasonal workers increased sligtly from 66.4% in 2016 to 66.8% in 2017.
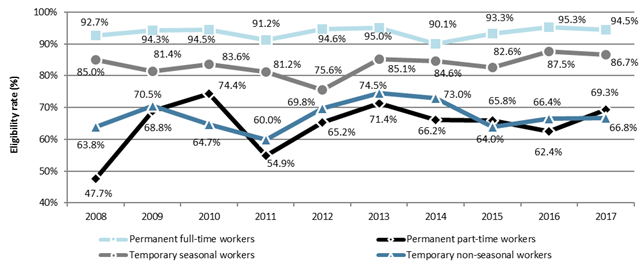
Chart 18 – Text version
| 2008 | 2009 | 2010 | 2011 | 2012 | 2013 | 2014 | 2015 | 2016 | 2017 | |
|---|---|---|---|---|---|---|---|---|---|---|
| Permanent full-time workers | 92.7% | 94.3% | 94.5% | 91.2% | 94.6% | 95.0% | 90.1% | 93.3% | 95.3% | 94.5% |
| Permanent part-time workers | 47.7% | 68.8% | 74.4% | 54.9% | 65.2% | 71.4% | 66.2% | 65.8% | 62.4% | 69.3% |
| Temporary seasonal workers | 85.0% | 81.4% | 83.6% | 81.2% | 75.6% | 85.1% | 84.6% | 82.6% | 87.5% | 86.7% |
| Temporary non-seasonal workers | 63.8% | 70.5% | 64.7% | 60.0% | 69.8% | 74.5% | 73.0% | 64.0% | 66.4% | 66.8% |
- Source: Statistics Canada, Employment Insurance Coverage Survey, 2008 to 2017.
Access to Employment Insurance regular benefits
Access to EI regular benefits is another way to measure how well the EI program is functioning to meet the needs of Canada’s unemployed in helping them transition to new employment. For the purpose of the EI Monitoring and Assessment Report, access to EI regular benefits is measured as the share of the unemployed population receiving EI regular benefits. Chart 19 illustrates the two main ratios used to measure accessibility—the Beneficiary-to-Unemployed (B/U) ratio and the Beneficiary-to-Unemployed Contributor (B/UC) ratio from 2013 to 2017.
The B/U and B/UC ratios in 2017 were 42.1% and 66.9%, respectively. It can be seen that, while the B/U ratio changed very little in 2017 compared to the previous year (+0.3 percentage points), the increase in the B/UC ratio was more significant (+2.9 percentage points) during this time. This happened because the change in the number of unemployed (-112,100 people) from 2016 to 2017 was higher than the change in the number of unemployed contributors (-100,900 people) during the same time period.
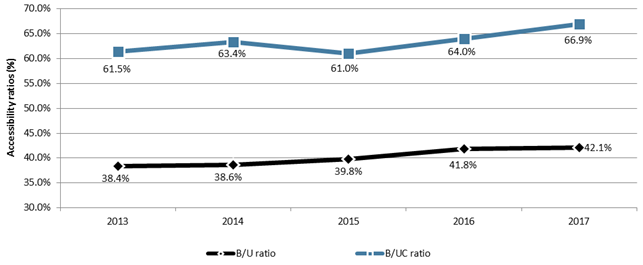
Chart 19 – Text version
| 2013 | 2014 | 2015 | 2016 | 2017 | |
|---|---|---|---|---|---|
| Beneficiary-to-Unemployed (B/U) Ratio | 38.4% | 38.6% | 39.8% | 41.8% | 42.1% |
| Beneficiary-to-Unemployed Contributor (B/UC) Ratio | 61.5% | 63.4% | 61.0% | 64.0% | 66.9% |
- Sources: Statistics Canada, Employment Insurance Coverage Survey (for data on the number of unemployed (U) and the number of unemployed contributors (UC)); and Statistics Canada, monthly Employment Insurance statistics release, Table 14-10-0010-01 (for data on EI regular beneficiaries (B)).
The Beneficiary-to-Unemployed (B/U) ratio
The Beneficiary-to-Unemployed (B/U) ratio is calculated by expressing the average number of unemployed individuals who received EI regular benefits in the reference week of the EICS as a share of the corresponding unemployed population.Footnote 32 As such, it includes a significant segment of the unemployed population who are ineligible for EI regular benefits (such as those who did not work in the previous year or never worked, who did not have a valid job separation, and those who were self-employed). Because of this, the B/U ratio is sensitive to changes in the composition of the unemployed population and the proportion of the unemployed outside the scope of the EI program coverage. This makes the ratio less suited to measuring access to EI regular benefits.
The Beneficiary-to-Unemployed Contributor (B/UC) ratio
The Beneficiary-to-Unemployed Contributor (B/UC) ratio is calculated by expressing the average number of EI regular beneficiaries as a share of the corresponding unemployed population who contributed EI premiums in the previous 12 months. This ratio considers a narrower target population than the B/U ratio. Because the B/UC ratio measures accessibility among unemployed workers for whom the EI regular benefits are designed to provide coverage, and exclude those who did not contribute EI premiums during their last employment period or did not have any labour force attachments, this ratio may provide a better assessment of accessibility to EI regular benefits.
Unemployed individuals eligible for EI benefits who do not apply
A recent study* by ESDC examined the characteristics of unemployed individuals who were eligible to receive EI regular and special benefits but did not apply, and the reasons for not applying. The study found that the proportion of individuals who recalled being eligible but did not apply was higher for EI special benefits than EI regular benefits.
The most common reasons for not applying for regular benefits were having found another job right away (30% of respondents), assuming not being eligible (25% of respondents) and not needing benefits (21% of respondents). These estimates were generally consistent for men and women, except for the reason of not needing benefits (23% for women vs. 18% for men.
On the other hand, the most common reasons for not applying for EI special benefits among eligible respondents at the time of the survey, were not needing the benefits (33% of respondents), followed by having found another job right away (26% of respondents) and assuming not being eligible (18% of respondents).
Both the likelihood and reasons for not applying varied by several factors (age groups, educational attainment, geographic regions, prevalence of disability and/or health conditions, duration of unemployment, previous work pattern, industry of employment and net income of the respondents). For example, a higher non-application rate for EI regular benefits was found for eligible individuals who were younger (aged 24 years or less), had more than a high school education, resided in the Prairies, had been unemployed for one to two months, and had worked in the service-producing industries. On the other hand, eligible individuals who reported having a disability, identified as being a visible minority or reported having poor health at job separation were slightly more likely to apply for EI regular and special benefits in general.
- * ESDC, EI-Eligible Job Separators that Do Not Apply: Characteristics of Non-Application. (Ottawa: ESDC, Evaluation Directorate, 2019)
2.2.3 Level of Employment Insurance regular benefits
The level of EI regular benefits (that is, the weekly regular benefit rate) that eligible claimants are entitled to receive is calculated as 55% of their highest (best) weeks of earnings in insurable employment during the qualifying period under the Variable Best Weeks (VBW) provision. The number of weeks used to determine the weekly benefit rate ranges from 14 to 22, depending on the monthly regional unemployment rate of the claimant’s EI economic region. In addition to this, claimants with children (under the age of 18) and low annual family income may be eligible to receive additional benefits under the Family Supplement Provision which can increase their benefit rate from 55% to a maximum of 80%, subject to the maximum weekly benefit rate (see sub-section 2.1.1 for detailed discussion).
Chart 20 illustrates the average weekly benefit rate for EI regular benefits claimants over the past eight years. During the current reporting period, the average weekly EI regular benefit rate was $457. This represents an increase of approximately $8 (+1.6%) from the benefit rate in the previous year ($449). The average weekly regular benefit rate has been rising steadily on a year-over-year basis.
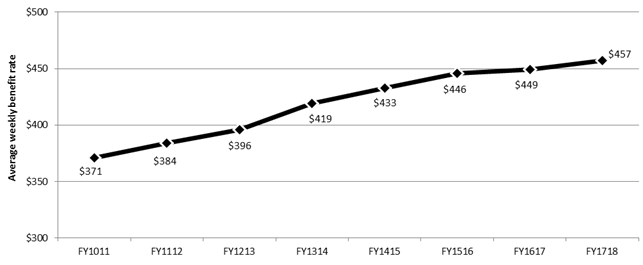
Chart 20 – Text version
| FY1011 | FY1112 | FY1213 | FY1314 | FY1415 | FY1516 | FY1617 | FY1718 | |
|---|---|---|---|---|---|---|---|---|
| Average weekly benefit rate | $371 | $384 | $396 | $419 | $433 | $446 | $449 | $457 |
- Note: Includes all claims for which at least $1 of EI regular benefits was paid.
- Source: Employment and Social Development Canada, Employment Insurance (EI) administrative data. Data are based on a 10% sample of EI administrative data.
Among all provinces and territories, the average weekly regular benefit rate increased in all regions except Yukon in FY1718 compared to the previous year. The highest growth rate was observed in Nunavut (+5.8%) followed by Newfoundland and Labrador and Northwest Territories (+3.1%). The level of average weekly regular benefit rate varied among regions—from a high of $527 in Northwest Territories to a low of $426 in Prince Edward Island in the current reporting period. On average, claimants in the Atlantic province, Quebec and Manitoba received less in weekly regular benefits than the national average weekly benefit rate.
In FY1718, the average weekly regular benefit rate for men ($481) was well over that for women ($419)—a trend that has continued over the years (see Annex 2.5.3 for average weekly regular benefit rate by gender over the past 5 years). This gap is observable for all categories of hours of insurable employment worked during the qualifying period and is more apparent at lower levels of labour market attachment, as outlined in Chart 21. At the lowest level of labour market attachment (as indicated by the number of hours of insurable employment), the average weekly regular benefit rate for women ($279) in FY1718 was approximately 74.6% of men’s ($374), whereas for women with the highest level of labour market attachment the average weekly benefit rate ($479) was approximately 92.6% of men’s ($517). However, this gap was the narrowest for claimants who had between 1400-1539 hours of insurable employment during their qualifying period.
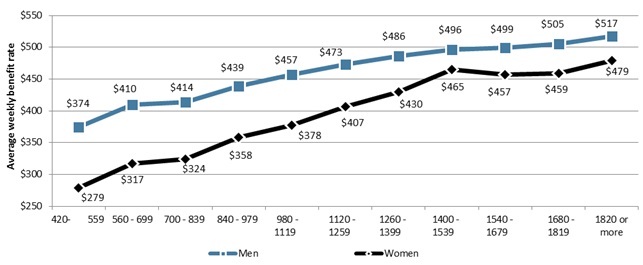
Chart 21 – Text version
| Insurable hours worked | Men's average weekly benefit rate | Women's average weekly benefit rate |
|---|---|---|
| 420 to 559 | $374 | $279 |
| 560 to 699 | $410 | $317 |
| 700 to 839 | $414 | $324 |
| 840 to 979 | $439 | $358 |
| 980 to 1119 | $457 | $378 |
| 1120 to 1259 | $473 | $407 |
| 1260 to 1399 | $486 | $430 |
| 1400 to 1539 | $496 | $465 |
| 1540 to 1679 | $499 | $457 |
| 1680 to 1819 | $505 | $459 |
| 1820 or more | $517 | $479 |
- Note: Includes all claims for which at least $1 of EI regular benefits was paid.
- Source: Employment and Social Development Canada, Employment Insurance (EI) administrative data. Data are based on a 10% sample of EI administrative data.
Table 16 outlines the level of average weekly regular benefits by age group for men and women for the current reporting period and the previous year. It can be seen that claimants who were between 25 and 44 years old had the highest average weekly regular benefit rate ($470) in FY1718, while younger claimants (aged 24 years and under) had the lowest ($416). Claimants who were between 45 and 54 years of age experienced the highest increase in the average weekly benefit rate in FY1718 compared to the previous year (+1.8% or +$9). When claimants are categorized by age group and gender, it can be seen that men who were between 45 and 54 years of age had the highest average weekly regular benefit rate ($496) in FY1718, whereas for women the highest rate was for claimants who were aged between 25 and 44 years ($436).
| Age group | Men | Women | Total | |||
|---|---|---|---|---|---|---|
| FY1617 | FY1718 | FY1617 | FY1718 | FY1617 | FY1718 | |
| 24 years old and under | $429 | $436 | $364 | $367 | $412 | $416 |
| 25 to 44 years old | $484 | $491 | $427 | $436 | $462 | $470 |
| 45 to 54 years old | $488 | $496 | $414 | $422 | $454 | $463 |
| 55 years old and over | $463 | $471 | $392 | $399 | $435 | $442 |
| Canada | $474 | $481 | $412 | $419 | $449 | $457 |
- Note: Includes all claims for which at least $1 in EI regular benefits was paid.
- Source: Employment and Social Development Canada, Employment Insurance (EI) administrative data. Data are based on a 10% sample of EI administrative data.
Table 17 shows the average weekly regular benefit rates by EI claimant categories. The average weekly regular benefit increased for all claimant categories in the current reporting period compared to the previous year, with the highest increase observed for frequent claimants (+2.3% or $11). In FY1718, long-tenured workers received the highest weekly regular benefit ($495), followed by the frequent claimants ($464). Occasional claimants received the lowest weekly regular benefit ($437), which was approximately $20 less than the national average.
| EI Claimant category | Average weekly regular benefit rate ($) | ||
|---|---|---|---|
| FY1617 | FY1718 | Change (%) | |
| Long-tenured workers | $489 | $495 | +1.1% |
| Occasional claimants | $429 | $437 | +1.8% |
| Frequent claimants | $453 | $464 | +2.3% |
| Canada | $449 | $457 | +1.6% |
- Note: Includes all claims for which at least $1 in EI regular benefits was paid.
- * See Annex 2.1 for definitions of claimant categories referenced in this table.
- Source: Employment and Social Development Canada, Employment Insurance (EI) administrative data. Data are based on a 10% sample of EI administrative data.
The weekly benefit rate for EI regular benefits is capped at a maximum that is based on the maximum insurable earnings (MIE). The MIE was $51,300 in 2017 and $51,700 in 2018. As the weekly regular benefit rate is calculated as 55% of average weekly earnings, the maximum weekly regular benefit rate was $543 in 2017 and $547 in 2018. Table 18 shows the proportion of claimants that received the maximum benefit rate.
| Share of claims that received the maximum weekly benefit rate | ||
|---|---|---|
| FY1617 | FY1718 | |
| Gender | ||
| Men | 56.9% | 58.4% |
| Women | 29.2% | 30.2% |
| Age group | ||
| 24 years old and under | 30.4% | 30.6% |
| 25 to 44 years old | 50.7% | 51.8% |
| 45 to 54 years old | 48.0% | 49.8% |
| 55 years old and over | 42.1% | 43.3% |
| EI claimant category | ||
| Long-tenured workers | 63.7% | 63.7% |
| Occasional claimants | 38.1% | 39.5% |
| Frequent claimants | 45.7% | 48.5% |
| Canada | 46.1% | 47.3% |
- Note: Includes all claims for which at least $1 in EI regular benefits was paid.
- * See Annex 2.1 for definitions of claimant categories referenced in this table.
- Source: Employment and Social Development Canada, Employment Insurance (EI) administrative data. Data are based on a 10% sample of EI administrative data.
Benefit repayments in the 2016 tax year*
Pursuant to the Employment Insurance Act, EI claimants must repay a percentage of EI benefits they have received if their net income** exceeds 1.25 times the maximum yearly insurable earnings. In the 2016 taxation year, they were required to repay 30% of the lesser of their net income above $63,500 or 30% of regular or fishing benefits they received in that taxation year. However, claimants who received special benefits or less than 1 week of either regular or fishing benefits in the preceding 10 taxation years were exempt from the benefits repayment requirement.
In the 2016 taxation year, around 169,300 EI claimants repaid a total of $250.6 million in EI benefits. Both the number of claimants who repaid benefits and the total amount repaid changed slightly in 2016 compared to the previous year—while the number of claimants who repaid benefits decreased (-1.7%), the total amount of benefits repaid increased (+1.3%). Each EI claimant subject to the benefit repayment provision repaid $1,480 on average in 2016, compared to $1,437 repaid in 2015 (+$43 or +3.0%). These claimants on average received $6,381 in EI benefits (any type of EI benefits, including EI special and EI fishing benefits) in 2016, compared to $6,185 in 2015.
Over the 5 tax years 2012-2016, the variations in the number of claimants who repaid benefits and the total amount repaid are mixed. The number of EI claimants who repaid benefits decreased in 2013 and in 2016, while it had increased in the other years. On the other hand, the total amount repaid in benefits increased every year in the past 5 years except for 2013 when it decreased by 1.7% from the previous year.
Benefit repayments vary by industry. Around two-thirds (66.5%) of those repaying EI benefits in 2016 had worked in the goods-producing industries and accounted for 68.0% of the total amount repaid. Whereas, service-producing industries accounted for 28.7% of claimants and 28.8% of total repaid benefits. These proportions have remained stable in recent years (2012-2016).
- * The most recent taxation year for which data is available is 2016.
- ** Net income includes employment income and EI benefits received during the taxation year.
2.2.4 Extension of Employment Insurance regular benefits for workers in regions affected by the downturn in commodity prices
In late 2014, a global downturn in commodity prices led to stalled economic growth in countries around the world, and Canada was not spared. In FY1516, the yearly real gross domestic product (GDP) growth in Canada slowed down to the lowest level observed since FY0910 following the recession in FY0809.Footnote 33 This economic slowdown produced sustained employment shocks across Canada, especially in regions whose economies are commodity-based. In order to provide extra financial support to displaced workers in the 15 EI economic regionsFootnote 34 that were hit the hardest by this event, the Government of Canada introduced temporary measuresFootnote 35 to provide eligible workers with additional weeks of EI regular benefits.
The temporary measure extended the number of EI regular benefit weeks by 5 weeks, up to a maximum of 50 weeks, for all eligible claimants—residing in these 15 EI economic regions who had established a claim between January 4, 2015 and July 8, 2017 and remained unemployed. An additional 20 weeks of EI regular benefits, up to a maximum of 70 weeks, was provided to long-tenured workers.Footnote 36, Footnote 37 These extended benefits were available for one year, starting from July 3, 2016. In order to claim the additional weeks of EI regular benefits provided through the measure, eligible claimants had their benefit period extended by the number of additional weeks of benefits they were entitled to receive, plus 12 weeks.Footnote 38 For example, a claimant eligible for 5 additional weeks of EI regular benefits provided by the measure had the benefit period extended by 17 weeks (5+12). For long-tenured workers who were eligible to receive an additional 20 weeks (for a total of 25 weeks) of EI regular benefits, their benefit period was extended by 12 weeks as well (same as the non-long tenured workers). This meant that these long-tenured workers received a benefit period extension of 37 weeks (25+12).
Eligible claimants for the additional weeks of Employment Insurance regular benefits
The measure had different implications for eligible claims depending on their establishment date. Although the measure came into effect on July 3, 2016, claims established as early as January 4, 2015 could also benefit from it. Based on their establishment date, claims eligible for additional weeks of EI regular benefits through the measure can be classified in three categories: the reach-back claims, active claims and new claims. Distinction among these three types of claims are discussed below.
Some claims that were established on or after January 4, 2015 in the affected regions and could be eligible for additional weeks of benefits, were terminatedFootnote 39 by the time the measure came into force on July 3, 2016. To support claimants who were still unemployed as of July 3, 2016, the benefit period on these claims was considered not to have ended, so that they could qualify for additional weeks of EI regular benefits. These claims are referred to as "reach-back claims".
In addition to the reach-back claims, some claims that were established on or after January 4, 2015 were still openFootnote 40 when the measure came into effect on July 3, 2016. These claims are referred to as active EI claims.
Lastly, as the measure was introduced to provide additional benefits for one year, the last effective day in order to be eligible for these benefits was July 8, 2017. Claims that were established between the temporary measure implementation date on July 3, 2016 and July 8, 2017 are referred to as new claims.
As mentioned above, it is important to distinguish among these 3 types of claims, although all of them were eligible for extended EI regular benefits, as the benefit period extension had different repercussions for them. For example, the reach-back claims were provided with a new benefit period so that they could receive some additional weeks of benefits, as they were terminated by the effective date of the measure. Because of this, claimants associated with these claims were not allowed to be entitled for any weeks of EI regular benefits that were not claimed during their original benefit period of 52 weeks.Footnote 41 On the other hand, active and new claims had their benefit period extended before their original benefit period of 52 weeks terminated. So, claimants associated with these claims could receive entitled weeks of unclaimed EI regular or special benefits from their original benefit period during their benefit period extension.
New claims established for the additional weeks of Employment Insurance regular benefits in regions affected by the downturn in commodity prices
During the reporting fiscal year, a total of 283,600 claims were established for EI regular benefits in the 15 EI economic regions affected by the economic downturn. Of these claims, 76,000 were potentially eligible to receive additional benefits. As shown in Table 19, a total of 29,800 claims received additional weeks of EI regular benefits in FY1718. As the measure was effective until July 8, 2017, only claims established for EI regular benefits in April, May, June and in the first week of July, 2017 in these regions were eligible to receive additional weeks of benefits—this explains the large difference in the number of claims that benefited from the measure in FY1617 and FY1718.
| Number of claims with additional weeks of benefits | Share of claims with additional benefits among potentially eligible claims (%) | Distribution of claims among all of those with additional benefits (% share) | Claims established between January 4, 2015 and March 31, 2018 | ||||||
|---|---|---|---|---|---|---|---|---|---|
| FY1617r | FY1718 | FY1617r | FY1718 | FY1617r | FY1718 | Number of claims with additional weeks of benefits | Share of claims with additional benefits among potentially eligible claims (%) | Distribution of claims among all of those with additional benefits (% share) | |
| Province or territory* | |||||||||
| Newfoundland and Labrador | 26,710 | 6,220 | 60.5% | 45.3% | 18.9% | 20.9% | 64,910 | 57.5% | 18.3% |
| Ontario | 13,160 | 3,380 | 47.0% | 44.4% | 9.3% | 11.4% | 34,390 | 46.4% | 9.7% |
| Manitoba | 3,510 | 1,040 | 49.1% | 45.8% | 2.5% | 3.5% | 8,550 | 47.8% | 2.4% |
| Saskatchewan | 13,890 | 3,090 | 46.7% | 38.1% | 9.8% | 10.4% | 34,010 | 44.7% | 9.6% |
| Alberta | 63,270 | 12,000 | 42.1% | 35.6% | 44.8% | 40.3% | 161,640 | 42.1% | 45.6% |
| British Columbia | 19,710 | 3,850 | 45.5% | 37.9% | 14.0% | 12.9% | 48,890 | 43.4% | 13.8% |
| Yukon | 590 | 80 | 60.8% | 57.1% | 0.4% | 0.3% | 1,160 | 48.7% | 0.3% |
| Nunavut | 350 | 100 | 51.5% | 37.0% | 0.2% | 0.3% | 890 | 54.3% | 0.3% |
| Gender | |||||||||
| Men | 86,540 | 17,290 | 44.6% | 40.5% | 61.3% | 58.1% | 221,960 | 43.2% | 62.6% |
| Women | 54,650 | 12,470 | 49.5% | 37.5% | 38.7% | 41.9% | 132,480 | 49.5% | 37.4% |
| Age category | |||||||||
| 24 years old and under | 14,220 | 2,630 | 36.5% | 36.1% | 10.1% | 8.8% | 33,440 | 33.5% | 9.4% |
| 25 to 44 years old | 58,320 | 12,240 | 42.3% | 36.0% | 41.3% | 41.1% | 145,620 | 41.1% | 41.1% |
| 45 to 54 years old | 31,450 | 6,630 | 48.3% | 38.3% | 22.3% | 22.3% | 81,540 | 48.6% | 23.0% |
| 55 years old and over | 37,200 | 8,260 | 59.6% | 47.3% | 26.3% | 27.8% | 93,840 | 58.8% | 26.5% |
| EI claimant category* | |||||||||
| Long-tenured worker | 33,730 | 5,670 | 39.3% | 28.9% | 23.9% | 19.1% | 94,830 | 40.6% | 26.8% |
| Non long-tenured worker | 107,460 | 24,090 | 49.2% | 42.7% | 76.1% | 80.9% | 259,610 | 47.4% | 73.2% |
| Claim status | |||||||||
| Reach-back claims | n/a | n/a | n/a | n/a | n/a | n/a | 77,090 | 50.1% | 21.7% |
| Active or new claims | 141,190 | 29,760 | 46.4% | 39.2% | 100.0% | 100.0% | 277,350 | 44.2% | 78.3% |
| Canada | 141,190 | 29,760 | 46.4% | 39.2% | 100.0% | 100.0% | 354,440 | 45.4% | 100.0% |
- Note: Data may not add up to the total due to rounding. Includes all claims for which at least $1 of additional benefit was paid.
- rRevised data.
- * There were no affected EI economic regions in Prince Edward Island, Nova Scotia, New Brunswick, Quebec and Northwest Territories.
- ** See Annex 2.1 for definitions of EI claimant categories.
- Source: Employment and Social Development Canada, Employment Insurance (EI) administrative data. Data are based on a 10% sample of EI administrative data.
Of all claims that received additional weeks of EI regular benefits in FY1718, Alberta and Newfoundland and Labrador accounted for the largest shares, as the commodity-based industries in Canada are concentrated in these provinces. In terms of gender and age groups, a greater share of claims were established by men (58.1%), and claimants who were between 25 and 44 years old (41.1%). Non long-tenured workers continued to make the majority of claims. Table 19 also outlines the proportion of claims that received additional weeks of EI regular benefits of all eligible claims. Nationally, 39.2% of the eligible claims received additional weeks of benefits because of the measure in FY1718, down from 46.4% in FY1617.
Table 19 also shows the total number and distribution of claims that received additional weeks of EI regular benefits since the measure came into effect on January 4, 2015. As of March 31, 2018, a total of 354,440 claims had received additional weeks of benefits, representing 45.4% of all potentially eligible claims. Of the total claims that received additional weeks of EI regular benefits, 77,090 claims were identified as reach-back claims (21.7% of total) while the other 277,350 claims were identified as active or new claims (78.3% of total).
While some eligible claimants did not use any additional weeks from the temporary help measure, they nevertheless benefited from the benefit period extension. These claimants either claimed weeks of EI regular benefits from their original entitlement or weeks of special benefits during the benefit period extension. Of all eligible claims established before or during FY1718, almost 134,700 claims met these criteria (see Table 20). In addition to this, as of March 31, 2018, almost 74,800 claims were associated with both additional weeks of EI benefits resulting from the measure; and, previously unclaimed weeks of either regular benefits during their original benefit period or weeks of special benefits claimed during the benefit period extension, or both, since the measure came into effect on January 4, 2015.
| Type of benefits under the temporary support measure | Number of claims established | As a share of all eligible claims established (%) | Claims established between January 4, 2015 and March 31, 2018 | |||
|---|---|---|---|---|---|---|
| FY1617r | FY1718 | FY1617r | FY1718 | Number of claims | As a share of all eligible claims established (%) | |
| Additional weeks of EI regular benefits only | 110,330 | 25,380 | 36.2% | 33.4% | 279,600 | 35.8% |
| At least one week of additional EI regular benefits and one week of original entitlement or of special benefits during the benefit period extension | 30,860 | 4,380 | 10.1% | 5.8% | 74,840 | 9.6% |
| Sub-total for claims with at least one week of additional EI regular benefits | 141,190 | 29,760 | 46.4% | 39.2% | 354,440 | 45.4% |
| Weeks of original entitlement or of special benefits during the benefit period extension only | 57,080 | 20,020 | 18.8% | 26.3% | 134,710 | 17.2% |
| Canada | 198,270 | 49,780 | 65.1% | 65.5% | 489,150 | 62.6% |
- Note: Data may not add up to the total due to rounding. Includes all claims which benefited from the temporary support measure.
- rRevised data.
- Source: Employment and Social Development Canada, Employment Insurance (EI) administrative data. Data are based on a 10% sample of EI administrative data.
Claim duration, benefit paid and exhaustion rate in regions affected by the downturn in commodity prices
Of the 489,200 claims that benefited from the temporary extension of EI regular benefits in the 15 EI economic regions since the temporary support measure came into effect, a total of 221,000 claims were completedFootnote 42 during the reporting fiscal year, compared to 202,600 completed claims in the previous year. The majority of these claims originated in Alberta (43.8%) in FY1718, followed by Newfoundland and Labrador (18.9%) and British Columbia (14.0%). On average, these claims received 38.0 weeks of benefits (27.7 weeks if the weeks of benefits associated with the temporary support measure are excluded)—see Table 21.
Claims that benefited from the temporary support measure of the extension of EI regular benefits had a weekly average benefit rate of $465 in FY1718, up slightly from $461 reported in the previous year. Compared to this, claims established for EI regular benefits in these affected regions that did not benefit from the extension measure received $479 on average every week in benefit payments. Regular claims that were completed in FY1718 that received at least one week of additional benefits and/or at least one week of EI benefits during the benefit period extension received on average $16,564 over their entire duration. Excluding the extra weeks of benefits received due to the temporary extension measure, on average these claims received $11,966 in EI benefits. Compared to this, claims established in these regions that did not benefit from the extension measure received $7,532 on average in FY1718.
| Excluding weeks of benefits paid under the temporary support measure | Including weeks of benefits paid under the temporary support measure | |||||||
|---|---|---|---|---|---|---|---|---|
| Average claim duration (in weeks) | Average amount of EI benefits paid per claim ($)** | Average claims duration (in weeks) | Average amount of EI benefits paid per claim ($)** | |||||
| FY1617r | FY1718p | FY1617r | FY1718p | FY1617r | FY1718p | FY1617r | FY1718p | |
| Province or territory* | ||||||||
| Newfoundland and Labrador | 33.4 | 31.7 | $13,345 | $12,463 | 41.1 | 40.4 | $16,542 | $16,136 |
| Ontario | 27.8 | 25.8 | $11,263 | $10,404 | 35.6 | 35.1 | $14,484 | $14,329 |
| Manitoba | 31.3 | 30.5 | $12,670 | $12,170 | 38.7 | 39.1 | $15,768 | $15,763 |
| Saskatchewan | 27.4 | 25.9 | $12,012 | $11,198 | 35.9 | 36.0 | $15,800 | $15,677 |
| Alberta | 27.6 | 27.5 | $12,836 | $12,743 | 36.9 | 39.1 | $17,188 | $18,186 |
| British Columbia | 26.0 | 25.2 | $11,075 | $10,489 | 33.9 | 34.6 | $14,381 | $14,477 |
| Yukon | 22.5 | 22.7 | $10,374 | $10,629 | 30.8 | 31.1 | $14,107 | $14,634 |
| Nunavut | 35.6 | 33.1 | $16,772 | $15,723 | 43.3 | 42.1 | $20,352 | $20,054 |
| Gender | ||||||||
| Men | 28.8 | 27.6 | $13,357 | $12,757 | 37.5 | 38.3 | $17,429 | $17,835 |
| Women | 27.9 | 27.8 | $10,778 | $10,625 | 36.1 | 37.3 | $14,073 | $14,412 |
| Age category | ||||||||
| 24 years old and under | 27.2 | 25.9 | $11,775 | $10,530 | 33.5 | 33.0 | $14,537 | $13,608 |
| 25 to 44 years old | 28.4 | 27.4 | $12,567 | $12,014 | 36.6 | 37.5 | $16,257 | $16,581 |
| 45 to 54 years old | 28.6 | 27.8 | $12,501 | $12,094 | 37.6 | 38.3 | $16,523 | $16,803 |
| 55 years old and over | 29.1 | 28.7 | $12,419 | $12,310 | 38.8 | 40.3 | $16,652 | $17,436 |
| EI claimant category* | ||||||||
| Long-tenured worker | 28.1 | 28.4 | $13,240 | $13,345 | 44.8 | 46.3 | $20,934 | $21,695 |
| Non long-tenured worker | 28.5 | 27.4 | $12,208 | $11,378 | 34.9 | 34.4 | $14,954 | $14,377 |
| Type of benefits under the temporary support measure | ||||||||
| Claims with additional regular benefits only | 30.2 | 33.7 | $13,096 | $14,340 | 38.2 | 43.0 | $16,609 | $18,438 |
| Claims with original entitlement weeks or special benefits only during the benefit period extension | 19.9 | 16.8 | $9,036 | $7,462 | 28.7 | 26.2 | $13,075 | $11,734 |
| Claims with weeks of additional regular benefits and weeks of original entitlement or of special benefits during the benefit period extension | 29.1 | 28.3 | $12,905 | $12,610 | 40.5 | 43.4 | $18,011 | $19,469 |
| Canada | 28.5 | 27.7 | $12,426 | $11,966 | 37.0 | 38.0 | $16,217 | $16,564 |
- Note: Data may not add up to the total due to rounding. Includes all claims which benefited from the temporary support measure.
- p Preliminary data.
- r Revised data.
- * There were no affected EI economic regions in Prince Edward Island, Nova Scotia, New Brunswick, Quebec and Northwest Territories
- ** Average amount of EI benefits (regular or special) paid per claim to claims established for regular benefits and that were completed during the fiscal year.
- *** See Annex 2.1 for definitions of EI claimant categories.
- Source: Employment and Social Development Canada, Employment Insurance (EI) administrative data. Data are based on a 10% sample of EI administrative data.
The exhaustion rate (including both entitlement and benefit period exhaustion) of completed claims in FY1718 that benefited from the measure was 52.6%. This exhaustion rate increases to 78.0% without the additional weeks of benefits provided through the temporary extension measure. This shows that, while almost half of all completed claims exhausted in the reporting period in these regions, an even greater share of the unemployed workers would have used all of their entitlement weeks or reached the end of their benefit period without the measure.
Amount paid to claimants benefiting from the extension of Employment Insurance regular benefits in regions affected by the downturn in commodity prices
During the reporting year, a total of $868.3 million were paid to EI claimants who benefited from the temporary extension of EI regular benefits in the affected regions, compared to $998.4 million paid in the previous year. Of this total amount in FY1718, $510.3 million were paid to claimants who received additional weeks of EI regular benefits because of the measure, while the other $358.1 million were associated with benefit payments to claimants who had qualified for regular benefits prior to the implementation of the measure or special benefits that were paid during the benefit period extension.
2.2.5 Employment Insurance regular benefit entitlement
Eligible claimants who have successfully established an EI claim receive up to a set maximum number of weeks of EI regular benefits (known as their entitlement). Their entitlement is determined by the number of hours of insurable employment worked during the qualifying period and the effective unemployment rate in the claimant’s EI economic region at the time the claim is established (see Annex 2.2 for the entitlement table). This subsection presents detailed analysis on the duration of EI regular benefits, both maximum entitlement and actual weeks used. Statistics presented in the subsection are generally based on claims that were completedFootnote 43 during the fiscal year. Statistics for the reporting fiscal year are preliminary estimates which are subject to revision in the future.
Maximum and actual duration of Employment Insurance regular benefits
Under most circumstances, the maximum entitlement of EI regular benefits available to an EI claimant is between 14 and 45 weeks, depending on the local unemployment rate and the claimant’s accumulated number of hours of insurable employment during the qualifying period. Higher maximums are associated with greater hours of insurable employment accumulated during the qualifying period and higher regional unemployment rates. The EI program is designed to respond automatically to changes in economic conditions that affect local labour markets. To do so, the country is divided into 62 economic regions. In general, when a region’s unemployment rate rises, the entrance requirements are reduced and the maximum duration of benefits increases. Therefore, the amount of assistance provided adjusts to the changing needs of regions and communities.
The actual duration of a claim is the number of weeks of EI regular benefits an EI claimant receives during a claim. Actual duration is usually lower than maximum duration, reflecting circumstances that can lead to reduced use of EI regular benefits over a claim’s benefit period (such as the claimant has found work, switched to special benefits or became unavailable to work).
The average maximum duration of EI regular claims completed in FY1718 decreased by 1.1 weeks: from 33.7 weeks in FY1617 to 32.6 weeks. The average actual duration also decreased by 0.6 weeks, to 20.1 weeks (see Chart 22). This decline in both average durations is attributable, in part, to the continuous improvement in labour market in several provinces and territories and the progressive reduction of the impact of the temporary EI support measures introduced through the Budget Implementation Act, 2016, No.1, which extended the duration of EI regular benefits for all eligible claimants in 15 EI economic regions affected by the downturn in commodity prices.Footnote 44
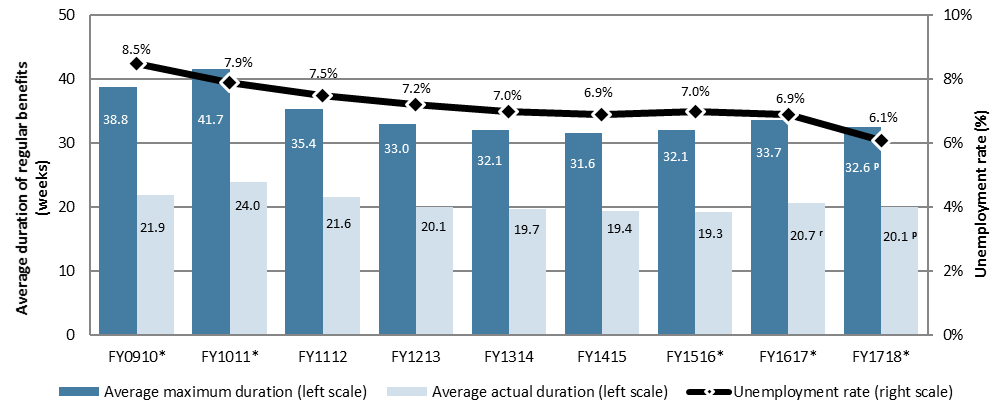
Chart 22 – Text version
| FY0910 | FY1011 | FY1112 | FY1213 | FY1314 | FY1415 | FY1516 | FY1617 | FY1718 | |
|---|---|---|---|---|---|---|---|---|---|
| Average actual duration in weeks (left scale) | 21.9 | 24 | 21.6 | 20.1 | 19.7 | 19.4 | 19.3 | 20.7 | 20.1p |
| Average maximum duration in weeks (left scale) | 38.8 | 41.7 | 35.4 | 33.0 | 32.1 | 31.6 | 32.1 | 33.7 | 32.6p |
| Unemloyment rate (right scale) | 8.5% | 7.9% | 7.5% | 7.2% | 7.0% | 6.9% | 7.0% | 6.9% | 6.1% |
- Note: Includes all claims completed during the fiscal year for which at least $1 of regular benefit was paid.
- *Coincides with the Employment Insurance temporary measures that increased the maximum number of weeks for which regular benefits could be paid.
- p Preliminary data.
- r Revised data.
- Sources: ESDC, Employment Insurance administrative data (for duration of regular benefits); and Statistics Canada, Labour Force Survey, Table 14-10-0287-01 (for data on unemployment rates). ESDC data are based on a 10% sample of EI administrative data.
In general, the average maximum duration of claims for EI regular benefits completed in FY1718 varied significantly across provinces and territories, reflecting differences in labour markets and labour force characteristics. As in the previous year, Nunavut (45.3 weeks) and Alberta (44.3 weeks) posted the highest average maximum duration, while Quebec and Ontario had the lowest averages at 28.8 weeks and 30.0 weeks, respectively (see Table 22).
Long-tenured workers are generally more likely to accumulate insurable hours of employment well above the minimum requirements for EI regular benefits. As such, they tend to benefit from longer entitlements (39.0 weeks during the reporting fiscal year) relative to frequent claimants (29.7 weeks) who averaged shorter employment spells.
With regards to the average actual duration of EI regular benefits, changes were generally in line with those observed for maximum duration. Provincial and territorial trends, notably affected by the changes in their local labour market conditions, showed greater variability. As such, as in the previous year, Alberta (+3.9 weeks), followed by Nunavut (+1.4 weeks), and Saskatchewan (+1.0 week) recorded the largest increases in the average actual duration in FY1718.
| Average maximum duration (weeks) | Average actual duration (weeks) | |||||
|---|---|---|---|---|---|---|
| FY1617 | FY1718p | Change (%) | FY1617 | FY1718p | Change (%) | |
| Province or territory | ||||||
| Newfoundland and Labrador | 42.3r | 43.5 | +2.9% | 31.8r | 32.4 | +1.8% |
| Prince Edward Island | 33.8 | 34.1 | +0.9% | 23.3r | 22.9 | -1.5% |
| Nova Scotia | 33.4 | 32.5 | -2.6% | 23.3r | 22.5 | -3.2% |
| New Brunswick | 34.4 | 33.4 | -2.8% | 23.6r | 22.3 | -5.6% |
| Quebec | 30.1 | 28.8 | -4.4% | 18.2r | 16.7 | -8.4% |
| Ontario | 31.1 | 30.0 | -3.7% | 18.9r | 17.4 | -7.5% |
| Manitoba | 32.0r | 31.1 | -3.0% | 19.3r | 19.1 | -1.2% |
| Saskatchewan | 41.5r | 40.3 | -3.1% | 24.8r | 25.9 | +4.2% |
| Alberta | 44.8r | 44.3 | -1.2% | 24.5 | 28.4 | +15.8% |
| British Columbia | 32.9r | 32.3 | -2.0% | 20.3r | 19.7 | -2.8% |
| Yukon | 31.7r | 30.1 | -4.9% | 21.0r | 21.4 | +2.0% |
| Northwest Territories | 34.1r | 31.0 | -9.2% | 21.6r | 22.3 | +3.3% |
| Nunavut | 44.0r | 45.3 | +2.8% | 31.2r | 32.6 | +4.6% |
| Gender | ||||||
| Men | 34.4 | 33.3 | -3.1% | 20.9r | 20.3 | -3.0% |
| Women | 32.5 | 31.5 | -3.0% | 20.3r | 19.7 | -2.6% |
| Age category | ||||||
| 24 years old and under | 32.2 | 30.8 | -4.4% | 18.7r | 17.5 | -6.3% |
| 25 to 44 years old | 34.1 | 32.7 | -4.0% | 19.6r | 19.1 | -2.9% |
| 45 to 54 years old | 34.3 | 33.5 | -2.2% | 21.4r | 20.8 | -2.9% |
| 55 years old and over | 32.9 | 32.3 | -1.9% | 22.9r | 22.3 | -2.7% |
| EI claimant category* | ||||||
| Long-tenured workers | 40.2r | 39.0 | -3.0% | 20.0 | 21.0 | +4.8% |
| Occasional claimants | 31.9 | 30.6 | -3.9% | 20.1r | 18.9 | -5.7% |
| Frequent claimants | 30.2 | 29.7 | -1.8% | 23.1r | 21.9 | -5.1% |
| Canada | 33.7 | 32.6 | -3.2% | 20.7r | 20.1 | -2.9% |
- Note: Change in number of weeks is based on unrounded numbers. Includes all claims completed during the fiscal year for which at least $1 of EI regular benefits was paid.
- * See Annex 2.1 for definitions of claimant categories referenced in this table.
- p Preliminary data.
- r Revised data.
- Source: Employment and Social Development Canada, Employment Insurance (EI) administrative data. Data are based on a 10% sample of EI administrative data.
EI regular claims from the Mining and oil and gas extraction industry had, on average, the greatest maximum duration (43.2 weeks), followed by those from the Utilities industry (35.4 weeks). The higher maximum duration levels in these industries, relative to the national average (32.6 weeks), are partly attributed to a large proportion of claimants qualifying as long-tenured workers.
In terms of actual duration, completed claims for EI regular benefits by workers from the Mining and oil and gas extraction industry (27.0 weeks) had the highest average duration during the reporting fiscal year, followed by the Finance and insurance (24.2 weeks) industry (see Annex 2.6.2). As in past years, the Educational services industry (12.6 weeks) posted an actual average duration significantly lower than the overall average. This is due to its seasonal nature and the relatively short and well-defined "off-season" over the summer months.
Proportion of Employment Insurance regular benefit weeks used
As with duration of EI regular benefits, a few factors may influence the proportion of the entitlement used by claimants. For instance, greater maximum durations are generally associated with lower proportions of regular benefits' weeks used.
The average proportion of weeks of EI regular benefits used in FY1718—the average number of weeks of EI regular benefits received by claimants as a share of their maximum entitlement—went down by 0.7 percentage points from the previous fiscal year, to 63.6%. It was higher in the Territories and Atlantic Provinces – with more than 69% of entitlement used by claimants -- and lower in Ontario and Quebec, with a proportion around 61%. As Table 23 shows, the Northwest Territories, Alberta and Yukon experienced the largest increase in the proportion of EI regular weeks used compared with the previous reporting year.
By gender, women and men used almost a similar proportion of their regular benefit weeks in FY1718.
By age group, as in past years, claimants aged 55 years and older tended to use more of their regular benefit weeks than claimants aged 24 years or less. This is likely attributable to, on average, longer periods of unemployment and lower actual benefits duration for older claimants relative to younger claimants.
Also, claimants working while on claim may have a stronger labour market attachment and may also defer weeks of EI benefits. As a result, on average, claimants working while on claim use a lower proportion of their weeks of EI benefits (60.1% during the reporting fiscal year) when compared to claimants who did not work while on claim (67.4%).
| Proportion of weeks of Employment Insurance regular benefits used | |||||
|---|---|---|---|---|---|
| FY1314 | FY1415 | FY1516 | FY1617r | FY1718p | |
| Province or territory | |||||
| Newfoundland and Labrador | 69.1% | 70.8% | 69.1% | 76.7% | 75.7% |
| Prince Edward Island | 72.3% | 71.6% | 73.0% | 71.9% | 70.3% |
| Nova Scotia | 70.3% | 70.5% | 72.1% | 72.4% | 72.2% |
| New Brunswick | 66.0% | 68.0% | 69.4% | 71.0% | 69.5% |
| Quebec | 62.7% | 63.4% | 63.9% | 63.7% | 61.7% |
| Ontario | 62.7% | 62.5% | 61.8% | 62.6% | 60.4% |
| Manitoba | 60.8% | 60.2% | 61.8% | 62.6% | 63.4% |
| Saskatchewan | 57.6% | 58.5% | 54.0% | 63.2% | 66.0% |
| Alberta | 57.6% | 58.8% | 52.4% | 58.7% | 64.4% |
| British Columbia | 65.5% | 64.6% | 63.4% | 64.8% | 63.7% |
| Yukon | 56.6% | 66.2% | 66.7% | 71.7% | 75.1% |
| Northwest Territories | 62.5% | 58.5% | 73.8% | 65.2% | 75.2% |
| Nunavut | 66.3% | 76.1% | 68.6% | 71.2% | 73.2% |
| Gender | |||||
| Men | 63.1% | 63.9% | 63.4% | 64.5% | 63.6% |
| Women | 64.1% | 63.6% | 62.6% | 64.0% | 63.7% |
| Age | |||||
| 24 years old and under | 59.8% | 60.0% | 59.9% | 60.7% | 59.5% |
| 25 to 44 years old | 60.7% | 61.0% | 60.2% | 60.9% | 60.6% |
| 45 to 54 years old | 63.9% | 63.9% | 63.5% | 65.0% | 63.7% |
| 55 years old and over | 70.6% | 70.9% | 70.1% | 72.3% | 71.0% |
| EI claimant category | |||||
| Long-tenured workers | 54.2% | 52.9% | 50.0% | 51.7% | 52.9% |
| Occasional claimants | 62.6% | 63.0% | 63.5% | 64.9% | 63.8% |
| Frequent claimants | 74.4% | 75.5% | 76.2% | 78.1% | 76.0% |
| Working while on claim status | |||||
| Not working while on claim | 66.8% | 67.0% | 66.0% | 67.6% | 67.4% |
| Working while on claim | 60.3% | 60.7% | 60.4% | 61.1% | 60.1% |
| Canada | 63.5% | 63.8% | 63.1% | 64.3% | 63.6% |
- p Preliminary data.
- r Revised data.
- Source: Employment and Social Development Canada, Employment Insurance (EI) administrative data. Data are based on a 10% sample of EI administrative data.
Regions with high unemployment rates are also often characterized by weaker labour market conditions. This is partly attributable to the greater importance of seasonal employment in these regions. There is thus a larger share of frequent EI claimants in regions with high unemployment rates relative to EI regions with lower unemployment rates. As frequent claimants tend to use a greater proportion of their entitlement, the proportion of regular benefits entitlement used is the highest for EI claims established in regions with unemployment rates above 13.0% (see Table 24).
| Completed claims for regular benefits | Proportion of entitlement used | |||||
|---|---|---|---|---|---|---|
| Number in FY1617r | Number in FY1718p | Change (%) | Proportion in FY1617r | Proportion in FY1718p | Change (ppts) | |
| Weeks of EI regular entitlement | ||||||
| Between 14 and 19 weeks | 116,560 | 171,820 | +47.4% | 83.3% | 82.4% | -0.9 |
| Between 20 and 24 weeks | 222,210 | 238,600 | +7.4% | 76.5% | 73.4% | -3.1 |
| Between 25 and 29 weeks | 218,910 | 208,360 | -4.8% | 66.6% | 62.8% | -3.8 |
| Between 30 and 34 weeks | 168,500 | 175,850 | +4.4% | 62.9% | 60.5% | -2.4 |
| Between 35 and 39 weeks | 265,920 | 319,040 | +20.0% | 58.2% | 53.6% | -4.6 |
| Between 40 and 44 weeks | 215,400 | 149,870 | -30.4% | 59.4% | 57.8% | -1.6 |
| 45 weeks or more | 184,440 | 186,490 | +1.1% | 50.7% | 59.8% | +9.1 |
| Unemployment rate in the economic region at the time the claim was established | ||||||
| 6.0% or less | 195,270 | 269,800 | +38.2% | 64.9% | 58.4% | -6.5 |
| Between 6.1% and 8.0% | 640,170 | 706,260 | +10.3% | 63.0% | 62.9% | -0.1 |
| Between 8.1% and 10.0% | 297,200 | 204,430 | -31.2% | 63.1% | 65.7% | +2.7 |
| Between 10.1% and 13.0% | 103,550 | 96,620 | -6.7% | 62.7% | 64.3% | +1.6 |
| 13.1% or more | 155,750 | 172,920 | +11.0% | 72.1% | 72.1% | 0.0 |
| Canada | 1,391,940 | 1,450,030 | +4.2% | 64.3% | 63.6% | -0.7 |
- Note: Change in percentage change and in percentage points are based on unrounded numbers. Includes all completed claims for which at least $1 of regular benefits was paid.
- p Preliminary data.
- r Revised data.
- Source: Employment and Social Development Canada, Employment Insurance (EI) administrative data. Data are based on a 10% sample of EI administrative data.
2.2.6 Employment Insurance regular benefits and seasonal claimants
EI claimants who had at least three regular or fishing claims in the five years prior to the reference year, with at least two of these claims having started during the same period of the year as the current claim, are referred to as seasonal claimants.Footnote 45 By definition, seasonal claimants overlap with the frequent, occasional and long-tenured claimant categories.Footnote 46
The total number of seasonal claims in FY1718 was 410,500, up 0.5% from 408,400 in FY1617. Among these seasonal claims, 381,100 claims (92.8%) were seasonal regular claims and the remaining 29,400 (7.2%) were for EI fishing benefits. The analysis presented in the following subsections is focused on seasonal regular claims.Footnote 47
The share of seasonal regular claims among all regular claims was 29.3% in FY1718, representing a slight increase for the first time since FY1314 and is slightly above the 10-year average of 28.9% (see Chart 23).
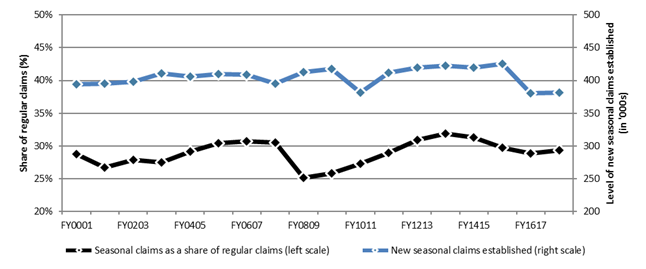
Chart 23 – Text version
| FY0001 | FY0102 | FY0203 | FY0304 | FY0405 | FY0506 | FY0607 | FY0708 | FY0809 | FY0910 | FY1011 | FY1112 | FY1213 | FY1314 | FY1415 | FY1516 | FY1617 | FY1718 | |
|---|---|---|---|---|---|---|---|---|---|---|---|---|---|---|---|---|---|---|
| New seasonal claims established (right scale) | 394.1 | 394.7 | 397.9 | 410.4 | 406.0 | 410.0 | 408.5 | 395.2 | 412.7 | 417.4 | 381.8 | 412.2 | 419.9 | 422.4 | 419.7 | 425.7 | 380.7 | 381.1 |
| Seasonal claims as a share of regular claims (left scale) | 28.7% | 26.7% | 27.9% | 27.5% | 29.1% | 30.4% | 30.7% | 30.5% | 25.1% | 25.8% | 27.3% | 29.0% | 30.9% | 31.9% | 31.3% | 29.7% | 28.8% | 29.3% |
- Note: Includes claims for which at least $1 of regular benefits was paid.
- *See Annex 2.1 for definitions of seasonal claims references in this chart.
- Source: Employment and Social Development Canada, Employment Insurance (EI) administrative data. Data are based on a 10% sample of EI administrative data.
Table 25 outlines the number of regular claims, the number of seasonal regular claims and the share of seasonal regular claims as a percentage of regular claims. This information is provided by province and territory, gender, age category and industry in FY1718. The table shows that the share of seasonal regular claims is highest in the Atlantic Provinces, specifically in Prince Edward Island and New Brunswick. The share is also relatively high in Quebec, whereas the Western Provinces and the Territories observe much lower shares of seasonal regular claims.
| Regular claims (number) | Seasonal regular claims (number) | Seasonal regular claims as a % of total regular claims | Seasonal regular claims as a % of total seasonal claims | |
|---|---|---|---|---|
| Province or territory | ||||
| Newfoundland and Labrador | 62,170 | 14,630 | 23.5% | 3.8% |
| Prince Edward Island | 16,430 | 8,340 | 50.8% | 2.2% |
| Nova Scotia | 63,880 | 25,340 | 39.7% | 6.6% |
| New Brunswick | 70,610 | 33,890 | 48.0% | 8.9% |
| Quebec | 399,080 | 157,360 | 39.4% | 41.3% |
| Ontario | 373,130 | 96,070 | 25.7% | 25.2% |
| Manitoba | 40,230 | 10,320 | 25.7% | 2.7% |
| Saskatchewan | 35,190 | 3,790 | 10.8% | 1.0% |
| Alberta | 112,400 | 7,690 | 6.8% | 2.0% |
| British Columbia | 122,410 | 22,960 | 18.8% | 6.0% |
| Territories | 4,180 | 720 | 17.2% | 0.2% |
| Gender | ||||
| Men | 788,880 | 235,580 | 29.9% | 61.8% |
| Women | 510,830 | 145,530 | 28.5% | 38.2% |
| Age category | ||||
| 24 years old and under | 118,750 | 7,930 | 6.7% | 2.1% |
| 25 to 44 years old | 571,930 | 144,000 | 25.2% | 37.8% |
| 45 to 54 years old | 289,420 | 98,730 | 34.1% | 25.9% |
| 55 years old and over | 319,610 | 130,450 | 40.8% | 34.2% |
| Industry | ||||
| Goods-producing industries | 502,080 | 165,890 | 33.0% | 43.5% |
| Services-producing industries | 764,150 | 208,910 | 27.3% | 54.8% |
| Unclassified | 33,480 | 6,310 | 18.8% | 1.7% |
| Canada | 1,299,710 | 381,110 | 29.3% | 100.0% |
- * Includes claims for which at least $1 of regular benefits was paid.
- **Seasonal regular claims are those claims, for which at least $1 of benefits was paid, by claimants who have had at least three regular or fishing claims in the last five years, two of which had to have started during the same period of year as the current claim. This period is defined as the 8 weeks before and 8 weeks after the current claim commenced, for a total window of 17 weeks.
- Source: Employment and Social Development Canada, Employment Insurance (EI) administrative data. Data are based on a 10% sample of EI administrative data.
The share of seasonal regular claims is similar for men and women. In terms of age groups, the largest share is observed for claimants aged 55 years and over, while the share of seasonal regular claims is particularly low for claimants aged 24 years or younger. Although a greater proportion of younger individuals work in seasonal jobs compared to other age groups, they are more likely to quit jobs to return to school – this is an invalid reason for separation under the Employment Insurance Act and they would not qualify to receive EI benefits (see subsection 2.2.2 for detailed discussion on EI coverage, eligibility and access).
Seasonal workers in the Labour Force Survey
Every month, Statistics Canada provides information on employment, unemployment and other key labour market indicators by a variety of demographic characteristics through the Labour Force Survey (LFS). The LFS defines seasonal workers as those whose employment is in an industry where employment levels rise and fall with the seasons. This is different from the definition used for EI claim purposes, which is not related to a claimant’s industry of employment, and instead is based on the claimant’s recent history of EI regular or fishing benefits use.
According to the LFS, there were 425,500 seasonal workers in FY1718*, a decrease of 3.3% from FY1617. Seasonal workers represented 2.7% of all employees and 19.9% of all temporary workers in FY1718, a slight change from the previous fiscal year.
Historically, men aged between 15 and 24 years are more likely to work in seasonal jobs, attributed to summer employment patterns for students. According to the LFS, men represented 64.2% of all seasonal employees in FY1718. Workers who were 15 to 24 years old represented 40.8% of all seasonal employees in FY1718.
- *Statistics Canada, Labour Force Survey, Table 14-10-0071-01.
In terms of industry sectors, the share of seasonal regular claims is higher in goods-producing industries than in the services-producing industries. As outlined in Table 25, the higher frequency of seasonal claimants in the Atlantic provinces may be attributed to the composition of its industries, which contains a larger share of goods-producing industries, leading to a much higher proportion of seasonal employment in this sector relative to the rest of the country.
Table 26 outlines the distribution of EI seasonal regular claims by quarter during FY1718. Nearly half (47.4%) of all seasonal regular claims were established in the third quarter (October to December) of the fiscal year. This is attributable to the slowdown in many seasonal industries during that quarter. There are some notable differences across industries and gender. For example, claims established by women and workers in the service-producing industries are more likely to be established in the second quarter (July to September) of the fiscal year (48.1% and 37.8% respectively), compared to seasonal regular claims established by men and workers in the goods-producing industries which are more concentrated in the third quarter of the fiscal year (60.5% and 63.2% respectively). This is likely due to the summer “off-season” in the Educational services industry, reflecting school closures during that period of the year.
| Total seasonal regular claims | Distribution of seasonal regular claims by quarter (%) | ||||
|---|---|---|---|---|---|
| Q1 (April to June) | Q2 (July to September) | Q3 (October to December) | Q4 (January to March) | ||
| Region | |||||
| Atlantic provinces | 82,200 | 16.2% | 19.3% | 47.9% | 16.5% |
| Quebec | 157,360 | 13.2% | 20.8% | 54.1% | 11.9% |
| Ontario | 96,070 | 9.0% | 37.2% | 39.4% | 14.4% |
| Western provinces | 44,760 | 11.0% | 37.1% | 40.4% | 11.4% |
| Territories | 720 | 8.3% | 20.8% | 55.6% | 15.3% |
| Gender | |||||
| Men | 235,580 | 9.3% | 13.2% | 60.5% | 17.0% |
| Women | 145,530 | 17.7% | 48.1% | 26.3% | 7.8% |
| Industry | |||||
| Goods-producing industries | 165,890 | 6.9% | 12.7% | 63.2% | 17.3% |
| Services-producing industries | 208,910 | 17.2% | 37.8% | 34.7% | 10.3% |
| Unclassified | 6,310 | 7.4% | 17.4% | 55.6% | 19.5% |
| Canada | 381,110 | 12.5% | 26.6% | 47.4% | 13.5% |
- Notes: Totals may not add up to the total due to rounding. Includes claims for which at least $1 of EI regular benefits was paid.
- *See Annex 2.1 for definitions of seasonal claims referenced in this table.
- Source: Employment and Social Development Canada, Employment Insurance (EI) administrative data. Data are based on a 10% sample of EI administrative data.
Duration of Employment Insurance regular benefits among seasonal claimants
The average maximum durationFootnote 48 of seasonal regular claims completedFootnote 49 in FY1718 was 29.9 weeks, decreasing slightly from 30.7 weeks in FY1617. The average maximum duration of completed non-seasonal regular claims was 33.7 weeks in FY1718, down from 34.9 weeks in FY1617.
The average actual durationFootnote 50 of EI regular benefits for seasonal claims completed in FY1718 was 17.7 weeks, down from the average duration of 18.9 in FY1617. For non-seasonal regular claimants, the average actual duration was 21.1 weeks for claims completed in FY1718, down slightly from 21.4 weeks in FY1617. The average maximum duration and the average actual duration of regular benefits are generally shorter for seasonal regular claimants than for non-seasonal regular claimants, reflecting the fact that seasonal claimants typically accumulate fewer hours of insurable employment prior to establishing a claim than non-seasonal claimants.
Overlapping definitions of seasonal and frequent claimants: internal analysis
Frequent EI claimants are those who have had three or more regular or fishing claims and have collected benefits for more than 60 weeks in total within the past five years. On the other hand, seasonal claimants are those who had three or more regular or fishing claims in the five fiscal years preceding the reference year, of which at least two of these claims were established at the same time of year as their claim in the reference year. By definition, there is significant overlap between frequent and seasonal claimants.
Frequent and seasonal claimants differ on two criteria: (1) frequent claimants must have received more than 60 weeks of EI regular or fishing benefits, while seasonal claimants do not need to have received EI benefits for a specific number of weeks; and (2) the timing of establishing claims determines a claimant’s status as seasonal, while this is not the case for defining frequent claimants.
As outlined in Table 27, a greater number of EI regular claimants qualify as seasonal claimants compared to frequent claimants (381,100 seasonal claims compared to 290,100 frequent claims in FY1718). This suggests that many seasonal regular claimants collect less than 60 weeks of regular benefits over the course of five fiscal years, while a large proportion of frequent claimants can also be considered seasonal (see Chart 24).
| Type of claim | FY1011 | FY1112 | FY1213 | FY1314 | FY1415 | FY1516 | FY1617 | FY1718 |
|---|---|---|---|---|---|---|---|---|
| Frequent | 309,230 | 321,040 | 319,580 | 309,780 | 304,700 | 307,790 | 285,690 | 290,070 |
| Seasonal | 381,810 | 412,230 | 419,930 | 422,410 | 419,720 | 425,690 | 380,680 | 381,110 |
- *See Annex 2.1 for definitions of frequent and seasonal claims referenced in this table.
- Source: Source: Employment and Social Development Canada, Employment Insurance (EI) administrative data. Data are based on a 10% sample of EI administrative data.
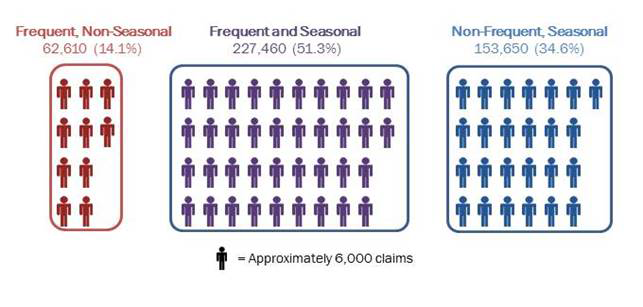
Chart 24 – Text version
| Frequent, non-seasonal | Frequent and seasonal | Non-frequent, seasonal | |
|---|---|---|---|
| Level of claims | 62,610 | 227,460 | 153,650 |
| Share of total frequent and seasonal claims | 14.1% | 51.3% | 34.6% |
- *See Annex 2.1 for definitions of frequent and seasonal claims referenced in this chart.
- Source: Employment and Social Development Canada, Employment Insurance (EI) administrative data. Data are based on a 10% sample of EI administrative data
Table 28 shows the comparison among EI regular claims completed in FY1718 among frequent seasonal, frequent non-seasonal and non-frequent seasonal claimants. The average duration and proportion of regular benefits paid for frequent non-seasonal and frequent seasonal claimants is generally similar. However, between the two non-overlapping populations (frequent non-seasonal and non-frequent seasonal), it can be seen that frequent non-seasonal claimants have a much longer average duration and are more likely to exhaust their regular entitlement compared to non-frequent seasonal claimants.
| Average duration of EI regular benefits (in weeks)p | Proportion of regular benefits paidp | Exhaustion ratep | |
|---|---|---|---|
| Frequent non-seasonal claims | 23.6 | 76.4% | 45.3% |
| Frequent and seasonal claims | 21.5 | 75.9% | 36.8% |
| Non-frequent seasonal claims | 11.8 | 41.1% | 9.4% |
- Note: Completed claims include those that are terminated and those that are dormant and remained inactive as of August the following fiscal year.
- *See Annex 2.1 for definitions of frequent and seasonal claims referenced in this table.
- p Preliminary data.
- Source: Employment and Social Development Canada, Employment Insurance (EI) administrative data. Data are based on a 10% sample of EI administrative data.
2.2.7 Exhaustion of Employment Insurance regular benefits
Claimants have exhausted their entitlement to Employment Insurance regular benefits when the number of weeks of benefits received (actual duration) equals the entitlement available over the course of the benefit period. The incidence of exhaustion of regular benefit entitlement can inform analysis related to the adequacy of EI regular benefits provided to those looking for suitable employment following a job separation. Since a claim must be completedFootnote 51 to determine whether the entitlement is exhausted or non-exhausted, the analysis in this section focuses on regular claims completed during FY1718, regardless of the claim’s establishment date.
Entitlement exhaustion of Employment Insurance regular benefits
Of the regular claims completed during FY1718, 33.7% ended when their entitlement was exhausted. As shown in Chart 25, the volume of regular claims with exhausted entitlement has increased slightly between FY1617 and FY1718. This follows a decline in FY1516, which was attributed to the measure that extended EI regular benefits in the 15 EI economic regions affected by the downturn in commodity prices. The measure provided additional weeks of benefits to many EI regular claimants in these regions and extended their benefit period. This has prolonged claims in FY1617, and in some cases, FY1718, whereas they would have otherwise exhausted in FY1516. This shift of benefit periods corresponds to the increase in exhaustion rate observed in FY1617 and the slight decrease in FY1718, bringing the exhaustion rate back to the level observed before the downturn.
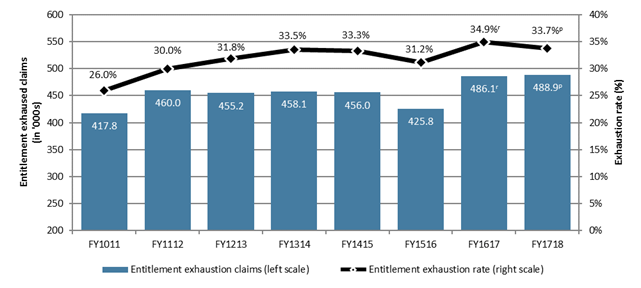
Chart 25 – Text version
| FY1011 | FY1112 | FY1213 | FY1314 | FY1415 | FY1516 | FY1617 | FY1718 | |
|---|---|---|---|---|---|---|---|---|
| Entitlement exhaustion claims (in thousands) (left scale) | 417.8 | 460.0 | 455.2 | 458.1 | 456.0 | 425.8 | 486.1 | 488.9 |
| Entitlement exhaustion rate (right scale) | 26.0% | 30.0% | 31.8% | 33.5% | 33.3% | 31.2% | 34.9% | 33.7% |
- Note: Includes completed claims for which at least $1 of regular benefits was paid.
- rRevised data.
- pPreliminary data.
- Source: Employment and Social Development Canada, Employment Insurance (EI) administrative data. Data are based on a 10% sample of EI administrative data.
At the provincial and territorial level, the most notable increases in exhaustion rates were in Manitoba, Alberta, Yukon and Northwest Territories, while there were significant decreases in Newfoundland and Labrador, Prince Edward Island, Ontario and Nunavut. By gender, claims established by women typically have a higher entitlement exhaustion rate than those established by men. This is due, in part, because on average, women qualify for fewer weeks of EI regular benefit entitlement. For claimants under 55 years old, entitlement exhaustion rates are comparable. Claimants aged 55 years old and over had a higher exhaustion rate.
| Entitlement exhaustion rate | |||
|---|---|---|---|
| FY1617r | FY1718p | Change (ppts) | |
| Province or territory | |||
| Newfoundland and Labrador | 47.3% | 44.8% | -2.5 |
| Prince Edward Island | 37.0% | 34.3% | -2.7 |
| Nova Scotia | 40.9% | 40.7% | -0.2 |
| New Brunswick | 36.4% | 34.6% | -1.8 |
| Quebec | 32.6% | 31.1% | -1.5 |
| Ontario | 33.9% | 31.6% | -2.3 |
| Manitoba | 33.6% | 34.6% | +1.1 |
| Saskatchewan | 38.1% | 37.4% | -0.6 |
| Alberta | 33.4% | 35.8% | +2.4 |
| British Columbia | 37.0% | 35.3% | -1.7 |
| Yukon | 46.2% | 47.3% | +1.1 |
| Northwest Territories | 37.3% | 50.6% | +13.3 |
| Nunavut | 46.6% | 42.9% | -3.7 |
| Gender | |||
| Men | 33.8% | 32.7% | -1.0 |
| Women | 36.9% | 35.3% | -1.6 |
| Age category | |||
| 24 years old and under | 32.8% | 32.9% | 0.0 |
| 25 to 44 years old | 31.3% | 30.8% | -0.4 |
| 45 to 54 years old | 34.7% | 32.3% | -2.4 |
| 55 years old and over | 43.5% | 40.8% | -2.6 |
| EI claimant category* | |||
| Long-tenured workers | 24.2% | 25.5% | +1.2 |
| Occasional claimants | 37.1% | 35.8% | -1.3 |
| Frequent claimants | 42.2% | 38.4% | -3.9 |
| Canada | 34.9% | 33.7% | -1.2 |
- Note: Change in percentage points is based on unrounded numbers. Includes all completed claims for which at least $1 of regular benefits was paid.
- *See Annex 2.1 for definitions of claimant categories referenced in this table.
- r Revised data.
- p Preliminary data.
- Source: Employment and Social Development Canada, Employment Insurance (EI) administrative data. Data are based on a 10% sample of EI administrative data.
Benefit period exhaustion vs entitlement exhaustion
In addition to entitlement exhaustion, claims may also end because their benefit period – the period during which an EI claimant can receive EI benefitsFootnote 52 – ends before all potential regular benefit weeks of entitlement have been paid. When this occurs, unless the claimant has stopped filing EI biweekly reportsFootnote 53, the claim is considered to have exhausted its benefit period. These claims represented 18.1% of all completed regular claims in FY1718.
The circumstances that result in benefit period exhaustion are generally different than those associated with entitlement exhaustion. There are many variables that affect the duration of an EI claim, which will influence benefit period exhaustion. These include regular benefit entitlement, weeks worked while on claim (leading to deferred benefit weeks) and the use of special benefits (adding another type of entitlement to the claim).
For instance, a much greater proportion of claims that exhausted the benefit period were associated with at least one week worked while on claim (72.3% in FY1718) compared with claims that ended in entitlement exhaustion (35.5%) (see Table 30). Claims that exhausted the benefit period through Working While on Claim had, on average, a greater number of weeks worked while on claim (16.5 weeks in FY1718) compared to claims that exhausted their entitlement (12.1 weeks in FY1718). Claimants who exhaust their benefit period are thus more likely to accumulate enough hours of insurable employment during their benefit period to meet the eligibility requirements to establish a new claim following the end of their claim. As a result, a much greater proportion of claimants who exhausted their benefit period requalified for a new claim within four weeks following the termination of their claim (69.0% in FY1718 compared to 11.1% for claims that exhausted their entitlement).
| Entitlement exhausted claims | Benefit period exhausted claims | |||
|---|---|---|---|---|
| FY1617r | FY1718p | FY1617r | FY1718p | |
| Exhaustion rate | 34.9% | 33.7% | 17.8% | 18.1% |
| Exhaustion rate by seasonality status | ||||
| Seasonal claim | 30.4% | 25.9% | 29.0% | 28.3% |
| Non-seasonal claim | 36.7% | 37.0% | 13.2% | 13.9% |
| Exhaustion rate by local unemployment rate at the time the claim was established | ||||
| 6.0% or less | 36.6% | 31.4% | 14.5% | 11.4% |
| 6.1% to 8.0% | 34.6% | 33.3% | 15.0% | 18.6% |
| 8.1% to 10.0% | 34.2% | 35.9% | 19.6% | 18.2% |
| 10.1% to 13.0% | 31.4% | 34.5% | 18.2% | 14.9% |
| 13.1% or above | 37.9% | 36.0% | 29.2% | 28.6% |
| Proportion of claims involving at least one week worked while on claim | 37.5% | 35.5% | 70.8% | 72.3% |
| Requalification rate for EI benefits* | 13.8% | 11.1% | 70.0% | 69.0% |
| Average weeks worked while on claim** | 11.4 | 12.1 | 17.1 | 16.5 |
| Average weeks of regular benefits paid | 28.9 | 28.8 | 19.6 | 19.3 |
| Share of mixed claims (collected special benefits) | 9.9% | 10.6% | 17.9% | 18.4% |
| Average proportion of regular entitlement used | 100.0% | 100.0% | 58.1% | 56.7% |
- Note: Includes all completed claims for which at least $1 of regular benefits was paid.
- r Revised data.
- p Preliminary data.
- *Requalification rate refers to the proportion of claimants who are able to requalify for a new claim within four weeks following the termination of their claim.
- **Includes only claims with at least one week worked while on claim.
- Source: Employment and Social Development Canada, Employment Insurance (EI) administrative data. Data are based on a 10% sample of EI administrative data.
Exhaustion type is also reflective of the characteristics of a beneficiaries’ claim. A greater share of claims that have exhausted their benefit period had an interaction with special benefits (18.4%) compared with claims that exhausted their entitlement (10.6%). Claims that exhausted the benefit period were also paid fewer weeks of EI regular benefits (19.3 weeks) compared to claims that exhausted their entitlement (28.8 weeks).
Entitlement exhaustion of Employment Insurance regular benefits: seasonal and non-seasonal gappers
Historically, entitlement exhaustion rates are lower for seasonal claimsFootnote 54 (25.9%) than non-seasonal claims (37.0%) (see Table 30). This is attributable to the fact that many seasonal employees are laid off temporarily and are likely to find work in the same industry and possibly with the same employer the following season. Furthermore, when a non-seasonal worker is laid off for reasons related to the deterioration of local labour market conditions, it can result in longer periods on EI and a more difficult job search.
Claimants who have exhausted their entitlement weeks may go through a period without income from either employment or EI benefits. While this is especially common for seasonal claimants, it can affect non-seasonal claimants as well. These claimants, known as “gappers”, have not accumulated sufficient hours of insurable employment during their qualifying period for their entitlement to cover the entire duration of their unemployment spell.
This year, the Monitoring and Assessment Report has adopted a new method to identify gappers (see methodological note for more details). Of the 1.3 million regular claims in FY1718, approximately 74,800 (5.8%) experienced a gap in income; 33,000 seasonal claimants and 41,800 non-seasonal claimants (see Table 31). Of the 74,800 gappers, the average length of their gap was 5.0 weeks.
| Claimant type | FY1617 | FY1718 | Change (%) |
|---|---|---|---|
| Seasonal | 30,720 (45.6%) |
33,020 (44.1%) |
+7.5% |
| Non-seasonal | 36,580 (54.4%) |
41,820 (55.9%) |
+14.3% |
| Total | 67,300 (100.0%) |
74,840 (100.0%) |
+11.2% |
- Notes: Includes claims for which at least $1 of regular benefits was paid.
- Source: Employment and Social Development Canada, Employment Insurance (EI) administrative data. Data are based on a 10% sample of EI administrative data.
The regional distribution of these gappers is presented in Chart 26. Prince Edward Island (9.2%), Nova Scotia (8.5%), New Brunswick (8.1%), Quebec (6.3%) and the Territories (11.5%) were overrepresented among gappers compared to the overall national share of gappers (5.2%). This is mostly attributable to the composition of the labour market in the Atlantic provinces and Quebec (representing 54.9% of all regular gappers).
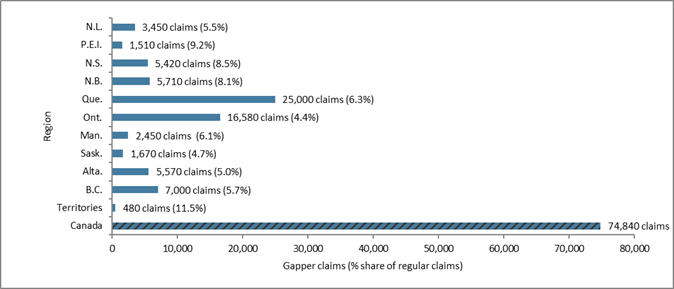
Chart 26 – Text version
| Gapper claims | Share of all regular claims | |
|---|---|---|
| Newfoundland and Labrador | 3,450 | 5.5% |
| Prince Edward Island | 1,510 | 9.2% |
| Nova Scotia | 5,420 | 8.5% |
| New Brunswick | 5,710 | 8.1% |
| Quebec | 25,000 | 6.3% |
| Ontario | 16,580 | 4.4% |
| Manitoba | 2,450 | 6.1% |
| Saskatchewan | 1,670 | 4.7% |
| Alberta | 5,570 | 5.0% |
| British Columbia | 7,000 | 5.7% |
| Territories | 480 | 11.5% |
| Canada | 74,840 | 5.8% |
- Note: Includes claims for which at least $1 of EI regular benefits was paid.
- Source: ESDC, Employment Insurance (EI) administrative data. Data are based on a 10% sample of EI administrative data.
Methodological note:
In previous EI Monitoring and Assessment Reports, seasonal gappers were defined differently. The seasonal gapper definition considered seasonal claimants with a regular benefit claim established during the reporting fiscal year that had exhausted their entitlement, had a combined work and EI benefit period fewer than 52 weeks and did not requalify for a new claim within four weeks following the end of their claim. The number of seasonal gappers identified through this methodology in previous Monitoring and Assessment Reports had declined consistently since FY1415 and was at 9,300 claims in FY1617. Continuing to use this methodology in FY1718 would have yielded approximately 8,600 seasonal gappers.
Starting with the FY1718 EI Monitoring and Assessment Report, the definition of gappers has broadened to better represent the levels of EI claimants experiencing periods with no income. To be considered a gapper, a claimant must have established a regular claim during the reporting fiscal year, have completed their previous regular benefit claim during the reporting fiscal year or the previous fiscal year and must have experienced a period without employment income or EI income immediately following the exhaustion of the preceding claim. The period with no income must be 15 weeks or less. Gappers can be either seasonal or non-seasonal claimants.
Note:
Additional Employment Insurance regular benefits for workers in seasonal employment
A new pilot project was implemented starting on August 5, 2018, which provides up to five additional weeks of Employment Insurance (EI) regular benefits to eligible claimants in 13 targeted EI economic regions.
The additional five weeks of regular benefits are available to claimants in one of the 13 targeted economic regions who start a claim between August 5, 2018 and May 30, 2020 if they meet the following criteria:
- In the previous five years, the claimant must have had at least three EI claims in which they received regular or fishing benefits; and
- At least two of those EI claims started around the same time of year.*
While these extended benefits were not implemented during the current reporting period, this measure will affect the maximum and average durations of seasonal regular claims established during FY1819.
- * Around the same time of year is defined as the eight weeks preceding and following the week in which the current claim starts.
2.2.8 Working While on Claim
The Employment Insurance Act’s Working While on Claim (WWC) provision is intended to help claimants stay connected with the labour market by encouraging them to accept available work while receiving EI benefits and to earn additional income while on claim. Under the WWC provisions, claimants who report employment income while on claim have their benefits reduced according to the prevailing legislation or pilot project. Under these, claimants have their benefits reduced dollar-for-dollar when they earn income above the respective earnings thresholds. If the benefit is reduced to zero, the week of entitlement is deferred for later use within the claim’s benefit period.Footnote 55 During the reporting period (FY1718), the WWC provision applied to regular, fishing, parental, compassionate care and parents of critically ill children benefits, as well as the new caregiver benefits.Footnote 56
During the reporting fiscal year, the effective WWC provision was associated with Pilot Project 20 (August 7, 2016 to August 11, 2018). Under this provision (also known as the ‟50 cent rule″), a claimant was able to keep 50 cents of EI benefits for every dollar earned while on claim, up to a maximum of 90% of the average weekly insurable earnings used to establish his or her weekly benefit rate, before benefits were reduced dollar-for-dollar.
While the present section focuses on claims and claimants that could be identified as earning employment income arising out of part-time or full-time work while on claim, it is worth noting that the WWC provision is also applicable to a broader range of earnings, such as pensions or severance pay.
Changes to the Working While on Claim provision
As of August 12, 2018, the “default earnings rule” of the WWC Pilot Project 20 was made a permanent part of the EI program. Under this rule, eligible EI claimants are allowed to keep 50 cents of their EI benefits for every dollar earned from Working While on Claim, up to a maximum of 90% of their previous weekly insurable earnings. Any earning above this threshold results in a dollar-for-dollar reduction of their EI benefits. These WWC rules began to apply to EI sickness and maternity benefits as of August 12, 2018.
Eligible EI claimants have the option to voluntarily revert to a temporary alternate earnings rule*, which allows them to earn the greater of $75 or 40 percent of their weekly benefit without any deduction in their EI benefits, after which EI benefits are reduced dollar-for-dollar. This alternate earnings rule is operational for a three-year transitional period until August 14, 2021. Claimants are eligible for this option of reverting to the transitional provisions if they had previously elected under Pilot Project 20 for any benefit period falling between August 7, 2016 and August 11, 2018, regardless of the EI benefit type.
* This temporary alternate earnings rule is the “optional rule” of the previous WWC Pilot Project 20.
Number of Employment Insurance regular claims and claimants Working While on ClaimFootnote 57
Among all EI regular benefit claimants with an active claimFootnote 58, 795,100 claimants (43.9%) worked at least one week while on claimFootnote 59 during the reporting period (see Table 32). This proportion is lower relative to the one associated with completed claims in the reporting fiscal year with at least one week worked while on claim (50.9%). This divergence is attributable to differences in the two measures.
| Region | Claimants with an active claim during the fiscal year who have worked at least one week while on claim during the fiscal year | Completed claims with at least one week worked while on claim over the claim’s life | ||||||
|---|---|---|---|---|---|---|---|---|
| Number FY1617 |
Share FY1617 | Number FY1718 |
Share FY1718 |
Number FY1617 |
Sharer FY1617 | Numberp FY1718 |
Sharep FY1718 |
|
| Province or territory | ||||||||
| Newfoundland and Labrador | 47,040 | 54.5% | 46,680 | 53.0% | 34,480r | 60.2% | 39,550 | 60.9% |
| Prince Edward Island | 9,690 | 47.8% | 9,570 | 47.9% | 9,020r | 53.2% | 9,240 | 53.0% |
| Nova Scotia | 38,460 | 48.2% | 39,490 | 48.9% | 34,120r | 54.7% | 36,650 | 54.9% |
| New Brunswick | 48,180 | 54.8% | 47,850 | 55.0% | 44,660r | 60.6% | 45,650 | 60.1% |
| Quebec | 271,580 | 51.1% | 266,850 | 51.6% | 245,130r | 58.0% | 252,640 | 56.9% |
| Ontario | 185,460 | 35.9% | 187,610 | 37.0% | 163,780r | 43.1% | 175,940 | 43.3% |
| Manitoba | 20,030 | 36.1% | 19,800 | 36.2% | 17,920r | 44.3% | 18,630 | 44.8% |
| Saskatchewan | 20,400 | 35.2% | 21,740 | 37.8% | 15,180r | 44.0% | 18,130 | 46.9% |
| Alberta | 91,160 | 36.5% | 78,770 | 36.9% | 72,540r | 44.6% | 72,650 | 48.1% |
| British Columbia | 77,940 | 40.5% | 74,820 | 41.5% | 65,710r | 47.9% | 67,130 | 48.4% |
| Territories | 2,100 | 33.8% | 1,890 | 30.6% | 1,760 | 41.3% | 1,710 | 38.5% |
| Gender | ||||||||
| Men | 499,210 | 42.1% | 471,140 | 42.5% | 433,580r | 49.5% | 439,740 | 49.3% |
| Women | 317,830 | 44.6% | 323,930 | 46.0% | 270,720r | 52.5% | 298,180 | 53.3% |
| Age category | ||||||||
| 24 years old and under | 77,420 | 41.3% | 71,560 | 42.0% | 72,600r | 51.4% | 70,270 | 51.2% |
| 25 to 44 years old | 384,430 | 45.3% | 372,420 | 46.4% | 334,080r | 53.5% | 346,840 | 54.1% |
| 45 to 54 years old | 211,150 | 49.4% | 204,420 | 50.7% | 182,110r | 57.6% | 193,210 | 58.9% |
| 55 years old and over | 144,040 | 33.3% | 146,670 | 33.6% | 115,510r | 37.2% | 127,600 | 37.1% |
| Seasonality | ||||||||
| Seasonal* | 264,400 | 57.6% | 254,520 | 57.9% | 236,470r | 59.1% | 250,580 | 58.6% |
| Non-seasonal | 552,640 | 38.4% | 540,550 | 39.4% | 467,830r | 47.2% | 487,340 | 47.7% |
| Canada | 817,040 | 43.1% | 795,070 | 43.9% | 704,300r | 50.6% | 737,920 | 50.9% |
- Note: Includes all claimants (or claims) to which at least $1 of regular benefits was paid.
- * See Annex 2.1 for definitions of seasonal claims referenced in this table.
- p Preliminary.
- r Revised.
- Source: Employment and Social Development Canada, Employment Insurance (EI) administrative data. Data are based on a 10% sample of EI administrative data.
The proportion of regular benefit claimants with at least one week worked while on claim varies by gender, age and across regions and industries. As in the previous year, greater shares of EI regular benefit claimants WWC correlates with regions—Atlantic Provinces (52.1%) and Quebec (51.6%)—and with industries—Educational services (58.9%) and Construction (49.6%)—that have a higher proportion of seasonal claimants. This is possibly due to the greater re-employment opportunities should the benefit period of the claimants exceed the length of the “off-season”.
Weeks worked while on claim
This section analyzes the WWC provision from the perspective of total regular weeks worked while on claim. It examines whether or not employment income was reported during a week in which a claimant was entitled to receive EI regular benefits during the fiscal year, regardless of when the claim was established.
The share of weeks worked while on an EI regular claim increased slightly for the second year after four consecutive years of decline (see Chart 27). The average number of weeks worked on claim also increased slightly, from 11.2 weeks in FY1617 to 11.4 weeks during the reporting fiscal year.
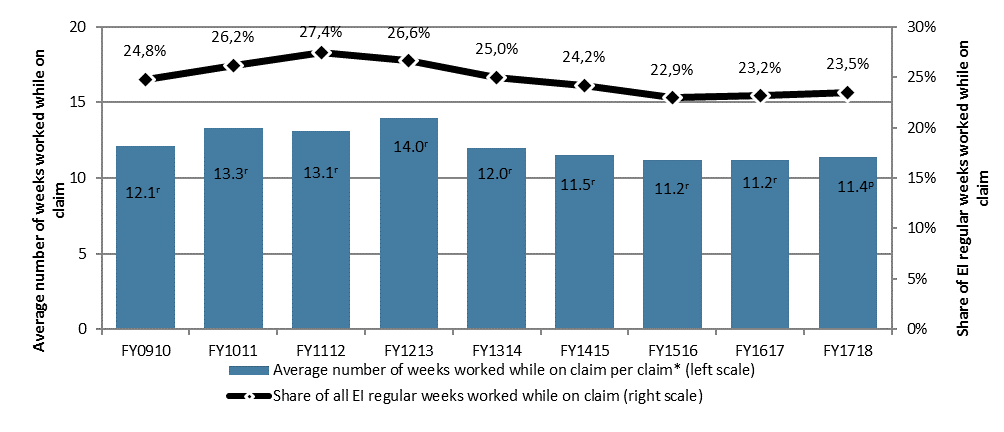
Chart 27 – Text version
| FY0910 | FY1011 | FY1112 | FY1213 | FY1314 | FY1415 | FY1516 | FY1617 | FY1718 | |
|---|---|---|---|---|---|---|---|---|---|
| Average number of weeks worked while on claim per claim (left scale) | 12.1r | 13.3r | 13.1r | 14.0r | 12.0r | 11.5r | 11.2r | 11.2r | 11.4p |
| Share of all regular weeks worked while on claim (right scale) | 24.8% | 26.2% | 27.4% | 26.6% | 25.0% | 24.2% | 22.9% | 23.2% | 23.5% |
- Note: Includes all claims for which at least $1 of regular benefits was paid.
- * Based on claims completed during the fiscal year.
- R Revised
- P Preliminary estimates
- Sources: ESDC, Employment Insurance (EI) administrative data. ESDC data are based on a 10% sample of EI administrative data.
An analysis by demographic characteristics shows that the share of and the average number of weeks worked while on an EI regular claim varied in a way similar to the number of claims with at least one week while on claim. Seasonal claimants, women, claimants between 45 years old and 54 years old and those living in Atlantic Canada or Quebec had above-average shares of EI regular weeks worked while on EI regular claim and also higher average numbers of weeks worked while on claim (see Tables 32 and 33).
Overall, adjustments to WWC pilot projects over the years since 2005, combined with shifting economic conditions, contributed to the changing patterns in weeks worked while on claim. A 2018 evaluation of WWC confirmed this observation.
| FY1314 | FY1415 | FY1516 | FY1617 | FY1718 | |
|---|---|---|---|---|---|
| Province or territory | |||||
| Newfoundland and Labrador | 28.2% | 27.0% | 25.8% | 27.4% | 25.9% |
| Prince Edward Island | 27.9% | 25.9% | 25.1% | 26.0% | 25.2% |
| Nova Scotia | 29.4% | 27.8% | 26.7% | 26.7% | 26.6% |
| New Brunswick | 33.3% | 32.4% | 31.2% | 31.7% | 32.9% |
| Quebec | 32.2% | 31.2% | 31.2% | 32.5% | 32.7% |
| Ontario | 18.0% | 17.7% | 17.1% | 17.1% | 16.7% |
| Manitoba | 14.1% | 12.7% | 12.1% | 12.4% | 12.8% |
| Saskatchewan | 13.5% | 12.9% | 12.6% | 13.3% | 13.5% |
| Alberta | 13.8% | 11.8% | 10.7% | 13.5% | 14.5% |
| British Columbia | 20.5% | 19.9% | 18.7% | 19.4% | 19.6% |
| Territories | 11.1% | 11.1% | 12.5% | 11.4% | 10.5% |
| Gender | |||||
| Men | 23.7% | 23.1% | 21.5% | 22.0% | 22.5% |
| Women | 27.0% | 26.1% | 25.6% | 25.4% | 25.3% |
| Age category | |||||
| 24 years old and under | 22.9% | 22.7% | 21.1% | 21.4% | 22.4% |
| 25 to 44 years old | 25.6% | 25.0% | 23.7% | 24.3% | 24.9% |
| 45 to 54 years old | 30.6% | 29.5% | 28.2% | 28.3% | 28.9% |
| 55 years old and over | 18.4% | 17.7% | 16.9% | 17.0% | 17.1% |
| Seasonality | |||||
| Seasonal** | 32.9% | 32.1% | 31.1% | 31.7% | 31.3% |
| Non-seasonal | 21.3% | 20.5% | 19.4% | 19.8% | 20.5% |
| Canada | 25.0% | 24.2% | 22.9% | 23.2% | 23.5% |
- Note: Includes all claims for which at least $1 of regular benefits was paid.
- * Data are based on the weeks worked while on claim during the specified period, regardless of when the claim was established.
- ** See Annex 2.1 for definitions of seasonal claims referenced in this table.
- Source: Employment and Social Development Canada, Employment Insurance (EI) administrative data. Data are based on a 10% sample of EI administrative data.
The evaluation found that Pilot Project 19, which had the same default 50 cent rule as Pilot Project 20 (that was in effect during the reporting fiscal year), was more effective at encouraging claimants not eligible to revert (97% of claimants) to work more while on claim. Indeed, the introduction of the 50 cent rule increased the probability of working while on claim by about 27% and the number of weeks worked by about 1 week for claimants not eligible to revert. With earnings below 80% of the EI benefit rate, the evaluation also found that claimants were encouraged to work more even if they received fewer EI benefits for this work effort compared to what they would have received under the previous pilots. The evaluation indicates that the largest increase was observed for work with earnings above 80% of the EI benefit rate, the level above which claimants received more EI benefits compared to the previous pilots. Among those claimants eligible to revert, work at practically all level of earnings declined; most of the reduction was observed for work with earnings below 40% of the EI benefit rate.
Pilots with an earnings threshold of $75 or 40% of their weekly EI benefit rate (Pilot Projects 8, 12 and 17) had mixed results compared with Pilots 18 and 19 using parameters identical to those in the Pilot 20 (50 cent rule). Empirical evidence suggests that claimants responded to the incentive created by the pilots, since they worked more with earnings up to 40% of the EI benefit rate; and in regions where Pilot 8 was not implemented, the incentive of Pilots 12 and 17 encouraged claimants to work more with earnings between 40% and 125% of the EI benefit rate (working with partial benefits). However, claimants were less likely to take work that would raise them above the threshold where their benefits were reduced to zero. As a result, Pilots 8, 12 and 17 did not increase the total incidence and duration of work while on claim. They also did not have a clear effect on EI usage.
All these results suggest that the provisions of the most recent pilots with the 50 cent rule (18, 19 and 20) have likely smoothed the distribution of hours worked by EI claimants relative to the provisions of previous pilot projects or the legislation, and increased work intensity. Indeed, with their implementation, there has been a shift, the percentage of claims with earnings greater than 40% of their weekly benefit rate increased, from between 81% to 84% under Pilot Projects 12 and 17 to 91% under Pilots Projects 18, 19 and 20.
The increase in work intensity since the implementation of WWC Pilot Project 18 is also reflected in the average weekly income—weekly EI regular benefits plus employment earnings—of EI regular benefits claimants WWC. Table 34 shows that the difference between the average weekly income of claimants WWC and those not WWC is higher since Pilot Project 18 came into force in August 2012. This increase is primarily attributable to higher real average weekly employment earnings during weeks worked while on claim under the provisions of Pilot Projects 18, 19 and 20 ($582 during the reporting period)Footnote 60. Table 34 also shows that, while claimants working while on claim had, over the course of the entire claim, a higher average total weekly income than those who did not work while on claim, they received on average less EI benefits ($246 per week compared to $326 for those not working while on claim).Footnote 61
| FY1112 | FY1213 | FY1314 | FY1415 | FY1516 | FY1617 | FY1718 | |
|---|---|---|---|---|---|---|---|
| Pilots 12 and 17 | Pilots 12, 17 and 18 | Pilots 17 and 18 | Pilot 18 | Pilots 18 and 19 | Pilots 18, 19 and 20 | Pilot 20 | |
| Claims without Working While on Claim | |||||||
| Average real weekly income (EI regular benefits only) | $298 | $302 | $311 | $320 | $327 | $329 | $326 |
| Claims with Working While on Claim (all weeks**) | |||||||
| Average real weekly EI regular benefits | $225 | $224 | $227 | $235 | $243 | $248 | $246 |
| Average real weekly employment earnings | $209 | $228 | $234 | $236 | $232 | $229 | $232 |
| Average real weekly income (EI regular benefits and employment earnings) | $434 | $452 | $461 | $470 | $475 | $478 | $478 |
| Difference in real average weekly income between claims with WWC and claims without WWC | |||||||
| Difference | +$136 | +$150 | +$150 | +$150 | +$149 | +$148 | $153 |
| Employment earnings during weeks worked only*** | |||||||
| Average real weekly employment earnings | $491 | $511 | $559 | $573 | $585 | $584 | $582 |
- Note: Based on claims that were terminated or were dormant and remained inactive as of August the following fiscal year, no matter when they were established.
- * Earnings and EI benefits are adjusted in real 2002 dollars using the All Items Consumer Price Index.
- ** Claims working while on claim in this report includes claims with deferred weeks of EI benefits (that have thus $0 of EI benefits paid and high amount of employment earnings). The figures presented are the sum of all regular benefits and/or employment earnings divided by the number of weeks the claim was active.
- *** The average real weekly employment earnings are total employment earnings divided by the number of weeks worked while on claim.
- Sources: Employment and Social Development Canada, Employment Insurance (EI) administrative data (for data on claims with WWC) and Statistics Canada, Table: 18-10-0004-01 (formerly CANSIM 326-0020). (for data on the consumer price index). Data are based on a 10% sample of EI administrative data.
Factors associated with Working While on Claim
A 2016 study* found that 73.8% of EI claimants who worked while on claim worked for a single employer. In addition, four-out-of-five claimants who worked while on claim had worked for the same employer before the start of their claim and 96% of those claimants did so in the same or previous year. In addition, 82.4% of claimants who worked while on claim worked for the same employer during and after their claim.
* ESDC, Who are Workers Working for When Working While on Claim? (Ottawa: ESDC, Evaluation Directorate, 2016).