
Annex 2: Employment Insurance benefits data tables
From: Employment and Social Development Canada
Official title: Employment Insurance Monitoring and Assessment Report for the fiscal year beginning April 1, 2018 and ending March 31, 2019: Annex 2 Employment Insurance benefits and data tables
On this page
- List of abbreviations
- Annex 2.1 – Employment Insurance benefits – Concepts and definitions
- Annex 2.2 – Employment Insurance maximum number of benefit weeks entitlement
- Annex 2.3 – Employment Insurance benefits
- Annex 2.4 – Employment Insurance benefits by EI economic region
- Annex 2.5 – Regular benefits
- Annex 2.6 – Regular benefits (by industry)
- Annex 2.7 – Regular benefits (by regional unemployment rate and hours of insurable employment from previous employment)
- Annex 2.8 – Regular benefits (by Employment Insurance economic region)
- Annex 2.9 – Seasonal regular claimants
- Annex 2.10 – Fishing benefits
- Annex 2.11 – Special benefits
- Annex 2.12 – Special benefits (by Employment Insurance economic region)
- Annex 2.13 – Firms and Employment Insurance regular and special benefits (by industry)
- Annex 2.14 – Maternity benefits
- Annex 2.15 – Parental benefits (biological and adoptive)
- Annex 2.16 – Sickness benefits
- Annex 2.17 – Sickness benefits (by industry)
- Annex 2.18 – Compassionate care benefits
- Annex 2.19 – Family caregiver benefit for adults
- Annex 2.20 – Family caregiver benefit for children
- Annex 2.21 – Work-Sharing benefits
- Annex 2.22 – Work-Sharing benefits (by industry)
- Annex 2.23 – Family Supplement
- Annex 2.24 – Working while on claim
- Annex 2.25 – Completed pure and combined Employment Insurance claims, by types of benefits, Canada
- Annex 2.26 – Employment Insurance benefit repayment
- Annex 2.27 – Contributors to the Employment Insurance program
- Annex 2.28 – Adjusted benefits-to-contributions (B/C) ratios
- Annex 2.29 – Unemployment rates used for the purpose of the Employment Insurance program (by Employment Insurance economic region)
- Annex 2.30 – Employment Insurance economic regions map – FY1819
List of abbreviations
This is the complete list of abbreviations for the Employment Insurance Monitoring and Assessment Report for the fiscal year beginning April 1, 2018 and ending March 31, 2019.
Abbreviations
- ASETS
- Aboriginal Skills and Employment Training Strategy
- ATSSC
- Administrative Tribunals Support Service of Canada
- B/C Ratio
- Benefits-to-Contributions ratio
- B/U Ratio
- Benefits-to-Unemployed ratio
- B/UC Ratio
- Benefits-to-Unemployed Contributor ratio
- BDM
- Benefit Delivery Modernization
- CANSIM
- Canadian Socio-Economic Information Management System
- CAWS
- Citizen Access Workstation Services
- CCAJ
- Connecting Canadians with Available Jobs
- CCB
- Canada Child Benefit
- CCDA
- Canadian Council of Directors of Apprenticeship
- CEIC
- Canada Employment Insurance Commission
- COLS
- Community Outreach and Liaison Service
- CSO
- Citizen Service Officer
- CPI
- Consumer Price Index
- CPP
- Canada Pension Plan
- CRA
- Canada Revenue Agency
- CRF
- Consolidated Revenue Fund
- CUSMA
- Canada-United States-Mexico Agreement
- CX
- Client Experience
- EBSMs
- Employment Benefits and Support Measures
- ECC
- Employment Contact Centre
- EF
- Enabling Fund
- EI
- Employment Insurance
- EI PAAR
- Employment Insurance Payment Accuracy Review
- EI PRAR
- Employment Insurance Processing Accuracy Review
- EICS
- Employment Insurance Coverage Survey
- eROE
- Electronic Record of Employment
- ESDC
- Employment and Social Development Canada
- FLMM
- Forum of Labour Market Ministers
- FY
- Fiscal Year
- G7
- Group of Seven
- GDP
- Gross Domestic Product
- HCCS
- Hosted Contact Centre Solution
- HRSDC
- Human Resources and Social Development Canada
- IQF
- Individual Quality Feedback
- IVR
- Interactive Voice Response
- LFS
- Labour Force Survey
- LMDA
- Labour Market Development Agreements
- LMI
- Labour Market Information
- LMP
- Labour Market Partnerships
- MIE
- Maximum Insurable Earnings
- MSCA
- My Service Canada Account
- NAICS
- North American Industry Classification System
- NAFTA
- North American Free Trade Agreement
- NAS
- National Apprenticeship Survey
- NERE
- New-Entrant/Re-Entrant
- NESI
- National Essential Skills Initiative
- NIS
- National Investigative Services
- NOS
- National Occupational Standards
- NQCP
- National Quality and Coaching Program for Call Centres
- OAS
- Old Age Security
- OECD
- Organization for Economic Co-operation and Development
- PPEs
- Clients who are Premiums Paid Eligible
- P/Ts
- Provinces and Territories
- PPTS
- Percentage points
- PRP
- Premium Reduction Program
- QPIP
- Quebec Parental Insurance Plan
- RAIS
- Registered Apprenticeship Information System
- ROE
- Record of Employment
- RSOS
- Red Seal Occupational Standards
- SA
- Social Assistance
- SCC
- Service Canada Centres
- SDP
- Service Delivery Partner
- SEPH
- Survey of Employment, Payrolls and Hours
- SIN
- Social Insurance Number
- SIR
- Social Insurance Registry
- SME
- Small and medium sized enterprises
- SO
- Scheduled Outreach
- SST
- Social Security Tribunal
- STDP
- Short-term disability plan
- SUB
- Supplemental Unemployment Benefit
- UV
- Unemployed-to-job-vacancy ratio
- VBW
- Variable Best Weeks
- VER
- Variable Entrance Requirement
- WWC
- Working While on Claim
Annex 2.1 – Employment Insurance benefits – Concepts and definitions
Chapter II and Annex 2 provide information on the numbers of new claims established, the average actual duration, the average weekly benefit rate, the amount paid in benefits, employment insurance claimant categories (long-tenured workers, occasional claimants, frequent claimants), seasonal regular claimants and claim status (active, open, completed, terminated, dormant and combined). These concepts are defined below.
New claims established
New claims established refer to new Employment Insurance claims that have been received, processed and approved by Employment and Social Development Canada (via Service Canada) for which at least $1 in benefits was paid to an Employment Insurance claimant.
To avoid double counting, each claim established is counted only once. Thus, a claim that was established, for example, in November 2017 (which is in FY1718) and for which benefits paid to an Employment Insurance claimant began in December 2017 (also in FY1718) and ended in June 2018 (which is in FY1819) is included in the FY1718 statistics, but is not counted in the FY1819 statistics.
New claims established designate a different concept from new applications submitted to Employment and Social Development Canada (and received by the organization). An application may be submitted, but not necessarily established. This is the case, for example, when the application is rejected because not all of the eligibility requirements are met.
It should be noted that the number of new claims established during a fiscal year does not necessarily correspond to the number of new Employment Insurance claimants because a claimant can have more than 1 Employment Insurance claim established annually.
New claims established are also referred to under other names such as: new claims established, benefits, claims and claims established. The terms "new," "benefits" and "established" are sometimes omitted so as not to complicate the text. In all cases, these terms refer to the same concept.
Average actual duration
The average actual duration of Employment Insurance claims refers, in regard to these claims, to the average number of weeks of benefits per claim during which at least 1 dollar in benefits was paid to an Employment Insurance claimant.
For claims associated with most benefits types, the average actual duration is calculated by dividing the sum of the number of weeks of benefits during which at least 1 dollar was paid per claim by the number of claims that were completed based on the variable assessed (that is, the average actual duration for Ontario is equal to the sum of the number of weeks of benefits paid in Ontario for all claims completed during a fiscal year divided by the number of claims that were completed in Ontario during the same period.
Average actual duration for claims for Employment Insurance fishing benefits and family caregiver benefits for adults and children are calculated using claims established during the reference period rather than claims completed during the reference period.
The average actual duration is a different concept than the average maximum duration: the latter is the maximum number of weeks during which benefits may be paid (under sections 12 and 152.14 of the Employment Insurance Act, and Section 8 of the Employment Insurance (Fishing) Regulations), while the former is the number of weeks for which benefits are actually paid.
Average weekly benefit rate
The average weekly benefit rate, or level of EI benefits, refers to the rate of weekly benefits payable on average for an Employment Insurance claim.
The average weekly benefit rate is calculated by dividing the sum of the weekly benefit rate of each claim by the number of claims that were established.
The Family Supplement is always included in the calculation of the average weekly benefit rate, unless otherwise specified.
The average weekly benefit rate is not necessarily equal to the amount of benefits actually paid on average per claim established. The amount paid may be less than the benefit rate, especially if the weekly benefits are reduced because the claimant worked while on claim (for more information, see subsection 2.2.7 of Chapter II relating to the Working While on Claim provision).
Amount paid
The amount paid refers to the sum of benefit payments that claimants who have established an Employment Insurance claim have received. In other words, it is the value of Employment Insurance benefits that were paid to Employment Insurance claimants.
The amount paid is always reported on a cash basis, meaning that they are reported in the year in which they were paid regardless of when the claim was established. Thus, the amount paid in benefits to an Employment Insurance claimant who, for example, had a claim established in November 2017 (i.e. in FY1718) and received payment starting in December 2017 (i.e. in FY1718) and ending in June 2018 (i.e. in FY1819) are included in the fiscal year statistics for FY1718 and FY1819. If this claimant received $200 per week for 17 weeks between December 2017 and March 2018, and $200 per week for 12 weeks between April and June 2018, an amount of $3,400 will be allocated to FY1718 and $2,400 will be allocated to FY1819.
Long-Tenured workers
Long-Tenured workers are Employment Insurance (EI) claimants who have paid at least 30% of the maximum annual EI premiums in 7 of the past 10 years and who, over the last 5 years, have collected EI regular or fishing benefits for 35 weeks or less.
Frequent claimants
Frequent claimants are EI claimants who have had 3 or more EI regular or fishing claims and have collected benefits for a total of more than 60 weeks in the past 5 years.
Occasional claimants
Occasional claimants are EI claimants who do not meet the requirements for either long-tenured workers or frequent claimants.
Seasonal claimants
EI claimants who had at least 3 regular or fishing claims within past 5 years from the reference year, with at least 2 of these claims having started during the same period of the year as the current claim, are referred to as seasonal claimants.
A claim is considered to have been established at the same time of year if it was established between 8 weeks before and 8 weeks after the week in which the reference year claim was established.
Active claims
Active claims are claims for which benefits are still being paid during the reference period.
With regards to the subsection 2.2.4 Extension of Employment Insurance regular benefits for workers in regions affected by the downturn in commodity prices, active claims represent those that were established after January 4, 2015 in the 15 EI economic regions targeted by the Budget Implementation Act, 2016, No.1 and that were still open by the time the implementation act came into effect on July 3, 2016.
Open claims
Open claims are those for which the claimants are still receiving or still can receive EI benefits.
Completed claims
Completed claims refer to claims that are terminated and those that are dormant.
Terminated claims
Terminated claims are those that have ended and for which claimants are no longer eligible to receive Employment Insurance benefits. The main reasons associated with the termination of claims is either that all weeks of benefits the claimant was entitled to be paid or that the claim reached the last week of the benefit period, that is the last week for which Employment Insurance benefits could be paid.
Dormant claims
Dormant claims are those that, as of August of the reference year following the reporting fiscal year, are open but are not active.
Combined or mixed claims
A combined or mixed claim refers to an Employment Insurance claim for which the claimant receives more than 1 type of benefit during the claimant’s benefit period. The 8 types of benefits available under the Employment Insurance program as stipulated in Chapter II and Annex 2 are:
- regular benefits
- fishing benefits
- maternity benefits
- parental benefits
- sickness benefits
- compassionate care benefits
- family caregiver benefit for adults
- family caregiver benefit for children, and
- Work-Sharing benefits
Regular and fishing benefits can never be combined in the same claim.
A claim for which a claimant receives both regular benefits and maternity benefits during its benefit period is treated as 2 separate claims in cases where information on regular benefits or maternity benefits is reported separately (as in the case of Annexes 2.5 and 2.14, which report data on the 2 types of benefits separately; in this example, each of the 2 annexes would add 1 claim to its totals). Conversely, if aggregated information is presented, the claim is considered a single claim (as in the case of Annex 2.3, which presents data on all Employment Insurance benefits).
| Number of hours of insurable employment in qualifying period | Regional rate of unempl.: 6% and under | Regional rate of unempl.: More than 6% but not more than 7% | Regional rate of unempl.: More than 7% but not more than 8% | Regional rate of unempl.: More than 8% but not more than 9% | Regional rate of unempl.: More than 9% but not more than 10% | Regional rate of unempl.: More than 10% but not more than 11% | Regional rate of unempl.: More than 11% but not more than 12% | Regional rate of unempl.: More than 12% but not more than 13% | Regional rate of unempl.: More than 13% but not more than 14% | Regional rate of unempl.: More than 14% but not more than 15% | Regional rate of unempl.: More than 15% but not more than 16% | Regional rate of unempl.: More than 16% |
|---|---|---|---|---|---|---|---|---|---|---|---|---|
| 420-454 | 0 | 0 | 0 | 0 | 0 | 0 | 0 | 0 | 26 | 28 | 30 | 32 |
| 455-489 | 0 | 0 | 0 | 0 | 0 | 0 | 0 | 24 | 26 | 28 | 30 | 32 |
| 490-524 | 0 | 0 | 0 | 0 | 0 | 0 | 23 | 25 | 27 | 29 | 31 | 33 |
| 525-559 | 0 | 0 | 0 | 0 | 0 | 21 | 23 | 25 | 27 | 29 | 31 | 33 |
| 560-594 | 0 | 0 | 0 | 0 | 20 | 22 | 24 | 26 | 28 | 30 | 32 | 34 |
| 595-629 | 0 | 0 | 0 | 18 | 20 | 22 | 24 | 26 | 28 | 30 | 32 | 34 |
| 630-664 | 0 | 0 | 17 | 19 | 21 | 23 | 25 | 27 | 29 | 31 | 33 | 35 |
| 665-699 | 0 | 15 | 17 | 19 | 21 | 23 | 25 | 27 | 29 | 31 | 33 | 35 |
| 700-734 | 14 | 16 | 18 | 20 | 22 | 24 | 26 | 28 | 30 | 32 | 34 | 36 |
| 735-769 | 14 | 16 | 18 | 20 | 22 | 24 | 26 | 28 | 30 | 32 | 34 | 36 |
| 770-804 | 15 | 17 | 19 | 21 | 23 | 25 | 27 | 29 | 31 | 33 | 35 | 37 |
| 805-839 | 15 | 17 | 19 | 21 | 23 | 25 | 27 | 29 | 31 | 33 | 35 | 37 |
| 840-874 | 16 | 18 | 20 | 22 | 24 | 26 | 28 | 30 | 32 | 34 | 36 | 38 |
| 875-909 | 16 | 18 | 20 | 22 | 24 | 26 | 28 | 30 | 32 | 34 | 36 | 38 |
| 910-944 | 17 | 19 | 21 | 23 | 25 | 27 | 29 | 31 | 33 | 35 | 37 | 39 |
| 945-979 | 17 | 19 | 21 | 23 | 25 | 27 | 29 | 31 | 33 | 35 | 37 | 39 |
| 980-1,014 | 18 | 20 | 22 | 24 | 26 | 28 | 30 | 32 | 34 | 36 | 38 | 40 |
| 1,015-1,049 | 18 | 20 | 22 | 24 | 26 | 28 | 30 | 32 | 34 | 36 | 38 | 40 |
| 1,050-1,084 | 19 | 21 | 23 | 25 | 27 | 29 | 31 | 33 | 35 | 37 | 39 | 41 |
| 1,085-1,119 | 19 | 21 | 23 | 25 | 27 | 29 | 31 | 33 | 35 | 37 | 39 | 41 |
| 1,120-1,154 | 20 | 22 | 24 | 26 | 28 | 30 | 32 | 34 | 36 | 38 | 40 | 42 |
| 1,155-1,189 | 20 | 22 | 24 | 26 | 28 | 30 | 32 | 34 | 36 | 38 | 40 | 42 |
| 1,190-1,224 | 21 | 23 | 25 | 27 | 29 | 31 | 33 | 35 | 37 | 39 | 41 | 43 |
| 1,225-1,259 | 21 | 23 | 25 | 27 | 29 | 31 | 33 | 35 | 37 | 39 | 41 | 43 |
| 1,260-1,294 | 22 | 24 | 26 | 28 | 30 | 32 | 34 | 36 | 38 | 40 | 42 | 44 |
| 1,295-1,329 | 22 | 24 | 26 | 28 | 30 | 32 | 34 | 36 | 38 | 40 | 42 | 44 |
| 1,330-1,364 | 23 | 25 | 27 | 29 | 31 | 33 | 35 | 37 | 39 | 41 | 43 | 45 |
| 1,365-1,399 | 23 | 25 | 27 | 29 | 31 | 33 | 35 | 37 | 39 | 41 | 43 | 45 |
| 1,400-1,434 | 24 | 26 | 28 | 30 | 32 | 34 | 36 | 38 | 40 | 42 | 44 | 45 |
| 1,435-1,469 | 25 | 27 | 29 | 31 | 33 | 35 | 37 | 39 | 41 | 43 | 45 | 45 |
| 1,470-1,504 | 26 | 28 | 30 | 32 | 34 | 36 | 38 | 40 | 42 | 44 | 45 | 45 |
| 1,505-1,539 | 27 | 29 | 31 | 33 | 35 | 37 | 39 | 41 | 43 | 45 | 45 | 45 |
| 1,540-1,574 | 28 | 30 | 32 | 34 | 36 | 38 | 40 | 42 | 44 | 45 | 45 | 45 |
| 1,575-1,609 | 29 | 31 | 33 | 35 | 37 | 39 | 41 | 43 | 45 | 45 | 45 | 45 |
| 1,610-1,644 | 30 | 32 | 34 | 36 | 38 | 40 | 42 | 44 | 45 | 45 | 45 | 45 |
| 1,645-1,679 | 31 | 33 | 35 | 37 | 39 | 41 | 43 | 45 | 45 | 45 | 45 | 45 |
| 1,680-1,714 | 32 | 34 | 36 | 38 | 40 | 42 | 44 | 45 | 45 | 45 | 45 | 45 |
| 1,715-1,749 | 33 | 35 | 37 | 39 | 41 | 43 | 45 | 45 | 45 | 45 | 45 | 45 |
| 1,750-1,784 | 34 | 36 | 38 | 40 | 42 | 44 | 45 | 45 | 45 | 45 | 45 | 45 |
| 1,785-1,819 | 35 | 37 | 39 | 41 | 43 | 45 | 45 | 45 | 45 | 45 | 45 | 45 |
| 1,820+ | 36 | 38 | 40 | 42 | 44 | 45 | 45 | 45 | 45 | 45 | 45 | 45 |
- Source: Employment Insurance Act, Schedule I.
Annex 2.3 – Employment Insurance benefits
| Category | FY1415 | FY1516 | FY1617 | FY1718 | FY1819 | Change (%) FY1718 to FY1819 |
|---|---|---|---|---|---|---|
| Newfoundland and Labrador | 81,230 | 85,910 | 74,000 | 81,090 | 86,070 | +6.1 |
| Prince Edward Island | 21,950 | 22,140 | 22,540 | 22,720 | 22,480 | -1.1 |
| Nova Scotia | 79,550 | 82,410 | 82,710 | 85,300 | 84,570 | -0.9 |
| New Brunswick | 85,020 | 88,670 | 88,910 | 91,130 | 89,820 | -1.4 |
| Quebec | 491,160 | 496,680 | 483,700 | 482,990 | 473,060 | -2.1 |
| Ontario | 561,200 | 569,620 | 552,030 | 562,570 | 556,900 | -1.0 |
| Manitoba | 57,000 | 64,660 | 59,250 | 61,440 | 64,020 | +4.2 |
| Saskatchewan | 47,840 | 57,110 | 49,850 | 51,250 | 54,210 | +5.8 |
| Alberta | 169,840 | 235,470 | 201,610 | 170,270 | 188,870 | +10.9 |
| British Columbia | 208,320 | 216,790 | 197,770 | 200,820 | 198,240 | -1.3 |
| Yukon | 2,450 | 2,410 | 2,300 | 2,200 | 2,310 | +5.0 |
| Northwest Territories | 2,250 | 2,320 | 2,380 | 2,420 | 2,310 | -4.5 |
| Nunavut | 990 | 1,230 | 1,290 | 1,340 | 1,470 | +9.7 |
| Men | 994,200 | 1,075,810 | 984,150 | 974,660 | 988,250 | +1.4 |
| Women | 814,600 | 849,610 | 834,190 | 840,880 | 836,080 | -0.6 |
| 24 years old and under | 181,910 | 194,270 | 178,010 | 172,810 | 170,480 | -1.3 |
| 25 to 44 years old | 871,570 | 933,430 | 883,950 | 876,270 | 882,780 | +0.7 |
| 45 to 54 years old | 391,140 | 402,020 | 370,360 | 363,410 | 352,640 | -3.0 |
| 55 years old and over | 364,180 | 395,700 | 386,020 | 403,050 | 418,430 | +3.8 |
| Canada | 1,808,800 | 1,925,420 | 1,818,340 | 1,815,540 | 1,824,330 | +0.5 |
- Note: Includes all claims for which at least $1 of EI benefits was paid.
- 1 Excludes Family caregiver benefits for adults and children due to the incompatibility of administrative data sources.
- Source: Employment and Social Development Canada, Employment Insurance (EI) administrative data. Data are based on a 10% sample of EI administrative data.
| Category | FY1415 | FY1516 | FY1617 | FY1718r1 | FY1819 | Change (%) FY1718 to FY1819 |
|---|---|---|---|---|---|---|
| Newfoundland and Labrador | 435 | 448 | 445 | 456 | 464 | +1.7 |
| Prince Edward Island | 416 | 428 | 432 | 436 | 437 | +0.1 |
| Nova Scotia | 419 | 425 | 426 | 431 | 437 | +1.5 |
| New Brunswick | 412 | 424 | 426 | 431 | 440 | +1.9 |
| Quebec | 420 | 428 | 433 | 443 | 454 | +2.5 |
| Ontario | 431 | 441 | 451 | 459r1 | 473 | +3.1 |
| Manitoba | 422 | 435 | 440 | 444 | 453 | +1.8 |
| Saskatchewan | 452 | 466 | 465 | 468r1 | 477 | +1.8 |
| Alberta | 472 | 486 | 485 | 488r1 | 499 | +2.2 |
| British Columbia | 429 | 442 | 447 | 455r1 | 468 | +2.9 |
| Yukon | 474 | 490 | 498 | 502 | 517 | +2.9 |
| Northwest Territories | 495 | 505 | 510 | 519 | 520 | +0.2 |
| Nunavut | 469 | 472 | 485 | 504r1 | 500 | -0.9 |
| Men | 457 | 469 | 473 | 480 | 492 | +2.3 |
| Women | 398 | 409 | 416 | 423r1 | 433 | +2.6 |
| 24 years old and under | 394 | 407 | 400 | 403 | 421 | +4.4 |
| 25 to 44 years old | 442 | 455 | 460 | 468r1 | 478 | +2.2 |
| 45 to 54 years old | 434 | 446 | 452 | 460 | 472 | +2.6 |
| 55 years old and over | 417 | 428 | 433 | 440 | 452 | +2.8 |
| Canada | 431 | 443 | 447 | 454r1 | 465 | +2.6 |
- Note: Percentage change is based on unrounded numbers. Includes all claims for which at least $1 of EI benefits was paid.
- 1 Excludes family caregiver benefits for adults and children due to incompatibility of administrative data sources and extended parental benefits which are paid at a lower benefit rate (33% of average weekly insurable earnings) than other types of benefits.
- 2 Takes into account Family Supplement top-ups paid to Employment Insurance claimants.
- r1 Revised data to reflect the exclusion of extended parental benefits which have been available at a lower benefit rate since December 3, 2017.
- Source: Employment and Social Development Canada, Employment Insurance (EI) administrative data. Data are based on a 10% sample of EI administrative data.
| Category | FY1415 | FY1516 | FY1617 | FY1718 | FY1819 | Change (%) FY11718 to FY1819 |
|---|---|---|---|---|---|---|
| Newfoundland and Labrador | 862.8 | 958.6 | 1,040.2 | 1,185.2 | 1,022.9 | -13.7 |
| Prince Edward Island | 211.4 | 228.1 | 230.7 | 248.1 | 231.1 | -6.9 |
| Nova Scotia | 748.1 | 833.0 | 841.3 | 892.2 | 845.1 | -5.3 |
| New Brunswick | 824.0 | 904.0 | 919.0 | 954.0 | 869.6 | -8.9 |
| Quebec | 3,507.1 | 3,649.7 | 3,430.7 | 3,558.2 | 3,106.0 | -12.7 |
| Ontario | 5,270.5 | 5,478.3 | 5,443.2 | 5,657.7 | 5,240.4 | -7.4 |
| Manitoba | 498.2 | 573.4 | 587.3 | 631.3 | 619.2 | -1.9 |
| Saskatchewan | 437.4 | 572.7 | 671.5 | 700.9 | 624.7 | -10.9 |
| Alberta | 1,507.0 | 2,362.3 | 3,158.3 | 2,655.3 | 2,171.0 | -18.2 |
| British Columbia | 1,862.8 | 2,031.1 | 2,064.2 | 2,089.5 | 1,878.1 | -10.1 |
| Yukon | 30.4 | 25.9 | 27.3 | 27.8 | 25.0 | -9.8 |
| Northwest Territories | 29.3 | 28.8 | 29.9 | 30.9 | 31.1 | +0.9 |
| Nunavut | 15.1 | 16.2 | 17.6 | 23.6 | 21.0 | -11.1 |
| Men | 8,088.4 | 9,411.7 | 9,868.8 | 9,678.0 | 8,416.6 | -13.0 |
| Women | 7,715.7 | 8,250.3 | 8,592.2 | 8,976.6 | 8,268.7 | -7.9 |
| 24 years old and under | 1,316.1 | 1,523.7 | 1,522.2 | 1,443.0 | 1,284.6 | -11.0 |
| 25 to 44 years old | 8,525.3 | 9,497.1 | 9,869.4 | 9,908.0 | 9,038.7 | -8.8 |
| 45 to 54 years old | 3,069.2 | 3,341.4 | 3,450.0 | 3,431.5 | 2,883.7 | -16.0 |
| 55 years old and over | 2,893.5 | 3,299.8 | 3,619.4 | 3,872.1 | 3,478.3 | -10.2 |
| Canada | 15,804.1 | 17,662.0 | 18,461.0 | 18,654.7 | 16,685.3 | -10.6 |
- Note: Data may not add up to the total due to rounding. Percentage change is based on unrounded numbers. Includes all claims for which at least $1 of EI benefits was paid.
- 1 Excludes family caregiver benefits for adults and children due to incompatibility of administrative data sources.
- Source: Employment and Social Development Canada, Employment Insurance (EI) administrative data. Data are based on a 10% sample of EI administrative data.
Annex 2.4 – Employment Insurance benefits by EI economic region
| EI economic region | FY1415 | FY1516 | FY1617 | FY1718 | FY1819 | Change (%) FY1718 to FY1819 |
|---|---|---|---|---|---|---|
| St. John's | 14,810 | 16,190 | 16,210 | 16,620 | 15,260 | -8.2 |
| Newfoundland - Labrador | 66,420 | 69,720 | 57,790 | 64,470 | 70,810 | +9.8 |
| Prince Edward Island2 | 9,530 | n/a | n/a | n/a | n/a | n/a |
| Charlottetown2 | 2,960 | 5,470 | 5,860 | 5,570 | 5,680 | +2.0 |
| Prince Edward Island (excluding Charlottetown)2 | 9,460 | 16,670 | 16,680 | 17,150 | 16,800 | -2.0 |
| Eastern Nova Scotia | 27,660 | 28,370 | 28,580 | 30,060 | 30,890 | +2.8 |
| Western Nova Scotia | 33,860 | 35,120 | 34,740 | 35,660 | 33,640 | -5.7 |
| Halifax | 18,030 | 18,920 | 19,390 | 19,580 | 20,040 | +2.3 |
| Fredericton-Moncton-Saint-John | 26,280 | 28,070 | 27,670 | 28,250 | 28,170 | -0.3 |
| Madawaska-Charlotte | 14,250 | 14,270 | 13,880 | 14,380 | 14,410 | +0.2 |
| Restigouche-Albert | 44,490 | 46,330 | 47,360 | 48,500 | 47,240 | -2.6 |
| Gaspésie-Îles-de-la-Madeleine | 26,520 | 27,320 | 27,780 | 27,900 | 27,020 | -3.2 |
| Quebec | 40,290 | 40,400 | 38,730 | 40,490 | 39,530 | -2.4 |
| Trois-Rivières | 9,900 | 10,060 | 9,550 | 9,650 | 9,310 | -3.5 |
| South Central Quebec | 9,760 | 9,190 | 9,950 | 8,780 | 8,870 | +1.0 |
| Sherbrooke | 10,850 | 10,060 | 9,870 | 10,150 | 9,960 | -1.9 |
| Montérégie | 30,970 | 33,220 | 32,400 | 31,710 | 30,950 | -2.4 |
| Montréal | 176,270 | 179,760 | 174,100 | 174,490 | 170,940 | -2.0 |
| Central Quebec | 87,010 | 87,800 | 86,170 | 86,950 | 85,820 | -1.3 |
| North Western Quebec | 23,260 | 22,520 | 21,010 | 21,210 | 20,750 | -2.2 |
| Lower Saint Lawrence and North Shore | 49,550 | 50,290 | 49,020 | 47,100 | 46,140 | -2.0 |
| Hull | 13,420 | 13,320 | 12,980 | 12,630 | 12,700 | +0.6 |
| Chicoutimi-Jonquière | 13,360 | 12,740 | 12,140 | 11,930 | 11,070 | -7.2 |
| Ottawa | 33,180 | 34,370 | 33,210 | 32,610 | 32,410 | -0.6 |
| Eastern Ontario | 26,590 | 27,780 | 26,630 | 26,410 | 25,490 | -3.5 |
| Kingston | 5,730 | 5,110 | 5,520 | 5,140 | 5,570 | +8.4 |
| Central Ontario | 58,200 | 61,340 | 60,350 | 59,150 | 58,130 | -1.7 |
| Oshawa | 17,890 | 17,760 | 17,770 | 18,760 | 16,100 | -14.2 |
| Toronto | 207,290 | 211,410 | 205,510 | 204,230 | 204,030 | -0.1 |
| Hamilton | 29,230 | 29,400 | 29,650 | 29,240 | 29,040 | -0.7 |
| St. Catharines | 19,580 | 20,760 | 20,330 | 20,380 | 20,090 | -1.4 |
| London | 19,400 | 18,920 | 19,270 | 20,780 | 19,090 | -8.1 |
| Niagara | 17,520 | 18,080 | 17,240 | 17,280 | 17,390 | +0.6 |
| Windsor | 19,480 | 13,630 | 12,200 | 19,440 | 21,290 | +9.5 |
| Kitchener | 20,450 | 20,340 | 20,980 | 21,820 | 21,540 | -1.3 |
| Huron | 17,570 | 17,710 | 20,100 | 19,450 | 17,880 | -8.1 |
| South Central Ontario | 18,560 | 19,210 | 19,310 | 21,680 | 20,780 | -4.2 |
| Sudbury | 7,870 | 8,760 | 7,290 | 7,430 | 7,860 | +5.8 |
| Thunder Bay | 6,510 | 6,540 | 6,000 | 6,370 | 5,900 | -7.4 |
| Northern Ontario | 36,150 | 38,500 | 30,670 | 32,400 | 34,310 | +5.9 |
| Winnipeg | 31,990 | 36,060 | 32,910 | 34,580 | 34,910 | +1.0 |
| Southern Manitoba | 15,120 | 18,200 | 17,150 | 17,180 | 17,750 | +3.3 |
| Northern Manitoba | 9,890 | 10,400 | 9,190 | 9,680 | 11,360 | +17.4 |
| Regina | 8,510 | 9,830 | 10,260 | 10,470 | 10,310 | -1.5 |
| Saskatoon | 12,220 | 14,780 | 13,940 | 13,430 | 13,990 | +4.2 |
| Southern Saskatchewan | 13,080 | 15,310 | 12,210 | 12,750 | 13,820 | +8.4 |
| Northern Saskatchewan | 14,030 | 17,190 | 13,440 | 14,600 | 16,090 | +10.2 |
| Calgary | 54,040 | 74,310 | 63,390 | 55,710 | 57,720 | +3.6 |
| Edmonton | 57,710 | 81,150 | 67,740 | 61,260 | 68,520 | +11.9 |
| Northern Alberta | 14,890 | 20,620 | 22,770 | 13,900 | 16,540 | +19.0 |
| Southern Alberta | 43,200 | 59,390 | 47,710 | 39,400 | 46,090 | +17.0 |
| Southern Interior British Columbia | 38,600 | 43,030 | 36,590 | 36,700 | 40,710 | +10.9 |
| Abbotsford | 10,690 | 10,790 | 11,090 | 10,750 | 9,760 | -9.2 |
| Vancouver | 90,310 | 90,370 | 84,900 | 87,510 | 82,480 | -5.7 |
| Victoria | 12,660 | 12,990 | 12,090 | 12,870 | 12,360 | -4.0 |
| Southern Coastal British Columbia | 30,380 | 32,410 | 31,280 | 30,000 | 30,350 | +1.2 |
| Northern British Columbia | 25,680 | 27,200 | 21,820 | 22,990 | 22,580 | -1.8 |
| Yukon2 | 1,120 | n/a | n/a | n/a | n/a | n/a |
| Whitehorse2 | 740 | 1,560 | 1,420 | 1,340 | 1,480 | +10.4 |
| Yukon (excluding Whitehorse)2 | 590 | 850 | 880 | 860 | 830 | -3.5 |
| Northwest Territories2 | 1,330 | n/a | n/a | n/a | n/a | n/a |
| Yellowknife2 | 310 | 810 | 870 | 840 | 830 | -1.2 |
| Northwest Territories (excluding Yellowknife)2 | 610 | 1,510 | 1,510 | 1,580 | 1,480 | -6.3 |
| Nunavut2 | 510 | n/a | n/a | n/a | n/a | n/a |
| Iqaluit2 | 100 | 300 | 230 | 320 | 290 | -9.4 |
| Nunavut (excluding Iqaluit)2 | 380 | 930 | 1,060 | 1,020 | 1,180 | +15.7 |
| Canada | 1,808,800 | 1,925,420 | 1,818,340 | 1,815,540 | 1,824,330 | +0.5 |
- Note: Includes all claims for which at least $1 of EI benefits was paid.
- 1 Excludes Family caregiver benefits for adults and children due to the incompatibility of administrative data sources.
- 2 As of October 12, 2014, there is a total of 62 EI economic regions, instead of 58 regions. The EI economic regions of Prince Edward Island, Yukon, the Northwest Territories and Nunavut were each divided into 2 EI economic regions, 1 consisting of the capital area and the remaining consisting of the non-capital area.
- Source: Employment and Social Development Canada, Employment Insurance (EI) administrative data. Data are based on a 10% sample of EI administrative data.
| EI economic region | FY1415 | FY1516 | FY1617 | FY1718r1 | FY1819 | Change (%) FY1617 to FY1718 |
|---|---|---|---|---|---|---|
| St. John's | 441 | 456 | 464 | 463 | 468 | +1.0 |
| Newfoundland - Labrador | 434 | 447 | 440 | 454 | 463 | +1.9 |
| Prince Edward Island | 409 | n/a | n/a | n/a | n/a | n/a |
| Charlottetown3 | 402 | 413 | 406 | 405 | 408 | +0.6 |
| Prince Edward Island (excluding Charlottetown)3 | 428 | 433 | 441 | 446 | 447 | +01 |
| Eastern Nova Scotia | 435 | 439 | 440 | 446 | 449 | +0.7 |
| Western Nova Scotia | 407 | 413 | 416 | 418 | 426 | +1.8 |
| Halifax | 415 | 426 | 425 | 431 | 439 | +1.8 |
| Fredericton-Moncton-Saint-John | 403 | 414 | 416 | 424 | 432 | +2.0 |
| Madawaska-Charlotte | 398 | 411 | 411 | 420 | 425 | +1.2 |
| Restigouche-Albert | 421 | 434 | 436 | 439 | 449 | +2.2 |
| Gaspésie-Îles-de-la-Madeleine | 432 | 437 | 443 | 451 | 460 | +2.1 |
| Quebec | 427 | 435 | 441 | 454 | 467 | +2.7 |
| Trois-Rivières | 409 | 415 | 419 | 436 | 441 | +1.2 |
| South Central Quebec | 419 | 429 | 437 | 443 | 451 | +1.9 |
| Sherbrooke | 412 | 418 | 430 | 435 | 452 | +3.9 |
| Montérégie | 415 | 424 | 432 | 439 | 452 | +3.1 |
| Montréal | 419 | 427 | 433 | 442 | 452 | +2.3 |
| Central Quebec | 412 | 420 | 426 | 436 | 447 | +2.3 |
| North Western Quebec | 428 | 433 | 438 | 446 | 464 | +4.0 |
| Lower Saint Lawrence and North Shore | 425 | 433 | 435 | 445 | 456 | +2.3 |
| Hull | 431 | 439 | 452 | 458 | 470 | +2.6 |
| Chicoutimi-Jonquière | 422 | 423 | 427 | 437 | 448 | +2.5 |
| Ottawa | 448 | 455 | 465 | 469r1 | 480 | +2.4 |
| Eastern Ontario | 424 | 431 | 441 | 441r1 | 460 | +4.4 |
| Kingston | 425 | 421 | 437 | 441 | 466 | +5.5 |
| Central Ontario | 419 | 432 | 444 | 448 | 461 | +2.8 |
| Oshawa | 449 | 452 | 466 | 476r1 | 486 | +2.0 |
| Toronto | 433 | 445 | 455 | 465r1 | 478 | +2.8 |
| Hamilton | 433 | 444 | 455 | 464 | 479 | +3.2 |
| St. Catharines | 409 | 413 | 428 | 435r1 | 450 | +3.3 |
| London | 426 | 427 | 439 | 451r1 | 463 | +2.8 |
| Niagara | 425 | 438 | 444 | 456r1 | 468 | +2.7 |
| Windsor | 448 | 437 | 433 | 468r1 | 485 | +3.7 |
| Kitchener | 438 | 444 | 458 | 460r1 | 480 | +4.3 |
| Huron | 421 | 435 | 441 | 450r1 | 467 | +3.8 |
| South Central Ontario | 429 | 440 | 455 | 461 | 474 | +2.9 |
| Sudbury | 434 | 453 | 453 | 456r1 | 481 | +5.6 |
| Thunder Bay | 439 | 459 | 467 | 475r1 | 483 | +1.7 |
| Northern Ontario | 432 | 445 | 442 | 451 | 469 | +3.9 |
| Winnipeg | 425 | 436 | 448 | 448r1 | 456 | +1.8 |
| Southern Manitoba | 416 | 434 | 432 | 441 | 449 | +1.7 |
| Northern Manitoba | 417 | 435 | 428 | 438 | 448 | +2.3 |
| Regina | 457 | 466 | 480 | 477r1 | 490 | +2.7 |
| Saskatoon | 459 | 466 | 469 | 473r1 | 482 | +2.1 |
| Southern Saskatchewan | 444 | 464 | 459 | 468 | 472 | +0.8 |
| Northern Saskatchewan | 450 | 467 | 455 | 458r1 | 468 | +2.3 |
| Calgary | 473 | 485 | 484 | 486r1 | 496 | +1.9 |
| Edmonton | 474 | 489 | 492 | 496r1 | 505 | +1.9 |
| Northern Alberta | 484 | 494 | 498 | 495r1 | 508 | +2.5 |
| Southern Alberta | 465 | 479 | 472 | 476r1 | 490 | +3.1 |
| Southern Interior British Columbia | 434 | 450 | 443 | 455 | 464 | +1.8 |
| Abbotsford | 383 | 391 | 407 | 409 | 423 | +3.3 |
| Vancouver | 424 | 435 | 451 | 456 | 471 | +3.3 |
| Victoria | 436 | 450 | 453 | 463 | 478 | +3.3 |
| Southern Coastal British Columbia | 433 | 444 | 443 | 452r1 | 465 | +2.8 |
| Northern British Columbia | 454 | 467 | 459 | 467 | 482 | +3.1 |
| Yukon3 | 471 | n/a | n/a | n/a | n/a | n/a |
| Whitehorse3 | 478 | 485 | 504 | 503 | 517 | +2.7 |
| Yukon (excluding Whitehorse)3 | 474 | 498 | 487 | 501 | 517 | +3.2 |
| Northwest Territories3 | 488 | n/a | n/a | n/a | n/a | n/a |
| Yellowknife3 | 499 | 505 | 511 | 523 | 528 | +1.0 |
| Northwest Territories (excluding Yellowknife)3 | 507 | 506 | 509 | 517 | 516 | -0.3 |
| Nunavut3 | 464 | n/a | n/a | n/a | n/a | n/a |
| Iqaluit3 | 497 | 499 | 524 | 517 | 541 | +4. |
| Nunavut (excluding Iqaluit)3 | 470 | 463 | 477 | 500r1 | 489 | -2.2 |
| Canada | 431 | 443 | 447 | 454r1 | 465 | +2.6 |
- Note: Percentage change is based on unrounded numbers. Includes all claims for which at least $1 of EI benefits was paid.
- 1 Excludes Family caregiver benefits for adults and children due to the incompatibility of administrative data sources and extended parental benefits which are paid at a lower benefit rate (33% of average weekly insurable earnings) than other types of benefits.
- 2 Takes into account Family Supplement top-ups paid to Employment Insurance claimants.
- 3 As of October 12, 2014, there is a total of 62 EI economic regions, instead of 58 regions. The EI economic regions of Prince Edward Island, Yukon, the Northwest Territories and Nunavut were each divided into 2 EI economic regions, 1 consisting of the capital area and the remaining consisting of the non-capital area.
- r1 Revised data to reflect the exclusion of extended parental benefits which have been available at a lower benefit rate since December 3, 2017.
- Source: Employment and Social Development Canada, Employment Insurance (EI)administrative data. Data are based on a 10% sample of EI administrative data.
| EI economic region | FY1415 | FY1516 | FY1617 | FY1718 | FY1819 | Change (%) FY1718 to FY1819 |
|---|---|---|---|---|---|---|
| St. John's | 130.5 | 146.2 | 167.4 | 191.6 | 163.2 | -14.8 |
| Newfoundland - Labrador | 732.4 | 812.4 | 872.7 | 993.6 | 859.7 | -13.5 |
| Prince Edward Island2 | 153.1 | 13.1 | n/a | n/a | n/a | n/a |
| Charlottetown2 | 11.1 | 46.9 | 52.3 | 50.1 | 47.0 | -6.1 |
| Prince Edward Island (excluding Charlottetown)2 | 47.1 | 168.1 | 178.4 | 198.0 | 184.0 | -7.0 |
| Eastern Nova Scotia | 286.4 | 328.9 | 335.5 | 362.0 | 356.5 | -1.5 |
| Western Nova Scotia | 298.5 | 321.4 | 322.3 | 337.6 | 307.3 | -9.0 |
| Halifax | 163.1 | 182.6 | 183.5 | 192.5 | 181.3 | -5.8 |
| Fredericton-Moncton-Saint-John | 225.5 | 257.6 | 263.4 | 259.3 | 246.4 | -5.0 |
| Madawaska-Charlotte | 120.5 | 125.2 | 117.1 | 124.6 | 121.4 | -2.6 |
| Restigouche-Albert | 478.0 | 521.2 | 538.5 | 570.1 | 501.8 | -12.0 |
| Gaspésie-Îles-de-la-Madeleine | 273.8 | 291.4 | 290.4 | 322.5 | 280.2 | -13.1 |
| Quebec | 240.7 | 259.0 | 237.7 | 254.8 | 231.5 | -9.1 |
| Trois-Rivières | 65.3 | 66.6 | 58.2 | 63.4 | 58.0 | -8.6 |
| South Central Quebec | 57.6 | 57.0 | 53.5 | 51.9 | 46.7 | -10.0 |
| Sherbrooke | 67.2 | 66.7 | 61.9 | 62.1 | 59.0 | -4.9 |
| Montérégie | 195.7 | 218.8 | 207.6 | 210.1 | 184.1 | -12.4 |
| Montréal | 1,289.1 | 1,331.2 | 1,273.9 | 1,288.5 | 1,114.3 | -13.5 |
| Central Quebec | 569.7 | 585.3 | 533.1 | 596.1 | 519.9 | -12.8 |
| North Western Quebec | 176.4 | 180.1 | 164.2 | 163.6 | 149.0 | -8.9 |
| Lower Saint Lawrence and North Shore | 390.9 | 397.4 | 372.8 | 370.3 | 311.7 | -15.8 |
| Hull | 89.7 | 95.1 | 91.9 | 91.4 | 80.4 | -12.1 |
| Chicoutimi-Jonquière | 91.0 | 101.0 | 85.6 | 83.6 | 71.2 | -14.8 |
| Ottawa | 333.4 | 352.9 | 341.9 | 344.7 | 328.2 | -4.8 |
| Eastern Ontario | 217.3 | 238.4 | 229.5 | 231.2 | 222.2 | -3.9 |
| Kingston | 51.4 | 46.0 | 48.1 | 47.7 | 47.2 | -1.0 |
| Central Ontario | 487.6 | 503.2 | 505.7 | 541.4 | 495.8 | -8.4 |
| Oshawa | 162.7 | 167.4 | 167.5 | 181.8 | 153.1 | -15.8 |
| Toronto | 2,161.6 | 2,224.3 | 2,178.7 | 2,244.7 | 2,087.5 | -7.0 |
| Hamilton | 258.6 | 275.6 | 275.9 | 289.9 | 270.8 | -6.6 |
| St. Catharines | 164.1 | 163.1 | 168.8 | 174.3 | 154.1 | -11.6 |
| London | 179.3 | 174.5 | 169.7 | 193.3 | 177.1 | -8.4 |
| Niagara | 142.2 | 166.7 | 154.9 | 159.5 | 156.6 | -1.8 |
| Windsor | 129.6 | 147.5 | 108.2 | 125.7 | 135.6 | +7.9 |
| Kitchener | 202.2 | 194.7 | 199.1 | 210.4 | 206.8 | -1.7 |
| Huron | 142.4 | 148.1 | 162.2 | 166.0 | 147.8 | -10.9 |
| South Central Ontario | 165.2 | 169.4 | 177.3 | 189.2 | 189.7 | +0.3 |
| Sudbury | 69.2 | 75.4 | 94.2 | 84.0 | 70.5 | -16.1 |
| Thunder Bay | 54.5 | 55.9 | 55.3 | 57.3 | 51.6 | -10.0 |
| Northern Ontario | 349.1 | 375.2 | 406.2 | 416.7 | 345.7 | -17.0 |
| Winnipeg | 272.4 | 321.0 | 312.1 | 332.4 | 326.0 | -1.9 |
| Southern Manitoba | 122.1 | 143.0 | 152.5 | 155.0 | 156.5 | +1.0 |
| Northern Manitoba | 103.6 | 109.3 | 122.6 | 144.0 | 136.7 | -5.0 |
| Regina | 76.8 | 93.7 | 106.6 | 118.0 | 109.0 | -7.6 |
| Saskatoon | 111.3 | 144.1 | 177.0 | 187.0 | 160.2 | -14.3 |
| Southern Saskatchewan | 106.2 | 142.8 | 169.9 | 170.9 | 147.2 | -13.9 |
| Northern Saskatchewan | 143.0 | 192.2 | 217.9 | 225.0 | 208.2 | -7.5 |
| Calgary | 510.1 | 786.2 | 1,057.4 | 917.0 | 716.3 | -21.9 |
| Edmonton | 515.4 | 781.3 | 1,037.9 | 922.1 | 785.2 | -14.8 |
| Northern Alberta | 139.3 | 225.5 | 323.4 | 236.9 | 199.2 | -15.9 |
| Southern Alberta | 342.3 | 569.3 | 739.5 | 579.3 | 470.3 | -18.8 |
| Southern Interior British Columbia | 321.9 | 386.2 | 439.6 | 433.6 | 380.8 | -12.2 |
| Abbotsford | 86.7 | 88.6 | 93.0 | 93.3 | 82.7 | -11.3 |
| Vancouver | 852.0 | 866.0 | 830.6 | 867.7 | 810.7 | -6.6 |
| Victoria | 115.5 | 124.0 | 119.8 | 119.5 | 112.9 | -5.5 |
| Southern Coastal British Columbia | 258.9 | 297.7 | 279.6 | 281.9 | 258.3 | -8.4 |
| Northern British Columbia | 227.9 | 268.6 | 301.6 | 293.4 | 232.7 | -20.7 |
| Yukon2 | 24.0 | 2.7 | n/a | n/a | n/a | n/a |
| Whitehorse2 | 3.2 | 14.3 | 18.4 | 19.0 | 15.9 | -16.0 |
| Yukon (excluding Whitehorse)2 | 3.2 | 9.0 | 8.9 | 8.8 | 9.1 | +3.5 |
| Northwest Territories2 | 24.8 | 3.6 | n/a | n/a | n/a | n/a |
| Yellowknife2 | 1.2 | 7.7 | 10.1 | 9.3 | 10.1 | +7.8 |
| Northwest Territories (excluding Yellowknife)2 | 3.3 | 17.5 | 19.8 | 21.5 | 21.1 | -2.1 |
| Nunavut2 | 12.8 | 1.3 | n/a | n/a | n/a | n/a |
| Iqualuit2 | 0.6 | 2.7 | 3.0 | 4.1 | 3.9 | -5.1 |
| Nunavut (excluding Iqaluit)2 | 1.7 | 12.1 | 14.6 | 19.5 | 17.1 | -12.4 |
| Canada | 15,804.1 | 17,662.0 | 18,461.0 | 18,654.7 | 16,685.3 | -10.6 |
- Note: Data may not add up to the total due to rounding. Percentage change is based on unrounded numbers. Includes all claims for which at least $1 of EI benefits was paid.
- 1 Excludes Family caregiver benefits for adults and children due to the incompatibility of administrative data sources.
- 2 As of October 12, 2014, there is a total of 62 Employment Insurance (EI) economic regions, instead of 58 regions. The EI economic regions of Prince Edward Island, Yukon, the Northwest Territories and Nunavut were each divided into 2 EI economic regions, 1 consisting of the capital area and the remaining consisting of the non-capital area. Amounts paid were registered in FY1516 in the 4 former EI economic regions in spite of the change in EI economic region boundaries because some claims established just prior to that change had continued to be paid in FY1516.
- Source: Employment and Social Development Canada, Employment Insurance (EI) administrative data. Data are based on a 10% sample of EI administrative data.
Annex 2.5 – Regular benefits
| Category | FY1415 | FY1516 | FY1617 | FY1718 | FY1819 | Change (%)
FY1718 to FY1819 |
|---|---|---|---|---|---|---|
| Newfoundland and Labrador | 63,410 | 67,880 | 55,590 | 62,170 | 66,680 | +7.3 |
| Prince Edward Island | 16,560 | 16,790 | 16,910 | 16,430 | 15,540 | -5.4 |
| Nova Scotia | 60,730 | 62,020 | 62,610 | 63,880 | 61,800 | -3.3 |
| New Brunswick | 68,930 | 72,030 | 70,120 | 70,610 | 68,320 | -3.2 |
| Quebec | 423,840 | 422,200 | 405,460 | 399,080 | 384,500 | -3.7 |
| Ontario | 391,380 | 390,830 | 366,810 | 373,130 | 363,620 | -2.5 |
| Manitoba | 37,280 | 41,810 | 39,310 | 40,230 | 42,610 | +5.9 |
| Saskatchewan | 31,500 | 39,580 | 34,090 | 35,190 | 37,570 | +6.8 |
| Alberta | 105,780 | 167,800 | 141,140 | 112,400 | 127,090 | +13.1 |
| British Columbia | 139,040 | 146,080 | 124,830 | 122,410 | 120,860 | -1.3 |
| Yukon | 1,880 | 1,840 | 1,750 | 1,610 | 1,640 | +1.9 |
| Northwest Territories | 1,680 | 1,550 | 1,740 | 1,760 | 1,580 | -10.2 |
| Nunavut | 600 | 680 | 770 | 810 | 810 | +11.1 |
| Men | 826,410 | 896,610 | 806,660 | 788,880 | 791,220 | +0.3 |
| Women | 516,200 | 534,480 | 514,470 | 510,830 | 501,490 | -1.8 |
| 24 years old and under | 129,700 | 140,640 | 126,880 | 118,750 | 113,780 | -4.2 |
| 25 to 44 years old | 592,390 | 639,540 | 588,420 | 571,930 | 568,800 | -0.5 |
| 45 to 54 years old | 323,840 | 329,800 | 298,500 | 289,420 | 278,900 | -3.6 |
| 55 years old and over | 296,680 | 321,110 | 307,330 | 319,610 | 331,230 | +3.6 |
| Long-tenured workers1 | 261,760 | 380,460 | 329,290 | 310,270 | 294,820 | -5.0 |
| Occasional claimants1 | 776,150 | 742,840 | 706,150 | 699,370 | 700,580 | +0.2 |
| Frequent claimants1 | 304,700 | 307,790 | 285,690 | 290,070 | 297,310 | +2.5 |
| Canada | 1,342,610 | 1,431,090 | 1,321,130 | 1,299,710 | 1,292,710 | -0.5 |
- Note: Includes claims for which at least $1 of EI regular benefits was paid.
- 1 See Annex-2.1 for definitions related to EI claimant categories.
- Source: Employment and Social Development Canada, Employment Insurance (EI) administrative data. Data are based on a 10% sample of EI administrative data.
| Category | FY1415 | FY1516 | FY1617 | FY1718 | FY1819p | Change (%)
FY1718 to FY1819 |
|---|---|---|---|---|---|---|
| Newfoundland and Labrador | 25.8 | 26.0 | 31.8 | 32.7r | 28.4 | -12.9 |
| Prince Edward Island | 22.8 | 23.3 | 23.3 | 23.1r | 22.2 | -3.9 |
| Nova Scotia | 23.1 | 23.7 | 23.3 | 22.7r | 21.8 | -3.8 |
| New Brunswick | 23.8 | 24.0 | 23.6 | 22.4r | 20.4 | -9.2 |
| Quebec | 18.7 | 18.6 | 18.2 | 16.8r | 15.4 | -8.7 |
| Ontario | 19.0 | 18.3 | 18.9 | 17.6r | 16.7 | -5.2 |
| Manitoba | 17.2 | 17.9 | 19.3 | 19.3r | 18.4 | -4.7 |
| Saskatchewan | 18.2 | 18.3 | 24.8 | 26.0r | 22.5 | -13.5 |
| Alberta | 16.4 | 17.4 | 24.5 | 28.5r | 21.3 | -25.2 |
| British Columbia | 18.5 | 18.4 | 20.3 | 19.9r | 17.6 | -11.1 |
| Yukon | 24.2 | 21.6 | 21.0 | 21.7r | 19.4 | -10.8 |
| Northwest Territories | 24.2 | 26.6 | 21.6 | 22.3 | 22.5 | +1.2 |
| Nunavut | 31.4 | 27.0 | 31.2 | 32.8r | 28.2 | -14.1 |
| Men | 19.6 | 19.6 | 20.9 | 20.5r | 18.4 | -10.2 |
| Women | 19.2 | 18.9 | 20.3 | 19.8r | 17.9 | -9.6 |
| 24 years old and under | 17.6 | 17.6 | 18.7 | 17.7r | 16.3 | -8.3 |
| 25 to 44 years old | 18.6 | 18.5 | 19.6 | 19.3r | 17.2 | -10.7 |
| 45 to 54 years old | 19.9 | 19.8 | 21.4 | 20.9r | 18.8 | -9.9 |
| 55 years old and over | 21.3 | 21.1 | 22.9 | 22.5r | 20.3 | -9.7 |
| Long-tenured workers2 | 18.0 | 17.4 | 20.0 | 21.1r | 17.7 | -15.8 |
| Occasional claimants2 | 18.9 | 19.0 | 20.1 | 19.1r | 17.6 | -8.1 |
| Frequent claimants2 | 22.0 | 22.1 | 23.1 | 22.1r | 20.5 | -7.4 |
| Canada | 19.4 | 19.3 | 20.7 | 20.3r | 18.2 | -9.9 |
- Note: Percentage change is based on unrounded numbers. Includes claims for which at least $1 of EI regular benefits was paid.
- 1 The reported duration estimates are based on completed claims that included those that are terminated and those that are dormant and remained inactive as of August the following fiscal year.
- 2 See Annex-2.1 for definitions related to EI claimant categories.
- r Revised.
- p Preliminary.
- Source: Employment and Social Development Canada, Employment Insurance (EI) administrative data. Data are based on a 10% sample of EI administrative data.
| Category | FY1415 | FY1516 | FY1617 | FY1718 | FY1819 | Change (%)
FY1718 to FY1819 |
|---|---|---|---|---|---|---|
| Newfoundland and Labrador | 430 | 444 | 434 | 447 | 456 | +1.9 |
| Prince Edward Island | 407 | 419 | 419 | 426 | 433 | +1.5 |
| Nova Scotia | 417 | 423 | 422 | 427 | 433 | +1.5 |
| New Brunswick | 413 | 426 | 430 | 437 | 447 | +2.2 |
| Quebec | 426 | 434 | 440 | 450 | 462 | +2.6 |
| Ontario | 435 | 445 | 454 | 462 | 477 | +3.2 |
| Manitoba | 424 | 438 | 441 | 449 | 456 | +1.5 |
| Saskatchewan | 458 | 472 | 468 | 471 | 481 | +2.0 |
| Alberta | 484 | 495 | 493 | 496 | 507 | +2.1 |
| British Columbia | 434 | 449 | 451 | 459 | 472 | +2.9 |
| Yukon | 478 | 494 | 501 | 500 | 519 | +3.8 |
| Northwest Territories | 498 | 507 | 511 | 527 | 523 | -0.7 |
| Nunavut | 472 | 469 | 486 | 514 | 502 | -2.5 |
| Men | 458 | 470 | 474 | 481 | 493 | +2.4 |
| Women | 395 | 406 | 412 | 419 | 432 | +3.1 |
| 24 years old and under | 405 | 419 | 412 | 416 | 433 | +4.1 |
| 25 to 44 years old | 445 | 458 | 462 | 470 | 481 | +2.3 |
| 45 to 54 years old | 437 | 449 | 454 | 463 | 475 | +2.7 |
| 55 years old and over | 420 | 431 | 435 | 442 | 455 | +3.0 |
| Long-tenured workers2 | 472 | 482 | 489 | 495 | 503 | +1.6 |
| Occasional claimants2 | 420 | 428 | 429 | 437 | 452 | +3.4 |
| Frequent claimants2 | 436 | 446 | 453 | 464 | 477 | +2.7 |
| Canada | 433 | 446 | 449 | 457 | 469 | +2.7 |
- Note: Percentage change is based on unrounded numbers. Includes claims for which at least $1 of EI regular benefits was paid.
- 1 Takes into account Family Supplement top-ups paid to claimants with regular benefits.
- 2 See Annex-2.1 for definitions related to EI claimant categories.
- Source: Employment and Social Development Canada, Employment Insurance (EI) administrative data. Data are based on a 10% sample of EI administrative data.
| Category | FY1415 | FY1516 | FY1617 | FY1718 | FY1819 | Change (%)
FY1718 to FY1819 |
|---|---|---|---|---|---|---|
| Newfoundland and Labrador | 666.5 | 749.5 | 822.2 | 953.6 | 799.2 | -16.2 |
| Prince Edward Island | 147.5 | 162.6 | 161.2 | 175.5 | 160.3 | -8.6 |
| Nova Scotia | 534.1 | 603.0 | 595.5 | 642.5 | 595.2 | -7.4 |
| New Brunswick | 640.9 | 712.5 | 703.0 | 729.6 | 632.2 | -13.3 |
| Quebec | 3,115.2 | 3,227.0 | 2,974.1 | 3,043.3 | 2,577.5 | -15.3 |
| Ontario | 3,093.1 | 3,200.8 | 3,069.9 | 3,183.3 | 2,775.9 | -12.8 |
| Manitoba | 277.2 | 338.3 | 352.1 | 386.2 | 371.1 | -3.9 |
| Saskatchewan | 246.3 | 361.3 | 450.8 | 473.3 | 393.0 | -17.0 |
| Alberta | 746.9 | 1,499.9 | 2,274.7 | 1,804.8 | 1,331.3 | -26.2 |
| British Columbia | 1,081.5 | 1,219.0 | 1,217.0 | 1,193.0 | 988.5 | -17.1 |
| Yukon | 22.7 | 18.7 | 18.8 | 18.9 | 16.5 | -12.9 |
| Northwest Territories | 20.5 | 20.2 | 19.3 | 20.8 | 21.4 | +3.0 |
| Nunavut | 9.5 | 9.4 | 11.5 | 15.8 | 11.7 | -25.7 |
| Men | 7,032.7 | 8,253.4 | 8,612.3 | 8,359.3 | 7,072.5 | -15.4 |
| Women | 3,569.3 | 3,868.8 | 4,057.8 | 4,281.2 | 3,601.3 | -15.9 |
| 24 years old and under | 966.1 | 1,153.7 | 1,158.1 | 1,076.1 | 922.7 | -14.3 |
| 25 to 44 years old | 4,603.5 | 5,345.2 | 5,548.9 | 5,449.7 | 4,585.2 | -15.9 |
| 45 to 54 years old | 2,604.6 | 2,844.6 | 2,921.7 | 2,876.7 | 2,335.9 | -18.8 |
| 55 years old and over | 2,427.9 | 2,778.8 | 3,041.3 | 3,238.0 | 2,830.0 | -12.6 |
| Long-tenured workers2 | 2,136.9 | 3,141.1 | 3,681.5 | 3,343.6 | 2,467.4 | -26.2 |
| Occasional claimants2 | 5,735.6 | 6,118.7 | 6,220.2 | 6,272.5 | 5,505.2 | -12.2 |
| Frequent claimants2 | 2,729.5 | 2,862.3 | 2,768.4 | 3,024.4 | 2,701.2 | -10.7 |
| Canada | 10,602.0 | 12,122.2 | 12670.1 | 12,640.5 | 10,673.8 | -15.6 |
- Note: Totals may not add up due to rounding. Percentage change is based on unrounded numbers. Includes claims for which at least $1 of EI regular benefits was paid.
- 1 Takes into account Family Supplement top-ups paid to claimants with regular benefits. Includes benefits paid for training purposes under section 25 of the Employment Insurance Act.
- 2 See Annex-2.1 for definitions related to EI claimant categories.
- Source: Employment and Social Development Canada, Employment Insurance (EI) administrative data. Data are based on a 10% sample of EI administrative data.
Annex 2.6 – Regular benefits (by industry)
| Industry | FY1415 | FY1516 | FY1617 | FY1718 | FY1819 | Change (%)
FY1718 to FY1819 |
|---|---|---|---|---|---|---|
| Goods-producing industries | 511,030 | 565,610 | 484,720 | 502,080 | 505,200 | +0.6 |
| Agriculture, forestry, fishing and hunting | 56,880 | 57,360 | 51,910 | 53,760 | 52,440 | -2.5 |
| Mining and oil and gas extraction | 28,900 | 38,250 | 24,430 | 21,340 | 24,980 | +17.1 |
| Utilities | 4,420 | 4,230 | 3,980 | 4,150 | 4,150 | 0.0 |
| Construction | 274,140 | 316,290 | 273,380 | 288,870 | 292,720 | +1.3 |
| Manufacturing | 146,690 | 149,480 | 131,020 | 133,960 | 130,910 | -2.3 |
| Service-producing industries | 748,370 | 821,740 | 762,630 | 764,150 | 764,220 | 0.0 |
| Wholesale trade | 44,050 | 48,240 | 43,600 | 39,790 | 38,920 | -2.2 |
| Retail trade | 72,850 | 83,500 | 76,300 | 79,090 | 69,330 | -12.3 |
| Transportation and warehousing | 56,270 | 67,950 | 59,470 | 60,190 | 62,640 | +4.1 |
| Finance and insurance | 13,820 | 15,500 | 14,080 | 15,020 | 12,630 | -15.9 |
| Real estate and rental and leasing | 18,030 | 20,220 | 18,640 | 17,720 | 18,270 | +3.1 |
| Professional, scientific and technical services | 54,690 | 61,630 | 54,190 | 52,690 | 50,950 | -3.3 |
| Business, building and support services1 | 93,310 | 100,250 | 88,740 | 86,380 | 88,130 | +2.0 |
| Educational services | 146,040 | 156,100 | 153,460 | 157,110 | 163,030 | +3.8 |
| Health care and social assistance | 47,160 | 47,610 | 45,740 | 46,590 | 45,870 | -1.5 |
| Information, culture and recreation2 | 39,470 | 41,320 | 38,030 | 39,080 | 40,250 | +3.0 |
| Accommodation and food services | 58,550 | 63,840 | 60,630 | 63,840 | 63,280 | -0.9 |
| Other services (except public administration) | 40,730 | 45,900 | 42,020 | 40,340 | 42,010 | +4.1 |
| Public administration | 63,400 | 69,680 | 67,730 | 66,310 | 68,910 | +3.9 |
| Unclassified3 | 83,210 | 43,740 | 73,780 | 33,480 | 23,290 | -30.4 |
| Canada | 1,342,610 | 1,431,090 | 1,321,130 | 1,299,710 | 1,292,710 | -0.5 |
- Note: Includes claims for which at least $1 of EI regular benefits was paid.
- 1 This industry sector comprises the industries with codes 55 (Management of companies and enterprises) and 56 (Administrative and support, waste management and remediation services) from the North American Industry Classification System.
- 2 This industry sector comprises the industries with codes 51 (Information and cultural industries) and 71 (Arts, entertainment and recreation) from the North American Industry Classification System.
- 3 For some claims, this information was not available in the data.
- Source: Employment and Social Development Canada, Employment Insurance (EI) administrative data. Data are based on a 10% sample of EI administrative data.
| Industry | FY1415 | FY1516 | FY1617 | FY1718r | FY1819p | Change (%)
FY1718 to FY1819 |
|---|---|---|---|---|---|---|
| Goods-producing industries | 19.1 | 19.3 | 20.7 | 20.1 | 17.9 | -10.9 |
| Agriculture, forestry, fishing and hunting | 21.4 | 21.6 | 22.0 | 22.0 | 20.4 | -7.2 |
| Mining and oil and gas extraction | 20.7 | 20.8 | 23.9 | 26.9 | 21.0 | -21.8 |
| Utilities | 18.5 | 17.6 | 18.4 | 19.3 | 16.4 | -14.6 |
| Construction | 18.1 | 18.4 | 19.6 | 19.3 | 17.3 | -10.4 |
| Manufacturing | 20.0 | 20.0 | 21.9 | 19.8 | 17.8 | -10.4 |
| Service-producing industries | 19.5 | 19.3 | 20.5 | 20.2 | 18.4 | -9.3 |
| Wholesale trade | 23.1 | 22.7 | 23.7 | 23.9 | 21.7 | -9.2 |
| Retail trade | 22.2 | 21.9 | 22.8 | 22.8 | 21.1 | -7.2 |
| Transportation and warehousing | 19.1 | 18.9 | 20.9 | 20.1 | 18.3 | -9.1 |
| Finance and insurance | 24.4 | 23.3 | 24.3 | 24.3 | 23.7 | -2.2 |
| Real estate and rental and leasing | 22.3 | 22.0 | 22.9 | 24.0 | 21.0 | -12.6 |
| Professional, scientific and technical services | 21.2 | 20.9 | 22.7 | 22.4 | 19.5 | -12.8 |
| Business, building and support services2 | 21.3 | 21.2 | 22.0 | 21.4 | 19.6 | -8.1 |
| Educational services | 11.7 | 11.9 | 12.4 | 12.5 | 11.8 | -6.2 |
| Health care and social assistance | 21.2 | 21.0 | 22.3 | 21.4 | 19.7 | -7.7 |
| Information, culture and recreation3 | 20.4 | 20.0 | 20.7 | 20.9 | 18.9 | -9.4 |
| Accommodation and food services | 22.0 | 22.1 | 22.7 | 22.6 | 20.8 | -8.2 |
| Other services (except public administration) | 21.1 | 20.9 | 22.4 | 22.4 | 20.0 | -11.0 |
| Public administration | 20.4 | 20.1 | 21.7 | 22.0 | 20.0 | -9.1 |
| Unclassified4 | 22.4 | 19.7 | 22.8 | 22.9 | 20.8 | -9.2 |
| Canada | 19.4 | 19.3 | 20.7 | 20.3 | 18.2 | -9.9 |
- Note: Percentage change is based on unrounded numbers. Includes claims for which at least $1 of EI regular benefits was paid.
- 1 The reported duration estimates are based on completed claims that included those that are terminated and those that are dormant and remained inactive as of August the following fiscal year.
- 2 This industry sector comprises the industries with codes 55 (Management of companies and enterprises) and 56 (Administrative and support, waste management and remediation services) from the North American Industry Classification System.
- 3 This industry sector comprises the industries with codes 51 (Information and cultural industries) and 71 (Arts, entertainment and recreation) from the North American Industry Classification System.
- 4 For some claims, this information was not available in the data.
- r Revised.
- p Preliminary.
- Source: Employment and Social Development Canada, Employment Insurance (EI) administrative data. Data are based on a 10% sample of EI administrative data.
| Industry | FY1415 | FY1516 | FY1617 | FY1718 | FY1819 | Change (%)
FY1718 to FY1819 |
|---|---|---|---|---|---|---|
| Goods-producing industries | 467 | 480 | 485 | 493 | 503 | +2.1 |
| Agriculture, forestry, fishing and hunting | 416 | 429 | 431 | 441 | 459 | +4.0 |
| Mining and oil and gas extraction | 510 | 522 | 528 | 531 | 541 | +1.8 |
| Utilities | 501 | 516 | 524 | 532 | 538 | +1.3 |
| Construction | 487 | 498 | 505 | 512 | 521 | +1.6 |
| Manufacturing | 439 | 448 | 453 | 464 | 474 | +2.2 |
| Service-producing industries | 413 | 425 | 430 | 434 | 447 | +3.0 |
| Wholesale trade | 424 | 440 | 447 | 449 | 462 | +2.9 |
| Retail trade | 368 | 374 | 386 | 386 | 405 | +4.9 |
| Transportation and warehousing | 403 | 425 | 417 | 420 | 431 | +2.7 |
| Finance and insurance | 445 | 462 | 463 | 481 | 493 | +2.5 |
| Real estate and rental and leasing | 421 | 432 | 440 | 449 | 469 | +4.3 |
| Professional, scientific and technical services | 463 | 479 | 482 | 488 | 497 | +1.7 |
| Business, building and support services2 | 409 | 419 | 422 | 429 | 447 | +4.2 |
| Educational services | 449 | 457 | 466 | 473 | 479 | +1.3 |
| Health care and social assistance | 394 | 402 | 408 | 414 | 423 | +2.1 |
| Information, culture and recreation3 | 401 | 413 | 414 | 418 | 435 | +4.1 |
| Accommodation and food services | 341 | 352 | 355 | 359 | 374 | +4.3 |
| Other services (except public administration) | 394 | 416 | 418 | 422 | 439 | +4.0 |
| Public administration | 437 | 446 | 451 | 460 | 468 | +1.7 |
| Unclassified4 | 412 | 419 | 423 | 427 | 440 | +3.1 |
| Canada | 433 | 446 | 449 | 457 | 469 | +2.7 |
- Note: Percentage change is based on unrounded numbers. Includes claims for which at least $1 of EI regular benefits was paid.
- 1 Takes into account Family Supplement top-ups paid to claimants with regular benefits.
- 2 This industry sector comprises the industries with codes 55 (Management of companies and enterprises) and 56 (Administrative and support, waste management and remediation services) from the North American Industry Classification System.
- 3 This industry sector comprises the industries with codes 51 (Information and cultural industries) and 71 (Arts, entertainment and recreation) from the North American Industry Classification System.
- 4 For some claims, this information was not available in the data.
- Source: Employment and Social Development Canada, Employment Insurance (EI) administrative data. Data are based on a 10% sample of EI administrative data.
| Industry | FY1415 | FY1516 | FY1617 | FY1718 | FY1819 | Change (%)
FY1718 to FY1819 |
|---|---|---|---|---|---|---|
| Goods-producing industries | 4,379.8 | 5,337.1 | 5,397.7 | 5,343.6 | 4,473.4 | -16.3 |
| Agriculture, forestry, fishing and hunting | 500.7 | 520.4 | 515.6 | 578.2 | 496.8 | -14.1 |
| Mining and oil and gas extraction | 238.9 | 445.0 | 448.8 | 310.0 | 274.2 | -11.5 |
| Utilities | 41.1 | 39.1 | 42.2 | 48.2 | 36.4 | -24.6 |
| Construction | 2,376.7 | 2,934.7 | 3,001.5 | 3,113.4 | 2,640.3 | -15.2 |
| Manufacturing | 1,222.4 | 1,397.9 | 1,389.6 | 1,293.7 | 1,025.7 | -20.7 |
| Service-producing industries | 5,656.9 | 6,487.5 | 6,687.7 | 6,998.6 | 5,995.6 | -14.3 |
| Wholesale trade | 421.0 | 497.1 | 515.1 | 492.3 | 402.6 | -18.2 |
| Retail trade | 607.0 | 685.4 | 712.3 | 763.4 | 620.9 | -18.7 |
| Transportation and warehousing | 400.3 | 520.5 | 556.8 | 533.3 | 466.0 | -12.6 |
| Finance and insurance | 155.9 | 166.5 | 177.9 | 193.9 | 155.0 | -20.0 |
| Real estate and rental and leasing | 163.7 | 191.8 | 208.1 | 207.3 | 175.4 | -15.4 |
| Professional, scientific and technical services | 505.4 | 630.5 | 666.4 | 601.1 | 479.4 | -20.2 |
| Business, building and support services2 | 787.0 | 881.9 | 876.9 | 871.4 | 768.8 | -11.8 |
| Educational services | 634.6 | 711.6 | 695.1 | 850.0 | 774.6 | -8.9 |
| Health care and social assistance | 362.2 | 371.2 | 389.6 | 424.0 | 349.6 | -17.5 |
| Information, culture and recreation3 | 318.3 | 336.2 | 337.1 | 377.7 | 324.7 | -14.0 |
| Accommodation and food services | 427.2 | 498.2 | 496.3 | 559.9 | 487.2 | -13.0 |
| Other services (except public administration) | 334.4 | 399.4 | 424.4 | 421.5 | 371.7 | -11.8 |
| Public administration | 539.9 | 597.3 | 631.5 | 702.7 | 619.7 | -11.8 |
| Unclassified4 | 565.3 | 297.6 | 584.7 | 298.4 | 204.8 | -31.4 |
| Canada | 10,602.0 | 12,122.2 | 12,670.1 | 12,640.5 | 10,673.8 | -15.6 |
- Note: Totals may not add up due to rounding. Percentage change is based on unrounded numbers. Includes claims for which at least $1 of EI regular benefits was paid.
- 1 Takes into account Family Supplement top-ups paid to claimants with regular benefits. Includes benefits paid for training purposes under section 25 of the Employment Insurance Act.
- 2 This industry sector comprises the industries with codes 55 (Management of companies and enterprises) and 56 (Administrative and support, waste management and remediation services) from the North American Industry Classification System.
- 3 This industry sector comprises the industries with codes 51 (Information and cultural industries) and 71 (Arts, entertainment and recreation) from the North American Industry Classification System.
- 4 For some claims, this information was not available in the data.
- r Revised.
- Source: Employment and Social Development Canada, Employment Insurance (EI) administrative data. Data are based on a 10% sample of EI administrative data.
Annex 2.7 – Regular benefits (by regional unemployment rate and hours of insurable employment from previous employment)
Annex 2.7.1 – Regular benefits (by regional unemployment rate and hours of insurable employment from previous employment): New claims established
For accessibility reasons, the table has been simplified. Consult the PDF version for the full table.
| Regional unemployment rate1 | FY1415 | FY1516 | FY1617 | FY1718 | FY1819 | Change (%)
FY1718 to FY1819 |
|---|---|---|---|---|---|---|
| 6.0% and under | 273,380 | 218,020 | 171,350 | 384,230 | 411,230 | +7.0 |
| 6.1% ~ 7.0% | 158,060 | 363,660 | 363,170 | 425,580 | 479,030 | +12.6 |
| 7.1% ~ 8.0% | 329,870 | 279,030 | 299,000 | 134,750 | 129,350 | -4.0 |
| 8.1% ~ 9.0% | 236,460 | 216,290 | 169,290 | 110,860 | 40,770 | -63.2 |
| 9.1% ~ 10.0% | 78,450 | 75,660 | 65,480 | 31,660 | 13,870 | -56.2 |
| 10.1% ~ 11.0% | 55,950 | 50,430 | 35,420 | 7,990 | 36,950 | +362.5 |
| 11.1% ~ 12.0% | 44,380 | 16,740 | 21,420 | 60,140 | 49,040 | -18.5 |
| 12.1% ~ 13.0% | 7,660 | 43,880 | 35,300 | 13,420 | 4,070 | -69.7 |
| 13.1% ~ 14.0% | 470 | 16,910 | 11,350 | 28,240 | 6,980 | -75.3 |
| 14.1% ~ 15.0% | 25,870 | 23,650 | 38,190 | 24,020 | 17,860 | -25.6 |
| 15.1% ~ 16.0% | 25,100 | 31,980 | 25,370 | 10,270 | 24,980 | +143.2 |
| 16.1% or greater | 106,960 | 94,840 | 85,790 | 68,550 | 78,580 | +14.6 |
- Note: Includes claims for which at least $1 of EI regular benefits was paid.
- 1 Unemployment rates used for the Employment Insurance program are a moving average of seasonally adjusted monthly rates of unemployment produced by Statistics Canada, as per section 17 of the Employment Insurance Regulations.
- Source: Employment and Social Development Canada, Employment Insurance (EI) administrative data. Data are based on a 10% sample of EI administrative data.
| Hours of insurable employment from previous employment | FY1415 | FY1516 | FY1617 | FY1718 | FY1819 | Change (%)
FY1718 to FY1819 |
|---|---|---|---|---|---|---|
| 420 to 559 | 15,540 | 16,070 | 20,010 | 18,660 | 18,220 | -2.4 |
| 560 to 699 | 48,850 | 51,100 | 56,330 | 47,490 | 41,930 | -11.7 |
| 700 to 839 | 88,530 | 91,000 | 102,770 | 104,810 | 102,040 | -2.6 |
| 840 to 979 | 115,160 | 116,610 | 113,880 | 110,790 | 110,600 | -0.2 |
| 980 to 1,119 | 127,920 | 132,800 | 119,850 | 114,140 | 117,460 | +2.9 |
| 1,120 to 1,259 | 128,290 | 131,700 | 122,760 | 120,710 | 122,190 | +1.2 |
| 1,260 to 1,399 | 117,920 | 126,290 | 113,860 | 114,510 | 114,270 | -0.2 |
| 1,400 to 1,539 | 127,610 | 134,580 | 125,170 | 125,090 | 129,220 | +3.3 |
| 1,540 to 1,679 | 109,360 | 115,230 | 103,540 | 105,730 | 106,130 | +0.4 |
| 1,680 to 1,819 | 109,480 | 119,890 | 103,900 | 106,150 | 107,350 | +1.1 |
| 1,820 or more | 353,950 | 395,820 | 339,060 | 331,630 | 323,300 | -2.5 |
| Canada | 1,342,610 | 1,431,090 | 1,321,130 | 1,299,710 | 1,292,710 | -0.5 |
- Note: Includes claims for which at least $1 of EI regular benefits was paid.
- Source: Employment and Social Development Canada, Employment Insurance (EI) administrative data. Data are based on a 10% sample of EI administrative data.
Annex 2.7.2 – Regular benefits (by regional unemployment rate and hours of insurable employment from previous employment): Average actual duration (number of weeks)
For accessibility reasons, the table has been simplified. Consult the PDF version for the full table.
| Regional unemployment rate2 | FY1415 | FY1516 | FY1617 | FY1718 | FY1819p | Change (%)
FY1718 to FY1819 |
|---|---|---|---|---|---|---|
| 6.0% and under | 15.7 | 17.2 | 19.0 | 14.8r | 15.3 | +3.8 |
| 6.1% ~ 7.0% | 18.0 | 15.9 | 18.9 | 17.5r | 15.5 | -11.0 |
| 7.1% ~ 8.0% | 18.2 | 19.2 | 18.9 | 19.9r | 19.1 | -3.9 |
| 8.1% ~ 9.0% | 19.5 | 19.4 | 19.7 | 23.4 | 22.3 | -4.8 |
| 9.1% ~ 10.0% | 19.7 | 19.2 | 21.0 | 22.7r | 23.1 | +2.1 |
| 10.1% ~ 11.0% | 21.4 | 21.3 | 22.9 | 22.5 | 20.4 | -9.6 |
| 11.1% ~ 12.0% | 21.2 | 23.8 | 24.9 | 25.8r | 23.2 | -10.2 |
| 12.1% ~ 13.0% | 23.6 | 19.8 | 24.2 | 30.2r | 28.3 | -6.3 |
| 13.1% ~ 14.0% | 25.1 | 19.7 | 24.0 | 22.5r | 23.6 | +5.0 |
| 14.1% ~ 15.0% | 26.7 | 27.9 | 26.1 | 25.9r | 25.9 | -0.1 |
| 15.1% ~ 16.0% | 28.0 | 26.6 | 28.6 | 26.8r | 25.1 | -6.5 |
| 16.1% or greater | 25.2 | 26.4 | 32.0 | 33.1r | 29.5 | -10.8 |
- Note: Percentage change is based on unrounded numbers. Includes claims for which at least $1 of EI regular benefits was paid.
- 1 The reported duration estimates are based on completed claims that included those that are terminated and those that are dormant and remained inactive as of August the following fiscal year.
- 2 Unemployment rates used for the Employment Insurance program are a moving average of seasonally adjusted monthly rates of unemployment produced by Statistics Canada, as per section 17 of the Employment Insurance Regulations.
- r Revised.
- p Preliminary.
- Source: Employment and Social Development Canada, Employment Insurance (EI) administrative data. Data are based on a 10% sample of EI administrative data.
| Hours of insurable employment from previous employment | FY1415 | FY1516 | FY1617 | FY1718 | FY1819 | Change (%)
FY1718 to FY1819 |
|---|---|---|---|---|---|---|
| 420 to 559 | 25.9 | 26.6 | 28.3 | 28.6 | 26.1 | -8.7 |
| 560 to 699 | 20.6 | 20.8 | 21.6 | 22.2r | 20.6 | -7.1 |
| 700 to 839 | 18.8 | 18.5 | 19.2 | 18.7r | 16.7 | -10.5 |
| 840 to 979 | 19.4 | 19.2 | 20.4 | 19.7r | 17.8 | -9.3 |
| 980 to 1,119 | 19.4 | 19.0 | 20.2 | 19.7r | 18.1 | -7.9 |
| 1,120 to 1,259 | 18.5 | 18.4 | 19.6 | 19.3r | 17.6 | -8.6 |
| 1,260 to 1,399 | 18.2 | 17.8 | 19.2 | 18.5r | 17.3 | -6.2 |
| 1,400 to 1,539 | 16.7 | 16.8 | 17.8 | 17.2r | 15.8 | -7.6 |
| 1,540 to 1,679 | 18.4 | 18.3 | 19.4 | 18.9r | 17.2 | -9.4 |
| 1,680 to 1,819 | 19.8 | 19.6 | 21.2 | 20.4r | 18.0 | -11.5 |
| 1,820 or more | 21.2 | 21.1 | 22.8 | 22.7r | 20.0 | -11.6 |
| Canada | 19.4 | 19.3 | 20.7 | 20.3r | 18.2 | -9.9 |
- Note: Percentage change is based on unrounded numbers. Includes claims for which at least $1 of EI regular benefits was paid.
- 1 The reported duration estimates are based on completed claims that included those that are terminated and those that are dormant and remained inactive as of August the following fiscal year.
- r Revised.
- p Preliminary.
- Source: Employment and Social Development Canada, Employment Insurance (EI) administrative data. Data are based on a 10% sample of EI administrative data.
Annex 2.7.3 – Regular benefits (by regional unemployment rate and hours of insurable employment from previous employment): Average weekly benefit rate ($)
For accessibility reasons, the table has been simplified. Consult the PDF version for the full table.
| Regional unemployment rate2 | FY1415 | FY1516 | FY1617 | FY1718 | FY1819 | Change (%)
FY1718 to FY1819 |
|---|---|---|---|---|---|---|
| 6.0% and under | 452 | 452 | 454 | 459 | 471 | +2.8 |
| 6.1% ~ 7.0% | 433 | 456 | 453 | 454 | 472 | +3.9 |
| 7.1% ~ 8.0% | 428 | 439 | 446 | 468 | 466 | -0.5 |
| 8.1% ~ 9.0% | 426 | 443 | 451 | 460 | 476 | +3.4 |
| 9.1% ~ 10.0% | 436 | 427 | 443 | 462 | 491 | +6.1 |
| 10.1% ~ 11.0% | 430 | 447 | 466 | 462 | 474 | +2.5 |
| 11.1% ~ 12.0% | 419 | 481 | 449 | 456 | 459 | +0.8 |
| 12.1% ~ 13.0% | 434 | 448 | 478 | 461 | 472 | +2.3 |
| 13.1% ~ 14.0% | 506 | 442 | 432 | 448 | 457 | +2.2 |
| 14.1% ~ 15.0% | 422 | 431 | 429 | 436 | 443 | +1.4 |
| 15.1% ~ 16.0% | 431 | 433 | 443 | 442 | 456 | +3.2 |
| 16.1% or greater | 429 | 444 | 433 | 445 | 455 | +2.3 |
- Note: Percentage change is based on unrounded numbers. Includes claims for which at least $1 of EI regular benefits was paid.
- 1 Takes into account Family Supplement top-ups paid to claimants with regular benefits.
- 2 Unemployment rates used for the Employment Insurance program are a moving average of seasonally adjusted monthly rates of unemployment produced by Statistics Canada, as per section 17 of the Employment Insurance Regulations.
- Source: Employment and Social Development Canada, Employment Insurance (EI) administrative data. Data are based on a 10% sample of EI administrative data.
| Hours of insurable employment from previous employment | FY1415 | FY1516 | FY1617 | FY1718 | FY1819 | Change (%)
FY1718 to FY1819 |
|---|---|---|---|---|---|---|
| 420 to 559 | 328 | 340 | 334 | 333 | 342 | +2.8 |
| 560 to 699 | 353 | 369 | 365 | 370 | 382 | +3.3 |
| 700 to 839 | 367 | 379 | 380 | 377 | 388 | +2.9 |
| 840 to 979 | 387 | 397 | 402 | 405 | 421 | +4.0 |
| 980 to 1,119 | 402 | 411 | 417 | 424 | 441 | +3.8 |
| 1,120 to 1,259 | 417 | 427 | 436 | 445 | 457 | +2.6 |
| 1,260 to 1,399 | 434 | 446 | 451 | 462 | 473 | +2.4 |
| 1,400 to 1,539 | 452 | 462 | 472 | 481 | 493 | +2.5 |
| 1,540 to 1,679 | 452 | 463 | 472 | 482 | 493 | +2.3 |
| 1,680 to 1,819 | 457 | 471 | 478 | 488 | 498 | +2.2 |
| 1,820 or more | 478 | 491 | 499 | 505 | 516 | +2.2 |
| Canada | 433 | 446 | 449 | 457 | 469 | +2.7 |
- Note: Percentage change is based on unrounded numbers. Includes claims for which at least $1 of EI regular benefits was paid.
- 1 Takes into account Family Supplement top-ups paid to claimants with regular benefits.
- Source: Employment and Social Development Canada, Employment Insurance (EI) administrative data. Data are based on a 10% sample of EI administrative data.
Annex 2.7.4 – Regular benefits (by regional unemployment rate and hours of insurable employment from previous employment): Amount paid ($ million)
For accessibility reasons, the table has been simplified. Consult the PDF version for the full table.
| Regional unemployment rate2 | FY1314 | FY1415 | FY1516 | FY1617 | FY1718 | Change (%)
FY1718 to FY1819 |
|---|---|---|---|---|---|---|
| 6.0% and under | 2,848.1 | 4,089.6 | 1,381.8 | 2,329.3 | 2,931.4 | +25.9 |
| 6.1% ~ 7.0% | 1,855.8 | 2,836.0 | 3,092.1 | 3,453.9 | 3,341.8 | -3.2 |
| 7.1% ~ 8.0% | 2,661.5 | 1,572.8 | 2,511.9 | 1,751.9 | 1,135.3 | -35.2 |
| 8.1% ~ 9.0% | 461.9 | 727.7 | 2,022.7 | 1,367.9 | 599.1 | -56.2 |
| 9.1% ~ 10.0% | 534.0 | 526.8 | 539.5 | 527.8 | 186.0 | -64.7 |
| 10.1% ~ 11.0% | 444.9 | 194.9 | 337.2 | 275.9 | 287.9 | +4.3 |
| 11.1% ~ 12.0% | 112.5 | 294.4 | 282.4 | 522.9 | 590.9 | +13.0 |
| 12.1% ~ 13.0% | 24.8 | 60.8 | 460.1 | 350.0 | 54.3 | -84.5 |
| 13.1% ~ 14.0% | 227.4 | 235.3 | 165.6 | 275.9 | 118.5 | -57.0 |
| 14.1% ~ 15.0% | 379.2 | 378.3 | 345.7 | 364.1 | 232.6 | -36.1 |
| 15.1% ~ 16.0% | 604.6 | 459.2 | 295.1 | 205.9 | 207.4 | +0.7 |
| 16.1% or greater | 447.4 | 746.2 | 1,235.9 | 1,215.2 | 988.7 | -18.6 |
- Note: Totals may not add up due to rounding. Totals include amounts paid for claims where data on hours of insurable employment are missing. Percentage change is based on unrounded numbers. Includes claims for which at least $1 of EI regular benefits was paid.
- 1 Takes into account Family Supplement top-ups paid to claimants with regular benefits. Includes benefits paid for training purposes under section 25 of the Employment Insurance Act.
- 2 Unemployment rates used for the Employment Insurance program are a moving average of seasonally adjusted monthly rates of unemployment produced by Statistics Canada, as per section 17 of the Employment Insurance Regulations.
- Source: Employment and Social Development Canada, Employment Insurance (EI) administrative data. Data are based on a 10% sample of EI administrative data.
| Hours of insurable employment from previous employment | FY1415 | FY1516 | FY1617 | FY1718 | FY1819 | Change (%)
FY1718 to FY1819 |
|---|---|---|---|---|---|---|
| 420 to 559 | 127.2 | 144.0 | 175.8 | 207.5 | 169.7 | -18.2 |
| 560 to 699 | 361.1 | 380.7 | 437.8 | 460.8 | 351.5 | -23.7 |
| 700 to 839 | 592.5 | 625.3 | 720.0 | 812.3 | 679.4 | -16.4 |
| 840 to 979 | 829.4 | 879.3 | 917.6 | 946.5 | 823.6 | -13.0 |
| 980 to 1,119 | 931.0 | 1,001.5 | 1,002.1 | 1,015.7 | 900.8 | -11.3 |
| 1,120 to 1,259 | 903.0 | 985.0 | 1,001.8 | 1,065.4 | 927.8 | -12.9 |
| 1,260 to 1,399 | 851.0 | 931.2 | 950.8 | 999.5 | 875.9 | -12.4 |
| 1,400 to 1,539 | 872.5 | 976.4 | 996.0 | 1,037.2 | 932.5 | -10.1 |
| 1,540 to 1,679 | 836.3 | 932.8 | 958.5 | 973.3 | 830.0 | -14.7 |
| 1,680 to 1,819 | 924.4 | 1,075.4 | 1,107.4 | 1,076.9 | 915.2 | -15.0 |
| 1,820 or more | 3,373.4 | 4,190.5 | 4,401.8 | 4,045.4 | 3,267.2 | -19.2 |
| Canada | 10,602.0 | 12,122.2 | 12,670.1 | 12,640.5 | 10,673.8 | -15.6 |
- Note: Totals may not add up due to rounding. Totals include amounts paid for claims where data on hours of insurable employment are missing. Percentage change is based on unrounded numbers. Includes claims for which at least $1 of EI regular benefits was paid.
- 1 Takes into account Family Supplement top-ups paid to claimants with regular benefits. Includes benefits paid for training purposes under section 25 of the Employment Insurance Act.
- Source: Employment and Social Development Canada, Employment Insurance (EI) administrative data. Data are based on a 10% sample of EI administrative data.
Annex 2.8 – Regular benefits (by Employment Insurance economic region)
| EI economic region | FY1415 | FY1516 | FY1617 | FY1718 | FY1819 | Change (%)
FY1718 to FY1819 |
|---|---|---|---|---|---|---|
| St. John’s | 10,550 | 12,290 | 12,510 | 12,900 | 11,510 | -10.8 |
| Newfoundland – Labrador | 52,860 | 55,590 | 43,080 | 49,270 | 55,170 | +12.0 |
| Prince Edward Island1 | 6,940 | n/a | n/a | n/a | n/a | n/a |
| Charlottetown1 | 2,320 | 4,070 | 4,420 | 3,820 | 3,730 | -2.4 |
| Prince Edward Island (excluding Charlottetown)1 | 7,300 | 12,720 | 12,490 | 12,610 | 11,810 | -6.3 |
| Eastern Nova Scotia | 22,110 | 22,420 | 22,580 | 23,760 | 24,190 | +1.8 |
| Western Nova Scotia | 26,450 | 27,000 | 26,950 | 27,020 | 24,810 | -8.2 |
| Halifax | 12,170 | 12,600 | 13,080 | 13,100 | 12,800 | -2.3 |
| Fredericton-Moncton-Saint-John | 19,230 | 20,920 | 19,800 | 20,180 | 19,270 | -4.5 |
| Madawaska-Charlotte | 11,370 | 11,240 | 10,700 | 10,940 | 10,840 | -0.9 |
| Restigouche- Albert | 38,330 | 39,870 | 39,620 | 39,490 | 38,210 | -3.2 |
| Gaspésie-Île-de-la Madeleine | 23,830 | 24,740 | 24,990 | 25,180 | 24,030 | -4.6 |
| Québec | 34,200 | 33,750 | 31,470 | 32,950 | 30,760 | -6.6 |
| Trois-Rivières | 8,620 | 8,430 | 7,930 | 7,820 | 7,550 | -3.5 |
| South Central Quebec | 8,160 | 7,480 | 7,900 | 6,820 | 6,820 | 0.0 |
| Sherbrooke | 9,210 | 8,230 | 7,990 | 8,000 | 7,690 | -3.9 |
| Montérégie | 25,750 | 27,030 | 26,160 | 24,880 | 24,240 | -2.6 |
| Montreal | 152,310 | 152,860 | 146,390 | 144,110 | 138,980 | -3.6 |
| Central Quebec | 74,540 | 73,830 | 70,970 | 71,440 | 68,910 | -3.5 |
| North Western Quebec | 20,300 | 19,850 | 17,960 | 17,730 | 17,610 | -0.7 |
| Lower Saint Lawrence and North Shore | 44,590 | 44,610 | 43,010 | 40,660 | 39,620 | -2.6 |
| Hull | 10,750 | 10,660 | 10,430 | 9,890 | 9,420 | -4.8 |
| Chicoutimi-Jonquière | 11,580 | 10,730 | 10,260 | 9,600 | 8,870 | -7.6 |
| Ottawa | 20,180 | 21,210 | 19,470 | 19,340 | 19,130 | -1.1 |
| Eastern Ontario | 19,820 | 20,220 | 18,910 | 18,670 | 17,530 | -6.1 |
| Kingston | 3,770 | 3,120 | 3,530 | 3,110 | 3,530 | +13.5 |
| Central Ontario | 42,610 | 44,200 | 42,800 | 41,030 | 39,720 | -3.2 |
| Oshawa | 12,350 | 12,280 | 12,270 | 12,690 | 10,470 | -17.5 |
| Toronto | 141,040 | 141,370 | 132,690 | 131,950 | 129,050 | -2.2 |
| Hamilton | 19,540 | 19,400 | 19,210 | 18,630 | 18,330 | -1.6 |
| St. Catharines | 14,660 | 15,240 | 14,710 | 14,310 | 14,030 | -2.0 |
| London | 13,430 | 12,300 | 12,710 | 13,770 | 11,870 | -13.8 |
| Niagara | 12,330 | 12,760 | 12,160 | 11,600 | 11,150 | -3.9 |
| Windsor | 15,520 | 9,340 | 8,360 | 14,490 | 16,180 | +11.7 |
| Kitchener | 13,340 | 13,340 | 13,360 | 13,570 | 13,240 | -2.4 |
| Huron | 13,040 | 12,940 | 13,970 | 13,360 | 12,560 | -6.0 |
| South Central Ontario | 11,590 | 11,890 | 11,480 | 13,110 | 12,130 | -7.5 |
| Sudbury | 5,540 | 6,550 | 4,560 | 4,990 | 5,180 | +3.8 |
| Thunder Bay | 4,580 | 4,990 | 4,250 | 4,460 | 4,130 | -7.4 |
| Northern Ontario | 28,040 | 29,680 | 22,370 | 24,050 | 25,390 | +5.6 |
| Winnipeg | 20,080 | 22,270 | 21,380 | 21,920 | 22,750 | +3.8 |
| Southern Manitoba | 9,750 | 11,550 | 10,960 | 11,180 | 11,140 | -0.4 |
| Northern Manitoba | 7,450 | 7,990 | 6,970 | 7,130 | 8,720 | +22.3 |
| Regina | 4,470 | 5,700 | 6,270 | 6,330 | 6,460 | +2.1 |
| Saskatoon | 7,510 | 9,730 | 9,210 | 8,640 | 9,080 | +5.1 |
| Southern Saskatchewan | 8,550 | 10,590 | 8,320 | 8,710 | 9,380 | +7.7 |
| Northern Saskatchewan | 10,970 | 13,560 | 10,290 | 11,510 | 12,650 | +9.9 |
| Calgary | 32,730 | 52,480 | 43,150 | 35,620 | 37,950 | +6.5 |
| Edmonton | 36,310 | 57,060 | 47,150 | 42,230 | 47,140 | +11.6 |
| Northern Alberta | 10,290 | 16,090 | 18,750 | 9,880 | 12,220 | +23.7 |
| Southern Alberta | 26,450 | 42,170 | 32,090 | 24,670 | 29,780 | +20.7 |
| Southern Interior British Columbia | 28,630 | 32,740 | 25,790 | 25,520 | 29,410 | +15.2 |
| Abbotsford | 7,380 | 7,390 | 7,160 | 6,690 | 5,830 | -12.9 |
| Vancouver | 55,620 | 54,580 | 49,110 | 47,730 | 43,640 | -8.6 |
| Victoria | 7,520 | 7,920 | 6,650 | 6,710 | 6,480 | -3.4 |
| Southern Coastal British Columbia | 20,740 | 22,350 | 20,390 | 19,220 | 19,010 | -1.1 |
| Northern British Columbia | 19,150 | 21,100 | 15,730 | 16,540 | 16,490 | -0.3 |
| Yukon1 | 780 | n/a | n/a | n/a | n/a | n/a |
| Whitehorse1 | 560 | 1,070 | 950 | 820 | 920 | +12.2 |
| Yukon (excluding Whitehorse)1 | 540 | 770 | 800 | 790 | 720 | -8.9 |
| Northwest Territories1 | 990 | n/a | n/a | n/a | n/a | n/a |
| Yellowknife1 | 170 | 410 | 510 | 520 | 430 | -17.3 |
| Northwest Territories (excluding Yellowknife)1 | 520 | 1,140 | 1,230 | 1,240 | 1,150 | -7.3 |
| Nunavut1 | 280 | n/a | n/a | n/a | n/a | n/a |
| Iqualuit1 | 40 | 110 | 110 | 170 | 130 | -23.5 |
| Nunavut (excluding Iqaluit)1 | 280 | 570 | 660 | 640 | 770 | +20.3 |
| Canada | 1,342,610 | 1,431,090 | 1,321,130 | 1,299,710 | 1292,710 | -0.5 |
- Note: Includes claims for which at least $1 of EI regular benefits was paid.
- 1 As of October 12, 2014, there are a total of 62 Employment Insurance (EI) economic regions, instead of 58 regions. The EI economic regions of Prince Edward Island, Yukon, the Northwest Territories and Nunavut were each divided into 2 EI economic regions, 1 consisting of the capital area and the remaining consisting of the non-capital area.
- Source: Employment and Social Development Canada, Employment Insurance (EI) administrative data. Data are based on a 10% sample of EI administrative data.
| EI economic region | FY1415 | FY1516 | FY1617 | FY1718 | FY1819p | Change (%)
FY1718 to FY1819 |
|---|---|---|---|---|---|---|
| St. John’s | 17.6 | 18.7 | 19.2 | 20.9r | 20.5 | -1.8 |
| Newfoundland – Labrador | 27.3 | 27.6 | 35.4 | 35.7r | 30.2 | -15.5 |
| Prince Edward Island2 | 23.2 | 25.3 | n/a | n/a | n/a | n/a |
| Charlottetown2 | n/a | 19.6 | 19.4 | 19.1r | 17.3 | -9.1 |
| Prince Edward Island (excluding Charlottetown)2 | n/a | 23.9 | 24.7 | 24.5r | 23.6 | -3.6 |
| Eastern Nova Scotia | 26.0 | 27.4 | 26.8 | 26.4r | 25.9 | -1.7 |
| Western Nova Scotia | 22.6 | 23.0 | 22.0 | 21.4r | 20.0 | -6.8 |
| Halifax | 19.4 | 18.9 | 19.8 | 19.0r | 18.4 | -3.3 |
| Fredericton-Moncton-Saint-John | 19.5 | 20.4 | 19.9 | 18.7r | 17.4 | -7.3 |
| Madawaska-Charlotte | 21.6 | 21.4 | 20.6 | 19.1r | 18.6 | -3.0 |
| Restigouche- Albert | 26.6 | 26.5 | 26.4 | 25.1r | 22.4 | -10.8 |
| Gaspésie-Île-de-la Madeleine | 26.2 | 26.0 | 25.4 | 25.2r | 23.5 | -6.7 |
| Québec | 15.3 | 15.9 | 15.3 | 14.2r | 13.2 | -6.8 |
| Trois-Rivières | 18.0 | 17.4 | 16.2 | 15.4r | 14.8 | -3.6 |
| South Central Quebec | 14.3 | 14.8 | 13.8 | 13.0r | 12.7 | -2.4 |
| Sherbrooke | 17.2 | 17.1 | 16.2 | 14.4r | 14.1 | -2.5 |
| Montérégie | 16.9 | 16.9 | 16.4 | 15.4r | 13.9 | -9.5 |
| Montreal | 19.2 | 19.0 | 18.9 | 17.0r | 15.5 | -9.0 |
| Central Quebec | 17.7 | 17.4 | 16.5 | 15.7r | 14.4 | -7.8 |
| North Western Quebec | 19.3 | 20.1 | 18.8 | 17.4r | 16.4 | -5.7 |
| Lower Saint Lawrence and North Shore | 19.6 | 19.3 | 19.1 | 17.3r | 15.2 | -12.2 |
| Hull | 17.3 | 18.0 | 17.4 | 16.2r | 14.2 | -12.7 |
| Chicoutimi-Jonquière | 18.0 | 19.2 | 18.1 | 16.8r | 14.6 | -13.0 |
| Ottawa | 17.4 | 17.1 | 17.4 | 16.3r | 15.6 | -4.4 |
| Eastern Ontario | 18.1 | 17.8 | 18.4 | 16.9r | 16.2 | -4.1 |
| Kingston | 17.9 | 18.1 | 17.2 | 15.8r | 15.6 | -1.4 |
| Central Ontario | 17.5 | 16.9 | 17.5 | 16.7r | 16.0 | -4.4 |
| Oshawa | 16.7 | 15.5 | 17.6 | 15.6r | 15.2 | -2.2 |
| Toronto | 20.3 | 19.6 | 19.1 | 18.1r | 17.1 | -5.6 |
| Hamilton | 16.5 | 16.9 | 16.4 | 16.3r | 15.4 | -5.5 |
| St. Catharines | 19.0 | 17.5 | 17.4 | 16.7r | 15.5 | -7.1 |
| London | 19.3 | 18.2 | 16.5 | 16.6r | 15.7 | -5.4 |
| Niagara | 18.4 | 18.2 | 18.3 | 16.9r | 15.9 | -5.9 |
| Windsor | 19.0 | 16.6 | 19.2 | 11.1r | 14.1 | +26.9 |
| Kitchener | 18.4 | 17.0 | 16.7 | 15.8r | 15.7 | -0.6 |
| Huron | 18.3 | 17.1 | 17.1 | 15.6r | 15.3 | -1.5 |
| South Central Ontario | 16.7 | 16.2 | 16.4 | 14.2r | 14.8 | +3.7 |
| Sudbury | 18.2 | 17.3 | 25.0 | 24.6r | 17.6 | -28.5 |
| Thunder Bay | 17.4 | 16.0 | 15.9 | 15.6r | 15.9 | +1.9 |
| Northern Ontario | 22.4 | 21.7 | 28.7 | 28.1r | 23.1 | -17.6 |
| Winnipeg | 15.7 | 16.9 | 17.0 | 16.6r | 15.9 | -4.3 |
| Southern Manitoba | 14.8 | 15.8 | 16.7 | 16.4r | 15.9 | -2.5 |
| Northern Manitoba | 24.5 | 24.4 | 30.5 | 31.7r | 27.7 | -12.6 |
| Regina | 14.0 | 14.9 | 16.4 | 16.8r | 15.7 | -6.2 |
| Saskatoon | 15.6 | 16.0 | 22.6 | 24.5r | 20.2 | -17.4 |
| Southern Saskatchewan | 16.7 | 16.4 | 24.0 | 25.9r | 20.9 | -19.3 |
| Northern Saskatchewan | 22.7 | 23.2 | 31.6 | 33.2r | 28.2 | -14.9 |
| Calgary | 16.8 | 17.5 | 26.4 | 29.8 | 22.7 | -23.8 |
| Edmonton | 15.7 | 16.8 | 24.0 | 26.3r | 20.2 | -23.0 |
| Northern Alberta | 18.3 | 19.8 | 21.7 | 31.7r | 23.9 | -24.4 |
| Southern Alberta | 16.1 | 17.3 | 24.4 | 28.6 | 20.2 | -29.5 |
| Southern Interior British Columbia | 18.3 | 18.4 | 24.2 | 24.8r | 19.9 | -20.0 |
| Abbotsford | 18.4 | 17.3 | 16.9 | 16.9r | 15.5 | -8.1 |
| Vancouver | 18.3 | 17.7 | 17.4 | 16.9r | 16.0 | -4.8 |
| Victoria | 17.2 | 17.3 | 18.1 | 15.9r | 15.0 | -5.6 |
| Southern Coastal British Columbia | 18.9 | 19.1 | 18.9 | 17.6r | 15.9 | -9.3 |
| Northern British Columbia | 19.7 | 20.6 | 26.3 | 24.7r | 21.5 | -13.1 |
| Yukon2 | 26.5 | 29.6 | n/a | n/a | n/a | n/a |
| Whitehorse2 | 11.9 | 16.7 | 21.9 | 23.2r | 18.9 | -18.4 |
| Yukon (excluding Whitehorse)2 | n/a | 20.4 | 19.9 | 19.8r | 20.0 | +1.3 |
| Northwest Territories2 | 25.4 | 35.0 | n/a | n/a | n/a | n/a |
| Yellowknife2 | n/a | 17.6 | 14.7 | 16.2r | 18.0 | +10.9 |
| Northwest Territories (excluding Yellowknife)2 | n/a | 25.0 | 24.6 | 24.5r | 24.5 | +0.1 |
| Nunavut2 | 32.0 | 34.7 | n/a | n/a | n/a | n/a |
| Iqualuit2 | n/a | 17.6 | 16.8 | 22.6 | 20.2 | -10.6 |
| Nunavut (excluding Iqaluit)2 | n/a | 25.5 | 34.3 | 34.9r | 29.8 | -14.6 |
| Canada | 19.4 | 19.3 | 20.7 | 20.3r | 18.2 | -9.9 |
- Note: Percentage change is based on unrounded numbers. Includes claims for which at least $1 of EI regular benefits was paid.
- 1 The reported duration estimates are based on completed claims that included those that are terminated and those that are dormant and remained inactive as of August the following fiscal year.
- 2 As of October 12, 2014, there are a total of 62 Employment Insurance (EI) economic regions, instead of 58 regions. The EI economic regions of Prince Edward Island, Yukon, the Northwest Territories and Nunavut were each divided into 2 EI economic regions, 1 consisting of the capital area and the remaining consisting of the non-capital area.
- r Revised.
- p Preliminary.
- Source: Employment and Social Development Canada, Employment Insurance (EI) administrative data. Data are based on a 10% sample of EI administrative data.
| EI economic region | FY1415 | FY1516 | FY1617 | FY1718 | FY1819 | Change (%)
FY1718 to FY1819 |
|---|---|---|---|---|---|---|
| St. John’s | 447 | 460 | 468 | 466 | 470 | +1.0 |
| Newfoundland – Labrador | 426 | 440 | 424 | 442 | 453 | +2.4 |
| Prince Edward Island2 | 399 | n/a | n/a | n/a | n/a | n/a |
| Charlottetown2 | 401 | 416 | 399 | 406 | 418 | +3.0 |
| Prince Edward Island (excluding Charlottetown)2 | 417 | 421 | 426 | 432 | 438 | +1.2 |
| Eastern Nova Scotia | 432 | 434 | 433 | 440 | 443 | +0.7 |
| Western Nova Scotia | 404 | 411 | 411 | 414 | 423 | +2.3 |
| Halifax | 417 | 428 | 424 | 429 | 432 | +0.7 |
| Fredericton-Moncton-Saint-John | 406 | 418 | 422 | 432 | 442 | +2.5 |
| Madawaska-Charlotte | 399 | 413 | 413 | 424 | 430 | +1.6 |
| Restigouche- Albert | 421 | 433 | 438 | 443 | 453 | +2.2 |
| Gaspésie-Île-de-la Madeleine | 430 | 437 | 442 | 451 | 460 | +2.1 |
| Québec | 438 | 445 | 452 | 467 | 481 | +3.0 |
| Trois-Rivières | 418 | 424 | 429 | 446 | 454 | +1.8 |
| South Central Quebec | 425 | 441 | 444 | 458 | 465 | +1.5 |
| Sherbrooke | 419 | 426 | 440 | 447 | 463 | +3.5 |
| Montérégie | 420 | 430 | 439 | 448 | 464 | +3.5 |
| Montreal | 424 | 432 | 438 | 448 | 459 | +2.6 |
| Central Quebec | 418 | 427 | 434 | 445 | 456 | +2.4 |
| North Western Quebec | 437 | 440 | 447 | 453 | 470 | +3.6 |
| Lower Saint Lawrence and North Shore | 429 | 439 | 441 | 452 | 462 | +2.2 |
| Hull | 436 | 445 | 457 | 463 | 477 | +3.1 |
| Chicoutimi-Jonquière | 427 | 432 | 434 | 446 | 458 | +2.7 |
| Ottawa | 443 | 453 | 460 | 464 | 476 | +2.6 |
| Eastern Ontario | 428 | 435 | 443 | 440 | 462 | +5.1 |
| Kingston | 429 | 429 | 438 | 443 | 466 | +5.2 |
| Central Ontario | 425 | 437 | 449 | 452 | 465 | +2.9 |
| Oshawa | 453 | 456 | 472 | 483 | 493 | +2.1 |
| Toronto | 435 | 447 | 458 | 467 | 482 | +3.0 |
| Hamilton | 437 | 452 | 460 | 468 | 483 | +3.2 |
| St. Catharines | 412 | 417 | 434 | 440 | 456 | +3.7 |
| London | 423 | 427 | 441 | 455 | 464 | +2.1 |
| Niagara | 433 | 439 | 447 | 457 | 473 | +3.6 |
| Windsor | 456 | 440 | 440 | 481 | 496 | +3.1 |
| Kitchener | 443 | 452 | 463 | 464 | 483 | +4.1 |
| Huron | 431 | 445 | 451 | 458 | 474 | +3.6 |
| South Central Ontario | 431 | 445 | 460 | 468 | 481 | +2.9 |
| Sudbury | 444 | 457 | 458 | 466 | 489 | +5.0 |
| Thunder Bay | 455 | 463 | 476 | 485 | 494 | +1.7 |
| Northern Ontario | 439 | 452 | 444 | 455 | 472 | +3.7 |
| Winnipeg | 429 | 441 | 451 | 456 | 461 | +1.0 |
| Southern Manitoba | 419 | 438 | 435 | 443 | 451 | +1.9 |
| Northern Manitoba | 417 | 431 | 421 | 435 | 448 | +2.8 |
| Regina | 468 | 473 | 490 | 487 | 501 | +2.9 |
| Saskatoon | 469 | 474 | 476 | 478 | 491 | +2.8 |
| Southern Saskatchewan | 450 | 469 | 461 | 472 | 474 | +0.6 |
| Northern Saskatchewan | 453 | 472 | 453 | 457 | 468 | +2.3 |
| Calgary | 484 | 493 | 490 | 493 | 502 | +2.0 |
| Edmonton | 487 | 499 | 500 | 505 | 514 | +1.8 |
| Northern Alberta | 489 | 499 | 500 | 498 | 511 | +2.5 |
| Southern Alberta | 477 | 490 | 481 | 485 | 499 | +2.9 |
| Southern Interior British Columbia | 442 | 459 | 448 | 463 | 471 | +1.6 |
| Abbotsford | 373 | 383 | 398 | 395 | 416 | +5.4 |
| Vancouver | 424 | 438 | 453 | 460 | 473 | +2.9 |
| Victoria | 438 | 454 | 459 | 461 | 486 | +5.3 |
| Southern Coastal British Columbia | 443 | 457 | 456 | 459 | 470 | +2.5 |
| Northern British Columbia | 462 | 474 | 461 | 474 | 487 | +2.7 |
| Yukon2 | 476 | n/a | n/a | n/a | n/a | n/a |
| Whitehorse2 | 485 | 491 | 510 | 496 | 521 | +4.9 |
| Yukon (excluding Whitehorse)2 | 473 | 499 | 491 | 504 | 516 | +2.6 |
| Northwest Territories2 | 492 | n/a | n/a | n/a | n/a | n/a |
| Yellowknife2 | 511 | 506 | 508 | 533 | 537 | +0.9 |
| Northwest Territories (excluding Yellowknife)2 | 507 | 507 | 513 | 525 | 518 | -1.2 |
| Nunavut2 | 464 | n/a | n/a | n/a | n/a | n/a |
| Iqualuit2 | 494 | 496 | 526 | 523 | 546 | +4.4 |
| Nunavut (excluding Iqaluit)2 | 477 | 464 | 480 | 512 | 494 | -3.5 |
| Canada | 433 | 446 | 449 | 457 | 469 | +2.7 |
- Note: Percentage change is based on unrounded numbers. Includes claims for which at least $1 of EI regular benefits was paid.
- 1 Takes into account Family Supplement top-ups paid to claimants with regular benefits.
- 2 As of October 12, 2014, there are a total of 62 Employment Insurance (EI) economic regions, instead of 58 regions. The EI economic regions of Prince Edward Island, Yukon, the Northwest Territories and Nunavut were each divided into 2 EI economic regions, 1 consisting of the capital area and the remaining consisting of the non-capital area.
- r Revised.
- Source: Employment and Social Development Canada, Employment Insurance (EI) administrative data. Data are based on a 10% sample of EI administrative data.
| EI economic region | FY14152 | FY15162 | FY1617 | FY1718 | FY1819 | Change (%)
FY1718 to FY1819 |
|---|---|---|---|---|---|---|
| St. John’s | 82.0 | 98.6 | 116.3 | 139.1 | 112.8 | -18.9 |
| Newfoundland – Labrador | 584.5 | 650.9 | 705.9 | 814.5 | 686.4 | -15.7 |
| Prince Edward Island2 | 105.7 | 8.5 | n/a | n/a | n/a | n/a |
| Charlottetown2 | 8.3 | 33.4 | 34.1 | 32.3 | 29.2 | -9.6 |
| Prince Edward Island (excluding Charlottetown)2 | 33.5 | 120.6 | 127.1 | 143.2 | 131.2 | -8.4 |
| Eastern Nova Scotia | 222.4 | 256.1 | 257.9 | 283.4 | 276.5 | -2.4 |
| Western Nova Scotia | 219.8 | 241.1 | 231.8 | 244.9 | 212.1 | -13.4 |
| Halifax | 91.9 | 105.8 | 105.8 | 114.2 | 106.5 | -6.7 |
| Fredericton-Moncton-Saint-John | 146.2 | 176.3 | 170.1 | 172.9 | 151.5 | -12.4 |
| Madawaska-Charlotte | 92.1 | 96.5 | 87.9 | 93.0 | 88.5 | -4.9 |
| Restigouche- Albert | 402.7 | 439.7 | 445.0 | 463.6 | 392.1 | -15.4 |
| Gaspésie-Île-de-la Madeleine | 249.1 | 266.8 | 264.2 | 295.6 | 252.0 | -14.7 |
| Québec | 209.8 | 222.0 | 198.3 | 211.6 | 183.7 | -13.2 |
| Trois-Rivières | 57.1 | 57.5 | 48.6 | 53.3 | 47.0 | -11.8 |
| South Central Quebec | 47.5 | 47.0 | 42.7 | 40.7 | 35.4 | -13.1 |
| Sherbrooke | 58.5 | 57.4 | 50.6 | 50.5 | 46.3 | -8.3 |
| Montérégie | 168.6 | 186.3 | 174.3 | 173.2 | 146.6 | -15.3 |
| Montreal | 1,166.0 | 1,195.6 | 1,124.4 | 1,116.9 | 939.7 | -15.9 |
| Central Quebec | 496.5 | 508.2 | 449.4 | 499.2 | 420.7 | -15.7 |
| North Western Quebec | 159.5 | 164.2 | 146.7 | 141.6 | 126.7 | -10.5 |
| Lower Saint Lawrence and North Shore | 349.5 | 354.2 | 327.0 | 318.4 | 262.6 | -17.5 |
| Hull | 74.9 | 81.2 | 76.5 | 74.7 | 60.8 | -18.6 |
| Chicoutimi-Jonquière | 78.1 | 86.5 | 71.4 | 67.6 | 56.0 | -17.1 |
| Ottawa | 151.3 | 165.8 | 151.8 | 152.4 | 140.9 | -7.6 |
| Eastern Ontario | 144.8 | 160.2 | 146.6 | 145.7 | 130.1 | -10.7 |
| Kingston | 27.9 | 24.1 | 23.9 | 24.2 | 23.6 | -2.7 |
| Central Ontario | 310.7 | 320.9 | 313.5 | 333.7 | 292.5 | -12.4 |
| Oshawa | 89.9 | 93.6 | 91.1 | 101.9 | 78.4 | -23.0 |
| Toronto | 1,215.2 | 1,230.7 | 1,148.5 | 1,177.8 | 1,035.5 | -12.1 |
| Hamilton | 137.5 | 145.9 | 143.5 | 150.2 | 137.9 | -8.2 |
| St. Catharines | 109.2 | 106.7 | 106.7 | 108.2 | 92.2 | -14.8 |
| London | 104.9 | 92.6 | 88.3 | 107.3 | 89.3 | -16.8 |
| Niagara | 88.9 | 103.8 | 93.9 | 94.4 | 85.4 | -9.5 |
| Windsor | 83.8 | 98.6 | 62.5 | 77.6 | 78.2 | +0.7 |
| Kitchener | 108.9 | 104.5 | 101.6 | 108.2 | 97.4 | -10.0 |
| Huron | 95.3 | 98.6 | 101.2 | 99.3 | 85.1 | -14.3 |
| South Central Ontario | 82.8 | 86.7 | 84.1 | 91.6 | 85.8 | -6.2 |
| Sudbury | 43.0 | 50.9 | 64.6 | 55.2 | 41.4 | -25.0 |
| Thunder Bay | 33.9 | 36.0 | 33.4 | 35.1 | 32.3 | -8.0 |
| Northern Ontario | 265.1 | 281.4 | 314.4 | 320.6 | 250.0 | -22.0 |
| Winnipeg | 138.4 | 171.9 | 169.3 | 182.0 | 177.9 | -2.2 |
| Southern Manitoba | 64.1 | 82.9 | 88.6 | 91.2 | 88.1 | -3.5 |
| Northern Manitoba | 74.7 | 83.6 | 94.2 | 113.0 | 105.1 | -7.0 |
| Regina | 31.3 | 43.8 | 52.3 | 61.8 | 52.0 | -15.9 |
| Saskatoon | 52.1 | 82.1 | 109.4 | 117.1 | 89.0 | -24.0 |
| Southern Saskatchewan | 60.3 | 87.9 | 115.4 | 115.4 | 88.0 | -23.7 |
| Northern Saskatchewan | 102.6 | 147.5 | 173.7 | 179.1 | 164.0 | -8.5 |
| Calgary | 237.3 | 486.3 | 747.9 | 613.1 | 415.8 | -32.2 |
| Edmonton | 260.7 | 489.2 | 730.6 | 632.7 | 495.0 | -21.8 |
| Northern Alberta | 79.3 | 157.5 | 253.3 | 176.4 | 139.9 | -20.7 |
| Southern Alberta | 169.6 | 366.9 | 542.9 | 382.6 | 280.6 | -26.7 |
| Southern Interior British Columbia | 221.2 | 273.0 | 318.5 | 310.0 | 258.7 | -16.6 |
| Abbotsford | 48.9 | 49.3 | 48.7 | 48.9 | 39.4 | -19.4 |
| Vancouver | 435.8 | 436.5 | 391.0 | 403.4 | 342.3 | -15.2 |
| Victoria | 57.4 | 64.6 | 56.4 | 53.8 | 49.9 | -7.2 |
| Southern Coastal British Columbia | 161.5 | 193.8 | 173.2 | 165.0 | 140.6 | -14.7 |
| Northern British Columbia | 156.8 | 201.8 | 229.2 | 211.9 | 157.6 | -25.6 |
| Yukon2 | 17.0 | 1.8 | n/a | n/a | n/a | n/a |
| Whitehorse2 | 2.6 | 9.2 | 10.8 | 10.9 | 8.9 | -18.9 |
| Yukon (excluding Whitehorse)2 | 3.1 | 7.7 | 8.0 | 8.0 | 7.6 | -4.6 |
| Northwest Territories2 | 17.2 | 2.6 | n/a | n/a | n/a | n/a |
| Yellowknife2 | 0.7 | 3.8 | 4.3 | 4.3 | 5.2 | +18.7 |
| Northwest Territories (excluding Yellowknife)2 | 2.7 | 13.8 | 15.0 | 16.4 | 16.2 | -1.2 |
| Nunavut2 | 7.9 | 0.7 | n/a | n/a | n/a | n/a |
| Iqualuit2 | 0.2 | 0.7 | 1.3 | 2.0 | 1.3 | -33.1 |
| Nunavut (excluding Iqaluit)2 | 1.4 | 8.0 | 10.2 | 13.8 | 10.4 | -24.6 |
| Canada | 10,602.0 | 12,122.2 | 12,670.1 | 12,640.5 | 10,673.8 | -15.6 |
- Note: Totals may not add up due to rounding. Percentage change is based on unrounded numbers. Includes claims for which at least $1 of EI regular benefits was paid.
- 1 Takes into account Family Supplement top-ups paid to claimants with regular benefits. Includes benefits paid for training purposes under section 25 of the Employment Insurance Act.
- 2 As of October 12, 2014, there are a total of 62 Employment Insurance (EI) economic regions, instead of 58 regions. The EI economic regions of Prince Edward Island, Yukon, the Northwest Territories and Nunavut were each divided into 2 EI economic regions, 1 consisting of the capital area and the remaining consisting of the non-capital area. The 4 former EI economic regions continued to show claim amounts in FY1516 as some claims that were established in these regions just prior to the change in EI economic region boundaries had continued to be paid in FY1516.
- Source: Employment and Social Development Canada, Employment Insurance (EI) administrative data. Data are based on a 10% sample of EI administrative data.
Annex 2.9 – Seasonal regular claimants
| Category | FY1415 | FY1516 | FY1617 | FY1718 | FY1819 | Change (%) FY1718 to FY1819 |
|---|---|---|---|---|---|---|
| Newfoundland and Labrador | 30,720 | 32,470 | 17,130 | 14,630 | 21,170 | +44.7 |
| Prince Edward Island | 8,580 | 8,590 | 8,430 | 8,340 | 8,120 | -2.6 |
| Nova Scotia | 25,560 | 24,970 | 24,630 | 25,340 | 24,640 | -2.8 |
| New Brunswick | 34,090 | 34,910 | 33,620 | 33,890 | 33,650 | -0.7 |
| Quebec | 159,240 | 159,380 | 156,020 | 157,360 | 153,030 | -2.8 |
| Ontario | 97,110 | 98,420 | 92,340 | 96,070 | 99,060 | +3.1 |
| Manitoba | 10,820 | 11,090 | 9,970 | 10,320 | 11,720 | +13.6 |
| Saskatchewan | 7,770 | 8,240 | 4,800 | 3,790 | 6,010 | +58.6 |
| Alberta | 13,700 | 15,280 | 8,650 | 7,690 | 11,980 | +55.8 |
| British Columbia | 31,370 | 31,500 | 24,410 | 22,960 | 25,220 | +9.8 |
| Yukon | 520 | 560 | 420 | 430 | 400 | -7.0 |
| Northwest Territories | 210 | 230 | 220 | 260 | 250 | -3.8 |
| Nunavut | 30 | 50 | 40 | 30 | 30 | 0.0 |
| Men | 261,810 | 266,130 | 232,770 | 235,580 | 245,400 | +4.2 |
| Women | 157,910 | 159,560 | 147,910 | 145,530 | 149,880 | +3.0 |
| 24 years old and under | 10,540 | 10,470 | 8,130 | 7,930 | 7,630 | -3.8 |
| 25 to 44 years old | 154,680 | 156,900 | 142,730 | 144,000 | 149,160 | +3.6 |
| 45 to 54 years old | 120,920 | 119,340 | 103,330 | 98,730 | 99,610 | +0.9 |
| 55 years old and over | 133,580 | 138,980 | 126,490 | 130,450 | 138,880 | +6.5 |
| Canada | 419,720 | 425,690 | 380,680 | 381,110 | 395,280 | +3.7 |
- Note: Includes all claims for which at least $1 of EI benefits was paid.
- 1 Seasonal regular claimants are individuals who established 3 or more regular or fishing claims in the 5 fiscal years preceding the reference year, of which at least 2 were established at the same time of year as their claim in the reference year. For the purposes of this annex, a 17-week window is used to determine whether a claim was established at the same time of year as their claim in the reference year. Specifically, a claim is considered to have been established at the same time of year if was established between 8 weeks before and 8 weeks after the week in which the reference year claim was established.
- Source: Employment and Social Development Canada, Employment Insurance (EI) administrative data. Data are based on a 10% sample of EI administrative data.
| Category | FY1415 | FY1516 | FY1617 | FY1718 | FY1819p | Change (%) FY1718 to FY1819 |
|---|---|---|---|---|---|---|
| Newfoundland and Labrador | 26.6 | 26.7 | 34.5 | 33.1r | 27.1 | -18.1 |
| Prince Edward Island | 23.1 | 23.5r | 23.9 | 23.8r | 23.2 | -2.3 |
| Nova Scotia | 22.7 | 23.6 | 22.9 | 22.6r | 22.2 | -1.5 |
| New Brunswick | 24.6 | 24.6 | 24.1r | 23.3r | 20.9 | -10.3 |
| Quebec | 17.1 | 17.1 | 16.6r | 15.7r | 14.2 | -9.5 |
| Ontario | 14.6 | 14.0 | 14.8 | 14.0r | 13.2 | -5.6 |
| Manitoba | 13.8 | 15.2r | 16.1 | 15.8r | 14.4 | -8.9 |
| Saskatchewan | 16.2 | 16.6 | 24.7 | 22.7 | 18.8 | -17.3 |
| Alberta | 12.9 | 14.2 | 21.8 | 22.7r | 17.7 | -21.9 |
| British Columbia | 15.0 | 15.0 | 17.3r | 17.1r | 14.6 | -14.2 |
| Yukon | 21.3 | 19.9 | 19.4 | 20.5r | 19.8 | -3.8 |
| Northwest Territories | 23.7 | 24.1 | 24.5 | 21.4r | 23.4 | +9.3 |
| Nunavut | 37.3 | 26.7 | 38.0 | 30.3r | 37.8 | +24.8 |
| Men | 18.9 | 19.0 | 19.9 | 18.7r | 16.7 | -10.8 |
| Women | 16.3 | 16.1 | 17.2 | 16.5 | 14.7 | -10.8 |
| 24 years old and under | 17.7 | 18.1r | 18.7 | 18.1r | 16.4 | -9.5 |
| 25 to 44 years old | 16.9 | 17.0 | 17.5 | 16.7r | 14.9 | -10.7 |
| 45 to 54 years old | 17.7 | 17.7 | 18.7 | 17.8r | 15.8 | -10.8 |
| 55 years old and over | 19.2 | 19.1 | 20.7 | 19.3r | 17.2 | -10.7 |
| Canada | 17.9 | 17.9 | 18.9 | 17.9r | 16.0 | -10.7 |
- Note: Percentage change is based on unrounded numbers. Includes all claims for which at least $1 of EI benefits was paid.
- 1 Seasonal regular claimants are individuals who established 3 or more regular or fishing claims in the 5 fiscal years preceding the reference year, of which at least 2 were established at the same time of year as their claim in the reference year. For the purposes of this annex, a 17-week window is used to determine whether a claim was established at the same time of year as their claim in the reference year. Specifically, a claim is considered to have been established at the same time of year if was established between 8 weeks before and 8 weeks after the week in which the reference year claim was established.
- 2 The reported duration estimates are based on completed claims that included those that are terminated and those that are dormant and remained inactive as of August the following fiscal year.
- p Preliminary.
- r Revised.
- Source: Employment and Social Development Canada, Employment Insurance (EI) administrative data. Data are based on a 10% sample of EI administrative data.
| Category | FY1415 | FY1516 | FY1617 | FY1718 | FY1819 | Change (%) FY1718 to FY1819 |
|---|---|---|---|---|---|---|
| Newfoundland and Labrador | 439 | 452 | 428 | 439 | 466 | +6.3 |
| Prince Edward Island | 413 | 431 | 443 | 452 | 454 | +0.4 |
| Nova Scotia | 427 | 433 | 440 | 450 | 455 | +1.0 |
| New Brunswick | 426 | 440 | 453 | 465 | 474 | +1.8 |
| Quebec | 447 | 456 | 466 | 475 | 486 | +2.2 |
| Ontario | 456 | 466 | 478 | 486 | 498 | +2.4 |
| Manitoba | 435 | 442 | 452 | 465 | 474 | +2.0 |
| Saskatchewan | 451 | 465 | 457 | 487 | 490 | +0.8 |
| Alberta | 478 | 488 | 485 | 505 | 515 | +2.0 |
| British Columbia | 431 | 445 | 444 | 451 | 470 | +4.0 |
| Yukon | 497 | 514 | 517 | 524 | 544 | +3.7 |
| Northwest Territories | 513 | 517 | 515 | 536 | 539 | +0.6 |
| Nunavut | 431 | 507 | 484 | 466 | 494 | +5.9 |
| Men | 470 | 481 | 487 | 495 | 506 | +2.1 |
| Women | 403 | 413 | 423 | 436 | 448 | +2.7 |
| 24 years old and under | 462 | 478 | 479 | 490 | 502 | +2.5 |
| 25 to 44 years old | 464 | 475 | 484 | 495 | 504 | +1.9 |
| 45 to 54 years old | 443 | 454 | 462 | 473 | 486 | +2.7 |
| 55 years old and over | 423 | 432 | 437 | 447 | 460 | +2.8 |
| Canada | 445 | 455 | 462 | 473 | 484 | +2.4 |
- Note: Percentage change is based on unrounded numbers. Includes all claims for which at least $1 of EI benefits was paid.
- 1 Seasonal regular claimants are individuals who established 3 or more regular or fishing claims in the 5 fiscal years preceding the reference year, of which at least 2 were established at the same time of year as their claim in the reference year. For the purposes of this annex, a 17-week window is used to determine whether a claim was established at the same time of year as their claim in the reference year. Specifically, a claim is considered to have been established at the same time of year if was established between 8 weeks before and 8 weeks after the week in which the reference year claim was established.
- 2 Takes into account Family Supplement top-ups paid to seasonal regular claimants.
- Source: Employment and Social Development Canada, Employment Insurance (EI) administrative data. Data are based on a 10% sample of EI administrative data.
| Category | FY1415 | FY1516 | FY1617 | FY1718 | FY1819 | Change (%) FY1718 to FY1819 |
|---|---|---|---|---|---|---|
| Newfoundland and Labrador | 342.1 | 365.8 | 359.0 | 240.3 | 206.0 | -14.3 |
| Prince Edward Island | 75.8 | 82.6 | 80.4 | 92.9 | 83.5 | -10.1 |
| Nova Scotia | 222.4 | 238.1 | 230.3 | 259.4 | 238.8 | -8.0 |
| New Brunswick | 330.4 | 352.2 | 343.6 | 363.1 | 319.8 | -11.9 |
| Quebec | 1,082.2 | 1,126.7 | 1,041.2 | 1,128.0 | 963.9 | -14.5 |
| Ontario | 571.9r | 606.0 | 585.9 | 638.4 | 599.3 | -6.1 |
| Manitoba | 63.3 | 70.9r | 68.6r | 76.5 | 78.0 | +1.9 |
| Saskatchewan | 53.5 | 63.9 | 59.9 | 49.2 | 49.2 | 0.0 |
| Alberta | 78.4 | 99.9 | 111.7 | 97.8 | 96.6 | -1.2 |
| British Columbia | 188.9 | 191.4 | 188.5 | 175.0 | 156.2 | -10.8 |
| Yukon | 6.0 | 4.8 | 4.7 | 4.6 | 4.3 | -7.6 |
| Northwest Territories | 2.6 | 2.8 | 2.6 | 2.9 | 3.4 | +15.5 |
| Nunavut | 0.5 | 0.5 | 0.8 | 0.6 | 0.6 | -1.4 |
| Men | 2,162.0r | 2,311.1 | 2,214.8 | 2,176.0 | 1,964.5 | -9.7 |
| Women | 856.0 | 894.5 | 862.4 | 952.9 | 834.9 | -12.4 |
| 24 years old and under | 80.4 | 87.3 | 76.4 | 71.9 | 61.5 | -14.4 |
| 25 to 44 years old | 1,089.1 | 1,157.1 | 1,108.0 | 1,147.8 | 1,030.4 | -10.2 |
| 45 to 54 years old | 859.2 | 884.9 | 826.8 | 808.3 | 696.3 | -13.9 |
| 55 years old and over | 989.3 | 1,076.3 | 1,066.0 | 1,100.9 | 1,011.2 | -8.1 |
| Canada | 3,018.0r | 3,205.6 | 3,077.2 | 3,128.9 | 2,799.4 | -10.5 |
- Note: Data may not add up to the total due to rounding. Percentage change is based on unrounded numbers. Includes all claims for which at least $1 of EI benefits was paid.
- 1 Seasonal regular claimants are individuals who established 3 or more regular or fishing claims in the 5 fiscal years preceding the reference year, of which at least 2 were established at the same time of year as their claim in the reference year. For the purposes of this annex, a 17-week window is used to determine whether a claim was established at the same time of year as their claim in the reference year. Specifically, a claim is considered to have been established at the same time of year if was established between 8 weeks before and 8 weeks after the week in which the reference year claim was established.
- 2 Takes into account Family Supplement top-ups paid to seasonal regular claimants.
- Source: Employment and Social Development Canada, Employment Insurance (EI) administrative data. Data are based on a 10% sample of EI administrative data.
Annex 2.10 – Fishing benefits
| Category | FY1415 | FY1516 | FY1617 | FY1718 | FY1819 | Change (%) FY1718 to FY1819 |
|---|---|---|---|---|---|---|
| Newfoundland and Labrador | 11,160 | 11,469 | 11,819 | 12,278 | 12,682 | +3.3 |
| Prince Edward Island | 2,844 | 2,981 | 3,108 | 3,258 | 3,278 | +0.6 |
| Nova Scotia | 5,185 | 5,327 | 5,448 | 5,633 | 5,701 | +1.2 |
| New Brunswick | 2,791 | 2,977 | 3,066 | 3,310 | 3,203 | -3.2 |
| Quebec | 1,390 | 1,409 | 1,425 | 1,412 | 1,408 | -0.3 |
| British Columbia | 3,124 | 2,940 | 2,919 | 2,942 | 2,843 | -3.4 |
| Other provinces and territories | 1,093 | 1,168 | 1,149 | 1,222 | 1,252 | +2.5 |
| Men | 22,590 | 23,121 | 23,502 | 24,015 | 24,319 | +1.3 |
| Women | 4,997 | 5,150 | 5,432 | 6,040 | 6,048 | +0.1 |
| 24 years old and under | 1,218 | 1,380 | 1,460 | 1,564 | 1,535 | -1.9 |
| 25 to 44 years old | 8,214 | 8,327 | 8,335 | 8,683 | 8,556 | -1.5 |
| 45 to 54 years old | 8,228 | 8,184 | 8,171 | 8,217 | 8,095 | -1.5 |
| 55 years old and over | 9,927 | 10,380 | 10,968 | 11,591 | 12,181 | +5.1 |
| Canada | 27,587 | 28,271 | 28,934 | 30,055 | 30,367 | +1.0 |
- Note: Includes all claims for which at least $1 of EI fishing benefits was paid.
- Source: Employment and Social Development Canada, Employment Insurance (EI) administrative data. Data are based on a 100% sample of EI administrative data.
| Category | FY1415 | FY1516 | FY1617 | FY1718 | FY1819 | Change (%) FY1718 to FY1819 |
|---|---|---|---|---|---|---|
| Newfoundland and Labrador | 20.7 | 20.7 | 21.2 | 19.5 | 19.1 | -1.9 |
| Prince Edward Island | 20.3 | 19.7 | 19.7 | 19.1 | 18.8 | -1.4 |
| Nova Scotia | 19.9 | 19.8 | 20.0 | 19.8 | 19.8 | -0.1 |
| New Brunswick | 19.8 | 19.4 | 19.8 | 19.6 | 19.1 | -2.5 |
| Quebec | 19.5 | 18.6 | 20.0 | 17.1 | 17.1 | 0.0 |
| British Columbia | 23.2 | 22.9 | 23.0 | 23.1 | 23.3 | +0.9 |
| Other provinces and territories | 22.8 | 22.3 | 22.5 | 23.2 | 23.0 | -0.6 |
| Men | 20.4 | 20.1 | 20.5 | 19.5 | 19.3 | -1.2 |
| Women | 22.3 | 22.0 | 22.3 | 21.5 | 21.2 | -1.3 |
| 24 years old and under | 20.2 | 20.3 | 20.3 | 20.4 | 20.1 | -1.6 |
| 25 to 44 years old | 20.4 | 20.2 | 20.5 | 20.2 | 20.1 | -0.6 |
| 45 to 54 years old | 20.5 | 20.2 | 20.5 | 19.3 | 19.0 | -1.9 |
| 55 years old and over | 21.3 | 21.0 | 21.3 | 20.0 | 19.8 | -1.2 |
| Canada | 20.7 | 20.5 | 20.8 | 19.9 | 19.7 | -1.2 |
- Note: Percentage change is based on unrounded numbers. Includes all claims for which at least $1 of EI fishing benefits was paid. Estimates on average actual duration are based on claims established.
- Source: Employment and Social Development Canada, Employment Insurance (EI) administrative data. Data are based on a 100% sample of EI administrative data.
| Category | FY1415 | FY1516 | FY1617 | FY1718 | FY1819 | Change (%) FY1718 to FY1819 |
|---|---|---|---|---|---|---|
| Newfoundland and Labrador | 484 | 497 | 506 | 515 | 517 | +0.4 |
| Prince Edward Island | 493 | 511 | 527 | 532 | 528 | -0.7 |
| Nova Scotia | 498 | 506 | 519 | 521 | 521 | +0.1 |
| New Brunswick | 499 | 511 | 519 | 521 | 529 | +1.6 |
| Quebec | 504 | 513 | 525 | 532 | 538 | +1.1 |
| British Columbia | 459 | 444 | 457 | 449 | 475 | +5.8 |
| Other provinces and territories | 414 | 431 | 426 | 430r | 444 | +3.3 |
| Men | 489 | 497r | 508r | 513r | 518 | +0.9 |
| Women | 465 | 480 | 489 | 494 | 499 | +1.2 |
| 24 years old and under | 464 | 475 | 481 | 483 | 493 | +2.2 |
| 25 to 44 years old | 484 | 494 | 503 | 507 | 512 | +1.0 |
| 45 to 54 years old | 490 | 500 | 511 | 517 | 522 | +1.0 |
| 55 years old and over | 484 | 493 | 504 | 510 | 514 | +0.8 |
| Canada | 484r | 494 | 505 | 510 | 514 | +1.0 |
- Note: Percentage change is based on unrounded numbers. Includes all claims for which at least $1 of EI fishing benefits was paid.
- 1 Takes into account Family Supplement top-ups paid to claimants with fishing benefits.
- Source: Employment and Social Development Canada, Employment Insurance (EI) administrative data. Data are based on a 100% sample of EI administrative data.
| Category | FY1415 | FY1516 | FY1617 | FY1718 | FY1819 | Change (%) FY1718 to FY1819 |
|---|---|---|---|---|---|---|
| Newfoundland and Labrador | 98.6 | 108.1 | 111.4 | 121.4 | 118.4 | -2.5 |
| Prince Edward Island | 24.1 | 26.2 | 28.4 | 29.5 | 29.1 | -1.3 |
| Nova Scotia | 49.9 | 53.0 | 57.2 | 59.8 | 59.9 | +0.2 |
| New Brunswick | 26.6 | 29.3 | 31.1 | 34.7 | 34.1 | -1.6 |
| Quebec | 12.8 | 12.5 | 12.0 | 11.2 | 12.0 | +7.2 |
| British Columbia | 31.7 | 31.3 | 29.9 | 30.4 | 29.8 | -2.1 |
| Other provinces and territories | 12.0 | 11.8 | 12.9 | 13.3 | 14.5 | +8.9 |
| Men | 210.9 | 223.9 | 229.5 | 241.0 | 238.9 | -0.9 |
| Women | 44.7 | 48.4 | 53.4 | 59.2 | 58.8 | -0.6 |
| 24 years old and under | 10.4 | 11.6 | 14.0 | 14.8 | 16.4 | +10.8 |
| 25 to 44 years old | 74.3 | 78.6 | 82.1 | 90.1 | 89.9 | -0.2 |
| 45 to 54 years old | 78.7 | 81.4 | 79.9 | 82.0 | 78.4 | -4.4 |
| 55 years old and over | 92.2 | 100.7 | 106.9 | 113.3 | 113.0 | -0.2 |
| Canada | 255.6 | 272.3 | 282.9 | 300.2 | 297.7 | -0.8 |
- Note: Data may not add up to the total due to rounding. Percentage change is based on unrounded numbers. Includes all claims for which at least $1 of EI fishing benefits was paid.
- 1 Takes into account Family Supplement top-ups paid to claimants with fishing benefits.
- Source: Employment and Social Development Canada, Employment Insurance (EI) administrative data. Data are based on a 10% sample of EI administrative data.
Annex 2.11 – Special benefits
| Category | FY1415 | FY1516 | FY1617 | FY1718 | FY1819 | Change (%) FY1718 to FY1819 |
|---|---|---|---|---|---|---|
| Newfoundland and Labrador | 11,940 | 12,490 | 12,080 | 13,040 | 13,230 | +1.5 |
| Prince Edward Island | 6,340 | 6,610 | 6,850 | 6,860 | 6,680 | -2.6 |
| Nova Scotia | 21,600 | 23,830 | 24,110 | 25,890 | 26,430 | +2.1 |
| New Brunswick | 24,850 | 26,980 | 28,480 | 33,000 | 33,590 | +1.8 |
| Quebec | 107,060 | 112,690 | 120,900 | 133,050 | 136,230 | +2.4 |
| Ontario | 183,350 | 192,110 | 198,760 | 204,730 | 207,380 | +1.3 |
| Manitoba | 18,910 | 20,230 | 19,100 | 20,910 | 20,680 | -1.1 |
| Saskatchewan | 14,740 | 16,230 | 15,380 | 16,420 | 17,310 | +5.4 |
| Alberta | 58,090 | 62,330 | 58,820 | 58,960 | 62,920 | +6.7 |
| British Columbia | 75,040 | 75,380 | 77,130 | 82,320 | 80,150 | -2.6 |
| Yukon | 670 | 740 | 710 | 710 | 670 | -5.6 |
| Northwest Territories | 600 | 720 | 640 | 710 | 750 | +5.6 |
| Nunavut | 350 | 470 | 420 | 490 | 520 | +6.1 |
| Men | 177,350 | 188,700 | 195,280 | 212,700 | 220,000 | +3.4 |
| Women | 346,190 | 362,110 | 368,100 | 384,390 | 386,540 | +0.6 |
| 24 years old and under | 39,730 | 41,940 | 41,340 | 42,020 | 42,050 | +0.1 |
| 25 to 44 years old | 301,340 | 317,170 | 321,680 | 337,320 | 342,800 | +1.6 |
| 45 to 54 years old | 90,650 | 93,420 | 94,840 | 100,990 | 99,400 | -1.6 |
| 55 years old and over | 91,820 | 98,280 | 105,520 | 116,760 | 122,290 | +4.7 |
| Employees | 522,810 | 550,250 | 562,660 | 596,310 | 605,930 | +1.6 |
| Self-employed persons | 730 | 560 | 720 | 780 | 610 | -21.8 |
| Canada | 523,540 | 550,810 | 563,380 | 597,090 | 606,540 | +1.6 |
- Note: Includes claims for which at least $1 of EI special benefits was paid.
- 1 Includes maternity, parental, sickness, and compassionate care benefits. Excludes family caregiver benefits for adults and children due to incompatibility of administrative data sources.
- Source: Employment and Social Development Canada, Employment Insurance (EI) administrative data. Data are based on a 10% sample of EI administrative data.
| Category | FY1415 | FY1516 | FY1617 | FY1718 | FY1819 | Change (%) FY1718 to FY1819 |
|---|---|---|---|---|---|---|
| Newfoundland and Labrador | 408 | 422 | 436 | 437 | 450 | +3.1 |
| Prince Edward Island | 397 | 407 | 424 | 429 | 438 | +2.1 |
| Nova Scotia | 400 | 409 | 416 | 425 | 431 | +1.5 |
| New Brunswick | 405 | 419 | 421 | 433 | 438 | +1.0 |
| Quebec | 390 | 398 | 406 | 416 | 427 | +2.6 |
| Ontario | 420 | 430 | 441 | 449 | 462 | +2.7 |
| Manitoba | 413 | 424 | 432 | 432 | 443 | +2.4 |
| Saskatchewan | 430 | 442 | 453 | 456 | 461 | +1.1 |
| Alberta | 445 | 454 | 460 | 467 | 477 | +2.0 |
| British Columbia | 411 | 422 | 434 | 443 | 454 | +2.5 |
| Yukon | 463 | 475 | 494 | 503 | 511 | +1.6 |
| Northwest Territories | 478 | 503 | 508 | 508 | 513 | +0.9 |
| Nunavut | 458 | 472 | 482 | 487 | 499 | +2.6 |
| Men | 444 | 454 | 462 | 470 | 481 | +2.3 |
| Women | 398 | 408 | 416 | 423 | 432 | +2.0 |
| 24 years old and under | 330 | 343 | 346 | 353 | 375 | +6.2 |
| 25 to 44 years old | 431 | 441 | 450 | 457 | 466 | +1.9 |
| 45 to 54 years old | 409 | 423 | 430 | 441 | 452 | +2.5 |
| 55 years old and over | 396 | 403 | 414 | 423 | 434 | +2.7 |
| Employees | 414 | 424 | 432 | 440 | 450 | +2.3 |
| Self-employed persons | 315 | 329 | 337 | 331 | 329 | -0.5 |
| Canada | 414 | 423 | 432 | 440 | 450 | +2.3 |
- Note: Percentage change is based on unrounded numbers. Includes claims for which at least $1 of EI special benefits was paid.
- 1 Includes maternity, standard parental, sickness, and compassionate care benefits. Excludes family caregiver benefits for adults and children due to incompatibility of administrative data sources and extended parental benefits which are calculated at a lower benefit rate.
- 2 Takes into account Family Supplement top-ups paid to claimants with special benefits.
- Source: Employment and Social Development Canada, Employment Insurance (EI) administrative data. Data are based in a 10% sample of EI administrative data.
| Category | FY1415 | FY1516 | FY1617 | FY1718 | FY1819 | Change (%) FY1718 to FY1819 |
|---|---|---|---|---|---|---|
| Newfoundland and Labrador | 98.0 | 101.3 | 106.6 | 110.8 | 106.5 | -3.8 |
| Prince Edward Island | 39.7 | 39.5 | 41.2 | 43.3 | 42.3 | -2.2 |
| Nova Scotia | 164.2 | 177.1 | 188.0 | 190.3 | 192.2 | +1.0 |
| New Brunswick | 156.8 | 162.7 | 185.1 | 190.8 | 205.2 | +7.6 |
| Quebec | 373.9 | 407.8 | 442.0 | 506.0r | 528.1 | +4.4 |
| Ontario | 2,179.2 | 2,281.4 | 2,379.7 | 2,486.9 | 2,500.2 | +0.5 |
| Manitoba | 212.5 | 224.5 | 224.4 | 237.2 | 240.0 | +1.2 |
| Saskatchewan | 188.2 | 208.4 | 218.8 | 226.7r | 233.8 | +3.1 |
| Alberta | 762.3 | 849.0 | 863.2 | 852.1r | 847.8 | -0.5 |
| British Columbia | 751.2 | 779.7 | 817.8 | 869.8 | 869.8 | 0.0 |
| Yukon | 7.6 | 7.2 | 8.5 | 8.9 | 8.8 | -1.1 |
| Northwest Territories | 8.5 | 8.1 | 10.1 | 9.7 | 9.5 | -1.8 |
| Nunavut | 5.0 | 5.7 | 4.8 | 7.2 | 8.0 | +11.1 |
| Unknown province* | 0.5 | 0.1 | 0.1 | 0.2 | 0.4 | +126.7 |
| Men | 834.0 | 909.2 | 1,001.3 | 1,077.6r | 1,126.5 | +4.5 |
| Women | 4,113.4 | 4,343.4 | 4,489.1 | 4,662.1r | 4,666.0 | +0.1 |
| 24 years old and under | 339.6 | 357.1 | 348.5 | 353.0 | 347.1 | -1.7 |
| 25 to 44 years old | 3,854.9 | 4,076.6 | 4,240.3 | 4,391.2 | 4,404.7 | +0.3 |
| 45 to 54 years old | 383.0 | 405.4 | 438.5 | 475.1 | 485.3 | +2.1 |
| 55 years old and over | 370.0 | 413.5 | 463.2 | 520.3r | 555.4 | +6.8 |
| Employees | 4,939.8 | 5,244.7 | 5,482.8 | 5,729.8 | 5,783.3 | +0.9 |
| Self-employed persons | 7.7 | 7.9 | 7.7 | 9.9 | 9.2 | -6.4 |
| Canada | 4,947.5 | 5,252.5 | 5,490.5 | 5,739.7r | 5,792.5 | +0.9 |
- Note: Includes claims for which at least $1 of EI special benefits was paid.
- 1 Includes maternity, parental, sickness and compassionate care benefits, as well as family caregiver benefits for adults and children.
- 2 Takes into account Family Supplement top-ups paid to claimants with special benefits.
- r Revised
- * For some claims, this information was not available in the data.
- Source: Employment and Social Development Canada, Employment Insurance (EI) administrative data. Data on maternity, parental and sickness benefits are based on a 10% sample of EI administrative data, whereas data on compassionate care benefits, and family caregiver benefits for adults and children are based on a 100% sample.
Annex 2.12 – Special benefits (by Employment Insurance economic region)
| EI Economic region | FY1415 | FY1516 | FY1617 | FY1718 | FY1819 | Change (%) FY1718 to FY1819 |
|---|---|---|---|---|---|---|
| St. John's | 4,590 | 4,440 | 4,570 | 5,080 | 4,660 | -8.3 |
| Newfoundland - Labrador | 7,350 | 8,050 | 7,510 | 7,960 | 8,570 | +7.7 |
| Prince Edward Island2 | 3,310 | n/a | n/a | n/a | n/a | n/a |
| Charlottetown | 760 | 1,830 | 2,130 | 1,990 | 1,940 | -2.5 |
| Prince Edward Island (excl. Charlottetown) | 2,270 | 4,780 | 4,720 | 4,870 | 4,740 | -2.7 |
| Eastern Nova Scotia | 6,800 | 7,290 | 7,600 | 8,500 | 8,180 | -3.8 |
| Western Nova Scotia | 7,970 | 9,200 | 8,950 | 9,920 | 10,220 | +3.0 |
| Halifax | 6,830 | 7,340 | 7,560 | 7,470 | 8,030 | +7.5 |
| Fredericton-Moncton | 9,050 | 9,980 | 10,180 | 11,010 | 11,540 | +4.8 |
| Madawaska-Charlotte | 4,000 | 4,120 | 4,130 | 4,680 | 4,780 | +2.1 |
| Restigouche-Albert | 11,800 | 12,880 | 14,170 | 17,310 | 17,270 | -0.2 |
| Gaspésie-Îles-de-la-Madeleine | 3,530 | 3,480 | 3,980 | 4,750 | 4,240 | -10.7 |
| Québec | 9,270 | 10,330 | 10,800 | 11,730 | 13,060 | +11.3 |
| Trois-Rivières | 2,640 | 2,830 | 2,910 | 3,210 | 3,290 | +2.5 |
| South Central Quebec | 2,690 | 2,700 | 2,990 | 3,190 | 3,210 | +0.6 |
| Sherbrooke | 2,610 | 2,550 | 3,150 | 3,250 | 3,480 | +7.1 |
| Montérégie | 7,350 | 8,420 | 8,650 | 9,470 | 9,700 | +2.4 |
| Montreal | 33,100 | 35,590 | 38,450 | 42,850 | 44,090 | +2.9 |
| Central Quebec | 21,040 | 21,830 | 24,180 | 25,780 | 26,910 | +4.4 |
| North Western Quebec | 4,600 | 4,330 | 4,560 | 5,420 | 5,220 | -3.7 |
| Lower Saint Lawrence and North Shore | 12,770 | 12,930 | 13,600 | 14,860 | 14,420 | -3.0 |
| Hull | 3,380 | 3,280 | 3,380 | 3,640 | 4,150 | +14.0 |
| Chicoutimi-Jonquière | 4,080 | 4,420 | 4,250 | 4,900 | 4,460 | -9.0 |
| Ottawa | 13,270 | 13,860 | 14,310 | 14,140 | 13,850 | -2.1 |
| Eastern Ontario | 7,520 | 8,250 | 8,210 | 8,750 | 9,030 | +3.2 |
| Kingston | 2,120 | 2,110 | 2,130 | 2,130 | 2,220 | +4.2 |
| Central Ontario | 16,790 | 18,820 | 18,920 | 19,350 | 19,780 | +2.2 |
| Oshawa | 5,970 | 5,980 | 6,020 | 6,660 | 5,990 | -10.1 |
| Toronto | 71,370 | 74,040 | 77,080 | 77,040 | 79,030 | +2.6 |
| Hamilton | 10,300 | 10,620 | 11,100 | 11,320 | 11,570 | +2.2 |
| St. Catharines | 5,530 | 6,410 | 6,470 | 6,650 | 7,020 | +5.6 |
| London | 6,360 | 6,930 | 7,110 | 7,770 | 7,320 | -5.8 |
| Niagara | 5,690 | 5,750 | 5,610 | 6,170 | 6,670 | +8.1 |
| Windsor | 4,560 | 4,640 | 4,520 | 5,680 | 6,090 | +7.2 |
| Kitchener | 7,430 | 7,280 | 7,900 | 8,470 | 8,590 | +1.4 |
| Huron | 5,260 | 5,550 | 7,100 | 7,200 | 6,260 | -13.1 |
| South Central Ontario | 6,880 | 7,370 | 7,800 | 8,690 | 8,640 | -0.6 |
| Sudbury | 2,790 | 2,560 | 3,040 | 2,840 | 3,120 | +9.9 |
| Thunder Bay | 2,100 | 1,950 | 1,980 | 2,080 | 2,180 | +4.8 |
| Northern Ontario | 9,410 | 9,990 | 9,460 | 9,790 | 10,020 | +2.3 |
| Winnipeg | 12,180 | 12,870 | 11,630 | 13,180 | 12,770 | -3.1 |
| Southern Manitoba | 5,040 | 5,630 | 5,680 | 5,880 | 6,060 | +3.1 |
| Northern Manitoba | 1,690 | 1,730 | 1,790 | 1,850 | 1,850 | +0.0 |
| Regina | 3,570 | 3,890 | 3,910 | 4,200 | 4,180 | -0.5 |
| Saskatoon | 4,120 | 4,500 | 4,450 | 4,660 | 4,980 | +6.9 |
| Southern Saskatchewan | 4,010 | 4,150 | 3,830 | 4,170 | 4,540 | +8.9 |
| Northern Saskatchewan | 3,040 | 3,690 | 3,190 | 3,390 | 3,610 | +6.5 |
| Calgary | 19,550 | 20,220 | 19,240 | 20,700 | 20,270 | -2.1 |
| Edmonton | 19,690 | 21,670 | 20,310 | 19,920 | 22,170 | +11.3 |
| Northern Alberta | 4,080 | 4,950 | 4,710 | 4,120 | 4,680 | +13.6 |
| Southern Alberta | 14,770 | 15,490 | 14,560 | 14,220 | 15,800 | +11.1 |
| Southern Interior British Columbia | 11,680 | 12,160 | 12,250 | 12,700 | 12,840 | +1.1 |
| Abbotsford | 4,730 | 4,360 | 5,240 | 5,370 | 4,980 | -7.3 |
| Vancouver | 36,700 | 36,830 | 36,380 | 39,940 | 38,770 | -2.9 |
| Victoria | 5,390 | 5,190 | 5,510 | 6,090 | 5,640 | -7.4 |
| Southern Coastal British Columbia | 10,110 | 10,480 | 11,570 | 11,280 | 11,570 | +2.6 |
| Northern British Columbia | 6,430 | 6,360 | 6,180 | 6,940 | 6,350 | -8.5 |
| Yukon2 | 440 | n/a | n/a | n/a | n/a | n/a |
| Whitehorse | 180 | 590 | 570 | 590 | 550 | -6.8 |
| Yukon (excluding Whitehorse) | 50 | 150 | 140 | 120 | 120 | 0.0 |
| Northwest Territories2 | 380 | n/a | n/a | n/a | n/a | n/a |
| Yellowknife | 120 | 390 | 370 | 360 | 410 | +13.9 |
| Northwest Territories (excl. Yellowknife) | 100 | 330 | 270 | 350 | 340 | -2.9 |
| Nunavut2 | 210 | n/a | n/a | n/a | n/a | n/a |
| Iqaluit | 60 | 170 | 110 | 170 | 160 | -5.9 |
| Nunavut (excl. Iqaluit) | 80 | 300 | 310 | 320 | 360 | +12.5 |
| Canada | 523,540 | 550,810 | 563,380 | 597,090 | 606,540 | +1.6 |
- Note: Includes claims for which at least $1 of EI special benefits was paid.
- 1 Includes maternity, parental, sickness and compassionate care benefits. Excludes family caregiver benefits for adults and children due to incompatibility of administrative data sources.
- 2 As of October 17, 2014, there is a total of 62 Employment Insurance (EI) economic regions, instead of 58 regions. The EI economic regions of Prince Edward Island, Yukon, the Northwest Territories and Nunavut were each divided into 2 EI economic regions, 1 consisting of the capital area and the remaining consisting of the non-capital area.
- Source: Employment and Social Development Canada, Employment Insurance (EI) administrative data. Data are based on a 10% sample of EI administrative data.
| EI Economic region | FY1415 | FY1516 | FY1617 | FY1718 | FY1819 | Change (%) FY1718 to FY1819 |
|---|---|---|---|---|---|---|
| St. John's | 415 | 430 | 445 | 440 | 455 | +3.5 |
| Newfoundland - Labrador | 403 | 417 | 430 | 435 | 448 | +3.0 |
| Prince Edward Island3 | 397 | n/a | n/a | n/a | n/a | n/a |
| Charlottetown | 389 | 383 | 405 | 402 | 407 | +1.3 |
| Prince Edward Island (excl. Charlottetown) | 399 | 416 | 432 | 440 | 450 | +2.3 |
| Eastern Nova Scotia | 419 | 426 | 436 | 449 | 457 | +1.7 |
| Western Nova Scotia | 381 | 391 | 395 | 402 | 405 | +0.9 |
| Halifax | 401 | 414 | 421 | 429 | 439 | +2.5 |
| Fredericton-Moncton | 403 | 415 | 414 | 422 | 429 | +1.7 |
| Madawaska-Charlotte | 394 | 399 | 401 | 408 | 417 | +2.1 |
| Restigouche-Albert | 410 | 428 | 433 | 448 | 450 | +0.5 |
| Gaspésie-Îles-de-la-Madeleine | 407 | 403 | 414 | 422 | 428 | +1.3 |
| Québec | 385 | 397 | 408 | 419 | 433 | +3.3 |
| Trois-Rivières | 382 | 385 | 389 | 408 | 414 | +1.3 |
| South Central Quebec | 389 | 391 | 410 | 406 | 419 | +3.3 |
| Sherbrooke | 390 | 381 | 400 | 404 | 426 | +5.4 |
| Montérégie | 386 | 400 | 402 | 410 | 422 | +2.9 |
| Montreal | 389 | 402 | 407 | 421 | 427 | +1.4 |
| Central Quebec | 382 | 391 | 397 | 406 | 419 | +3.2 |
| North Western Quebec | 388 | 392 | 401 | 413 | 436 | +5.7 |
| Lower Saint Lawrence and North Shore | 402 | 404 | 410 | 417 | 435 | +4.2 |
| Hull | 409 | 412 | 433 | 441 | 450 | +2.2 |
| Chicoutimi-Jonquière | 404 | 405 | 414 | 423 | 425 | +0.7 |
| Ottawa | 453 | 455 | 470 | 473 | 483 | +2.1 |
| Eastern Ontario | 410 | 417 | 432 | 437 | 451 | +3.3 |
| Kingston | 414 | 408 | 434 | 439 | 463 | +5.5 |
| Central Ontario | 399 | 414 | 427 | 435 | 446 | +2.5 |
| Oshawa | 435 | 440 | 449 | 463 | 469 | +1.4 |
| Toronto | 426 | 438 | 446 | 456 | 467 | +2.3 |
| Hamilton | 424 | 425 | 443 | 457 | 469 | +2.4 |
| St. Catharines | 397 | 400 | 409 | 420 | 432 | +3.0 |
| London | 422 | 421 | 432 | 442 | 460 | +4.1 |
| Niagara | 404 | 428 | 431 | 446 | 452 | +1.2 |
| Windsor | 418 | 430 | 419 | 434 | 459 | +5.5 |
| Kitchener | 422 | 426 | 444 | 449 | 469 | +4.6 |
| Huron | 394 | 412 | 422 | 435 | 449 | +3.1 |
| South Central Ontario | 420 | 423 | 444 | 445 | 462 | +3.8 |
| Sudbury | 407 | 432 | 437 | 433 | 462 | +6.7 |
| Thunder Bay | 400 | 445 | 451 | 452 | 463 | +2.4 |
| Northern Ontario | 406 | 420 | 431 | 441 | 456 | +3.4 |
| Winnipeg | 416 | 427 | 437 | 432 | 443 | +2.5 |
| Southern Manitoba | 407 | 412 | 419 | 432 | 440 | +1.8 |
| Northern Manitoba | 409 | 445 | 439 | 437 | 453 | +3.7 |
| Regina | 436 | 451 | 461 | 459 | 471 | +2.7 |
| Saskatoon | 431 | 441 | 449 | 457 | 460 | +0.5 |
| Southern Saskatchewan | 417 | 438 | 447 | 458 | 458 | 0.0 |
| Northern Saskatchewan | 437 | 437 | 454 | 451 | 456 | +1.1 |
| Calgary | 449 | 459 | 465 | 472 | 477 | +1.1 |
| Edmonton | 443 | 456 | 466 | 474 | 483 | +1.9 |
| Northern Alberta | 464 | 472 | 484 | 478 | 494 | +3.4 |
| Southern Alberta | 435 | 439 | 438 | 449 | 462 | +3.0 |
| Southern Interior British Columbia | 403 | 422 | 430 | 438 | 443 | +1.2 |
| Abbotsford | 374 | 378 | 394 | 398 | 411 | +3.0 |
| Vancouver | 417 | 425 | 443 | 448 | 462 | +3.1 |
| Victoria | 428 | 437 | 440 | 463 | 465 | +0.3 |
| Southern Coastal British Columbia | 402 | 416 | 415 | 439 | 449 | +2.2 |
| Northern British Columbia | 418 | 438 | 447 | 450 | 468 | +4.1 |
| Yukon3 | 465 | n/a | n/a | n/a | n/a | n/a |
| Whitehorse | 453 | 474 | 496 | 507 | 508 | +0.3 |
| Yukon (excluding Whitehorse) | 478 | 476 | 485 | 486 | 524 | +7.9 |
| Northwest Territories3 | 475 | n/a | n/a | n/a | n/a | n/a |
| Yellowknife | 482 | 506 | 516 | 509 | 517 | +1.6 |
| Northwest Territories (excl. Yellowknife) | 485 | 499 | 497 | 507 | 507 | +0.1 |
| Nunavut3 | 450 | n/a | n/a | n/a | n/a | n/a |
| Iqaluit | 499 | 528 | 530 | 514 | 536 | +4.3 |
| Nunavut (excl. Iqaluit) | 451 | 441 | 465 | 470 | 482 | +2.4 |
| Canada | 414 | 423 | 432 | 440 | 450 | +2.3 |
- Note: Percentage change is based on unrounded numbers. Includes claims for which at least $1 of EI special benefits was paid.
- 1 Includes maternity, standard parental, sickness and compassionate care benefits. Excludes family caregiver benefits for adults and children due to incompatibility of administrative data sources and extended parental benefits which are calculated at a lower benefit rate.
- 2 Takes into account Family Supplement top-ups paid to claimants with special benefits.
- 3 As of October 12, 2014, there is a total of 62 Employment Insurance (EI) economic regions, instead of 58 regions. The EI economic regions of Prince Edward Island, Yukon, the Northwest Territories and Nunavut were each divided into 2 EI economic regions, 1 consisting of the capital area and the remaining consisting of the non-capital area.
- Source: Employment and Social Development Canada, Employment Insurance (EI) administrative data. Data are based on a 10% sample of EI administrative data.
| EI Economic region | FY1415 | FY1516 | FY1617 | FY1718 | FY1819 | Change (%) FY1718 to FY1819 |
|---|---|---|---|---|---|---|
| St. John's | 44.6 | 43.3 | 47.2 | 48.8 | 46.5 | -4.6 |
| Newfoundland - Labrador | 53.1 | 57.7 | 59.2 | 61.3 | 58.8 | -4.1 |
| Prince Edward Island3 | 33.4 | 4.3 | n/a | n/a | n/a | n/a |
| Charlottetown | 2.3 | 12.1 | 16.4 | 15.6 | 16.0 | +2.4 |
| Prince Edward Island (excl. Charlottetown) | 3.9 | 22.9 | 24.7 | 27.5 | 25.7 | -6.6 |
| Eastern Nova Scotia | 37.9 | 43.6 | 47.2 | 47.6 | 48.0 | +0.7 |
| Western Nova Scotia | 56.6 | 58.7 | 66.2 | 66.6 | 70.3 | +5.5 |
| Halifax | 69.4 | 74.4 | 74.5 | 75.3 | 71.8 | -4.6 |
| Fredericton-Moncton | 77.9 | 79.7 | 91.7 | 84.8 | 93.3 | +9.9 |
| Madawaska-Charlotte | 23.6 | 23.2 | 24.1 | 26.0 | 27.8 | +6.8 |
| Restigouche-Albert | 54.9 | 59.2 | 68.9 | 78.9 | 82.2 | +4.1 |
| Gaspésie-Îles-de-la-Madeleine | 11.7 | 12.4 | 14.5 | 16.3 | 16.6 | +1.7 |
| Québec | 30.4 | 36.8 | 38.8 | 43.0 | 47.8 | +11.3 |
| Trois-Rivières | 8.0 | 8.9 | 9.5 | 10.1 | 10.9 | +8.5 |
| South Central Quebec | 9.9 | 9.9 | 10.4 | 11.1 | 11.3 | +1.9 |
| Sherbrooke | 8.4 | 9.0 | 11.1 | 11.2 | 12.5 | +11.6 |
| Montérégie | 26.2 | 31.4 | 32.5 | 36.5 | 37.2 | +1.9 |
| Montreal | 120.0 | 133.3 | 146.7 | 170.2 | 173.9 | +2.2 |
| Central Quebec | 71.7 | 75.6 | 82.1 | 96.0 | 98.8 | +2.9 |
| North Western Quebec | 16.7 | 15.9 | 17.4 | 22.0 | 22.3 | +1.6 |
| Lower Saint Lawrence and North Shore | 40.8 | 42.6 | 45.4 | 51.4 | 48.7 | -5.3 |
| Hull | 14.8 | 13.8 | 15.4 | 16.8 | 19.6 | +16.8 |
| Chicoutimi-Jonquière | 12.6 | 14.5 | 14.2 | 15.9 | 15.1 | -4.9 |
| Ottawa | 182.1 | 187.2 | 190.0 | 192.2 | 187.3 | -2.5 |
| Eastern Ontario | 72.3 | 78.0 | 82.4 | 85.4 | 92.1 | +7.8 |
| Kingston | 23.4 | 21.9 | 24.2 | 23.4 | 23.6 | +0.8 |
| Central Ontario | 175.7 | 181.9 | 191.5 | 207.3 | 203.1 | -2.0 |
| Oshawa | 72.7 | 73.7 | 76.4 | 79.9 | 74.7 | -6.6 |
| Toronto | 944.5 | 990.5 | 1028.4 | 1064.9 | 1051.2 | -1.3 |
| Hamilton | 120.8 | 129.6 | 132.2 | 139.5 | 132.9 | -4.7 |
| St. Catharines | 54.8 | 56.0 | 62.0 | 66.0 | 61.8 | -6.3 |
| London | 74.0 | 81.6 | 81.1 | 85.9 | 87.8 | +2.2 |
| Niagara | 53.1 | 62.7 | 60.7 | 64.9 | 71.0 | +9.2 |
| Windsor | 45.8 | 48.7 | 45.6 | 48.1 | 57.5 | +19.4 |
| Kitchener | 93.0 | 90.1 | 97.2 | 101.7 | 109.2 | +7.4 |
| Huron | 47.0 | 49.1 | 60.6 | 66.6 | 62.7 | -5.9 |
| South Central Ontario | 82.1 | 82.7 | 93.0 | 97.5 | 103.8 | +6.4 |
| Sudbury | 26.1 | 24.5 | 29.5 | 28.8 | 29.1 | +0.9 |
| Thunder Bay | 20.6 | 20.0 | 22.0 | 22.3 | 19.3 | -13.2 |
| Northern Ontario | 82.9 | 92.8 | 90.5 | 95.2 | 95.0 | -0.2 |
| Winnipeg | 133.3 | 147.1 | 141.3 | 150.2 | 147.8 | -1.6 |
| Southern Manitoba | 57.4 | 57.9 | 61.5 | 62.9 | 67.6 | +7.4 |
| Northern Manitoba | 21.3 | 18.9 | 20.6 | 22.3 | 21.7 | -2.6 |
| Regina | 45.4 | 49.8 | 54.3 | 56.2 | 57.0 | +1.5 |
| Saskatoon | 57.5 | 60.6 | 66.5 | 69.2 | 71.2 | +2.9 |
| Southern Saskatchewan | 45.8 | 53.8 | 54.2 | 55.5 | 59.0 | +6.4 |
| Northern Saskatchewan | 39.0 | 43.3 | 42.4 | 44.6 | 43.4 | -2.6 |
| Calgary | 272.5 | 294.0 | 301.6 | 302.5 | 299.7 | -0.9 |
| Edmonton | 254.5 | 284.5 | 297.3 | 288.0 | 289.9 | +0.7 |
| Northern Alberta | 59.8 | 67.6 | 69.5 | 60.4 | 59.2 | -2.0 |
| Southern Alberta | 172.5 | 198.9 | 191.4 | 195.2 | 189.6 | -2.9 |
| Southern Interior British Columbia | 100.4 | 111.0 | 120.4 | 123.5 | 122.0 | -1.2 |
| Abbotsford | 37.4 | 38.8 | 43.8 | 44.1 | 42.8 | -2.9 |
| Vancouver | 406.3 | 418.7 | 430.5 | 455.7 | 459.8 | +0.9 |
| Victoria | 56.4 | 57.7 | 61.4 | 63.9 | 61.0 | -4.5 |
| Southern Coastal British Columbia | 86.5 | 92.4 | 95.8 | 106.8 | 106.9 | 0.0 |
| Northern British Columbia | 61.9 | 58.4 | 63.1 | 71.6 | 67.2 | -6.2 |
| Yukon3 | 7.0 | 0.9 | n/a | n/a | n/a | n/a |
| Whitehorse | 0.6 | 5.1 | 7.6 | 8.0 | 7.1 | -12.0 |
| Yukon (excluding Whitehorse) | 0.1 | 1.3 | 0.9 | 0.8 | 1.4 | +88.2 |
| Northwest Territories3 | 7.6 | 1.0 | n/a | n/a | n/a | n/a |
| Yellowknife | 0.5 | 3.9 | 5.7 | 5.0 | 4.9 | -1.6 |
| Northwest Territories (excl. Yellowknife) | 0.4 | 3.1 | 4.3 | 4.6 | 4.4 | -5.2 |
| Nunavut3 | 4.4 | 0.5 | n/a | n/a | n/a | n/a |
| Iqaluit | 0.3 | 1.8 | 1.5 | 2.1 | 2.5 | +20.1 |
| Nunavut (excl. Iqaluit) | 0.2 | 3.4 | 3.5 | 5.0 | 5.7 | +13.0 |
| Canada | 4,928.7 | 5,228.8 | 5,464.6 | 5,700.8 | 5,709.0 | +0.1 |
- Note: Data may not add up to the total due to rounding. Percentage change is based on unrounded numbers. Includes claims for which at least $1 of EI special benefits was paid.
- 1 Includes maternity, parental, sickness, and compassionate care benefits. Excludes family caregiver benefits for adults and children due to incompatibility of administrative data sources. Therefore, total amounts paid in EI special benefits do not match those in annex 2.11.3.
- 2 Takes into account Family Supplement top-ups paid to claimants with special benefits.
- 3 As of October 12, 2014, there is a total of 62 Employment Insurance (EI) economic regions, instead of 58 regions. The EI economic regions of Prince Edward Island, Yukon, the Northwest Territories and Nunavut were each divided into 2 EI economic regions, 1 consisting of the capital area and the remaining consisting of the non-capital area. Amounts paid were registered in FY1516 in the 4 former EI economic regions in spite of the change in EI economic region boundaries because some claims established just prior to that change had continued to be paid in FY1516.
- Source: Employment and Social Development Canada, Employment Insurance (EI) administrative data. Data are based on a 10% sample of EI administrative data.
| Industry | Distribution of firms (#) 2017 | Distribution of firms (%) 2017 | Distribution of the firm’s workforce1 (#) 2017 | Distribution of the firm’s workforce1 (%) 2017 | EI regular claimant distribution2 (#) 2017 | EI regular claimant distribution2 (%) 2017 | EI special claimant distribution2 (#) 2017 | EI special claimant distribution2 (%) 2017 |
|---|---|---|---|---|---|---|---|---|
| Goods-producing industries | 266,720 | 22.0 | 3,749,920 | 19.5 | 671,220 | 38.9 | 163,360 | 19.9 |
| Agriculture, forestry, fishing and hunting | 52,800 | 4.4 | 334,400 | 1.7 | 66,580 | 3.9 | 17,160 | 2.1 |
| Mining, and oil and gas extraction | 8,810 | 0.7 | 220,320 | 1.1 | 34,000 | 2.0 | 6,990 | 0.9 |
| Utilities | 850 | 0.1 | 117,730 | 0.6 | 5,990 | 0.3 | 2,720 | 0.3 |
| Construction | 154,830 | 12.8 | 1,308,790 | 6.8 | 380,890 | 22.1 | 58,120 | 7.1 |
| Manufacturing | 49,430 | 4.1 | 1,768,680 | 9.2 | 183,760 | 10.6 | 78,380 | 9.6 |
| Services-producing industries | 879,190 | 72.6 | 15,299,750 | 79.6 | 1,042,040 | 60.4 | 650,570 | 79.4 |
| Wholesale trade | 47,410 | 3.9 | 845,320 | 4.4 | 59,750 | 3.5 | 30,410 | 3.7 |
| Retail trade | 104,660 | 8.6 | 2,184,030 | 11.4 | 108,270 | 6.3 | 90,310 | 11.0 |
| Transportation and warehousing | 75,240 | 6.2 | 827,790 | 4.3 | 80,630 | 4.7 | 34,890 | 4.3 |
| Finance and insurance | 33,310 | 2.7 | 748,580 | 3.9 | 21,420 | 1.2 | 28,380 | 3.5 |
| Professional, scientific and technical services | 156,760 | 12.9 | 1,101,140 | 5.7 | 76,500 | 4.4 | 34,210 | 4.2 |
| Real estate and rental and leasing | 54,010 | 4.5 | 343,040 | 1.8 | 26,540 | 1.5 | 13,360 | 1.6 |
| Business, building and other support services3 | 59,350 | 4.9 | 1,292,750 | 6.7 | 129,530 | 7.5 | 56,790 | 6.9 |
| Educational services | 14,580 | 1.2 | 1,403,940 | 7.3 | 178,600 | 10.3 | 51,030 | 6.2 |
| Health care and social assistance | 109,650 | 9.0 | 1,676,160 | 8.7 | 69,430 | 4.0 | 113,130 | 13.8 |
| Information, culture and recreation4 | 32,540 | 2.7 | 688,430 | 3.6 | 54,750 | 3.2 | 20,260 | 2.5 |
| Accommodation and food services | 77,170 | 6.4 | 1,545,300 | 8.0 | 88,980 | 5.2 | 62,120 | 7.6 |
| Other services (except public administration) | 109,320 | 9.0 | 748,360 | 3.9 | 57,320 | 3.3 | 33,100 | 4.0 |
| Public administration | 5,210 | 0.4 | 1,894,920 | 9.9 | 90,340 | 5.2 | 82,600 | 10.1 |
| Unclassified* | 65,920 | 5.4 | 180,980 | 0.9 | 13,340 | 0.8 | 5,210 | 0.6 |
| Canada | 12,11,830 | 100.0 | 19,230,660 | 100.0 | 1,726,610 | 100.0 | 819,150 | 100.0 |
- Note: Data may not add up to the total due to rounding.
- 1 The number of workers in a firm is the number of individuals paid employment income by that firm, as indicated on a T4 form. The number of workers is adjusted so that each individual in the labour force is only counted once and individuals who work for more than 1 firm are taken into account. For example, if an employee earned $25,000 in firm 1 and $25,000 in firm 2, then he or she was recorded as 0.5 employees at the first firm and 0.5 employees at the second firm.
- 2 These columns are based on the number of people receiving EI regular and/or special benefits in 2017.
- 3 This industry category comprises the industries with codes 55 (Management of companies and enterprises) and 56 (Administrative and support, waste management and mediation services) from the North American Industry Classification System.
- 4 This industry category comprises the industries with codes 51 (Information and cultural industries) and 71 (Arts, entertainment and recreation) from the North American Industry Classification System.
- * For some claims, this information was not available in the data.
- Sources: Employment and Social Development Canada, Employment Insurance (EI) administrative data. Data are based on a 100% sample of EI data. Canada Revenue Agency (CRA) administrative data. CRA data are based on a 100% sample.
Annex 2.14 – Maternity benefits
| Category | FY1415 | FY1516 | FY1617 | FY1718 | FY1819 | Change (%) FY1718 to FY1819 |
|---|---|---|---|---|---|---|
| Newfoundland and Labrador | 2,730 | 2,970 | 2,750 | 2,730 | 2,550 | -6.6 |
| Prince Edward Island | 1,060 | 1,050 | 1,030 | 900 | 890 | -1.1 |
| Nova Scotia | 5,430 | 5,680 | 5,000 | 5,060 | 5,410 | +6.9 |
| New Brunswick | 4,230 | 4,410 | 4,130 | 4,180 | 4,350 | +4.1 |
| Quebec2 | n/a | n/a | n/a | n/a | n/a | n/a |
| Ontario | 82,350 | 84,190 | 83,770 | 83,920 | 83,500 | -0.5 |
| Manitoba | 8,090 | 8,870 | 8,150 | 8,610 | 8,580 | -0.3 |
| Saskatchewan | 7,780 | 8,330 | 7,760 | 8,330 | 8,340 | +0.1 |
| Alberta | 31,070 | 31,860 | 30,580 | 29,470 | 29,360 | -0.4 |
| British Columbia | 25,690 | 26,300 | 26,340 | 27,430 | 26,110 | -4.8 |
| Yukon | 250 | 290 | 280 | 240 | 280 | +16.7 |
| Northwest Territories | 260 | 360 | 320 | 300 | 380 | +26.7 |
| Nunavut | 140 | 200 | 220 | 300 | 260 | -13.3 |
| 24 years old and under | 17,520 | 16,990 | 15,470 | 15,080 | 14,120 | -6.4 |
| 25 to 29 years old | 49,300 | 49,060 | 47,800 | 46,170 | 45,120 | -2.3 |
| 30 to 34 years old | 66,320 | 70,100 | 68,500 | 68,610 | 68,240 | -0.5 |
| 35 to 39 years old | 30,270 | 32,470 | 32,420 | 34,660 | 35,600 | +2.7 |
| 40 years old and over | 5,670 | 5,890 | 6,140 | 6,950 | 6,930 | -0.3 |
| Canada | 169,080 | 174,510 | 170,330 | 171,470 | 170,010 | -0.9 |
- Note: Includes claims for which at least $1 of EI maternity benefits was paid.
- 1 Figures also include maternity benefits for self-employed individuals.
- 2 Since January 2006, Quebec has administered its own maternity benefits under the Quebec Parental Insurance Plan.
- Source: Employment and Social Development Canada, Employment Insurance (EI) administrative data. Data are based on a 10% sample of EI administrative data.
| Category | FY1415 | FY1516 | FY1617 | FY1718 | FY1819P | Change (%) FY1718 to FY1819 |
|---|---|---|---|---|---|---|
| Newfoundland and Labrador | 14.2 | 14.1 | 14.3 | 14.3 | 14.2 | -1.0 |
| Prince Edward Island | 14.2 | 14.2 | 14.6 | 14.5 | 14.1 | -2.6 |
| Nova Scotia | 14.6 | 14.5 | 14.7 | 14.7 | 14.6 | -1.2 |
| New Brunswick | 14.6 | 14.7 | 14.7 | 14.6 | 14.5 | -1.0 |
| Quebec1 | n/a | n/a | n/a | n/a | n/a | n/a |
| Ontario | 14.6r | 14.6r | 14.6 | 14.7 | 14.6 | -0.2 |
| Manitoba | 14.8 | 14.6 | 14.7 | 14.6 | 14.7 | +0.8 |
| Saskatchewan | 14.7 | 14.7 | 14.7 | 14.7 | 14.7 | +0.1 |
| Alberta | 14.6 | 14.6 | 14.6 | 14.7 | 14.6 | -0.2 |
| British Columbia | 14.7 | 14.7 | 14.6 | 14.7 | 14.7 | 0.0 |
| Yukon | 14.4 | 14.5 | 14.4 | 15.0 | 14.3 | -4.8 |
| Northwest Territories | 14.6 | 14.8 | 14.2 | 14.3 | 13.1 | -8.3 |
| Nunavut | 14.8 | 14.0 | 14.5 | 14.3 | 14.8 | +3.4 |
| 24 years old and under | 14.6 | 14.7 | 14.6 | 14.6 | 14.6 | -0.4 |
| 25 to 29 years old | 14.7 | 14.7 | 14.6 | 14.6r | 14.6 | -0.2 |
| 30 to 34 years old | 14.6 | 14.6 | 14.7 | 14.7 | 14.7 | -0.2 |
| 35 to 39 years old | 14.6 | 14.7 | 14.6 | 14.6 | 14.6 | 0.0 |
| 40 years old and over | 14.5 | 14.5 | 14.6 | 14.6r | 14.6 | -0.6 |
| Canada | 14.6 | 14.6 | 14.6 | 14.7 | 14.6 | -0.2 |
- Note: Percentage change is based on unrounded numbers. Includes claims for which at least $1 of EI maternity benefits was paid. Based on completed claims which include those that are terminated and those that are dormant and remained inactive as of August of the following fiscal year.
- 1 Since January 2006, Quebec has administered its own maternity benefits under the Quebec Parental Insurance Plan.
- p Preliminary.
- r Revised.
- Source: Employment and Social Development Canada. Employment Insurance (EI) administrative data. Data are based on a 10% sample of EI administrative data.
| Category | FY1415 | FY1516 | FY1617 | FY1718 | FY1819 | Change (%) FY1718 to FY1819 |
|---|---|---|---|---|---|---|
| Newfoundland and Labrador | 430 | 424 | 450 | 438 | 470 | +7.1 |
| Prince Edward Island | 421 | 432 | 436 | 446 | 441 | -1.0 |
| Nova Scotia | 394 | 409 | 411 | 425 | 436 | +2.5 |
| New Brunswick | 403 | 414 | 424 | 431 | 433 | +0.4 |
| Quebec2 | n/a | n/a | n/a | n/a | n/a | n/a |
| Ontario | 429 | 439 | 447r | 457 | 470 | +2.8 |
| Manitoba | 407 | 416 | 432 | 422 | 438 | +3.8 |
| Saskatchewan | 427 | 439 | 455 | 452 | 461 | +2.1 |
| Alberta | 441 | 449 | 462 | 467 | 475 | +1.7 |
| British Columbia | 421 | 428 | 437 | 449 | 462 | +2.8 |
| Yukon | 438 | 474 | 493 | 518 | 506 | -2.3 |
| Northwest Territories | 492 | 495 | 499 | 499 | 503 | +0.9 |
| Nunavut | 434 | 453 | 480 | 469 | 466 | -0.6 |
| 24 years old and under | 315 | 325 | 326 | 335 | 355 | +5.9 |
| 25 to 29 years old | 411 | 419 | 430 | 435 | 447 | +2.6 |
| 30 to 34 years old | 451 | 459 | 469 | 475 | 486 | +2.3 |
| 35 to 39 years old | 460 | 468 | 476 | 482 | 491 | +1.8 |
| 40 years old and over | 459 | 462 | 475 | 480 | 482 | +0.5 |
| Canada | 427 | 436 | 447 | 454 | 465 | +2.6 |
- Note: Percentage change is based on unrounded numbers. Includes claims for which at least $1 of EI maternity benefits was paid.
- 1 Takes into account Family Supplement top-ups paid to claimants with maternity benefits.
- 2 Since January 2006, Quebec has administered its own maternity benefits under the Quebec Parental Insurance Plan.
- r Revised.
- Source: Employment and Social Development Canada, Employment Insurance (EI) administrative data. Data are based on a 10% sample of EI administrative data.
| Category | FY1415 | FY1516 | FY1617 | FY1718 | FY1819 | Change (%) FY1718 to FY1819 |
|---|---|---|---|---|---|---|
| Newfoundland and Labrador | 17.6 | 17.7 | 18.5 | 17.8 | 17.5 | -1.4 |
| Prince Edward Island | 6.9 | 6.5 | 6.2 | 6.5 | 5.9 | -10.3 |
| Nova Scotia | 32.1 | 33.1 | 32.0 | 31.4 | 33.3 | +6.0 |
| New Brunswick | 25.6 | 25.6 | 27.9 | 25.1 | 27.7 | +10.7 |
| Quebec2 | n/a | n/a | n/a | n/a | n/a | n/a |
| Ontario | 522.4 | 542.6 | 556.9 | 566.4 | 576.3 | +1.7 |
| Manitoba | 49.5 | 53.1 | 51.5 | 55.4 | 55.5 | +0.3 |
| Saskatchewan | 48.2 | 52.3 | 53.0 | 55.4 | 58.1 | +5.0 |
| Alberta | 198.1 | 209.5 | 212.9 | 206.2 | 203.9 | -1.1 |
| British Columbia | 159.7 | 165.2 | 172.6 | 179.9 | 179.5 | -0.2 |
| Yukon | 1.5 | 1.9 | 2.0 | 1.9 | 2.1 | +11.2 |
| Northwest Territories | 2.0 | 2.1 | 2.5 | 2.3 | 2.5 | +10.4 |
| Nunavut | 0.8 | 1.3 | 1.3 | 2.1 | 1.8 | -14.8 |
| 24 years old and under | 80.3 | 81.9 | 77.4 | 76.1 | 75.6 | -0.8 |
| 25 to 29 years old | 297.2 | 302.6 | 308.1 | 297.1 | 299.1 | +0.7 |
| 30 to 34 years old | 440.9 | 466.0 | 480.6 | 484.5 | 485.2 | +0.1 |
| 35 to 39 years old | 207.4 | 219.7 | 229.3 | 245.5 | 255.2 | +4.0 |
| 40 years old and over | 38.6 | 40.6 | 41.9 | 47.1 | 49.0 | +4.2 |
| Canada | 1,064.3 | 1,110.9 | 1,137.3 | 1,150.3 | 1,164.1 | +1.2 |
- Note: Data may not add up to the total due to rounding. Percentage change is based on unrounded numbers. Includes claims for which at least $1 of EI maternity benefits was paid.
- 1 Takes into account Family Supplement top-ups paid to claimants with maternity benefits.
- 2 Since January 2006, Quebec has administered its own maternity benefits under the Quebec Parental Insurance Plan.
- Source: Employment and Social Development Canada, Employment Insurance (EI) administrative data. Data are based on a 10% sample of EI administrative data.
Annex 2.15 – Parental benefits (biological and adoptive)
| Category | FY1415 | FY1516 | FY1617 | FY1718 Standard1 | FY1718 Extended2 | FY1718 Total | FY1819 Standard1 | FY1819 Extended2 | FY1819 Total | Change (%) FY1718 to FY1819 (Total) |
|---|---|---|---|---|---|---|---|---|---|---|
| Newfoundland and Labrador | 2,820 | 2,960 | 2,930 | 2,720 | 70 | 2,790 | 2,440 | 280 | 2,720 | -2.5 |
| Prince Edward Island | 1,150 | 1,140 | 1,130 | 950 | 50 | 1,000 | 930 | 30 | 960 | -4.0 |
| Nova Scotia | 6,110 | 6,470 | 5,970 | 5,620 | 210 | 5,830 | 5,430 | 760 | 6,190 | +6.2 |
| New Brunswick | 4,720 | 4,940 | 4,580 | 4,550 | 160 | 4,710 | 4,500 | 460 | 4,960 | +5.3 |
| Quebec3 | n/a | n/a | n/a | n/a | n/a | n/a | n/a | n/a | n/a | n/a |
| Ontario | 94,920 | 96,390 | 98,370 | 92,770 | 5,110 | 97,880 | 80,900 | 18,720 | 99,620 | +1.8 |
| Manitoba | 9,380 | 9,970 | 9,440 | 9,780 | 270 | 10,050 | 8,970 | 1,250 | 10,220 | +1.7 |
| Saskatchewan | 8,470 | 9,140 | 8,720 | 9,030 | 260 | 9,290 | 8,610 | 870 | 9,480 | +2.0 |
| Alberta | 33,640 | 34,830 | 33,480 | 31,760 | 1,370 | 33,130 | 29,370 | 4,470 | 33,840 | +2.1 |
| British Columbia | 29,210 | 29,670 | 30,340 | 31,090 | 1,160 | 32,250 | 25,840 | 4,950 | 30,790 | -4.5 |
| Yukon | 340 | 340 | 330 | 1,080c | 40c | 310 | 1,130c | 120c | 400 | +29.0 |
| Northwest Territories | 350 | 480 | 390 | 1,080c | 40c | 430 | 1,130c | 120c | 490 | +14.0 |
| Nunavut | 210 | 330 | 280 | 1,080c | 40c | 380 | 1,130c | 120c | 360 | -5.3 |
| Men | 26,540 | 26,690 | 29,490 | 30,390 | 460 | 30,850 | 30,030 | 3,570 | 33,600 | +8.9 |
| Women | 164,780 | 169,970 | 166,470 | 158,960 | 8,240 | 167,200 | 138,090 | 28,340 | 166,430 | -0.5 |
| 24 years old and under | 17,500 | 17,030 | 15,840 | 14,700 | 720 | 15,420 | 12,640 | 2,020 | 14,660 | -4.9 |
| 25 to 29 years old | 52,010 | 51,830 | 51,080 | 47,450 | 1,930 | 49,380 | 42,080 | 6,890 | 48,970 | -0.8 |
| 30 to 34 years old | 74,080 | 77,880 | 77,230 | 74,620 | 3,400 | 78,020 | 66,110 | 12,660 | 78,770 | +1.0 |
| 35 to 39 years old | 36,980 | 39,010 | 40,360 | 40,670 | 2,100 | 42,770 | 36,850 | 8,100 | 44,950 | +5.1 |
| 40 years old and over | 10,750 | 10,910 | 11,450 | 11,910 | 550 | 12,460 | 10,440 | 2,240 | 12,680 | +1.8 |
| Canada | 191,320 | 196,660 | 195,960 | 189,350 | 8,700 | 198,050 | 168,120 | 31,910 | 200,030 | +1.0 |
- Note: Includes claims for which at least $1 of EI parental benefits was paid. Parental benefits that are shared between 2 parents are considered as 2 separate claims.
- 1 Starting December 3, 2017, parents can choose between receiving standard or extended parental benefits. Standard parental benefits are equivalent to the parental benefits offered in previous fiscal years, that is, up to 35 weeks of parental benefits paid at 55% of the average weekly insurable earnings.
- 2 Extended parental benefits offer up to 61 weeks of parental benefits paid at 33% of the average weekly insurable earnings.
- 3 Since January 2006, Quebec has administered its own parental benefits under the Quebec Parental Insurance Plan.
- c For confidentiality purposes, data for Yukon, Northwest Territories and Nunavut have been combined.
- Source: Employment and Social Development Canada, Employment Insurance (EI) administrative data. Data are based on a 10% sample of EI administrative data.
| Category | FY1415 | FY1516 | FY1617 | FY1718 Standard only1 | FY1819P Standard only1 | Change (%) FY1718 to FY1819 |
|---|---|---|---|---|---|---|
| Newfoundland and Labrador | 30.6 | 30.9 | 29.9 | 30.4 | 29.9 | -1.7 |
| Prince Edward Island | 30.7 | 30.2 | 29.9 | 29.7 | 31.0 | +4.4 |
| Nova Scotia | 29.4 | 28.7 | 29.5 | 29.4r | 28.7 | -2.2 |
| New Brunswick | 30.2 | 29.8 | 29.7 | 29.3 | 29.9 | +1.8 |
| Quebec2 | n/a | n/a | n/a | n/a | n/a | n/a |
| Ontario | 30.1r | 30.2r | 29.9r | 30.0 | 30.0 | 0.0 |
| Manitoba | 30.5 | 30.5 | 30.3 | 29.7 | 29.8 | +0.4 |
| Saskatchewan | 31.2 | 31.3 | 30.9 | 31.0 | 30.6 | -1.4 |
| Alberta | 31.4 | 31.0 | 30.9 | 30.6 | 30.5 | -0.6 |
| British Columbia | 30.5 | 30.5 | 30.0 | 29.7r | 30.1 | +1.2 |
| Yukon | 25.9 | 28.1 | 27.8 | 26.3r | 27.4 | +3.9 |
| Northwest Territories | 26.5 | 25.7 | 27.8 | 24.4 | 27.0 | +10.9 |
| Nunavut | 28.6 | 24.0 | 27.3 | 25.1 | 30.8 | +23.0 |
| Men | 16.5 | 16.6 | 16.1 | 16.3r | 16.0 | -1.8 |
| Women | 32.6 | 32.6 | 32.6 | 32.5 | 32.7 | +0.6 |
| 24 years old and under | 31.8 | 31.6 | 31.4 | 31.4r | 31.2 | -0.6 |
| 25 to 29 years old | 31.2 | 31.4 | 31.2 | 31.0 | 31.3 | +0.8 |
| 30 to 34 years old | 30.6 | 30.5 | 30.3 | 30.2 | 30.3 | +0.3 |
| 35 to 39 years old | 29.4 | 29.4 | 29.2 | 29.0r | 29.0 | +0.1 |
| 40 years old and over | 26.2 | 26.0 | 25.5 | 26.2r | 25.7 | -1.8 |
| Canada | 30.4 | 30.4 | 30.1 | 30.0 | 30.1 | +0.1 |
- Note: Percentage change is based on unrounded numbers. Includes claims for which at least $1 of EI parental benefits was paid. Based on completed claims which include those that are terminated and those that are dormant and remained inactive as of August the following fiscal year.
- 1 Starting December 3, 2017, parents can choose between receiving standard or extended parental benefits. Standard parental benefits are equivalent to the parental benefits offered in previous fiscal years, that is, up to 35 weeks of parental benefits at 55% of the average weekly insurable earnings. Extended parental benefits offer up to 61 weeks of benefits at 33% of the average weekly insurable earnings. Given the low number of completed extended parental claims in FY1718 and FY1819, duration estimates for those claims are not reported.
- 2 Since January 2006, Quebec has administered its own maternity benefits under the Quebec Parental Insurance Plan.
- p Preliminary.
- r Revised.
- Source: Employment and Social Development Canada. Employment Insurance (EI) administrative data. Data are based on a 10% sample of EI administrative data.
| Category | FY1415 | FY1516 | FY1617 | FY1718 Standard2 |
FY1718 Extended3 |
FY1819
Standard2 |
FY1819 Extended3 |
Change (%) FY1718 to FY1819 (Standard) |
Change (%) FY1718 to FY1819 (Extended) |
|---|---|---|---|---|---|---|---|---|---|
| Newfoundland and Labrador | 433 | 441 | 460 | 448 | 289 | 478 | 311 | +6,8 | +7,8 |
| Prince Edward Island | 428 | 438 | 440 | 449 | 281 | 453 | 279 | +0.8 | -0.5 |
| Nova Scotia | 411 | 427 | 432 | 446 | 277 | 452 | 281 | +1.4 | +1.5 |
| New Brunswick | 418 | 425 | 434 | 442 | 261 | 442 | 280 | +0.1 | +7.0 |
| Quebec4 | n/a | n/a | n/a | n/a | n/a | n/a | n/a | n/a | n/a |
| Ontario | 438 | 448 | 458 | 466 | 289 | 478 | 300 | +2.6 | +3.8 |
| Manitoba | 419 | 427 | 444 | 435 | 286 | 452 | 277 | +4.0 | -3.2 |
| Saskatchewan | 433 | 448 | 463 | 464 | 242 | 474 | 287 | +2.3 | +19.0 |
| Alberta | 448 | 457 | 468 | 475 | 291 | 483 | 296 | +1.9 | +1.8 |
| British Columbia | 434 | 440 | 450 | 462 | 280 | 473 | 294 | +2.5 | +5.0 |
| Yukon | 469 | 483 | 498 | 520 | 328c | 523 | 298c | +0.6 | -8.9 |
| Northwest Territories | 498 | 503 | 513 | 502 | 328c | 512 | 298c | +1.8 | -8.9 |
| Nunavut | 451 | 464 | 491 | 478 | 328c | 493 | 298c | +3.2 | -8.9 |
| Men | 480 | 491 | 503 | 507 | 310 | 517 | 321 | +2.0 | +3.5 |
| Women | 430 | 439 | 449 | 455 | 285 | 466 | 294 | +2.3 | +3.2 |
| 24 years old and under | 327 | 336 | 336 | 346 | 243 | 372 | 254 | +7.3 | +4.2 |
| 25 to 29 years old | 417 | 426 | 438 | 443 | 267 | 454 | 285 | +2.4 | +6.7 |
| 30 to 34 years old | 457 | 465 | 476 | 481 | 294 | 491 | 302 | +2.2 | +2.8 |
| 35 to 39 years old | 468 | 475 | 484 | 490 | 298 | 499 | 306 | +1.7 | +2.7 |
| 40 years old and over | 466 | 477 | 489 | 493 | 315 | 499 | 309 | +1.1 | -1.9 |
| Canada | 437 | 446 | 457 | 464 | 286 | 475 | 297 | +2.4 | +3.7 |
- Note: Percentage change is based on unrounded numbers. Includes claims for which at least $1 of EI parental benefits was paid.
- 1 Takes into account Family Supplement top-ups paid to claimants with parental benefits.
- 2 Starting December 3, 2017, parents can choose between receiving standard or extended parental benefits. Standard parental benefits are equivalent to the parental benefits offered in previous fiscal years, that is, up to 35 weeks of parental benefits paid at 55% of the average weekly insurable earnings.
- 3 Extended parental benefits offer up to 61 weeks of parental benefits paid at 33% of the average weekly insurable earnings.
- 4 Since January 2006, Quebec has administered its own parental benefits under the Quebec Parental Insurance Plan.
- c For confidentiality purposes, data for Yukon, Northwest Territories and Nunavut have been combined.
- Source: Employment and Social Development Canada, Employment Insurance (EI) administrative data. Data are based on a 10% sample of EI administrative data.
| Category | FY1415 | FY1516 | FY1617 | FY1718 Standard2 |
FY1718 Extended3 |
FY1718 Total |
FY1819 Standard2 |
FY1819 Extended3 |
FY1819 Total |
Change (%) FY1718 to FY1819 (Total) |
|---|---|---|---|---|---|---|---|---|---|---|
| Newfoundland and Labrador | 41.3 | 39.9 | 42.0 | 42.6 | 0.0 | 42.6 | 36.7 | 1.7 | 38.4 | -10.0 |
| Prince Edward Island | 15.7 | 15.4 | 14.4 | 15.0 | 0.0 | 15.1 | 13.8 | 0.5 | 14.3 | -5.2 |
| Nova Scotia | 72.4 | 77.0 | 79.4 | 77.1 | 0.0 | 77.1 | 69.6 | 4.5 | 74.0 | -4.0 |
| New Brunswick | 59.0 | 61.8 | 62.5 | 59.8 | 0.0 | 59.8 | 60.2 | 3.1 | 63.3 | +5.8 |
| Quebec4 | n/a | n/a | n/a | n/a | n/a | n/a | n/a | n/a | n/a | n/a |
| Ontario | 1,258.4 | 1,297.7 | 1,328.0 | 1,374.9 | 0.5 | 1,375.4 | 1,215.7 | 131.3 | 1,347.0 | -2.1 |
| Manitoba | 120.3 | 125.0 | 126.1 | 130.9 | 0.0 | 131.0 | 124.6 | 6.9 | 131.6 | +0.4 |
| Saskatchewan | 110.3 | 121.1 | 127.8 | 133.6 | 0.0 | 133.6 | 129.4 | 5.6 | 135.0 | +1.0 |
| Alberta | 446.7 | 497.7 | 501.7 | 495.1 | 0.2 | 495.3 | 445.3 | 32.3 | 477.6 | -3.6 |
| British Columbia | 382.3 | 395.9 | 409.5 | 433.3 | 0.1 | 433.4 | 401.3 | 30.2 | 431.5 | -0.5 |
| Yukon | 4.9 | 3.4 | 4.2 | 5.0 | 0.0c | 5.0 | 4.5 | 0.7c | 4.7 | -6.6 |
| Northwest Territories | 5.3 | 4.6 | 6.6 | 5.7 | 0.0c | 5.7 | 5.3 | 0.7c | 5.4 | -6.0 |
| Nunavut | 3.4 | 3.9 | 2.8 | 4.1 | 0.0c | 4.1 | 5.1 | 0.7c | 5.5 | +34.5 |
| Men | 205.1 | 213.5 | 233.7 | 251.8 | 0.6 | 252.4 | 242.4 | 15.1 | 257.4 | +2.0 |
| Women | 2,314.9 | 2,430.0 | 2,471.4 | 2,525.4 | 0.4 | 2,525.7 | 2,269.1 | 201.5 | 2,470.6 | -2.2 |
| 24 years old and under | 183.0 | 191.9 | 177.8 | 176.0 | 0.1 | 176.1 | 157.9 | 11.8 | 169.7 | -3.6 |
| 25 to 29 years old | 683.1 | 705.8 | 707.4 | 698.4 | 0.2 | 698.6 | 640.1 | 44.7 | 684.9 | -2.0 |
| 30 to 34 years old | 1,010.3 | 1,080.1 | 1,116.0 | 1,154.2 | 0.4 | 1,154.6 | 1,027.4 | 89.3 | 1,116.7 | -3.3 |
| 35 to 39 years old | 514.1 | 530.6 | 565.6 | 595.2 | 0.2 | 595.4 | 547.9 | 55.5 | 603.3 | +1.3 |
| 40 years old and over | 129.5 | 135.1 | 138.3 | 153.4 | 0.1 | 153.5 | 138.2 | 15.3 | 153.4 | 0.0 |
| Canada | 2,520.1 | 2,643.5 | 2,705.1 | 2,777.1 | 1.0 | 2,778.1 | 2,511.5 | 216.6 | 2,728.0 | -1.8 |
- Note: Data may not add up to the total due to rounding. Percentage change is based on unrounded numbers. Includes claims for which at least $1 of EI parental benefits was paid.
- 1 Takes into account Family Supplement top-ups paid to claimants with parental benefits.
- 2 Starting December 3, 2017, parents can choose between receiving standard or extended parental benefits. Standard parental benefits are equivalent to the parental benefits offered in previous fiscal years, that is, up to 35 weeks of parental benefits paid at 55% of the average weekly insurable earnings.
- 3 Extended parental benefits offer up to 61 weeks of parental benefits paid at 33% of the average weekly insurable earnings.
- 4 Since January 2006, Quebec has administered its own parental benefits under the Quebec Parental Insurance Plan.
- c For confidentiality purposes, data for Yukon, Northwest Territories and Nunavut have been combined.
- Source: Employment and Social Development Canada, Employment Insurance (EI) administrative data. Data are based on a 10% sample of EI administrative data.
Annex 2.16 – Sickness benefits
| Category | FY1415 | FY1516 | FY1617 | FY1718 | FY1819 | Change (%) FY1718 to FY1819 |
|---|---|---|---|---|---|---|
| Newfoundland and Labrador | 9,930 | 10,170 | 10,140 | 11,070 | 11,500 | +3.9 |
| Prince Edward Island | 5,520 | 5,780 | 6,000 | 6,100 | 5,960 | -2.3 |
| Nova Scotia | 16,570 | 18,500 | 19,070 | 21,060 | 21,130 | +0.3 |
| New Brunswick | 21,080 | 22,800 | 24,830 | 29,440 | 30,080 | +2.2 |
| Quebec | 105,880 | 111,420 | 119,210 | 131,510 | 134,600 | +2.3 |
| Ontario | 93,470 | 99,060 | 105,010 | 111,480 | 112,990 | +1.4 |
| Manitoba | 9,990 | 10,590 | 9,970 | 11,250 | 11,030 | -2.0 |
| Saskatchewan | 6,910 | 7,640 | 7,060 | 7,670 | 8,200 | +6.9 |
| Alberta | 25,430 | 29,240 | 26,520 | 27,750 | 31,430 | +13.3 |
| British Columbia | 49,580 | 49,490 | 50,170 | 53,710 | 53,190 | -1.0 |
| Yukon | 330 | 430 | 420 | 450 | 300 | -33.3 |
| Northwest Territories | 250 | 250 | 200 | 250 | 280 | +12.0 |
| Nunavut | 130 | 110 | 100 | 130 | 150 | +15.4 |
| Men | 149,630 | 160,580 | 163,870 | 179,810 | 184,820 | +2.8 |
| Women | 195,440 | 204,900 | 214,830 | 232,060 | 236,020 | +1.7 |
| 24 years old and under | 25,410 | 27,730 | 28,710 | 29,990 | 30,250 | +0.9 |
| 25 to 34 years old | 72,060 | 77,030 | 80,220 | 88,670 | 90,000 | +1.5 |
| 35 to 44 years old | 69,800 | 74,860 | 76,310 | 83,000 | 85,520 | +3.0 |
| 45 to 54 years old | 87,430 | 89,420 | 90,600 | 96,350 | 94,980 | -1.4 |
| 55 to 64 years old | 76,270 | 80,310 | 84,940 | 93,830 | 98,340 | +4.8 |
| 65 years old and over | 14,100 | 16,130 | 17,920 | 20,030 | 21,750 | +8.6 |
| Canada | 345,070 | 365,480 | 378,700 | 411,870 | 420,840 | +2.2 |
- Note: Includes claims for which at least $1 of EI sickness benefits was paid.
- Source: Employment and Social Development Canada, Employment Insurance (EI) administrative data. Data are based on a 10% sample of EI administrative data.
| Category | FY1415 | FY1516 | FY1617 | FY1718 | FY1819P | Change (%) FY1718 to FY1819 |
|---|---|---|---|---|---|---|
| Newfoundland and Labrador | 9.9 | 9.6 | 9.8 | 9.7 | 9.4 | -2.6 |
| Prince Edward Island | 7.9 | 7.8 | 7.8 | 8.2 | 8.1 | -1.7 |
| Nova Scotia | 9.5 | 9.0 | 9.3 | 9.0r | 9.1 | +0.6 |
| New Brunswick | 8.5 | 8.3 | 8.5 | 8.3 | 8.5 | +2.4 |
| Quebec | 9.1 | 9.0 | 9.1 | 9.0 | 9.0 | +0.3 |
| Ontario | 10.5 | 10.6 | 10.7 | 10.7 | 10.5 | -1.5 |
| Manitoba | 10.5 | 10.2 | 10.6 | 10.1 | 10.1 | -0.4 |
| Saskatchewan | 10.1 | 10.4 | 10.8 | 10.2r | 10.1 | -0.8 |
| Alberta | 10.8 | 10.7 | 10.8 | 10.5 | 10.5 | -0.2 |
| British Columbia | 10.6 | 10.7 | 10.7 | 10.6 | 10.6 | -0.3 |
| Yukon | 9.1 | 10.0 | 8.9 | 10.2 | 10.9 | +7.6 |
| Northwest Territories | 10.5 | 9.9 | 10.3 | 11.1r | 10.8 | -2.1 |
| Nunavut | 11.2 | 13.3 | 10.1 | 14.7 | 11.6 | -20.7 |
| Men | 9.5 | 9.5 | 9.6 | 9.5 | 9.4 | -0.9 |
| Women | 10.1 | 10.1 | 10.2 | 10.1 | 10.1 | -0.1 |
| 24 years old and under | 9.1 | 8.8 | 8.9 | 9.0 | 8.8 | -2.3 |
| 25 to 34 years old | 9.2 | 9.1 | 9.1 | 9.1 | 9.2 | +0.9 |
| 35 to 44 years old | 9.8 | 9.7 | 9.9 | 9.7 | 9.7 | +0.1 |
| 45 to 54 years old | 10.1 | 10.0 | 10.2 | 10.1 | 10.0 | -0.5 |
| 55 to 64 years old | 10.4 | 10.4 | 10.5 | 10.3 | 10.1 | -1.5 |
| 65 years old and over | 11.0 | 10.9 | 10.8 | 10.8 | 10.8 | -0.5 |
| Canada | 9.9 | 9.8 | 9.9 | 9.8 | 9.8 | -0.5 |
- Note: Percentage change is based on unrounded numbers. Includes claims for which at least $1 of EI sickness benefits was paid. Based on completed claims which include those that are terminated and those that are dormant and remained inactive as of August of the following fiscal year.
- p Preliminary
- r Revised
- Source: Employment and Social Development Canada, Employment Insurance (EI) administrative data. Data are based on a 10% sample of EI administrative data.
| Category | FY1415 | FY1516 | FY1617 | FY1718 | FY1819 | Change (%) FY1718 to FY1819 |
|---|---|---|---|---|---|---|
| Newfoundland and Labrador | 399 | 415 | 429 | 431 | 444 | +3.2 |
| Prince Edward Island | 389 | 400 | 418 | 425 | 433 | +2.0 |
| Nova Scotia | 391 | 400 | 408 | 417 | 424 | +1.6 |
| New Brunswick | 400 | 416 | 417 | 430 | 435 | +1.3 |
| Quebec | 390 | 398 | 405 | 416 | 427 | +2.6 |
| Ontario | 397 | 408 | 420 | 430 | 446 | +3.7 |
| Manitoba | 405 | 419 | 417 | 425 | 431 | +1.5 |
| Saskatchewan | 417 | 428 | 438 | 442 | 445 | +0.5 |
| Alberta | 436 | 448 | 446 | 454 | 464 | +2.3 |
| British Columbia | 394 | 408 | 419 | 428 | 441 | +3.1 |
| Yukon | 453 | 470 | 490 | 488 | 501 | +2.5 |
| Northwest Territories | 449 | 502 | 517 | 497 | 518 | +4.1 |
| Nunavut | 467 | 455 | 430 | 520 | 519 | -0.2 |
| Men | 438 | 448 | 455 | 464 | 475 | +2.4 |
| Women | 368 | 379 | 388 | 397 | 409 | +3.0 |
| 24 years old and under | 331 | 346 | 351 | 355 | 377 | +6.2 |
| 25 to 34 years old | 398 | 410 | 417 | 427 | 439 | +2.7 |
| 35 to 44 years old | 415 | 426 | 433 | 442 | 453 | +2.4 |
| 45 to 54 years old | 407 | 421 | 428 | 439 | 450 | +2.5 |
| 55 to 64 years old | 400 | 407 | 418 | 427 | 438 | +2.5 |
| 65 years old and over | 368 | 381 | 391 | 398 | 413 | +3.8 |
| Canada | 398 | 409 | 417 | 426 | 438 | +2.8 |
- Note: Percentage change is based on unrounded numbers. Includes claims for which at least $1 of EI sickness benefits was paid.
- 1 Takes into account Family Supplement top-ups paid to claimants with sickness benefits.
- Source: Employment and Social Development Canada, Employment Insurance (EI) administrative data. Data are based on a 10% sample of EI administrative data.
| Category | FY1415 | FY1516 | FY1617 | FY1718 | FY1819 | Change (%) FY1718 to FY1819 |
|---|---|---|---|---|---|---|
| Newfoundland and Labrador | 38.7 | 43.0 | 45.1 | 49.0 | 48.7 | -0.7 |
| Prince Edward Island | 17.0 | 17.3 | 20.2 | 21.1 | 21.4 | +1.5 |
| Nova Scotia | 58.9 | 65.8 | 74.0 | 79.0 | 81.4 | +3.1 |
| New Brunswick | 71.6 | 74.3 | 92.7 | 103.7 | 111.2 | +7.3 |
| Quebec | 367.9 | 400.0 | 428.8 | 490.2 | 507.0 | +3.4 |
| Ontario | 386.1 | 424.3 | 461.8 | 502.3 | 519.7 | +3.5 |
| Manitoba | 41.6 | 44.9 | 43.7 | 47.3 | 48.2 | +1.9 |
| Saskatchewan | 28.9 | 33.6 | 35.4 | 34.6 | 36.4 | +5.1 |
| Alberta | 113.0 | 136.1 | 138.2 | 138.3 | 150.3 | +8.7 |
| British Columbia | 204.7 | 212.9 | 223.9 | 242.3 | 241.5 | -0.3 |
| Yukon | 1.3 | 1.8 | 2.1 | 1.9 | 1.8 | -6.3 |
| Northwest Territories | 1.1 | 1.3 | 0.9 | 1.5 | 1.4 | -6.8 |
| Nunavut | 0.7 | 0.5 | 0.7 | 0.9 | 0.6 | -33.0 |
| Men | 621.1 | 684.5 | 745.5 | 797.0 | 830.0 | +4.1 |
| Women | 710.6 | 771.5 | 821.9 | 915.0 | 939.6 | +2.7 |
| 24 years old and under | 75.2 | 81.9 | 91.5 | 98.6 | 99.5 | +0.9 |
| 25 to 34 years old | 256.4 | 283.9 | 307.8 | 340.3 | 356.4 | +4.7 |
| 35 to 44 years old | 278.2 | 308.2 | 327.3 | 353.2 | 368.8 | +4.4 |
| 45 to 54 years old | 357.4 | 375.7 | 396.9 | 425.7 | 426.4 | +0.2 |
| 55 to 64 years old | 308.5 | 341.5 | 370.0 | 407.1 | 426.4 | +4.7 |
| 65 years old and over | 55.9 | 64.8 | 74.0 | 87.2 | 92.1 | +5.6 |
| Canada | 1,331.7 | 1,456.0 | 1,567.4 | 1,712.0 | 1,769.6 | +3.4 |
- Note: Data may not add up to the totals due to rounding. Percentage change is based on unrounded numbers. Includes claims for which at least $1 of EI sickness benefits was paid.
- 1 Takes into account Family Supplement top-ups paid to claimants with sickness benefits.
- Source: Employment and Social Development Canada, Employment Insurance (EI) administrative data. Data are based on a 10% sample of EI administrative data.
Annex 2.17 – Sickness benefits (by industry)
| Industry | FY1415 Employment (000s) | FY1415 Share (%) | FY1819 Employment (000s) | FY1819 Share (%) |
|---|---|---|---|---|
| Goods-producing industries | 3,888.8 | 21.8 | 3,930.6 | 21.0 |
| Agriculture, forestry, fishing, hunting, mining and oil and gas extraction | 670.6 | 3.8 | 620.4 | 3.3 |
| Utilities | 136.2 | 0.8 | 146.3 | 0.8 |
| Construction | 1,376.1 | 7.7 | 1,438.5 | 7.7 |
| Manufacturing | 1,705.9 | 9.6 | 1,725.4 | 9.2 |
| Services-producing industries | 13,940.9 | 78.2 | 14,816.5 | 79.0 |
| Wholesale trade and retail trade | 2,729.1 | 15.3 | 2,796.3 | 14.9 |
| Transportation and warehousing | 899.2 | 5.0 | 1,006.4 | 5.4 |
| Finance, insurance, real estate, rental and leasing | 1,084.5 | 6.1 | 1,176.3 | 6.3 |
| Professional, scientific and technical services | 1,337.2 | 7.5 | 1,490.0 | 7.9 |
| Business, building and other support services1 | 740.1 | 4.2 | 788.6 | 4.2 |
| Educational services | 1,253.7 | 7.0 | 1,338.4 | 7.1 |
| Health care and social assistance | 2,235.3 | 12.5 | 2,423.8 | 12.9 |
| Information, culture and recreation2 | 754.3 | 4.2 | 779.8 | 4.2 |
| Accommodation and food services | 1,212.7 | 6.8 | 1,232.7 | 6.6 |
| Other services (except public administration) | 784.4 | 4.4 | 806.4 | 4.3 |
| Public administration | 910.3 | 5.1 | 977.9 | 5.2 |
| Unclassified* | n/a | n/a | n/a | n/a |
| Canada | 17,829.6 | 100.0 | 18,747.1 | 100.0 |
- Note: Data may not add up to the total due to rounding.
- 1 This industry category comprises the industries with codes 55 (Management of companies and enterprises) and 56 (Administrative and support, waste management and mediation services) from the North American Industry Classification System.
- 2 This industry category comprises the industries with codes 51 (Information and cultural industries) and 71 (Arts, entertainment and recreation) from the North American Industry Classification System.
- * For some claims, this information was not available in the data.
- Source: Statistics Canada, Labour Force Survey, Table 14-10-0022-01.
| Industry | FY1415 New claims (000s) | FY1415 Share (%) | FY1819 New claims (000s) | FY1819 Share (%) |
|---|---|---|---|---|
| Goods-producing industries | 88,630 | 25.7 | 113,690 | 27.0 |
| Agriculture, forestry, fishing, hunting, mining and oil and gas extraction | 16,110 | 4.7 | 17,780 | 4.2 |
| Utilities | 490 | 0.1 | 560 | 0.1 |
| Construction | 33,820 | 9.8 | 42,290 | 10.0 |
| Manufacturing | 38,210 | 11.1 | 53,060 | 12.6 |
| Services-producing industries | 237,470 | 68.8 | 300,660 | 71.4 |
| Wholesale trade and retail trade | 54,770 | 15.9 | 68,730 | 16.3 |
| Transportation and warehousing | 17,470 | 5.1 | 22,750 | 5.4 |
| Finance, insurance, real estate, rental and leasing | 10,420 | 3.0 | 13,120 | 3.1 |
| Professional, scientific and technical services | 9,520 | 2.8 | 11,960 | 2.8 |
| Business, building and other support services1 | 26,820 | 7.8 | 30,700 | 7.3 |
| Educational services | 9,320 | 2.7 | 12,930 | 3.1 |
| Health care and social assistance | 40,870 | 11.8 | 54,430 | 12.9 |
| Information, culture and recreation2 | 7,030 | 2.0 | 8,450 | 2.0 |
| Accommodation and food services | 25,140 | 7.3 | 31,560 | 7.5 |
| Other services (except public administration) | 14,070 | 4.1 | 18,130 | 4.3 |
| Public administration | 22,040 | 6.4 | 27,900 | 6.6 |
| Unclassified* | 18,970 | 5.5 | 6,490 | 1.5 |
| Canada | 345,070 | 100.0 | 420,840 | 100.0 |
- Note: Data may not add up to the total due to rounding. Percentage share is based on unrounded numbers. Includes claims for which at least $1 of EI sickness benefits was paid.
- 1 This industry category comprises the industries with codes 55 (Management of companies and enterprises) and 56 (Administrative and support, waste management and mediation services) from the North American Industry Classification System.
- 2 This industry category comprises the industries with codes 51 (Information and cultural industries) and 71 (Arts, entertainment and recreation) from the North American Industry Classification System.
- * For some claims, this information was not available in the data.
- Source: Employment and Social Development Canada, Employment Insurance (EI) administrative data. Data are based on a 10% sample of EI administrative data.
| Industry | FY1415 Amount paid ($) | FY1415 Share (%) | FY1819 Amount paid ($) | FY1819 Share (%) |
|---|---|---|---|---|
| Goods-producing industries | 362.0 | 27.2 | 503.7 | 28.5 |
| Agriculture, forestry, fishing, hunting, mining and oil and gas extraction | 57.0 | 4.3 | 79.6 | 4.5 |
| Utilities | 2.7 | 0.2 | 3.1 | 0.2 |
| Construction | 146.2 | 11.0 | 199.2 | 11.3 |
| Manufacturing | 156.1 | 11.7 | 221.8 | 12.5 |
| Services-producing industries | 911.5 | 68.4 | 1,238.4 | 70.0 |
| Wholesale trade and retail trade | 189.3 | 14.2 | 258.3 | 14.6 |
| Transportation and warehousing | 77.9 | 5.9 | 107.7 | 6.1 |
| Finance, insurance, real estate, rental and leasing | 42.9 | 3.2 | 59.6 | 3.4 |
| Professional, scientific and technical services | 37.3 | 2.8 | 54.0 | 3.1 |
| Business, building and other support services1 | 105.1 | 7.9 | 127.6 | 7.2 |
| Educational services | 34.1 | 2.6 | 47.8 | 2.7 |
| Health care and social assistance | 164.2 | 12.3 | 234.3 | 13.2 |
| Information, culture and recreation2 | 25.7 | 1.9 | 34.9 | 2.0 |
| Accommodation and food services | 80.9 | 6.1 | 107.0 | 6.0 |
| Other services (except public administration) | 52.1 | 3.9 | 72.3 | 4.1 |
| Public administration | 101.5 | 7.6 | 134.8 | 7.6 |
| Unclassified* | 58.2 | 4.4 | 27.5 | 1.6 |
| Canada | 1,331.7 | 100.0 | 1,769.6 | 100.0 |
- Note: Data may not add up to the total due to rounding. Percentage share is based on unrounded numbers. Includes claims for which at least $1 of EI sickness benefits was paid.
- 1 This industry category comprises the industries with codes 55 (Management of companies and enterprises) and 56 (Administrative and support, waste management and mediation services) from the North American Industry Classification System.
- 2 This industry category comprises the industries with codes 51 (Information and cultural industries) and 71 (Arts, entertainment and recreation) from the North American Industry Classification System.
- * For some claims, this information was not available in the data.
- Source: Employment and Social Development Canada, Employment Insurance (EI) administrative data. Data are based on a 10% sample of EI administrative data.
Annex 2.18 – Compassionate care benefits
| Category | FY1415 | FY1516 | FY1617 | FY1718 | FY1819 | Change (%) FY1718 to FY1819 |
|---|---|---|---|---|---|---|
| Newfoundland and Labrador | 76 | 92 | 106 | 129 | 92 | -28.7 |
| Prince Edward Island | 33 | 51 | 55 | 66 | 40 | -39.4 |
| Nova Scotia | 170 | 243 | 367 | 351 | 281 | -19.9 |
| New Brunswick | 143 | 205 | 245 | 283 | 193 | -31.8 |
| Quebec | 1,046 | 1,319 | 1,759 | 1,808 | 1,497 | -17.2 |
| Ontario | 2,738 | 3,465 | 4,452 | 4,966 | 3,574 | -28.0 |
| Manitoba | 229 | 297 | 391 | 397 | 346 | -12.8 |
| Saskatchewan | 157 | 200 | 258 | 284 | 219 | -22.9 |
| Alberta | 675 | 741 | 1,002 | 1,032 | 866 | -16.1 |
| British Columbia | 948 | 1,238 | 1,523 | 1,658 | 1,243 | -25.0 |
| Yukon | 29c | 20c | 35c | 36c | 34c | -5.6 |
| Northwest Territories | 29c | 20c | 35c | 36c | 34c | -5.6 |
| Nunavut | 29c | 20c | 35c | 36c | 34c | -5.6 |
| Men | 1,833 | 2,260 | 2,812 | 3,120 | 2,436 | -21.9 |
| Women | 4,411 | 5,611 | 7,381 | 7,890 | 5,949 | -24.6 |
| 24 years old and under | 118 | 138 | 176 | 167 | 116 | -30.5 |
| 25 to 44 years old | 2,099 | 2,450 | 3,259 | 3,494 | 2,723 | -22.1 |
| 45 to 54 years old | 2,172 | 2,758 | 3,461 | 3,641 | 2,681 | -26.4 |
| 55 years old and over | 1,855 | 2,525 | 3,297 | 3,708 | 2,865 | -22.7 |
| Canada | 6,244 | 7,871 | 10,193 | 11,010 | 8,385 | -23.8 |
- Note: Includes claims for which at least $1 of EI compassionate care benefits was paid.
- c For confidentiality purposes, data for Yukon, Northwest Territories and Nunavut have been combined.
- Source: Employment and Social Development Canada, Employment Insurance (EI) administrative data. Data are based on a 100% sample of EI administrative data.
| Category | FY1415 | FY15161 | FY1617 | FY1718 | FY1819P | Change (%) FY1718 to FY1819 |
|---|---|---|---|---|---|---|
| Newfoundland and Labrador | 4.6 | 5.0 | 9.7 | 13.4 | 13.3 | -0.7 |
| Prince Edward Island | 4.6 | 5.1 | 11.0 | 13.2r | 12.1 | -8.3 |
| Nova Scotia | 4.9 | 5.0 | 10.8 | 13.3r | 11.4 | -14.5 |
| New Brunswick | 4.6 | 4.5 | 10.3 | 13.3r | 12.2 | -8.3 |
| Quebec | 4.4 | 4.4 | 8.6 | 10.8 | 9.8 | -9.3 |
| Ontario | 4.7 | 4.6 | 9.8 | 11.8 | 11.7 | -1.3 |
| Manitoba | 4.7 | 4.8 | 10.2 | 11.9 | 11.4 | -4.2 |
| Saskatchewan | 5.1 | 5.0 | 11.7 | 12.5 | 12.0 | -4.2 |
| Alberta | 5.0 | 5.0 | 10.0 | 12.9 | 12.5 | -2.9 |
| British Columbia | 4.8 | 4.7 | 10.3 | 12.4 | 11.7 | -6.2 |
| Yukon | 4.8c | 4.3c | 11.1c | 14.3c | 10.8c | -24.7 |
| Northwest Territories | 4.8c | 4.3c | 11.1c | 14.3c | 10.8c | -24.7 |
| Nunavut | 4.8c | 4.3c | 11.1c | 14.3c | 10.8c | -24.7 |
| Men | 4.8 | 4.7 | 9.7 | 12.1 | 11.8 | -3.0 |
| Women | 4.7 | 4.6 | 9.9 | 11.9 | 11.3 | -5.1 |
| 24 years old and under | 4.8 | 4.8 | 9.8 | 11.0 | 10.3 | -6.2 |
| 25 to 44 years old | 4.6 | 4.6 | 9.5 | 11.3 | 11.0 | -3.3 |
| 45 to 54 years old | 4.6 | 4.6 | 9.5 | 11.9 | 11.2 | -5.8 |
| 55 years old and over | 4.9 | 4.8 | 10.5 | 12.8 | 12.2 | -4.3 |
| Canada | 4.7 | 4.6 | 9.8 | 12.0 | 11.5 | -4.5 |
- Note: Percentage change is based on unrounded numbers. Includes claims for which at least $1 of EI compassionate care benefits was paid. Based on completed claims which include those that are terminated and those that are dormant and remained inactive as of August the following fiscal year.
- 1 Starting January 3, 2016, compassionate care benefits were enhanced to allow claimants to collect up to 26 weeks of benefits, an increase from the maximum of 6 weeks previously available.
- c For confidentiality purposes, data for Yukon, Northwest Territories and Nunavut have been combined.
- p Preliminary
- r Revised.
- Source: Employment and Social Development Canada, Employment Insurance (EI) administrative data. Data are based on a 100% sample of EI administrative data.
| Category | FY1415 | FY15161 | FY1617 | FY1718 | FY1819 | Change (%) FY1718 to FY1819 |
|---|---|---|---|---|---|---|
| Newfoundland and Labrador | 410 | 421 | 433 | 448 | 458 | +2.3 |
| Prince Edward Island | 405 | 411 | 417 | 450 | 440 | -2.2 |
| Nova Scotia | 395 | 399 | 411 | 418 | 429 | +2.8 |
| New Brunswick | 397 | 392 | 403 | 417 | 430 | +3.0 |
| Quebec | 411 | 412 | 414 | 429 | 443 | +3.3 |
| Ontario | 431 | 438 | 450 | 461 | 477 | +3.4 |
| Manitoba | 415 | 425 | 448 | 454 | 459 | +1.0 |
| Saskatchewan | 445 | 465 | 463 | 459 | 484 | +5.3 |
| Alberta | 457 | 464 | 470 | 477 | 490 | +2.6 |
| British Columbia | 427 | 439 | 453 | 459 | 474 | +3.4 |
| Yukon | 493c | 460c | 498c | 521c | 496c | -4.8 |
| Northwest Territories | 493c | 460c | 498c | 521c | 496c | -4.8 |
| Nunavut | 493c | 460c | 498c | 521c | 496c | -4.8 |
| Men | 461 | 468 | 478 | 488 | 498 | +1.9 |
| Women | 414 | 420 | 431 | 441 | 456 | +3.5 |
| 24 years old and under | 361 | 364 | 380 | 386 | 414 | +7.1 |
| 25 to 44 years old | 440 | 448 | 457 | 466 | 478 | +2.6 |
| 45 to 54 years old | 432 | 439 | 454 | 464 | 477 | +2.8 |
| 55 years old and over | 412 | 417 | 423 | 436 | 453 | +3.7 |
| Canada | 428 | 434 | 444 | 454 | 468 | +3.1 |
- Note: Percentage change is based on unrounded numbers. Includes claims for which at least $1 of EI compassionate care benefits was paid.
- 1 Takes into account Family Supplement top-ups paid to claimants with compassionate care benefits.
- c For confidentiality purposes, data for Yukon, Northwest Territories and Nunavut have been combined.
- Source: Employment and Social Development Canada, Employment Insurance (EI) administrative data. Data are based on a 100% sample of EI administrative data.
| Category | FY1415 | FY15161 | FY1617 | FY1718 | FY1819 | Change (%) FY1718 to FY1819 |
|---|---|---|---|---|---|---|
| Newfoundland and Labrador | 0.2 | 0.2 | 0.6 | 0.8 | 0.5 | -34.6 |
| Prince Edward Island | 0.1 | 0.1 | 0.3 | 0.4 | 0.2 | -36.9 |
| Nova Scotia | 0.3 | 0.6 | 2.1 | 2.0 | 1.4 | -32.4 |
| New Brunswick | 0.3 | 0.5 | 1.4 | 1.5 | 1.1 | -28.4 |
| Quebec | 1.9 | 2.8 | 7.7 | 8.5 | 6.5 | -24.3 |
| Ontario | 5.5 | 8.0 | 23.0 | 27.3 | 20.0 | -26.9 |
| Manitoba | 0.5 | 0.7 | 2.2 | 2.2 | 1.8 | -16.7 |
| Saskatchewan | 0.4 | 0.5 | 1.7 | 1.8 | 1.4 | -19.2 |
| Alberta | 1.5 | 2.0 | 6.1 | 6.7 | 5.7 | -15.3 |
| British Columbia | 1.9 | 2.9 | 8.8 | 9.5 | 7.0 | -26.4 |
| Yukon | 0.1c | 0.1c | 0.2c | 0.3c | 0.2c | -19.8 |
| Northwest Territories | 0.1c | 0.1c | 0.2c | 0.3c | 0.2c | -19.8 |
| Nunavut | 0.1c | 0.1c | 0.2c | 0.3c | 0.2c | -19.8 |
| Men | 4.1 | 5.9 | 16.8 | 19.1 | 15.0 | -21.8 |
| Women | 8.5 | 12.4 | 37.3 | 42.0 | 30.9 | -26.4 |
| 24 years old and under | 0.2 | 0.3 | 0.7 | 0.8 | 0.5 | -38.8 |
| 25 to 44 years old | 4.2 | 5.8 | 17.0 | 18.9 | 14.4 | -23.5 |
| 45 to 54 years old | 4.4 | 6.4 | 18.5 | 20.5 | 15.1 | -26.4 |
| 55 years old and over | 3.8 | 5.9 | 17.9 | 21.0 | 15.9 | -24.3 |
| Canada | 12.5 | 18.3 | 54.1 | 61.1 | 45.8 | -25.0 |
- Note: Data may not add up to the total due to rounding. Percentage change is based on unrounded numbers. Includes claims for which at least $1 of EI compassionate care benefits was paid.
- 1 Takes into account Family Supplement top-ups paid to claimants with compassionate care benefits.
- c For confidentiality purposes, data for Yukon, Northwest Territories and Nunavut have been combined.
- Source: Employment and Social Development Canada, Employment Insurance (EI) administrative data. Data are based on a 100% sample of EI administrative data.
Annex 2.19 – Family caregiver benefit for adults
| Category | FY1718r | FY1819 |
|---|---|---|
| Newfoundland and Labrador | 54 | 195 |
| Prince Edward Island | 17 | 65 |
| Nova Scotia | 67 | 290 |
| New Brunswick | 65 | 277 |
| Quebec | 508 | 1,772 |
| Ontario | 1,207 | 4,658 |
| Manitoba | 85 | 332 |
| Saskatchewan | 63 | 232 |
| Alberta | 229 | 899 |
| British Columbia | 344c | 1,234 |
| Territories | 344c | 27 |
| Unknown* | 28 | 125 |
| Men | 829 | 3,117 |
| Women | 1,842 | 6,989 |
| 24 years old and under | 37 | 170 |
| 25 to 34 years old | 260 | 1,066 |
| 35 to 44 years old | 466 | 1,887 |
| 45 to 54 years old | 837 | 3,201 |
| 55 to 64 years old | 905 | 3,206 |
| 65 years old and over | 166 | 576 |
| Canada | 2,671 | 10,106 |
- Note: Includes claims for which at least $1 of benefits for family caregiver for adults was paid. Given the short period during which benefits for family caregivers for adults were offered in FY1718, few claims were made. Consequently, the data from FY1819 cannot be compared to the previous year’s data.
- 1 The family caregiver benefits for adults have been available since December 3, 2017.
- c For confidentiality purposes, data for Yukon, Northwest Territories, and Nunavut have been combined with British Columbia.
- r Revised
- * For some claims, this information was not available in the data.
- Source: Employment and Social Development Canada, Employment Insurance (EI) administrative data. Data are based on a 100% sample of EI administrative data from Service Canada’s Manual Pay System.
| Category | FY1718 | FY1819 |
|---|---|---|
| Newfoundland and Labrador | 11.4 | 11.0 |
| Prince Edward Island | n/a | 10.9 |
| Nova Scotia | 9.3 | 11.1 |
| New Brunswick | 10.1 | 11.2 |
| Quebec | 9.0 | 11.4 |
| Ontario | 7.6 | 10.6 |
| Manitoba | 7.9 | 10.1 |
| Saskatchewan | 7.6 | 10.9 |
| Alberta | 8.1 | 11.0 |
| British Columbia and Territories | 8.4c | 11.1c |
| Unknown* | 3.7 | 5.0 |
| Men | 7.9 | 10.6 |
| Women | 8.0 | 10.8 |
| 24 years old and under | 9.8 | 9.8 |
| 25 to 34 years old | 7.5 | 10.2 |
| 35 to 44 years old | 7.6 | 10.2 |
| 45 to 54 years old | 7.7 | 10.7 |
| 55 to 64 years old | 8.4 | 11.1 |
| 65 years old and over | 8.9 | 12.0 |
| Canada | 8.0 | 10.7 |
- Note: Includes claims for which at least $1 of benefits for family caregiver for adults was paid. Given the short period during which benefits for family caregivers for adults were offered in FY1718, few claims were made. Consequently, the data from FY1819 cannot be compared to the previous year’s data.
- 1 The family caregiver benefits for adults have been available since December 3, 2017.
- 2 Results on actual duration of benefits for family caregiver for adults have been estimated using all claims established over the fiscal year.
- c For confidentiality purposes, data for Yukon, Northwest Territories, and Nunavut have been combined with British Columbia.
- * For some claims, this information was not available in the data.
- Source: Employment and Social Development Canada, Employment Insurance (EI) administrative data. Data are based on a 100% sample of EI administrative data from Service Canada’s Manual Pay System.
| Category | FY1718r | FY1819 |
|---|---|---|
| Newfoundland and Labrador | 415 | 430 |
| Prince Edward Island | n/a | 455 |
| Nova Scotia | 376 | 419 |
| New Brunswick | 401 | 414 |
| Quebec | 416 | 424 |
| Ontario | 455 | 459 |
| Manitoba | 443 | 443 |
| Saskatchewan | 487 | 467 |
| Alberta | 480 | 473 |
| British Columbia and Territories | 445c | 452c |
| Men | 491 | 490 |
| Women | 428 | 435 |
| 24 years old and under | 428 | 395 |
| 25 to 34 years old | 471 | 463 |
| 35 to 44 years old | 470 | 463 |
| 45 to 54 years old | 459 | 460 |
| 55 to 64 years old | 418 | 444 |
| 65 years old and over | 419 | 398 |
| Canada | 446 | 451 |
- Note: Includes claims for which at least $1 of benefits for family caregiver for adults was paid. Given the short period during which benefits for family caregivers for adults were offered in FY1718, few claims were made. Consequently, the data from FY1819 cannot be compared to the previous year’s data.
- 1 The family caregiver benefits for adults have been available since December 3, 2017.
- 2 Takes into account Family Supplement top-ups paid to claimants with benefits for family caregiver for adults.
- c For confidentiality purposes, data for Yukon, Northwest Territories, and Nunavut have been combined with British Columbia.
- Source: Employment and Social Development Canada, Employment Insurance (EI) administrative data. Data are based on a 100% sample of EI administrative data from Service Canada’s Manual Pay System.
| Category | FY1718r | FY1819 |
|---|---|---|
| Newfoundland and Labrador | 146.9 | 966.6 |
| Prince Edward Island | 40.9 | 330.8 |
| Nova Scotia | 179.2 | 1,337.9 |
| New Brunswick | 206.5 | 1,230.1 |
| Quebec | 1,481.4 | 8,192.8 |
| Ontario | 3,521.0 | 22,423.6 |
| Manitoba | 244.2 | 1,513.7 |
| Saskatchewan | 186.5 | 1,190.2 |
| Alberta | 728.5 | 4,617.8 |
| British Columbia and Territories | 1,011.7c | 6,214.3c |
| Unknown province* | 40.7 | 326.8 |
| Men | 2,711.7 | 16,047.8 |
| Women | 5,094.0 | 32,296.9 |
| 24 years old and under | 76.2 | 630.3 |
| 25 to 34 years old | 784.4 | 4,938.7 |
| 35 to 44 years old | 1,387.9 | 8,803.9 |
| 45 to 54 years old | 2,459.9 | 15,657.8 |
| 55 to 64 years old | 2,588.5 | 15,549.2 |
| 65 years old and over | 508.9 | 2,764.8 |
| Canada | 7,805.8 | 48,344.6 |
- Note: Includes claims for which at least $1 of benefits for family caregiver for adults was paid. Given the short period during which benefits for family caregivers for adults were offered in FY1718, few claims were made. Consequently, the data from FY1819 cannot be compared to the previous year’s data.
- 1 The family caregiver benefits for adults have been available since December 3, 2017.
- 2 Takes into account Family Supplement top-ups paid to claimants with benefits for family caregiver for adults.
- c For confidentiality purposes, data for Yukon, Northwest Territories, and Nunavut have been combined with British Columbia.
- * For some claims, this information was not available in the data.
- r Revised.
- Source: Employment and Social Development Canada, Employment Insurance (EI) administrative data. Data are based on a 100% sample of EI administrative data from Service Canada’s Manual Pay System.
Annex 2.20 – Family caregiver benefit for children
| Category | FY1415 | FY1516 | FY1617 | FY1718 | FY1819 | Change (%) FY1718 to FY1819 |
|---|---|---|---|---|---|---|
| Newfoundland and Labrador | 32 | 58 | 44 | 70r | 55 | -20.3 |
| Prince Edward Island | 10 | 26 | 22 | 18 | 30 | +66.7 |
| Nova Scotia | 64 | 73 | 86 | 92r | 104 | +13.0 |
| New Brunswick | 77 | 74 | 92 | 94r | 101 | +6.3 |
| Quebec | 642 | 822 | 889 | 884r | 1,050 | +18.8 |
| Ontario | 1,010 | 1,329 | 1,570 | 1,941r | 2,089 | +7.6 |
| Manitoba | 92 | 129 | 158 | 182r | 208 | +13.7 |
| Saskatchewan | 77 | 142 | 153 | 195r | 222 | +12.1 |
| Alberta | 408 | 558 | 613 | 765r | 852 | +12.1 |
| British Columbia | 349 | 466 | 553 | 628r | 708 | +12.6 |
| Yukon | 5c | 13c | 16c | 12c | 18c | +50.0 |
| Northwest Territories | 5c | 13c | 16c | 12c | 18c | +50.0 |
| Nunavut | 5c | 13c | 16c | 12c | 18c | +50.0 |
| Province unknown* | 80 | 50 | 42 | 40 | 38 | -5.0 |
| Men | 567 | 751 | 818 | 1,008r | 1,151 | +14.2 |
| Women | 2,279 | 2,989 | 3,420 | 3,913r | 4,324 | +10.5 |
| 24 years old and under | 180 | 216 | 225 | 257r | 242 | -5.8 |
| 25 to 44 years old | 2,454 | 3,276 | 3,766 | 4,281r | 4,683 | +9.4 |
| 45 to 54 years old | 194 | 226 | 227 | 341r | 478 | +40.2 |
| 55 years old and over | 18 | 22 | 20 | 41r | 71 | +73.2 |
| Canada | 2,846 | 3,740 | 4,238 | 4,921r | 5,475 | +11.3 |
- Note: Includes claims for which at least $1 of benefits for family caregiver for children was paid. All family caregiver benefits for children that are shared between 2 parents are considered as 2 separate claims.
- 1 As of December 3, 2017, EI Parents of Critically Ill Children benefits have been renamed Family Caregiver Benefit for Children as part of the Budget Implementation Act, 2017, No. 1. The benefits for Parents of Critically Ill Children became available in June 2013.
- c For confidentiality purposes, data for Yukon, Northwest Territories and Nunavut have been combined.
- r Revised
- * For some claims, this information was not available in the data.
- Source: Employment and Social Development Canada, Employment Insurance (EI) administrative data. Data are based on a 100% sample of EI administrative data from Service Canada’s Manual Pay System.
| Category | FY1415 | FY1516 | FY1617 | FY1718 | FY1819P | Change (%) FY1718 to FY1819 |
|---|---|---|---|---|---|---|
| Newfoundland and Labrador | 21.4 | 17.8 | 17.1 | 20.6r | 22.8 | +10.4 |
| Prince Edward Island | 10.8 | 11.0 | 24.7 | 20.2 | 19.1 | -5.3 |
| Nova Scotia | 19.6 | 20.6 | 20.5 | 20.0r | 22.0 | +10.0 |
| New Brunswick | 16.2 | 21.0 | 19.3 | 20.3 | 15.3 | -24.6 |
| Quebec | 15.2 | 14.6 | 14.6 | 15.3 | 13.8 | -9.7 |
| Ontario | 16.6 | 20.9 | 20.4 | 17.9r | 19.1 | +6.5 |
| Manitoba | 16.0 | 19.9 | 19.6 | 16.3r | 17.1 | +4.8 |
| Saskatchewan | 15.1 | 21.4 | 18.7 | 17.1r | 20.6 | +20.6 |
| Alberta | 16.5 | 21.1 | 20.9 | 19.4 | 19.8 | +1.8 |
| British Columbia | 16.3 | 20.2 | 17.8 | 18.4r | 17.8 | -3.7 |
| Yukon | 19.6c | 10.5c | 25.0c | 11.1c | 16.8c | +50.8c |
| Northwest Territories | 19.6c | 10.5c | 25.0c | 11.1c | 16.8c | +50.8c |
| Nunavut | 19.6c | 10.5c | 25.0c | 11.1c | 16.8c | +50.8c |
| Unknown province* | 13.0 | 7.4 | 6.1 | 5.9 | 5.6 | -4.9 |
| Men | 14.9 | 16.0 | 14.3 | 13.8 | 14.4 | +4.2 |
| Women | 16.5 | 18.3 | 18.7 | 18.4 | 18.3 | -0.7 |
| 24 years old and under | 15.0 | 15.8 | 16.2 | 15.3r | 16.4 | +7.4 |
| 25 to 44 years old | 15.8 | 17.2 | 16.8 | 16.3 | 16.6 | +1.4 |
| 45 to 54 years old | 22.1 | 21.5 | 21.7 | 20.1r | 18.7 | -7.0 |
| 55 years old and over | 11.9 | 12.7 | 21.9 | 18.5r | 20.5 | +10.9 |
| Canada | 16.2 | 17.5 | 17.3 | 16.7 | 17.0 | +1.3 |
- Note: Percentage change is based on unrounded numbers. Includes claims for which at least $1 of benefits for family caregiver for children was paid.
- 1 As of December 3, 2017, EI Parents of Critically Ill Children benefits have been renamed Family Caregiver Benefit for Children as part of the Budget Implementation Act, 2017, No. 1. The benefits for Parents of Critically Ill Children became available in June 2013.
- 2 Results on actual duration of benefits for family caregiver for children have been estimated using all claims established over the fiscal year.
- c For confidentiality purposes, data for Yukon, Northwest Territories and Nunavut have been combined.
- p Preliminary
- r Revised
- * For some claims, this information was not available in the data.
- Source: Employment and Social Development Canada, Employment Insurance (EI) administrative data. Data are based on a 100% sample of EI administrative data from Service Canada’s Manual Pay System.
| Category | FY1415 | FY1516 | FY1617 | FY1718 | FY1819 | Change (%) FY1718 to FY1819 |
|---|---|---|---|---|---|---|
| Newfoundland and Labrador | 431 | 422 | 447 | 424 | 486 | +14.6 |
| Prince Edward Island | 376 | 467 | 437 | 447 | 462 | +3.3 |
| Nova Scotia | 396 | 403 | 441 | 416r | 425 | +2.1 |
| New Brunswick | 415 | 435 | 385 | 432 | 447 | +3.6 |
| Quebec | 423 | 435 | 442 | 447 | 461 | +3.2 |
| Ontario | 435 | 443 | 455 | 467 | 468 | +0.3 |
| Manitoba | 432 | 431 | 435 | 479r | 455 | -4.9 |
| Saskatchewan | 452 | 477 | 442 | 439r | 473 | +7.7 |
| Alberta | 452 | 457 | 461 | 471r | 479 | +1.7 |
| British Columbia | 434 | 447 | 444 | 469 | 457 | -2.6 |
| Yukon | 501c | 442c | 454c | 532c | 489c | -8.1 |
| Northwest Territories | 501c | 442c | 454c | 532c | 489c | -8.1 |
| Nunavut | 501c | 442c | 454c | 532c | 489c | -8.1 |
| Men | 457 | 474 | 481 | 494 | 500 | +1.2 |
| Women | 428 | 424 | 429 | 436r | 446 | +2.3 |
| 24 years old and under | 346 | 376 | 370 | 381 | 392 | +2.9 |
| 25 to 44 years old | 441 | 445 | 451 | 461 | 468 | +1.6 |
| 45 to 54 years old | 431 | 435 | 440 | 466 | 461 | -1.1 |
| 55 years old and over | 409 | 418 | 458 | 423 | 462 | +9.3 |
| Canada | 433 | 440 | 446 | 457 | 464 | +1.6 |
- Note: Percentage change is based on unrounded numbers. Includes claims for which at least $1 of benefits for family caregiver for children was paid.
- 1 As of December 3, 2017, EI Parents of Critically Ill Children benefits have been renamed Family Caregiver Benefit for Children as part of the Budget Implementation Act, 2017, No. 1. The benefits for Parents of Critically Ill Children became available in June 2013.
- 2 Takes into account Family Supplement top-ups paid to claimants with benefits for family caregiver for children.
- c For confidentiality purposes, data for Yukon, Northwest Territories and Nunavut have been combined.
- r Revised
- Source: Employment and Social Development Canada, Employment Insurance (EI) administrative data. Data are based on a 100% sample of EI administrative data from Service Canada’s Manual Pay System.
| Category | FY1415 | FY1516 | FY1617 | FY1718 | FY1819 | Change (%) FY1718 to FY1819 |
|---|---|---|---|---|---|---|
| Newfoundland and Labrador | 280.5 | 330.8 | 352.9 | 450.2 | 542.9 | +20.6 |
| Prince Edward Island | 34.3 | 179.4 | 138.1 | 133.1 | 171.1 | +28.5 |
| Nova Scotia | 501.4 | 492.8 | 550.1 | 522.9 | 757.5 | +44.9 |
| New Brunswick | 427.6 | 525.2 | 519.6 | 520.0 | 654.7 | +25.9 |
| Quebec | 4,069.5 | 4,945.1 | 5,515.1 | 5,761.5 | 6,480.2 | +12.5 |
| Ontario | 6,792.5 | 8,895.9 | 10,004.5 | 12,006.6 | 14,828.9 | +23.5 |
| Manitoba | 575.8 | 775.9 | 962.9 | 1,090.7 | 1,310.1 | +20.1 |
| Saskatchewan | 456.9 | 878.6 | 926.0 | 1,142.3r | 1,707.8 | +49.5 |
| Alberta | 2,942.2 | 3,818.3 | 4,308.4 | 4,893.3r | 5,691.4 | +16.3 |
| British Columbia | 2,378.6 | 2,808.5 | 3,055.5 | 3,707.1 | 4,360.7 | +17.6 |
| Yukon | 44.7c | 62.7c | 110.9c | 63.8c | 154.4c | +142.0 |
| Northwest Territories | 44.7c | 62.7c | 110.9c | 63.8c | 154.4c | +142.0 |
| Nunavut | 44.7c | 62.7c | 110.9c | 63.8c | 154.4c | +142.0 |
| Unknown* | 363.9 | 84.5 | 111.5 | 113.8 | 96.9 | -14.9 |
| Men | 3,739.8 | 5,231.0 | 5,265.7 | 6,332.8 | 8,090.5 | +27.8 |
| Women | 15,128.1 | 18,566.7 | 21,289.6 | 24,072.4r | 28,666.0 | +19.1 |
| 24 years old and under | 923.5 | 1,087.6 | 1,060.3 | 1,312.1 | 1,240.3 | -5.5 |
| 25 to 44 years old | 16,087.6 | 20,549.8 | 23,335.0 | 25,978.2 | 30,846.9 | +18.8 |
| 45 to 54 years old | 1,767.9 | 2,012.5 | 2,031.9 | 2,796.3 | 4,025.2 | +43.9 |
| 55 years old and over | 89.0 | 147.8 | 128.2 | 318.5 | 644.1 | +102.2 |
| Canada | 18,867.9 | 23,797.7 | 26,555.4 | 30,405.2r | 36,756.5 | +20.9 |
- Note: Data may not add up to the total due to rounding. Percentage change is based on unrounded numbers. Includes claims for which at least $1 of benefits for family caregiver for children was paid.
- 1 As of December 3, 2017, EI Parents of Critically Ill Children benefits have been renamed Family Caregiver Benefit for Children as part of the Budget Implementation Act, 2017, No. 1. The benefits for Parents of Critically Ill Children became available in June 2013.
- 2 Takes into account Family Supplement top-ups paid to claimants with benefits for family caregiver for children.
- c For confidentiality purposes, data for Yukon, Northwest Territories and Nunavut have been combined.
- r Revised
- * For some claims, this information was not available in the data.
- Source: Employment and Social Development Canada, Employment Insurance (EI) administrative data. Data are based on a 100% sample of EI administrative data from Service Canada’s Manual Pay System.
Annex 2.21 – Work-Sharing benefits
| Category | FY1415 | FY1516 | FY1617 | FY1718 | FY1819 | Change (%)
FY1718 to FY1819 |
|---|---|---|---|---|---|---|
| Newfoundland and Labrador | 14 | 43 | 41 | 28c | 0c | -100.0 |
| Prince Edward Island | 82 | 12 | 10 | 28c | 0c | -100.0 |
| Nova Scotia | 20c | 205 | 145 | 181 | 15 | -91.7 |
| New Brunswick | 20c | 42 | 16 | 22 | 11 | -50.0 |
| Quebec | 3,580 | 4,451 | 2,737 | 941 | 1,001 | +6.4 |
| Ontario | 2,255 | 2,849 | 2,017 | 1,737 | 1,339 | -22.9 |
| Manitoba | 262 | 2,482 | 915 | 111 | 539 | +385.6 |
| Saskatchewan | 742 | 1,035 | 577 | 85 | 212 | +149.4 |
| Alberta | 631 | 7,939 | 4,872 | 403 | 600 | +48.9 |
| British Columbia | 438 | 1,463 | 606 | 200 | 98 | -51.0 |
| Men | 5,952 | 15,933 | 8,883 | 2,487 | 2,721 | +9.4 |
| Women | 2,072 | 4,588 | 3,053 | 1,221 | 1,094 | -10.4 |
| 24 years old and under | 497 | 1,425 | 718 | 151 | 235 | +55.6 |
| 25 to 44 years old | 3,475 | 9,463 | 5,547 | 1,403 | 1,409 | +0.4 |
| 45 to 54 years old | 2,403 | 5,539 | 3,144 | 1,075 | 1,080 | +0.5 |
| 55 years old and over | 1,649 | 4,094 | 2,527 | 1,079 | 1,091 | +1.1 |
| Canada | 8,024 | 20,521 | 11,936 | 3,708 | 3,815 | +2.9 |
- Note: Includes all claims for which at least $1 of EI Work-Sharing benefits was paid. During the years reported in this table, no Work-Sharing claims were established in the territories.
- c For confidentiality purposes, data for some provinces in different years have been combined.
- Source: Employment and Social Development Canada, Employment Insurance (EI) administrative data. Data are based on a 100% sample of EI administrative data.
| Category | FY1415 | FY1516r | FY1617r | FY1718r | FY1819p | Change (%)
FY1718 to FY1819 |
|---|---|---|---|---|---|---|
| Newfoundland and Labrador | 11.3c,r | 19.3 | 17.8 | 19.0c | 24.5c | +29.1 |
| Prince Edward Island | 11.3c,r | 7.7 | 14.5 | 19.0c | 24.5c | +29.1 |
| Nova Scotia | 18.9c,r | 14.0 | 15.4 | 19.9 | 15.2 | -23.5 |
| New Brunswick | 9.3 | 13.8 | 16.2 | 17.0 | +5.1 | |
| Quebec | 15.1r | 13.0 | 13.2 | 21.1 | 15.7 | -25.5 |
| Ontario | 16.9r | 15.5 | 14.4 | 15.9 | 13.2 | -16.5 |
| Manitoba | 14.7r | 11.6 | 17.0 | 23.5 | 14.5 | -38.3 |
| Saskatchewan | 11.4r | 18.9 | 17.3 | 24.5 | 20.6 | -16.1 |
| Alberta | 10.5r | 14.9 | 20.6 | 31.6 | 18.5 | -41.7 |
| British Columbia | 12.9c,r | 13.3 | 17.5 | 22.2 | 15.4 | -30.7 |
| Yukon | 12.9c,r | n/a | n/a | n/a | n/a | n/a |
| Men | 15.3r | 14.1 | 16.9 | 23.2 | 14.9 | -35.7 |
| Women | 16.1r | 15.3 | 19.4 | 25.4 | 16.9 | -33.6 |
| 24 years old and under | 13.1 | 12.0 | 16.3 | 22.1 | 12.8 | -42.3 |
| 25 to 44 years old | 15.1r | 14.1 | 17.2 | 24.0 | 15.0 | -37.3 |
| 45 to 54 years old | 16.1r | 14.9 | 17.6 | 24.6 | 15.6 | -36.7 |
| 55 years old and over | 16.4r | 15.0 | 17.9 | 22.9 | 16.4 | -28.6 |
| Canada | 15.6r | 14.4 | 17.4 | 23.8 | 15.5 | -35.1 |
- Notes: Percentage change is based on unrounded numbers. Includes claims for which at least $1 of EI Work-Sharing benefits was paid. Based on completed claims which include those that are terminated and those that are dormant and remained inactive as of August the following year.
- c For confidentiality purposes, data for some provinces and territories in different years have been combined.
- r Revised.
- Source: Employment and Social Development Canada, Employment Insurance (EI) administrative data. Data are based on a 100% sample of EI administrative data.
| Category | FY1415 | FY1516 | FY1617 | FY1718 | FY1819 | Change (%)
FY1718 to FY1819 |
|---|---|---|---|---|---|---|
| Newfoundland and Labrador | 135 | 168 | 187 | 148c | 0c | -100.0 |
| Prince Edward Island | 160 | 186 | 211 | 148c | 0c | -100.0 |
| Nova Scotia | 196c | 136 | 137 | 113 | 183 | +61.8 |
| New Brunswick | 196c | 128 | 176 | 71 | 109 | +54.3 |
| Quebec | 120 | 116 | 113 | 109 | 127 | +15.8 |
| Ontario | 118 | 117 | 118 | 102 | 105 | +3.2 |
| Manitoba | 135 | 119 | 101 | 113 | 110 | -2.7 |
| Saskatchewan | 196 | 142 | 142 | 160 | 151 | -5.4 |
| Alberta | 146 | 142 | 137 | 124 | 135 | +9.0 |
| British Columbia | 121 | 150 | 114 | 118 | 167 | +42.1 |
| Men | 135 | 136 | 131 | 115 | 129 | +12.8 |
| Women | 112 | 115 | 107 | 99 | 99 | +0.5 |
| 24 years old and under | 122 | 133 | 120 | 102 | 120 | +17.8 |
| 25 to 44 years old | 132 | 133 | 125 | 113 | 124 | +9.6 |
| 45 to 54 years old | 130 | 128 | 126 | 106 | 119 | +11.6 |
| 55 years old and over | 125 | 129 | 124 | 108 | 118 | +9.2 |
| Canada | 129 | 131 | 125 | 109 | 121 | +10.4 |
- Notes: Percentage change is based on unrounded numbers. Includes claims for which at least $1 of EI Work-Sharing benefits was paid. During the years reported in this table, no Work-Sharing claims were established in the territories.
- 1 Takes into account Family Supplement top-ups paid to claimants with Work-Sharing benefits.
- c For confidentiality purposes, data for some provinces in different years have been combined.
- Source: Employment and Social Development Canada, Employment Insurance (EI) administrative data. Data are based on a 100% sample of EI administrative data, except for the amount paid which is based on a 10% sample.
| Category | FY1415 | FY1516 | FY1617 | FY1718r | FY1819 | Change (%)
FY1718 to FY1819 |
|---|---|---|---|---|---|---|
| Newfoundland and Labrador | 0.0 | 0.1 | 0.2 | 0.2c | 0.0c | -97.8 |
| Prince Edward Island | 0.0r | 0.1 | 0.0 | 0.2c | 0.0c | -97.8 |
| Nova Scotia | 0.3c | 0.3 | 0.7 | 0.4 | 0.0 | -91.2 |
| New Brunswick | 0.3c | 0.0 | 0.1 | 0.0 | 0.0 | -68.6 |
| Quebec | 7.7r | 6.3r | 6.7r | 3.2 | 1.8 | -41.6 |
| Ontario | 5.5r | 5.4r | 4.5r | 2.8 | 1.5 | -47.4 |
| Manitoba | 0.6r | 3.0r | 3.7r | 0.6 | 0.5 | -12.5 |
| Saskatchewan | 2.1r | 2.4r | 1.8r | 0.9 | 0.5 | -43.6 |
| Alberta | 0.3r | 18.3r | 25.3r | 4.1 | 1.1 | -73.2 |
| British Columbia | 0.9r | 3.7r | 2.3r | 0.4 | 0.3 | -23.2 |
| Men | 13.1r | 31.2r | 34.4r | 9.2 | 4.3 | -53.7 |
| Women | 4.3r | 8.3 | 10.8r | 3.3 | 1.5 | -54.7 |
| 24 years old and under | 0.7r | 2.5r | 2.7r | 0.6 | 0.3 | -54.7 |
| 25 to 44 years old | 7.4r | 18.3r | 20.9r | 5.1 | 2.1 | -58.9 |
| 45 to 54 years old | 5.5r | 10.8r | 12.3r | 3.7 | 1.7 | -55.6 |
| 55 years old and over | 3.7r | 8.0r | 9.3r | 3.1 | 1.7 | -43.8 |
| Canada | 17.4r | 39.6r | 45.3r | 12.5 | 5.7 | -53.9 |
- Notes: Data may not add up to the total due to rounding. Percentage change is based on unrounded numbers. Includes claims for which at least $1 of EI Work-Sharing benefits was paid. During the years reported in this table, no Work-Sharing claims were established in the territories.
- 1 Takes into account Family Supplement top-ups paid to claimants with Work-Sharing benefits.
- 2 In previous EI Monitoring and Assessment Reports, amounts paid for Work-Sharing benefits were based on a 10% sample of EI administrative data. Starting in FY1819, amounts paid are based on a 100% sample. Consequently, statistics reported for previous years have been revised.
- c For confidentiality purposes, data for some provinces in different years have been combined.
- r Revised.
- Source: Employment and Social Development Canada, Employment Insurance (EI) administrative data. Data are based on a 100% sample of EI administrative data.
Annex 2.22 – Work-Sharing benefits (by industry)
| Industry | FY1415 | FY1516 | FY1617 | FY1718 | FY1819 | Change (%) FY1718 to FY1819 |
|---|---|---|---|---|---|---|
| Goods-producing industries | 5,365 | 15,612 | 9,315 | 3,031 | 3,461 | +14.2 |
| Agriculture, forestry, fishing and hunting | 75 | 40 | 10 | 18c | 13c | -27.8 |
| Mining and oil and gas extraction | 67 | 514c | 281 | 18c | 13c | -27.8 |
| Utilities | 0 | 514c | 0 | 0 | 0 | n/a |
| Construction | 208 | 627 | 550 | 158 | 190 | +20.3 |
| Manufacturing | 5,015 | 14,431 | 8,474 | 2,855 | 3,258 | +14.1 |
| Service-producing industries | 2,462 | 4,869 | 2,439 | 633r | 352 | -44.4 |
| Wholesale trade | 849 | 2,026 | 1,017 | 180 | 63 | -65.0 |
| Retail trade | 171 | 521 | 167 | 44 | 30 | -31.8 |
| Transportation and warehousing | 71c | 220c | 78c | 14c | 20c | +42.9 |
| Finance and insurance | 71c | 220c | 78c | 14c | 20c | +42.9 |
| Real estate and rental and leasing | 25 | 131 | 203 | 283c | 67c | -76.3 |
| Professional, scientific and technical services | 889 | 1,069 | 543 | 283c | 67c | -76.3 |
| Business, building and support services1 | 114 | 170 | 175 | 39 | 73 | +87.2 |
| Educational services | 49 | 14 | 32c | 24c | 23c | -4.2 |
| Health care and social assistance | 66 | 31 | 32c | 24c | 23c | -4.2 |
| Information, culture and recreation2 | 60 | 105 | 23 | 31 | 45 | +45.2 |
| Accommodation and food services | 26 | 216 | 29 | 14c | 28c | +100.0 |
| Other services (except public administration) | 141 | 352 | 169 | 14c | 28c | +100.0 |
| Public administration | 198c | 54c | 185c | 48c | n/a3 | n/a3 |
| Unclassified4 | 198c | 54c | 185c | 48c | n/a3 | n/a3 |
| Canada | 8,024 | 20,521 | 11,936 | 3,708 | 3,815 | -89.6 |
- Note: Includes claims for which at least $1 of EI Work-Sharing benefits was paid.
- 1 This industry sector comprises the industries with codes 55 (Management of companies and enterprises) and 56 (Administrative and support, waste management and remediation services) from the North American Industry Classification System.
- 2 This industry sector comprises the industries with codes 51 (Information and cultural industries) and 71 (Arts, entertainment and recreation) from the North American Industry Classification System.
- 3 Data have been suppressed to ensure confidentiality.
- 4 For some claims, this information was not available in the data.
- c For confidentiality purposes, data for some industries in different years have been combined.
- Source: Employment and Social Development Canada, Employment Insurance (EI) administrative data. Data are based on a 100% sample of EI administrative data.
| Industry | FY1415r | FY1516r | FY1617r | FY1718r | FY1819p | Change (%)
FY1718 to FY1819 |
|---|---|---|---|---|---|---|
| Goods-producing industries | 15.1 | 13.4 | 16.5 | 21.5 | 14.6 | -32.2 |
| Agriculture, forestry, fishing and hunting | 10.5 | 9.8 | 8.1 | 37.6c | 27.5c | -26.8 |
| Mining and oil and gas extraction | 16.5 | 17.2c | 17.6 | 37.6c | 27.5c | -26.8 |
| Utilities | 0.0 | 17.2c | 14.0 | 0.0 | 0.0 | n/a |
| Construction | 13.0 | 13.6 | 13.2 | 23.5 | 13.2 | -43.9 |
| Manufacturing | 15.3 | 13.3 | 16.6 | 21.0 | 14.6 | -30.4 |
| Service-producing industries | 17.0 | 16.8 | 20.8 | 31.6 | 21.2 | -33.0 |
| Wholesale trade | 17.9 | 16.4 | 20.3 | 34.0 | 18.7 | -45.1 |
| Retail trade | 18.8 | 14.2 | 21.4 | 25.4 | 16.3 | -35.9 |
| Transportation and warehousing | 19.8c | 24.0c | 19.6c | 32.2c | 31.2c | -3.2 |
| Finance and insurance | 19.8c | 24.0c | 19.6c | 32.2c | 31.2c | -3.2 |
| Real estate and rental and leasing | 16.0c | 14.4 | 19.2 | 28.1c | 25.1c | -10.5 |
| Professional, scientific and technical services | 16.0c | 19.3 | 19.9 | 28.1c | 25.1c | -10.5 |
| Business, building and support services1 | 16.3 | 13.4 | 22.9 | 24.5 | 12.2 | -50.3 |
| Educational services | 15.8 | 18.3c | 24.9c | 25.4c | 24.6c | -3.0 |
| Health care and social assistance | 22.8 | 18.3c | 24.9c | 25.4c | 24.6c | -3.0 |
| Information, culture and recreation2 | 20.8 | 18.3 | 26.9 | 55.2 | 24.2 | -56.2 |
| Accommodation and food services | 15.3 | 14.0 | 25.6 | 36.7c | 27.7c | -24.7 |
| Other services (except public administration) | 13.8 | 12.7 | 22.9 | 36.7c | 27.7c | -24.7 |
| Public administration | 12.5c | 12.8c | 15.1c | 14.9c | n/a3 | n/a3 |
| Unclassified4 | 12.5c | 12.8c | 15.1c | 14.9c | n/a3 | n/a3 |
| Canada | 15.6 | 14.4 | 17.4 | 23.8 | 15.5 | -35.1 |
- Note: Percentage change is based on unrounded numbers. Includes claims for which at least $1 of EI Work-Sharing benefits was paid. Based on completed claims which include those that are terminated and those that are dormant and remained inactive as of August the following fiscal year.
- 1 This industry sector comprises the industries with codes 55 (Management of companies and enterprises) and 56 (Administrative and support, waste management and remediation services) from the North American Industry Classification System.
- 2 This industry sector comprises the industries with codes 51 (Information and cultural industries) and 71 (Arts, entertainment and recreation) from the North American Industry Classification System.
- 3 Data have been suppressed to ensure confidentiality.
- 4 For some claims, this information was not available in the data.
- c For confidentiality purposes, data for some industries in different years have been combined.
- p Preliminary.
- r Revised.
- Source: Employment and Social Development Canada, Employment Insurance (EI) administrative data. Data are based on a 100% sample of EI administrative data.
| Industry | FY1415 | FY1516 | FY1617 | FY1718 | FY1819 | Change (%)
FY1718 to FY1819 |
|---|---|---|---|---|---|---|
| Goods-producing industries | 125 | 132 | 124 | 106 | 119 | +12.4 |
| Agriculture, forestry, fishing and hunting | 153 | 142 | 116 | 110c | 180c | +63.5 |
| Mining and oil and gas extraction | 198 | 152c | 126 | 110c | 180c | +63.5 |
| Utilities | 0 | 152c | 0 | 0 | 0 | n/a |
| Construction | 113 | 153 | 148 | 112 | 130 | +16.1 |
| Manufacturing | 124 | 130 | 122 | 106 | 119 | +11.9 |
| Service-producing industries | 138 | 129 | 129 | 123 | 133 | +8.4 |
| Wholesale trade | 169 | 109 | 111 | 113 | 145 | +28.1 |
| Retail trade | 126 | 115 | 130 | 119 | 106 | -10.6 |
| Transportation and warehousing | 155c | 136c,r | 158c | 157c | 91c | -41.9 |
| Finance and insurance | 155c | 136c,r | 158c | 157c | 91c | -41.9 |
| Real estate and rental and leasing | 116 | 125 | 132 | 131c | 140c | +7.0 |
| Professional, scientific and technical services | 122 | 138 | 145 | 131c | 140c | +7.0 |
| Business, building and support services2 | 111 | 140 | 139 | 100 | 156 | +57.0 |
| Educational services | 144 | 126c | 124c | 128c | 145c | +13.5 |
| Health care and social assistance | 100 | 126c | 124c | 128c | 145c | +13.5 |
| Information, culture and recreation3 | 124 | 179 | 152 | 136 | 118 | -13.2 |
| Accommodation and food services | 103 | 211 | 125 | 108c | 111c | +2.7 |
| Other services (except public administration) | 114 | 158 | 151 | 108c | 111c | +2.7 |
| Public administration | 128c | 148c | 130c | 125c | n/a4 | n/a4 |
| Unclassified5 | 128c | 148c | 130c | 125c | n/a4 | n/a4 |
| Canada | 129 | 131 | 125 | 109 | 121 | +10.4 |
- Note: Percentage change is based on unrounded numbers. Includes claims for which at least $1 of EI Work-Sharing benefits was paid.
- 1 Takes into account Family Supplement top-ups paid to claimants with Work-Sharing benefits.
- 2 This industry sector comprises the industries with codes 55 (Management of companies and enterprises) and 56 (Administrative and support, waste management and remediation services) from the North American Industry Classification System.
- 3 This industry sector comprises the industries with codes 51 (Information and cultural industries) and 71 (Arts, entertainment and recreation) from the North American Industry Classification System.
- 4 Data have been suppressed to ensure confidentiality.
- 5 For some claims, this information was not available in the data.
- c For confidentiality purposes, data for some industries in different years have been combined.
- r Revised.
- Source: Employment and Social Development Canada, Employment Insurance (EI) administrative data. Data are based on a 100% sample of EI administrative data.
| Industry | FY1415 | FY1516 | FY1617 | FY1718 | FY1819 | Change (%)
FY1718 to FY1819 |
|---|---|---|---|---|---|---|
| Goods-producing industries | 11.5r | 28.1r | 32.2r | 9.1r | 4.9 | -45.9 |
| Agriculture, forestry, fishing and hunting | 0.1 | 0.1 | 0.0 | 0.2c,r | 0.0c | -95.5 |
| Mining and oil and gas extraction | 0.2r | 1.4c,r | 1.3 | 0.2c,r | 0.0c | -95.5 |
| Utilities | 0.0 | 1.4c,r | 0.0 | 0.0 | 0.0 | n/a |
| Construction | 0.3 | 1.0r | 2.0r | 0.8r | 0.3 | -66.7 |
| Manufacturing | 10.9r | 25.7r | 28.9r | 8.0r | 4.6 | -42.5 |
| Service-producing industries | 5.8 | 12.3r | 13.9r | 3.4 | 0.8 | -74.9 |
| Wholesale trade | 2.5r | 4.1r | 4.2r | 1.1 | 0.2 | -81.4 |
| Retail trade | 0.2 | 0.8 | 1.3r | 0.2r | 0.1 | -66.5 |
| Transportation and warehousing | 0.1c | 0.5c,r | 0.6c,r | 0.1c,r | 0.0c | -66.7 |
| Finance and insurance | 0.1c | 0.5c,r | 0.6c,r | 0.1c,r | 0.0c | -66.7 |
| Real estate and rental and leasing | 0.0r | 0.2r | 0.8r | 1.3c,r | 0.2c | -82.7 |
| Professional, scientific and technical services | 2.3 | 2.9r | 2.7r | 1.3c,r | 0.2c | -82.7 |
| Business, building and support services3 | 0.2 | 0.4r | 0.8 | 0.2r | 0.1 | -48.3 |
| Educational services | 0.1 | 0.1c | 0.1c | 0.1c | 0.0c | -53.0 |
| Health care and social assistance | 0.1 | 0.1c | 0.1c | 0.1c | 0.0c | -53.0 |
| Information, culture and recreation4 | 0.1r | 0.5 | 0.4 | 0.2r | 0.1 | -33.9 |
| Accommodation and food services | 0.0 | 1.1r | 0.5r | 0.3c,r | 0.1c | -74.0 |
| Other services (except public administration) | 0.1 | 0.9r | 1.4 | 0.3c,r | 0.1c | -74.0 |
| Public administration | 0.1c,r | 0.0c | 0.4c,r | 0.1c | n/a5 | n/a5 |
| Unclassified6 | 0.1c,r | 0.0c | 0.4c,r | 0.1c | n/a5 | n/a5 |
| Canada | 17.4r | 39.6r | 45.3r | 12.5r | 5.7 | -53.9 |
- Note: Data may not add up to the total due to rounding. Percentage change is based on unrounded numbers. Includes claims for which at least $1 of EI Work-Sharing benefits was paid.
- 1 Takes into account Family Supplement top-ups paid to claimants with Work-Sharing benefits.
- 2 In previous EI Monitoring and Assessment Reports, amounts paid for Work-Sharing benefits were based on a 10% sample of EI administrative data. Starting in FY1819, amounts paid are based on a 100% sample. Consequently, statistics reported for previous years have been revised.
- 3 This industry sector comprises the industries with codes 55 (Management of companies and enterprises) and 56 (Administrative and support, waste management and remediation services) from the North American Industry Classification System.
- 4 This industry sector comprises the industries with codes 51 (Information and cultural industries) and 71 (Arts, entertainment and recreation) from the North American Industry Classification System.
- 5 Data have been suppressed to ensure confidentiality.
- 6 For some claims, this information was not available in the data.
- c For confidentiality purposes, data for some industries in different years have been combined.
- r Revised.
- Source: Employment and Social Development Canada, Employment Insurance (EI) administrative data. Data are based on a 100% sample of EI administrative data.
Annex 2.23 – Family Supplement
| Category | FY1415 | FY1516 | FY1617 | FY1718 | FY1819 | Change (%)
FY1718 to FY1819 |
|---|---|---|---|---|---|---|
| Newfoundland and Labrador | 2,390 | 2,490 | 2,500 | 2,530 | 2,320 | -8.3 |
| Prince Edward Island | 930 | 990 | 1,020 | 930 | 780 | -16.1 |
| Nova Scotia | 4,210 | 4,600 | 4,440 | 4,170 | 4,400 | +5.5 |
| New Brunswick | 4,460 | 4,100 | 4,100 | 3,960 | 3,890 | -1.8 |
| Quebec | 17,610 | 17,470 | 18,200 | 17,580 | 16,900 | -3.9 |
| Ontario | 28,330 | 27,680 | 26,330 | 25,740 | 23,470 | -8.8 |
| Manitoba | 4,260 | 4,390 | 4,070 | 4,010 | 3,880 | -3.2 |
| Saskatchewan | 2,680 | 2,660 | 3,050 | 3,110 | 3,270 | +5.1 |
| Alberta | 5,950 | 6,380 | 6,700 | 5,790 | 6,110 | +5.5 |
| British Columbia | 9,930 | 9,030 | 8,780 | 7,980 | 7,710 | -3.4 |
| Yukon | 40 | 20 | 40 | 50 | 20 | -60.0 |
| Northwest Territories | 60 | 20 | 90 | 50 | 60 | +20.0 |
| Nunavut | 60 | 80 | 90 | 50 | 90 | +80.0 |
| Men | 16,850 | 16,540 | 16,480 | 15,900 | 14,930 | -6.1 |
| Women | 64,060 | 63,370 | 62,930 | 60,050 | 57,970 | -3.5 |
| 24 years old and under | 10,640 | 10,420 | 9,820 | 9,580 | 9,010 | -5.9 |
| 25 to 44 years old | 56,930 | 57,080 | 57,040 | 54,100 | 52,600 | -2.8 |
| 45 to 54 years old | 11,760 | 10,840 | 10,980 | 10,580 | 9,880 | -6.6 |
| 55 years old and over | 1,580 | 1,570 | 1,570 | 1,690 | 1,410 | -16.6 |
| Canada | 80,910 | 79,910 | 79,410 | 75,950 | 72,900 | -4.0 |
- Note: Includes claims for which at least $1 in Family Supplement was paid.
- 1 Excludes Family caregiver benefits for adults and children due to the incompatibility of administrative data sources.
- Source: Employment and Social Development Canada, Employment Insurance (EI) administrative data. Data are based on a 10% sample of EI administrative data.
| Category | FY1415 | FY1516 | FY1617 | FY1718 | FY1819 |
|---|---|---|---|---|---|
| Newfoundland and Labrador | 2.9 | 2.9 | 3.4 | 3.1 | 2.7 |
| Prince Edward Island | 4.2 | 4.5 | 4.5 | 4.1 | 3.5 |
| Nova Scotia | 5.3 | 5.6 | 5.4 | 4.9 | 5.2 |
| New Brunswick | 5.2 | 4.6 | 4.6 | 4.3 | 4.3 |
| Quebec | 3.6 | 3.5 | 3.8 | 3.6 | 3.6 |
| Ontario | 5.0 | 4.9 | 4.8 | 4.6 | 4.2 |
| Manitoba | 7.5 | 6.8 | 6.9 | 6.5 | 6.1 |
| Saskatchewan | 5.6 | 4.7 | 6.1 | 6.1 | 6.0 |
| Alberta | 3.5 | 2.7 | 3.3 | 3.4 | 3.2 |
| British Columbia | 4.8 | 4.2 | 4.4 | 4.0 | 3.9 |
| Yukon | 1.6 | 0.8 | 1.7 | 2.3 | 0.9 |
| Northwest Territories | 2.7 | 0.9 | 3.8 | 2.1 | 2.6 |
| Nunavut | 6.1 | 6.5 | 7.0 | 3.7 | 6.1 |
| Men | 1.7 | 1.5 | 1.7 | 1.6 | 1.5 |
| Women | 7.9 | 7.5 | 7.5 | 7.1 | 6.9 |
| 24 years old and under | 5.8 | 5.4 | 5.5 | 5.5 | 5.3 |
| 25 to 44 years old | 6.5 | 6.1 | 6.5 | 6.2 | 6.0 |
| 45 to 54 years old | 3.0 | 2.7 | 3.0 | 2.9 | 2.8 |
| 55 years old and over | 0.4 | 0.4 | 0.4 | 0.4 | 0.3 |
| Canada | 4.5 | 4.2 | 4.4 | 4.2 | 4.0 |
- Note: Includes claims for which at least $1 in Family Supplement was paid.
- 1 Excludes Family caregiver benefits for adults and children due to the incompatibility of administrative data sources.
- Source: Employment and Social Development Canada, Employment Insurance (EI) administrative data. Data are based on a 10% sample of EI administrative data.
| Category | FY1415 | FY1516 | FY1617 | FY1718 | FY1819 | Change (%)
FY1718 to FY1819 |
|---|---|---|---|---|---|---|
| Newfoundland and Labrador | 40 | 42 | 39 | 44 | 43 | -1.5 |
| Prince Edward Island | 41 | 43 | 41 | 45r | 40 | -11.1 |
| Nova Scotia | 41 | 43 | 45 | 42 | 44 | +3.7 |
| New Brunswick | 36 | 39 | 41 | 40 | 43 | +5.7 |
| Quebec | 43 | 43 | 42 | 42 | 43 | +0.7 |
| Ontario | 39r | 40 | 43 | 45 | 43 | -3.8 |
| Manitoba | 46 | 49 | 55 | 55 | 54 | -2.1 |
| Saskatchewan | 47 | 43r | 49 | 55r | 51 | -6.4 |
| Alberta | 43 | 41 | 45r | 43r | 44 | +1.6 |
| British Columbia | 38 | 39 | 43 | 40 | 42 | +3.6 |
| Yukon | 44 | 60 | 30 | 25 | 35 | +40.8 |
| Northwest Territories | 43 | 15 | 35 | 52 | 43 | -17.1 |
| Nunavut | 35 | 61 | 44 | 39 | 46 | +16.1 |
| Men | 46 | 47 | 47 | 48 | 49 | +3.1 |
| Women | 39r | 40 | 43 | 44 | 43 | -1.9 |
| 24 years old and under | 35 | 34r | 38 | 37 | 38 | +3.0 |
| 25 to 44 years old | 43 | 44 | 47 | 47 | 47 | -1.4 |
| 45 to 54 years old | 36 | 37 | 36 | 38 | 37 | -2.0 |
| 55 years old and over | 36 | 36 | 34 | 36 | 33 | -9.9 |
| Canada | 41 | 41 | 44 | 44 | 44 | -0.9 |
- Note: Percentage change is based on unrounded numbers. Includes claims for which at least $1 in Family Supplement was paid.
- 1 Excludes Family caregiver benefits for adults and children due to the incompatibility of administrative data sources.
- r Revised data.
- Source: Employment and Social Development Canada, Employment Insurance (EI) administrative data. Data are based on a 10% sample of EI administrative data.
| Category | FY1415 | FY1516 | FY1617 | FY1718 | FY1819 | Change (%)
FY1617 to FY1718 |
|---|---|---|---|---|---|---|
| Newfoundland and Labrador | 330 | 332 | 341 | 347 | 339 | -2.1 |
| Prince Edward Island | 327 | 340 | 343 | 350 | 357 | +2.0 |
| Nova Scotia | 328 | 329 | 324 | 331 | 342 | +3.2 |
| New Brunswick | 330 | 338 | 340 | 353 | 353 | 0.0 |
| Quebec | 347 | 353 | 360 | 363 | 376 | +3.5 |
| Ontario | 326 | 336 | 341 | 350 | 368 | +5.0 |
| Manitoba | 347 | 349 | 369 | 358 | 374 | +4.5 |
| Saskatchewan | 356 | 359 | 359 | 361 | 378 | +4.5 |
| Alberta | 348 | 357 | 366 | 374 | 383 | +2.5 |
| British Columbia | 333 | 338 | 349 | 354 | 369 | +4.4 |
| Yukon | 326 | 461 | 480 | 418 | 308 | -26.2 |
| Northwest Territories | 343 | 500 | 432 | 359 | 405 | +12.8 |
| Nunavut | 314 | 385 | 344 | 431 | 352 | -18.4 |
| Men | 384 | 393 | 397 | 404 | 416 | +3.0 |
| Women | 323 | 330 | 337 | 343 | 356 | +4.0 |
| 24 years old and under | 292 | 297 | 299 | 312 | 324 | +4.0 |
| 25 to 44 years old | 343 | 350 | 358 | 363 | 375 | +3.3 |
| 45 to 54 years old | 341 | 345 | 349 | 353 | 373 | +5.7 |
| 55 years old and over | 350 | 363 | 355 | 377 | 376 | -0.2 |
| Canada | 336 | 343 | 350 | 355 | 369 | +3.7 |
- Note: Percentage change is based on unrounded numbers. Includes claims for which at least $1 in Family Supplement was paid.
- 1 Excludes Family caregiver benefits for adults and children due to the incompatibility of administrative data sources.
- 2 Averages include all claims which provided Family Supplement top-ups paid to Employment Insurance claimants.
- Source: Employment and Social Development Canada, Employment Insurance (EI) administrative data. Data are based on a 10% sample of EI administrative data.
| Category | FY1415 | FY1516 | FY1617 | FY1718 | FY1819 | Change (%)
FY1617 to FY1718 |
|---|---|---|---|---|---|---|
| Newfoundland and Labrador | 3.6 | 3.4r | 3.1r | 4.0 | 3.5 | -11.9 |
| Prince Edward Island | 1.3 | 1.2 | 1.3 | 1.2 | 1.0 | -20.3 |
| Nova Scotia | 5.1 | 6.2 | 5.7r | 5.6 | 5.3 | -5.6 |
| New Brunswick | 5.0 | 4.9r | 4.6 | 4.9r | 4.5 | -7.1 |
| Quebec | 15.2r | 15.3 | 15.5 | 15.2 | 13.3 | -12.3 |
| Ontario | 32.7r | 32.8 | 30.0r | 30.8r | 25.3 | -17.9 |
| Manitoba | 5.4 | 5.5 | 6.1 | 6.1 | 5.4 | -12.5 |
| Saskatchewan | 3.9r | 3.3r | 4.2r | 4.7r | 4.8 | +0.8 |
| Alberta | 7.3r | 7.4r | 8.1r | 8.1r | 6.4 | -20.9 |
| British Columbia | 10.3 | 10.3 | 9.8 | 8.9 | 7.3 | -18.1 |
| Yukon | 0.1 | 0.0 | 0.0 | 0.0 | 0.0 | +11.7 |
| Northwest Territories | 0.1 | 0.0 | 0.1 | 0.1 | 0.1 | +29.9 |
| Nunavut | 0.0 | 0.1 | 0.1 | 0.1 | 0.1 | +92.0 |
| Men | 16.4 | 17.0 | 17.0 | 17.0 | 14.7 | -13.4 |
| Women | 73.6 | 73.6 | 71.6 | 72.7 | 62.3 | -14.3 |
| 24 years old and under | 13.6 | 13.5 | 12.1 | 12.1 | 10.0 | -17.4 |
| 25 to 44 years old | 66.8 | 67.5 | 67.0 | 67.4 | 58.3 | -13.5 |
| 45 to 54 years old | 8.4 | 8.3 | 8.5 | 8.8 | 7.7 | -12.4 |
| 55 years old and over | 1.2 | 1.3 | 1.1 | 1.3 | 0.9 | -28.8 |
| Canada | 90.0 | 90.6 | 88.7 | 89.7 | 77.0 | -14.2 |
- Note: Data may not add up to the total due to rounding. Percentage change is based on unrounded numbers. Includes claims for which at least $1 in Family Supplement was paid.
- 1 Excludes Family caregiver benefits for adults and children due to the incompatibility of administrative data sources.
- r Revised data.
- Source: Employment and Social Development Canada, Employment Insurance (EI) administrative data. Data are based on a 10% sample of EI administrative data.
Annex 2.24 – Working while on claim
| Category | FY1415 | FY1516 | FY1617 | FY1718r | FY1819p | Change (%)
FY1718 to FY1819 |
|---|---|---|---|---|---|---|
| Newfoundland and Labrador | 38,000 | 36,560 | 34,480 | 39,010 | 44,280 | +13.5 |
| Prince Edward Island | 9,100 | 8,950 | 9,020 | 9,220 | 8,610 | -6.6 |
| Nova Scotia | 33,780 | 34,730 | 34,120 | 36,420 | 35,410 | -2.8 |
| New Brunswick | 44,010 | 43,590 | 44,660 | 45,350 | 40,240 | -11.3 |
| Quebec | 257,360 | 249,000 | 245,130 | 249,350 | 230,800 | -7.4 |
| Ontario | 180,650 | 182,430 | 163,780 | 174,130 | 157,030 | -9.8 |
| Manitoba | 17,750 | 15,790 | 17,920 | 18,560 | 19,310 | +4.0 |
| Saskatchewan | 12,590 | 14,650 | 15,180 | 17,850 | 18,960 | +6.2 |
| Alberta | 35,170 | 43,880 | 72,540 | 71,460 | 65,300 | -8.6 |
| British Columbia | 70,660 | 66,910 | 65,710 | 66,110 | 61,740 | -6.6 |
| Yukon | 920 | 870 | 760 | 690 | 700 | +1.4 |
| Northwest Territories | 720 | 750 | 760 | 730 | 790 | +8.2 |
| Nunavut | 270 | 230 | 240 | 330 | 430 | +30.3 |
| Men | 418,680 | 418,140 | 433,580 | 432,850 | 407,900 | -5.8 |
| Women | 282,300 | 280,200 | 270,720 | 296,360 | 275,700 | -7.0 |
| 24 years old and under | 67,960 | 67,700 | 72,600 | 69,190 | 62,060 | -10.3 |
| 25 to 44 years old | 319,090 | 325,920 | 334,080 | 343,220 | 325,620 | -5.1 |
| 45 to 54 years old | 198,710 | 188,990 | 182,110 | 191,010 | 171,470 | -10.2 |
| 55 years old and over | 115,220 | 115,730 | 115,510 | 125,790 | 124,450 | -1.1 |
| Canada | 700,980 | 698,340 | 704,300 | 729,210 | 683,600 | -6.3 |
- Note: Includes claims for which at least $1 of regular benefit was paid. Includes only claims with at least $1 of employment income earned from working while on claim while claiming EI regular benefits. Based on completed claims which include those that are terminated and those that are dormant and remained inactive as of August the following fiscal year.
- r Revised data.
- p Preliminary.
- Source: Employment and Social Development Canada, Employment Insurance (EI) administrative data. Data are based on a 10% sample of EI administrative data.
| Category | FY1415 | FY1516 | FY1617 | FY1718r | FY1819p | Change (%)
FY1718 to FY1819 |
|---|---|---|---|---|---|---|
| Newfoundland and Labrador | 15.6 | 15.6 | 15.2 | 17.7 | 16.9 | -4.5 |
| Prince Edward Island | 13.8 | 13.3 | 13.9 | 13.7 | 13.1 | -4.4 |
| Nova Scotia | 14.5 | 14.3 | 14.0 | 13.8 | 13.3 | -3.6 |
| New Brunswick | 16.9 | 16.6 | 16.4 | 16.5 | 15.9 | -3.6 |
| Quebec | 13.5 | 13.4 | 13.5 | 13.1 | 12.7 | -3.1 |
| Ontario | 9.1 | 8.3 | 8.4 | 8.0 | 7.7 | -3.8 |
| Manitoba | 5.7 | 6.0 | 5.8 | 6.1 | 6.1 | 0.0 |
| Saskatchewan | 6.3 | 6.2 | 7.0 | 8.7 | 7.7 | -11.5 |
| Alberta | 5.9 | 6.0 | 7.0 | 9.8 | 7.7 | -21.4 |
| British Columbia | 8.9 | 8.9 | 9.0 | 9.4 | 8.6 | -8.5 |
| Yukon | 8.8 | 7.7 | 7.0 | 8.1 | 8.0 | -1.2 |
| Northwest Territories | 5.7 | 7.1 | 7.1 | 6.0 | 5.0 | -16.7 |
| Nunavut | 5.8 | 7.3 | 8.6 | 7.2 | 7.1 | -1.4 |
| Men | 11.6 | 11.2 | 11.0 | 11.5 | 11.1 | -3.5 |
| Women | 11.5 | 11.1 | 11.3 | 11.3 | 10.5 | -7.1 |
| 24 years old and under | 9.3 | 9.1 | 8.8 | 8.8 | 8.7 | -1.1 |
| 25 to 44 years old | 10.7 | 10.4 | 10.4 | 10.7 | 10.1 | -5.6 |
| 45 to 54 years old | 13.1 | 12.8 | 12.7 | 12.9 | 12.3 | -4.7 |
| 55 years old and over | 12.4 | 12.0 | 12.4 | 12.7 | 12.2 | -3.9 |
| Canada | 11.5 | 11.2 | 11.2 | 11.4 | 10.9 | -4.4 |
- Note: Percentage change is based on unrounded numbers. Includes only weeks with at least $1 of employment income earned from working while on claim while claiming EI regular benefits. Based on completed claims which include those that are terminated and those that are dormant and remained inactive as of August the following fiscal year.
- r Revised data.
- p Preliminary.
- Source: Employment and Social Development Canada, Employment Insurance (EI) administrative data. Data are based on a 10% sample of EI administrative data.
| Category | FY1415 | FY1516 | FY1617 | FY1718r | FY1819p | Change (%)
FY1718 to FY1819 |
|---|---|---|---|---|---|---|
| Newfoundland and Labrador | 965 | 1,014 | 993 | 1,021 | 1,070 | +4.8 |
| Prince Edward Island | 664 | 743 | 724 | 687 | 724 | +5.4 |
| Nova Scotia | 803 | 848 | 851 | 821 | 831 | +1.3 |
| New Brunswick | 764 | 793 | 794 | 793 | 818 | +3.0 |
| Quebec | 731 | 750 | 760 | 778 | 809 | +3.9 |
| Ontario | 638 | 631 | 640 | 654 | 676 | +3.3 |
| Manitoba | 569 | 574 | 615 | 608 | 616 | +1.4 |
| Saskatchewan | 699 | 769 | 728 | 753 | 815 | +8.2 |
| Alberta | 841 | 891 | 825 | 858 | 901 | +5.0 |
| British Columbia | 673 | 735 | 725 | 726 | 751 | +3.5 |
| Yukon | 651 | 663 | 658 | 607 | 722 | +18.9 |
| Northwest Territories | 819 | 899 | 805 | 898 | 873 | -2.8 |
| Nunavut | 682 | 819 | 628 | 856 | 816 | -4.6 |
| Men | 878 | 907 | 903 | 930 | 969 | +4.2 |
| Women | 485 | 502 | 501 | 515 | 535 | +3.9 |
| 24 years old and under | 591 | 603 | 611 | 589 | 620 | +5.2 |
| 25 to 44 years old | 725 | 750 | 762 | 771 | 803 | +4.1 |
| 45 to 54 years old | 761 | 793 | 788 | 808 | 847 | +4.8 |
| 55 years old and over | 707 | 733 | 734 | 760 | 785 | +3.3 |
| Canada | 719 | 744 | 749 | 762 | 794 | +4.3 |
- Note: Percentage change is based on unrounded numbers. Includes employment income only (all amounts paid in Employment Insurance benefits are excluded from the calculation). Only weeks with at least $1 of employment income earned from working while on claim while claiming EI regular benefits are taken into account in the calculation. Based on completed claims which include those that are terminated and those that are dormant and remained inactive as of August the following fiscal year.
- r Revised.
- p Preliminary.
- Source: Employment and Social Development Canada, Employment Insurance (EI) administrative data. Data are based on a 10% sample of EI administrative data.
| Category | FY1415 | FY1516 | FY1617 | FY1718r | FY1819p | Change
(% points)
FY1718 to FY1819 |
|---|---|---|---|---|---|---|
| Newfoundland and Labrador | 59.5 | 60.1 | 60.2 | 61.0 | 60.8 | -0.2 |
| Prince Edward Island | 55.0 | 55.6 | 53.2 | 53.4 | 51.2 | -2.3 |
| Nova Scotia | 56.7 | 55.4 | 54.7 | 55.3 | 54.5 | -0.8 |
| New Brunswick | 62.6 | 61.5 | 60.6 | 60.3 | 57.1 | -3.3 |
| Quebec | 58.5 | 57.7 | 58.0 | 57.5 | 56.4 | -1.1 |
| Ontario | 43.6 | 44.8 | 43.1 | 43.9 | 41.5 | -2.4 |
| Manitoba | 45.8 | 42.8 | 44.3 | 45.7 | 43.7 | -2.0 |
| Saskatchewan | 43.7 | 47.2 | 44.0 | 47.1 | 45.4 | -1.7 |
| Alberta | 41.4 | 42.5 | 44.6 | 48.5 | 46.2 | -2.3 |
| British Columbia | 48.2 | 48.0 | 47.9 | 49.0 | 47.9 | -1.1 |
| Yukon | 42.4 | 48.3 | 41.3 | 38.5 | 40.2 | +1.7 |
| Northwest Territories | 43.1 | 43.6 | 45.0 | 43.5 | 45.1 | +1.7 |
| Nunavut | 36.5 | 41.8 | 32.9 | 40.2 | 42.2 | +1.9 |
| Men | 50.4 | 49.7 | 49.5 | 49.9 | 48.5 | -1.4 |
| Women | 52.6 | 53.5 | 52.5 | 53.8 | 51.8 | -2.0 |
| 24 years old and under | 51.2 | 50.8 | 51.4 | 51.8 | 49.4 | -2.3 |
| 25 to 44 years old | 53.5 | 53.6 | 53.5 | 54.9 | 53.9 | -1.0 |
| 45 to 54 years old | 58.6 | 58.5 | 57.6 | 59.4 | 57.1 | -2.3 |
| 55 years old and over | 38.5 | 38.6 | 37.2 | 37.3 | 36.2 | -1.1 |
| Canada | 51.3 | 51.2 | 50.6 | 51.4 | 49.8 | -1.7 |
- Note: Percentage change is based on unrounded numbers. Includes claims for which at least $1 of regular benefit was paid. Based on completed claims which include those that are terminated and those that are dormant and remained inactive as of August the following fiscal year.
- r Revised data.
- p Preliminary.
- Source: Employment and Social Development Canada, Employment Insurance (EI) administrative data. Data are based on a 10% sample of EI administrative data.
| Benefit type | FY1617 Level of claims | FY1617 Combined claims (%) | FY1718 Level of claims | FY1718 Combined claims (%) | FY1819 Level of claims | FY1819 Combined claims (%) |
|---|---|---|---|---|---|---|
| Regular | 1,467,260 | 11.9 | 1,498,290 | 12.4 | 1,423,840 | 12.8 |
| Fishing | 27,280 | 13.2 | 30,570 | 13.1 | 30,190 | 13.5 |
| Sickness | 398,040 | 47.4 | 435,640 | 46.6 | 439,560 | 46.1 |
| Maternity | 175,170 | 98.4 | 173,960 | 98.5 | 166,180 | 98.5 |
| Parental2 | 202,880 | 86.0 | 204,310 | 85.0 | 196,260 | 84.2 |
| Compassionate care | 9,690 | 41.6 | 12,300 | 41.1 | 9,970 | 41.5 |
| Work-sharing | 17,950 | 22.1 | 11,310 | 25.1 | 3,310 | 31.1 |
| All claims3 | 1,922,010 | 18.0 | 1,976,800 | 18.0 | 1,891,250 | 18.2 |
- Note: Includes claims for which at least $1 of EI benefits was paid. Completed claims include those that are terminated and those that are dormant and remained inactive as of August the following fiscal year.
- 1 Excludes Family caregiver benefits for adults and children due to the incompatibility of administrative data sources.
- 2 Parental benefits for biological parents and parental benefits for adoptive parents are grouped together.
- 3 The sum of claims by benefit type does not add up to the total because more than 1 benefit type can be part of the same claim.
- Source: Employment and Social Development Canada, Employment Insurance (EI) administrative data. Data are based on a 10% sample of EI administrative data
Annex 2.26 – Employment Insurance benefit repayment
| Category | 2013 | 2014 | 2015 | 2016 | 2017 | Change (%)
2016 to 2017 |
|---|---|---|---|---|---|---|
| Newfoundland and Labrador | 12,787 | 14,168 | 14,766 | 14,812 | 14,412 | -2.7 |
| Prince Edward Island | 1,048 | 1,275 | 1,422 | 1,573 | 1,737 | +10.4 |
| Nova Scotia | 7,722 | 8,738 | 8,625 | 7,952 | 8,645 | +8.7 |
| New Brunswick | 6,499 | 7,220 | 6,869 | 6,038 | 6,135 | +1.6 |
| Quebec | 40,948 | 40,567 | 37,645 | 39,941 | 43,401 | +8.7 |
| Ontario | 38,373 | 43,716 | 45,100 | 36,921 | 44,092 | +19.4 |
| Manitoba | 2,918 | 3,084 | 3,162 | 3,074 | 3,882 | +26.3 |
| Saskatchewan | 4,585 | 4,690 | 4,982 | 5,230 | 6,225 | +19.0 |
| Alberta | 22,813 | 23,415 | 28,296 | 33,926 | 38,651 | +13.9 |
| British Columbia | 18,676 | 19,215 | 20,590 | 19,088 | 21,186 | +11.0 |
| Yukon | 288 | 273 | 299 | 274 | 344 | +25.5 |
| Northwest Territories | 275 | 259 | 264 | 310 | 299 | -3.5 |
| Nunavut | 108 | 96 | 108 | 107 | 120 | +12.1 |
| Non-residents of Canada | 69 | 61 | 97 | 83 | 99 | +19.3 |
| Men | 140,103 | 148,848 | 153,159 | 150,835 | 167,644 | +11.1 |
| Women | 17,006 | 17,929 | 19,066 | 18,494 | 21,584 | +16.7 |
| 24 years old and under | 6,098 | 6,328 | 5,408 | 4,879 | 5,394 | +10.6 |
| 25 to 44 years old | 68,297 | 72,948 | 77,047 | 78,828 | 85,933 | +9.0 |
| 45 to 54 years old | 41,376 | 43,660 | 44,369 | 41,292 | 45,790 | +10.9 |
| 55 years old and over | 41,338 | 43,841 | 45,401 | 44,330 | 52,111 | +17.6 |
| Canada | 157,109 | 166,777 | 172,225 | 169,329 | 189,228 | +11.8 |
- 1 As benefit repayments are administered through the tax system, the most recent data available are for the 2017 tax year.
- Source: Employment and Social Development Canada, Employment Insurance (EI) administrative data. Data are based on a 100% sample of EI administrative data.
| Category | 2013 | 2014 | 2015 | 2016 | 2017 | Change (%)
2016 to 2017 |
|---|---|---|---|---|---|---|
| Newfoundland and Labrador | 21.0 | 26.9 | 28.7 | 31.6 | 32.1 | +1.5 |
| Prince Edward Island | 1.9 | 2.7 | 3.8 | 4.7 | 5.7 | +22.4 |
| Nova Scotia | 14.5 | 17.5 | 20.0 | 18.8 | 21.4 | +13.8 |
| New Brunswick | 11.6 | 13.5 | 14.7 | 13.3 | 14.2 | +6.9 |
| Quebec | 45.3 | 46.1 | 44.3 | 45.9 | 52.2 | +13.8 |
| Ontario | 44.5 | 49.8 | 54.8 | 46.2 | 53.6 | +16.1 |
| Manitoba | 3.7 | 4.2 | 4.4 | 4.2 | 5.3 | +27.2 |
| Saskatchewan | 5.7 | 6.4 | 7.1 | 7.7 | 9.9 | +29.2 |
| Alberta | 29.1 | 31.2 | 40.0 | 51.4 | 60.8 | +18.3 |
| British Columbia | 23.3 | 24.9 | 28.6 | 25.9 | 29.0 | +11.9 |
| Yukon | 0.4 | 0.4 | 0.4 | 0.4 | 0.5 | +28.8 |
| Northwest Territories | 0.4 | 0.4 | 0.4 | 0.4 | 0.5 | +8.7 |
| Nunavut | 0.1 | 0.1 | 0.2 | 0.2 | 0.2 | +7.9 |
| Non-residents of Canada | 0.1 | 0.1 | 0.2 | 0.1 | 0.2 | +41.0 |
| Men | 182.9 | 203.8 | 224.4 | 227.7 | 257.4 | +13.1 |
| Women | 18.8 | 20.2 | 23.1 | 23.0 | 28.1 | +22.2 |
| 24 years old and under | 7.2 | 8.0 | 7.4 | 6.7 | 7.4 | +10.6 |
| 25 to 44 years old | 79.8 | 89.8 | 100.9 | 104.8 | 116.3 | +11.0 |
| 45 to 54 years old | 52.0 | 57.1 | 63.0 | 61.6 | 69.1 | +12.1 |
| 55 years old and over | 62.6 | 69.1 | 76.1 | 77.6 | 92.7 | +19.5 |
| Canada | 201.7 | 224.0 | 247.5 | 250.6 | 285.5 | +13.9 |
- Note: Data may not add up to the totals due to rounding. Percentage change is based on unrounded numbers.
- 1 As benefit repayments are administered through the tax system, the most recent data available are for the 2017 tax year.
- Source: Employment and Social Development Canada, Employment Insurance (EI) administrative data. Data are based on a 100% sample of EI administrative data.
Annex 2.27 – Contributors to the Employment Insurance program
| Category | 2016 Total | 2017 Total | 2017 % of total | 2017 Paid by employers2 | 2017 Paid by employees |
|---|---|---|---|---|---|
| Newfoundland and Labrador | 370.3 | 315.6 | 1.5 | 183.0 | 136.5 |
| Prince Edward Island | 94.7 | 86.1 | 0.4 | 49.6 | 37.0 |
| Nova Scotia | 614.7 | 545.8 | 2.6 | 311.5 | 238.0 |
| New Brunswick | 497.8 | 443.6 | 2.1 | 253.8 | 192.2 |
| Quebec | 4,375.5 | 3,763.8 | 17.7 | 2,123.7 | 1,669.1 |
| Ontario | 9,621.7 | 8,617.6 | 40.6 | 4,929.2 | 3,768.2 |
| Manitoba | 892.4 | 795.7 | 3.7 | 454.4 | 347.8 |
| Saskatchewan | 786.1 | 681.2 | 3.2 | 388.1 | 300.7 |
| Alberta | 3,399.7 | 2,969.2 | 14.0 | 1,707.0 | 1,311.6 |
| British Columbia | 3,188.3 | 2,911.2 | 13.7 | 1,675.0 | 1,268.2 |
| Yukon | 36.3 | 33.6 | 0.2 | 19.5 | 14.6 |
| Northwest Territories | 50.4 | 43.2 | 0.2 | 25.0 | 19.0 |
| Nunavut | 34.0 | 31.1 | 0.1 | 18.2 | 13.6 |
| Men | 13,202.1 | 11,725.4 | 55.2 | 6,729.7 | 5,146.0 |
| Women | 10,758.6 | 9,510.8 | 44.8 | 5,407.5 | 4,170.0 |
| Unknown3 | 1.2 | 1.4 | 0.0 | 0.8 | 0.6 |
| 24 years old and under | 1,871.8 | 1,694.2 | 8.0 | 980.9 | 718.8 |
| 25 to 44 years old | 11,271.5 | 10,040.9 | 47.3 | 5,750.1 | 4,413.6 |
| 45 to 54 years old | 5,963.2 | 5,129.0 | 24.2 | 2,918.8 | 2,267.5 |
| 55 years old and over | 4,850.3 | 4,368.4 | 20.6 | 2,485.4 | 1,914.5 |
| Unknown3 | 5.1 | 5.0 | 0.0 | 2.9 | 2.2 |
| Goods-producing industries | 5,386.6 | 4,801.4 | 22.6 | 2,772.4 | 2,096.6 |
| Agriculture, forestry, fishing and hunting | 293.9 | 268.5 | 1.3 | 157.1 | 114.3 |
| Mining, and oil and gas extraction | 395.2 | 362.8 | 1.7 | 209.5 | 163.6 |
| Utilities | 221.4 | 189.2 | 0.9 | 105.0 | 86.3 |
| Construction | 1,841.1 | 1,650.1 | 7.8 | 977.0 | 708.8 |
| Manufacturing | 2,634.9 | 2,330.8 | 11.0 | 1,323.8 | 1,023.7 |
| Service-producing industries | 18,397.7 | 16,307.3 | 76.8 | 9,289.5 | 7,165.1 |
| Wholesale trade | 1,281.6 | 1,076.0 | 5.1 | 616.6 | 469.8 |
| Retail trade | 1,954.4 | 1,732.8 | 8.2 | 998.3 | 743.5 |
| Transportation and warehousing | 1,111.7 | 1,000.4 | 4.7 | 568.9 | 441.0 |
| Finance and insurance | 1,172.6 | 1,019.5 | 4.8 | 567.1 | 462.7 |
| Real estate, and rental and leasing | 403.0 | 364.1 | 1.7 | 211.6 | 156.8 |
| Professional, scientific and technical services | 1,465.1 | 1,341.4 | 6.3 | 773.6 | 588.3 |
| Business, building and other support services4 | 1,313.0 | 1,198.1 | 5.6 | 691.6 | 518.2 |
| Educational services | 1,900.5 | 1,662.4 | 7.8 | 923.8 | 750.2 |
| Health care and social assistance | 2,170.1 | 1,924.9 | 9.1 | 1,099.7 | 847.6 |
| Information, culture and recreation5 | 837.7 | 724.8 | 3.4 | 413.3 | 318.9 |
| Accommodation and food services | 975.0 | 890.2 | 4.2 | 518.3 | 374.3 |
| Other services (except public administration) | 802.8 | 727.2 | 3.4 | 423.4 | 310.8 |
| Public administration | 3,010.1 | 2,645.5 | 12.5 | 1,483.2 | 1,183.0 |
| Unclassified3 | 177.6 | 128.9 | 0.6 | 76.2 | 54.9 |
| Canada | 23,962.0 | 21,237.6 | 100.0 | 12,138.0 | 9,316.5 |
- Note: Data may not add up to the totals due to rounding. Percentage share is based on unrounded numbers.
- 1 As Employment Insurance premium payments are administered through the tax system, the most recent data available are for the 2017 taxation year.
- 2 Employer contributions are 1.4 times the level of employee contributions. However, employers who participate in the Premium Reduction Program may contribute less than 1.4 times their employees’ contributions. See Chapter 2, Section 2.7 for more information.
- 3 For some T4 slips, this information was not available in the data.
- 4 This industry category comprises the industries with codes 55 (Management of Companies and Enterprises) and 56 (Administrative and Support, Waste Management and Mediation services) from the North American Industry Classification System.
- 5 This industry category comprises the industries with codes 51 (Information and Cultural Industries) and 71 (Arts, Entertainment and Recreation) from the North American Industry Classification System.
- Source: Canada Revenue Agency, T4 slips with employment income. Data are based on a 10% sample of T4 slips with employment income.
| Category | Total empl. Income ($ million) 2016 | Total empl. Income ($ million) 2017 | Total empl. Income ($ million) % of total 2017 | Total ins. earnings ($ million) 2016 | Total ins. earnings ($ million) 2017 | Number of workers with empl. income 2016 | Number of workers with empl. income 2017 | Number of workers with empl. income % of total 2017 | Empl. income per worker ($ per year) 2016r | Empl. income per worker ($ per year) 2017 | Ins. earnings per worker ($ per year) 2016r | Ins. earnings per worker ($ per year) 2017 |
|---|---|---|---|---|---|---|---|---|---|---|---|---|
| Newfoundland and Labrador | 12,634.5 | 11,934.9 | 1.3 | 8,480.7 | 8,360.9 | 276,450 | 270,930 | 1.4 | 45,703 | 44,052 | 30,677 | 30,860 |
| Prince Edward Island | 2,776.2 | 2,899.8 | 0.3 | 2,156.4 | 2,266.6 | 80,420 | 83,490 | 0.4 | 34,521 | 34,732 | 26,814 | 27,148 |
| Nova Scotia | 18,948.3 | 19,208.7 | 2.2 | 14,147.4 | 14,586.3 | 480,370 | 490,840 | 2.6 | 39,445 | 39,134 | 29,451 | 29,717 |
| New Brunswick | 15,002.7 | 15,286.2 | 1.7 | 11,406.6 | 11,775.1 | 393,650 | 397,910 | 2.1 | 38,112 | 38,416 | 28,977 | 29,592 |
| Quebec | 173,833.1 | 178,586.5 | 20.1 | 126,262.6 | 131,202.1 | 4,204,180 | 4,283,290 | 22.3 | 41,348 | 41,694 | 30,033 | 30,631 |
| Ontario | 352,225.5 | 352,072.4 | 39.7 | 222,248.7 | 230,942.6 | 7,191,750 | 7,373,130 | 38.3 | 48,976 | 47,751 | 30,903 | 31,322 |
| Manitoba | 28,950.3 | 29,872.1 | 3.4 | 20,611.3 | 21,318.7 | 685,070 | 689,480 | 3.6 | 42,259 | 43,326 | 30,086 | 30,920 |
| Saskatchewan | 27,130.3 | 26,556.7 | 3.0 | 18,294.9 | 18,431.7 | 591,870 | 580,370 | 3.0 | 45,838 | 45,758 | 30,910 | 31,759 |
| Alberta | 133,969.4 | 131,577.0 | 14.8 | 78,890.4 | 80,385.5 | 2,406,620 | 2,388,480 | 12.4 | 55,667 | 55,088 | 32,781 | 33,655 |
| British Columbia | 111,651.7 | 114,362.2 | 12.9 | 73,416.5 | 77,707.8 | 2,510,010 | 2,594,000 | 13.5 | 44,483 | 44,087 | 29,249 | 29,957 |
| Yukon | 1,220.5 | 1,266.5 | 0.1 | 833.6 | 894.5 | 25,110 | 26,300 | 0.1 | 48,606 | 48,156 | 33,198 | 34,010 |
| Northwest Territories | 2,110.6 | 2,060.6 | 0.2 | 1,172.1 | 1,163.9 | 32,340 | 32,420 | 0.2 | 65,264 | 63,559 | 36,244 | 35,901 |
| Nunavut | 1,387.5 | 1,385.1 | 0.2 | 791.2 | 842.6 | 24,500 | 25,370 | 0.1 | 56,634 | 54,597 | 32,295 | 34,010 |
| Men | 533,908.4 | 532,725.2 | 60.1 | 319,151.7 | 331,266.3 | 9,769,570 | 9,949,350 | 51.7 | 54,650 | 53,544 | 32,668 | 33,295 |
| Women | 347,697.1 | 354,066.2 | 39.9 | 259,532.9 | 268,574.3 | 9,124,560 | 9,278,320 | 48.2 | 38,106 | 38,161 | 28,443 | 28,946 |
| Unknown gender2 | 235.0 | 277.3 | 0.0 | 27.9 | 37.7 | 8,210 | 8,340 | 0.0 | 28,628 | 33,254 | 3,400 | 4,517 |
| 24 years old and under | 46,628.2 | 48,902.5 | 5.5 | 43,863.4 | 46,199.5 | 3,145,600 | 3,207,240 | 16.7 | 14,823 | 15,248 | 13,944 | 14,405 |
| 25 to 44 years old | 388,047.3 | 392,390.3 | 44.2 | 272,671.7 | 284,231.8 | 7,936,370 | 8,102,540 | 42.1 | 48,895 | 48,428 | 34,357 | 35,079 |
| 45 to 54 years old | 246,069.6 | 239,728.8 | 27.0 | 145,046.4 | 146,092.4 | 3,918,440 | 3,871,250 | 20.1 | 62,798 | 61,925 | 37,016 | 37,738 |
| 55 years old and over | 200,743.5 | 205,644.5 | 23.2 | 117,009.2 | 123,216.6 | 3,889,940 | 4,042,960 | 21.0 | 51,606 | 50,865 | 30,080 | 30,477 |
| Unknown age2 | 352.0 | 402.6 | 0.0 | 121.9 | 138.0 | 11,990 | 12,020 | 0.1 | 29,357 | 33,496 | 10,165 | 11,481 |
| Goods-producing industries | 204,589.3 | 205,297.9 | 23.1 | 129,749.8 | 135,102.8 | 3,722,260 | 3,784,600 | 19.7 | 54,964 | 54,246 | 34,858 | 35,698 |
| Agriculture, forestry, fishing and hunting | 9,811.4 | 10,343.8 | 1.2 | 6,887.3 | 7,308.0 | 343,520 | 352,550 | 1.8 | 28,561 | 29,340 | 20,049 | 20,729 |
| Mining, and oil and gas extraction | 21,957.8 | 21,653.4 | 2.4 | 9,568.4 | 10,267.1 | 216,210 | 223,850 | 1.2 | 101,558 | 96,732 | 44,255 | 45,866 |
| Utilities | 11,557.3 | 11,060.1 | 1.2 | 5,503.1 | 5,556.7 | 119,150 | 118,300 | 0.6 | 96,998 | 93,492 | 46,187 | 46,972 |
| Construction | 66,509.7 | 68,076.8 | 7.7 | 43,424.3 | 45,292.0 | 1,306,280 | 1,319,800 | 6.9 | 50,915 | 51,581 | 33,243 | 34,317 |
| Manufacturing | 94,753.1 | 94,163.7 | 10.6 | 64,366.6 | 66,679.1 | 1,737,100 | 1,770,100 | 9.2 | 54,547 | 53,197 | 37,054 | 37,670 |
| Service-producing industries | 670,685.7 | 676,338.7 | 76.2 | 444,757.1 | 461,281.7 | 14,969,360 | 15,274,330 | 79.4 | 44,804 | 44,279 | 29,711 | 30,200 |
| Wholesale trade | 51,694.6 | 45,616.4 | 5.1 | 30,988.8 | 30,313.6 | 876,750 | 842,860 | 4.4 | 58,962 | 54,121 | 35,345 | 35,965 |
| Retail trade | 60,197.2 | 61,066.5 | 6.9 | 46,418.2 | 48,028.7 | 2,135,840 | 2,166,550 | 11.3 | 28,184 | 28,186 | 21,733 | 22,168 |
| Transportation and warehousing | 39,968.0 | 41,054.7 | 4.6 | 26,974.1 | 28,369.8 | 805,660 | 833,530 | 4.3 | 49,609 | 49,254 | 33,481 | 34,036 |
| Finance and insurance | 59,075.9 | 58,357.9 | 6.6 | 29,021.8 | 29,613.5 | 758,180 | 754,000 | 3.9 | 77,918 | 77,398 | 38,278 | 39,275 |
| Real estate, and rental and leasing | 15,798.2 | 16,140.5 | 1.8 | 9,531.8 | 10,014.9 | 339,030 | 343,690 | 1.8 | 46,598 | 46,963 | 28,115 | 29,139 |
| Professional, scientific and technical services | 66,494.7 | 65,440.9 | 7.4 | 35,453.3 | 37,928.4 | 1,064,390 | 1,107,980 | 5.8 | 62,472 | 59,063 | 33,309 | 34,232 |
| Business, building and other support services3 | 47,604.8 | 48,300.4 | 5.4 | 31,188.1 | 33,166.6 | 1,218,450 | 1,274,680 | 6.6 | 39,070 | 37,892 | 25,597 | 26,020 |
| Educational services | 67,204.4 | 68,706.3 | 7.7 | 47,095.5 | 48,485.8 | 1,380,110 | 1,396,890 | 7.3 | 48,695 | 49,185 | 34,124 | 34,710 |
| Health care and social assistance | 71,116.7 | 73,460.8 | 8.3 | 53,444.3 | 55,580.3 | 1,637,510 | 1,677,770 | 8.7 | 43,430 | 43,785 | 32,638 | 33,127 |
| Information, culture and recreation4 | 32,221.8 | 31,701.8 | 3.6 | 20,287.8 | 20,556.6 | 686,600 | 687,800 | 3.6 | 46,930 | 46,092 | 29,548 | 29,887 |
| Accommodation and food services | 26,055.3 | 27,422.5 | 3.1 | 22,682.6 | 24,025.6 | 1,487,310 | 1,530,940 | 8.0 | 17,518 | 17,912 | 15,251 | 15,693 |
| Other services (except public administration) | 26,091.4 | 26,393.8 | 3.0 | 18,912.7 | 19,908.0 | 730,140 | 746,480 | 3.9 | 35,735 | 35,358 | 25,903 | 26,669 |
| Public administration | 107,162.6 | 112,676.2 | 12.7 | 72,758.1 | 75,290.0 | 1,849,390 | 1,911,160 | 9.9 | 57,945 | 58,957 | 39,342 | 39,395 |
| Unclassified2 | 6,565.6 | 5,432.3 | 0.6 | 4,205.7 | 3,493.8 | 210,720 | 177,080 | 0.9 | 31,158 | 30,677 | 19,959 | 19,730 |
| Canada | 881,840.6 | 887,068.8 | 100.0 | 578,712.5 | 599,878.3 | 18,902,340 | 19,236,010 | 100.0 | 46,652 | 46,115 | 30,616 | 31,185 |
- Note: Data may not add up to the totals due to rounding. Percentage share is based on unrounded numbers.
- 1 As Employment Insurance premium payments are administered through the tax system, the most recent data available are for the 2017 taxation year.
- 2 For some T4 slips, this information was not available in the data.
- 3 This industry category comprises the industries with codes 55 (Management of Companies and Enterprises) and 56 (Administrative and Support, Waste Management and Mediation services) from the North American Industry Classification System.
- 4 This industry category comprises the industries with codes 51 (Information and Cultural Industries) and 71 (Arts, Entertainment and Recreation) from the North American Industry Classification System.
- r Revised data.
- Source: Canada Revenue Agency, T4 slips with employment income. Data are based on a 10% sample of T4 slips with employment income.
| Category | EI premium 2017 ($ million) | EI premium % of total 2017 | EI regular benefits 2017 ($ million) | EI regular benefits % of total 2017 | Total EI benefits 2017 ($ million) | Total EI benefits % of total 2017 | Adjusted regular B/C ratio2,3 (Canada=1) 2017 | Adjusted total B/C ratio3 (Canada=1) 2017 |
|---|---|---|---|---|---|---|---|---|
| Newfoundland and Labrador4 | 315.6 | 1.5 | 811.8 | 6.7 | 1,060.7 | 5.8 | 4.81 | 3.87 |
| Prince Edward Island4 | 86.1 | 0.4 | 148.4 | 1.2 | 227.0 | 1.2 | 3.24 | 3.03 |
| Nova Scotia4 | 545.8 | 2.6 | 570.2 | 4.7 | 834.7 | 4.5 | 1.94 | 1.76 |
| New Brunswick4 | 443.6 | 2.1 | 669.0 | 5.5 | 921.8 | 5.0 | 2.81 | 2.39 |
| Quebec4 | 3,763.8 | 17.7 | 2,939.5 | 24.3 | 3,496.7 | 19.0 | 1.11 | 1.07 |
| Ontario4 | 8,617.6 | 40.6 | 3,003.6 | 24.8 | 5,458.6 | 29.6 | 0.64 | 0.73 |
| Manitoba4 | 795.7 | 3.7 | 324.5 | 2.7 | 590.2 | 3.2 | 0.75 | 0.85 |
| Saskatchewan4 | 681.2 | 3.2 | 377.0 | 3.1 | 618.3 | 3.4 | 1.01 | 1.05 |
| Alberta4 | 2,969.2 | 14.0 | 2,069.0 | 17.1 | 3,111.3 | 16.9 | 1.28 | 1.21 |
| British Columbia4 | 2,911.2 | 13.7 | 1,148.6 | 9.5 | 2,044.3 | 11.1 | 0.73 | 0.81 |
| Yukon4 | 33.6 | 0.2 | 16.7 | 0.1 | 24.9 | 0.1 | 0.92 | 0.85 |
| Northwest Territories4 | 43.2 | 0.2 | 17.1 | 0.1 | 29.0 | 0.2 | 0.73 | 0.77 |
| Nunavut4 | 31.1 | 0.1 | 9.8 | 0.1 | 16.4 | 0.1 | 0.57 | 0.61 |
| Outside Canada4 | 0.0 | 0.0 | 3.0 | 0.0 | 10.0 | 0.1 | 0.00 | 0.00 |
| Men | 11,725.4 | 55.2 | 8,244.5 | 68.1 | 9,923.4 | 53.8 | 1.23 | 0.97 |
| Women | 9,510.8 | 44.8 | 3,863.6 | 31.9 | 8,520.5 | 46.2 | 0.71 | 1.03 |
| Unknown gender5 | 1.4 | 0.0 | 0.0 | 0.0 | 0.0 | 0.0 | 0.00 | 0.00 |
| 24 years old and under | 1,694.2 | 8.0 | 1,020.0 | 8.4 | 1,583.9 | 8.6 | 1.09 | 1.08 |
| 25 to 44 years old | 10,040.9 | 47.3 | 5,253.0 | 43.4 | 9,860.6 | 53.5 | 0.92 | 1.13 |
| 45 to 54 years old | 5,129.0 | 24.2 | 2,877.9 | 23.8 | 3,456.6 | 18.7 | 0.98 | 0.78 |
| 55 years old and over | 4,368.4 | 20.6 | 2,957.1 | 24.4 | 3,542.8 | 19.2 | 1.19 | 0.93 |
| Unknown age5 | 5.0 | 0.0 | 0.0 | 0.0 | 0.0 | 0.0 | 0.00 | 0.00 |
| Goods-producing industries | 4,801.4 | 22.6 | 5,344.1 | 44.1 | 6,752.8 | 36.6 | 1.96 | 1.62 |
| Agriculture, forestry, fishing and hunting | 268.5 | 1.3 | 515.0 | 4.3 | 877.6 | 4.8 | 3.49 | 3.76 |
| Mining, and oil and gas extraction | 362.8 | 1.7 | 463.5 | 3.8 | 539.3 | 2.9 | 2.24 | 1.71 |
| Utilities | 189.2 | 0.9 | 40.1 | 0.3 | 66.7 | 0.4 | 0.36 | 0.41 |
| Construction | 1,650.1 | 7.8 | 2,947.9 | 24.3 | 3,423.7 | 18.6 | 3.22 | 2.39 |
| Manufacturing | 2,330.8 | 11.0 | 1,377.6 | 11.4 | 1,845.5 | 10.0 | 1.02 | 0.91 |
| Service-producing industries | 16,307.3 | 76.8 | 6,527.7 | 53.9 | 11,370.2 | 61.6 | 0.70 | 0.80 |
| Wholesale trade | 1,076.0 | 5.1 | 486.0 | 4.0 | 698.1 | 3.8 | 0.79 | 0.75 |
| Retail trade | 1,732.8 | 8.2 | 675.6 | 5.6 | 1,171.4 | 6.4 | 0.70 | 0.78 |
| Transportation and warehousing | 1,000.4 | 4.7 | 565.3 | 4.7 | 764.9 | 4.1 | 0.99 | 0.88 |
| Finance and insurance | 1,019.5 | 4.8 | 168.5 | 1.4 | 446.8 | 2.4 | 0.28 | 0.50 |
| Real estate and rental and leasing | 364.1 | 1.7 | 207.2 | 1.7 | 302.2 | 1.6 | 1.03 | 0.96 |
| Professional, scientific and technical services | 1,341.4 | 6.3 | 636.5 | 5.3 | 952.2 | 5.2 | 0.83 | 0.82 |
| Business, building and other support6 | 1,198.1 | 5.6 | 864.1 | 7.1 | 1,217.3 | 6.6 | 1.29 | 1.17 |
| Educational services | 1,662.4 | 7.8 | 688.2 | 5.7 | 1,205.6 | 6.5 | 0.70 | 0.84 |
| Health care and social assistance | 1,924.9 | 9.1 | 379.5 | 3.1 | 1,215.8 | 6.6 | 0.34 | 0.73 |
| Information, culture and recreation7 | 724.8 | 3.4 | 338.3 | 2.8 | 496.2 | 2.7 | 0.82 | 0.79 |
| Accommodation and food services | 890.2 | 4.2 | 505.4 | 4.2 | 821.5 | 4.5 | 1.04 | 1.06 |
| Other services (except public administration) | 727.2 | 3.4 | 412.1 | 3.4 | 660.4 | 3.6 | 1.03 | 1.05 |
| Public administration | 2,645.5 | 12.5 | 601.0 | 5.0 | 1,417.7 | 7.7 | 0.40 | 0.62 |
| Unclassified5 | 128.9 | 0.6 | 236.3 | 2.0 | 320.9 | 1.7 | 3.35 | 2.87 |
| Canada | 21,237.6 | 100.0 | 12,108.1 | 100.0 | 18,443.9 | 100.0 | 1.00 | 1.00 |
- Note: Data may not add up to the total due to rounding. Percentage share is based on unrounded numbers.
- 1 As Employment Insurance premium payments are administered through the tax system, the most recent data available are for the 2017 taxation year.
- 2 To factor in the Quebec Parental Insurance Program (QPIP), which reduced the premiums paid by employers and employees in Quebec, and the Premium Reduction Program (PRP), which reduces the premiums paid by employers who offer their employees a short-term disability plan, the regular benefits-to-contributions ratios have been calculated based on an estimate of the Employment Insurance premiums that would have been paid by employees and employers in the absence of QPIP and PRP, rather than on premiums that were actually paid.
- 3 For ease of analysis, the benefits-to-contributions ratios have been adjusted (that is, standardized) so that the figure for Canada equals 1.
- 4 The benefits-to-contributions ratios for the provinces and territories are determined by the location of employers for premiums and by the residence of claimants for benefits. As a result, it is possible that the ratio for some provinces and territories may be under or overstated if contributions are being accredited to a province or territory, while the employment is actually situated in another province or territory.
- 5 For some T4 slips, this information was not available in the data.
- 6 This industry comprises the industries with codes 55 (management of companies and enterprises) and 56 (administrative and support, waste management and mediation services) from the North American Industry Classification System.
- 7 This industry comprises the industries with codes 51 (information and cultural industries) and 71 (arts, entertainment and recreation) from the North American Industry Classification System.
- Source: Canada Revenue Agency (CRA), T4 slips with employment income (for data on Employment Insurance contributions); and Employment and Social Development Canada (ESDC), Employment Insurance (EI) administrative data (for data on Employment Insurance benefits). CRA data are based on a 10% sample of T4 slips with employment income, and ESDC data are based on a 10% sample of EI administrative data.
| Effective date3 | April 08, 2018 to May 12, 2018 | May 13, 2018 to June 09, 2018 | June 10, 2018 to July 07, 2018 | July 08, 2018 to August 11, 2018 | August 12, 2018 to Sept. 08, 2018 | Sept. 09, 2018 to Oct. 06, 2018 | Oct. 07, 2018 to Nov. 03, 2018 | Nov. 04, 2018 to Dec. 08, 2018 | Dec. 09, 2018 to January 05, 2019 | January 06, 2019 to February 09, 2019 | February 10, 2019 to March 09, 2019 | March 10, 2019 to April 06, 2019 | Minimum of the 12 months | Average of the 12 months | Maximum of the 12 months |
|---|---|---|---|---|---|---|---|---|---|---|---|---|---|---|---|
| Unemployment rate moving average ending on the month of …4 | March 2018 (%) | April 2018 (%) | May 2018 (%) | June 2018 (%) | July 2018 (%) | August 2018 (%) | Sept. 2018 (%) | Oct. 2018 (%) | Nov. 2018 (%) | Dec. 2018 (%) | January 2019 (%) | February 2019 (%) | FY1819 (%) | FY1819 (%) | FY1819 (%) |
| St. John’s | 8.3 | 8.5 | 8.6 | 8.7 | 8.9 | 9.3 | 9.4 | 8.9 | 8.0 | 7.5 | 7.3 | 7.3 | 7.3 | 8.4 | 9.4 |
| Newfound-land-Labrador | 18.7 | 19.1 | 19.3 | 19.8 | 19.7 | 19.4 | 18.5 | 18.0 | 17.8 | 17.1 | 16.1 | 15.5 | 15.5 | 18.3 | 19.8 |
| Charlottetown | 6.7 | 6.8 | 6.9 | 7.0 | 7.1 | 7.2 | 6.8 | 6.1 | 5.9 | 6.1 | 6.7 | 7.2 | 5.9 | 6.7 | 7.2 |
| Prince Edward Island | 13.8 | 14.5 | 13.9 | 13.1 | 11.7 | 11.5 | 11.7 | 11.2 | 11.0 | 11.3 | 11.8 | 12.6 | 11.0 | 12.3 | 14.5 |
| Eastern Nova Scotia | 14.3 | 14.6 | 14.5 | 15.1 | 14.8 | 15.7 | 15.8 | 16.0 | 15.7 | 16.0 | 15.8 | 14.8 | 14.3 | 15.3 | 16.0 |
| Western Nova Scotia | 8.4 | 7.9 | 7.4 | 7.4 | 7.6 | 7.6 | 7.4 | 7.2 | 7.0 | 6.9 | 6.9 | 7.0 | 6.9 | 7.4 | 8.4 |
| Halifax | 6.2 | 5.7 | 5.8 | 6.0 | 6.4 | 6.7 | 6.7 | 6.7 | 6.2 | 5.7 | 5.2 | 4.9 | 4.9 | 6.0 | 6.7 |
| Fredericton-Moncton-Saint-John | 6.7 | 6.2 | 6.2 | 6.2 | 6.1 | 6.6 | 6.6 | 6.5 | 6.2 | 6.3 | 6.5 | 6.4 | 6.1 | 6.4 | 6.4 |
| Madawaska-Charlotte | 8.8 | 8.4 | 8.6 | 8.4 | 8.5 | 7.9 | 7.7 | 7.2 | 7.7 | 8.3 | 8.6 | 8.3 | 7.2 | 8.2 | 8.8 |
| Restigouche-Albert | 11.8 | 11.9 | 11.3 | 11.0 | 10.8 | 11.3 | 12.0 | 11.9 | 11.8 | 11.8 | 12.3 | 12.8 | 10.8 | 11.7 | 12.8 |
| Gaspésie - Îles-de-la-Madeleine | 13.3 | 13.9 | 14.3 | 14.4 | 14.4 | 14.7 | 15.8 | 16.5 | 15.7 | 13.9 | 13.7 | 14.2 | 13.3 | 14.6 | 16.5 |
| Québec | 3.8 | 4.0 | 4.1 | 3.9 | 4.0 | 3.8 | 3.9 | 4.0 | 4.0 | 4.0 | 3.9 | 4.0 | 3.8 | 4.0 | 4.1 |
| Trois-Rivières | 5.2 | 5.3 | 5.1 | 5.2 | 4.9 | 4.8 | 4.6 | 5.1 | 5.5 | 5.4 | 5.3 | 5.3 | 4.6 | 5.1 | 5.5 |
| South Central Québec | 2.7 | 2.6 | 2.5 | 2.3 | 2.5 | 2.9 | 3.1 | 3.0 | 2.6 | 2.5 | 2.3 | 2.3 | 2.3 | 2.6 | 3.1 |
| Sherbrooke | 5.8 | 5.6 | 5.1 | 4.7 | 4.2 | 4.0 | 3.9 | 4.4 | 5.3 | 5.5 | 5.3 | 4.3 | 3.9 | 4.8 | 5.8 |
| Montérégie | 5.0 | 4.9 | 4.4 | 3.9 | 3.8 | 4.1 | 4.6 | 4.6 | 4.4 | 4.4 | 4.6 | 5.1 | 3.8 | 4.5 | 5.1 |
| Montréal | 6.3 | 6.3 | 6.2 | 6.2 | 6.3 | 6.2 | 6.3 | 6.1 | 6.1 | 6.1 | 6.3 | 6.1 | 6.1 | 6.2 | 6.3 |
| Central Quebec | 5.9 | 5.3 | 4.7 | 5.2 | 5.8 | 6.6 | 6.2 | 5.8 | 5.7 | 5.5 | 5.0 | 4.9 | 4.7 | 5.6 | 6.6 |
| North Western Quebec | 7.1 | 7.3 | 7.1 | 7.1 | 6.6 | 6.5 | 6.5 | 6.6 | 6.6 | 6.4 | 6.7 | 6.6 | 6.4 | 6.8 | 7.3 |
| Bas-Saint-Laurent – Côte-Nord | 6.3 | 7.1 | 7.1 | 6.7 | 6.5 | 7.1 | 7.3 | 7.6 | 7.7 | 7.9 | 8.0 | 7.8 | 6.3 | 7.3 | 8.0 |
| Hull | 4.8 | 5.0 | 5.2 | 4.9 | 4.8 | 4.7 | 4.5 | 4.5 | 4.8 | 5.2 | 5.4 | 5.5 | 4.5 | 4.9 | 5.5 |
| Chicoutimi-Jonquière | 5.9 | 6.0 | 6.3 | 6.6 | 6.8 | 6.7 | 6.5 | 6.1 | 6.0 | 5.8 | 5.4 | 5.4 | 5.4 | 6.1 | 6.8 |
| Ottawa | 4.9 | 4.3 | 4.2 | 4.3 | 4.4 | 4.6 | 4.6 | 4.7 | 4.7 | 5.0 | 5.3 | 5.2 | 4.2 | 4.7 | 5.3 |
| Eastern Ontario | 6.6 | 6.3 | 6.0 | 5.7 | 5.4 | 5.3 | 5.4 | 5.5 | 6.3 | 6.9 | 7.0 | 6.3 | 5.3 | 6.1 | 7.0 |
| Kingston | 5.3 | 5.1 | 5.4 | 5.8 | 5.9 | 5.9 | 5.5 | 5.4 | 5.4 | 5.8 | 5.7 | 5.3 | 5.1 | 5.5 | 5.9 |
| Central Ontario | 6.0 | 5.8 | 5.8 | 6.2 | 6.4 | 6.3 | 6.2 | 6.4 | 6.3 | 5.7 | 5.8 | 5.6 | 5.6 | 6.0 | 6.4 |
| Oshawa | 4.6 | 4.5 | 4.6 | 4.2 | 4.3 | 4.7 | 5.5 | 5.9 | 5.9 | 6.0 | 5.9 | 5.4 | 4.2 | 5.1 | 6.0 |
| Toronto | 5.8 | 6.0 | 6.2 | 6.3 | 6.1 | 6.1 | 6.1 | 6.3 | 6.2 | 6.0 | 6.0 | 6.2 | 5.8 | 6.1 | 6.3 |
| Hamilton | 5.6 | 5.4 | 4.8 | 4.4 | 4.5 | 4.9 | 5.2 | 5.1 | 4.8 | 4.4 | 3.8 | 3.6 | 3.6 | 4.7 | 5.6 |
| St. Catharines | 5.7 | 5.9 | 6.3 | 6.3 | 7.0 | 7.5 | 7.5 | 7.3 | 7.0 | 7.0 | 6.7 | 6.8 | 5.7 | 6.8 | 7.5 |
| London | 6.3 | 5.7 | 5.3 | 5.6 | 5.6 | 5.4 | 5.3 | 4.9 | 4.7 | 4.8 | 4.9 | 5.3 | 4.7 | 5.3 | 6.3 |
| Niagara | 7.6 | 7.4 | 7.8 | 7.4 | 7.5 | 7.4 | 8.1 | 8.0 | 8.2 | 7.8 | 7.4 | 6.8 | 6.8 | 7.6 | 8.2 |
| Windsor | 5.9 | 5.9 | 6.0 | 5.9 | 6.3 | 6.8 | 7.6 | 7.3 | 6.9 | 6.3 | 6.2 | 6.2 | 5.9 | 6.4 | 7.6 |
| Kitchener | 5.0 | 5.4 | 5.7 | 6.0 | 5.5 | 5.2 | 4.7 | 4.8 | 4.7 | 4.6 | 4.5 | 4.4 | 4.4 | 5.0 | 6.0 |
| Huron | 5.3 | 5.7 | 5.6 | 5.3 | 5.3 | 5.4 | 5.4 | 5.7 | 5.1 | 5.2 | 5.3 | 6.5 | 5.1 | 5.5 | 6.5 |
| South Central Ontario | 5.1 | 4.9 | 4.9 | 4.8 | 4.7 | 4.3 | 4.1 | 4.0 | 4.2 | 4.2 | 4.5 | 4.6 | 4.0 | 4.5 | 5.1 |
| Sudbury | 6.4 | 6.9 | 6.9 | 6.8 | 6.5 | 6.7 | 6.4 | 6.2 | 6.2 | 6.0 | 6.4 | 5.8 | 5.8 | 6.4 | 6.9 |
| Thunder Bay | 4.8 | 4.9 | 4.7 | 4.8 | 4.5 | 4.8 | 4.9 | 5.0 | 4.8 | 4.9 | 5.2 | 5.8 | 4.5 | 4.9 | 5.8 |
| Northern Ontario | 10.9 | 10.5 | 10.4 | 10.7 | 11.0 | 10.7 | 10.6 | 10.8 | 11.2 | 11.3 | 10.8 | 10.5 | 10.4 | 10.8 | 11.3 |
| Winnipeg | 6.3 | 6.5 | 6.8 | 6.8 | 6.7 | 6.4 | 6.2 | 6.1 | 5.9 | 5.8 | 5.7 | 5.5 | 5.5 | 6.2 | 6.8 |
| Southern Manitoba | 6.4 | 6.5 | 6.7 | 6.5 | 6.5 | 6.5 | 6.6 | 7.4 | 7.7 | 8.2 | 7.4 | 7.3 | 6.4 | 7.0 | 8.2 |
| Northern Manitoba | 34.5 | 34.5 | 34.2 | 33.5 | 32.5 | 31.6 | 31.6 | 32.0 | 32.7 | 33.5 | 33.6 | 33.6 | 31.6 | 33.2 | 34.5 |
| Regina | 5.1 | 5.7 | 6.1 | 6.2 | 6.0 | 5.9 | 6.1 | 6.5 | 6.3 | 6.0 | 5.3 | 5.2 | 5.1 | 5.9 | 6.5 |
| Saskatoon | 6.5 | 6.7 | 6.9 | 7.0 | 7.1 | 7.1 | 7.3 | 6.8 | 6.1 | 5.5 | 5.7 | 6.1 | 5.5 | 6.6 | 7.3 |
| Southern Saskatchewan | 8.2 | 8.0 | 8.1 | 7.8 | 7.5 | 7.4 | 7.5 | 7.8 | 7.7 | 7.6 | 7.2 | 7.4 | 7.2 | 7.7 | 8.2 |
| Northern Saskatchewan | 17.4 | 18.2 | 19.0 | 19.6 | 19.9 | 20.1 | 19.7 | 19.1 | 18.9 | 19.1 | 19.5 | 19.5 | 17.4 | 19.2 | 20.1 |
| Calgary | 8.1 | 7.8 | 7.4 | 7.4 | 7.7 | 8.2 | 8.3 | 8.4 | 8.1 | 7.6 | 7.3 | 7.5 | 7.3 | 7.8 | 8.4 |
| Edmonton | 6.8 | 6.7 | 6.6 | 6.7 | 6.5 | 6.4 | 6.4 | 6.6 | 6.6 | 6.6 | 6.6 | 7.0 | 6.4 | 6.6 | 7.0 |
| Northern Alberta | 11.1 | 11.1 | 11.3 | 11.2 | 10.9 | 10.5 | 10.6 | 10.8 | 10.7 | 10.4 | 10.3 | 10.7 | 10.3 | 10.8 | 11.3 |
| Southern Alberta | 5.9 | 6.0 | 6.2 | 6.5 | 6.5 | 6.6 | 6.8 | 6.9 | 6.6 | 6.4 | 6.4 | 6.9 | 5.9 | 6.5 | 6.9 |
| Southern Interior British Columbia | 7.9 | 7.7 | 7.9 | 8.2 | 8.0 | 8.1 | 7.7 | 7.2 | 6.4 | 5.9 | 5.7 | 5.6 | 5.6 | 7.2 | 8.2 |
| Abbotsford | 4.1 | 4.6 | 4.8 | 4.9 | 4.9 | 5.2 | 5.0 | 4.8 | 4.7 | 4.6 | 4.9 | 5.1 | 4.1 | 4.8 | 5.2 |
| Vancouver | 4.1 | 4.2 | 4.2 | 4.4 | 4.5 | 4.8 | 4.6 | 4.4 | 4.2 | 4.5 | 4.8 | 5.0 | 4.1 | 4.5 | 5.0 |
| Victoria | 5.4 | 5.2 | 4.8 | 5.2 | 5.1 | 5.1 | 4.7 | 4.7 | 4.7 | 4.5 | 4.5 | 4.1 | 4.1 | 4.8 | 5.4 |
| Southern Coastal British Columbia | 6.8 | 6.8 | 6.8 | 6.8 | 6.4 | 6.5 | 6.2 | 6.2 | 5.7 | 5.4 | 5.0 | 4.9 | 4.9 | 6.1 | 6.8 |
| Northern British Columbia | 10.4 | 10.4 | 10.4 | 10.0 | 9.8 | 9.6 | 9.4 | 9.3 | 9.3 | 9.2 | 9.2 | 9.4 | 9.2 | 9.7 | 10.4 |
| Whitehorse | 3.0 | 2.8 | 2.6 | 2.5 | 2.4 | 2.6 | 3.0 | 3.5 | 3.8 | 3.7 | 3.4 | 3.9 | 2.4 | 3.1 | 3.9 |
| Yukon | 6.5 | 5.8 | 7.5 | 7.3 | 7.7 | 6.2 | 6.2 | 6.2 | 5.9 | 6.0 | 6.0 | 6.5 | 5.8 | 6.5 | 7.7 |
| Yellowknife | 3.8 | 3.4 | 3.4 | 3.4 | 3.9 | 3.6 | 3.2 | 4.1 | 4.4 | 4.4 | 3.8 | 3.7 | 3.2 | 3.8 | 4.4 |
| Northwest Territories | 14.4 | 12.8 | 13.8 | 14.2 | 12.8 | 12.4 | 11.8 | 12.0 | 11.6 | 11.7 | 13.2 | 13.3 | 11.6 | 12.8 | 14.4 |
| Iqaluit | 7.1 | 7.1 | 6.4 | 5.7 | 5.5 | 5.4 | 6.4 | 6.8 | 8.7 | 8.8 | 7.0 | 7.0 | 5.4 | 6.8 | 8.8 |
| Nunavut | 17.1 | 16.7 | 17.2 | 18.7 | 18.9 | 19.0 | 18.1 | 16.9 | 17.2 | 18.0 | 18.1 | 20.5 | 16.7 | 18.0 | 20.5 |
- 1 The unemployment rates in this annex are those used in the administration of the EI program. These rates come from Statistics Canada but may differ from the official unemployment rates due to differences in methodology, as explained below.
- 2 To obtain the monthly unemployment rates used for the purposes of the Employment Insurance program relating to periods before April 8 2018, please refer to the Web page Monthly Seasonal Adjusted Unemployment Rates by EI Economic Region.
- 3 Effective for new claims established between the dates indicated.
- 4 The regional unemployment rates are calculated using a 3-month moving average (or, in the case of the territories, a 12-month moving average if this is larger) of seasonally adjusted unemployment rates for the period ending in the month indicated. These regional rates come from Statistics Canada’s Labour Force Survey (LFS). The regional unemployment rates in the provinces incorporate an estimate of the rates of unemployment for status Indians living on reserves, as per section 17 of the Employment Insurance Regulations. Conversely, the regional unemployment rates in the territories are representative of the population, as LFS data cover persons living on and off reserves. A monthly regional unemployment rate substitute is used if Statistics Canada is not able to publish a monthly unemployment rate for reasons of confidentiality.
- Source: Statistics Canada, Labour Force Survey (for data on unemployment rate); and Employment and Social Development Canada, Employment Insurance administrative data (for information on effective dates).
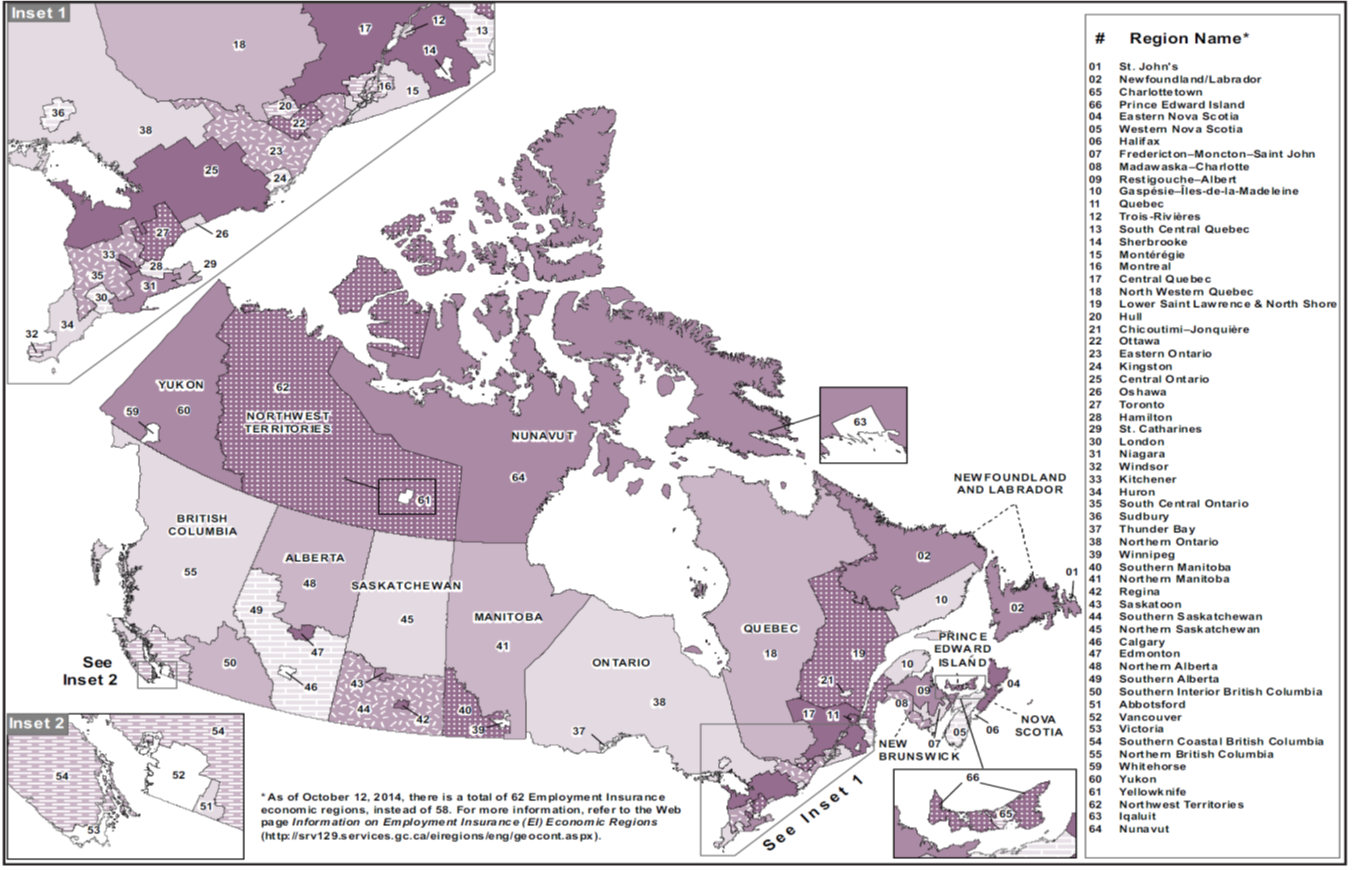
Annex 2.30 – Text description
- Newfoundland and Labrador:
- 01 St-John’s
- 02 Newfoudland/Labrador
- Prince Edward Island:
- 65 Charlottetown
- 66 Prince Edward Island
- Nova Scotia:
- 04 Eastern Nova Scotia
- 05 Western Nova Scotia
- 06 Halifax
- New Brunswick:
- 07 Fredericton–Moncton–Saint John
- 08 Madawaska–Charlotte
- 09 Restigouche–Albert
- Quebec:
- 10 Gaspésie–Îles-de-la-Madeleine
- 11 Québec
- 12 Trois-Rivières
- 13 South Central Quebec
- 14 Sherbrooke
- 15 Montérégie
- 16 Montréal
- 17 Central Quebec
- 18 North Western Quebec
- 19 Bas-St-Laurent–Côte-Nord
- 20 Hull
- 21 Chicoutimi–Jonquière
- Ontario:
- 22 Ottawa
- 23 Eastern Ontario
- 24 Kingston
- 25 Central Ontario
- 26 Oshawa
- 27 Toronto
- 28 Hamilton
- 29 St. Catherines
- 30 London
- 31 Niagara
- 32 Windsor
- 33 Kitchener
- 34 Huron
- 35 South Central Ontario
- 36 Sudbury
- 37 Thunder Bay
- 38 Northern Ontario
- Manitoba:
- 39 Winnipeg
- 40 Southern Manitoba
- 41 Northern Manitoba
- Saskatchewan:
- 42 Regina
- 43 Saskatoon
- 44 Southern Saskatchewan
- 45 Northern Saskatchewan
- Alberta:
- 46 Calgary
- 47 Edmonton
- 48 Northern Alberta
- 49 Southern Alberta
- British Columbia:
- 50 Southern Interior British Columbia
- 51 Abbotsford
- 52 Vancouver
- 53 Victoria
- 54 Southern Coastal British Columbia
- 55 Northern British Columbia
- Yukon:
- 59 Whitehorse
- 60 Yukon
- Northwest Territories:
- 61 Yellowknife
- 62 Northwest Territories
- Nunavut:
- 63 Iqaluit
- 64 Nunavut