
Chapter 3: Impact and effectiveness of Employment Insurance benefits (EBSMs–Part II of the Employment Insurance Act)
From: Employment and Social Development Canada
Official title: Employment Insurance Monitoring and Assessment Report for the fiscal year beginning April 1, 2018 and ending March 31, 2019: Chapter 3: Impact and effectiveness of Employment Benefits and Support Measures (EBSMs–Part II of the Employment Insurance Act)
In chapter 3
List of abbreviations
This is the complete list of abbreviations for the Employment Insurance Monitoring and Assessment Report for the fiscal year beginning April 1, 2018 and ending March 31, 2019.
Abbreviations
- ASETS
- Aboriginal Skills and Employment Training Strategy
- ATSSC
- Administrative Tribunals Support Service of Canada
- B/C Ratio
- Benefits-to-Contributions ratio
- B/U Ratio
- Benefits-to-Unemployed ratio
- B/UC Ratio
- Benefits-to-Unemployed Contributor ratio
- BDM
- Benefit Delivery Modernization
- CANSIM
- Canadian Socio-Economic Information Management System
- CAWS
- Citizen Access Workstation Services
- CCAJ
- Connecting Canadians with Available Jobs
- CCB
- Canada Child Benefit
- CCDA
- Canadian Council of Directors of Apprenticeship
- CEIC
- Canada Employment Insurance Commission
- COLS
- Community Outreach and Liaison Service
- CSO
- Citizen Service Officer
- CPI
- Consumer Price Index
- CPP
- Canada Pension Plan
- CRA
- Canada Revenue Agency
- CRF
- Consolidated Revenue Fund
- CUSMA
- Canada-United States-Mexico Agreement
- CX
- Client Experience
- EBSMs
- Employment Benefits and Support Measures
- ECC
- Employment Contact Centre
- EF
- Enabling Fund
- EI
- Employment Insurance
- EI PAAR
- Employment Insurance Payment Accuracy Review
- EI PRAR
- Employment Insurance Processing Accuracy Review
- EICS
- Employment Insurance Coverage Survey
- eROE
- Electronic Record of Employment
- ESDC
- Employment and Social Development Canada
- FLMM
- Forum of Labour Market Ministers
- FY
- Fiscal Year
- G7
- Group of Seven
- GDP
- Gross Domestic Product
- HCCS
- Hosted Contact Centre Solution
- HRSDC
- Human Resources and Social Development Canada
- IQF
- Individual Quality Feedback
- IVR
- Interactive Voice Response
- LFS
- Labour Force Survey
- LMDA
- Labour Market Development Agreements
- LMI
- Labour Market Information
- LMP
- Labour Market Partnerships
- MIE
- Maximum Insurable Earnings
- MSCA
- My Service Canada Account
- NAICS
- North American Industry Classification System
- NAFTA
- North American Free Trade Agreement
- NAS
- National Apprenticeship Survey
- NERE
- New-Entrant/Re-Entrant
- NESI
- National Essential Skills Initiative
- NIS
- National Investigative Services
- NOS
- National Occupational Standards
- NQCP
- National Quality and Coaching Program for Call Centres
- OAS
- Old Age Security
- OECD
- Organization for Economic Co-operation and Development
- PPEs
- Clients who are Premiums Paid Eligible
- P/Ts
- Provinces and Territories
- PPTS
- Percentage points
- PRP
- Premium Reduction Program
- QPIP
- Quebec Parental Insurance Plan
- RAIS
- Registered Apprenticeship Information System
- ROE
- Record of Employment
- RSOS
- Red Seal Occupational Standards
- SA
- Social Assistance
- SCC
- Service Canada Centres
- SDP
- Service Delivery Partner
- SEPH
- Survey of Employment, Payrolls and Hours
- SIN
- Social Insurance Number
- SIR
- Social Insurance Registry
- SME
- Small and medium sized enterprises
- SO
- Scheduled Outreach
- SST
- Social Security Tribunal
- STDP
- Short-term disability plan
- SUB
- Supplemental Unemployment Benefit
- UV
- Unemployed-to-job-vacancy ratio
- VBW
- Variable Best Weeks
- VER
- Variable Entrance Requirement
- WWC
- Working While on Claim
Introduction - Chapter 3
Activities conducted under Part II of the Employment Insurance (EI) Act help individuals in Canada prepare for, find and maintain suitable employment. Under the umbrella of Employment Benefits and Support Measures (EBSMs), these activities include programs delivered by provinces and territories under Labour Market Development Agreements (LMDAs), as well as the Government of Canada's pan-Canadian programming and functions of the National Employment Service (NES).
This chapter presents program results for EBSMs achieved under Part II of the EI Act during the fiscal year beginning on April 1, 2018 and ending on March 31, 2019 (FY1819). Section 1 provides a national overview of EBSM-similar programming delivered under the LMDAs and by agreement holders under the Aboriginal Skills and Employment Training Strategy (ASETS), which transitioned to the Indigenous Skills and Employment Training (ISET) program as of April 1, 2019. Provincial and territorial employment programming activities are presented in Section 2, with a description of each jurisdiction's labour market and employment priorities. Section 3 presents an overview of Employment and Social Development Canada's (ESDC's) study of the Job Creation Partnerships program. The section also builds on the well-being analysis presented in the FY1617 MAR with new poverty analysis based on the Market Basket Measure, Canada's new official poverty line. Section 4 discusses the results of ESDC's delivery of pan-Canadian activities, and the administration of NES functions.
Notes to readers
- The data used to analyze EBSM activities were collected from provinces, territories, and ASETS agreement holders. Governments continue to improve data quality and collection to ensure accurate, reliable, and consistent information. While all data sets are verified before publication, systems and operational changes may affect the comparability of data from year to year. In this context, the number of interventions for FY1819 may be over-represented nationally. More accurate intervention counts will be provided in future years of this report.
- References to average levels of activity and to highs and lows generally use the 10-year period from FY0809 to FY1819 as a frame of reference.
- Statistics Canada's Labour Force Survey (LFS) is the source of labour market data reported. Data for Canada and the provinces are fiscal-year averages, calculated using seasonally unadjusted monthly data, while monthly references are seasonally adjusted. Data for the Northwest Territories, Yukon and Nunavut are calculated using unadjusted three-month moving averages of monthly data. In discussions of employment trends by industry, standard industry titles are taken from the North American Industry Classification System (NAICS).
- Real GDP data and other non-LFS macroeconomic indicators are from Statistics Canada's Economic accounts. Forecasts rely on published analyses from the Bank of Canada, the Conference Board of Canada, Canadian banks, Organisation for Economic Co-operation and Development and Statistics Canada, as well as on internal analysis, using information available as of January 2020.
3.1 National overview
In this section
3.1.1 Economic and labour market context
According to key indicators, Canada's labour market performed well in FY1819. Overall, the labour force grew by 1.1% to a total of 19.9 million workers, while employment expanded at a faster pace, +1.4%, to a total of 18.7 million. Employment among women grew by 1.5%, while men's level increased by 1.3%. For both women and men, the employment growth was concentrated in full-time work. In sum, Canada's employment rate edged up to 61.9% in FY1819, compared to 61.6% in the previous fiscal year.
Canada's unemployment rate edged down to 5.8% in FY1819, compared to 6.1% in FY1718. The unemployment rate of both women and men declined, with women's unemployment rate registering at 5.5% (compared to 5.7% in the previous year) and men's at 6.1% (compared to 6.5% in the previous year).
Despite this, ongoing challenges in the energy sector had an impact on labour markets in the Prairie provinces. Unemployment rates in Saskatchewan and Alberta remain above the national rate. As well, employment growth in both jurisdictions has been weaker than the national growth. Between FY1617 and FY1819, Canada's employment expanded by 3.3%, while in Saskatchewan and Alberta employment grew by 0.6% and 3.1%, respectively.
Statistics CanadaFootnote 1 reported 340,000 job vacancies across Canada in FY1819, compared to 287,900 in FY1718 (+18.1% increase year over year). The survey also reported 1.16 million unemployed workers in FY1819, declining by roughly 6% compared to the previous year. Taken together—expressed as the unemployment-to-job vacancies ratio (U/V ratio) —for every job vacancy in FY1819, 3.4 individuals were unemployed. In comparison, Canada's U/V ratio stood at 4.1 in the previous year.
In 2018, Canada's real gross domestic product (GDP) rose by 2.0%, following a 3.0% increase in 2017. Growth varied from 0.8% in New Brunswick to 7.6% in Nunavut. Real GDP increased in every province and territory, with the exception of Newfoundland and Labrador, where real GDP fell by 3.5%. For 2019, Canada's real GDP was forecast to grow by approximately 1.5%, with economic expansion projected in most parts of the country.
3.1.2 Main resultsFootnote 2
Decline in the number of EBSM clients and interventionsFootnote 3
In FY1819, provinces and territories served 670,431 clients under the Labour Market Development Agreements (LMDAs), a decline of 3.7% compared to the previous year. The number of LMDA interventions delivered to clients decreased by 4.5% year over year, to a total of 1,023,493 interventions.
Terminology guide
A client is a person who has participated in programs or services funded by the LMDAs or by Indigenous organizations. See section 1.3 for details for client types.
An intervention is a discrete program or service in which a client participates. See Section 1.4 and 1.5 for the type of interventions available to clients.
Any reference to participants is the number of interventions, where information on designated groups is collected at the intervention level, rather than individual client.
Combined with programs and services delivered by Indigenous organizations through the Aboriginal Skills and Employment Training Strategy (ASETS), a grand total of 695,610 EBSM clients were served (-2.8%), and 1,067,991 EBSM interventions (-3.6%) were delivered in FY1819.
The overall intervention-to-client ratio edged down to 1.54, compared to 1.55 in the previous year, as the number of interventions declined at a higher rate than the client totals.
Overall expenditures increased significantly by 18.4% to a total of $2.6 billion.
3.1.3 Client profile and participation
In FY1819, the total number of EBSM clients served declined by 2.8% year over year, with varying declines among the three traditional client groups. The number of active EI claimants declined by 8.9% year over year, to a total of 286,197, while former EI claimants dropped by 12.1%, to a total 101,848, and non-insured clients also declined by 16.0%, to a total of 240,075. The drop in non-insured clients is largely attribute to the creation of a new category for clients. As of April 2018, a new client group—Premiums Paid Eligible (PPE)—represented 9.7% of all clients, or a total of 67,490 in FY1819. See Table 1 for descriptions of the different client types and the box below for details on PPE.
Expanded eligibility under the LMDAs
Effective April 1, 2018, eligibility for Employment Benefits (for example, training, wage subsidies) was expanded to include all unemployed individuals who have made minimum EI premium contributions. With the expanded eligibility, a new client group—known as Premiums Paid Eligible (PPE)—was created to report on the unique characteristics of this clientele. In addition, eligibility for Employment Assistance Services was expanded to include all Canadians, whereas previous access was limited to unemployed Canadians.
PPE represented 9.7% of total clients; with those who were previously non-insured clients largely falling into the new group. Proportionally, Saskatchewan (27.1%), Nunavut (15.9%), Northwest Territories (15.0%) and Ontario (12.1%) had the highest percentage of PPE among their clients. The lowest proportion of PPE were in Newfoundland and Labrador (1.2% of all clients).
At the national level, roughly 54% of PPE clients were women and 46% were men. By comparison, across all client groups, fewer than 43% were women and more than 57% were men. This suggests the expanded eligibility under PPE has enabled more women to access training supports.
By age, most PPE were core-aged (69.4%) clients, followed by youth (16.6%) and workers aged 55 or older (13.8%). The largest cohorts of youth PPE were in New Brunswick (37%), Prince Edward Island (36%) and Saskatchewan (37%). PPE clients aged 55 or older were more prevalent in Nova Scotia and British Columbia, where they represented approximately 19% of all clients in both provinces.
Across Canada, PPE accessed a total of 104,537 interventions, most (82.6%) of which were Employment Assistance Services. With the broadened eligibility, PPE accessed 18,187 Employment Benefit interventions, previously accessible only by active and former EI claimants prior to the current fiscal year. ESDC will continue to monitor and assess PPE trends as data become available.
As a share of all clients, active EI claimants represented 41.4% of total clients, followed by non-insured (34.5%), and former EI claimants (14.6%) in FY1819. Active and former EI claimant client shares among all clients declined by 2.7 and 1.6 percentage points respectively, compared to the previous fiscal year.
Table 1 - Client descriptions
For accessibility reasons, the information is presented in text format. Consult the PDF version for the table.
Active claimants are those who had an active EI Part I regular claim when they requested assistance under Part II of the Employment Insurance Act. Typically, they have stronger and more recent job attachment. They tend to be able to return to work more quickly than those with weaker ties to employment. Active claimants who are considered job-ready from an analytical point of view often seek out short-term interventions under EI Part II to find their next employment opportunity. Others require longer-term Employment Benefits to upgrade their skills, establish certification or refine their job search strategies.
Former claimants are those who completed an EI claim in the previous 5 years, or who began a parental or maternity claim in the last 5 years when they requested assistance under Part II. They are no longer eligible for EI Part I; however, they remain eligible for EI Part II under certain criteria.Footnote 4Former claimants do not receive income support under Part I of the Employment Insurance Act while they complete an Employment Benefit intervention under EI Part II; however, they may receive Part II income support while completing their return-to-work action plan.
Premiums Paid Eligible are those who have made minimum Employment Insurance premium contributions above the premium refund threshold (that is $2,000 in earnings) in at least 5 of the last 10 years.
Non-insured clients are unemployed individuals who are neither active nor former EI clients. Non-insured clients usually have little substantive or recent job attachment. They include new labour force participants and individuals who were formerly self-employed without paid employment earnings. While these clients are not eligible for Employment Benefits under EI Part II, they may access Employment Assistance Services.
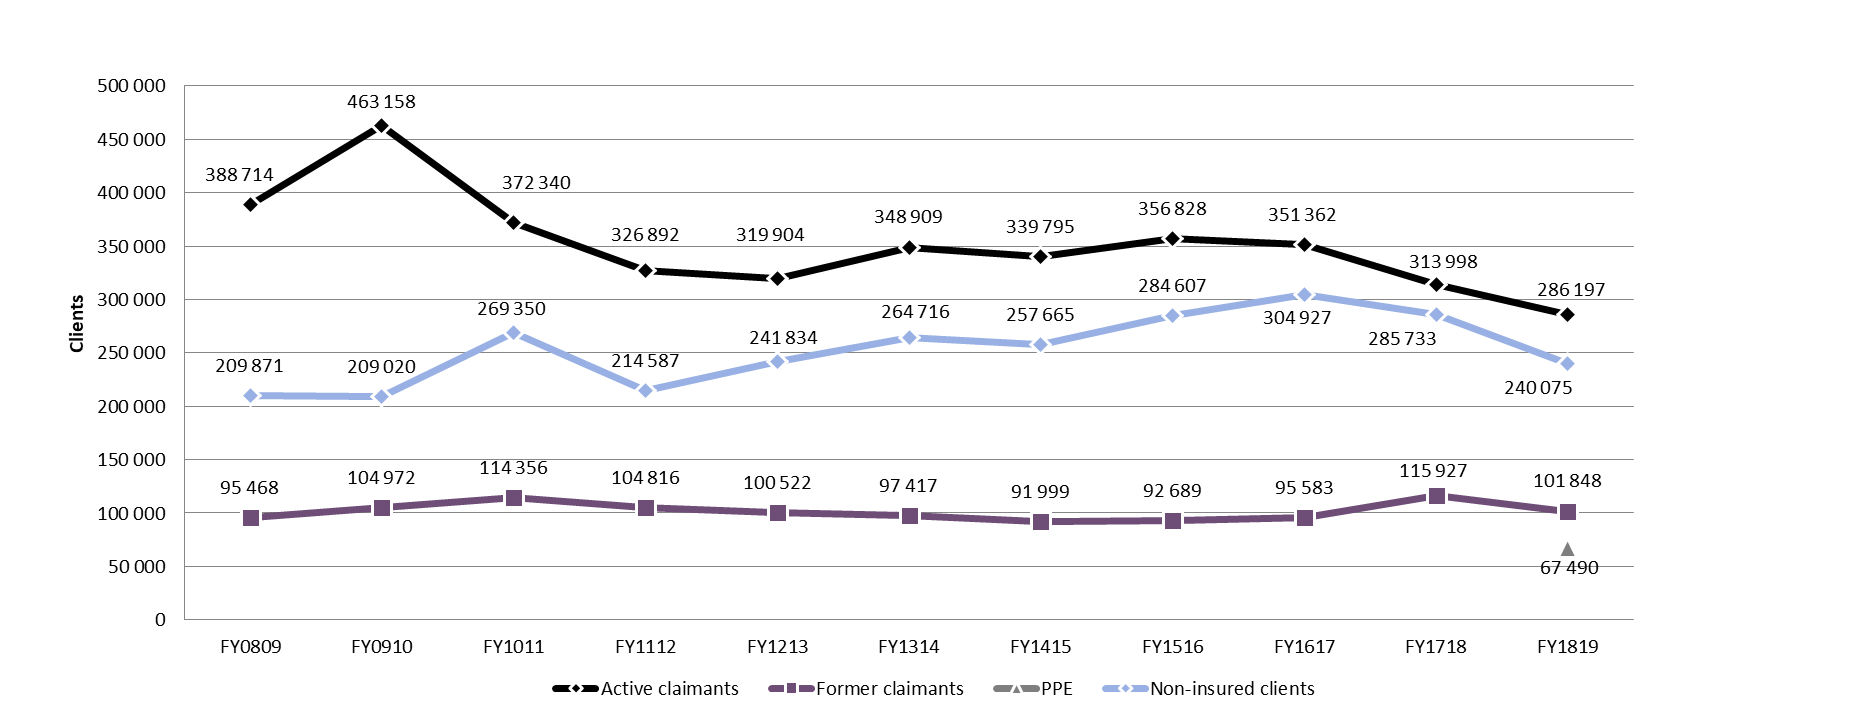
Chart 1 – Text version
| Client type | FY0809 | FY0910 | FY1011 | FY1112 | FY1213 | FY1314 | FY1415 | FY1516 | FY1617 | FY1718 | FY1819 |
|---|---|---|---|---|---|---|---|---|---|---|---|
| Active claimants | 388 714 | 463 158 | 372 340 | 326 892 | 319 904 | 348 909 | 339 795 | 356 828 | 351 362 | 313 998 | 286 197 |
| Former claimants | 95 468 | 104 972 | 114 356 | 104 816 | 100 522 | 97 417 | 91 999 | 92 689 | 95 583 | 115 927 | 101 848 |
| PPE | n/a | n/a | n/a | n/a | n/a | n/a | n/a | n/a | n/a | n/a | 67 490 |
| Non-insured clients | 209 871 | 209 020 | 269 350 | 214 587 | 241 834 | 264 716 | 257 665 | 284 607 | 304 927 | 285 733 | 240 075 |
Since FY0809, the number of EI active claimants has declined by 26.4%, while former EI claimants and non-insured clients increased by 6.7% and 14.4%, respectively. The drop in active EI claimants is largely attributable to the strong performance of Canada's labour market, resulting in an overall decline in EI program use among Canadians. In turn, provinces and territories focused on serving clients more removed from the labour market.
Age distributionFootnote 5
In FY1819, most EBSM clients were in their core working years (25 to 54 years old), totalling 406,743 individuals, or 63.1% of all clients. Youth - those aged 15 to 24 years old - represented 22.3% of all clients (143,684), and clients aged 55 or older were the remaining 13.4% of the shares (86,370 clients). Youth clients increased significantly by 8.2%, followed by clients aged 55 or older (+1.7%), compared to FY1718. Core-aged clients declined by 1.6% year over year. The increase in youth clients resulted in their overall shares edging up, with a decline in the share of core-aged. Whereas, clients aged 55 or older remained unchanged at 13.4% of overall client shares.
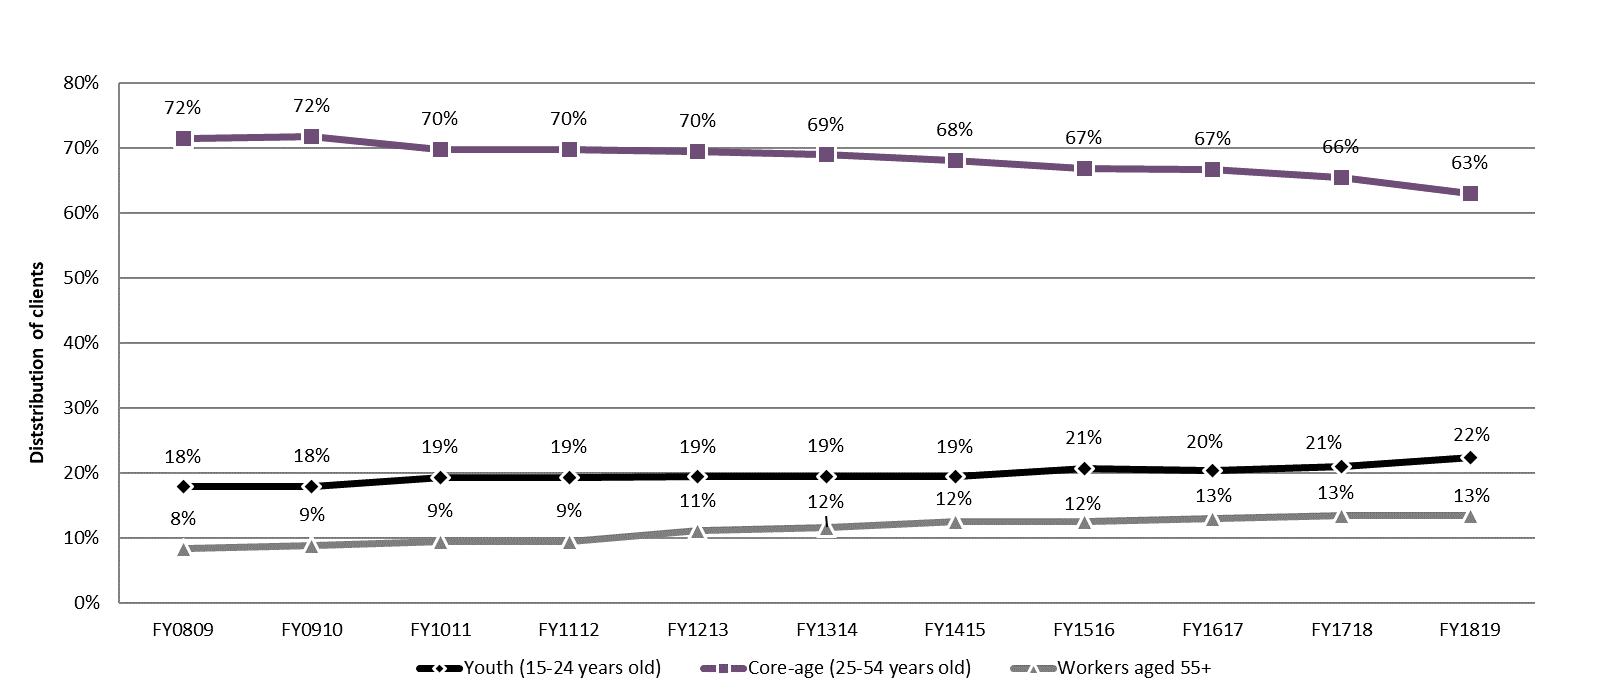
Chart 2 – Text version
| Age distribution | FY0809 | FY0910 | FY1011 | FY1112 | FY1213 | FY1314 | FY1415 | FY1516 | FY1617 | FY1718 | FY1819 |
|---|---|---|---|---|---|---|---|---|---|---|---|
| Youth (15 to 24 years old) | 18% | 18% | 19% | 19% | 19% | 19% | 19% | 21% | 20% | 21% | 22% |
| Core-age (25 to 54 years old) | 72% | 72% | 70% | 70% | 70% | 69% | 68% | 67% | 67% | 66% | 63% |
| Workers (aged 55+) | 8% | 9% | 9% | 9% | 11% | 12% | 12% | 12% | 13% | 13% | 13% |
In the context of an aging labour force, the number of EBSM clients aged 55 or older increased by over 79% compared to FY0809 results. Clients aged 55 or older now represent 13.4% all total clients, compared to 8.5% a decade earlier.
Youth participation in labour market programming also increased (+38.3%) in the past 10 years, as provinces and territories prioritized serving younger people to help counter the effects of an aging population, and developing and maintaining a competitive workforce. This age cohort now represents over 22% of all clients, compared to 17.8% 10 years earlier.
Given the growth of both youth and clients aged 55 or older, the share of core-age workers (25 to 54 years old) declined over the last 10 years. Core-age workers now represent 63.1% of all clients, compared to 73.3% in FY0809.
Designated groupsFootnote 6
In support of employment equity principles, ESDC collects information on the EBSM participation of women, Indigenous peoples, members of visible minority groups and persons with disabilities. As participantsFootnote 7 voluntarily self-identify, annual fluctuations may be due to changes in self-identification rates.
- Women participated in a total of 474,830 EBSM interventions in FY1819, a 1.5% increase year-over-year (45.3% of all interventions delivered to Canadians). Women accessed predominately EAS-only interventions (88.3%); at a higher rate than men (79.4%). Among participants who were women, most were non-insured clients (39.2%), followed by active EI claimants (31.1%) and former EI claimants (18.2%). The remainder of women participants (10.4%) were under the new PPE client category.
- In FY1819, a total of 141,046 participants self-identified as persons with disabilities, an increase of 0.3% year-over-year. Persons with disabilities participated in 13.4% of all interventions delivered in FY1819. The vast majority (90.5%) participated in an EAS-only intervention, compared to 9.5% who participated in Employment Benefits.
- Indigenous peoples participated in 111,515 interventions in FY1819, representing an increase of 27.4% year-over-year. The increase is reflective of a number of jurisdictions prioritizing to serve under-represented groups and improve their employment outcomes, as well as, continued growth observed under ASETS programming. As a share of all ESBM interventions delivered in Canada, Indigenous peoples participated in 10.6% of the total, including programming delivered through ASETS. As in previous years, most Indigenous participants accessed on EAS-only interventions (93.4% of all interventions).
- Members of visible minority groups participated in 73,772 interventions in FY1819, dropping by 5.1% year-over-year. Among all interventions delivered in Canada, members of visible minority groups represented 7.0% of all participants, compared to 7.2% in FY1718. The majority of interventions (91.9%) were EAS-only, compared to 8.6% for Employment Benefits.
Official languages
To foster the full recognition and use of both English and French in Canadian society, and to help ensure that labour market programs and services are delivered in both official languages, all LMDAs contain commitments by provinces and territories to have programs and services delivered in both official languages, where there is significant demand.
3.1.4 Interventions: Employment benefits
Employment Benefits are longer-term interventions focused on providing skills or work experience required to regain employment. Under the LMDAs, provinces and territories can provide Employment Benefits similar to the following 6 benefit types outlined in the EI Act:
- Skills Development-Regular (SD-R)
- Skills Development-Apprentices (SD-A)
- Targeted Wage Subsidies (TWS)
- Self-Employment (SE)
- Job Creation Partnerships (JCPs), and
- Targeted Earnings Supplements (TES)Footnote 8
In FY1819, Employment Benefit interventions totalled 164,442, a significant increase of 16.0% compared to the previous reporting period. With strong labour market conditions and a decline in EBSM interventions, the rise of Employment Benefits suggests provinces and territories focused on longer-term training and skills development investments. The average length of an Employment Benefit intervention was 125 days in FY1819, on average, longer than the duration observed in previous reporting periods.
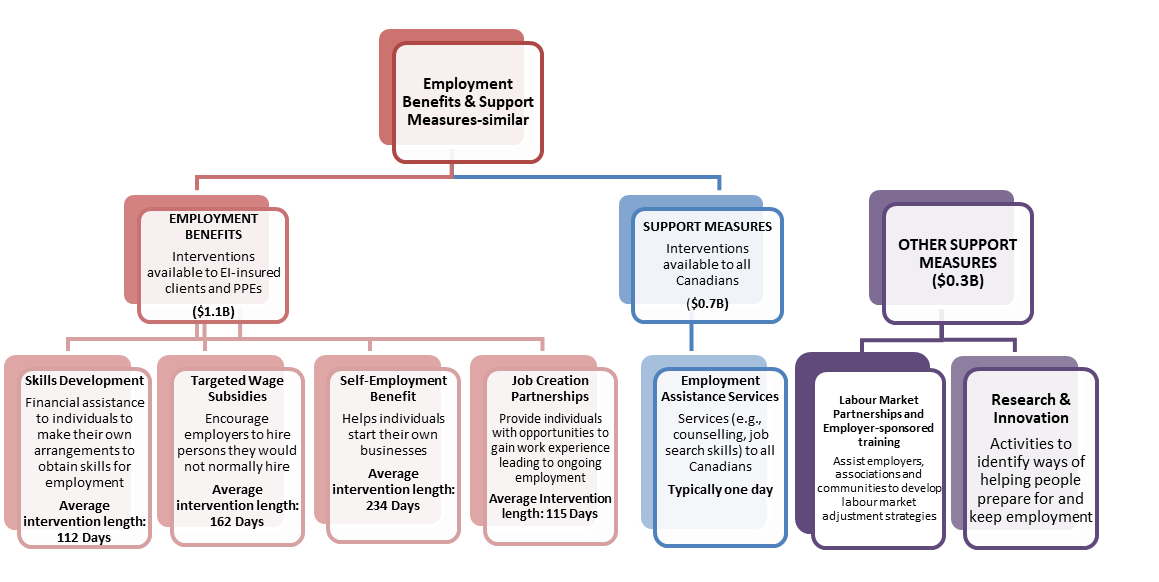
Table 2 - Text version
Table 2 - Text version
- Employment benefits and support measures similar
- Employment benefits: Interventions available to EI-insured clients and PPEs ($1.1B):
- Skills Development: Financial assistance to individuals to make their own arrangements to obtain skills for employment. Average intervention length: 112 Days
- Targeted Wage Subsidies: Encourage employers to hire persons they would not normally hire. Average intervention length: 162 Days
- Self-Employment benefit: Helps individuals start their own businesses. Average intervention length: 234 Days
- Job Creation Partnerships: Provide individuals with opportunities to gain work experience leading to ongoing employment. Average Intervention length: 115 Days
- Support measures: Interventions available to all Canadians ($0.7B):
- Employment Assistance Services: Services (for example, counselling, job search skills) to all unemployed individuals. Typically 1 day
- Other support measures ($0.3B):
- Labour Market Partnerships and Employer-sponsored training: Assist employers, associations and communities to develop labour market adjustment strategies
- Research & Innovation: Activities to identify ways of helping people prepare for and keep employment
- Employment benefits: Interventions available to EI-insured clients and PPEs ($1.1B):
SD-R interventions dramatically increased, by 30.5%, to a total of 72,226, while SD-A interventions increased by 4.9%, to a total of 65,323 in FY1819. Combined, Skills Development interventions made up 83.6% of all Employment Benefits, and Skills Development expenditures totalled $877.7 million, an increase of 5.8%, or $48.1 million, compared to FY1718 results.
In FY1819, TWS interventions shot up by 23.1% year-over-year, to 18,793, and represented 11.4% of all Employment Benefits. Corresponding with this increase, expenditures on TWS programming totalled $142.4 million, an increase of $32.5 million in spending compared to the previous fiscal year.
The number of SE interventions rose by 1.7%, to 4,978, with their shares among all Employment Benefits representing 3.0%. However, SE expenditures decreased in FY1819; going from $61.6 million in FY1718, to $60.6 million in the current reporting year.
Overall, JCP interventions totalled 3,122, dropped by 1.7% year over year. JCP expenditures edged up to $34.0 million, compared to $37.0 million in the previous year.
| Employment benefits | Interventions | Share of Employment benefits | Year-over-year change | Expenditures ($ thousands) |
Estimated cost per intervention |
|---|---|---|---|---|---|
| Targeted Wage Subsidies | 18,793 | 11.4% | +23.1% | $142.4 | $7,575 |
| Self-Employment | 4,978 | 3.0% | -13.4% | $60.6 | $12,180 |
| Job Creation Partnerships | 3,122 | 1.9% | +1.7% | $34.0 | $10,904 |
| Skills Development-Regular | 72,226 | 43.9% | +30.5% | $877.7 | $6,381 |
| Skills Development-Apprentice | 65,323 | 39.7% | +4.9% | ||
| Canada | 164,442 | 100% | +16.0% | $1,114.8 | $6,779 |
3.1.5 Interventions: Support measures
Part II of the Employment Insurance Act authorizes 3 support measures:
- Employment Assistance Services (EAS)
- Labour Market Partnerships (LMPs), and
- Research and Innovation (R&I)
Under the LMDAs, provinces and territories deliver these measures at regional and local levels, while ESDC retains responsibility for pan-Canadian delivery of LMPs and R&I (see section 4: Pan-Canadian Activities and the National Employment Service). However, LMPs and R&I are generally not associated with direct client services, so counts on participants or interventions are not available. The EAS component of support measures provides a full range of self-help and assisted services, such as support in determining career objectives through employment counselling, improving job search techniques, completing a return-to-work action plan and accessing labour market information in support of career choices.
Employment Assistance Services
EAS interventions provide crucial support to those who have been absent from the labour market for an extensive period or who have low job attachment. They may also support new immigrants or young people who are entering the Canadian labour market for the first time. These interventions are reported in one of the 3 following categories:
- Employment services
- Group services, or
- Individual counselling
In FY1819, a total of 859,051 EAS interventions were delivered, a decrease of 7.6% year-over-year. Total expenditures on EAS increased by 1.6% compared to the previous year, to a total of $705.4 million.
Employment services interventions continued to be the most common EAS intervention type, accounting for 58.8% of all EAS interventions in FY1819. A total of 505,182 employment services interventions were delivered, a decrease of 5.9% year-over-year. Group services dropped by 14.1%, for a total of 18,698 interventions delivered. In turn, the share of group services among all EAS-type interventions edged down to 2.2%, compared to 2.3% in the previous year. Individual counselling is particularly important when supporting clients who face barriers to employment, and often need action plans as a pathway to Employment Benefits. A total of 335,171 interventions were delivered in FY1819, declining by 9.7% year-over-year.
Other support measures
The Labour Market Partnership (LMP) measure facilitates collaboration between employers, employees and employer associations, as well as community groups and communities to develop solutions to labour force imbalances, such as persistent high unemployment or skill shortages. Under LMPs, employer-sponsored training includes assistance to employers to support approved training activities for employees in order to maintain their employment. This may include employees affected by technological or structural changes in the economy. In FY1819, LMP expenditures totalled $253.4 million, increasing by 47.4% year-over-year.
Research and Innovation (R&I) initiatives identify better ways of helping people prepare for, return to or maintain employment and participate productively in the labour force. In FY1819, R&I expenditures totalled $94 million, compared to $320.3 million in the previous year.
| Employment Assistance Services* and other support measures | Interventions | Share of employment support measures | Year-over-year change | Expenditures ($ thousands) |
Estimated cost per intervention |
|---|---|---|---|---|---|
| Employment services | 505,182 | 58.8% | -5.9% | n/a | n/a |
| Group services | 18,698 | 2.2% | -14.1% | n/a | n/a |
| Individual counselling | 335,171 | 39.0% | -9.7% | n/a | n/a |
| Total Employment Assistance Services | 859,051 | 100% | -7.6% | $705.4 | $821 |
| Labour Market Partnerships | n/a | n/a | n/a | $253.4 | n/a |
| Research & Innovation | n/a | n/a | n/a | $94.0 | n/a |
| Canada | 859,051 | 100% | -7.6% | $1,052.8 | n/a |
*Expenditures for Employment Assistance Services are reported at the aggregate level by most provinces and territories.
3.1.6 Expenditures
Total expenditures under Part II of the Employment Insurance Act were $2.6 billion in FY1819, which included EBSM programming, and pan-Canadian activities. This represented an increase of 18.4% compared to the previous year.
Under the LMDAs, Employment Benefits remained the largest investment, at $1.115 billion, representing more than half of expenditures by provinces and territories. Compared to FY1718, spending on Employment Benefits increased by over $80 million (+7.7%). Employment Assistance Services expenditures increased as well, up 1.6%, to a total of $705.4 million.
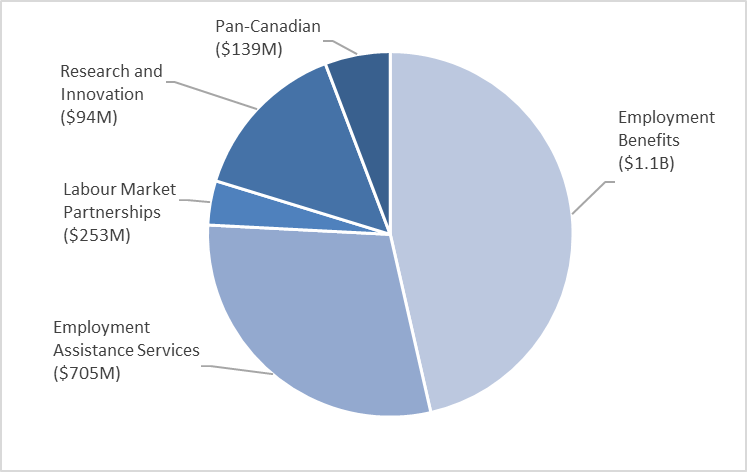
Chart 3 – Text version
| Expenditures | Total |
|---|---|
| Employment benefits | $1.1B |
| Employment Assistance Services | $705M |
| Labour Market Partnerships | $253M |
| Research and Innovation | $94M |
| Pan-Canadian | $139M |
Expenditures towards LMPs and R&I measures increased, going from $320.3 million in FY1718, to $347.4 million in FY1819 (+8.4%).
Pan-Canadian expenditures increased significantly (+15.6%), increasing from $120.2 million in FY1718 to $139.0 million in FY1819. See section 4 of this chapter for details on Pan-Canadian activities.
Targeted measures under LMDAs in FY1819
In FY1819, the Government of Canada made available additional time-limited targeted funding under LMDAs to support workers and communities affected by duties and tariffs imposed by the United States on Canadian softwood exports, as well as steel and aluminum products. In addition, Budget 2018 announced additional funding to assist workers in seasonal industries. For FY1819, nearly $75 million was available to provinces and territories under these 3 measures:
- $20.5M for workers in seasonal industries
- $25M for workers affected by steel and aluminum trade dispute, and
- $29.1M for workers affected by the softwood lumber trade dispute
Provinces and territories accessed roughly $59 million of the total to support workers with LMDA-funding programming. For example, British Columbia used some of the funding towards 6 projects offering skills training and work experience in communities affected by the softwood lumber downturn.
To support workers, provinces and territories accessed more than $59M under the 3 targeted measures of the $75M made available in FY1819.
SkillsAdvance Ontario supported laid off steel and aluminum workers with training during rotating and temporary plant shutdowns to deal with reduced business, resulting from US-imposed steel tariffs, skilled labour shortages and a surge in imports from non-NAFTA countries.
Newfoundland and Labrador used additional funding for workers in seasonal industries to respond to circumstances such as industry closures and downsizing in fish processing. Through the Fish Plant Worker Program, the Province focused on creating short-term employment with wage subsidy supports for workers impacted by the downturn in the fishing sector.
In Nova Scotia, Workplace Initiatives worked with the Fishery and Tourism industries and other government partners to develop innovative approaches for seasonal workers. This included symposia to understand the needs and challenges in relation to seasonal work in these industries.
More information on the additional targeted funding measures is available in section 2 of this chapter.
3.1.7 Key performance indicatorsFootnote 9
FY1819 Employment benefits and support measures key facts
For accessibility reasons, the table has been simplified. Consult the PDF version for the full table.
| EI Active, Former, and Premiums-Paid Eligible (LMDA) | Non-insured clients (LMDA) | Pan-Canadian1 |
|---|---|---|
| 455,535 | 240,075 | 25,179 |
1 EI Part II Pan-Canadian services to individuals are through the Aboriginal Skills and Employment Training Strategy.
| Active claimants | Former claimants | PPEs | Pan-Canadian2 |
|---|---|---|---|
| 41.1% | 14.6% | 9.7% | 34.5% |
| Youth clients (15-24)2 | Core age workers (25-54)2 | Clients aged 55 or older2 | |
| 22.3% | 63.1% | 13.4% |
2 Age distribution does not equal 100%, as the “unknown” category is not reported here. Date of birth is not collected for clients in SD-Apprentices and Group Services.
| Interventions | FY1819 | Year-over-year change |
|---|---|---|
| Employment Benefits | 164,442 | 16.0%  |
| Support Measures: EAS | 859,051 | 7.6%  |
| Pan-Canadian | 44,498 | 24.1% |
| Relative share | FY1819 | Year-over-year change (p.p.) |
|---|---|---|
| Employment Benefits | 16.1% | 3.0 |
| Support Measures: EAS | 83.9% | 3.0 |
| Expenditures | FY1819 ($ million) |
Year-over-year change |
|---|---|---|
| Employment Benefits | $1,114.8 | 7.7% |
| Support Measures: EAS | $705.4 | 1.6% |
| LMPs and R&I | $347.4 | 8.4% |
| Pan-Canadian | $408.6 | 240% |
| Total Expenditures | $2,618 | 18.4% |
3 Totals may not add up exactly due to rounding; accounting adjustments are not included.
| Indicator | Total | Year-over-year change |
|---|---|---|
| Active Claimants Served | 286,197 | 8.9% |
| Returns to Employment | 190,754 | 7.6% |
| Estimated Unpaid Benefits ($ Million) | $1,071.0 | 2.9% |
ESDC monitors the results of EBSM-similar programming delivered by provinces and territories through 3 key performance indicators:
- the number of active EI claimants servedFootnote 10
- the number of EI clients who return to employment following an intervention,Footnote 11 and
- the amount of unpaid EI Part I benefits resulting from returns to employment
In the context of improving labour market and economic conditions in FY1819 throughout most parts of Canada, the number of active EI claimants served (286,197) dropped by 8.9% year-over-year. Returns to work increased by 7.6% year-over-year, with a total of 190,754 clients finding employment within 6 months of completing their interventions. Stemming from the declines in active EI claimants, unpaid EI Part I benefits totalled $1.071 billion, declining by 2.9% compared to the previous year.
Table 5 presents supplementary performance indicators at the national and provincial/territorial level, contextualized with labour market aggregates. Since multiple factors can influence results at the individual, jurisdictional and national level, these indicators cannot be solely attributed to the LMDAs.
At the national level, 62.6% of active EI claimants began their first LMDA-funded intervention within 12 weeks after their Benefit Commencement Period (BCP). Compared to FY1718, this is an increase of 3.1 percentage points, where 59.5% of active claimants began within 12 weeks that year. At the provincial/territorial level, most jurisdictions experienced an increase, as well, with results ranging from 76.3% in Quebec, to 32.1% in Newfoundland and Labrador.
In FY1819, Canada's returns to work from interventions among active clients, expressed as a proportion of the country's labour force, was 1.0%. Quebec and the four Atlantic provinces were at or above the national average. At the same time, unpaid EI regular benefits stemming from returns to work, expressed as a proportion of total EI regular benefits paid, was 10.0% at the national level. Quebec, Saskatchewan, Alberta, and British Columbia posted higher proportions than the national figure. Only Quebec registered above the national average for these 2 ratios. This suggests an effective and efficient balance between returning clients to work as soon as possible, while ensuring the necessary active employment services for employment success over a mid-to long-term horizon.
| Provinces and territories | Unemployment rate (FY1819) | Job vacancy rate (FY1819) | EI active claimants (%) beginning EI Part II within 12 weeks following their Part I Benefit Period Commencement* (FY1819) | Returns to work among active EI clients from EBSM interventions, as a proportion of the labour force (FY1819) | Estimated unpaid EI regular benefits resulting from EBSM interventions, as a proportion of Part I regular benefits paid (FY1819) |
|---|---|---|---|---|---|
| Newfoundland & Labrador | 13.0% | 2.0 | 32.1% | 1.2% | 2.0% |
| Prince Edward Island | 9.3% | 3.6 | 60.8% | 2.9% | 4.2% |
| Nova Scotia | 7.2% | 2.7 | 54.1% | 1.0% | 4.4% |
| New Brunswick | 7.9% | 3.0 | 54.3% | 2.1% | 4.0% |
| Quebec | 5.4% | 3.2 | 76.3% | 1.7% | 11.4% |
| Ontario | 5.7% | 3.2 | 56.3% | 0.6% | 9.6% |
| Manitoba | 5.8% | 2.5 | 42.6% | 0.6% | 11.4% |
| Saskatchewan | 6.0% | 2.2 | 45.6% | 0.8% | 12.5% |
| Alberta | 6.7% | 2.8 | 63.9% | 0.7% | 15.5% |
| British Columbia | 4.7% | 4.6 | 42.0% | 0.8% | 13.8% |
| Northwest Territories | 6.9% | 3.3 | 57.3% | 0.8% | 9.9% |
| Yukon | 3.4% | 4.5 | 40.0% | 0.5% | 5.0% |
| Nunavut | 14.5% | 3.4 | 37.8% | 0.3% | 5.5% |
| Canada | 5.8% | 3.3 | 62.6% | 1.0% | 10.0% |
Source: Labour Force Survey, Business Payroll Survey, and EI administrative data.
*This includes a small percentage of clients who began EI Part II programming up to 2 weeks prior to their Part I Benefit Period Commencement. SD-A participants and those who were non-insured participants were excluded, if they had taken EAS in the previous year.
3.2. Provincial and territorial EBSM activities
In this section
- 3.2.1 Context
- 3.2.2 Newfoundland and Labrador
- 3.2.3 Prince Edward Island
- 3.2.4 Nova Scotia
- 3.2.5 New Brunswick
- 3.2.6 Quebec
- 3.2.7 Ontario
- 3.2.8 Manitoba
- 3.2.9 Saskatchewan
- 3.2.10 Alberta
- 3.2.11 British Columbia
- 3.2.12 Northwest Territories
- 3.2.13 Yukon
- 3.2.14 Nunavut
This section analyzes the provincial and territorial economic environment and EBSM-similar activities in FY1819. It links trends in clients served, interventions and expenditures to local labour market conditions, as well as employment programming priorities.
3.2.1 Context
Under the LMDAs, provinces and territories receive funding to support the delivery of programs and services, similar to the EBSMs established under Part II of the Employment Insurance Act.Footnote 12 To address unique labour market challenges, provinces and territories deliver employment programming under LMDAs, which were individually negotiated with the Government of Canada. Provinces and territories design and deliver all EI-funded active employment programming, except for pan-Canadian activities, discussed in section 4 of this chapter.
Broad-based consultations were held in FY1617 with provinces, territories and stakeholders to identify ways to improve the labour market transfer agreements and guide future investments to strengthen labour market programming. Comments received indicated a desire for agreements to be more flexible and responsive to the needs of employers and Canadians, especially those who are underrepresented in the workforce.
Budget 2017 announced new measures to rationalize and expand the existing bilateral labour market transfer agreements with provinces and territories, including the LMDAs. This included amending the EI Act to expand eligibility for Employment Benefits to include unemployed individuals who have made minimum Employment Insurance premium contributions in at least 5 of the last 10 years. In addition, eligibility for Employment Assistance Services was broadened to include both the unemployed and employed. Provinces and territories were also provided with increased flexibility to support employer-sponsored training under the Labour Market Partnerships Support Measure. These changes took effect on April 1, 2018 and were reflected in amending agreements signed with provinces and territories. These amendments can be found on the LMDA website.
In addition, the amended LMDAs require provinces and territories to consult with employer and employee organizations, as well as stakeholders representing Official Language Minority Communities, as part of their annual planning process. Provinces and territories are required to provide ESDC with lists of stakeholders consulted, key priorities coming out of the consultations, and linkages with labour market programming priorities.
Budget 2017 announced an additional $1.8 billion investment in the LMDAs over 6 years (2017-2018 to 2022-2023), to help more Canadians access EI-funded skills training and employment supports.
Overall, Canada's economy and labour market performed well in FY1819, contributing to a decline in the number of clients served and LMDA-funded interventions delivered in most Provinces and territories. Despite varying economic and labour market conditions throughout Canada, all jurisdictions prioritized improvements to the labour market attachment of underrepresented groups, such as persons with disabilities, Indigenous peoples, recent immigrants, youth, and older workers; as well as assuring employers ready access to a skilled workforce. An aging workforce and out-migration remain a particular labour market challenges for Atlantic Canada, where the Provinces worked with communities and regional stakeholders to ensure labour market programming responds to the demographic pressures.
The Managing for results section for each provincial and territorial summary highlights innovative approaches to improve outcomes for clients. These include:
- better employer engagement in setting priorities and design
- improved strategies to deliver active employment supports earlier for EI claimants, and
- innovative approaches in some jurisdictions to Research and Innovation support measures
3.2.2 Newfoundland and LabradorFootnote 13
In 2018, for a second consecutive year, Newfoundland and Labrador registered the lowest real GDP growth among all provinces and territories, with a contraction of 3.5% compared to 2017. A consensus of private sector banks projects that Newfoundland and Labrador's economic growth has surpassed the national average in 2019, increasing by about 2.0%.
Newfoundland and Labrador: EBSM key facts
For accessibility reasons, the table has been simplified. Consult the PDF version for the full table.
| Insured clients | Non-insured clients |
|---|---|
| 9,211 |
542 |
| Intervention type | FY1819 | Year-over-year change |
|---|---|---|
| Employment Benefits | 7,246 | 9.8% |
| Support Measures: EAS | 13,687 | 26.5% |
| Intervention type | FY1819 | Year-over-year change(pp) |
|---|---|---|
| Employment Benefits | 34.6% | 4.5 |
| Support Measures: EAS | 65.4% | 4.5 |
| Total expenditures | FY1819 ($ million) |
Year-over-year change |
|---|---|---|
| Employment Benefits | $113.3 | 0.9% |
| Support Measures: EAS | $10.1 | 47.2% |
| LMP and R&I | $10.6 | 8.8% |
| Total Expenditures2 | $134.0 | 4.0% |
1 Newfoundland and Labrador invested $486,760 of its total allocation towards administration costs, representing almost 6.0% of the Budget 2017 additional funding the Province received in FY1819.
2 Totals may not add up due to rounding; does not include accounting adjustments.
| FY1718 | FY1819 | Year-over-year change |
|---|---|---|
| $17.47 | $16.16 | 7.5% |
Compared to the previous fiscal year, labour market conditions improved slightly in FY1819. Employment increased by 3,700 (+1.7%), all in part-time positions, ending 5 consecutive years of decline, while the unemployment rate improved from 14.7% to 13.0%, the lowest in the past 4 years. Employment growth was concentrated in the services-producing sector (+4,400; +2.5%), led by gains in public administration (+2,400; +16.2%), wholesale trade (+1,600; +37.5%), as well as in information, culture and recreation (+1,500; +23.4%). In the goods-producing sector (-700; -1.4%), declines were recorded in most industries, led by construction (-1,200; -5.9%). This partially offset the increase in forestry, fishing, mining, quarrying, oil and gas (+1,600; +13.5%).
In an ongoing period of economic adjustment, the Government of Newfoundland and Labrador offered programs and services under its LMDA to improve the skills of residents. The aim was to address labour market demands, support displaced workers impacted by labour force adjustments and company closures, and address new and ongoing challenges and opportunities. Provincial investment priorities for FY1819 included:
- providing mechanisms to develop a highly educated and skilled workforce
- implementing initiatives to support a strong labour supply, with a focus on under-represented groups
- continuing development of a comprehensive human resource plan to support sector diversification and a productive and knowledge-intensive economy, and
- developing a responsive and adaptive workforce, through effective employment and skills training programming, with a focus on unemployed and underemployed individuals from underrepresented groups (women, persons with disabilities, Indigenous groups, youth, and mature workers)
Stakeholder engagement led to the redesign of the Targeted Wage Subsidies Program
The department engaged with stakeholders, including employers, industry, community organizations, post-secondary institutions and individuals to gain a better understanding of their labour market needs and issues. This engagement provided an opportunity to share information that was then taken into account in the redesign and implementation of labour market initiatives with a focus on providing more responsive and timely supports for clients.
As an example, these consultations led to the redesign of the department's JobsNL wage subsidy program. The subsidy amount increased, along with the duration of the subsidy, and completion bonuses were given to employers and individuals who maintained employment 10 weeks beyond the intervention completion date. Additionally, the department used information from these consultations to inform the development of other programs supported through labour market transfer agreements with a focus on priority sectors such as forestry, aquaculture, agriculture and others.
3.2.2.1 Managing for results
As 1 of the conditions of the amended LMDA, Newfoundland and Labrador is working with ESDC to implement the Targeting, Referral and Feedback (TRF) system. Evaluations of the LMDAs demonstrated that clients who accessed services in the first 2 to 3 months of their EI Part I claim had better employment and earnings outcomes, and were able to return to work more quickly. LMDA clients who were active EI claimants often did not access programs and services until 6 months or later into their claim. The TRF system will assist the Province in improving outcomes for LMDA clients. A pilot test started in February 2020.
As noted in the FY1718 Monitoring and Assessment Report, the Province contracted a third‑party service provider (Employment Options) to deliver employment counselling and case management to EI-eligible clients in the larger centres of the Province. In FY1819 Employment Options opened its first office in Grand Falls. The company has since expanded and opened offices in St. John's East, St. John's West, and Corner Brook. This increase in capacity aligns with the vision and goals of the Workforce Innovation Centre. The focus was to identify ways to better help people prepare for, find, return to, or maintain sustainable employment. Employment Assistance Services are still available at the Department's employment centres across the Province. They assist EI-eligible individuals with job searches, resume writing, labour market information, as well as career and employment needs assessments. As part of the Performance Measurement Strategy, changes were made in the Labour Market Programs Support System (LaMPSS) to capture the required reporting fields for ESDC. This increase in capacity, combined with the enhancements in LaMPSS, allowed for improved capture of data and program results. As well, the Province is working with Community Partners to make similar changes to their Accountability Resource Management System (ARMS), to better capture the required fields as outlined in the Performance Measurement Strategy. The schema was provided to the ARMS technical team, who will create xml files for each community partner. This will be sent to ESDC via secure upload. Full implementation is expected for 2020.
The province also updated its online resources to better assist clients with their career planning and job search needs. Through the Provincial SkillsPass NL Project, targeted online programs help clients secure and maintain employment. This training program will give job searchers the tools and confidence needed to find suitable employment and build their career. Every client training record associated with a client's online profile is secured in an online database allowing the client to demonstrate training completion and credential attainment. The SkillsPass Program gives career counsellors the ability to track and monitor the client's progress. Clients can complete up to 22 learning activities related to career planning and job search. The program delivers consistent service in rural and urban areas of the province, and will increase the number of clients served.
3.2.2.2 Clients, interventions and expenditures
Compared to the previous fiscal year, the total number of clients served in Newfoundland and Labrador during FY1819 decreased from 12,867 to 9,753, a 24.2% year-over-year decline. The number of active claimants (-1,674; -17.8%), former claimants (-999; -42.2%) and non-insured clients (-565; -51.0%) dropped.
The new client group, Premiums-Paid Eligible (PPE), totalled 124 of all clients served by the province, and represented 1.3% of all clients. With respect to the shares of the 3 other client groups, active claimants (79.1%) increased by 6.1 percentage points, while former claimants (14.1%) and non-insured clients (5.6%) fell by 4.3 and 3.0 percentage points respectively. The decline in the proportion of non-insured clients may be attributable to the new PPE category.
The total number of EBSM-similar interventions in Newfoundland and Labrador dropped to 20,933 (‑21.5%) in FY1819, with the shares of Employment Benefits and Support Measures representing 34.6% and 65.4%, of all EBSM-similar interventions. A total of 3,055 (+9.3%) insured clients returned to employment after participating in an EBSM-similar program. Unpaid EI benefits decreased from $17.47 million to $16.16 million, representing a 7.5% year-over-year drop. EBSM total expenditures advanced by 4.0% to $134.0 million, including $7.8 million from the province's share of the additional $225.0 million LMDA investment announced in Budget 2017, as well as funding measures provided to support workers in seasonal industries ($1.6 million), and those affected by trade disputes in the steel and aluminum industries ($500,000).
The Impacted Fish Plant Worker Program is an example. The targeted program is focused on creating short-term employment for workers from fish plants deemed impacted by the downturn in the fishing sector. The Fish Plant Worker Program is administered by Municipal Affairs and Environment (MAE) as impacted fish plants are identified by the Department of Fisheries and Land Resources (FLR).Once a fish plant is identified by FLR, MAE will make contact with the plant to obtain a plant worker list, as well as, reach out to the community in which the plant is located to secure a sponsor. If another sponsor is needed to accommodate the workers of the impacted plant, then MAE will reach out again and pursue projects in other communities tied to those impacted workers.
Under the Impacted Fish Plant Worker Program, workers can work 420 hours less any insurable hours they have already accumulated in the current year.
Newfoundland and Labrador also supports directly or indirectly impacted steel and aluminum workers through the provision of similar types of supports.
One such example was the Labour Market Partnership with NewCo Metals aimed to address the human resource planning needs of the company. A company was hired to conduct onsite training at the Newco's newly constructed processing facility at Foxtrap. There were 3 main components within Newco's training plan. The first component was provided by Wendt Industries, suppliers of the shredder and the downstream ancillary equipment. This highly specialized equipment enables the secondary processing of metal products, the first and only of its kind in Newfoundland and Labrador.
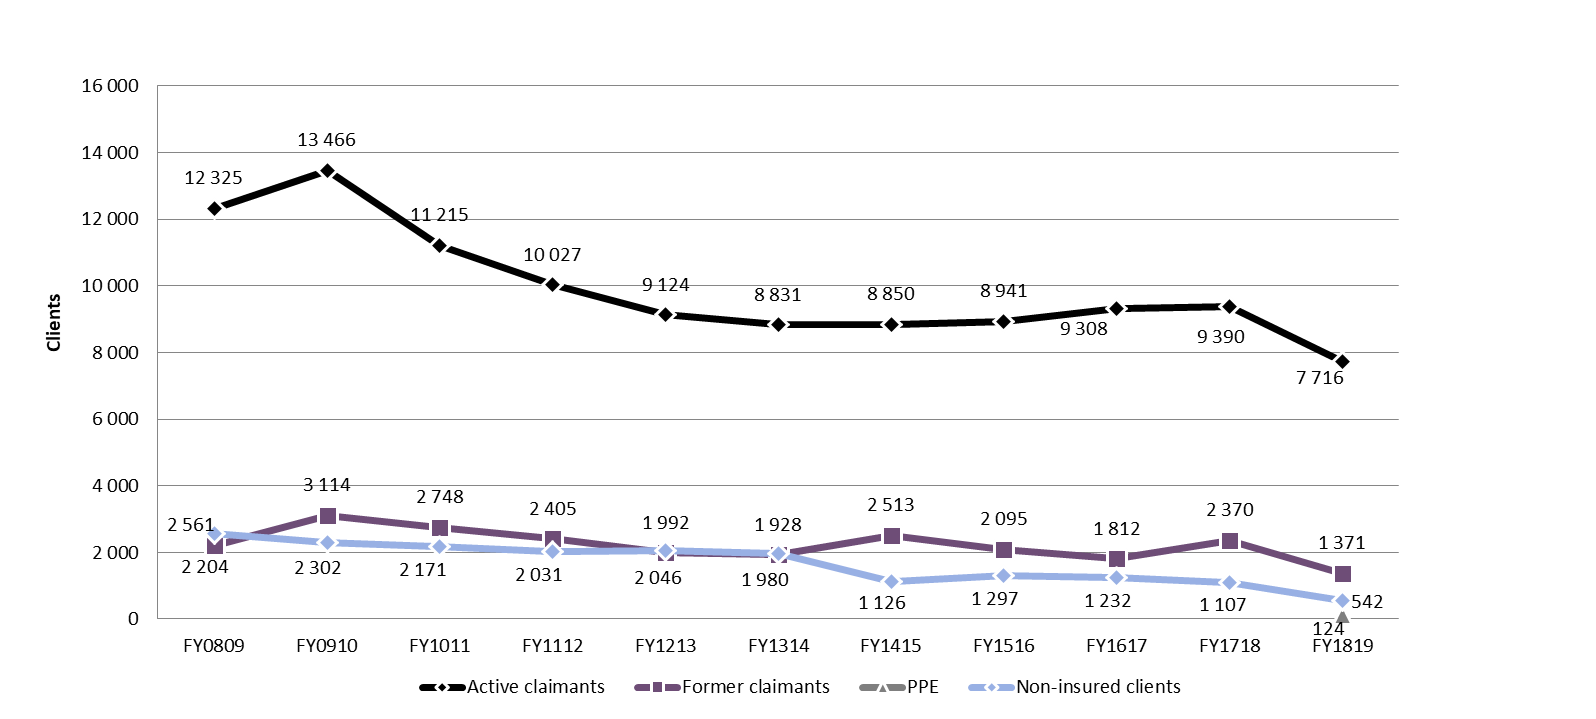
Chart 4 – Text version
| Client type | FY0809 | FY0910 | FY1011 | FY1112 | FY1213 | FY1314 | FY1415 | FY1516 | FY1617 | FY1718 | FY1819 |
|---|---|---|---|---|---|---|---|---|---|---|---|
| Active claimants | 12,325 | 13,466 | 11,215 | 10,027 | 9,124 | 8,831 | 8,850 | 8,941 | 9,308 | 9,390 | 7,716 |
| Former claimants | 2,204 | 3,114 | 2,748 | 2,405 | 1,992 | 1,928 | 2,513 | 2,095 | 1,812 | 2,370 | 1,371 |
| PPE | n/a | n/a | n/a | n/a | n/a | n/a | n/a | n/a | n/a | n/a | 124 |
| Non-insured clients | 2,561 | 2,302 | 2,171 | 2,031 | 2,046 | 1,980 | 1,126 | 1,297 | 1,232 | 1,107 | 542 |
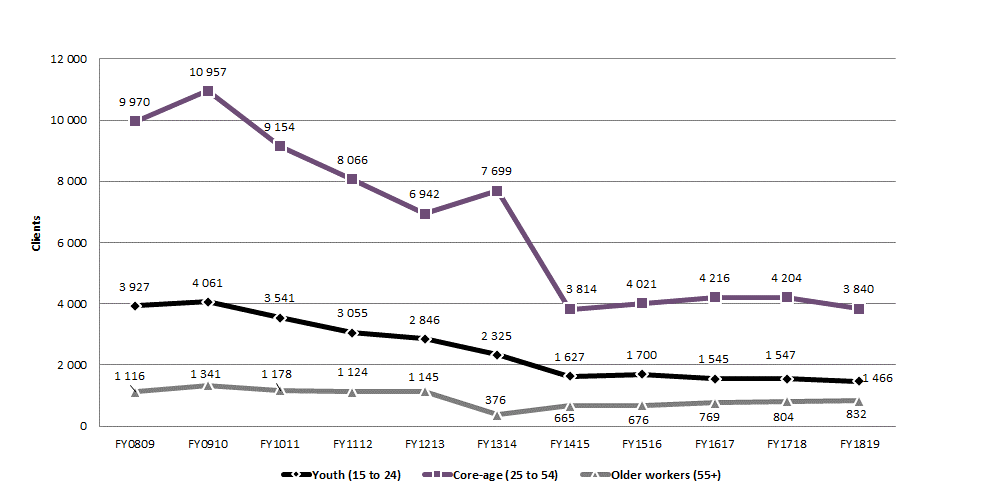
Chart 5 – Text version
| Client age | FY0809 | FY0910 | FY1011 | FY1112 | FY1213 | FY1314 | FY1415 | FY1516 | FY1617 | FY1718 | FY1819 |
|---|---|---|---|---|---|---|---|---|---|---|---|
| Youth (15 to 24) | 3,927 | 4,061 | 3,541 | 3,055 | 2,846 | 2,325 | 1,627 | 1,700 | 1,545 | 1,547 | 1,466 |
| Core-age (25 to 54) | 9,970 | 10,957 | 9,154 | 8,066 | 6,942 | 7,699 | 3,814 | 4,021 | 4,216 | 4,204 | 3,840 |
| Older workers (55+) | 1,116 | 1,341 | 1,178 | 1,124 | 1,145 | 376 | 665 | 676 | 769 | 804 | 832 |
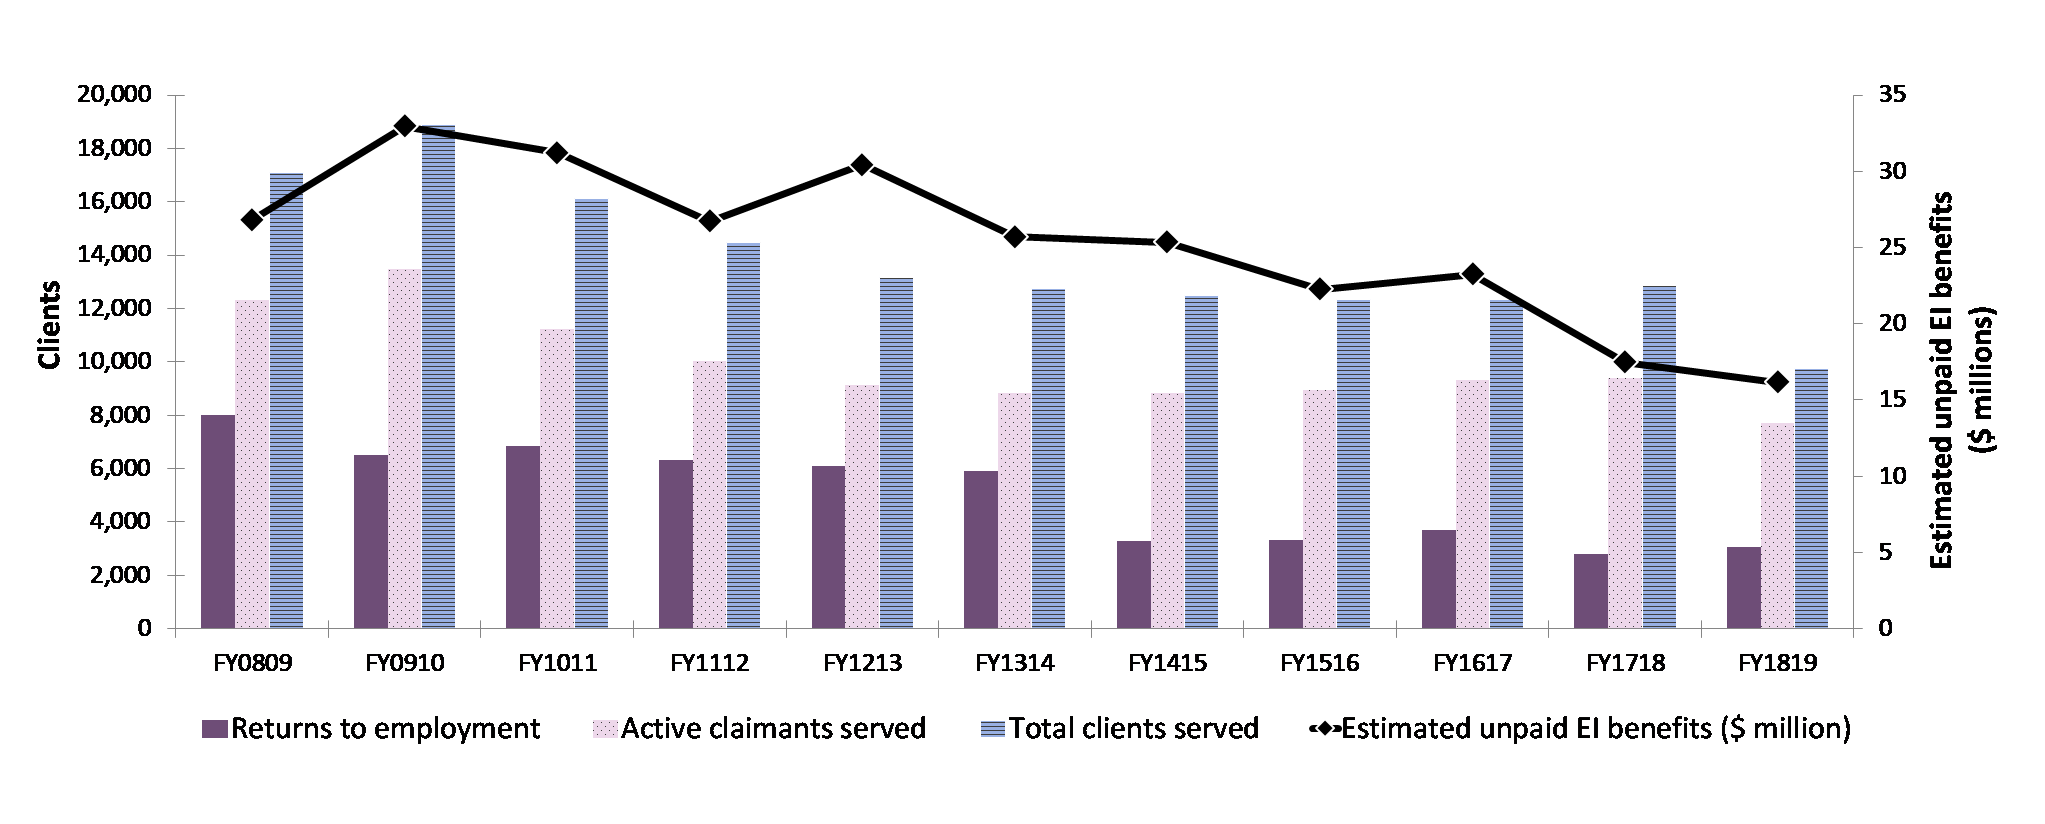
Chart 6 – Text version
| Key performance indicators | FY0809 | FY0910 | FY1011 | FY1112 | FY1213 | FY1314 | FY1415 | FY1516 | FY1617 | FY1718 | FY1819 |
|---|---|---|---|---|---|---|---|---|---|---|---|
| Returns to employment | 7,995 | 6,526 | 6,857 | 6,335 | 6,114 | 5,918 | 3,298 | 3,306 | 3,696 | 2,795 | 3,055 |
| Active claimants served | 12,325 | 13,466 | 11,215 | 10,027 | 9,124 | 8,831 | 8,850 | 8,941 | 9,308 | 9,390 | 7,716 |
| Total clients served | 17,090 | 18,882 | 16,134 | 14,463 | 13,162 | 12,739 | 12,489 | 12,333 | 12,352 | 12,867 | 9,753 |
| Estimated unpaid EI benefits ($ million) | $26,83 | $32,94 | $31,20 | $26,71 | $30,42 | $25,69 | $25,35 | $22,25 | $23,23 | $17,47 | $16,16 |
Table 6 - Newfoundland and Labrador: EBSM-similar programming, FY1819
For accessibility reasons, the table has been simplified. Consult the PDF version for the full table.
| Employment benefits | Interventions | Year-over-year change |
Expenditures ($ 000s) |
|---|---|---|---|
| SD-R: Newfoundland and Labrador Skills Development | 3,244 | -10.1% | 90,792 |
| SD-A: Newfoundland and Labrador Skills Development | 1,547 | -23.1% | |
| TWS: Newfoundland and Labrador Wage Subsidies | 802 | -2.2% | 7,519 |
| SE: Newfoundland and Labrador Self-Employment Assistance | 267 | -6.6% | 6,507 |
| JCP: Newfoundland and Labrador Job Creation Partnerships | 1,386 | +5.7% | 8,509 |
| Support measures | Interventions | Year-over-year change |
Expenditures ($ 000s) |
|---|---|---|---|
| EAS: Newfoundland and Labrador Employment Assistance Services | 13,687 | -26.5% | 10,060 |
| LMP: Newfoundland and Labrador Labour Market Partnerships | n/a | n/a | 7,448 |
| R&I: Research and Innovation | n/a | n/a | 3,123 |
3.2.2.3 Employment benefits
The total number of Employment benefit interventions in Newfoundland and Labrador dropped from 8,037 to 7,246 in FY1819, representing a 9.8% year-over-year decline. With the exception of JCP (+75; +5.7%), all other benefit types dropped: TWS (-18; -2.2%), SE (-19; -6.6%), SD-R (-364; -10.1%) and SD-A (-465; -23.1%). Total expenditures towards Employment Benefits ($113.3 million) remained relatively stable (+0.9%).
3.2.2.4 Support measures: EAS
After 4 consecutive years of growth, EAS interventions in Newfoundland and Labrador dropped by 26.5% to 13,687. All EAS types contributed to this decline: Employment services (-3,311; -39.4%), group services (-44; -1.2%) and individual counselling (-1,585; -24.1%). Total EAS expenditures advanced by 47.2% to $10.1 million.
3.2.2.5 Other support measures: LMP and R&I
In FY1819, Newfoundland and Labrador's total funding for LMP and R&I reached $10.6 million (+8.8%). While funding towards LMP ($7.4 million) increased by 66.1%, R&I funding ($3.1 million) declined by 40.3%.
EBSMs in action: Research and innovation - Newfoundland and Labrador
FY1819 was the second year, of the 3-year Workforce Innovation Centre funded Research and Innovation grant, to the Collective Interchange Cooperative and Canadian Career Development Foundation, for their Evidence for Community Employment Services: A Collaborative Regional Approach project. Results from this project have been positive to date with the development and implementation of the PRIME (Performance Recording Instrument for Meaningful Evaluation) front line service delivery recording tool. The initial PRIME application was developed by the Canadian Career Development Foundation. Following an initial period of studying 10 years of data and consequently tailoring the PRIME system, the project moved to targeting training and upskilling for practitioners. PRIME was implemented in 6 significant client service delivery organizations in NL. The following milestones have been achieved. PRIME is a simple tool that supports a more effective approach of tracking incremental meaningful client changes and it collected and enabled analysis of a much wider range of client outcomes and progress indicators. This resulted in information being provided to government, supervisors, frontline workers and the client themselves. Information is being used collaboratively with clients with measurable immediate effects. Based on the feedback that has been produced during the study, the Canadian Career Development Foundation was able to refine the initial PRIME 1.0 with a new release of PRIME 2.0 with a number of enhancements. This study is ongoing and set to be completed by November 2020 with the next big milestone to move further toward using PRIME to foster a culture of evidence-based decision making for services providers, government and clients.
3.2.3 Prince Edward Island
For a fourth consecutive year, in 2018, Prince Edward Island's real GDP growth surpassed the national average, increasing by 2.6%. The latest forecasts from the major banks point to a growth rate of over 2.0% for 2019.
Prince Edward Island: EBSM key facts
For accessibility reasons, the table has been simplified. Consult the PDF version for the full table.
| Insured clients | Non-insured clients |
|---|---|
| 4,774 |
1,595 |
| Intervention type | FY1819 | Year-over-year change |
|---|---|---|
| Employment Benefits | 3,4753,946 | 5.6% |
| Support Measures: EAS | 6,888 | 4.5% |
| Intervention type | FY1819 | Year-over-year change(pp) |
|---|---|---|
| Employment Benefits | 33.5% | 0.2 |
| Support Measures: EAS | 66.5% | 0.2 |
| Total expenditures | FY1819 ($ million) |
Year-over-year change |
|---|---|---|
| Employment Benefits | $21.3 | 13.7% |
| Support Measures: EAS | $4.7 | 9.2% |
| LMP and R&I | $1.7 | 0.6% |
| Total Expenditures2 | $27.7 | 8.3% |
1 Prince Edward Island invested $75,240 of its total allocation towards administration costs, representing almost 3.5% of the Budget 2017 additional funding the Province received in FY1819.
2 Totals may not add up due to rounding; does not include accounting adjustments.
| FY1718 | FY1819 | Year-over-year change |
|---|---|---|
| $7.13 | $6.66 | 6.5% |
Prince Edward Island enjoyed favourable labour market conditions in FY1819. Employment grew by 1,800 (+2.4%) year-over-year, entirely in full-time positions, to reach 76,100, marking a new high for the province. Employment in full-time positions increased by 3.9%, from 62,000 to 64,400, while employment in part-time positions decreased by 5.3%, from 12,300 to 11,600. The unemployment rate declined from 9.9% in FY1718 to 9.3% in FY1819, the lowest rate since comparable data became available in FY7677. Employment growth was the strongest in the goods-producing sector (+1,400; +7.6%), with gains in all industries, led by growth in agriculture (+700; +19.6%) and construction (+300; +5.3%). Employment in the services-producing sector advanced by 400 positions on a net basis (+0.7%), with as many industries expanding as those contracting. A notable gain was in accommodation and food services (+600; +10.7%).
Investments in labour market programs were aimed at supporting continued economic growth and prosperity in Prince Edward Island. This was achieved by ensuring that these programs continued to address labour market demand challenges and meet the needs of job seekers. The province's investment priorities for FY1819 included:
- assisting Islanders in developing the necessary skills to prepare for, find and keep employment
- continuing support for persons with disabilities to gain and maintain meaningful employment
- providing employers with an access to a skilled and diverse workforce, and
- ensuring that communities in Prince Edward Island are able to respond effectively to their own labour market opportunities and challenges
3.2.3.1 Managing for results
Prince Edward Island had a unique advantage when it came to understanding the needs and expectations of its stakeholders. Because of its small geographic size, Prince Edward Island was able to remain connected with industry, sector councils, employers and job seekers. This allowed the province to respond quickly to labour force changes.
To learn more about labour market issues and opportunities that employers across the province were facing, the Department of Education and Lifelong Learning consulted directly with key stakeholders; including sector councils and industry associations, Indigenous and Francophone communities, employment assistance providers, chambers of commerce and post-secondary institutions, and various non-profit organizations.
This consultation process provided a forum for partners to discuss labour market issues important to them and to job seekers. The collaborative effort ensured programs and services were responsive, timely, relevant, and aligned with the labour force needs of Prince Edward Island's key economic sectors.
Across the province employers, industry associations, and sector councils confirmed that a shortage of workers was one of the main areas of concern. Prince Edward Island's traditional sectors such as agriculture, fisheries, seafood processing, aquaculture, and tourism identified the lack of reliable and available labour was affecting their ability to expand their industries. Many of these industries were located in rural areas and demographic changes, such as a declining population and an aging workforce, depleted the labour supply. In response, the province continued to work closely with these sectors to attract local workers, through a variety of recruitment initiatives, with a focus on underrepresented groups such as newcomers, social assistance recipients, and Indigenous participants.
Newer sectors such as biotechnology, aerospace, advanced manufacturing, and information technology indicated challenges in accessing a skilled workforce. In this context, the province continued to invest in skills development training, by providing financial assistance to unemployed Islanders to complete training programs, to gain the skills and education necessary to find and maintain long-term sustainable employment.
3.2.3.2 Clients, interventions and expenditures
In FY1819, Prince Edward Island served 6,369 clients, a rise of 4.0% year-over-year, and the fourth consecutive year of annual growth. This growth was attributed to an increase in the number of active claimants (+137; +3.9%), combined with the 438 clients served under the new PPE category. The number of non-insured clients (-257; -13.9%) and former claimants (‑72; ‑9.2%) declined compared to FY1718. The share of active claimants remained unchanged in FY1819, at 56.9% of all clients served. The proportions of former claimants (11.2%) and non-insured clients (25.0%) declined by 1.6 and 5.2 percentage points respectively. The decline in the proportion of non-insured clients may be attributable to the new PPE category, which accounted for 6.9% of all clients served. In prior years, those clients could have been classified in the non-insured category.
For a fifth consecutive year, the number of EBSM-similar interventions in Prince Edward Island grew, reaching 10,363 in FY1819 (+4.8%). A total of 2,470 (+12.2%) insured clients returned to employment after participating in an EBSM-similar intervention. Unpaid EI benefits decreased from $7.13 million to $6.66 million, a 6.5% decline year-over-year. EBSM total expenditures reached $27.7 million (+8.3%). In addition to the province's share of the ongoing 1.95 billion dollars in LMDA program funding ($24.1 million), expenditures included its share of the additional $225.0 million envelope announced in Budget 2017 ($2.1 million). Expenditures also included the additional targeted funding provided to support workers in seasonal industries ($500,000), as well as those affected by the trade disputes in the forest sector ($500,000), and the steel and aluminum industries ($500,000).
Investments in targeted funding supported workers directly and indirectly affected by the lumber and steel-aluminum trade disputes to transition to sustainable employment through wage subsidies and training. In addition, the province received an allocation of $525,000 to support workers impacted by the seasonal nature of employment in a number of PEI's key sectors.

Chart 7 – Text version
| Client | FY0809 | FY0910 | FY1011 | FY1112 | FY1213 | FY1314 | FY1415 | FY1516 | FY1617 | FY1718 | FY1819 |
|---|---|---|---|---|---|---|---|---|---|---|---|
| Active clients | 3,035 | 2,740 | 2,882 | 2,921 | 3,032 | 2,963 | 2,709 | 2,876 | 2,798 | 3,487 | 3,624 |
| Former clients | 512 | 487 | 572 | 574 | 708 | 703 | 621 | 657 | 709 | 784 | 712 |
| PPE | n/a | n/a | n/a | n/a | n/a | n/a | n/a | n/a | n/a | n/a | 438 |
| Non-insured clients | 1,072 | 885 | 1,071 | 1,340 | 1,316 | 1,285 | 1,470 | 1,681 | 1,893 | 1,852 | 1,595 |

Chart 8 – Text version
| Age | FY0809 | FY0910 | FY1011 | FY1112 | FY1213 | FY1314 | FY1415 | FY1516 | FY1617 | FY1718 | FY1819 |
|---|---|---|---|---|---|---|---|---|---|---|---|
| Youth (15 to 24) | 1,060 | 950 | 1,124 | 1,202 | 1,265 | 1,259 | 1,276 | 1,456 | 1,542 | 2,309 | 2,488 |
| Core-age (25 to 54) | 2,784 | 2,504 | 2,705 | 2,937 | 3,023 | 2,920 | 2,776 | 2,954 | 3,137 | 3,072 | 2,943 |
| Older workers (55+) | 323 | 275 | 312 | 364 | 446 | 463 | 438 | 508 | 458 | 499 | 507 |
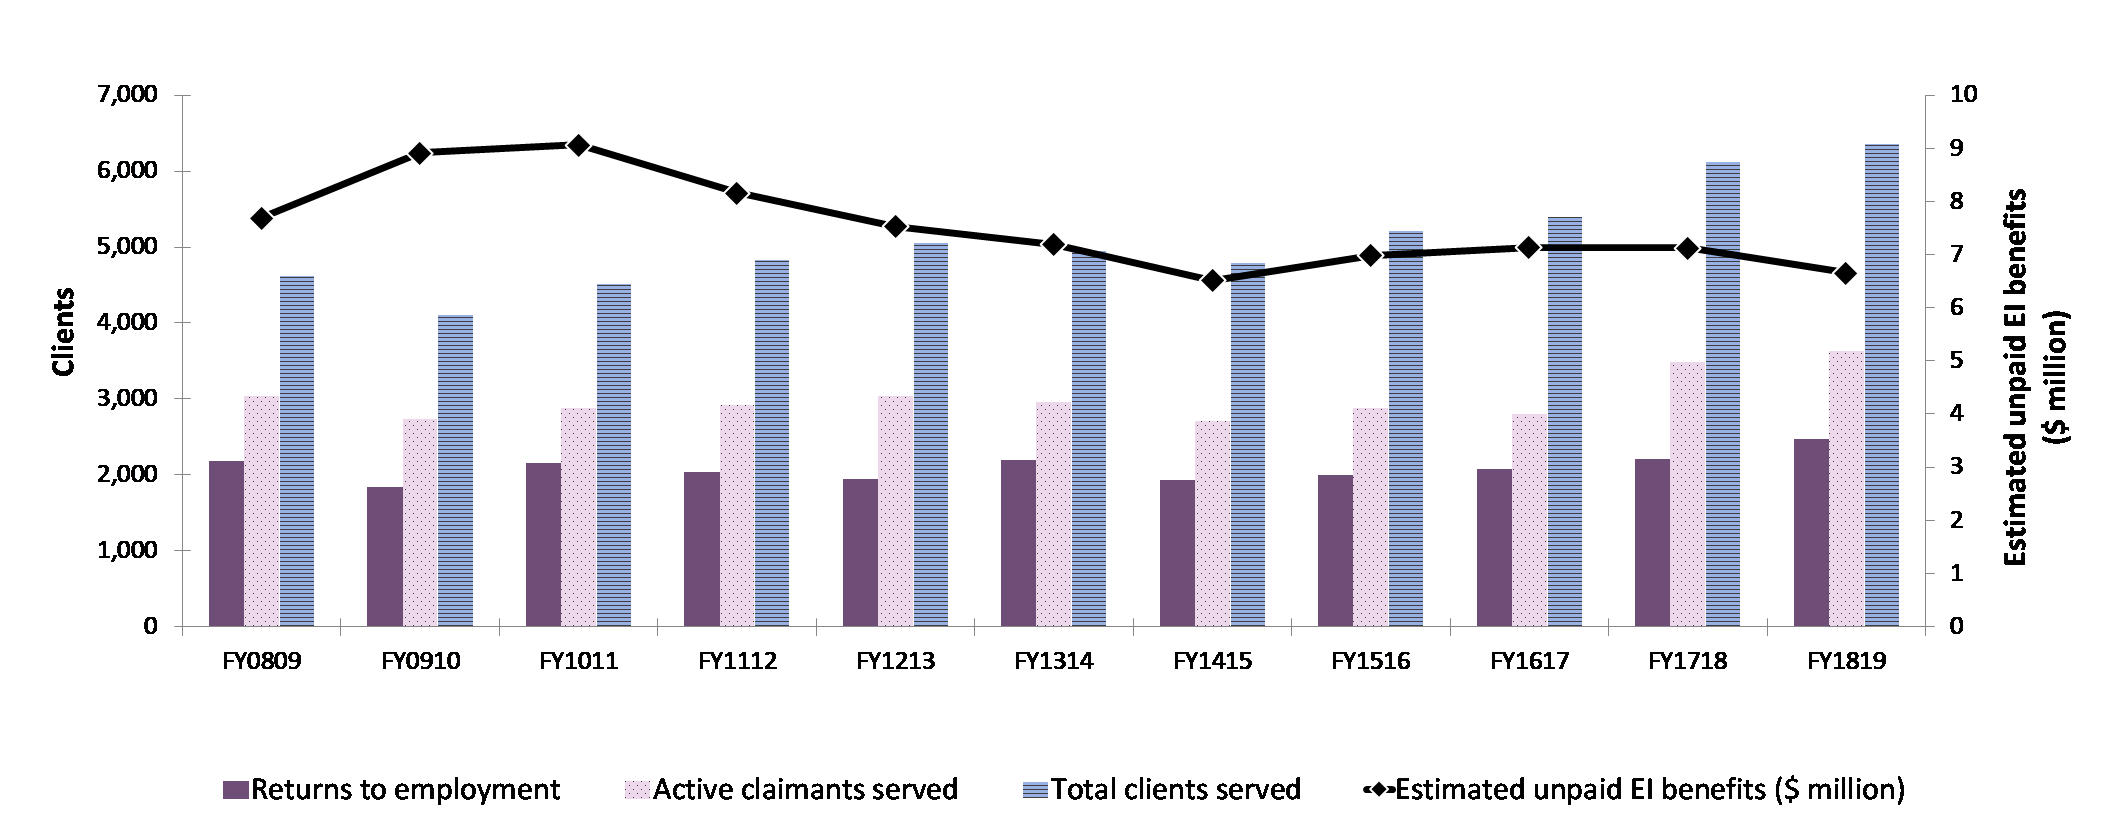
Chart 9 – Text version
| Key performance indicators | FY0809 | FY0910 | FY1011 | FY1112 | FY1213 | FY1314 | FY1415 | FY1516 | FY1617 | FY1718 | FY1819 |
|---|---|---|---|---|---|---|---|---|---|---|---|
| Returns to employment | 2,186 | 1,839 | 2,159 | 2,034 | 1,939 | 2,194 | 1,934 | 1,997 | 2,081 | 2,202 | 2,470 |
| Active claimants served | 3,035 | 2,740 | 2,882 | 2,921 | 3,032 | 2,963 | 2,709 | 2,876 | 2,798 | 3,487 | 3,624 |
| Total clients served | 4,619 | 4,112 | 4,525 | 4,835 | 5,056 | 4,951 | 4,800 | 5,214 | 5,400 | 6,123 | 6,369 |
| Estimated unpaid EI benefits ($ million) | $7,69 | $8,92 | $9,07 | $8,16 | $7,53 | $7,19 | $6,52 | $6,99 | $7,14 | $7,13 | $6,66 |
Table 7 - Prince Edward Island: EBSM-similar programming, FY1819
For accessibility reasons, the table has been simplified. Consult the PDF version for the full table.
| Employment benefits | Interventions | Year-over-year Change |
Expenditures ($ 000s) |
|---|---|---|---|
| SD-R: Training PEI—Individual | 2,398 | +13.0% | 14,923 |
| SD-A: Training PEI—Apprentice | 305 | +14.2% | |
| TWS: Employ PEI | 562 | -19.3% | 3,696 |
| SE: Self‑Employ PEI | 151 | +3.4% | 1,986 |
| JCP: Work Experience PEI | 59 | -1.7% | 734 |
| Support measures | Interventions | Year-over-year Change |
Expenditures ($ 000s) |
|---|---|---|---|
| EAS: Employment Assistance Services | 6,888 | +4.5% | 4,651 |
| LMP: Labour Market Partnerships | n/a | n/a | 1,731 |
| R&I: Research & Innovation | n/a | n/a | 0 |
3.2.3.3 Employment benefits
In FY1819, Prince Edward Island delivered 3,475 Employment Benefit interventions, a 5.6% increase over FY1718. While SD-R (+275; +13.0%), SD-A (+38; +14.2%) and SE (+5; +3.4%) increased, TWS (-134; - 19.3%) and JCP (-1; -1.7%) decreased. The significant rise in SD-R interventions since FY1718 may be attributed to the implementation of the Career Connect Program. This program provides unemployed individuals, who qualified for benefits, an opportunity to continue receiving benefits while attending full-time, post-secondary training within Canada, for the duration of their claim. Expenditures on Employment Benefits increased from $18.8 million to $21.3 million, a 13.7% rise over FY1718.
3.2.3.4 Support measures: EAS
The province delivered 6,888 EAS interventions in FY1819, an increase of 296 (+4.5%) over the previous fiscal year. The number of individual counselling interventions in Prince Edward Island sharply increased (+1,314; +122.6%), while the number of employment services interventions decreased significantly (- 1,018; -18.4%). Expenditures on EAS decreased by $500,000 (-9.2%) to $4.7 million.
Prince Edward Island's Prosper Program
The Prosper Program provides life and employability skills training, as well as ongoing employment coaching and mentoring, to clients who received social assistance and to newcomers to Canada. Targeted clients transitioned to entry-level employment opportunities in high demand sectors, that experience shortage of workers.
The Prosper Program delivered 2 types of training supports for clients to transition into the workforce. Clients could participate in the classroom component, which focused on life and employability skills, followed by job coaching support. For participants who were ready to transition directly to the labour market, a job coach was available to provide coaching and mentoring to assist with the transition to employment.
In the first year of delivery, the program focused on employment opportunities in the agriculture sector. Based on the success of the Prosper Program over the past 3 years of delivery, the program expanded to also support the construction, tourism, and seafood processing sectors.
3.2.3.5 Other support measures: LMP and R&I
Expenditures on LMP ($1.7 million) remained relatively stable in FY1819 compared to FY1718 (+0.6%). There were no reported expenditures under R&I in FY1819.
eForcePEI.ca
The program was designed to meet specific needs of rural learners, small to medium enterprises, non-profit groups, and unemployed or under-employed individuals by providing e-learning courseware to better enhance their employability skills.
The intent of the online learning platform was to provide cost-effective and widely accessible training to businesses and individuals to increase their skills and knowledge. eForcePEI used Bluedrop's online learning platform, CoursePark.com, to provide access to courses from leading publishers and subject experts.
The short courses were mainly delivered using audio over text slides and video. The courses were not interactive and the online format was flexible for employers and employees. Course bundles (groups of related courses) covered a variety of topics. The most popular course bundle since the program started in 2013 was Microsoft Office Excel.
Targeted clientele included small and medium-sized businesses, non-profit organizations, as well as individuals interested in improving their skills and knowledge. The number of individual users and learning networks (each learning network represented a business or organization) grew steadily. As of February 2019, there were 7,000 individual users, and over 700 learning networks.
3.2.4 Nova Scotia
Similar to the situation in 2017, Nova Scotia's real GDP growth remained at 1.5% in 2018. The province's economy is projected to have expanded by about the same rate in 2019. Real GDP growth is projected at 0.8% in 2019 and 0.9% for 2020.
Nova Scotia: EBSM key facts
For accessibility reasons, the table has been simplified. Consult the PDF version for the full table.
| Insured clients | Non-insured clients |
|---|---|
| 12,408 |
3,040 |
| Intervention type | FY1819 | Year-over-year change |
|---|---|---|
| Employment Benefits | 7,136 | 72.5% |
| Support Measures: EAS | 20,232 | 24.1% |
| Intervention type | FY1819 | Year-over-year change(pp) |
|---|---|---|
| Employment Benefits | 26.1% | 12.7 |
| Support Measures: EAS | 73.9% | 12.7 |
| Total expenditures | FY1819 ($ million) |
Year-over-year change |
|---|---|---|
| Employment Benefits | $48.3 | 5.8% |
| Support Measures: EAS | $33.4 | 15.3% |
| LMP and R&I | $5.0 | 113.5% |
| Total Expenditures2 | $86.7 | 5.0% |
1 Nova Scotia invested $833,951.50 of its total allocation towards administration costs, representing 9.7% of the Budget 2017 additional funding the Province received in FY1819.
2 Totals may not add up due to rounding; does not include accounting adjustments.
| FY1718 | FY1819 | Year-over-year change |
|---|---|---|
| $23.91 | $26.43 | 10.5% |
In contrast to the modest economic growth, labour market conditions in the province improved markedly in FY1819. The employment growth of 8,500 (+1.9%), entirely realized in full-time positions, was Nova Scotia's highest annual net gain since FY0405. The decline in the number of unemployed (‑5,100; -12.6%) pushed the unemployment rate down to 7.2%, the lowest since Statistics Canada began reporting these estimates in 1976. Employment growth was concentrated in services-producing industries (+7,000; +1.9%), led by gains in accommodation and food services (+4,400; +14.2%), as well as in wholesale and retail trade (+4,000; +5.2%). These were partially offset by declines in health care and social assistance (-1,500; -2.1%), as well as in finance, insurance, real estate, rental and leasing (‑1,200; ‑5.2%). In the goods-producing sector (+1,500; +1.8%), employment growth was mainly supported by increases in construction (+1,200; +3.6%), and agriculture (+600; +13.3%).
Despite its employment growth, Nova Scotia still faces several labour market challenges moving forward. Shifts that occurred in traditionally dominant industries disproportionally impacted low-skilled workers, while Nova Scotians living outside the Halifax metropolitan area had fewer employment and education opportunities. Many young people had difficulty attaching to the labour market and filling the vacancies created by retirements. In response, the province addressed these challenges by ensuring its more vulnerable residents had the skills needed to successfully keep or gain employment. A skilled workforce will generate productivity gains that will mitigate the losses resulting from a declining workforce. Nova Scotia prioritized groups typically underrepresented in employment such as African Nova Scotians, persons with disabilities, visible minorities, persons in gender-non-traditional careers, and new immigrants to Canada.
3.2.4.1 Managing for results
Targeting, Referral and Feedback System
Nova Scotia expects to implement the Targeting, Referral, and Feedback system (TRF) by the end of FY1920. The national system identifies and refers the names of new EI claimants, based on selected targeting criteria chosen by the province. The province can then proactively reach out to offer individualized employment services to EI clients. The goal is to help job-ready EI clients return to work sooner in their EI claim, or to assist those at risk of longer term or repeated unemployment, via retraining or other more intensive services. The effect is to identify workers for rapid re-employment in high demand occupations, and to extend greater career services to improve the employability of persons in low demand occupations.
Once the EI client referrals are made to the province, the current process can be fairly labour intensive to administer. Each referral must be contacted with an invitation to visit an EAS-funded employment centre, to explore programs and services to facilitate returns to work. The dates and results of each contact must be noted, and every step is tracked and collated before it is sent back to ESDC.
With the success of Nova Scotia's Labour Market Programs Support System (LaMPSS) to administer the delivery of LMDA programs, the team from Labour and Advanced Education and LaMPSS Information Technology are examining how to integrate TRF into LaMPSS to mitigate time consuming and labour intensive processes. A project plan was developed to electronically import the referral lists from ESDC into LaMPSS, and either send automated email invitations to clients, or distribute the call list workload to the local Labour and Advanced Education Program units across the province. LaMPSS automatically watches for any client case activity when the referred EI clients register at local EAS-funded Nova Scotia Works offices, and extracts data for the feedback file. With the project plan outlined, development and implementation of system changes to LaMPSS has begun, and the roll out TRF is expected by the end of FY1920.
LaMPSS system development
The Nova Scotia LaMPSS system is constantly evolving to adapt to new and changing programs and external reporting requirements. The adaptations also increase ease of use, and better user control input at critical junctures in the program and client documentation processes.
There were 5 software releases in FY1819, implementing almost 150 enhancements targeted to strengthening program administration, and the collection of accountability reporting data. Providing the tools to assist front line delivery staff leads to more accurate and timely documentation, which in turn generates better outcomes for clients.
Accountability reporting
Aligned with continuous LaMPSS system development is the ongoing advancement of a data warehouse capacity, which allows provincial program staff to create ad hoc reports to support program delivery and development. Programs evolved in response to labour market, social and economic realities. Such information is critical for supporting informed decision making. Nova Scotia's reporting tools made advancements during FY1819 and continue to do so going forward.
Stakeholder engagement: Family Fair Hiring Policy — Job Creation Partnership
During discussions with the Indigenous organizations in Nova Scotia it was raised how some provincial employment benefit program policy, specifically the nepotism policy, can inadvertently create an additional barrier to Indigenous organizations. Indigenous communities often try to hire their members for band related employment opportunities. However, this can sometimes create conflicts with the existing nepotism clauses. Employment Nova Scotia engaged with various Indigenous stakeholders to identify the issue and possible solutions, including:
- the Mi'kmaq Economic Benefits Office (MEBO) in Sydney Nova Scotia
- the Native Council of Nova Scotia (NCNS), and
- internal stakeholders across Labour and Advanced Education, Youth Strategy, Office of Aboriginal Affairs
Results/Improvements — Under the new family hiring policy, Labour and Advanced Education (LAE) will provide incentives to employers to support the hiring of immediate family members only where it supports the employment of individuals from certain groups that are underrepresented in the labour market and where the employer has followed a fair hiring process.
Stakeholder engagement: The START wage subsidy program encourages employers to hire unemployed Nova Scotians requiring work experience
LAE Skills and Learning Branch have cycled through each funding program with Lean Six Sigma and/or program evaluations in recent years and in F71819 the START wage subsidy program was targeted.
To better understand how the program is delivered and its impacts on stakeholders, the LAE review project team gathered critical feedback from 8 in-person Lean sessions with employment Nova Scotia staff, 7 key informant interviews with past/present LAE employees who were central to the START program development/launch, collected 72 on-line surveys of EAS service provider staff that worked with wage subsidy clients, collected on-line surveys from 304 past employer participants and 370 past job seeker participants.
Most employers and job seekers generally felt that the application process was easy and they had the necessary information to apply, but a small minority had challenges in this regard.
- 90% of job seekers had a good experience with their EAS case manager
- 80% of employers were satisfied or very satisfied with the length of time from application to decision
- 91% of employers stated the program met or exceeded their expectations, but challenges were noted in some instances of difficulty filling some vacancies
- Feedback suggested increasing awareness of the program, extending the duration of the placements, broadening the eligibility criteria, and increasing financial support
- The project team developed several recommendations for the project sponsor to investigate including:
- explore improvements to the on-line application process
- develop a marketing strategy for the program
- update the LAE website and improve internal communications
- develop pre-employment preparation and soft skills training for START job seeker candidates
- revitalize the program intent and player roles/responsibilities
- improve placement monitoring and follow-up
3.2.4.2 Clients, interventions and expenditures
Nova Scotia served 15,448 clients in FY1819, 438 (-2.8%) fewer than in FY1718. Significant declines in the number of non-insured clients (-1,297; -29.9%) and former claimants (-496; -20.7%) served were partially offset by an increase in the number of active claimants served (+314; +3.4%). Active claimant shares of the total number of clients increased as well. Active claimants (61.3%) advanced by 3.7 percentage points and recorded the highest share since FY0910, while the shares of former claimants (12.3%) and non-insured clients (19.7%) dropped by 2.8 and 7.6 percentage points, respectively. A large portion of the drop in uninsured clients may be attributed to the new PPE category, which consisted of 1,041 clients (6.7% of all clients) in FY1819. Under the previous eligibility rules, these clients would likely have been considered as non-insured clients.
The number of EBSM-similar interventions decreased by 3,423 to 27,368 in FY1819, a year-over-year drop of 11.1%. A total of 5,075 insured clients returned to work after participating in an EBSM-similar program, a decrease of 9.8% over the previous fiscal year. Unpaid EI benefits rose from $23.91 million in FY1718 to $26.43 million in FY1819. EBSM total expenditures reached $86.7 million (+5.0%). In addition to the province's share of the ongoing 1.95 billion dollars in LMDA program funding ($77.4 million), some expenditures were also drawn from the additional $225 million LMDA envelope announced in Budget 2017 ($8.6 million, of which $0.8 million was used towards administration costs). The province also invested the additional targeted funding made available to support workers in seasonal industries ($1.6 million).
Overall, efforts toward addressing labour seasonality in FY1819 included the following initiatives:
- the provincial government working closely with seasonal industries including tourism, fisheries, and agriculture in recent years to better support their need to address workforce challenges. Through recent workforce studies and available labour market information, it has been determined that the tourism, fisheries, and agriculture sectors all have workers who experience unique challenges due to the cyclical nature of their work. Ongoing work with these sector and discussions with Tourism Nova Scotia, the Department of Agriculture, and the Department of Fisheries and Aquaculture have determined that training is a need
- through the LMDA-funded Sector Council Program, the Nova Scotia Tourism Human Resource Sector Council and the Nova Scotia Fisheries Human Resource Sector Council receive core funding to provide support to their respective sectors in the area of Human Resource recruitment, attraction, retention, and training
- the Federation of Agriculture has also been working closely with the province in seeking support with their current workforce-related issues and they are currently preparing to submit their application under the Sector Council Program in FY1920
- the LMDA's targeted funding will allow for the provision of skills training to those most in need in these sectors and allow them to increase their employability skills, essential skills, and technical skills
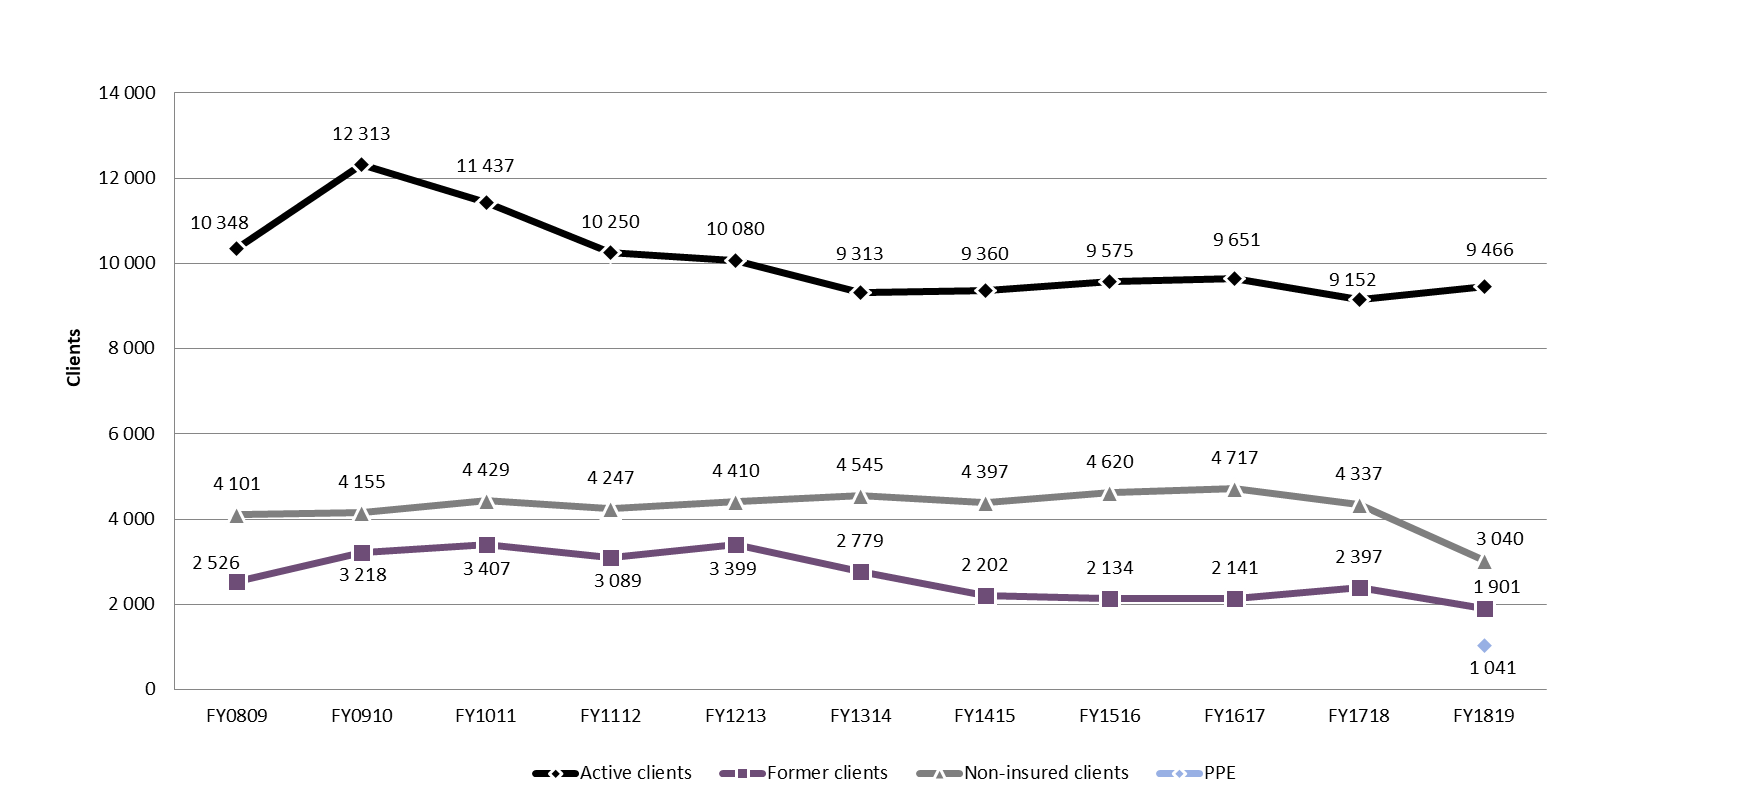
Chart 10 – Text version
| Client type | FY0809 | FY0910 | FY1011 | FY1112 | FY1213 | FY1314 | FY1415 | FY1516 | FY1617 | FY1718 | FY1819 |
|---|---|---|---|---|---|---|---|---|---|---|---|
| Active clients | 10,348 | 12,313 | 11,437 | 10,250 | 10,080 | 9,313 | 9,360 | 9,575 | 9,651 | 9,152 | 9,466 |
| Former clients | 2,526 | 3,218 | 3,407 | 3,089 | 3,399 | 2,779 | 2,202 | 2,134 | 2,141 | 2,397 | 1,901 |
| PPE | n/a | n/a | n/a | n/a | n/a | n/a | n/a | n/a | n/a | n/a | 1,041 |
| Non-insured clients | 4 101 | 4 155 | 4 429 | 4 247 | 4 410 | 4 545 | 4 397 | 4 620 | 4 717 | 4 337 | 3 040 |
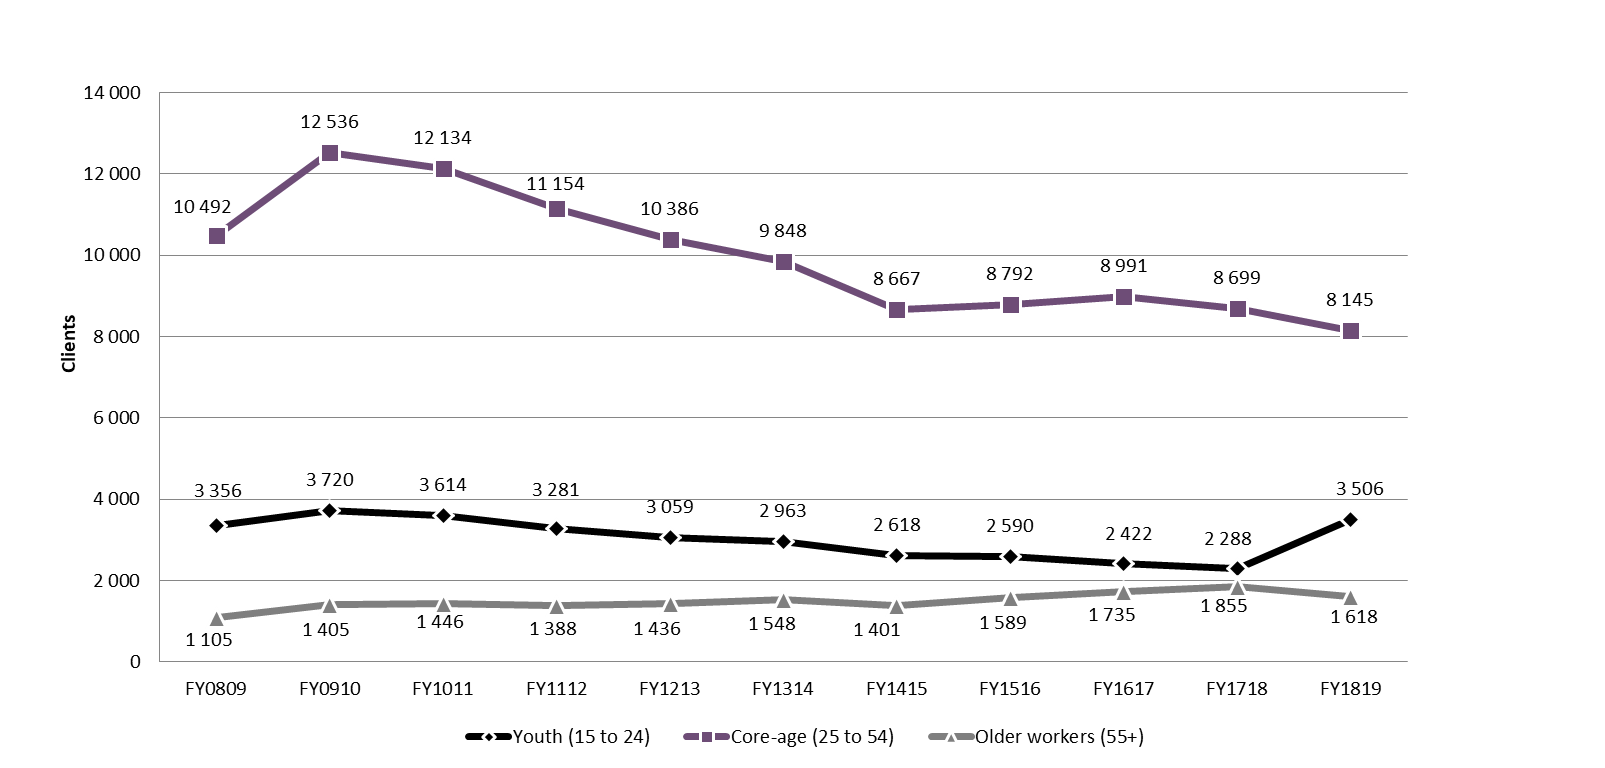
Chart 11 – Text version
| Age | FY0809 | FY0910 | FY1011 | FY1112 | FY1213 | FY1314 | FY1415 | FY1516 | FY1617 | FY1718 | FY1819 |
|---|---|---|---|---|---|---|---|---|---|---|---|
| Youth (15 to 24) | 3,356 | 3,720 | 3,614 | 3,281 | 3,059 | 2,963 | 2,618 | 2,590 | 2,422 | 2,288 | 3,506 |
| Core-age (25 to 54) | 10,492 | 12,536 | 12,134 | 11,154 | 10,386 | 9,848 | 8,667 | 8,792 | 8,991 | 8,699 | 8,145 |
| Older workers (55+) | 1,105 | 1,405 | 1,446 | 1,388 | 1,436 | 1,548 | 1,401 | 1,589 | 1,735 | 1,855 | 1,618 |
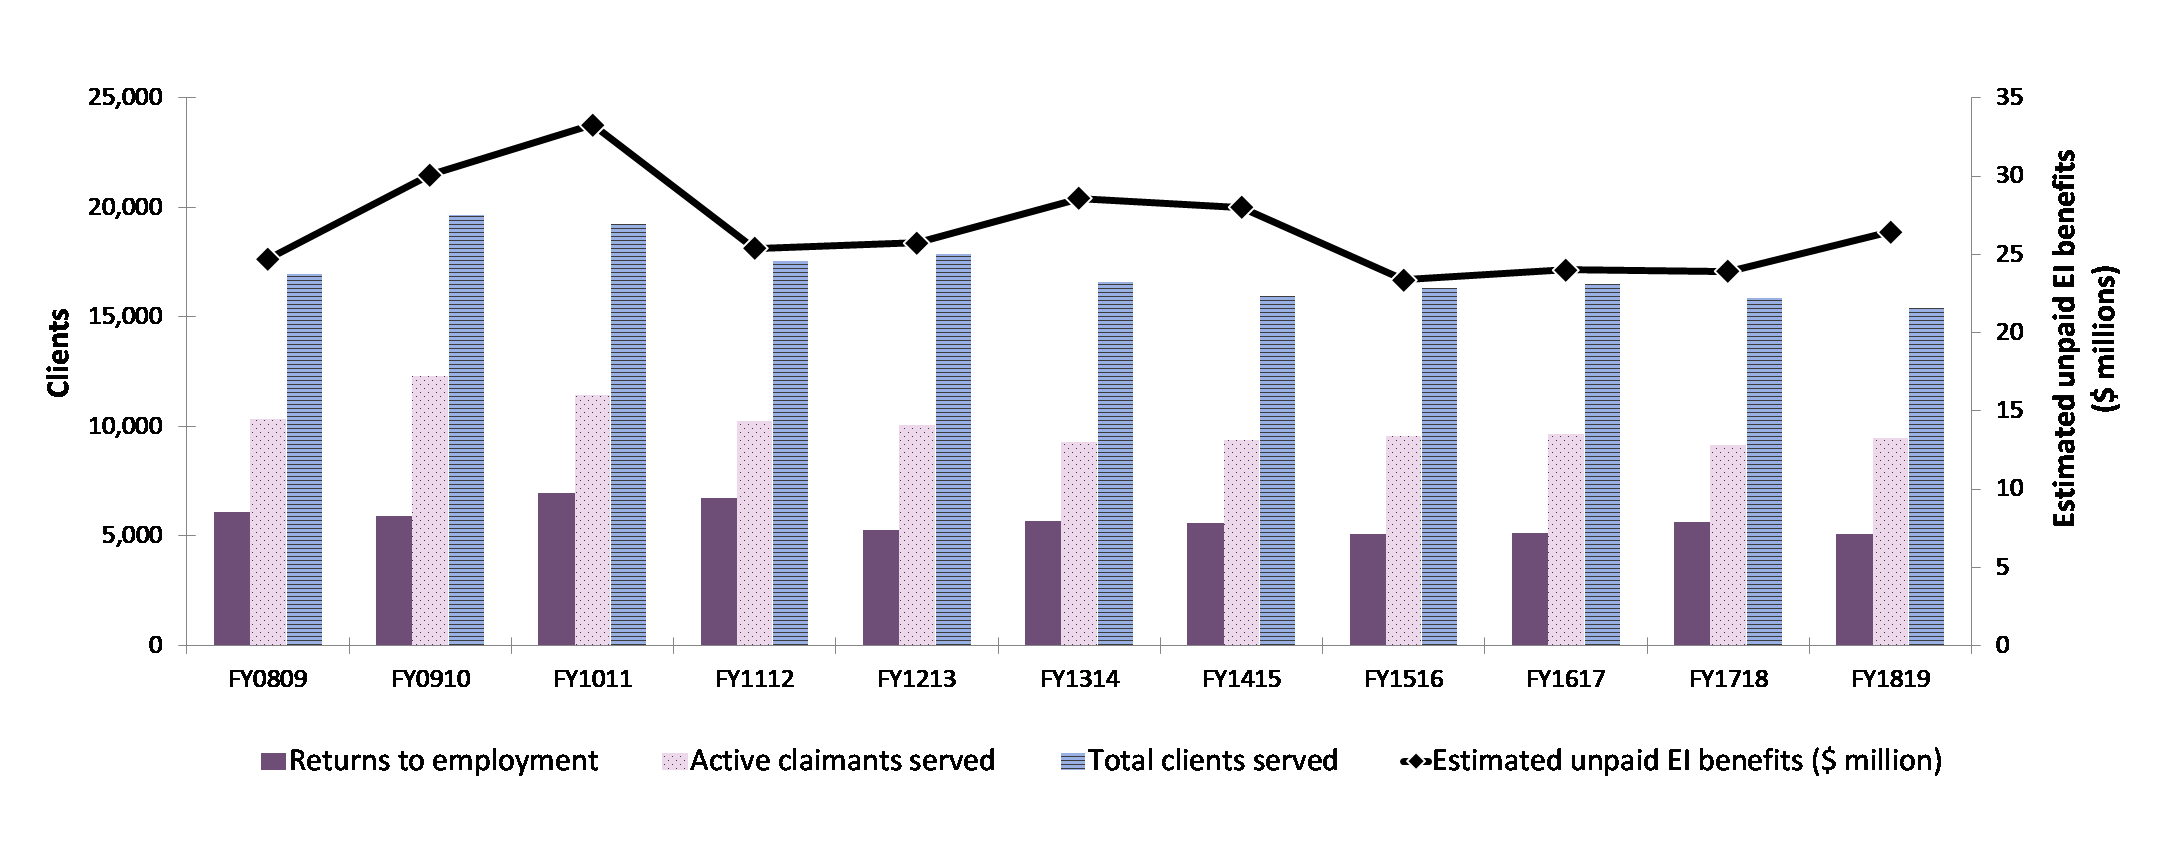
Chart 12 – Text version
| Key performance indicators | FY0809 | FY0910 | FY1011 | FY1112 | FY1213 | FY1314 | FY1415 | FY1516 | FY1617 | FY1718 | FY1819 |
|---|---|---|---|---|---|---|---|---|---|---|---|
| Returns to employment | 6,100 | 5,908 | 6,942 | 6,734 | 5,259 | 5,680 | 5,608 | 5,100 | 5,153 | 5,624 | 5,075 |
| Active claimants served | 10,348 | 12,313 | 11,437 | 10,250 | 10,080 | 9,313 | 9,360 | 9,575 | 9,651 | 9,152 | 9,466 |
| Total clients served | 16,975 | 19,686 | 19,273 | 17,586 | 17,889 | 16,637 | 15,959 | 16,329 | 16,509 | 15,886 | 15,448 |
| Estimated unpaid EI benefits ($ million) | $24,71 | $30,09 | $33,28 | $25,38 | $25,75 | $28,60 | $28,00 | $23,39 | $24,02 | $23,91 | $26,43 |
Table 8 - Nova Scotia: EBSM-similar programming, FY1819
For accessibility reasons, the table has been simplified. Consult the PDF version for the full table.
| Employment benefits | Interventions | Year-over-year change |
Expenditures ($ 000s) |
|---|---|---|---|
| SD-R: Nova Scotia Skills Development | 3,510 | +207.9% | 37,942 |
| SD-A: Nova Scotia Skills Development | 2,007 | +31.4% | |
| TWS: START | 928 | +14.7% | 3,293 |
| SE: Nova Scotia Self-Employment Benefit | 558 | +0.5% | 6,218 |
| JCP: Nova Scotia Job Creation Partnerships | 133 | +24.3% | 884 |
| Support measures | Interventions | Year-over-year change |
Expenditures ($ 000s) |
|---|---|---|---|
| EAS: Nova Scotia Employment Assistance Services | 20,232 | -24.1% | 33,414 |
| LMP: Nova Scotia Labour Market Partnerships | n/a | n/a | 4,727 |
| R&I: Research and Innovation | n/a | n/a | 267 |
3.2.4.3 Employment benefits
Nova Scotia delivered 7,136 Employment Benefit interventions in FY1819, 72.5% higher than in FY1718, the highest number in over a decade. All benefit types increased: SD-R (+2,370; +207.9%), JCP (+26; +24.3%), TWS (+119; +14.7%), SE (+3; +0.5%) and SD-A (+480; +31.4%). Expenditures on Employment Benefit interventions declined by almost $3.0 million (-5.8%) year-over-year, to $48.3 million in FY1819.
EBSMs in action: Skills Development - Nova Scotia
In March of 2017, a young woman in her early thirties came into a Nova Scotia Works (NSW) office to discuss applying for the carpentry program at NS Community College (NSCC). Her previous employment included much customer service work in various aspects.
She always had an interest in carpentry and enjoyed doing odd jobs around home. Being a female, she thought that maybe she would not be able to find work and therefore would have difficulties in pursuing this career. After a discussion with an employment counsellor, she decided to apply for the carpentry program.
She also completed her application for Skills Development and was approved for 2 years funding. She did very well throughout both years of the program, receiving a bronze medal in the NSCC Skills Competition in her second year. In June of 2019, she graduated with honours and the employer that she worked with during her summer employment and work term hired her for full-time employment upon graduation.
Now the new carpenter is expecting her first child in November and when she is ready to return to work, her job will be there for her.
This is a great success story of “Women in trades.”
The increase in Employment Benefit interventions, particularly in Skills Development, may be attributed to 2 factors.
- For several years prior to FY1819, feepayer participants were not included in the provincial data exchange. By including feepayers as LMDA participants, the SD-Regular count increased by approximately 2,100 in FY1819
- In September 2018, the Canada - Nova Scotia accountability data exchange process was overhauled, and a new XML data format was implemented. This appears to have led to some accounting discrepancies and work is still underway to identify the root causes
A woman with a disability finds a job after Skills Development training
Diana Bond is a deaf woman in her mid 30's. She was displaced from her job as a production worker in Halifax in February 2016. She struggled with seeking another job until she came to TEAM Work for support for employment services. Diana Bond had worked with her uncle occasionally on his food truck and she was interested in starting her own business. She did some research to develop a business plan and met with our self-employment services to review it. Diana Bond felt it wasn't a very reliable career plan and did further exploring on what careers would suit her. In between that time, she also attended some workshops at TEAM Work to gain knowledge on prepping for potential interviews, how to disclose disability and revising her resume. She had always had a dream of working in metal fabrication. It was suggested she apply through Women's Unlimited. She went for her orientation and was fascinated by the program and decided to enter.
She applied to the ENS Skills Development program and was supported to attend the program along with the funding support of interpreters. This accommodation was close to $60,000 over the course of her program, and without it, she would not have been able to do the program. Her confidence has boosted since she was displaced for her previous job. She completed the Women's Unlimited program and was accepted into NSCC for two years in metal fabrication. ENS also support Diana Bond with accommodations for the classroom, lab, and placements. Around Christmas 2018, Diana Bond had an interview with an employer for a work placement followed by an interview for a job in May 2019. She started the new job on June 18th working in the field in which she trained.
This was the first time Women's Unlimited had a deaf person in the program, and the result is sustainable employment and a new career. Without the Skills Development program, and the collaboration of the NSW, ENS, and NSCC partnerships, she would not have succeeded in her dream career.
3.2.4.4 Support measures: EAS
In FY1819, Nova Scotia delivered 20,232 EAS interventions, a 24.1% decrease over FY1718. All 3 EAS types dropped: group services (-874; -52.0%), individual counselling (-406; -18.0%) and employment service (-5,141; -22.6%). Overall expenditures on EAS increased by $4.4 million year-over-year, to $33.4 million in FY1819.
3.2.4.5 Other support measures: LMP and R&I
Expenditures on LMP more than doubled in FY1819 ($4.7 million) compared to FY1718 ($2.0 million), while funding of R&I initiatives declined by 23.4% year-over-year, to $0.3 million in FY1819.
EBSMs in action: Research and innovation - Nova Scotia
Labour and Advanced Education has partnered with the Centre for Employment Innovation at St. Francis Xavier University and the Phoenix Youth Employment Centre to extend the New Opportunities for Work program (NOW) to multi-barriered and under-supported youth.
The NOW Program offers an innovative approach to key labour market challenges, with both short- and long-term impacts. Participants are receiving the training and ongoing supports necessary to flourish in their new work environments, with the hope that current NOW employers will retain the employee past the 2 years, appreciating the value and experience that the employee now brings. In addition, during the program, the participants will acquire valuable job experience and skills that apply to today's job market that are transferable to other organizations.
Innovative in its design and delivery, New Opportunities for Work allows participating employment service providers to help mold the program, within the given parameters, to best suit the needs of their own clients and communities.
The NOW program also has a robust research component which includes monitoring the program from start to finish through a developmental evaluation. This research will help build capacity within the system by generating evidence-informed solutions that support front-line employment service design and delivery.
This year's investment of $267,000 will target 10 youth participants.
3.2.5 New Brunswick
Compared to 2017, New Brunswick's real GDP growth (0.1%) remained stable in 2018. The province's economy is forecasted to have slightly strengthened in 2019, by close to 1.0%.
New Brunswick: EBSM key facts
For accessibility reasons, the table has been simplified. Consult the PDF version for the full table.
| Insured clients | Non-insured clients |
|---|---|
| 13,977 |
7,550 |
| Intervention type | FY1819 | Year-over-year change |
|---|---|---|
| Employment Benefits | 12,764 | 9.2% |
| Support Measures: EAS | 28,334 | 13.1% |
| Intervention type | FY1819 | Year-over-year change(pp) |
|---|---|---|
| Employment Benefits | 31.1% | 4.7 |
| Support Measures: EAS | 68.9% | 4.7 |
| Total expenditures | FY1819 ($ million) |
Year-over-year change |
|---|---|---|
| Employment Benefits | $78.1 | 5.1% |
| Support Measures: EAS | $7.7 | 27.4% |
| LMP and R&I | $12.4 | 29.2% |
| Total Expenditures1 | $98.2 | 3.9% |
1 Totals may not add up due to rounding; does not include accounting adjustments.
| FY1718 | FY1819 | Year-over-year change |
|---|---|---|
| $29.14 | $25.00 | 14.2% |
Labour market conditions in New Brunswick were relatively steady in FY1819, compared to the previous year. Employment grew slightly (+1,700; +0.5%) at about the same rate as the labour force and working-age population, leaving the participation and employment rates unchanged from the previous year, at 61.4% and 56.5% respectively. The province's unemployment rate edged down from 8.0% to 7.9%, the lowest in a decade. Employment growth was entirely realized in the services-producing sector (+2,000; +0.7%), while employment in the goods-producing sector declined slightly (‑300; -0.4%). On the services-producing side, gains in public administration (+2,100; +9.0%), information, culture and recreation (+1,700; +15.8%), as well as in transportation and warehousing (+1,000; +5.8%), were partially offset by losses in wholesale and retail trade (-3,000; -5.3%), as well as in accommodation and food services (-700; -3.0%). A net increase of 2,800 jobs (+21.2%) in the natural resources industries (comprising agriculture, forestry, fishing, mining, quarrying, oil and gas) were more than offset by losses in construction (-1,600; -6.5%) and manufacturing (-1,400; -4.2%) in the goods-producing sector.
New Brunswick's economy and labour force continued to face on going demographic challenges such as slow population growth, an aging population and out-migration of youth and skilled workers. The province also continued to experience a high unemployment rate relative to the rest of Canada. Although relatively poor economic and workforce growth is expected over the short-term, high replacement demand stemming primarily from retirements is resulting in a significant number of job vacancies to fill. It is therefore important for the province to continue to attract, retain and educate a highly skilled workforce. To ensure New Brunswick is responsive to these labour market challenges and opportunities, the province continued to:
- collaborate with employers and workers to respond and support them in addressing their workforce and training needs
- promote and increase adult literacy, essential skills and continuous learning
- increase participation in post-secondary education
- improve access to and dissemination of relevant labour market information, and
- invest in innovative programs and services including workplace learning, on the job training and upskilling employees
3.2.5.1 Managing for results
Stakeholder Engagement
In FY1819 the Department of Post-Secondary Education Training and Labour began piloting the Human Resource Support Services program (HRSS). The program assists employers in assessing their human resource needs, recommends options and supports their implementation. This program also helps employers with the management of their human resources within their business, which includes attracting and retaining the right people to meet operational needs. Intervention plans developed with employers identify options/solutions that are adapted and responsive to needs in line with labour market realities. The HRSS program has been beneficial to employers throughout New Brunswick and will be fully launched in FY2021.
New Brunswick's ongoing consultations take place under the Province's HRSS programming. The province engages with a diverse group of employers, labour market related associations and community organizations.
3.2.5.2 Clients, interventions and expenditures
In FY1819, New Brunswick served 21,527 clients, 1,301 (-5.7%) fewer than in FY1718. Aside from PPE clients, all other client type counts declined: active claimants (-915; -8.1%), non-insured clients (-860; - 10.2%) and former claimants (-853; -27.4%). The drop in the number of uninsured clients is mostly attributable to the new PPE category, whose 1,327 clients in FY1819 likely counted towards non-insured clients under previous eligibility rules. As for the shares of the total number of clients served, all client types declined as a result of lower volumes and the new PPE category, which accounted for 6.2% of all clients. Between FY1718 and FY1819, the proportions of active claimants (48.3%), non-insured (35.1%), and former claimants (10.5%) dropped by 1.3, 1.8 and 3.1 percentage points, respectively.
New Brunswick delivered 41,098 EBSM-similar interventions in FY1819, a decline of 7.2% (- 3,209) over the previous year. Following the same trend, the number of insured clients who returned to work after participating in an EBSM-similar intervention declined 8.7% from 8,800 in FY1718, to 8,031 in FY1819. Unpaid EI benefits amounted to $25.00 million in FY1819, down from $29.14 million in FY1718. Expenditures on EBSMs rose to $98.2 million (+$3.7 million, +3.9%) in FY1819. These expenditures include the province's shares of the ongoing $1.95 billion LMDA program funding ($89.2 million) and the $225.0 million envelope in additional funding announced in Budget 2017 ($9.0 million).
In addition to these expenditures, $3.7 million in additional targeted funding was made available to support workers in seasonal industries and workers affected by trade disputes in the steel and aluminum industries, and the forest sector, which the province did not access.

Chart 13 – Text version
| Client | FY0809 | FY0910 | FY1011 | FY1112 | FY1213 | FY1314 | FY1415 | FY1516 | FY1617 | FY1718 | FY1819 |
|---|---|---|---|---|---|---|---|---|---|---|---|
| Active clients | 11,315 | 13,895 | 12,076 | 10,459 | 9,365 | 9,070 | 8,596 | 10,411 | 11,386 | 11,302 | 10,387 |
| Former clients | 2,303 | 3,064 | 2,741 | 2,365 | 2,334 | 2,592 | 2,393 | 2,885 | 2,859 | 3,116 | 2,263 |
| PPE | n/a | n/a | n/a | n/a | n/a | n/a | n/a | n/a | n/a | n/a | 1,327 |
| Non-insured clients | 3,512 | 5,679 | 5,001 | 4,217 | 3,844 | 4,876 | 4,838 | 6,365 | 8,347 | 8,410 | 7,550 |
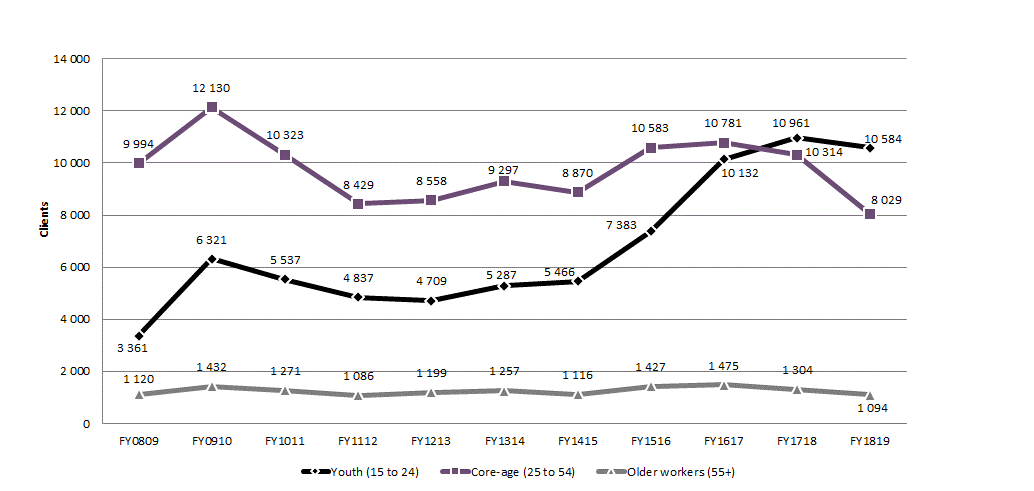
Chart 14 – Text version
| Age | FY0809 | FY0910 | FY1011 | FY1112 | FY1213 | FY1314 | FY1415 | FY1516 | FY1617 | FY1718 | FY1819 |
|---|---|---|---|---|---|---|---|---|---|---|---|
| Youth (15 to 24) | 3,361 | 6,321 | 5,537 | 4,837 | 4,709 | 5,287 | 5,466 | 7,383 | 10,132 | 10,961 | 10,584 |
| Core-age (25 to 54) | 9,994 | 12,130 | 10,323 | 8,429 | 8,558 | 9,297 | 8,870 | 10,583 | 10,781 | 10,314 | 8,029 |
| Older workers (55+) | 1,120 | 1,432 | 1,271 | 1,086 | 1,199 | 1,257 | 1,116 | 1,427 | 1,475 | 1,304 | 1,094 |
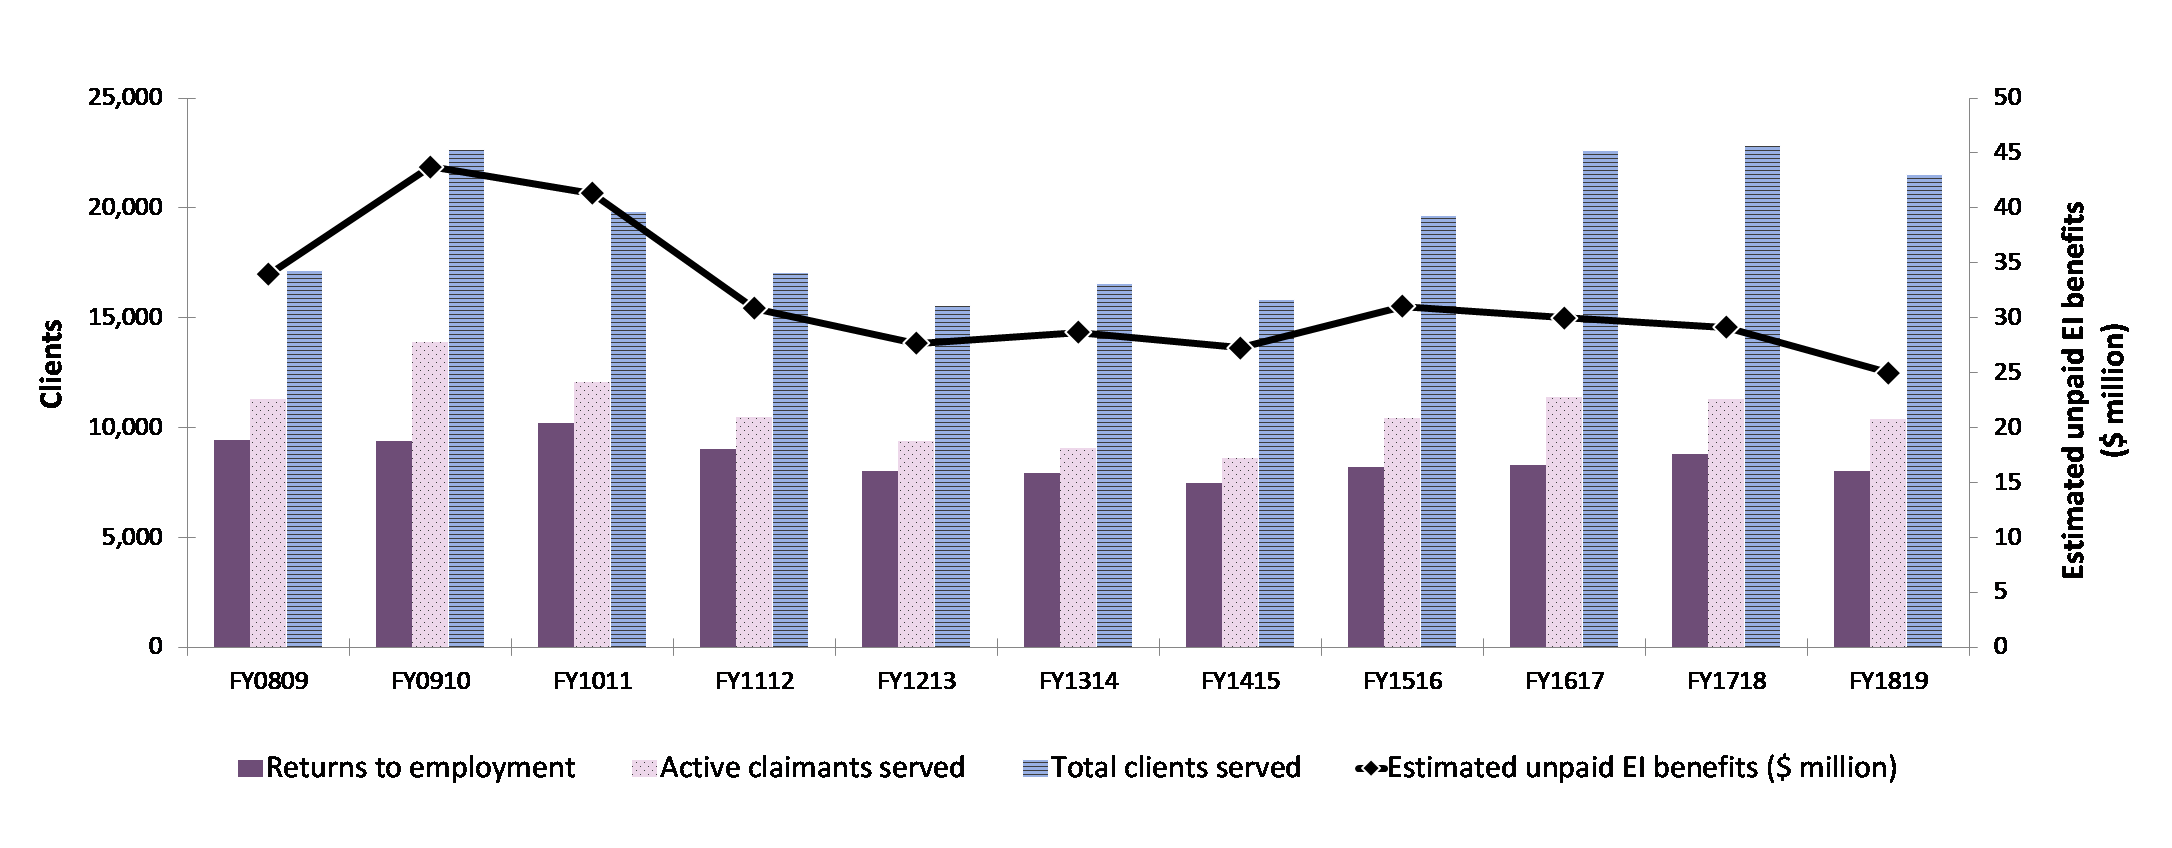
Chart 15 – Text version
| Key performance indicators | FY0809 | FY0910 | FY1011 | FY1112 | FY1213 | FY1314 | FY1415 | FY1516 | FY1617 | FY1718 | FY1819 |
|---|---|---|---|---|---|---|---|---|---|---|---|
| Returns to employment | 9,422 | 9,367 | 10,193 | 9,017 | 8,015 | 7,927 | 7,471 | 8,179 | 8,300 | 8,800 | 8,031 |
| Active claimants served | 11,315 | 13,895 | 12,076 | 10,459 | 9,365 | 9,070 | 8,596 | 10,411 | 11,386 | 11,302 | 10,387 |
| Total clients served | 17,130 | 22,638 | 19,818 | 17,041 | 15,543 | 16,538 | 15,827 | 19,661 | 22,592 | 22,828 | 21,527 |
| Estimated unpaid EI benefits ($ million) | $33,95 | $43,73 | $41,33 | $30,85 | $27,65 | $28,67 | $27,25 | $31,02 | $30,01 | $29,14 | $25,00 |
Table 9 - New Brunswick: EBSM-similar programming, FY1819
For accessibility reasons, the table has been simplified. Consult the PDF version for the full table.
| Employment benefits | Interventions | Year-over-year change |
Expenditures ($ 000s) |
|---|---|---|---|
| SD-R: Training and Skills Development Program | 7,208 | +4.8% | 56,047 |
| SD-A: Training and Skills Development Program | 2,054 | -6.9% | |
| TWS: Workforce Expansion—Employer Wage Subsidy | 3,254 | +41.9% | 16,883 |
| SE: Workforce Expansion—Self-Employment Benefit | 248 | -21.3% | 5,202 |
| Support measures | Interventions | Year-over-year change |
Expenditures ($ 000s) |
|---|---|---|---|
| EAS: Employment Assistance Services | 28,334 | -13.1% | 7,656 |
| LMP: Adjustment Services | n/a | n/a | 12,073 |
| R&I: Research and Innovation | n/a | n/a | 294 |
3.2.5.3 Employment benefits
The province delivered 12,764 Employment Benefit interventions in FY1819, 9.2% (+1,072) more than in FY1718 and the highest since FY0910. Increases in TWS (+961; +41.9%) and SD-R (+331; +4.8%) were partially offset by declines in SE (-67; -21.3%), and SD-A (-153; -6.9%). Expenditures on Employment Benefits increased by 5.1% (+$3.8 million) in FY1819, for a total of $78.1 million.
3.2.5.4 Support measures: EAS
New Brunswick delivered fewer EAS interventions in FY1819 compared to FY1718, for a total of 28,334 (‑4,281; -13.1%). Both intervention types declined year-over-year: individual counselling decreased by 15.1% (-3,450) while employment services dropped by 8.5% (- 831). The province spent $7.7 million on EAS interventions in FY1819, a 27.4% (-$2.9 million) decline compared to the previous year. This shift was due to funding some EAS contracts through the Workforce Development Agreement that were previously funded under the LMDA.
Youth Employment Fund helps Flo to find a suitable job
Often one of the critical elements for successfully assisting clients to secure employment when they have faced an extended period of difficulty is simply matching the right employee with the right employer. Over a year and a half ago, a young lady named Flo stopped into a provincial office feeling somewhat hopeless of finding meaningful employment. She had plenty of marketable skills andheld a degree in Electrical Engineering but had struggled to secure any meaningful employment. She had a very strong resume with work on past projects bolstering her educational experience. Flo seemed to be able to secure the interviews but received no job offers. This had not always been the case, Flo had success in securing jobs just a couple years prior. Flo felt that her recent decision to transition from a man to a woman was having an impact. She felt that the field no longer suited her and just wanted a new start. During a discussion with the provincial office, she realized that she had an interest in MAME Emulators and restoration of old arcade games. She also had some strong computer skills as well as a flare for digital media. It was clear that an IT job with a digital marketing might be a nice fit. The office connected Flo with a local employer who would see the obvious strengths she possessed and assisted her with development of a great pitch for a job with this dual designation of IT & digital marketing. The business was an insurance company and real estate brokerage. The owner Brandon liked the idea and with the option of the Youth Employment Fund to assist with the initial training period for Flo she was able to start a full-time position earning a good wage and it remains a career to this day. Flo was really pleased with the job and loved the staff right from the get go, this position not only provided her with employment but a renewed sense of confidence in her value after a period of self-doubt. These are the ones that make it all worthwhile.
3.2.5.5 Other support measures: LMP and R&I
Expenditures on LMP totalled $12.1 million in FY1819, the highest the province spent on this measure, while funding of R&I initiatives was cut by half in FY1819, dropping to $300,000 from $600,000 in FY1718.
3.2.6 Quebec
The Quebec economy grew by 2.5% in real terms in 2018, surpassing the national average of 2.0%. Forecasters expect Quebec's real GDP growth to be more moderate in 2019, around 2.0%, which is still above the projected national average of 1.4%.
Quebec: EBSM key facts
For accessibility reasons, the table has been simplified. Consult the PDF version for the full table.
| Insured clients | Non-insured clients |
|---|---|
| 156,514 |
58,228 |
| Intervention type | FY1819 | Year-over-year change |
|---|---|---|
| Employment Benefits | 33,210 | 7.3% |
| Support Measures: EAS | 237,373 | 13.6% |
| Intervention type | FY1819 | Year-over-year change(pp) |
|---|---|---|
| Employment Benefits | 12.3% | 2.2 |
| Support Measures: EAS | 87.7% | 2.2 |
| Total expenditures | FY1819 ($ million) |
Year-over-year change |
|---|---|---|
| Employment Benefits | $335.0 | 3.5% |
| Support Measures: EAS | $146.1 | 1.8% |
| LMP and R&I | $117.4 | 6.3% |
| Total Expenditures1 | $598.6 | 2.7% |
1 Totals may not add up due to rounding; does not include accounting adjustments.
| FY1718 | FY1819 | Year-over-year change |
|---|---|---|
| $327.62 | $293.92 | 10.3% |
Compared with the previous fiscal year, Quebec's labour force remained relatively stable at 4,518,500 (+0.3%). Overall, employment (+0.7%) increased somewhat from 4,242,500 to 4,273,000, while the unemployment rate (5.4%) fell 0.4 percentage points.
From one year to the next, employment levels remained relatively stable in the goods-producing sector (+2,600; +0.3%) with net gains in forestry, fishing and mining (+4,200; 11.4%), construction (+3,300; +1.3%) and utilities (+3,100; 12.5%). However, agriculture (-1,100; -1.9%) and manufacturing (-6,800; -1.4%) slowed somewhat. In the service sector, employment increased (+27,900; +0.8%), with growth in transportation and warehousing (+7,900; +3.7%), professional, scientific and technical services (+4,400; +1.3%), business, building and other support services (+11,400; +6.2%), educational services (+5,500; +1.9%) and health care and social assistance (+12,500; +2.1%). This increase was partially offset by net losses in information, culture and recreation (-9,400; -5.1%) and accommodation and food services (-3,800; -1.4%).
As in previous fiscal years, Quebec faced a labour shortage and challenges related to matching training, skills, and jobs in FY1819. This is the result of 2 factors: the demographic decline in the population aged 15 to 64 and the increase in the number of jobs. Consequently, employers will have difficulty recruiting qualified candidates for available positions in the short term.
To resolve this situation, employers are being asked to adapt their human resources processes with the goal of leveraging the employment potential of the entire available workforce to the fullest extent possible to meet the needs of the labour market. They may moderate their recruitment criteria, improve staff training, emphasize diversity, improve workforce retention or adapt their working conditions, among other things.
Furthermore, in order to maintain the competitiveness of its businesses, Quebec will continue to invest in the training of its workforce to meet current and future labour market needs.
For FY1819, Quebec placed particular emphasis on the integration and participation of people from groups that are under-represented in the labour market:
- people with low skills
- persons with disabilities
- people aged 55 and over
- recent immigrants
- Indigenous persons
- youth, and
- people in the justice system
In order to effectively address the numerous challenges in the labour market, Quebec focused its interventions on 5 strategic orientations during FY1819:
- expand knowledge of qualitative and quantitative labour market imbalances
- accelerate employment integration for people ready to enter the labour market, in particular through support for skills development
- encourage the hiring of members of groups underrepresented in the labour market and clients of social assistance programs, in particular through support for skills development
- contribute to structuring and adapting human resources management in companies, encouraging them to improve productivity, and
- adapt service delivery, in collaboration with all partners, to the evolving context of intervention and to the needs of individuals and businesses.
These tools will enable Quebec to improve the employment rate by hiring people who are unemployed and improving companies' productivity and ability to adapt.
In January 2019, the Ministère du Travail, de l'Emploi et de la Solidarité sociale (MTESS) launched “La Grande corvée” initiative to support businesses experiencing difficulties with filling positions. Quebec plans to support an increasing number of businesses as they face new challenges related to labour shortages. As of March 31, 2019, nearly 4,800 businesses had been proactively contacted by public employment services. Systematic canvassing enabled Quebec to increase the number of businesses that were assisted for the first time during FY1819.
3.2.6.1 Partnership and Managing for Results
To ensure that it can respond adequately and quickly to the needs of the labour market, Quebec has a partnership structure that is unique in Canada. In terms of planning, the Commission des partenaires du marché du travail (CPMT), which brings together employer and union representatives from the education sector and community organizations, works with the MTESS to guide public employment services so that they meet the needs expressed by all partners. This collaboration involves the joint development of an annual action plan for labour and employment.
The management and delivery of public employment services are planned in a decentralized manner to better adapt to the needs of regional labour markets and local clienteles. Thus, while complying with the major orientations of Quebec's overall action plan, the regional offices of Services Québec are autonomous in their use of the measures in the range of employment services, the implementation of strategies and the management of their intervention budget. As a result, their use may differ from one region to another, depending on the priorities and characteristics of the territory.
Throughout Quebec, public employment services interventions are delivered according to a results-based management approach. Quebec's overall action plan provides annual targets for targeted results indicators, and regional offices specify their contribution in their regional action plan for employment and labour. This management method makes it possible to deliver effective interventions and assess concrete results, particularly with respect to the return to employment of persons who have benefited from public employment services.
Through the MTESS, Quebec continues to rely on its targeting, referral, and feedback (TRF) system, which enables it to undertake proactive intervention with Employment Insurance applicants. Set up jointly with the federal government and used since 1999, the TRF system has proven its effectiveness and is currently being implemented in other parts of Canada.
Employment interventions are delivered in partnership with organizations specializing in employability development that have signed service agreements with the regional offices of Services Québec and economic development organizations. This complements the activities of public employment services and offers businesses and the public a variety of services based on their needs. The agreements with service provider partners include results-based objectives. These organizations are also instrumental in leading public employment services to innovate their service delivery.
3.2.6.2 Clients, interventions and expenditures
During FY1819, Quebec served a total of 214,742 clients, a decrease of 10.7% year over year. These decreases, which affected the 3 main types of clients, are mainly explained by the strength of the Quebec labour market in recent years, which has experienced a historically low unemployment rate. For a third consecutive year, the number of active clients declined to 116,261 (-8.9%) in FY1819. Former claimants (23,005) and non-insured clients (58,228) fell by 30.2% and 27.0% respectively. For the first time, Quebec reported the number of “clients with eligibility based on contributions paid” (new PPE category) at 17,248. In terms of the volume of client types in relation to the total number of clients served, the proportion of active clients (54.1%) increased by 1.0 percentage point compared to the previous year. The proportion of former claimants (10.7%) and non-insured clients (27.1%) declined by 3.0 and 6.1 percentage points respectively, year over year. The share of clients with eligibility based on contributions paid was 8.0%. The decline in the proportion of non-insured clients may be attributable to the new PPE category.
The total number of interventions in FY1819, 270,583, decreased by 11.5% compared to FY1718. Although it was the most used of all EBSM interventions, the proportion of Employment Assistance Services (EAS) (87.7%) declined by 2.2 percentage points, while the proportion of Employment Benefits was 12.3% (+2.2 percentage points).
A total of 74,535 clients (+8.3%) found employment after participating in a program similar to EBSM. This was the sixth consecutive year that this number has increased. Unpaid benefits from the EI Operating Account declined 10.3% to $293.92 million. In total, EBSM expenditures of $598.6 million were 2.7% higher than the previous fiscal year.Footnote 14 This includes $29.2 million additional targeted funding in Quebec to support workers in seasonal industries ($8.0 million), as well as those affected by tariffs in the softwood lumber ($14.7 million) and steel and aluminum ($6.6 million) sectors.
In order to quickly provide support to laid-off seasonal workers, Quebec and the Federal Government signed the Canada-Quebec Agreement in Support of Seasonal Workers in Quebec in May 2018. A pilot project providing workers with training employed in a company with seasonal activities or are unemployed, and enhanced income support for those who are unemployed was implemented in the spring of 2018. Enhanced funding is also provided to seasonal businesses that train their workers, with a 100% rate of reimbursement of training expenses and salaries to businesses.

Chart 16 – Text version
| Client | FY0809 | FY0910 | FY1011 | FY1112 | FY1213 | FY1314 | FY1415 | FY1516 | FY1617 | FY1718 | FY1819 |
|---|---|---|---|---|---|---|---|---|---|---|---|
| Active clients | 127,027 | 138,274 | 130,782 | 121,089 | 119,771 | 147,396 | 140,026 | 146,359 | 138,682 | 127,614 | 116,261 |
| Former clients | 23,893 | 24,970 | 23,288 | 25,099 | 25,081 | 26,779 | 24,986 | 26,946 | 26,945 | 32,965 | 23,005 |
| PPE | n/a | n/a | n/a | n/a | n/a | n/a | n/a | n/a | n/a | n/a | 17,248 |
| Non-insured clients | 37,408 | 42,167 | 37,859 | 47,049 | 54,519 | 63,162 | 64,769 | 79,814 | 84,716 | 79,764 | 58,228 |
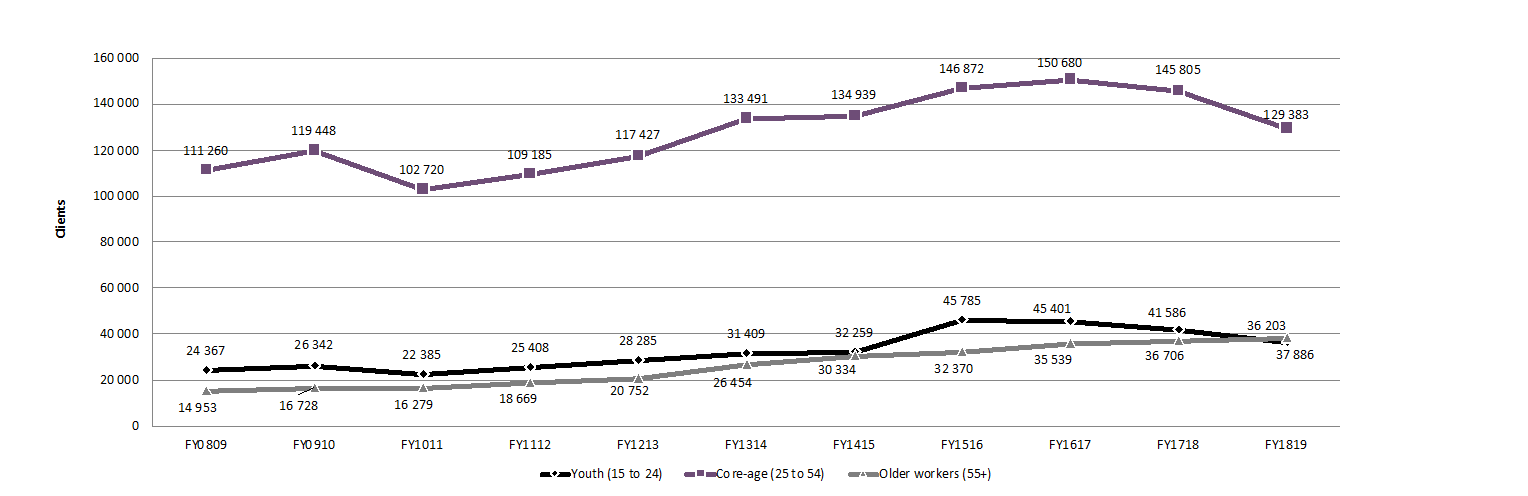
Chart 17 – Text version
| Age | FY0809 | FY0910 | FY1011 | FY1112 | FY1213 | FY1314 | FY1415 | FY1516 | FY1617 | FY1718 | FY1819 |
|---|---|---|---|---|---|---|---|---|---|---|---|
| Youth (15 to 24) | 24,367 | 26,342 | 22,385 | 25,408 | 28,285 | 31,409 | 32,259 | 45,785 | 45,401 | 41,586 | 36,203 |
| Core-age (25 to 54) | 111,260 | 119,448 | 102,720 | 109,185 | 117,427 | 133,491 | 134,939 | 146,872 | 150,680 | 145,805 | 129,383 |
| Older workers (55+) | 14,953 | 16,728 | 16,279 | 18,669 | 20,752 | 26,454 | 30,334 | 32,370 | 35,539 | 36,706 | 37,886 |
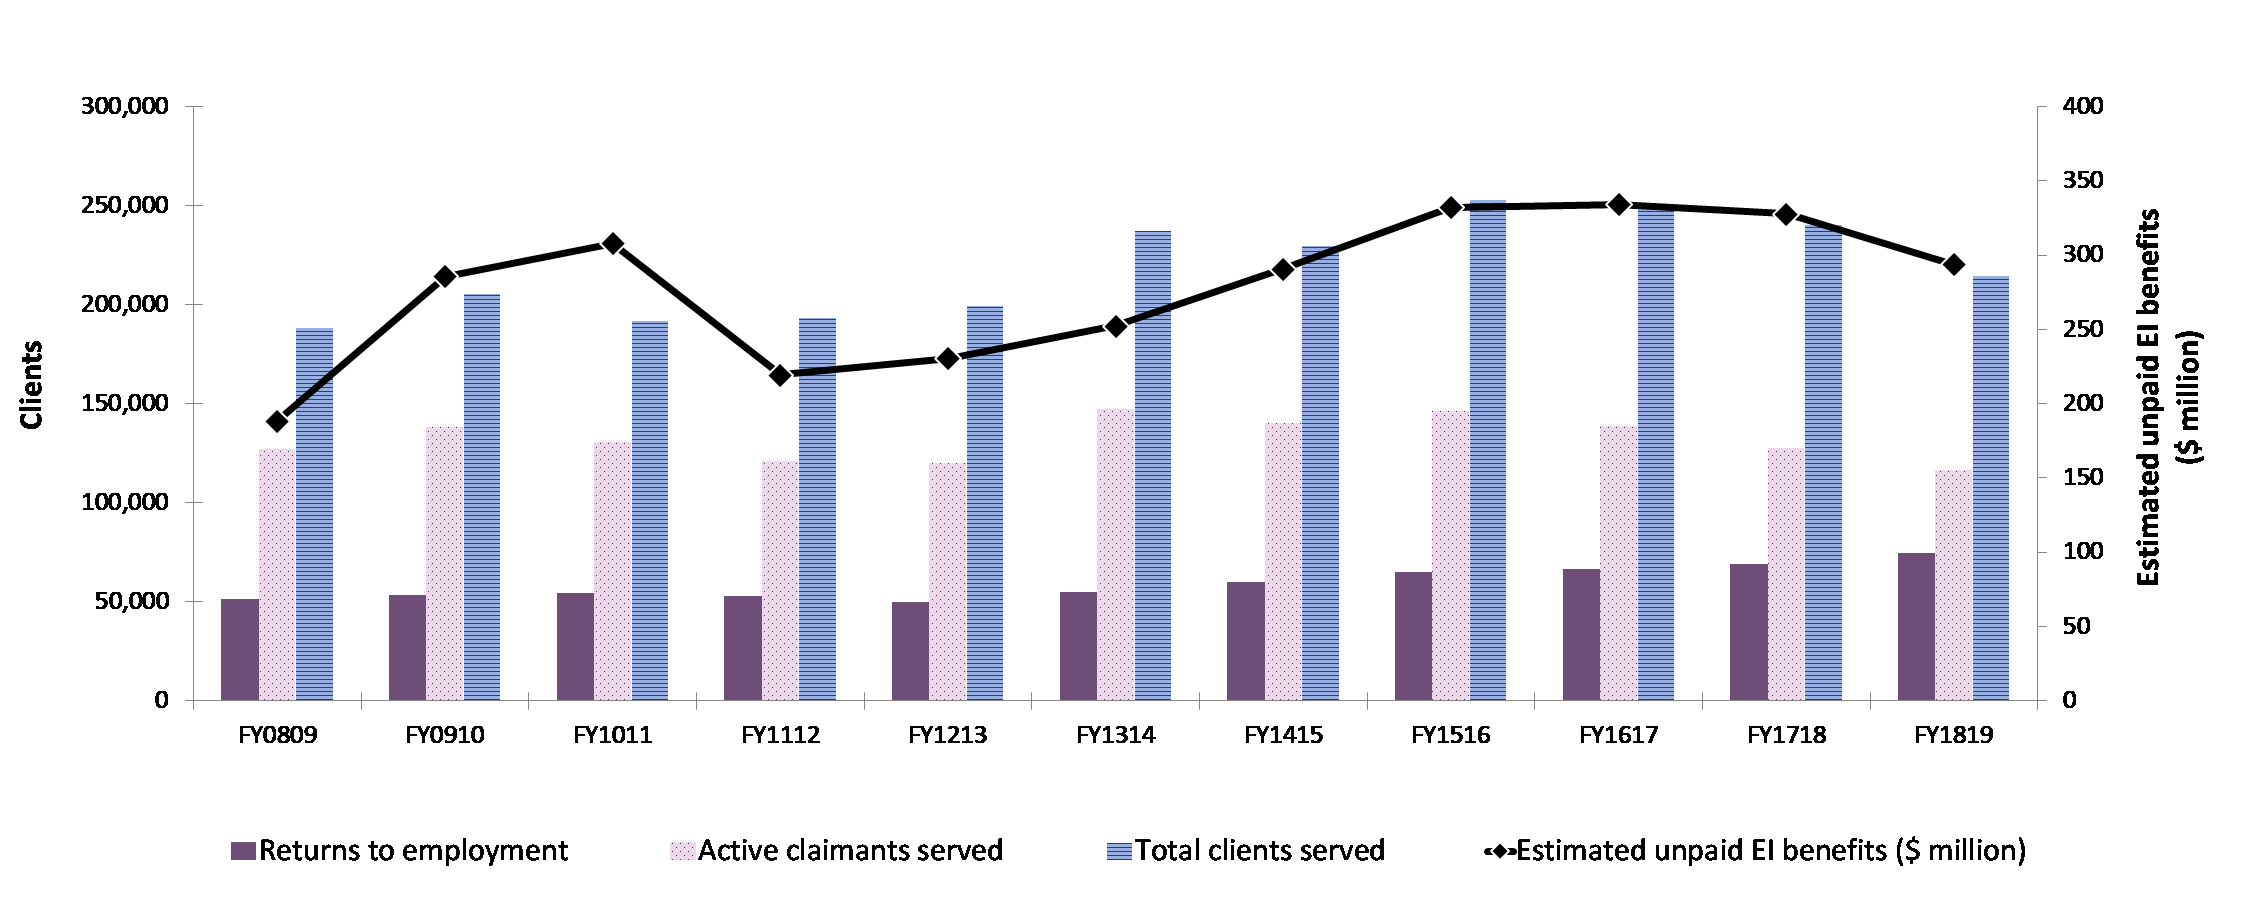
Chart 18 – Text version
| Key performance indicators | FY0809 | FY0910 | FY1011 | FY1112 | FY1213 | FY1314 | FY1415 | FY1516 | FY1617 | FY1718 | FY1819 |
|---|---|---|---|---|---|---|---|---|---|---|---|
| Returns to employment | 51,383 | 53,081 | 54,239 | 52,872 | 49,757 | 55,043 | 59,949 | 64,697 | 66,502 | 68,794 | 74,535 |
| Active claimants served | 127,027 | 138,274 | 130,782 | 121,089 | 119,771 | 147,396 | 140,026 | 146,359 | 138,682 | 127,614 | 116,261 |
| Total clients served | 188,328 | 205,411 | 191,929 | 193,237 | 199,371 | 237,337 | 229,781 | 253,119 | 250,343 | 240,343 | 214,742 |
| Estimated unpaid EI benefits ($ million) | $188,26 | $285,80 | $307,80 | $219,42 | $230,49 | $252,38 | $290,84 | $332,31 | $334,28 | $327,62 | $293,92 |
Table 10 - Quebec - ESBM-similar programming, FY1819
For accessibility reasons, the table has been simplified. Consult the PDF version for the full table.
| Employment benefits | Interventions | Year-over-year change |
Expenditures ($ 000s) |
|---|---|---|---|
| SD-R: Manpower Training Measure Job Readiness |
23,376 | +2.1% | 219,180 |
| TWS: Wage Subsidies | 8,196 | +27.0% | 92,844 |
| SE: Support for Self-Employment Measure | 1,638 | +2.8% | 23,022 |
| TES: Return to Work Supplement | 0 | 0 | 0 |
| Support measures | Interventions | Year-over-year change |
Expenditures ($ 000s) |
|---|---|---|---|
| EAS: Labour Market Information Job Placement Job Research and Assistance Services |
237,373 | -13.6% | 146,105 |
| LMPs: Job Cooperation Services Manpower Training Measure for Enterprises |
n/a | n/a | 112,887 |
| R&I: Research and Innovation Strategy | n/a | n/a | 4,521 |
3.2.6.3 Employment benefits
In FY1819, Quebec delivered a total of 33,210 Employment Benefit interventions (+7.3%). All types of Employment Benefits contributed to this expansion: Skills Development-Regular (SD-R) (23,376), Targeted Wage Subsidies (TWS) (8,196), and Self-Employment (SE) (1,638) increased by 2.1%, 27.0% and 2.8%, respectively. In total, Quebec spent $335.0 million (+3.5%) on Employment Benefits.
For FY1819, additional LMDA funding of $29.2 million was granted to improve support for the softwood lumber, steel and aluminum industries as well as seasonal businesses. Quebec was able to mobilize its partners to invest all of this money and thus consolidate the economic development of its regions as a proactive step against the challenges in these sectors, some of which have been targeted by countervailing duties imposed by the US. Funding for workforce training initiatives ($4.9 million) enabled workers to acquire relevant skills and meet the ever-evolving needs of their employer. Finally, by encouraging employers to hire people at risk of long-term unemployment, the investment in the wage subsidy ($4.0 million) helped stimulate employment and provide work experience.
3.2.6.4 Support measures: employment assistance services (EAS)
For a second consecutive year, the total number of EAS interventions decreased, reaching 237,373 (- 13.6%) in FY1819. All EAS intervention-types decreased. Group services (13,929), individual counselling (38,836) and employment services (184,608) dropped by 12.9% (-2,056), 46.2% (-33,404) and 1.0% (- 1,921), respectively. EAS expenditures, which totalled $146.1 million, decreased by 1.8%.
3.2.6.5 Other support measures: LMPs and R&I
Compared to FY1718, Quebec spent a total of $117.4 million on LMPs and R&I, an increase of 6.3%. In contrast to LMPs, where total costs ($112.9 million) jumped 9.8% year over year, R&I expenditures ($4.5 million) fell 40.2%. This decrease is due to Quebec's decision to fund its R&I initiatives from other sources of revenue. Quebec's total investment in R&I amounted to $12.8 million.
The Grande corvée : Public employment services serving companies
In January 2019, the MTESS launched the Grande corvée initiative to meet the needs of businesses. This large-scale measure is aimed at responding to the issue of labour scarcity by meeting the needs of companies. Its goal is to listen to companies and equip them for this issue. This large-scale operation is carried out by more than 200 business advisors from the MTESS in its network of 165 Services Québec offices and local employment centres in Quebec's 17 administrative regions. This initiative is ongoing and offers a new way of communicating and exchanging information with Quebec businesses.
The Grande corvée initiative also enables the MTESS to better monitor the labour market by identifying the needs and issues expressed by business leaders. It closely examines not only the needs of businesses but also their satisfaction with employment services.
Service spécialisé Jeunes : A tailored approach to meet the needs of youth
Given the 136,000 young people who are neither employed nor pursuing education or training, the MTESS has in recent years implemented various levers of intervention for employment for the most vulnerable young people. Thus, during FY1819, the MTESS continued experimenting with a specialized service for young people under the Employment Assistance Service measure. Since July 1, 2016, young people under 30 years of age have benefited from a new experimental project called “Service spécialisé Jeunes.” About 2,500 young people benefit from this service, which includes investments of approximately $13 million to $14 million annually. The service aims to help young people define a professional objective that will lead them to employment or a return to training, primarily through new support formulas to ensure the success of youth projects, while paying particular attention to those at risk of “dropping out” of employment and training. This measure has a positive impact on the integration and job retention of young people.
3.2.7 Ontario
In 2018, Ontario's real gross domestic product (GDP) grew by 2.2%, down from 2.9% in 2017. According to an average of private sector forecasts, Ontario's real GDP growth is expected to have moderated to 1.6% in 2019, the same rate as the national average.
Ontario: EBSM key facts
For accessibility reasons, the table has been simplified. Consult the PDF version for the full table.
| Insured clients | Non-insured clients |
|---|---|
| 105,075 |
100,631 |
| Intervention type | FY1819 | Year-over-year change |
|---|---|---|
| Employment Benefits | 31,691 | 42.4% |
| Support Measures: EAS | 200,387 | 4.3% |
| Intervention type | FY1819 | Year-over-year change(pp) |
|---|---|---|
| Employment Benefits | 13.7% | 3.3 |
| Support Measures: EAS | 86.3% | 3.3 |
| Total expenditures | FY1819 ($ million) |
Year-over-year change |
|---|---|---|
| Employment Benefits | $179.4 | 22.2% |
| Support Measures: EAS | $323.0 | 0.5% |
| LMP and R&I | $159.6 | 11.0% |
| Total Expenditures1 | $662.0 | 7.6% |
1 Totals may not add up due to rounding; does not include accounting adjustments.
| FY1718 | FY1819 | Year-over-year change |
|---|---|---|
| $233.15 | $265.22 | 13.8% |
Employment in Ontario grew (+133,200; +1.9%) at the same rate as the working-age population, leaving the employment rate unchanged compared to that of the previous year, at 61.0%. The province's unemployment rate edged down to 5.7% from 5.8% a year earlier, the lowest since FY8990. In contrast to FY1718, employment growth in FY1819 was entirely realized in full-time employment (+136,900; +2.4%) and was more concentrated in the services-producing sector (+121,300; +2.1%). Growth in that sector was led by gains in transportation and warehousing (+39,200; +11.2%) and in educational services (+32,300; +6.5%). In the goods-producing sector (+11,900; +0.8%), losses in manufacturing (-11,900; - 1.5%) were more than offset by gains in construction (+11,400; +2.2%) and utilities (+9,700; +20.3%).
Like other jurisdictions, Ontario faces challenges related to a changing global economy and the aging of its population. These include increased demand for specialized skills, workplace transformation from automation and new technologies, rise in non-standard forms of employment and a slowing labour force growth. Such challenges impact individuals entering the labour market as well as established workers, with youth, Indigenous peoples, persons with disabilities, recent immigrants and other vulnerable workers experiencing less favourable labour market outcomes than the rest of the labour force. Ontario engages with key stakeholders to build awareness and solicit feedback on the province's employment related challenges.
3.2.7.1 Managing for results
Ontario is currently implementing the Targeting, Referral and Feedback (TRF) system. In this context, Ontario, in partnership with the Government of Canada, will proactively engage EI applicants and assist them to return to employment more quickly. TRF connects new EI applicants to their local Employment Ontario service centres, where they can access employment information, services and supports, while matching their existing skills with local labour market needs.
The province continues to engage with stakeholders to inform the design, delivery and implementation of ongoing and new initiatives. Engagements in FY1819 included consultations with employment services and social assistance partners, and consultations focused on employer-led coalition's goals of hiring 40,000 not in employment, education or training (NEET) youth into meaningful employment, as well as engaging 60,000 NEET youth in education and training opportunities.
3.2.7.2 Clients, interventions and expenditures
Ontario served 205,706 clients in FY1819, an increase of 13,037 (+6.8%) over FY1718. FY1819 marks the introduction of Premiums Paid Eligibility (PPE) clients, a new category of clients who may have been classified as non-insured clients in previous years. PPE clients in Ontario accounted for 12.3% (25,228) of all clients. All other client type proportions decreased: non-insured (100,631), active claimants (53,221) and former claimants (26,626) declined by 5.5%, 5.8% and 10.4%, respectively. The decline in the proportion of non-insured clients may be attributable to the new PPE category.
The number of total EBSM-similar interventions delivered in Ontario rose for a fourth consecutive year, reaching 232,078 (+8.3%) in FY1819. After 6 consecutive years of growth, the share of EAS in relation to the total EBSM-similar interventions dropped by 3.3 percentage points to 86.3%. Returns to employment advanced from 39,678 to 47,400, a 19.5% year-over-year increase, and unpaid EI benefits totalled $265.22 million (+13.8%), compared to $233.15 million in FY1718. Ontario's total expenditures amounted to $662.0 million (+7.6%). This sum includes $71.7 million received by the province from the $225.0 million in additional LMDA funding announced in Budget 2017. The province also received additional targeted funding to support workers in seasonal industries ($3.5 million), as well as workers impacted by the trade disputes in the forest sector ($3.3 million) and steel and aluminium industries ($12.0 million).
Partnerships and opportunities were delivered through SkillsAdvance Ontario to enable laid off workers to train during plant shutdown periods, in response to the rotating/temporary plant shutdowns that were introduced by companies to deal with reduced business as a result of the of US imposed steel tariffs, skilled labour shortages, and a surge in imports from non-NAFTA countries. As well, projects created recruitment opportunities for individuals to participate in a focused sector based skills training program, including employer paid work placement, with the intent of long-term labour retention and growing the skilled trades.
Partnerships were established to deliver projects through SkillsAdvance Ontario to provide participants, job seekers and incumbent workers, in northwestern Ontario with essential and technical skills training in electrician, millwright, mechanical harvesting, heavy equipment operator, and wood processing, to meet in-demand occupations identified by employer partners.
Additional projects were developed and funded with industry and employment training partners, including the City of Toronto, Prince Edward County Chamber of Tourism and Commerce, Prince Edward Learning Centre and Loyalist College, to support workers in seasonal industries.

Chart 19 – Text version
| Client | FY0809 | FY0910 | FY1011 | FY1112 | FY1213 | FY1314 | FY1415 | FY1516 | FY1617 | FY1718 | FY1819 |
|---|---|---|---|---|---|---|---|---|---|---|---|
| Active clients | 102,406 | 118,782 | 70,901 | 63,780 | 66,748 | 64,689 | 63,061 | 60,489 | 62,339 | 56,484 | 53,221 |
| Former clients | 19,278 | 21,693 | 28,703 | 22,074 | 20,707 | 20,145 | 19,734 | 18,611 | 24,796 | 29,702 | 26,626 |
| PPE | n/a | n/a | n/a | n/a | n/a | n/a | n/a | n/a | n/a | n/a | 25,228 |
| Non-insured clients | 37,923 | 27,682 | 92,788 | 46,170 | 66,703 | 74,533 | 71,278 | 82,458 | 103,402 | 106,483 | 100,631 |
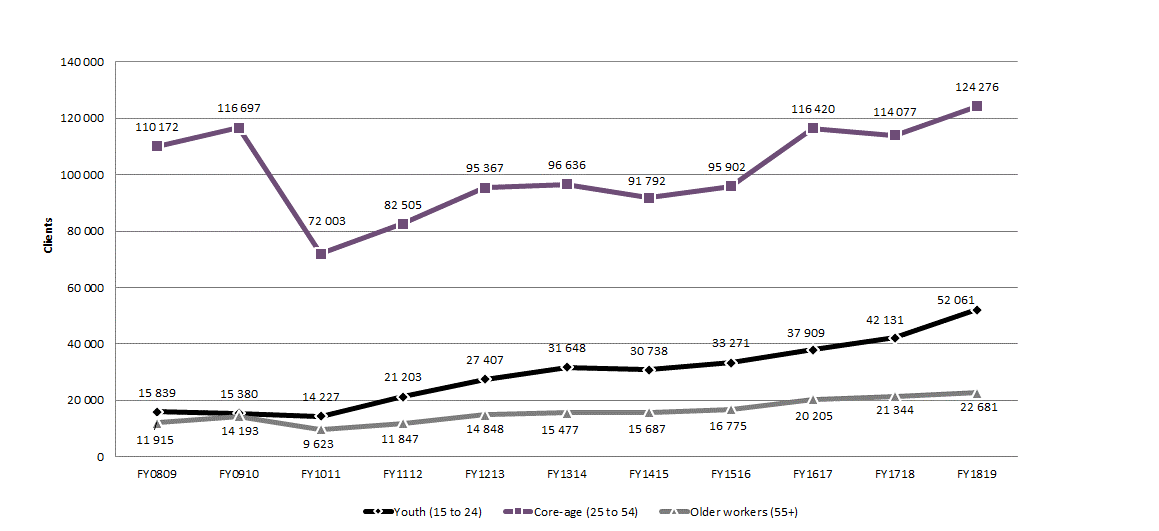
Chart 20 – Text version
| Age | FY0809 | FY0910 | FY1011 | FY1112 | FY1213 | FY1314 | FY1415 | FY1516 | FY1617 | FY1718 | FY1819 |
|---|---|---|---|---|---|---|---|---|---|---|---|
| Youth (15 to 24) | 15,839 | 15,380 | 14,227 | 21,203 | 27,407 | 31,648 | 30,738 | 33,271 | 37,909 | 42,131 | 52,061 |
| Core-age (25 to 54) | 110,172 | 116,697 | 72,003 | 82,505 | 95,367 | 96,636 | 91,792 | 95,902 | 116,420 | 114,077 | 124,276 |
| Older workers (55+) | 11,915 | 14,193 | 9,623 | 11,847 | 14,848 | 15,477 | 15,687 | 16,775 | 20,205 | 21,344 | 22,681 |
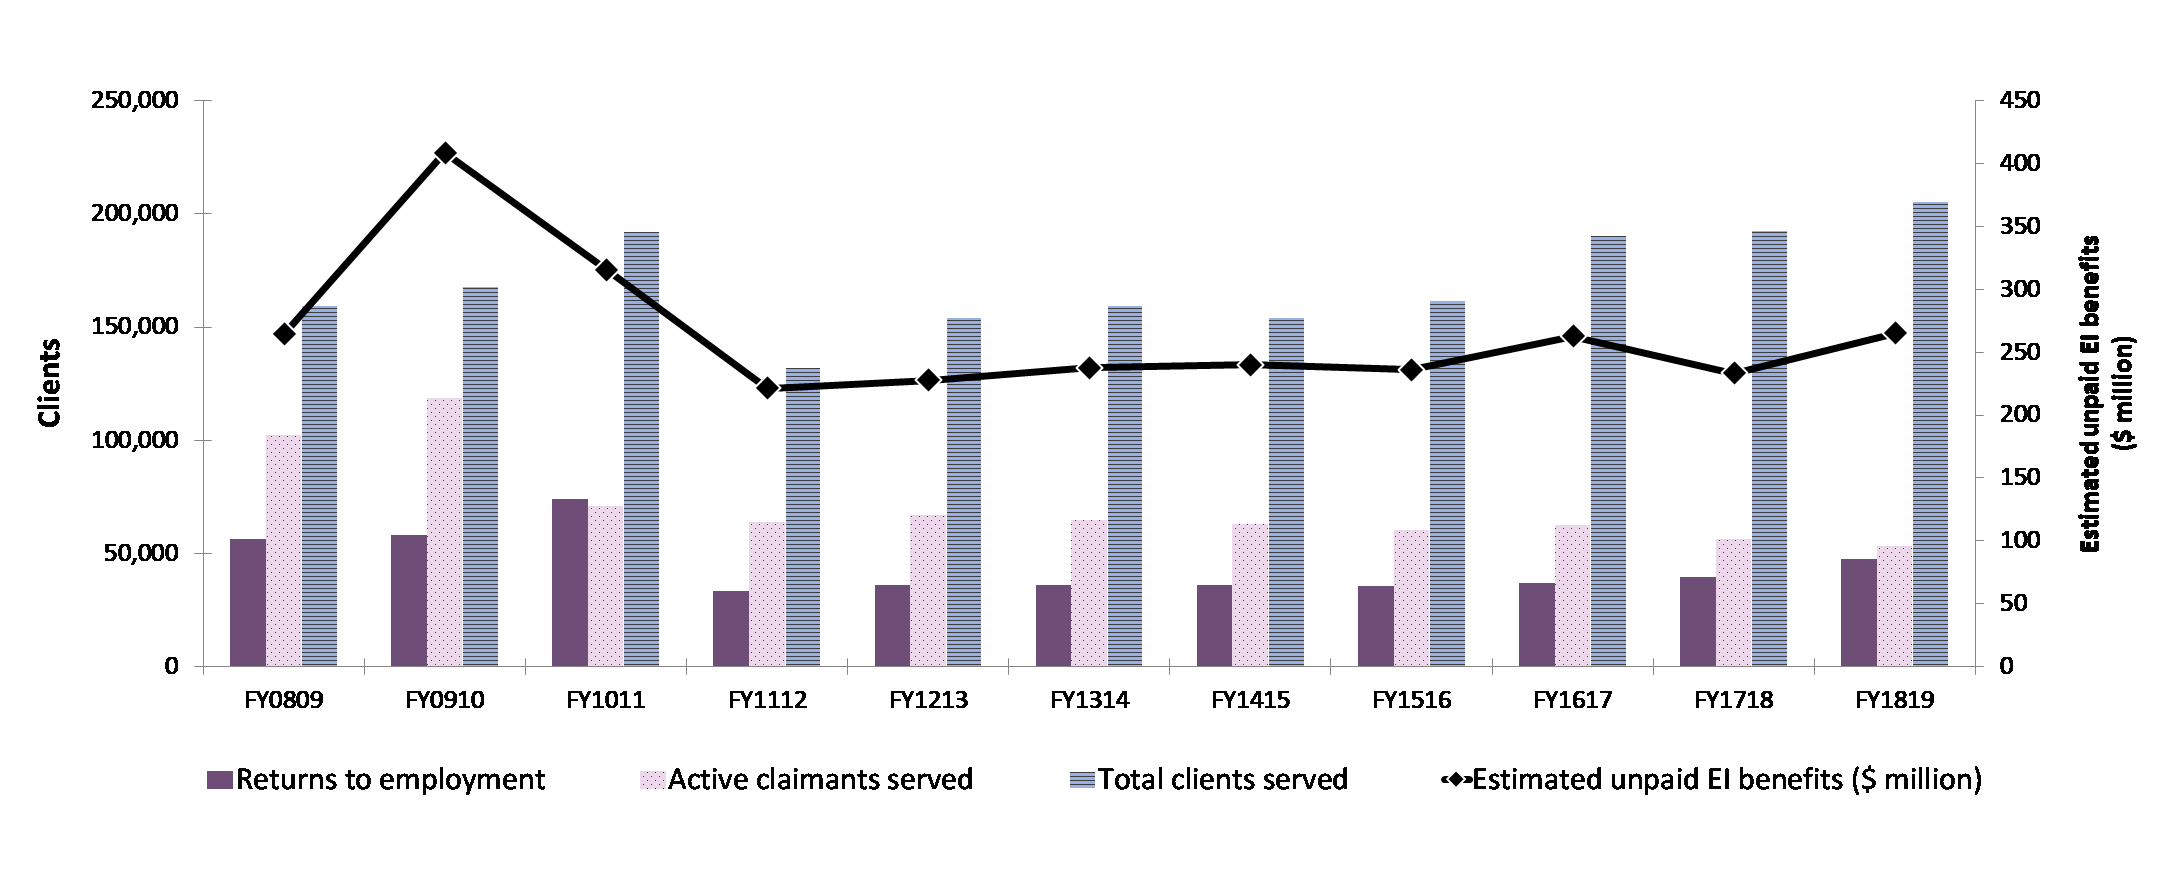
Chart 21 – Text version
| Key performance indicators | FY0809 | FY0910 | FY1011 | FY1112 | FY1213 | FY1314 | FY1415 | FY1516 | FY1617 | FY1718 | FY1819 |
|---|---|---|---|---|---|---|---|---|---|---|---|
| Returns to employment | 56,562 | 58,333 | 73,855 | 33,347 | 36,111 | 36,018 | 36,166 | 35,625 | 37,044 | 39,678 | 47,399 |
| Active claimants served | 102,406 | 118,782 | 70,901 | 63,780 | 66,748 | 64,689 | 63,061 | 60,489 | 62,339 | 56,484 | 53,221 |
| Total clients served | 159,607 | 168,157 | 192,392 | 132,024 | 154,158 | 159,367 | 154,073 | 161,558 | 190,537 | 192,669 | 205,706 |
| Estimated unpaid EI benefits ($ million) | $264,44 | $408,52 | $315,75 | $221,48 | $227,71 | $237,59 | $240,22 | $236,05 | $262,66 | $233,15 | $265,22 |
Table 11 - Ontario: EBSM-similar programming, FY1819
For accessibility reasons, the table has been simplified. Consult the PDF version for the full table.
| Employment benefits | Interventions | Year-over-year change |
Expenditures ($ 000s) |
|---|---|---|---|
| SD-R: Second Career, Literacy and Basic Skills | 9,564 | +103.7% | 171,819 |
| SD-A: Skills Development-Apprenticeship | 18,692 | +21.7% | |
| TWS: Job Placement with Incentive | 3,322 | +62.9% | 6,258 |
| SE: Ontario Self-Employment Benefit | 0 | n/a | 0 |
| JCP: Ontario Job Creation Partnerships | 113 | -29.8% | 1,281 |
| Support measures | Interventions | Year-over-year change |
Expenditures ($ 000s) |
|---|---|---|---|
| EAS: Ontario Employment Assistance Services/ Employment Service | 200,387 | +4.3% | 323,004 |
| LMP: Ontario Labour Market Partnerships | N/A | N/A | 90,781 |
| R&I: Research and Innovation | N/A | N/A | 68,831 |
3.2.7.3 Employment benefits
After a seventh consecutive year of decline, the number of Employment Benefit interventions delivered in Ontario grew in FY1819, by 42.4%, to 31,691. With the exception of JCP (-48; -29.8%), all other benefit types increased: TWS (+1,283; +62.9%), SD-R (+4,870; +103.7%) and SD-A (+3,332; +21.7%). For a third consecutive year, SE was not delivered in the province. For the first time since FY1011, expenditures towards Employment Benefits increased, amounting to $179.4 million (+22.2%).
Skills Development training helps Maria secure employment
Maria first came to Canada from Mexico in 2013. She had worked in office environments for 15 years. Since her arrival in Canada, she could not find full-time work in her field. She came to Gateway Centre for Learning in July of 2017 seeking certifications to validate her administrative skillset, improve her math and workplace skills, and prepare for the citizenship exam.
Maria worked full time and actively participated in her learning plan. Her dedication to her learning plan was impressive. She was very organized in her learning strategies. She participated in every type of learning offered: one-on-one tutoring, small group, on-line learning/e-channel, blended, and experiential learning. She worked full-time, studied and volunteered to utilize the skills she had learned and increase her employability to secure work in a different industry. Within six months of starting at Gateway, she secured alternate employment. She is employed as an 'Unregulated Care Provider' and she enjoys her job immensely. Her employer has invested training in her to increase her ability to do more.
3.2.7.4 Support measures: EAS
For a fourth consecutive year, EAS interventions in Ontario rose, reaching 200,387 (+4.3%) in FY1819. Individual counselling remained the sole delivered EAS type of intervention. The province spent a total of $323.0 million (-0.5%) on EAS.
Shelby benefits from Employment Assistance Services
Shelby had a history with crime and behavioural problems when he started the Youth Job Connection (YJC) program. He had been expelled from a school in the Upper Canada District School Board and placed in a home for “at risk youth”, when he was referred the YJC program. The program taught Shelby the importance of working as a member of a team and taught him discipline that set him up for success when he was put on his placement.
Shelby was placed at a campground where he was initially only supposed to work part-time, but he and the supervisor felt he could handle more hours and more responsibility. He returned to the same place of employment in summer 2018 once again working full-time and has even taken on an additional job helping a local farmer with lawn maintenance. He has also since been reinstated to the UCDSB, as a result of advocacy from the campground supervisor.
3.2.7.5 Other support measures
In FY1819, total funding towards LMP and R&I amounted to $159.6 million, an 11.0% year-over-year increase. This represents a fifth consecutive year of growth. While expenditures on LMP totalled $90.8 million (+220.8%), increasing for a third consecutive year, R&I's funding decreased, after 6 consecutive years of grow, by 40.4%, to $68.8 million. The respective increase and decrease in LMP and R&I funding is in part the result of the reclassification of some LMDAs programs that had been previously classified under R&I, under LMP.
In FY1819, Ontario supported employer-sponsored training, by delivering the Canada-Ontario Job Grant (COJG) under the Labour Market Partnerships Support Measure (COJG was previously delivered under the R&I stream). This employer cost-shared program helps employers train their labour force and adapt to changing labour market needs. The majority (86%) of COJG participants in FY1819 were in “Tier 1” training, meaning the training will lead to a new or a better job with the sponsoring employer.
EBSM in action: Career Ready Fund ($30 million)
Launched in FY1718, the Career Ready Fund helps employers, publicly-assisted colleges and universities and other organizations (such as industry associations and not-for-profits) create experiential learning opportunities for postsecondary students and recent graduates.
Experiential learning is “hands-on learning” in a real or simulated workplace that helps prepare students and recent graduates for the transition to work, while helping employers connect to new talent with the skills they need to hit the ground running. The Career Ready Fund supports projects through multiple streams:
- Employer and Regional Partnerships (funded as a Labour Market Partnership)
- New Graduate Career Bridge
- University and College Stream
- Strategic Initiatives Fund
- Auto Stream (introduced in FY1819)
Projects supported through the program's multiple streams address the following priorities:
- developing and expanding innovative and sustainable partnerships among employers, colleges and universities and other organizations that create new experiential learning opportunities
- supporting new graduates with internships or similar experiences, the creation of curriculum to develop job-ready skills, or outreach to employers to create work opportunities
- building capacity at publicly-assisted colleges and universities to create new experiential opportunities, with a significant focus on employer engagement
Now in its third year, Ontario expects that its multi-year investment in the program of $66.3 million through the LMDA will create 120,000 net new opportunities for students, recent graduates, and apprentices in a wide range of formats such as co-ops, field placements, work placements, industry-sponsored and capstone projects, bootcamps and incubators, as well as on-campus work, work simulations, and preparatory programming within postsecondary coursework.
At the institutional level, significant focus is being placed on employer outreach and support, and the creation of co-curricular records that allow students to build a portfolio of experiences and promote their skills to employers.
At the same time, the fund is supporting several industry and employer-driven projects. For example, under the newly created Auto Stream, employers in the auto and its part and supply industries receive wage subsidies for every work placement position they create to support the career readiness of participants. In addition to supporting the skills training of participants, this funding also supports the talent needs of businesses in this sector.
The Auto Stream was created in late FY1819 to support Ontario's automotive and broader parts and supply sectors. This stream is helping to build a talent pipeline into the auto industry by creating new experiential learning opportunities for postsecondary students, recent graduates and apprentices.
Student uses Career Ready Fund to springboard his career
Steven Tremblay, an Environmental Studies student at Queen's University participated in the Queen's Internship Program and obtained on-the-job experience at the Kingston Environment Department GIS Unit.
The Queen's Internship Program was supported through the Employer and Regional Partnerships Stream of the Career Ready Fund. This Stream provided seed funding to support the development and expansion of innovative and sustainable local, sectoral, and province-wide partnerships to create experiential learning opportunities among employers, postsecondary institutions, and other parties. Queen's University received $447,894 in funding under this stream, which supported 136 new, incremental opportunities.
Steven noted that: “By participating in my university's internship program, I found a 12-month job placement that perfectly matched the combination of environmental knowledge and GIS skills I developed during my studies. I worked with the Corporation of the City of Kingston's Environment and Sustainable Initiatives Department. Both my employers at the city and staff at the university GIS department embraced my active learning as an intern, and the experience helped complement my degree with the workplace experience and skills I needed to transition to employment.”
He went on to note: “My internship gave me a huge leg up for employment after graduation, not only because I understood data and GIS, but because I had lots of experience understanding municipal infrastructure and field operations.”
Steven's post-graduate employment has included being a GIS assistant with the Ministry of the Environment, and a GIS specialist with a private engineering firm.
3.2.8 Manitoba
Manitoba's real GDP growth slowed down considerably in 2018 (+1.3%) compared to 2017 (+3.2%). In 2019, forecasters expect that the province's economy will have grown at about the same rate as in 2018.
Manitoba: EBSM key facts
For accessibility reasons, the table has been simplified. Consult the PDF version for the full table.
| Insured clients | Non-insured clients |
|---|---|
| 14,056 |
10,022 |
| Intervention type | FY1819 | Year-over-year change |
|---|---|---|
| Employment Benefits | 6,866 | 10.3% |
| Support Measures: EAS | 54,043 | 1.5% |
| Intervention type | FY1819 | Year-over-year change(pp) |
|---|---|---|
| Employment Benefits | 11.3% | 0.8 |
| Support Measures: EAS | 88.7% | 0.8 |
| Total expenditures | FY1819 ($ million) |
Year-over-year change |
|---|---|---|
| Employment Benefits | $32.7 | 13.6% |
| Support Measures: EAS | $10.1 | 3.2% |
| LMP and R&I | $7.0 | 11.2% |
| Total Expenditures1 | $49.7 | 7.2% |
1 Totals may not add up due to rounding; does not include accounting adjustments.
| FY1718 | FY1819 | Year-over-year change |
|---|---|---|
| $41.31 | $42.17 | 2.1% |
Following the same trend as its real GDP growth, Manitoba's labour market in FY1819 improved moderately compared to FY1617 and FY1718. Employment grew by 5,900 (+0.9%), mostly in full-time positions (+5,100; +1.0%). The unemployment rate increased by 0.3 percentage points to 5.8%, as more people joined the labour force in search of work (+8,600; +1.3%). Employment growth in FY1819 was entirely realized in the services-producing sector (+7,200; +1.5%), led by gains in transportation and warehousing (+4,200; +11.4%), health care and social assistance (+2,500; +2.5%), as well as in public administration (+2,500; +7.7%). Notable declines were realized in wholesale and retail trade (‑3,400; ‑3.7%), as well as in finance, insurance, real estate, rental and leasing (-1,900; -5.2%). There was also a slight decline in the goods‑producing sector (-1,300; -0.8%). The increase in agriculture (+600; +2.5%) was more than offset by a drop in utilities (-1,500; -17.9%).
Given its labour market context, Manitoba used targeted and innovative approaches to engage those not participating in the labour force, increase the skills of the current and future workforce, improve outcomes for those who continue to face barriers to participation, and assist individuals to effectively transition to the workforce. During consultations, employers identified the need for workers across a broad range of skills sets.
3.2.8.1 Managing for results
Community stakeholders identified key labour market barriers and opportunities that informed annual planning priorities, and supported employment programming that met Manitoba's labour market needs. Manitoba undertook regular consultations with stakeholders to inform broader government strategies, initiatives, and program priorities. Consultations were not always specific to the LMDA, but supported the identification of issues, needs and opportunities that addressed the agreement over the coming years.
In FY1819, Manitoba delivered many programs and services to job seekers in urban, rural and northern communities. The province designed and delivered LMDA-funded programming in these locations by working with communities, employers, service providers, and educational institutions to identify local labour market needs, and collaboratively develop programs and services to address them.
3.2.8.2 Clients, interventions and expenditures
In FY1819, Manitoba served 722 fewer clients than in FY1718 (-2.9%), for a total of 24,078. This was the fourth consecutive year during which the province served fewer clients. Aside from PPE clients, all other client types declined: non-insured clients (-2,257; -18.4%), former claimants (- 644; -17.3%), and active claimants (-339; -3.9%). The decline in the number of non-insured clients is mostly attributable to the introduction of the new PPE category, whose 2,518 clients in FY1819 would have counted towards non-insured clients under previous eligibility rules. As for their shares of the total number of clients served, all client types declined as a result of lower volumes and the new PPE category accounting for 10.5% of all clients. Between FY1718 and FY1819, the proportions of non-insured clients (41.6%), active claimants (35.1%), and former claimants (12.8%) dropped by 7.9, 0.3 and 2.2 percentage points, respectively.
In contrast to the reduced number of clients served, Manitoba delivered 1,439 (+2.4%) more interventions in FY1819 than in FY1718, for a total of 60,909 interventions. The number of insured clients who returned to work after participating in an EBSM-similar program totalled 4,470 in FY1819, almost unchanged (-0.8%) from FY1718. Unpaid EI benefits increased year-over-year, from $41.31 million in FY1718 to $42.17 million in FY1819, an increase of 2.1%. Manitoba's total expenditures on EBSMs increased by $3.3 million (+7.2%) to $49.7 million in FY1819. These expenditures comprised the province's shares of the ongoing $1.95 billion LMDA program funding ($43.0 million) and its share of the $225.0 million in additional funding announced in Budget 2017 ($6.8 million).
On top of these expenditures, $1.5 million was made available to the province under the additional targeted funding measures to support workers in seasonal industries and those affected by trade disputes in the steel and aluminum industries, and the forest sector, which the province did not access.
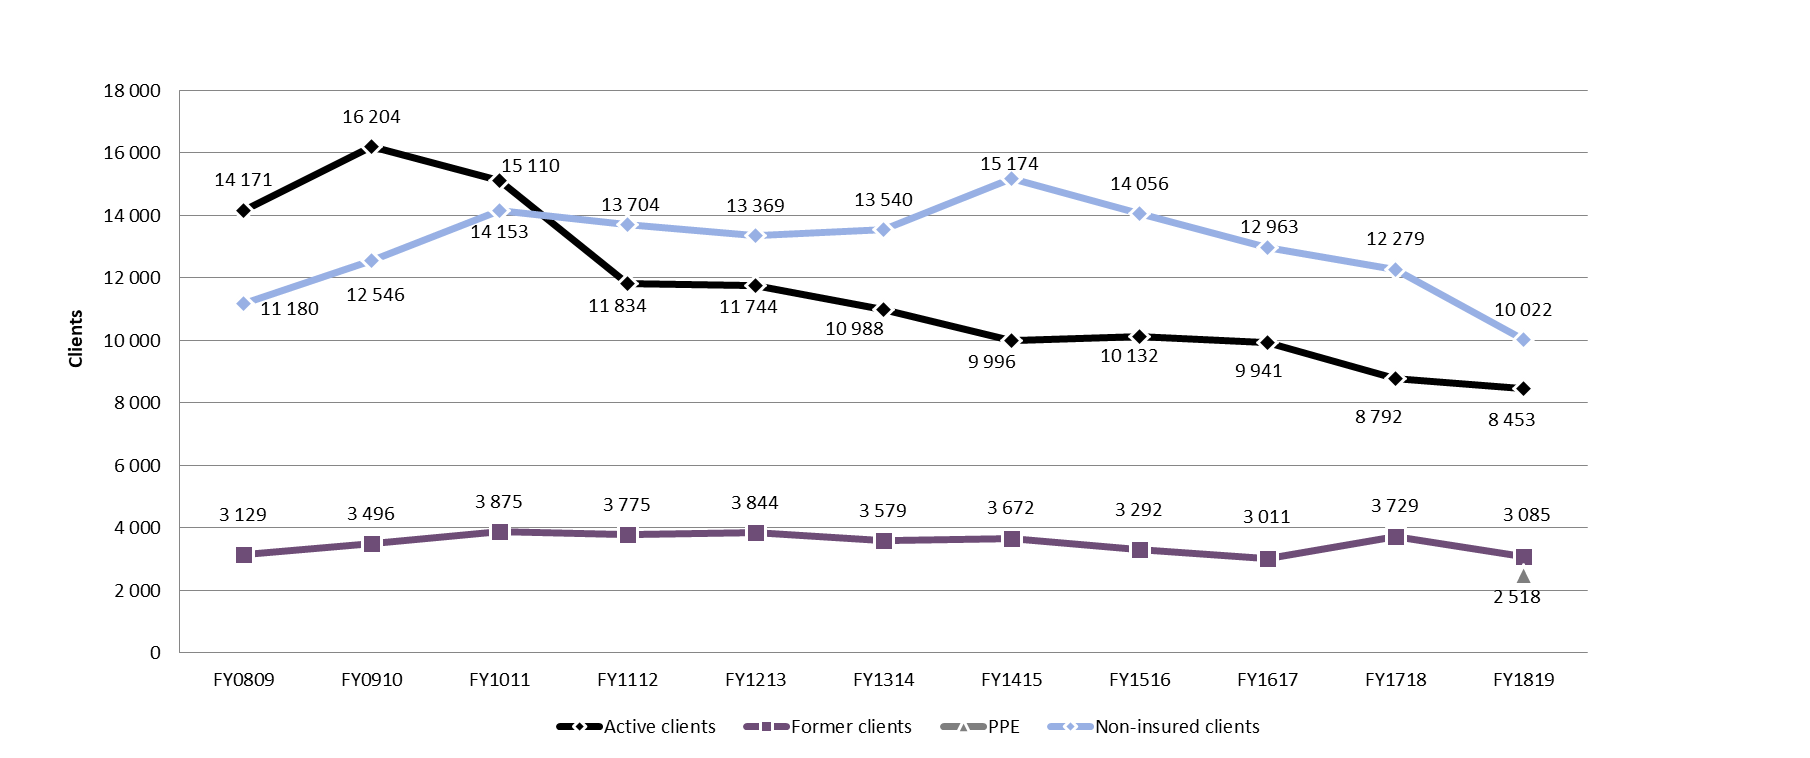
Chart 22 – Text version
| Client | FY0809 | FY0910 | FY1011 | FY1112 | FY1213 | FY1314 | FY1415 | FY1516 | FY1617 | FY1718 | FY1819 |
|---|---|---|---|---|---|---|---|---|---|---|---|
| Active clients | 14,171 | 16,204 | 15,110 | 11,834 | 11,744 | 10,988 | 9,996 | 10,132 | 9,941 | 8,792 | 8,453 |
| Former clients | 3,129 | 3,496 | 3,875 | 3,775 | 3,844 | 3,579 | 3,672 | 3,292 | 3,011 | 3,729 | 3,085 |
| PPE | n/a | n/a | n/a | n/a | n/a | n/a | n/a | n/a | n/a | n/a | 2,518 |
| Non-insured clients | 11,180 | 12,546 | 14,153 | 13,704 | 13,369 | 13,540 | 15,174 | 14,056 | 12,963 | 12,279 | 10,022 |
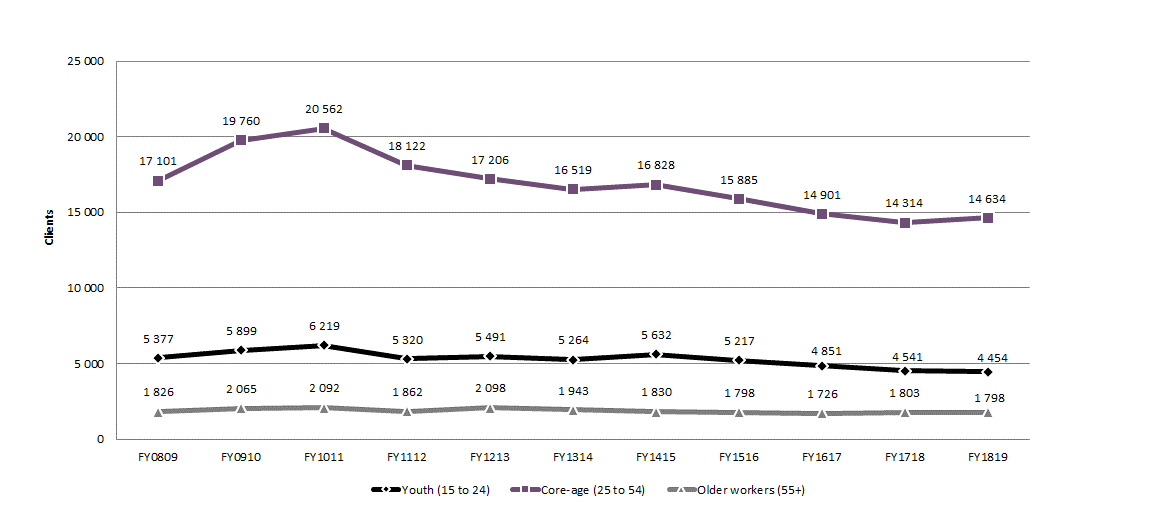
Chart 23 – Text version
| Age | FY0809 | FY0910 | FY1011 | FY1112 | FY1213 | FY1314 | FY1415 | FY1516 | FY1617 | FY1718 | FY1819 |
|---|---|---|---|---|---|---|---|---|---|---|---|
| Youth (15 to 24) | 5,377 | 5,899 | 6,219 | 5,320 | 5,491 | 5,264 | 5,632 | 5,217 | 4,851 | 4,541 | 4,454 |
| Core-age (25 to 54) | 17,101 | 19,760 | 20,562 | 18,122 | 17,206 | 16,519 | 16,828 | 15,885 | 14,901 | 14,314 | 14,634 |
| Older workers (55+) | 1,826 | 2,065 | 2,092 | 1,862 | 2,098 | 1,943 | 1,830 | 1,798 | 1,726 | 1,803 | 1,798 |
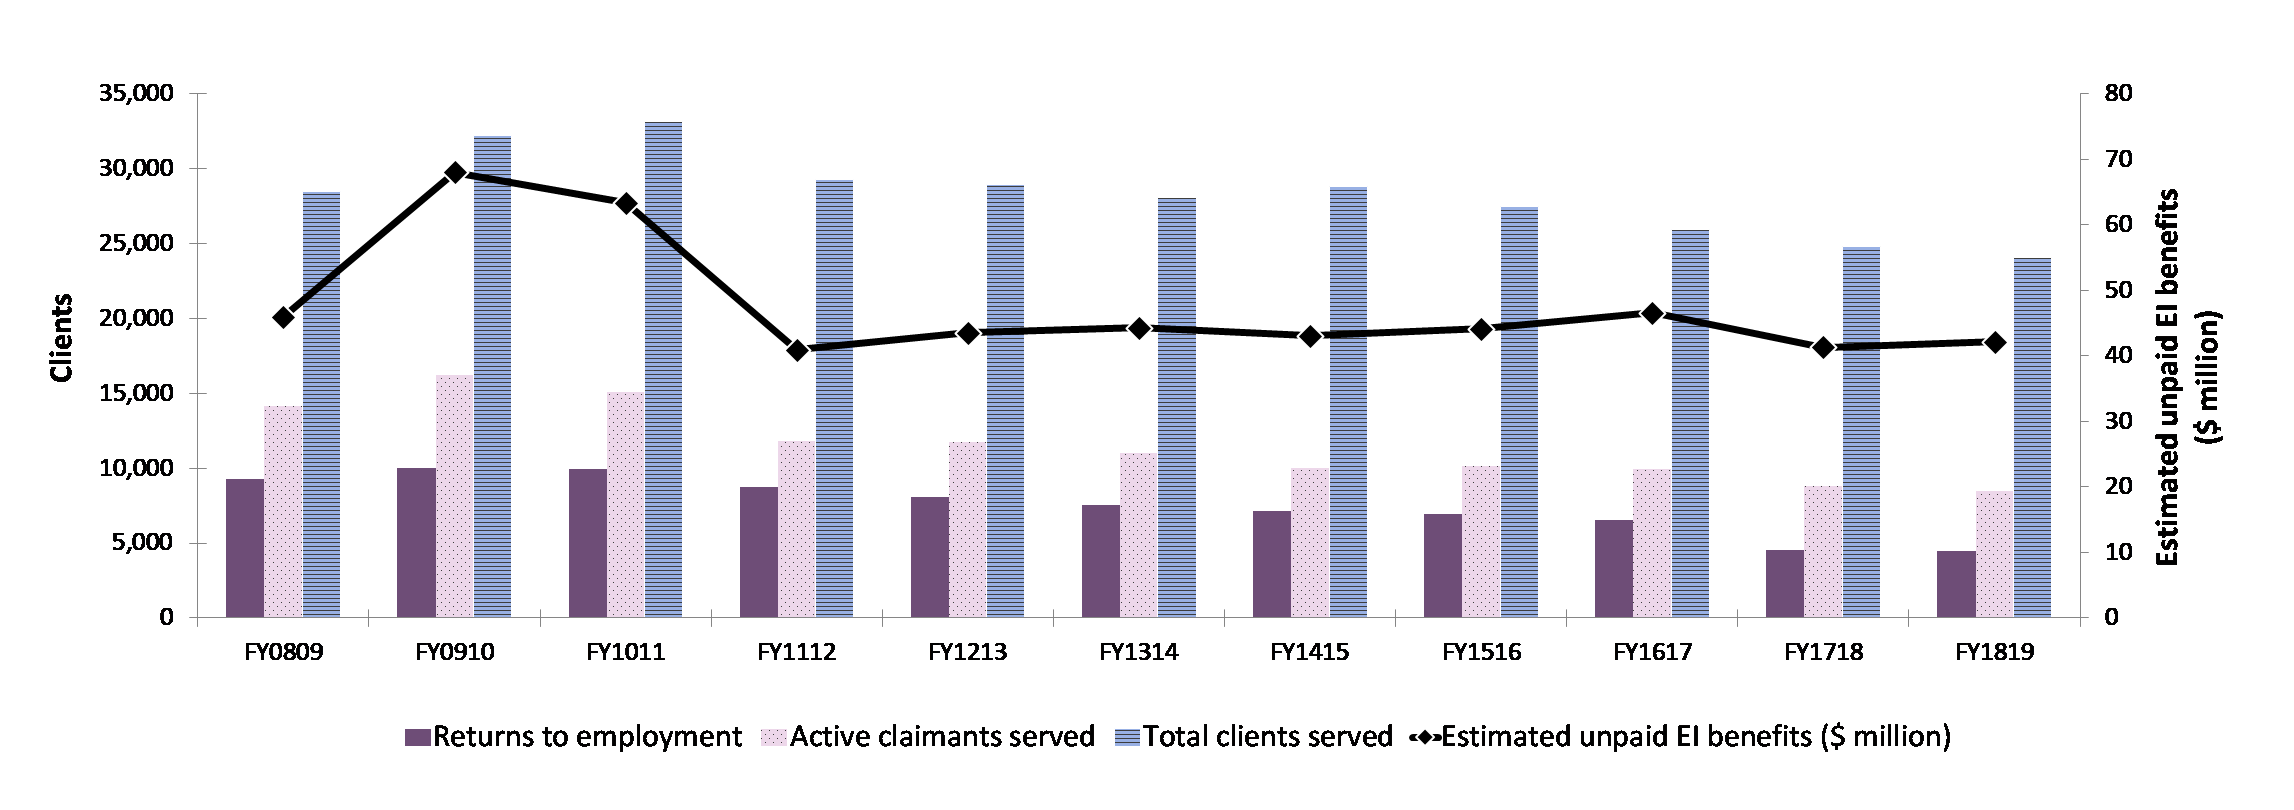
Chart 24 – Text version
| Key performance indicators | FY0809 | FY0910 | FY1011 | FY1112 | FY1213 | FY1314 | FY1415 | FY1516 | FY1617 | FY1718 | FY1819 |
|---|---|---|---|---|---|---|---|---|---|---|---|
| Returns to employment | 9,256 | 10,043 | 9,950 | 8,714 | 8,056 | 7,526 | 7,156 | 6,957 | 6,565 | 4,505 | 4,470 |
| Active claimants served | 14,171 | 16,204 | 15,110 | 11,834 | 11,744 | 10,988 | 9,996 | 10,132 | 9,941 | 8,792 | 8,453 |
| Total clients served | 28,480 | 32,246 | 33,138 | 29,313 | 28,957 | 28,107 | 28,842 | 27,480 | 25,915 | 24,800 | 24,078 |
| Estimated unpaid EI benefits ($ million) | $46,00 | $68,03 | $63,38 | $40,97 | $43,51 | $44,28 | $43,09 | $44,14 | $46,59 | $41,31 | $42,17 |
Table 12 - Manitoba: EBSM-similar programming, FY1819
For accessibility reasons, the table has been simplified. Consult the PDF version for the full table.
| Employment benefits | Interventions | Year-over-year change |
Expenditures ($ 000s) |
|---|---|---|---|
| SD-R: Skills Development | 2,515 | +27.1% | 29,620 |
| SD-A: Skills Development-Apprenticeship | 3,997 | +2.5% | |
| TWS: Wage Subsidies | 31 | -13.9% | 150 |
| SE: Self-Employment | 83 | -37.6% | 1,232 |
| JCP: Employment Partnerships | 240 | +34.8% | 1,682 |
| Support measures | Interventions | Year-over-year change |
Expenditures ($ 000s) |
|---|---|---|---|
| EAS: Employment Assistance Services | 54,043 | +1.5% | 10,092 |
| LMP: Labour Market Partnerships | n/a | n/a | 5,669 |
| R&I: Research and Innovation | n/a | n/a | 1,296 |
3.2.8.3 Employment benefits
In FY1819, Manitoba delivered 6,866 Employment Benefit interventions, up by 10.3% (+640) over FY1718. Increases in SD-R (+537; +27.1%), SD-A (+96; +2.5%) and JCP (+62; +34.8%) were partially offset by declines in SE (-50; -37.6%) and TWS (-5; -13.9%). Expenditures on Employment Benefits increased by $3.9 million (+13.6%) in FY1819 over FY1718, reaching $32.7 million.
3.2.8.4 Support measures: EAS
The province also delivered more EAS interventions in FY1819 compared to the previous year, reaching 54,043 (+799; +1.5%). While employment services increased by 2.5% (+854), for a total of 34,994, individual counselling (19,049) remained stable (-0.3%; -55). Manitoba spent $10.1 million on EAS, an increase of 3.2% over FY1718.
3.2.8.5 Other support measures: LMP and R&I
Expenditures on R&I ($1.3 million) were $0.9 million lower (-40.1%) than in FY1718, while spending on LMP ($5.7 million) remained relatively unchanged over the same period.
Best practices
R&I
In FY1819, Manitoba worked with an innovative community-based service provider through the Research and Innovation program to adapt their program curriculum into a “Train the Trainer” tool. The curriculum focuses on developing participants' personal management and resiliency skills. With the development of this new community of practice tool, other service providers and employers can apply these best practices when helping marginalized individuals to enter the labour market. The Train the Trainer tool will increase the confidence and ability of other agencies to deliver effective and proven curriculum and build a repository of knowledge across other organizations serving similar clientele.
LMP
In response to downsizing in northern Manitoba's natural resource extraction sector, Manitoba has been providing a range of labour adjustment services to employers, employees, and communities experiencing labour disruptions due to layoffs or closures. In addition to supporting affected workers at individual companies, Manitoba worked with the City of Thompson to support labour adjustment activities, retiree retention, economic development and infrastructure development activities in order to ensure the long-term sustainability of the community.
3.2.9 Saskatchewan
Saskatchewan's real GDP expanded by 1.3% in 2018, down from 1.7% in 2017. In 2019, the province's real GDP growth is projected to reach to about 1.2%.
Saskatchewan: EBSM key facts
For accessibility reasons, the table has been simplified. Consult the PDF version for the full table.
| Insured clients | Non-insured clients |
|---|---|
| 22,680 |
2,527 |
| Intervention type | FY1819 | Year-over-year change |
|---|---|---|
| Employment Benefits | 22,975 | 84.7% |
| Support Measures: EAS | 12,791 | 12.5% |
| Intervention type | FY1819 | Year-over-year change(pp) |
|---|---|---|
| Employment Benefits | 64.2% | 12.0 |
| Support Measures: EAS | 35.8% | 12.0 |
| Total expenditures | FY1819 ($ million) |
Year-over-year change |
|---|---|---|
| Employment Benefits | $30.3 | 2.6% |
| Support Measures: EAS | $10.9 | 100.9% |
| LMP and R&I | $1.9 | 0.9% |
| Total Expenditures1 | $43.0 | 12.1% |
1 Totals may not add up due to rounding; does not include accounting adjustments.
| FY1718 | FY1819 | Year-over-year change |
|---|---|---|
| $50.38 | $49.07 | 2.6% |
Labour market conditions improved in Saskatchewan in FY1819 over the previous year. After slightly declining by 1,800 (-0.3%) in FY1718, employment increased by 5,000 (+0.9%) in FY1819, with the majority of the gains in full-time positions (+4,000; +0.9%).
Despite the strengthening in employment aggregates, the unemployment rate edged down by 0.1 percentage point to 6.0%, due to an increase in the workforce size. Employment growth occurred mostly in the services-producing sector (+4,600; +1.1%), led by gains in health care, social assistance (+2,900; +3.9%), and educational services (+2,700; +6.7%). However, losses were recorded in wholesale and retail trade (-3,700; -4.1%), as well as in professional, scientific and technical services (- 2,500; -8.7%). Declines in construction (-1,200; -2.4%), forestry, fishing, mining, quarrying, and oil and gas (-1,100; -4.6%) were more than offset by gains in the other industries, led by a net increase of 1,800 positions in agriculture (+5.1%) and the goods-producing sector (+400; +0.3%).
Saskatchewan took a balanced approach to labour market development to meet the immediate needs of employers and workers, while ensuring a future supply of labour equipped to support continued economic growth and competitiveness. Activities included supporting unemployed workers back to employment, developing sources of labour currently not engaged or under-utilized in the labour force, and supporting employers in training their existing workforce to adapt to current and future challenges. Under-represented groups targeted by programs and services include Indigenous peoples, persons with disabilities, newcomers to Canada (including refugees), youth, women and older workers.
3.2.9.1 Managing for results
Saskatchewan was committed to engaging stakeholders in planning, priority-setting, policy development, program design and service delivery. Saskatchewan's regionally-based labour market delivery system facilitated continuous stakeholder engagement. The Ministry of Immigration and Career Training (ICT) had offices in ten communities across the province.
For example, these offices were aware of regional layoffs and recruitment challenges. They understood the unique set of education and employment barriers that groups in their regions faced. They heard from community-based organizations; training institutions; employers; job seekers; and agencies representing youth, Indigenous peoples, and individuals who are currently in, or recently released from, custody. Together with stakeholders, ICT identified labour market needs that required focused approaches and/or greater program investments. As a result, ICT launched several new projects:
- new Targeted Initiatives for Older Workers, to increase the employability of older workers
- enhanced Career Bridging, to address the needs of under-represented persons in the labour force
- the Wicehtowak Workforce Development Program, designed to improve the employment rate of Indigenous groups who are currently under-represented and/or facing barriers in the Saskatchewan workforce, and
- the Training Voucher Pilot, to provide funding for unemployed individuals (from specific sectors that have been impacted by changing economic conditions), to attend training to build skills that are in demand in Saskatchewan
Saskatchewan has completed the technical setup for a new data exchange infrastructure, established catchment areas, and completed training for establishing targets to pilot the Targeting, Referral and Feedback (TRF) initiative. Saskatchewan is currently testing a target group, to establish the internal processes for receiving the referral files, engaging with clients and responding with feedback.
3.2.9.2 Clients, interventions and expenditures
For a sixth consecutive year, Saskatchewan served a growing total number of clients, reaching 25,207 (+35.3%) in FY1819. While the number of active claimants (8,850) and non-insured clients (2,527) dropped by 6.3% and 49.8% respectively, that of former claimants (6,058) advanced by 45.8%. PPE clients, a new category, reached 7,772. As for their proportion relative to the total number of clients, active claimants (35.1%) and non-insured clients (10.0%) fell by 15.6 and 17.0 percentage points, respectively. The share of former claimants increased to 24.0% (+1.7 percentage point) and PPE clients accounted for 30.8% of all clients. The decline in the proportion of non-insured clients may be attributable to the new PPE category.
In FY1819, Saskatchewan delivered a total number of 35,766 interventions, representing a fourth consecutive year of growth. Similar to FY1718, the share of EAS continued to drop, representing 35.8% of all EBSM-similar interventions in FY1819. The share of Employment Benefits grew from 52.2% in FY1718 to 64.2% in FY1819. A total of 5,148 individuals (+5.5% year-over-year) returned to employment after participating in an EBSM-similar program, and unpaid EI benefits declined from $50.38 million to $49.07 million, a 2.6% year-over-year decrease. Expenditures for EBSM-similar programming expanded from $38.4 million to $43.0 million, representing a year-over-year increase of 12.1%. This included $6.1 million received by the province in FY1819, as part of the $225.0 million in additional LMDA funding from Budget 2017. This also included the province's shares of the additional targeted funding to help workers in seasonal industries ($400,000), and to support workers affected by trade disputes in the forest sector ($500,000) and the steel and aluminium ($700,000) industries.
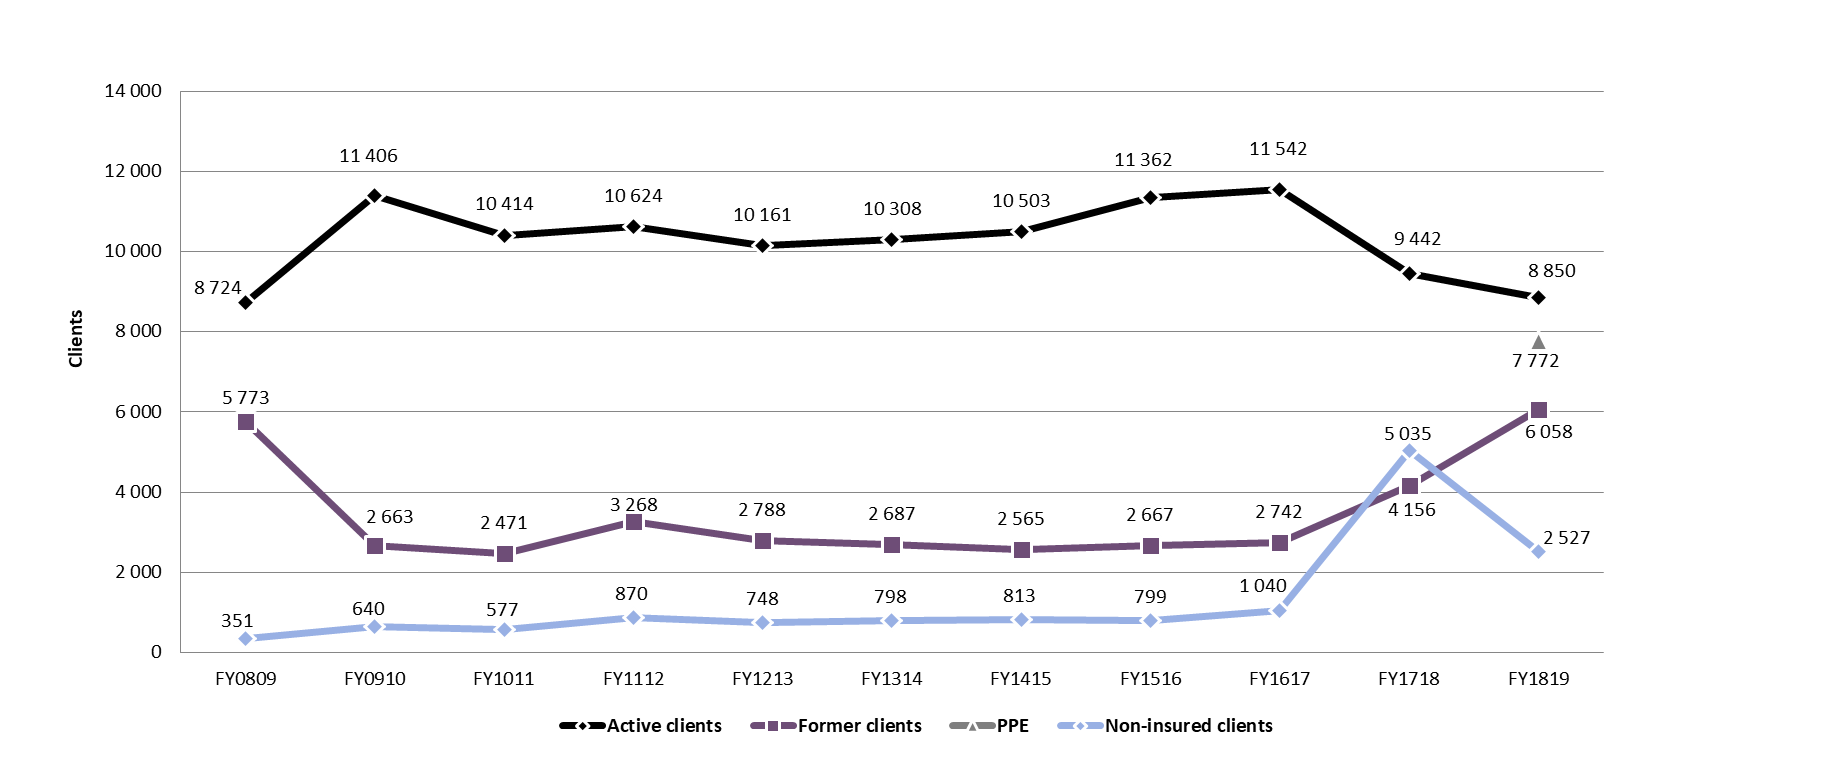
Chart 25 – Text version
| Client | FY0809 | FY0910 | FY1011 | FY1112 | FY1213 | FY1314 | FY1415 | FY1516 | FY1617 | FY1718 | FY1819 |
|---|---|---|---|---|---|---|---|---|---|---|---|
| Active clients | 8,724 | 11,406 | 10,414 | 10,624 | 10,161 | 10,308 | 10,503 | 11,362 | 11,542 | 9,442 | 8,850 |
| Former clients | 5,773 | 2,663 | 2,471 | 3,268 | 2,788 | 2,687 | 2,565 | 2,667 | 2,742 | 4,156 | 6,058 |
| PPE | n/a | n/a | n/a | n/a | n/a | n/a | n/a | n/a | n/a | n/a | 7,772 |
| Non-insured clients | 351 | 640 | 577 | 870 | 748 | 798 | 813 | 799 | 1,040 | 5,035 | 2,527 |
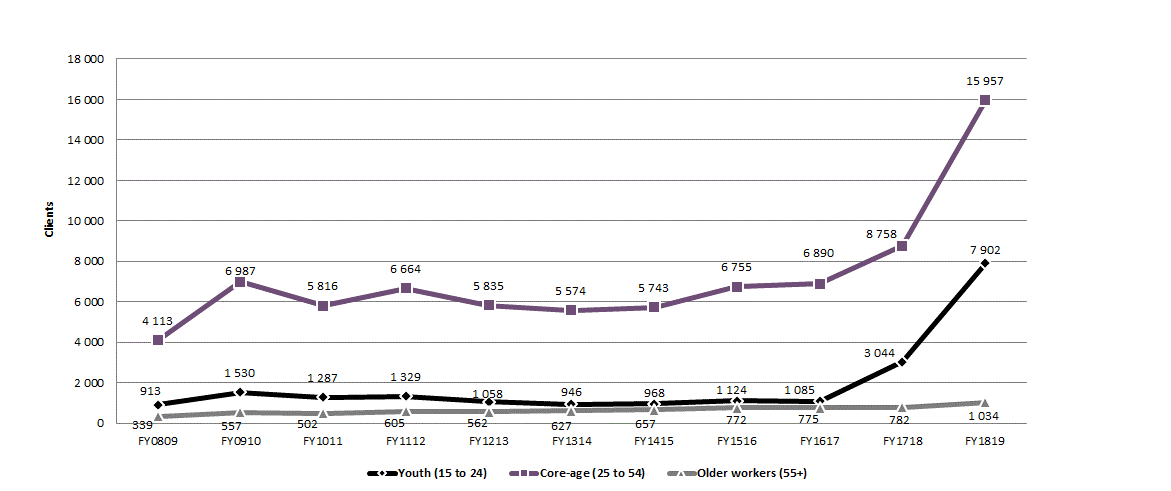
Chart 26 – Text version
| Age | FY0809 | FY0910 | FY1011 | FY1112 | FY1213 | FY1314 | FY1415 | FY1516 | FY1617 | FY1718 | FY1819 |
|---|---|---|---|---|---|---|---|---|---|---|---|
| Youth (15 to 24) | 913 | 1,530 | 1,287 | 1,329 | 1,058 | 946 | 968 | 1,124 | 1,085 | 3,044 | 7,902 |
| Core-age (25 to 54) | 4,113 | 6,987 | 5,816 | 6,664 | 5,835 | 5,574 | 5,743 | 6,755 | 6,890 | 8,758 | 15,957 |
| Older workers (55+) | 339 | 557 | 502 | 605 | 562 | 627 | 657 | 772 | 775 | 782 | 1,034 |

Chart 27 – Text version
| Key performance indicators | FY0809 | FY0910 | FY1011 | FY1112 | FY1213 | FY1314 | FY1415 | FY1516 | FY1617 | FY1718 | FY1819 |
|---|---|---|---|---|---|---|---|---|---|---|---|
| Returns to employment | 4,956 | 6,432 | 6,692 | 6,083 | 5,784 | 6,038 | 6,038 | 6,204 | 6,716 | 4,879 | 5,148 |
| Active claimants served | 8,724 | 11,406 | 10,414 | 10,624 | 10,161 | 10,308 | 10,503 | 11,362 | 11,542 | 9,442 | 8,850 |
| Total clients served | 14,848 | 14,709 | 13,462 | 14,762 | 13,697 | 13,793 | 13,881 | 14,828 | 15,324 | 18,633 | 25,207 |
| Estimated unpaid EI benefits ($ million) | $42,80 | $64,70 | $64,15 | $54,13 | $55,56 | $60,81 | $61,60 | $61,55 | $74,73 | $50,38 | $49,07 |
Table 13 - Saskatchewan: EBSM-Similar programming, FY1819
For accessibility reasons, the table has been simplified. Consult the PDF version for the full table.
| Employment benefits | Interventions | Year-over-year change |
Expenditures ($ 000s) |
|---|---|---|---|
| SD-R: Skills Training | Provincial Training Allowance | 15,783 | +126.7% | 29,952 |
| SD-A: Apprenticeship Training | 7,125 | +31.8% | |
| TWS: Skills Training Allocation | 0 | n/a | 0 |
| SE: Self-Employment Program | 67 | -4.3% | 339 |
| JCP: Employment Programs | 0 | n/a | 0 |
| Support measures | Interventions | Year-over-year change |
Expenditures ($ 000s) |
|---|---|---|---|
| EAS: Workforce Development | 12,791 | +12.5% | 10,885 |
| LMP: Regional Planning and Employer Partnerships | n/a | n/a | 1,405 |
| R&I: Research and Innovation | n/a | n/a | 451 |
3.2.9.3 Employment benefits
In Saskatchewan, Employment Benefit interventions increased significantly (+84.7%) year-over-year, to reach 22,975 in FY1819. This growth was largely due to SD-R (+8,821) and SD-A (+1,719), 126.7% and 31.8%, respectively. At the same time, SE (‑3) declined by 4.3%. The significant increase in the number of Skills Development interventions was attributed to the significant number of unemployed workers who lacked the skills needed for the jobs of today and the future. Employment Benefit expenditures decreased by 2.6%, to a total of $30.3 million.
EBSMs in action: Saskatchewan Skills Development - Essential Skills for the Workplace (ESWP)
Saskatchewan's essential skills training focuses on transitioning unemployed, under-represented or low literacy learners to employment. The majority of participants in essential skills programs are Indigenous peoples who lack essential skills (in other words, reading, numeracy, oral communication, computer skills, working with others); many have little work experience and even limited exposure to the world of work.
As an example, Saskatchewan's ESWP works closely with employers to ensure that students acquire skills for occupations that are in-demand. ESWP also includes work placements for specific occupations and supports the attainment of safety certificates when necessary. In addition, students are eligible for Provincial Training Allowance income support while they are enrolled in the program. Essential skills programs have included Early Childhood Education; Automotive Maintenance; Security Officer; Food Preparation; Service and Hospitality Industry; Oilfield Truck Operator; and others. Many essential skills programs are delivered in partnerships with employers or industry associations and with First Nation organizations.
3.2.9.4 Support measures (EAS)
In FY1819, Saskatchewan delivered 12,791 EAS interventions, representing 12.5% more than in FY1718. Growth in both employment services (+970; +16.3%) and individual counselling (+539; +10.7%) were partially offset by a drop in group services (-87; -22.5%). Compared to FY1718, EAS expenditures doubled from $5.4 million to $10.9 million (+100.9%). The increase was attributed to the province strengthening its approach to assessing the employability of clients and streaming clients into programs most conducive to their employability needs.
Josh received Employment Assistance Services
Saskatchewan's Workforce Development Program provides a flexible range of individual and group supports, programs, and services that enable participants to become job ready, attach to the labour market, and maintain employment. One of the LMDA-funded Workforce Development programs is the Prairie Employment Program (PEP) in North Battleford. This program works with unemployed and underemployed job seekers who have disabilities or multiple and significant barriers to employment. PEP assists job seekers with essential skills development, employment counselling, job search skills, and job coaching. In addition, PEP provides ongoing support to employers and clients to help employers find reliable and trustworthy employees and to help clients find meaningful work.
In January 2018, Josh came to PEP with a number of barriers to securing and maintaining employment: a partial grade 10 education, mental health issues, unreliable transportation, and a lack of employability skills. Josh's resume lacked vital information that could help his job search. In addition, he had weak interviewing skills because of low self-confidence. PEP offered Josh employment counselling, helped him revamp his resume, and helped him find employment with a painting company. They also gave him financial assistance to complete the required Safety Construction Orientation Training (SCOT). For well over a year, Josh has been working for the same employers who say that he is an incredibly hard worker. They have also noticed an improvement in his self-confidence. As a result of his positive employment experience and the encouragement of his employers, Josh is applying for his apprenticeship in painting. Josh says that he would not be where he is today without the support he received from PEP.
3.2.9.5 Other support measures: LMP and R&I
In FY1819, Saskatchewan's total LMP and R&I expenditures ($1.9 million) declined slightly (- 0.9%). Saskatchewan's R&I investments included a follow-up survey of clients in labour market programs, including those funded under the LMDA, and 2 program evaluations. One of the key findings identified in all 3 of the research activities was the increase of clients with mental health conditions. In response to these findings, ICT hosted mental health and career development workshops for ministry staff, third-party service providers and other human service ministries, to implement strategies for supporting or improving the mental health of clients through career development. Early feedback from those who participated in the training, indicated that staff have a better understanding of the relationship between mental health and employment.
3.2.10 Alberta
Following a 4.8% rise in 2017, Alberta's real GDP growth increased by 1.6% in 2018, while the national average was 2.0%. The province's real GDP growth is forecasted to have slowed down considerably in 2019, falling below 1.0%, before strengthening again in 2020.
Alberta: EBSM key facts
For accessibility reasons, the table has been simplified. Consult the PDF version for the full table.
| Insured clients | Non-insured clients |
|---|---|
| 51,787 |
31,484 |
| Intervention type | FY1819 | Year-over-year change |
|---|---|---|
| Employment Benefits | 18,132 | 10.8% |
| Support Measures: EAS | 140,687 | 4.3% |
| Intervention type | FY1819 | Year-over-year change(pp) |
|---|---|---|
| Employment Benefits | 11.4% | 0.7 |
| Support Measures: EAS | 88.6% | 0.7 |
| Total expenditures | FY1819 ($ million) |
Year-over-year change |
|---|---|---|
| Employment Benefits | $92.4 | 17.2% |
| Support Measures: EAS | $56.7 | 14.5% |
| LMP and R&I | $5.0 | 50.4% |
| Total Expenditures2 | $154.0 | 17.0% |
1 Alberta invested $2,929,005 of its total allocation towards administration costs, representing 10.0% of the Budget 2017 additional funding the Province received in FY1819.
2 Totals may not add up due to rounding and does not include accounting adjustments.
| FY1718 | FY1819 | Year-over-year change |
|---|---|---|
| $233.42 | $205.88 | 11.8% |
Informed by the needs of stakeholders, Alberta's labour market priorities in FY1819 were focussed on diversifying the economy, as it was recovering from the latest commodities downturn, serving under-represented groups including Indigenous peoples, persons with disabilities, newcomers and highly-barriered individuals, as well as getting Albertans back to work. The target clientele for this last priority are those recently unemployed, particularly those affected by layoffs in the coal, oil, gas, engineering and technology industries.
Labour market conditions improved for a second consecutive year in the province in FY1819. Employment increased by 34,600 (+1.5%), almost entirely in full-time positions (+34,100; +1.8%), while the unemployment rate decreased from 7.4% to 6.7%. This was 1.7 percentage points lower than the recent peak of 8.4% in FY1617 following the commodities downturn. Both goods-producing and services-producing sectors saw their employment levels increase. Manufacturing (+8,000; +6.5%), as well as forestry, fishing, mining, quarrying, oil and gas (+4,600; +3.1%) led employment growth in the goods-producing sector (+14,400; +2.5%) for a second consecutive year. Public administration (+9,500; +9.2%), health care and social assistance (+7,800; +2.9%), as well as business, building and other support services (+5,800; + 7.0%) led the growth in the services-producing sector (+20,200; +1.2%).
3.2.10.1 Managing for results
Alberta Advanced Education (AE) collaborates with job creators and post-secondary institutions on an on-going basis, to ensure the apprenticeship education programs meet industry and labour market needs. AE works with Alberta's industry network and the Alberta Apprenticeship and Industry Training Board, to develop and maintain program standards, and with post-secondary institutions to coordinate classroom instruction.
In FY1819, AE developed an online and automated process for apprentices to submit documents. This process replaces physical mail and/or the need to visit an office in-person. This approach makes it faster for many apprentices to register for classes. Nine publicly funded post-secondary providers now offer online class registrations via MyTradesecrets, an online service that provides clients and stakeholders with access to program information. Approximately 66.0% of all apprenticeship class registrations in FY1819 were online.
AE also developed a project to estimate apprenticeship class sizes. It uses Machine Learning, a statistical and computational model, to analyze key indicators (for example, data on apprenticeship and economic forecasts) and predict the demand for classroom instruction. The model helps AE meet the demand for classroom instruction, by planning for the corresponding spaces needed. This results in reduced expenses for the post-secondary system and increased value for apprentices continuing their education.
Targeting, Referral and Feedback (TRF), beginning in January 2018, Transition to Employment Services (TES) providers used TRF throughout Alberta to target their services to recently unemployed Albertans. TRF has been beneficial to connect EI clients to employment and training services in their own communities, including promoting programs intended for target client groups, such as mature workers and occupations in Alberta's resource sector which are experiencing a decline in employment, including engineers, geologists and technologists. Most TES providers make referrals based on the last occupation an individual entered on their EI application, according to the National Occupation Classification code; however, in some smaller communities, the criteria for selection is broadened to increase the number of referrals.
Targeting, Referral and Feedback in Alberta
In Spring 2019, a security company approached a Calgary TES provider requesting help recruiting security staff. The provider hosted an employer hiring event at their office and contacted all TRF referrals whose last occupation was in the security industry. Of the referrals contacted, 15 attended the event and 9 were hired on the spot. The remaining candidates attended an information session to access further services.
3.2.10.2 Clients, interventions and expenditures
For a third consecutive year, the total number of clients served in Alberta fell, totalling 83,271 (-7.3%) in FY1819. With the exception of PPE (8,388), a new client category, all other client types declined, with active claimants (30,363), former claimants (13,036) and non-insured clients (31,484) dropping by 13.5%, 17.8% and 19.1%, respectively. With regards to their shares relative to the total number of clients, the proportion of each client type declined as follows: active claimants (36.5%), former claimants (15.7%), and non-insured clients (37.8%) decreased by 2.6, 2.0 and 5.5 percentage points, respectively. The decline in the proportion of non-insured clients may be attributable to the new PPE category, which accounted for 10.1% of all clients.
For a third consecutive year, the total number of interventions delivered in Alberta dropped, reaching 158,819 (-5.1%) in FY1819. While the share of Employment Benefits (11.4%) contracted by 0.7 percentage point, that of EAS (88.6%) expanded (+0.7 percentage point), for the first time since FY1011. In total, 18,669 individuals (-0.3%) became employed after participating in EBSM-similar programming, and unpaid EI benefits reached $205.88 million, a year over year drop of 11.8%. Total LMDA expenses grew by 17.0% to $154.0 million. This included $29.3 million as part of a $225.0 million envelope in additional LMDA funding, announced in Budget 2017.
On top of these expenditures, $3.3 million was made available to the province under the additional targeted funding measures to support workers in seasonal industries and those affected by trade disputes in the steel and aluminum industries, and the forest sector, which the province did not access.

Chart 28 – Text version
| Client | FY0809 | FY0910 | FY1011 | FY1112 | FY1213 | FY1314 | FY1415 | FY1516 | FY1617 | FY1718 | FY1819 |
|---|---|---|---|---|---|---|---|---|---|---|---|
| Active clients | 46,385 | 61,503 | 48,917 | 41,394 | 39,823 | 42,472 | 43,398 | 51,694 | 49,720 | 35,101 | 30,363 |
| Former clients | 16,245 | 18,168 | 22,683 | 20,966 | 18,234 | 16,819 | 15,820 | 16,213 | 14,087 | 15,856 | 13,036 |
| PPE | n/a | n/a | n/a | n/a | n/a | n/a | n/a | n/a | n/a | n/a | 8 388 |
| Non-insured clients | 69,072 | 76,097 | 72,284 | 65,098 | 62,404 | 63,516 | 60,344 | 60,191 | 54,258 | 38,909 | 31,484 |
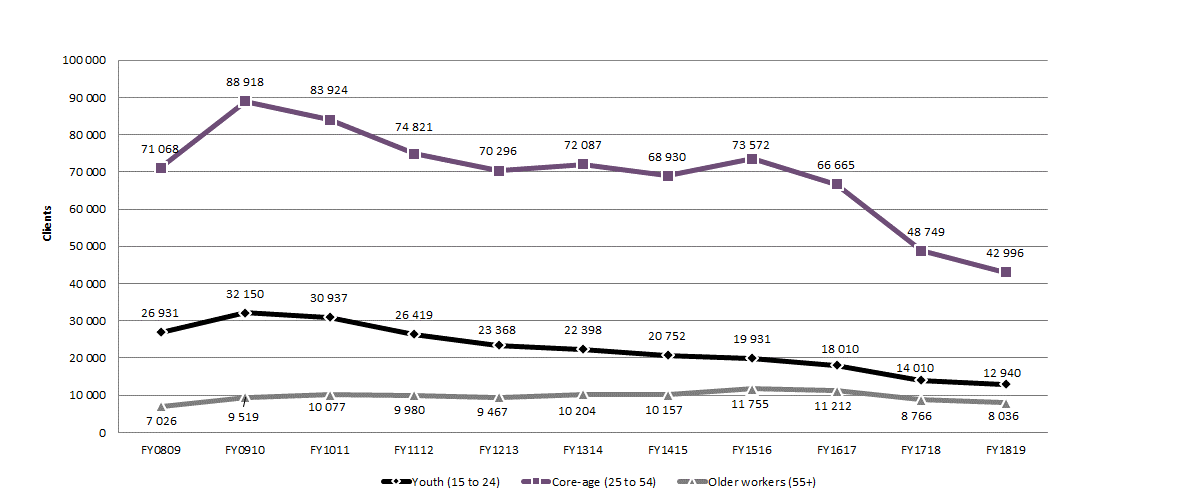
Chart 29 – Text version
| Age | FY0809 | FY0910 | FY1011 | FY1112 | FY1213 | FY1314 | FY1415 | FY1516 | FY1617 | FY1718 | FY1819 |
|---|---|---|---|---|---|---|---|---|---|---|---|
| Youth (15 to 24) | 26,931 | 32,150 | 30,937 | 26,419 | 23,368 | 22,398 | 20,752 | 19,931 | 18,010 | 14,010 | 12,940 |
| Core-age (25 to 54) | 71,068 | 88,918 | 83,924 | 74,821 | 70,296 | 72,087 | 68,930 | 73,572 | 66,665 | 48,749 | 42,996 |
| Older workers (55+) | 7,026 | 9,,519 | 10,077 | 9,980 | 9,467 | 10,204 | 10,157 | 11,755 | 11,212 | 8,766 | 8,036 |
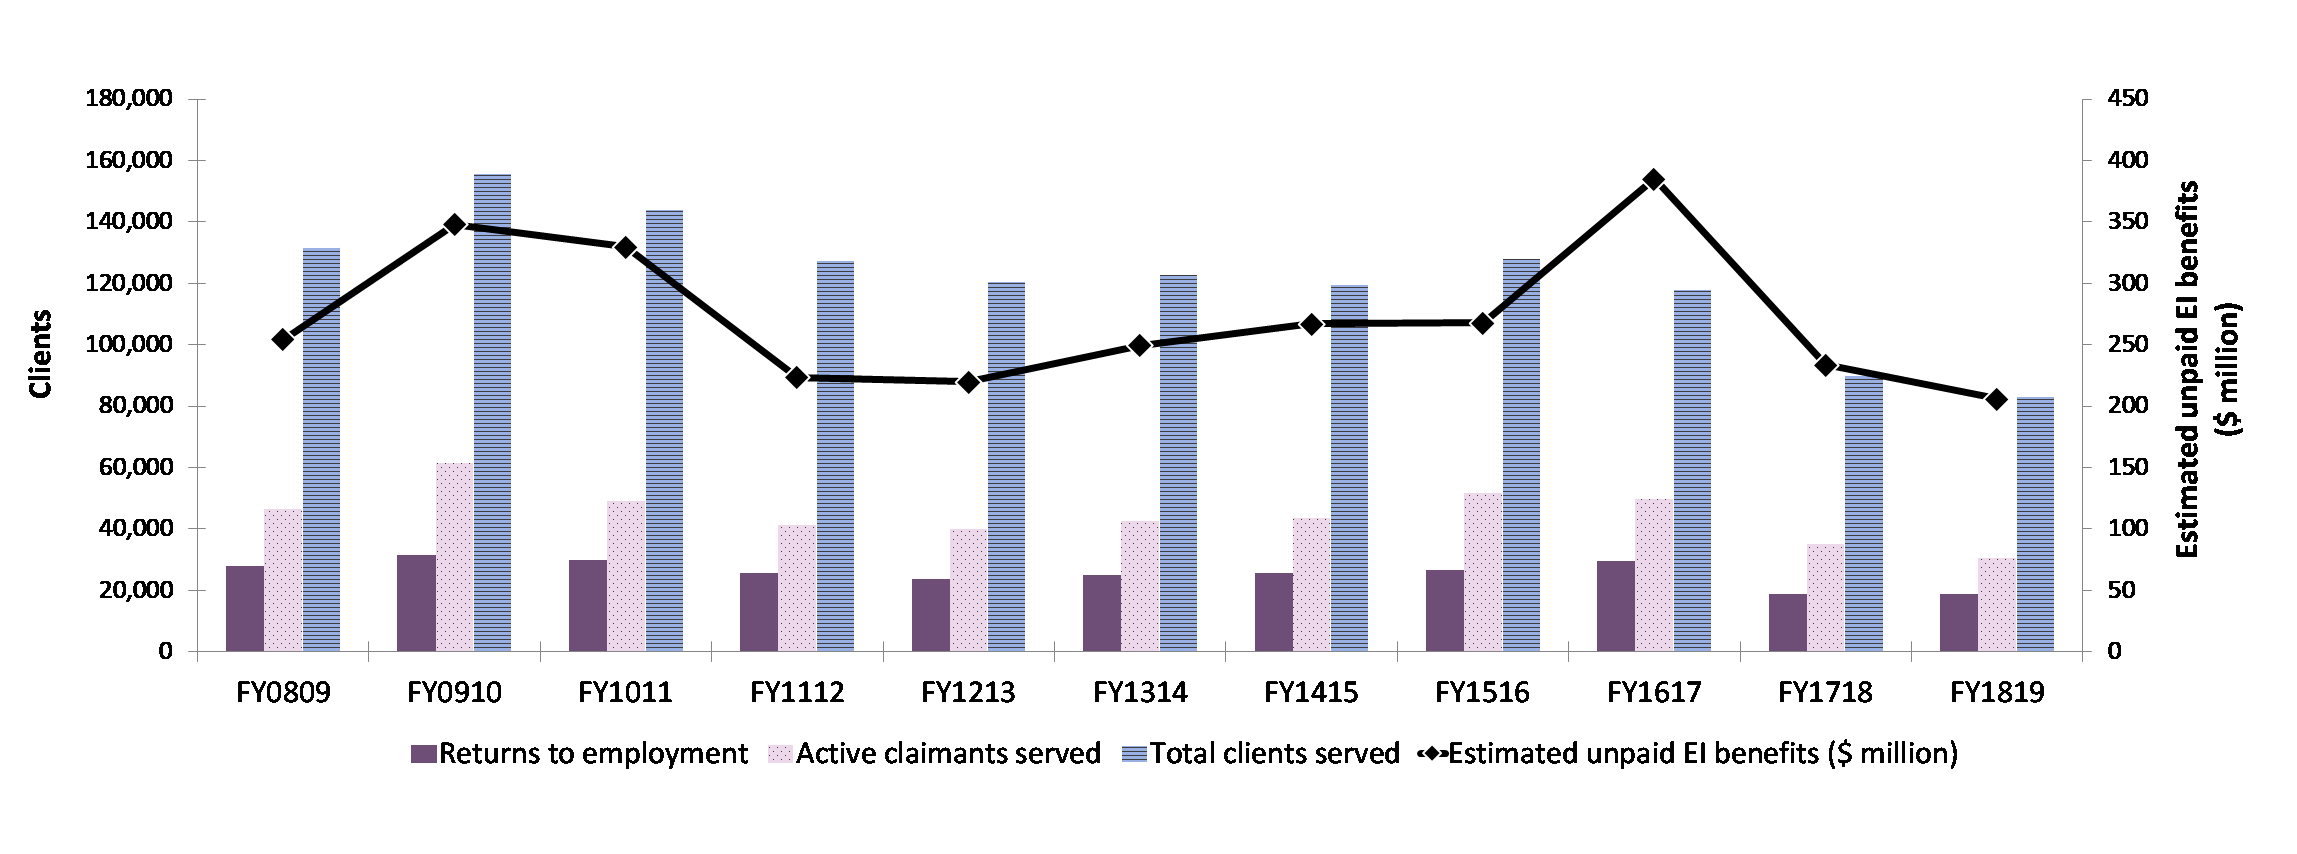
Chart 30 – Text version
| Key performance indicators | FY0809 | FY0910 | FY1011 | FY1112 | FY1213 | FY1314 | FY1415 | FY1516 | FY1617 | FY1718 | FY1819 |
|---|---|---|---|---|---|---|---|---|---|---|---|
| Returns to employment | 27,869 | 31,341 | 29,890 | 25,776 | 23,686 | 25,092 | 25,745 | 26,525 | 29,671 | 18,726 | 18,669 |
| Active claimants served | 46,385 | 61,503 | 48,917 | 41,394 | 39,823 | 42,472 | 43,398 | 51,694 | 49,720 | 35,101 | 30,363 |
| Total clients served | 131,702 | 155,768 | 143,884 | 127,458 | 120,461 | 122,807 | 119,562 | 128,098 | 118,065 | 89,866 | 83,271 |
| Estimated unpaid EI benefits ($ million) | $254,39 | $347,95 | $329,59 | $223,61 | $219,63 | $249,34 | $266,98 | $267,88 | $384,91 | $233,42 | $205,88 |
Table 14 - Alberta: EBSM-Similar programming, FY1819
For accessibility reasons, the table has been simplified. Consult the PDF version for the full table.
| Employment benefits | Interventions | Year over year change |
Expenditures ($ 000s) |
|---|---|---|---|
| SD-R: Occupational Training Work Foundations | 1,284 | +11.7% | 75,494 |
| SD-A: Skills Development-Apprenticeship | 15,422 | -13.0% | |
| TWS: Workplace Training | 179 | +40.9% | 1,662 |
| SE: Self‑Employment | 260 | -13.9% | 1,906 |
| JCP: Integrated Training | 987 | -3.8% | 13,323 |
| Support measures | Interventions | Year over year change |
Expenditures ($ 000s) |
|---|---|---|---|
| EAS: Career Information | 140,687 | -4.3% | 56,657 |
| LMP: Workforce Partnerships | n/a | n/a | 4,995 |
3.2.10.3 Employment benefits
For a third consecutive year, the number of Employment Benefit interventions delivered by Alberta fell, reaching 18,132 (-10.8%) in FY1819. While the number of Self-Employment (SE) (-42; -13.9%), Job Creation Partnership (JCP) (-39; -3.8%) and SD-A (- 2,301; -13.0%) interventions declined, gains were recorded in Targeted Wage Subsidy (TWS) (+52; +40.9%), and Skills Development-Regular (SD-R) (+134; +11.7%). The province spent $92.4 million on Employment Benefits (+17.2%).
The apprenticeship and industry training system is responsive to industry demand. Historically, changes in demand for training lag behind the economic changes that drive demand for skilled tradespeople in the workforce. In response to the economic downturn that began in 2014, fewer new apprentices registered in 2015 and 2016, and attendance began to decline significantly in FY1718 and continued in FY1819. This decline accounts for the majority of Alberta's decrease in the number of Employment Benefit interventions delivered.
Crane training opportunity lifts mom's career - Skills Development - Apprentice
Sandra first began studying for a career in Human Resources over 10 years ago, but had to abandon school to take care of her ailing mother and young disabled daughter. After working in Alberta's energy industry as a heavy equipment operator, Sandra wanted to advance her career further. After a while, she impressed a Local 955 union Business Agent who entered her name in a lottery for a training position as a Crane and Hoisting Equipment Operator.
Sandra was thrilled to win the lottery, but was concerned about the testing, because she considered herself to be a poor exam writer. Sandra dug deep and poured herself into the training materials—spending hours studying. It was difficult balancing work, studying and family obligations, but Sandra persevered. Sandra's “aha” moment came after one particularly tough exam when she realized that she was one of the few students who actually understood the intricacies of the problems. That's when she realized, “I deserve this.”
Sandra used her new found confidence to complete her exams and become an Apprentice Crane and Hoisting Equipment Operator-Mobile Crane. Sandra is now looking forward to receiving her Journeyperson ticket in her trade this year. Sandra's advice to any other apprentices who may be struggling is, “Stay encouraged, surround yourself with people willing to pass on their knowledge and never stop learning.” Sandra is grateful to her Alberta Apprenticeship and Industry Training Officer, her Local 955, and mentors she met through the union and in her workplace for sharing their knowledge, supporting her and giving her the chance to succeed.
3.2.10.4 Support measures: Employment Assistance Services (EAS)Footnote 15
Alberta delivered fewer EAS interventions —delivered solely through Employment Services— in FY1819 compared to FY1718, for a total of 140,687 (-6,368; -4.3%). EAS total expenditures jumped from $49.5 million to $56.7 million, a 14.5% year-over-year increase.
Alberta job seekers benefited from the expanded Transition to Employment Services program in FY1819. The program helps unemployed Albertans update and adjust their existing skills to new occupations in emerging sectors through short-term skills training, job search supports, unpaid work exposure and job placement services. The Transition to Employment Services program continued to increase the number of eligible Albertans served, due to new services set up in Medicine Hat, Red Deer, Cold Lake, Bonnyville and Fort McMurray in FY1819.
3.2.10.5 Other support measures: LMP
Compared to FY1718, total funding for LMP grew by 50.4% to $5.0 million. In total, 57 organizations participated in LMP in FY1819 in Alberta. There were no reported expenditures under Research and Innovation in FY1819.
The LMP grant program supports workplace human resource development and labour market adjustment strategies through community partnerships. Grant projects were conducted to assess regional or industry labour markets, address labour market issues identified by communities/employers/industry, and share best practices related to workforce development. Sixteen LMP grants were provided to Indigenous communities and stakeholders throughout Alberta. The projects supported local labour market needs and created opportunities that improved Indigenous participation in the workforce. The Indigenous LMP projects reached 4,165 Indigenous stakeholders, job seekers and employers in the province and included job and career fairs, labour market analysis surveys, Indigenous occupational and cultural awareness and improving access to both employers and jobseekers.
EBSMs in action: LMP
Alberta is a leading producer of remotely piloted aircraft systems, simulation and computer-based training systems and aircraft manufacturing.
According to the Canadian Council for Aviation and Aerospace, the aviation and aerospace sector is facing extreme labour shortages. Workers are needed in every segment of the sector including pilots, ground crew, technicians and mechanics. Careers in the aviation industry are typically marketed to men. Women hold the majority of lower paid jobs in the industry (for example, flight attendants, administrative work and check-in agents) while Indigenous peoples comprise only 3.0% of the Canadian aviation workforce.
Elevate Aviation's Career Exploration Workshops Project supports mitigating these workforce imbalances by creating linkages between Industry and Albertans through targeted career streams. This project will attract more individuals from under-represented groups into aviation by building awareness of careers and employment opportunities in aviation. Approximately 50 volunteers from Elevate's industry partners have created and delivered program content for 6 targeted career streams:
- airport maintenance
- airport operations
- air traffic services
- flight education
- technology, and
- Military careers
Workshops ran from March 4, 2019 until May 31, 2019, with 6 weeks designed for students, 2 weeks for Indigenous peoples and 2 weeks for adult women. Of the 224 participants who attended the workshops, 55.0% were female. Due to demand, Elevate has scheduled additional career workshops for fall 2019. The workshops encourage adult participants to pursue a career in aviation and build future capacity for youth, through exposure to career pathways in the aviation industry.
3.2.11 British Columbia
British Columbia's real GDP growth (+2.6%) exceeded the national average (+2.0%) for a fifth consecutive year in 2018. The province's economic growth is projected to be 2.4% in 2019.
British Columbia: EBSM key facts
For accessibility reasons, the table has been simplified. Consult the PDF version for the full table.
| Insured clients | Non-insured clients |
|---|---|
| 38,358 |
23,332 |
| Intervention type | FY1819 | Year-over-year change |
|---|---|---|
| Employment Benefits | 20,182 | 6.1% |
| Support Measures: EAS | 141,289 | 13.7% |
| Intervention type | FY1819 | Year-over-year change(pp) |
|---|---|---|
| Employment Benefits | 12.5% | 0.9 |
| Support Measures: EAS | 87.5% | 0.9 |
| Total expenditures | FY1819 ($ million) |
Year-over-year change |
|---|---|---|
| Employment Benefits | $179.6 | 9.9% |
| Support Measures: EAS | $99.7 | 2.0% |
| LMP and R&I | $26.0 | 10.6% |
| Total Expenditures1 | $305.4 | 3.7% |
1 Totals may not add up due to rounding and does not include accounting adjustments.
| FY1718 | FY1819 | Year-over-year change |
|---|---|---|
| $136.56 | $136.81 | 0.2% |
Labour market conditions in British Columbia continued to improve in FY1819, but at a slower rate than in previous years. Employment grew by 34,500 (+1.4%), less than half the rate of growth of FY1617 and FY1718. The unemployment rate declined to 4.7%, one of the lowest among all provinces and territories, as the number of unemployed individuals continued to decrease (-7,100; -5.5%). Employment growth was entirely realized in the services producing sector (+37,800; +1.9%), led by gains in professional, scientific and technical services (+15,200; +7.6%), accommodation and food services (+11,600; +6.4%), as well as in health care and social assistance (+10,400; +3.3%). Losses were registered in finance, insurance, real estate, rental and leasing (-7,200; -4.6%), and in wholesale and retail trade (‑6,500; - 1.7%). In the goods-producing sector (-3,300; -0.7%), declines in manufacturing (-4,100; -2.3%) and agriculture (-2,000; - 7.6%) were partially offset by a gain in construction (+2,600; +1.1%).
British Columbia's priorities for FY1819 aimed at strengthening the province's labour market, by delivering responsive programs and services to better align skills training with local labour market needs. This included:
- investments in training to better align British Columbians with sustainable job opportunities and to meet employer demands
- implementation strategies to engage all British Columbians, including underrepresented groups
- partnerships with local communities and organizations to further develop and increase community-based partnerships across the province, and
- leveraging and enhancing labour market information and knowledge
3.2.11.1 Managing for results
Targeting, Referral and Feedback Initiative
In the fall of 2016, British Columbia launched the Targeting, Referral and Feedback (TRF) initiative across the province. This assisted EI applicants return to employment more quickly, by effectively identifying and connecting these individuals with their local WorkBC Centre. In FY1819, more than 2,700 EI applicants referred through TRF began working with a WorkBC Case Manager, and more than 2,000 achieved employment (including TRF-referred clients who began service in previous years). The clients achieved employment in a wide range of occupations, including high‑demand occupations such as financial auditors and accountants, administrative officers, and information system analysts and consultants.
The employment service delivery contracts for WorkBC expired on March 31, 2019. British Columbia worked closely with its contracted Service Providers to ensure TRF referred clients transitioned smoothly into the renewed WorkBC program.
Stakeholder Engagement
In preparation for the launch of the renewed WorkBC program, and to market Community and Employer Partnership, British Columbia engaged various ministries, local governments, and key stakeholders, such as industry leaders and employers through outreach activities.
These activities included:
- working with the Ministry of Advanced Education, Skills and Training (AEST), Community Living BC, and Services to Adults with Developmental Disabilities, to ensure WorkBC and other community programs are complementary, streamline client referral processes between programs and ensure marketing materials are up to date
- marketing WorkBC services and Community and Employer Partnership funding opportunities to communities impacted by employer closures, downturns in specific sectors, as well as impacts from events such as pine beetles, wildfires and floods
- promoting the Employer Sponsored Training program under the Labour Market Partnerships (LMP) support measure to eligible employers, by offering financial assistance to support training activities for employees who would otherwise lose their jobs
- working with AEST and the Ministry of Forest, Lands and Natural Resource Operations and Rural Development, to ensure complementary programming between Community and Employer Partnership and other programs
To further this work, British Columbia is building a new Employment Opportunities Development team, to establish relationships with employers from across the province, so the province can obtain feedback on how the program can best assist with meeting their staffing needs, as well as generating opportunities for people seeking employment.
Renewed WorkBC Employment Services
The employment service delivery contracts for WorkBC expired on March 31, 2019, and British Columbia took this opportunity to change the WorkBC employment services model. The new model incorporated outcomes and feedback from stakeholder engagement, conducted throughout the years, and included recommendations from the independent, third-party Program Evaluation concluded in 2016. Program renewal activities included drafting of new contracts, procurement, systems design, cost analysis and training in FY1819.
Key changes to the program allow British Columbia to better align skills training with employer demands, focus on sustainable outcomes, and achieve consistency in services available to British Columbians across the province.
Through a procurement process, 47 new contracts took effect on March 1, 2019. Collaboration between British Columbia and new service providers allowed for seamless transition from old to new contractors, and led to a successful launch of WorkBC Centres on April 1, 2019.
3.2.11.2 Clients, interventions and expenditures
British Columbia served 61,690 clients (-10.6% year-over-year) in FY1819, representing a fifth consecutive year of decline. With the exception of PPE (2,904), a new insured client segment, all other client types dropped as follows: active claimants (28,399), former claimants (7,055), and non-insured clients (23,332), by 13.6%, 30.9%, and 9.9%, respectively. The decrease in non-insured could be due to the new PPE category. As for their shares relative to the total number of clients, active claimants (46.0%) and former claimants (11.4%) decreased by 1.6 and 3.4 percentage points, respectively, while the proportion of non-insured clients (37.8%) remained relatively unchanged (+0.3 percentage point). The new PPE client type accounted for 4.7% of all clients served.
For a fifth consecutive year, British Columbia delivered a decreasing number of interventions, for a total of 161,471 (-12.8%) in FY1819. Similar to the previous fiscal years, EAS remained the most delivered intervention type, and accounted for 87.5% of all interventions. In total, 21,515 individuals (+2.5%) returned to work after participating in EBSM-similar programming, and unpaid EI benefits ($136.81 million) remained relatively stable (+0.2%) compared to FY1718. Total EBSM expenditures reached $305.4 million (+3.7%) in FY1819, including $22.8 million of the $225.0 million LMDA additional funding announced in Budget 2017. British Columbia also received additional targeted LMDA funding through the following special measures: $5.0 million to support workers affected by a trade dispute in the forest sector, $1.6 million to support workers affected by the steel and aluminum trade dispute, as well as close to $1.0 million to support workers in seasonal industries.
Additional financial support provided to British Columbia in FY1819 was used to address the impact on communities affected by trade disputes, with a focus on supports such as retraining. WorkBC Centres providing client services in communities with increasing client volumes were provided additional funding to meet demands. $1.34 million of additional funding was added to 10 communities in British Columbia during the year.
Funding also went into Community and Employer Partnerships (CEP) supported projects that offered skills training and work experience, with an investment of $1.6 million into 6 projects in communities affected by the forestry sector downturn. Due to the timing of Budget 2017 top-up transfers, $2.0 million in unspent LMDA funding was returned to Canada.
Downturns in the forestry sector and seasonal wildfires have had an impact on several rural communities. In response, WorkBC has been able to support communities through a number of CEP projects.
The Fire Mitigation Project is a Job Creation Partnership project coordinated by the Thompson Nicola Cariboo United Way. This project will complete fire mitigation activities, including wildfire site reclamation and restoration for 160 properties in Ashcroft/Cache Creek, 100 Mile House, Williams Lake and Quesnel, areas that have historically been impacted by wildfires.
The Ministry of Social Development and Poverty Reduction (SDPR) is providing over $725,000 to fund the project, which will provide a minimum of 20 participants with training and work experience in conducting property assessments, fire mitigation and restoration activities, all of which will increase their opportunities to find sustainable employment. The communities will benefit from knowing they are better prepared for the fire season, especially vulnerable citizens who may have limited capacity to undertake fire mitigation activities themselves.
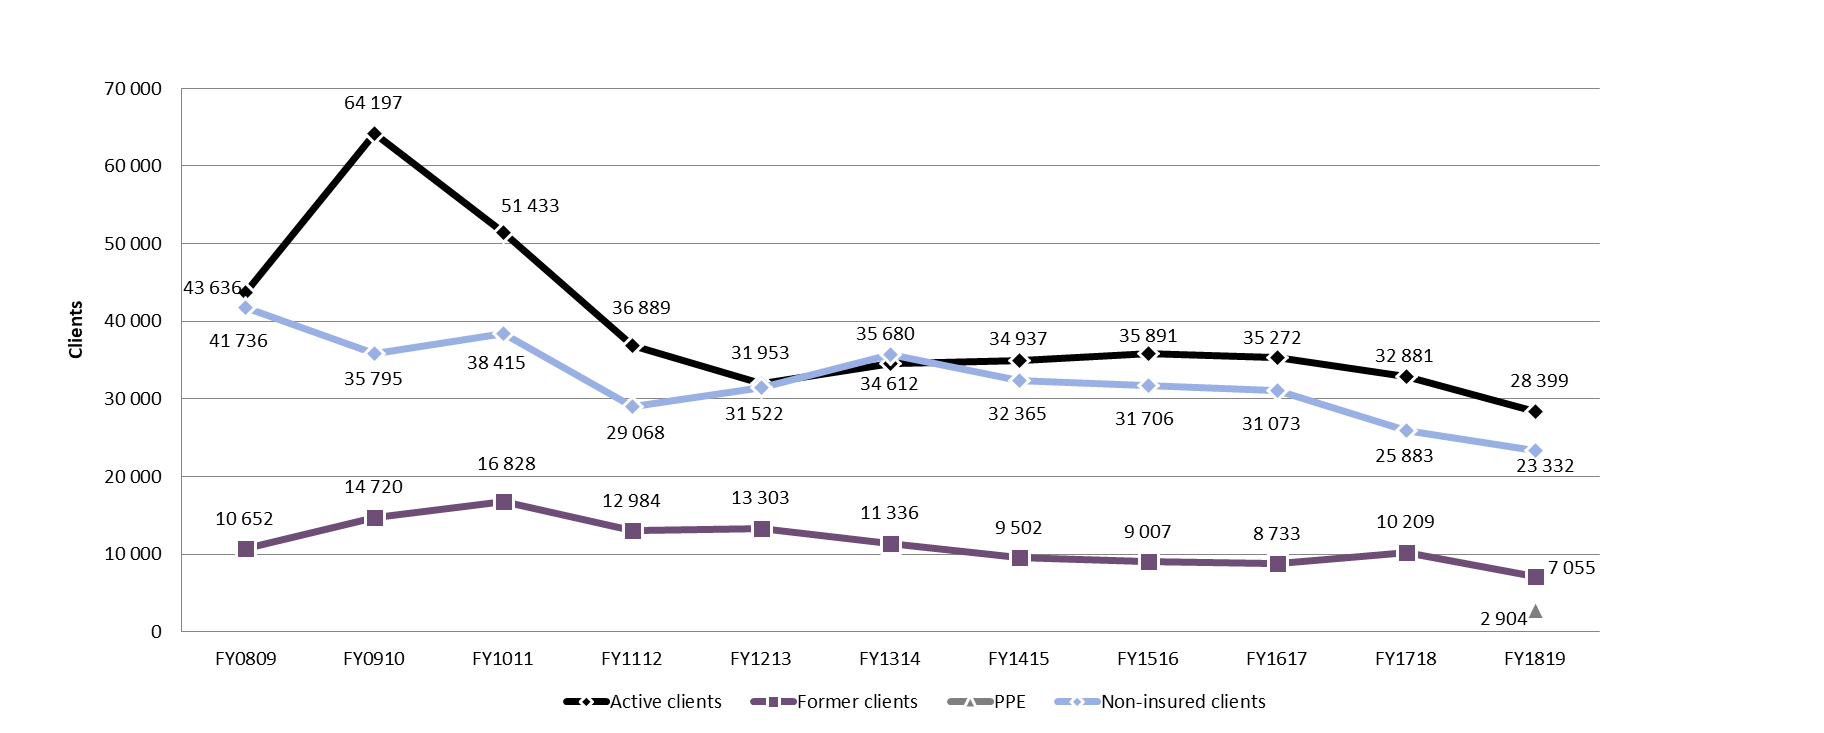
Chart 31 – Text version
| Client | FY0809 | FY0910 | FY1011 | FY1112 | FY1213 | FY1314 | FY1415 | FY1516 | FY1617 | FY1718 | FY1819 |
|---|---|---|---|---|---|---|---|---|---|---|---|
| Active clients | 43,636 | 64,197 | 51,433 | 36,889 | 31,953 | 34,612 | 34,937 | 35,891 | 35,272 | 32,881 | 28,399 |
| Former clients | 10,652 | 14,720 | 16,828 | 12,984 | 13,303 | 11,336 | 9,502 | 9,007 | 8,733 | 10,209 | 7,055 |
| PPE | n/a | n/a | n/a | n/a | n/a | n/a | n/a | n/a | n/a | n/a | 2,904 |
| Non-insured clients | 41,736 | 35,795 | 38,415 | 29,068 | 31,522 | 35,680 | 32,365 | 31,706 | 31,073 | 25,883 | 23,332 |
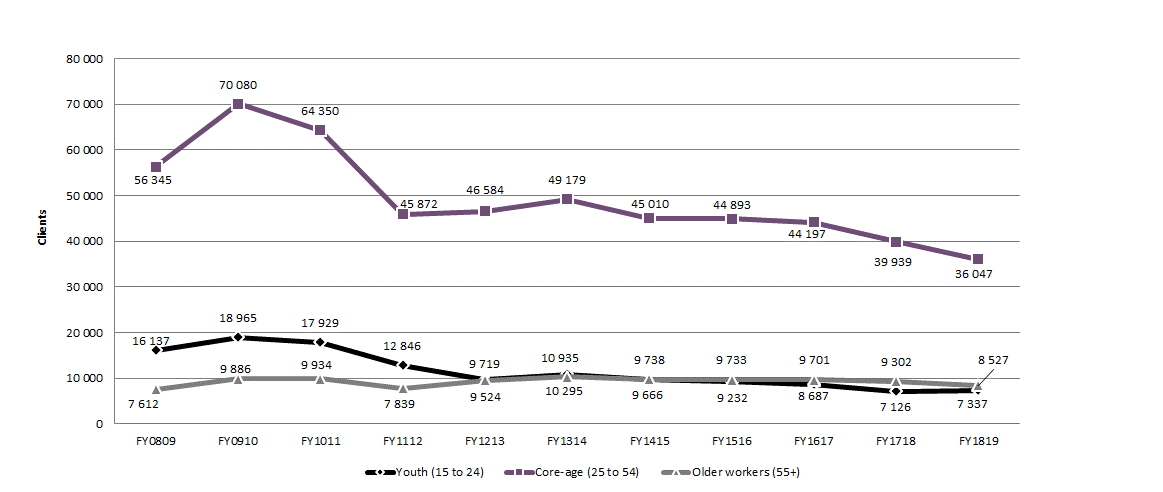
Chart 32 – Text version
| Age | FY0809 | FY0910 | FY1011 | FY1112 | FY1213 | FY1314 | FY1415 | FY1516 | FY1617 | FY1718 | FY1819 |
|---|---|---|---|---|---|---|---|---|---|---|---|
| Youth (15 to 24) | 16,137 | 18,965 | 17,929 | 12,846 | 9,719 | 10,935 | 9,666 | 9,232 | 8,687 | 7,126 | 7,337 |
| Core-age (25 to 54) | 56,345 | 70,080 | 64,350 | 45,872 | 46,584 | 49,179 | 45,010 | 44,893 | 44,197 | 39,939 | 36,047 |
| Older workers (55+) | 7,612 | 9,886 | 9,934 | 7,839 | 9,524 | 10,295 | 9,738 | 9,733 | 9,701 | 9,302 | 8,527 |
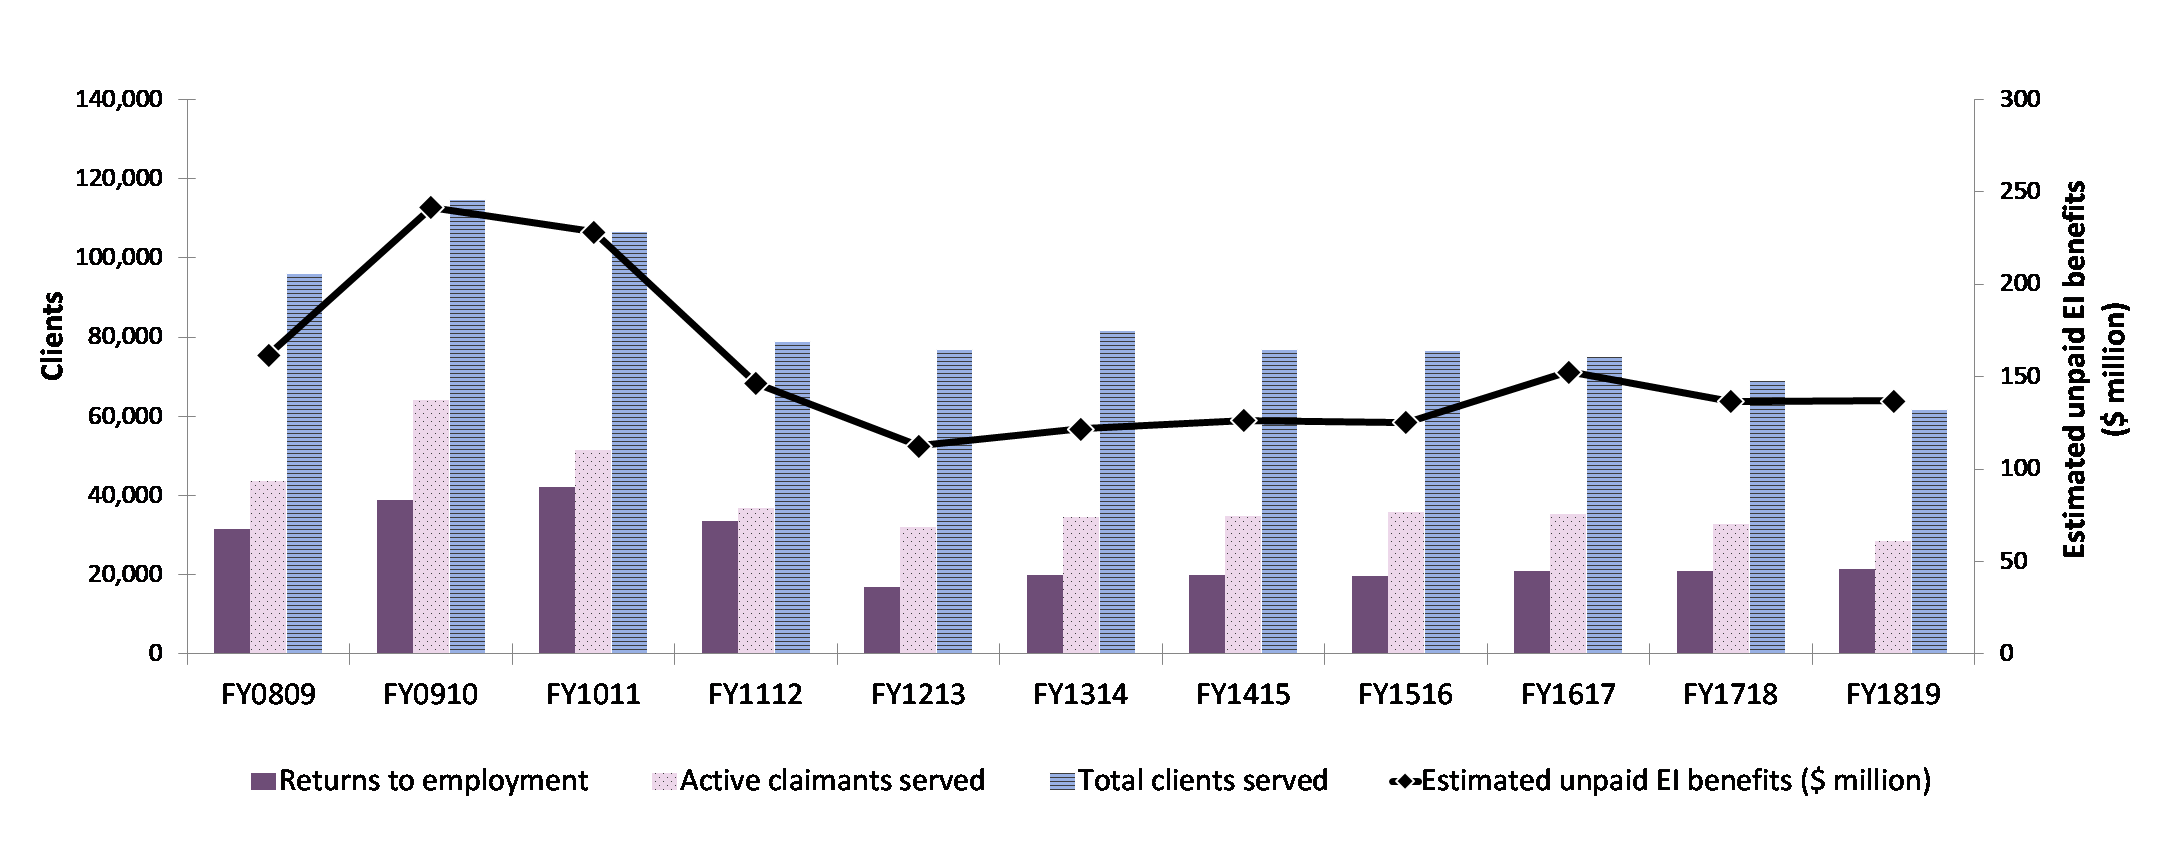
Chart 33 – Text version
| Key performance indicators | FY0809 | FY0910 | FY1011 | FY1112 | FY1213 | FY1314 | FY1415 | FY1516 | FY1617 | FY1718 | FY1819 |
|---|---|---|---|---|---|---|---|---|---|---|---|
| Returns to employment | 31,607 | 38,931 | 42,082 | 33,580 | 16,777 | 20,040 | 19,818 | 19,552 | 21,050 | 20,997 | 21,515 |
| Active claimants served | 43,636 | 64,197 | 51,433 | 36,889 | 31,953 | 34,612 | 34,937 | 35,891 | 35,272 | 32,881 | 28,399 |
| Total clients served | 96,024 | 114,712 | 106,676 | 78,941 | 76,778 | 81,628 | 76,804 | 76,604 | 75,078 | 68,973 | 61,690 |
| Estimated unpaid EI benefits ($ million) | $161,76 | $241,66 | $228,44 | $146,43 | $112,51 | $121,85 | $126,47 | $125,29 | $152,70 | $136,56 | $136,81 |
Table 15 - British Columbia: EBSM-similar programming, FY1819
For accessibility reasons, the table has been simplified. Consult the PDF version for the full table.
| Employment benefits | Interventions | Year-over-year change |
Expenditures ($ 000s) |
|---|---|---|---|
| SD-R: Skills Development Employment Benefit | 2,944 | -15.8% | 148,902 |
| SD-A: Skills Development Employment Benefit - Apprenticeship | 13,843 | +2.1% | |
| TWS: Wage Subsidies | 1,501 | -20.9% | 9,037 |
| SE: Self-Employment | 1,690 | -27.4% | 14,178 |
| JCPJCP: Job Creation Partnerships | 204 | -6.0% | 7,484 |
| Support measures | Interventions | Year-over-year change |
Expenditures ($ 000s) |
|---|---|---|---|
| EAS: Employment Assistance Services | 141,289 | -13.7% | 99,723 |
| LMP: Labour Market Partnerships Employer Sponsored Training |
n/a | n/a | 10,955 |
| R&I: Research and Innovation | n/a | n/a | 15,080 |
3.2.11.3 Employment benefits
In FY1819, the total number of Employment Benefit interventions (20,182) delivered in British Columbia decreased by 6.1% year over year. While SD-A (+283; +2.1%) advanced, TWS (-396; -20.9%), SE (-638; - 27.4%), JCP (-13; -6.0%), and SD-R (-552; -15.8%) experienced declines. The province spent $179.6 million (+9.9%) on Employment Benefits. While the number of clients accessing WorkBC Employment Services declined, the average cost of training related services and living supports have continued to increase in WorkBC over the last 3 years. This is consistent with Statistics Canada reported increases in average tuition fees and the Consumer Price Index in British Columbia.
In FY1819, additional financial support provided to British Columbia addressed the impacts on communities affected by trade disputes, and focused on retraining. WorkBC Centres in communities with increasing client volumes were provided additional funding to meet demands. Funding also went to the Community and Employer Partnership supported projects that offered skills training and work experience, with an investment of $1.6 million in 6 projects, for communities affected by the forest sector downturn.
The Silent Green - Self Employment
Magali is a francophone client living in a remote area working as a gardener. She had to leave her job because the use of gas-powered equipment had a negative impact on her health. She enjoyed working as a gardener and was searching for ways to continue without the negative impacts.
At the WorkBC centre, Magali discussed self-employment options with an advisor and attended information sessions prior to applying to the Self-Employment (SE) program. Magali completed 10 weeks of classes to build a viable business plan which led to the launch of her business, the Silent Green. The Silent Green is an eco-friendly, zero-carbon emission, all electric gardening service on the Sunshine Coast. Her customers include both residential and commercial properties.
Magali received on-going coaching from her advisor and has successfully grown her business to more than 40 clients mostly through word-of-mouth.
New career - Skills Training
Jasmine had been working for over 10 years as a hairdresser but had to change careers due to a severe medical condition that affects her spine. At WorkBC, Jasmine attended workshops to update her resume and cover letter, and improve her job search techniques. Career exploration helped her determine a suitable career path in office administration and a functional capacity assessment determined that she would be able to do this job without further injury.
Jasmine was approved for Skills Training and worked towards a certificate in Office Administration. Within a very short time after completion, she successfully transitioned to a new career that will offer her sustainable employment.
Emergency Medical Responder - Skills Training
Martina was an Indigenous client living in a remote village with children and was never able to find sustainable employment in her community.
One day, Martina witnessed an accident at a playground where she stayed by the injured person's side until emergency services arrived. The Emergency Medical Responder (EMR) Chief was impressed with Martina's natural instincts and ability to assist without previous training. The Chief suggested Martina explore the EMR field as a career as there were current job vacancies.
Martina reached out to WorkBC to look into available supports since she was unemployed and on EI. With the help of her Case Manager she completed labour market research and found appropriate courses through the Justice Institute of BC. Martina successfully completed a 3-week certificate course that allowed her to start employment with BC Emergency Health Services (BCEHS) as a driver. She is now registered by BCEHS for on-the-job training as an EMR. Once her training and licensing is complete, she will be an EMR serving her local community.
3.2.11.4 Employment Assistance Services
In FY1819, British Columbia delivered 141,289 (-13.7%) EAS interventions, representing the fifth consecutive year of decline. All EAS-types contributed to this drop: Employment services (‑15,189; - 13.2%), group services (-5; -7.9%), and individual counselling (-7,295; -15.1%). EAS expenditures fell from last fiscal year's total of $101.8 million to $99.7 million in FY1819.
3.2.11.5 Other support measures: LMP and R&I
LMP and R&I funding in British Columbia decreased by 10.6%, to $26.0 million in FY1819. Both LMP ($11.0 million) and R&I ($15.0 million) dropped by 14.2% and 7.9%, respectively.
To achieve its goal of forming partnerships with a wide range of communities and organizations, British Columbia continued to leverage funding from the Community and Employer Partnership program to learn about and address its unique local labour market issues, as well as social challenges beyond unemployment. LMP and R&I are important components that support British Columbia's local communities. Key activities under these programs in FY1819 included:
- developing a labour market strategy for the Cariboo Region
- developing strategies to reduce labour shortages in Williams Lake
- identifying the labour market issues, training gaps and community action plans in Northeastern British Columbia, in light of major liquified natural gas, mining and dam construction projects in the region
- developing strategies and models to support recruitment and retention of under-represented groups in the creative industries in Vancouver, Vancouver Island and Kelowna
- identifying new, innovative and untested approaches to supporting persons with disabilities in exploring technical occupations that align with diverse abilities, and
- researching and analyzing gaps, opportunities and skill requirements in the manufacturing sector in the Nelson and Castlegar areas
3.2.12 Northwest Territories
Northwest Territories' real GDP expanded by 1.9% in 2018, down from 3.7% in 2017.
Northwest Territories: EBSM key facts
For accessibility reasons, the table has been simplified. Consult the PDF version for the full table.
| Insured clients | Non-insured clients |
|---|---|
| 700 |
355 |
| Intervention type | FY1819 | Year-over-year change |
|---|---|---|
| Employment Benefits | 238 | 9.8% |
| Support Measures: EAS | 1,762 | 7.6% |
| Intervention type | FY1819 | Year-over-year change(pp) |
|---|---|---|
| Employment Benefits | 11.9% | 0.3 |
| Support Measures: EAS | 88.1% | 0.3 |
| Total expenditures | FY1819 ($ million) |
Year-over-year change |
|---|---|---|
| Employment Benefits | $1.8 | 15.4% |
| Support Measures: EAS | $1.0 | 18.8% |
| LMP and R&I | $0.2 | 26.8% |
| Total Expenditures1 | $2.9 | 1.5% |
1 Totals may not add up due to rounding and does not include accounting adjustments.
| FY1718 | FY1819 | Year-over-year change |
|---|---|---|
| $1.30 | $1.64 | 26.3% |
Employment in the Northwest Territories bounced back in FY1819 (+400; +1.8%), after declining in FY1718 (-1,100; -4.8%), with important gains realized in full-time positions (+800; +4.7%). The territory's unemployment rate improved to 6.9%, passing below the 7.0% mark for the first time since FY1011.
In FY1819, the Northwest Territories continued to implement the Skills 4 Success 4-Year Action Plan 2016 to 2020. The latest key strategy of this action plan, released in April 2018, was the NWT Small Communities Employment Strategy 2018 to 2024, to enhance employment and training opportunities and outcomes in the small communities of the territory. Consistent with the overall objectives of the Skills 4 Success 4-Year Action Plan 2016 to 2020, the territory's priorities of the Labour Market Development Agreement for FY1819 were to:
- provide access to programs for EI clients in order to enhance their skills and increase their likelihood of returning work quickly
- develop the tools to identify EI clients earlier in their claim in order to offer them more relevant and better adapted programming
- continue to provide quality career development resources and services through Regional Education, Culture and Employment (ECE) Service Centres
3.2.12.1 Managing for results
The Government of the Northwest Territories (GNWT) took a multi-pronged approach to stakeholder engagement. It had ongoing engagement at the regional and community level through Regional ECE Service Centres, which included working with regional training committees, education and training providers, Indigenous Governments, community organizations and businesses in the communities to serve the career development needs of individuals and communities. The GNWT also, over the course of the past 4 years, has undertaken larger scale engagements, as part of Skills 4 Success and the development of complementary strategies. In addition, the territory is currently implementing the Targeting, Referral and Feedback (TRF) system.
3.2.12.2 Clients, interventions and expenditures
In FY1819, the Northwest Territories served 1,055 clients, a drop of 28.2% compared to FY1718. With the exception of PPE clients (229), a new client category, all other client types dropped: active claimants (266), former claimants (205), and non-insured clients (355) declined by 20.1%, 40.2% and 55.2%, respectively. As for their shares relative to the total number of clients served, active claimants (25.2%) advanced by 2.5 percentage points, while former claimants (19.4%) and non-insured clients (33.6%) decreased by 3.9 and 20.3 percentage points, respectively. The proportion of PPE clients was 21.7%. The decline in the proportion of non-insured clients may be attributable to the new PPE category.
After 3 consecutive years of growth, the total number of interventions delivered in the Northwest Territories dropped, totalling 2,000 (-7.9% year-over-year) in FY1819. EAS remained the most delivered intervention, with a proportion of 88.1%.
In total, 181 individuals (+27.5%) returned to employment after participating in EBSM-similar programming, and unpaid EI benefits amounted to $1.64 million (+26.3%). EBSM expenditures totalled $2.9 million (-1.5%), including $300,000 representing Northwest Territories' portion of the $225.0 million in additional LMDA funding announced in Budget 2017.
In addition to these expenditures, $800,000 in additional targeted funding was made available to support workers in seasonal industries and those affected by the trade dispute in the forest sector, which the territory did not access.
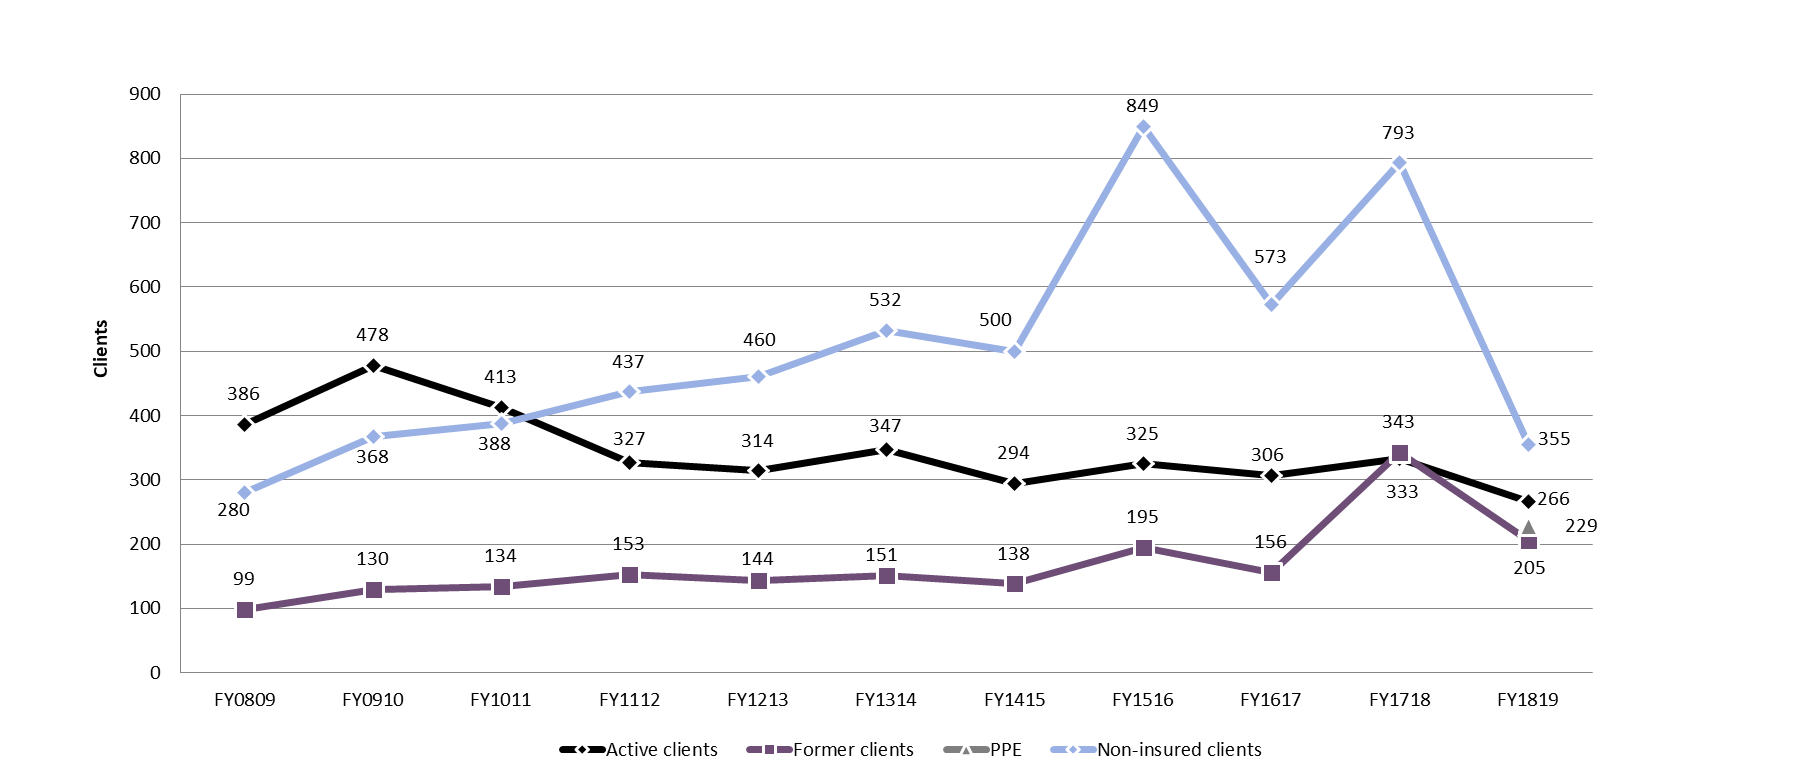
Chart 34 – Text version
| Client | FY0809 | FY0910 | FY1011 | FY1112 | FY1213 | FY1314 | FY1415 | FY1516 | FY1617 | FY1718 | FY1819 |
|---|---|---|---|---|---|---|---|---|---|---|---|
| Active clients | 386 | 478 | 413 | 327 | 314 | 347 | 294 | 325 | 306 | 333 | 266 |
| Former clients | 99 | 130 | 134 | 153 | 144 | 151 | 138 | 195 | 156 | 343 | 205 |
| PPE | n/a | n/a | n/a | n/a | n/a | n/a | n/a | n/a | n/a | n/a | 229 |
| Non-insured clients | 280 | 368 | 388 | 437 | 460 | 532 | 500 | 849 | 573 | 793 | 355 |
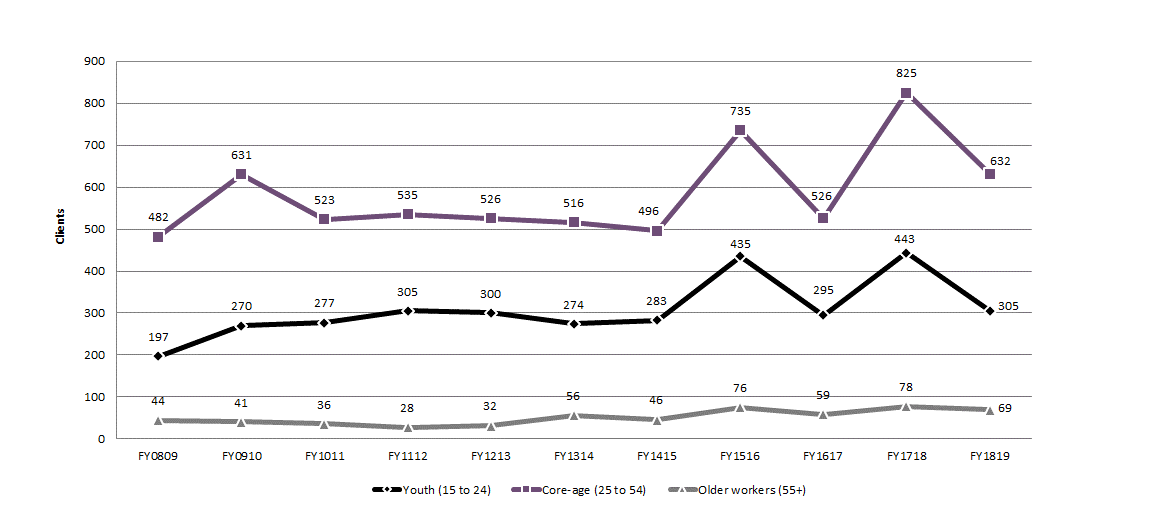
Chart 35 – Text version
| Age | FY0809 | FY0910 | FY1011 | FY1112 | FY1213 | FY1314 | FY1415 | FY1516 | FY1617 | FY1718 | FY1819 |
|---|---|---|---|---|---|---|---|---|---|---|---|
| Youth (15 to 24) | 197 | 270 | 277 | 305 | 300 | 274 | 283 | 435 | 295 | 443 | 305 |
| Core-age (25 to 54) | 482 | 631 | 523 | 535 | 526 | 516 | 496 | 735 | 526 | 825 | 632 |
| Older workers (55+) | 44 | 41 | 36 | 28 | 32 | 56 | 46 | 76 | 59 | 78 | 69 |
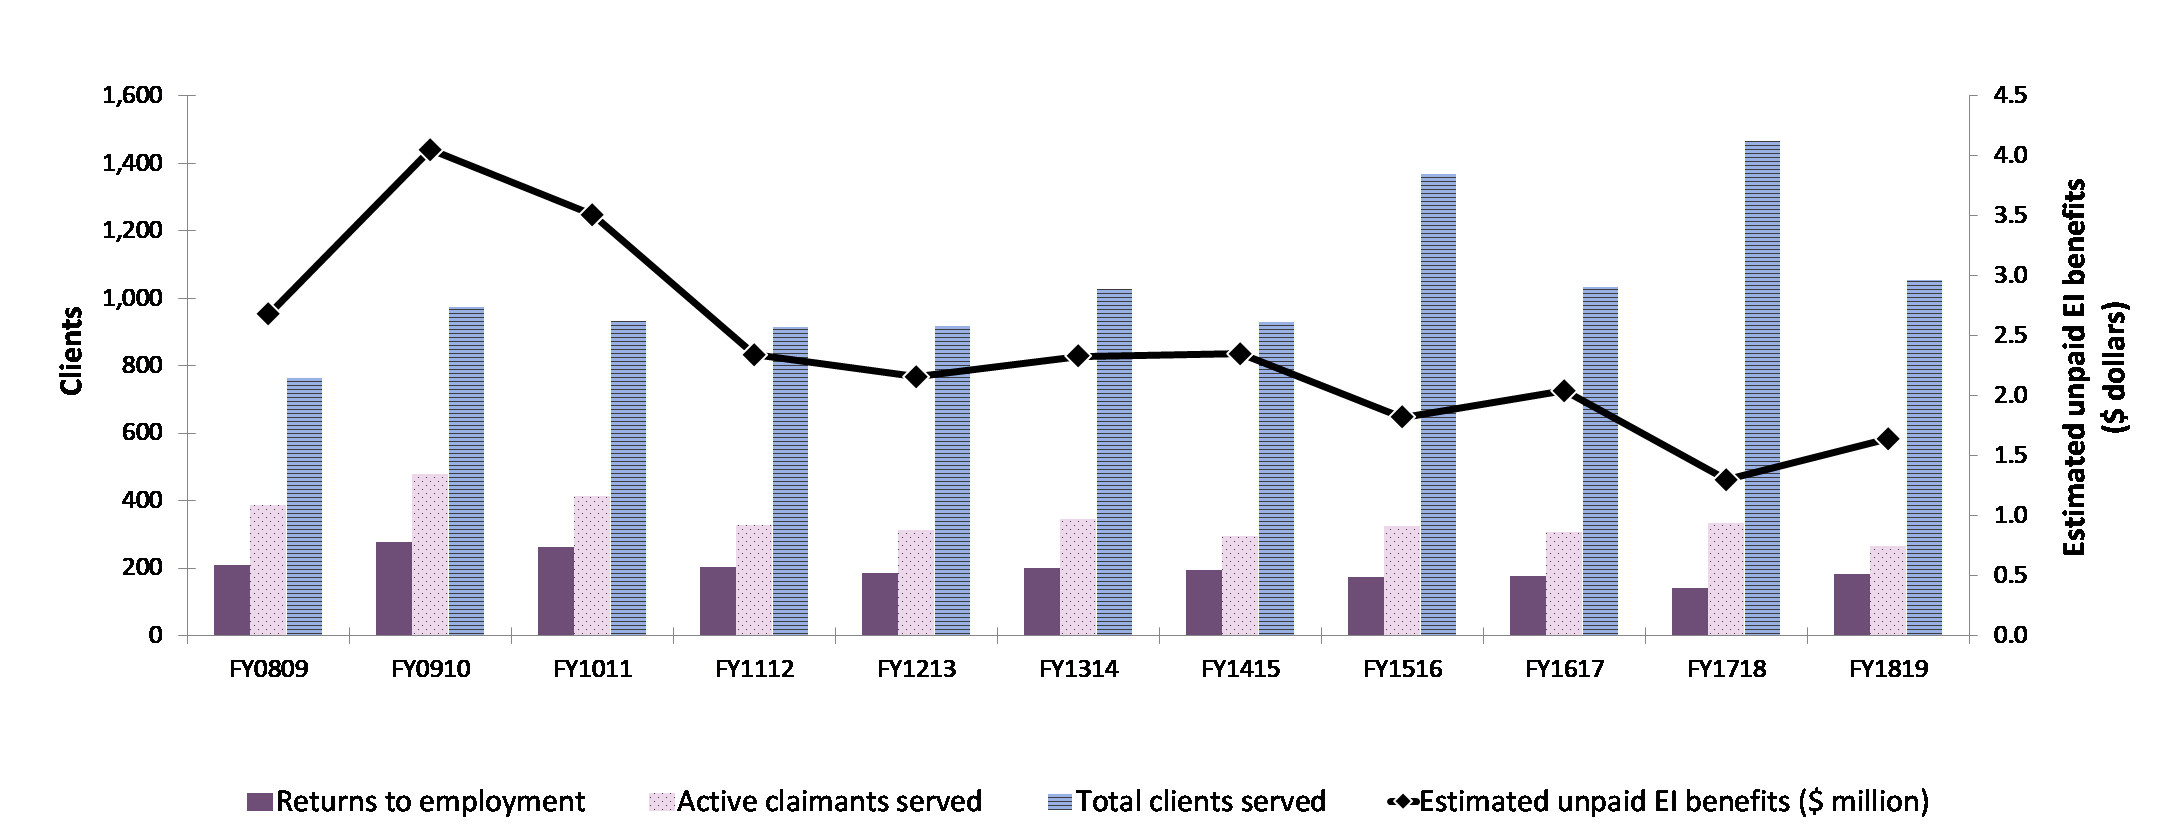
Chart 36 – Text version
| Key performance indicators | FY0809 | FY0910 | FY1011 | FY1112 | FY1213 | FY1314 | FY1415 | FY1516 | FY1617 | FY1718 | FY1819 |
|---|---|---|---|---|---|---|---|---|---|---|---|
| Returns to employment | 208 | 278 | 263 | 202 | 185 | 200 | 193 | 173 | 177 | 142 | 181 |
| Active claimants served | 386 | 478 | 413 | 327 | 314 | 347 | 294 | 325 | 306 | 333 | 266 |
| Total clients served | 765 | 976 | 935 | 917 | 918 | 1,030 | 932 | 1,369 | 1,035 | 1,469 | 1,055 |
| Estimated unpaid EI benefits ($ million) | $2,68 | $4,05 | $3,51 | $2,34 | $2,16 | $2,33 | $2,35 | $1,82 | $2,04 | $1,30 | $1,64 |
Table 16 - Northwest Territories: EBSM-similar programming, FY1819
For accessibility reasons, the table has been simplified. Consult the PDF version for the full table.
| Employment benefits | Interventions | Year-over-year change |
Expenditures ($ 000s) |
|---|---|---|---|
| SD-R: Skills Development - Regular | 87 | +58.2% | 1,166 |
| SD-A: Skills Development - Apprenticeship | 126 | +0.8% | |
| TWS: Wage Subsidies | 14 | -76.7% | 230 |
| SE: Self-Employment | 11 | -21.4% | 216 |
| JCPJCP: Job Creation Partnerships | 0 | -100.0% | 144 |
| Support measures | Interventions | Year-over-year change |
Expenditures ($ 000s) |
|---|---|---|---|
| EAS: Employment Assistance Services | 1,762 | -7,6% | 958 |
| LMP: Labour Market Partnerships (Strategic Workforce Initiatives) | n/a | n/a | 75 |
| R&I: Research and Innovation | n/a | n/a | 77 |
3.2.12.3 Employment benefits
Compared to FY1718, the Northwest Territories delivered fewer Employment Benefit interventions (238) in FY1819, representing a 9.8% year-over-year decrease. While both SD-R (+32; +58.2%) and SD-A (+1; +0.8%) advanced, TWS (-46; -76.7%), SE (-3; -21.4%), and JCP (‑10; -100.0%) dropped. Employment Benefit expenditures grew by 15.4% to $1.8 million.
3.2.12.4 Support measures: EAS
After 3 consecutive years of growth, EAS interventions (1,762) in the Northwest Territories dropped by 7.6% in FY1819. This decline is attributed solely to individual counselling (-145; - 7.6%). The territory invested $1.0 million (‑18.8%) in EAS.
3.2.12.5 Other support measures: LMP and R&I
For a third consecutive year, total funding for LMP and R&I dropped, amounting to $152,000 (‑26.8%) in FY1819. For a third consecutive year, LMP decreased, reaching $75,000 (-41.4%) in FY1819. R&I dropped for a second consecutive year, reaching $77,000 (-3.7%) in FY1819.
EBSMs in action - JCP
One program success story was with the GNWT's territorial partner, the Mine Training Society (MTS). MTS accessed LMDA funding to deliver Surface Miner training programs to NWT residents. The GNWT utilized the Job Creation Partnership program to support students with individual supports. This allowed students to develop mining industry mandatory skills sets required by the diamond mines in the NWT. Upon completion of the training program, students were interviewed by the mining companies and could earn an “on-the-job” work placement that could lead to full-time, permanent employment. In FY1819, 15 participants were funded using LMDA dollars who successfully completed the training program.
3.2.13 Yukon
In 2018, Yukon's real GDP growth (+2.8%) surpassed the national average (+2.0%) for a third consecutive year.
Yukon: EBSM key facts
For accessibility reasons, the table has been simplified. Consult the PDF version for the full table.
| Insured clients | Non-insured clients |
|---|---|
| 263 |
75 |
| Intervention type | FY1819 | Year-over-year change |
|---|---|---|
| Employment Benefits | 197 | 9.4% |
| Support Measures: EAS | 207 | 24.2% |
| Intervention type | FY1819 | Year-over-year change(pp) |
|---|---|---|
| Employment Benefits | 48.8% | 9.1 |
| Support Measures: EAS | 51.2% | 9.1 |
| Total expenditures | FY1819 ($ million) |
Year-over-year change |
|---|---|---|
| Employment Benefits | $1.5 | 17.1% |
| Support Measures: EAS | $1.5 | 6.8% |
| LMP and R&I | $0.05 | 76.8% |
| Total Expenditures2 | $3.1 | 10.9% |
1 Yukon invested $19,850.66 of its total allocation towards administration costs, representing almost 8.0% of the Budget 2017 additional funding the Territory received in FY1819.
2 Totals may not add up due to rounding; does not include accounting adjustments.
| FY1718 | FY1819 | Year-over-year change |
|---|---|---|
| $1.30 | $1.64 | 5.8% |
Yukon's overall employment level remained relatively unchanged in FY1819 (+100; +0.2%) compared to FY1718. A net decline of 200 full-time positions (-1.2%) was more than offset by an increase in part-time employment (+300; +9.1%). Yukon's unemployment rate edged up to 3.4%, the lowest among all provinces and territories. The territory's participation and employment rates were the highest in the country. Yukon priorities for FY1819 included:
- establishing improved, government-to-government consultation processes with Yukon's First Nation governments
- providing relevant, quality and timely labour market information for users
- facilitating Yukon employers' ability to recruit suitable employees
- enhancing Yukon employers' ability to retain skilled employees
- ensuring training opportunities are available for all Yukon people
- facilitating and improving learning and employment transitions
3.2.13.1 Managing for results
Yukon is working with the Government of Canada to simplify and automate reporting where possible, while improving reporting turn-around times. The territory is also implementing a new system by which it will be able to share LMDA data with the Government of Canada on a monthly basis. In addition, Yukon is working with ESDC to implement the Targeting, Referral and Feedback (TRF) system.
Yukon's stakeholder engagement
The Labour Market Framework (LMF) is the strategic process through which many priorities for Yukon's labour market are established and specific activities are undertaken, including community consultations. Through the LMF, Yukon engages with the federal and municipal governments, First Nations service organizations, service providers, employers, educational institutions, and unions.
All input from community engagement is considered in the development of Yukon's key labour market priorities, based on consensus with the action items, goals and priorities being jointly developed.
The existing LMF will take Yukon through until end of 2020, built around labour market information, recruitment and employee retention, and ensuring comprehensive skills and trades training are available to Yukoners.
3.2.13.2 Clients, interventions and expenditures
After 2 consecutive years of growth, the total number of clients served in Yukon decreased, reaching 338 (-6.1%) in FY1819. While 39 of the clients served were PPE clients, a new category of insured clients, all other client-types experienced drops, with active claimants (189), former claimants (35) and non-insured clients (75) decreasing by 9.1%, 20.5% and 30.6%, respectively. As for their shares of the total number of clients served, the new PPE client reached 11.5%. Active claimants (55.9%), former claimants (10.4%) and non-insured clients (22.2%) saw their proportions in the total number of clients served drop by 1.9%, 1.9%, and 7.8%, respectively. The decline in the proportion of non-insured clients may be attributable to the new PPE category.
Compared to FY1718, Yukon delivered fewer EBSM-similar interventions in FY1819 (404), a 10.8% year‑over‑year decline. The share of EAS relative to all interventions fell from 60.3% to 51.2% (‑9.1 percentage points year‑over‑year), while that of Employment Benefits advanced from 39.7% to 48.8% (+9.1 percentage points year-over-year). In total, unpaid EI benefits jumped by 5.8% to $1.07 million, and 120 individuals (-14.9%) returned to employment after participating in EBSM-similar programming. Total expenditures for EBSMs fell from $3.5 million in FY1718 to $3.1 million in FY1819, a 10.9% year-over-year decrease. This amount included $200,000 the territory received in FY1819 as part of the $225.0 million in LMDA additional funding announced in Budget 2017.
On top of these expenditures, $800,000 was also made available to Yukon under the additional targeted funding measures to support workers in seasonal industries and those affected by the trade dispute in the forest sector, which the territory did not access.
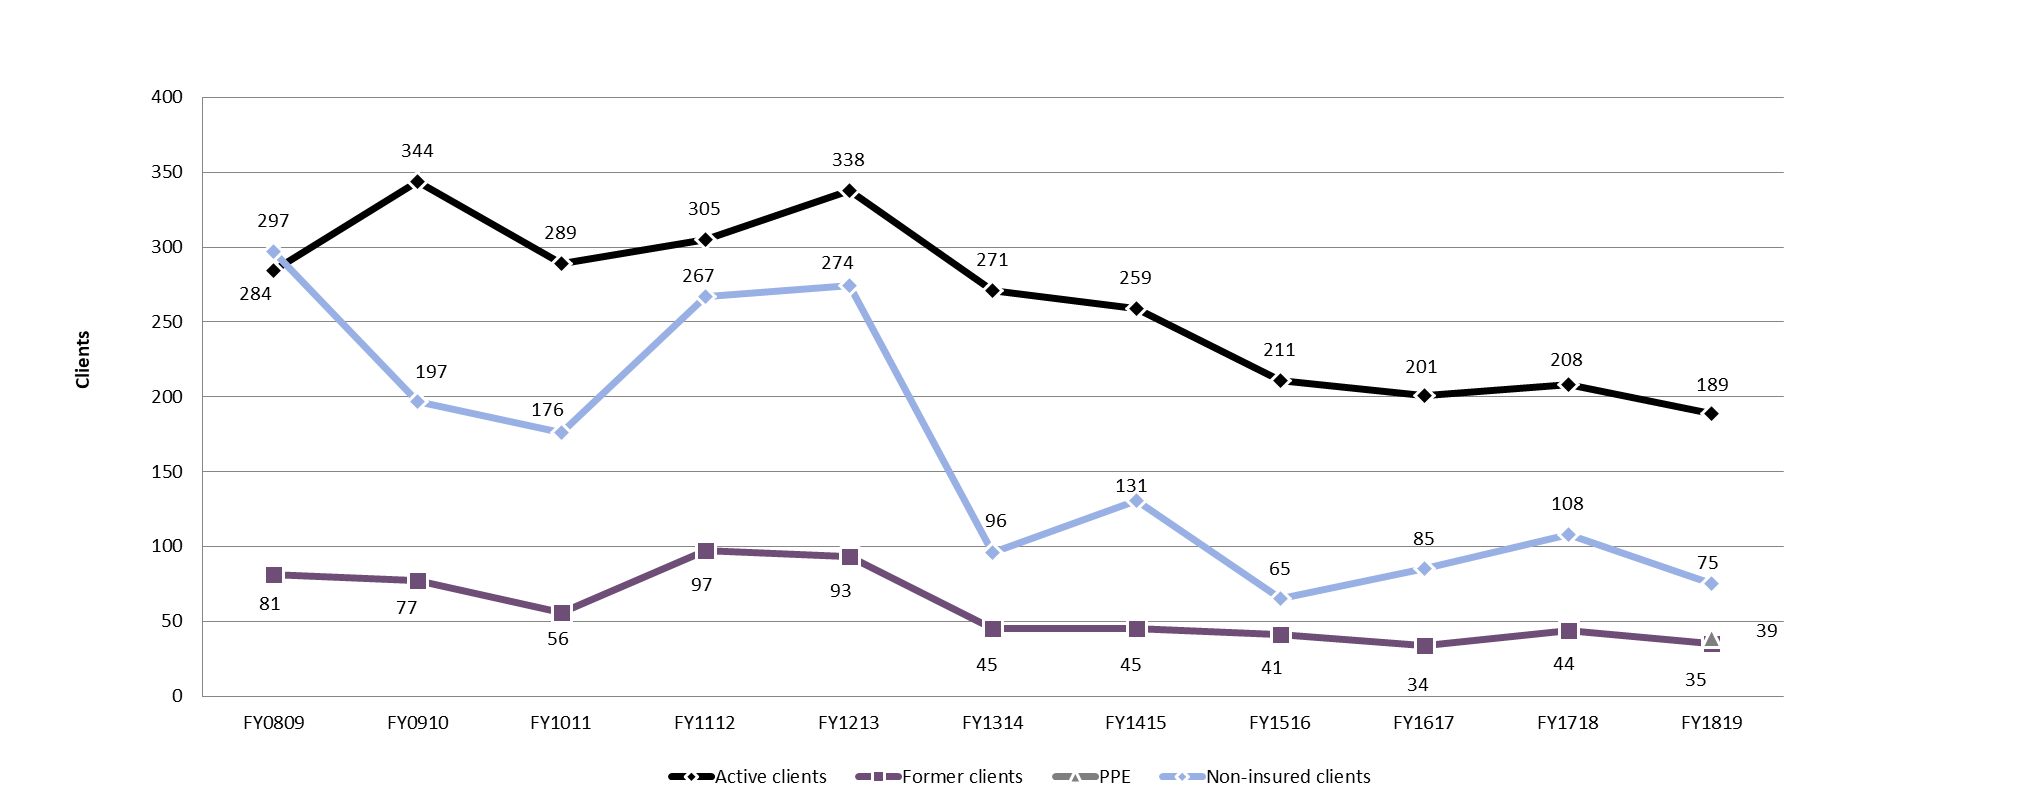
Chart 37 – Text version
| Client | FY0809 | FY0910 | FY1011 | FY1112 | FY1213 | FY1314 | FY1415 | FY1516 | FY1617 | FY1718 | FY1819 |
|---|---|---|---|---|---|---|---|---|---|---|---|
| Active clients | 284 | 344 | 289 | 305 | 338 | 271 | 259 | 211 | 201 | 208 | 189 |
| Former clients | 81 | 77 | 56 | 97 | 93 | 45 | 45 | 41 | 34 | 44 | 35 |
| PPE | n/a | n/a | n/a | n/a | n/a | n/a | n/a | n/a | n/a | n/a | 39 |
| Non-insured clients | 297 | 197 | 176 | 267 | 274 | 96 | 131 | 65 | 85 | 108 | 75 |
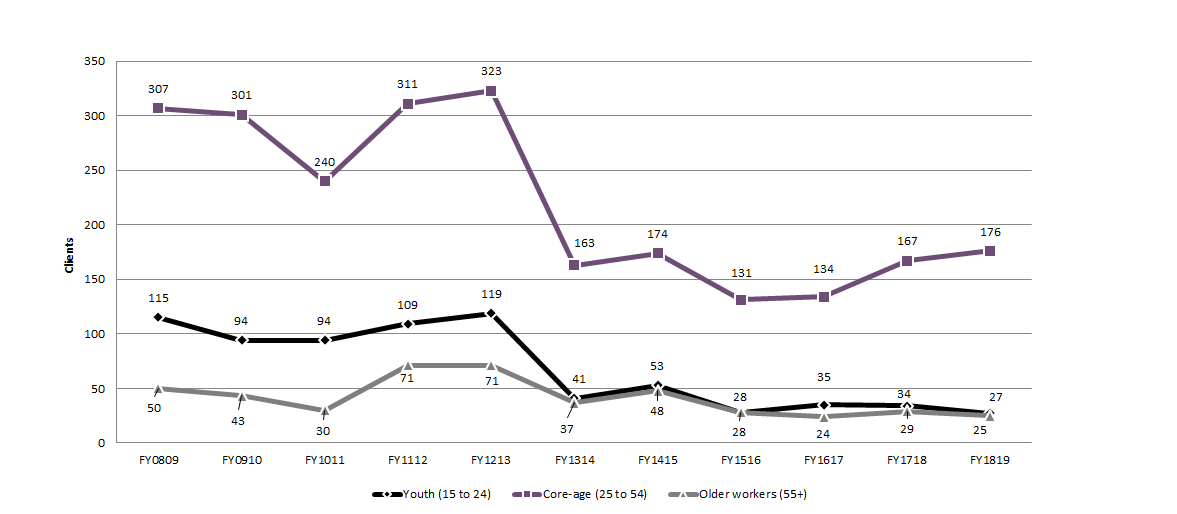
Chart 38 – Text version
| Age | FY0809 | FY0910 | FY1011 | FY1112 | FY1213 | FY1314 | FY1415 | FY1516 | FY1617 | FY1718 | FY1819 |
|---|---|---|---|---|---|---|---|---|---|---|---|
| Youth (15 to 24) | 115 | 94 | 94 | 109 | 119 | 41 | 53 | 28 | 35 | 34 | 27 |
| Core-age (25 to 54) | 307 | 301 | 240 | 311 | 323 | 163 | 174 | 131 | 134 | 167 | 176 |
| Older workers (55+) | 50 | 43 | 30 | 71 | 71 | 37 | 48 | 28 | 24 | 29 | 25 |
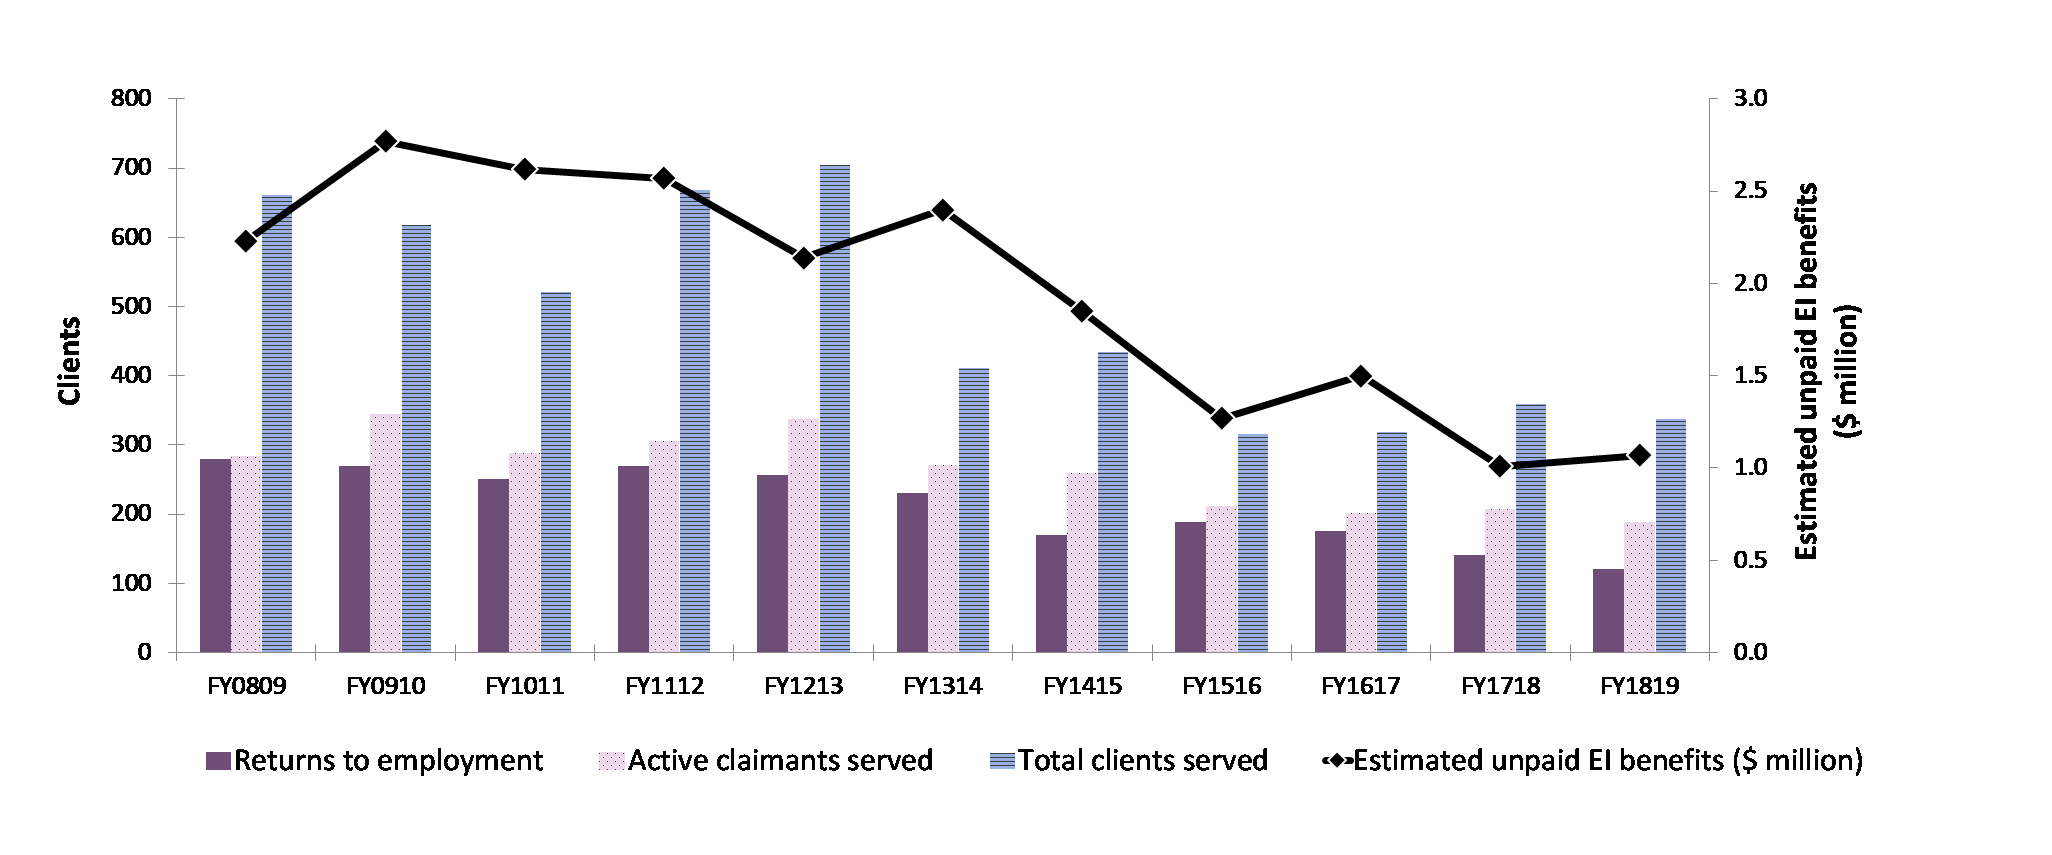
Chart 39 – Text version
| Key performance indicators | FY0809 | FY0910 | FY1011 | FY1112 | FY1213 | FY1314 | FY1415 | FY1516 | FY1617 | FY1718 | FY1819 |
|---|---|---|---|---|---|---|---|---|---|---|---|
| Returns to employment | 279 | 270 | 250 | 270 | 256 | 230 | 170 | 188 | 176 | 141 | 120 |
| Active claimants served | 284 | 344 | 289 | 305 | 338 | 271 | 259 | 211 | 201 | 208 | 189 |
| Total clients served | 662 | 618 | 521 | 669 | 705 | 412 | 435 | 317 | 320 | 360 | 338 |
| Estimated unpaid EI benefits ($ million) | $2,23 | $2,77 | $2,62 | $2,57 | $2,14 | $2,40 | $1,85 | $1,27 | $1,50 | $1,01 | $1,07 |
Table 17 - Yukon: EBSM-similar programming, FY1819
For accessibility reasons, the table has been simplified. Consult the PDF version for the full table.
| Employment benefits | Interventions | Year-over-year change |
Expenditures ($ 000s) |
|---|---|---|---|
| SD-R: Skills Development Employment Benefit - Regular | 29 | +7.4% | 1,496 |
| SD-A: Skills Development Employment Benefit - Apprenticeship | 164 | +9.3% | |
| TWS: Targeted Wage Subsidies | 4 | +33.3% | 12 |
| SE: Self‑Employment | 0 | n/a | 0 |
| JCPJCP: Employment Programs | 0 | n/a | 0 |
| Support measures | Interventions | Year-over-year change |
Expenditures ($ 000s) |
|---|---|---|---|
| EAS: Employment Assistance Services | 207 | -24.2% | 1,544 |
| LMP: Labour Market Partnerships Employer Sponsored Training |
n/a | n/a | 0 |
| R&I: Research and Innovation | n/a | n/a | 51 |
3.2.13.3 Employment benefits
In FY1819, the number of Employment Benefit interventions in Yukon advanced by 9.4% to 197. All intervention types contributed to this growth: TWS (+1; +33.3%), SD-R (+2; +7.4%), and SD-A (+14; +9.3%). The territory spent $1.5 million (+17.1%) on Employment Benefits.
3.2.13.4 Support measures: EAS
Compared to last fiscal year, Yukon delivered fewer EAS interventions in FY1819, a decline of 24.2%, for a total of 207. Similar to FY1718, employment services was the sole delivered EAS-type. EAS expenditures advanced by 6.8% to $1.5 million.
3.2.13.5 Other support measures: LMP and R&I
For a third consecutive year, Yukon's total funding for other support measures fell, reaching $51,000 (‑76.8%) in FY1819. Unlike what was recorded over the previous fiscal year, this amount was spent solely on R&I.
3.2.14 Nunavut
Nunavut's real GDP growth reached 10.0% in 2018, the highest rate among all provinces and territories for a second consecutive year.
Nunavut: EBSM key facts
For accessibility reasons, the table has been simplified. Consult the PDF version for the full table.
| Insured clients | Non-insured clients |
|---|---|
| 553 |
694 |
| Intervention type | FY1819 | Year-over-year change |
|---|---|---|
| Employment Benefits | 330 | 24.3% |
| Support Measures: EAS | 1,371 | 14.3% |
| Intervention type | FY1819 | Year-over-year change(pp) |
|---|---|---|
| Employment Benefits | 19.4% | 7.3 |
| Support Measures: EAS | 80.6% | 7.3 |
| Total expenditures | FY1819 ($ million) |
Year-over-year change |
|---|---|---|
| Employment Benefits | $2.0 | 2.6% |
| Support Measures: EAS | $0.2 | 2.6% |
| LMP and R&I | $0.2 | 2.3% |
| Total Expenditures1,2 | $2.3 | 2.6% |
1 Totals may not add up due to rounding and does not include accounting adjustments.
2 Expenditures are estimates as Nunavut was unable to provide an audited financial statement at time of writing, as Government of Nunavut networks were impacted by ransomware in late 2019.
| FY1718 | FY1819 | Year-over-year change |
|---|---|---|
| $0.78 | $0.64 | 17.9% |
Nunavut's overall employment level increased by 300 (+2.4%) in FY1819, all in full-time positions (+500; +4.4%), while part-time employment edged down by 200 (-8.8%). The territory's unemployment rate increased to 14.5%, the highest among all provinces and territories, as more people joined the labour force in search for work (+500; +3.1%).
Translating the territory's fast economic growth into job opportunities represented Nunavut's main labour market challenge. This applied particularly to the Inuit population which was employed in a much lower proportion than the non-Inuit population. The territory's labour market priorities in FY1819 were:
- preparing the labour force to meet the needs of a growing and transitioning economy
- developing programs to improve the participation of youth and persons with disabilities in the labour market
- encouraging greater employer involvement in training, to ensure that skills are aligned with current and future job opportunities
- helping Nunavummiut to develop the essential skills to succeed in finding and keeping employment
- connecting Nunavummiut job seekers with job opportunities through accurate, timely and comprehensive labour market information
- engaging with community leaders, community organizations, municipalities, Inuit organizations and other levels of government to leverage partnership opportunities
3.2.14.1 Managing for results
To increase client participation in its EBSM-similar programming, Nunavut improves client service by monitoring and adjusting its service delivery model on a regular basis. To ensure all clients receive the best results from EAS, the territory is developing an ongoing professional development program for its front-line staff. As well, the case management system is being evaluated to identify measures to more effectively meet client needs. These improvements are driving the creation of new information sources and tools to inform practice and policy.
3.2.14.2 Clients, interventions and expenditures
Similar to FY1718, Nunavut served a growing number of clients, totaling 1,247 (+14.0%). PPE clients, a new client category, reached 234. Former claimants (177) increased by 5.4%, while active claimants (142) and non-insured clients (694) dropped by 7.2% and 10.2%, respectively. With regard to their shares of all clients served, PPE clients accounted for 18.8%, while other client-types registered losses, with active claimants (11.4%), former claimants (14.2%), and non-insured clients (55.7%) declining by 2.6, 1.2 and 15.0 percentage points, respectively. The decline in the proportion of non-insured clients may be attributable to the new PPE category.
In FY1819, Nunavut delivered 1,701 interventions (+4.0%), with EAS-interventions remaining the most used intervention type. Returns to employment in the territory dropped by 7.7% to 48, while unpaid EI benefits was $0.64 million (-17.9%). Total expenditures towards EBSM-similar programming grew by 2.6% to $2.3 million. These included $257,434 the territory received in FY1819 as part of the $225.0 million additional LMDA funding from Budget 2017. The territory also received additional targeted funding to support workers in seasonal industries ($250,000). In addition, following the signature of the Agreement to Amend the Canada - Nunavut LMDA in the summer of 2018, the territory received its share ($146,984) of the additional $125.0 million in LMDA funding for FY1718, announced in Budget 2017.
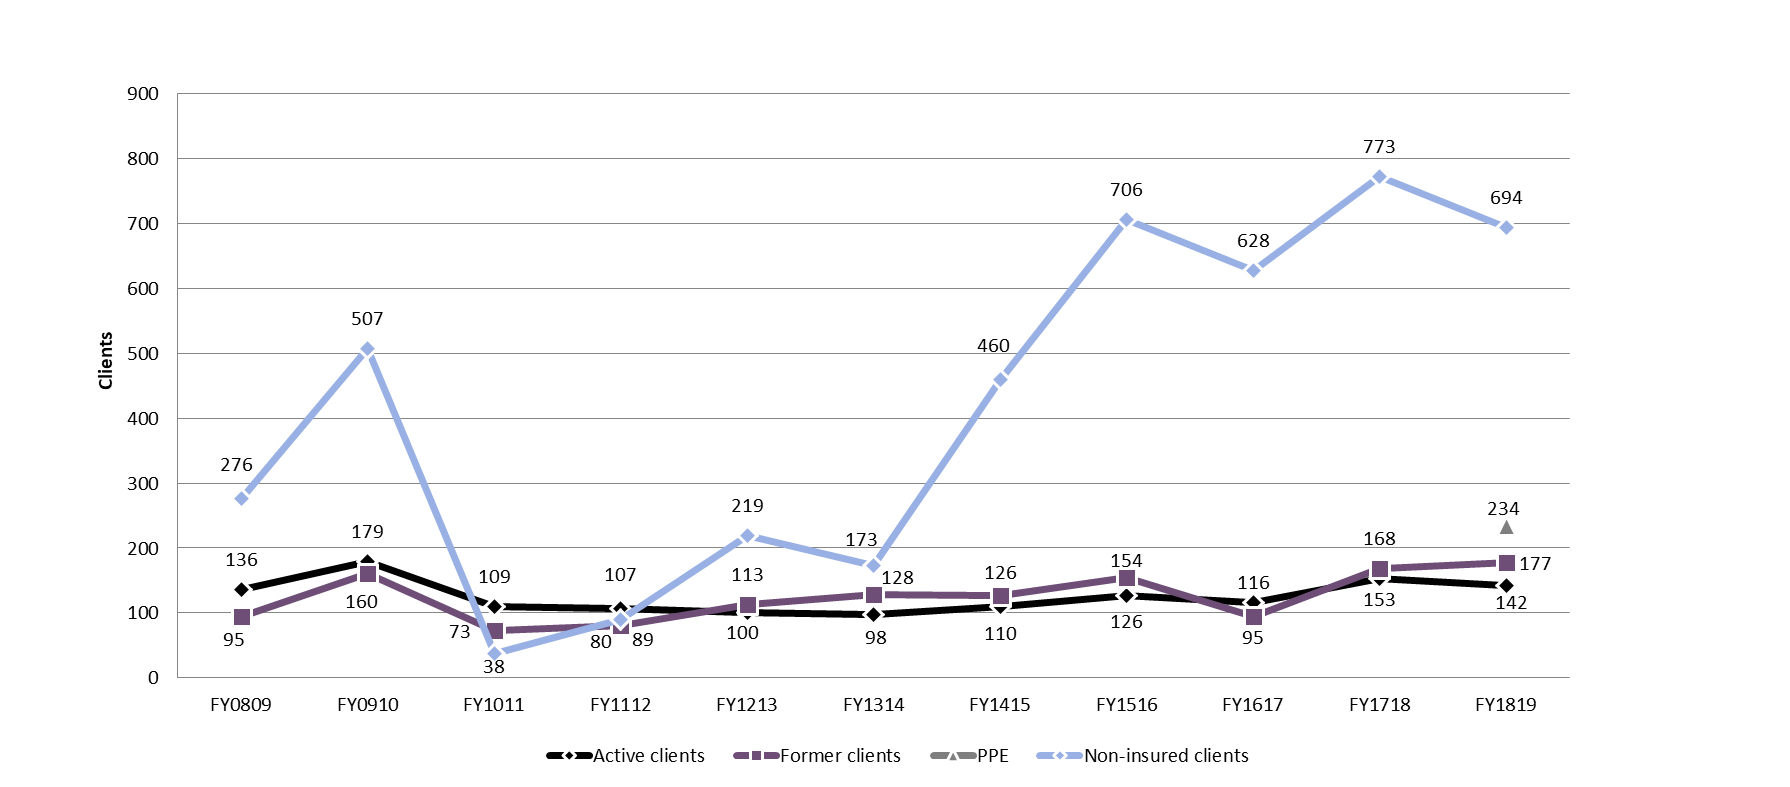
Chart 40 – Text version
| Client | FY0809 | FY0910 | FY1011 | FY1112 | FY1213 | FY1314 | FY1415 | FY1516 | FY1617 | FY1718 | FY1819 |
|---|---|---|---|---|---|---|---|---|---|---|---|
| Active clients | 136 | 179 | 109 | 107 | 100 | 98 | 110 | 126 | 116 | 153 | 142 |
| Former clients | 95 | 160 | 73 | 80 | 113 | 128 | 126 | 154 | 95 | 168 | 177 |
| PPE | n/a | n/a | n/a | n/a | n/a | n/a | n/a | n/a | n/a | n/a | 234 |
| Non-insured clients | 276 | 507 | 38 | 89 | 219 | 173 | 460 | 706 | 628 | 773 | 694 |
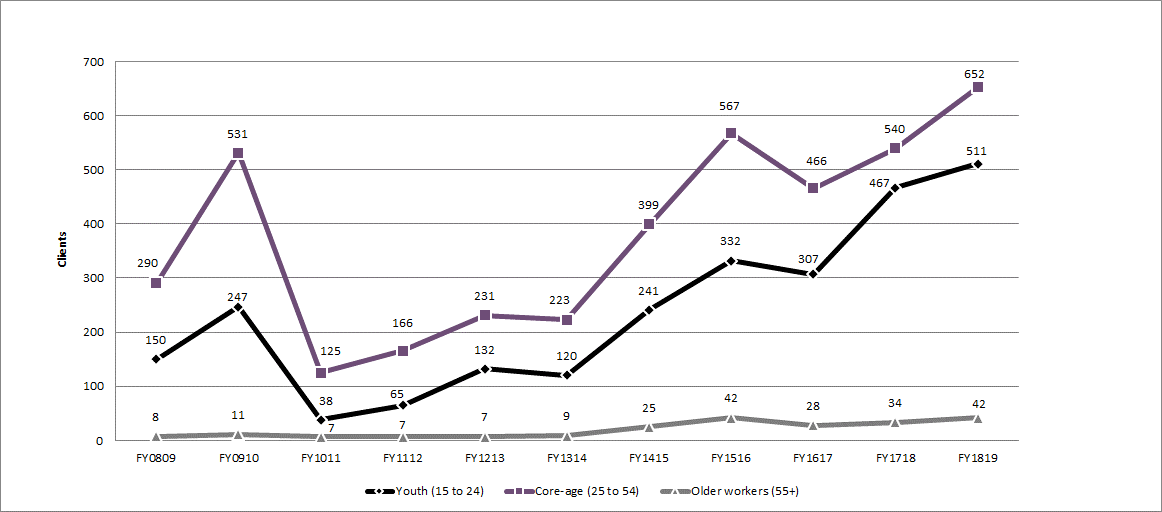
Chart 41 – Text version
| Age | FY0809 | FY0910 | FY1011 | FY1112 | FY1213 | FY1314 | FY1415 | FY1516 | FY1617 | FY1718 | FY1819 |
|---|---|---|---|---|---|---|---|---|---|---|---|
| Youth (15 to 24) | 150 | 247 | 38 | 65 | 132 | 120 | 241 | 332 | 307 | 467 | 511 |
| Core-age (25 to 54) | 290 | 531 | 125 | 166 | 231 | 223 | 399 | 567 | 466 | 540 | 652 |
| Older workers (55+) | 8 | 11 | 7 | 7 | 7 | 9 | 25 | 42 | 28 | 34 | 42 |
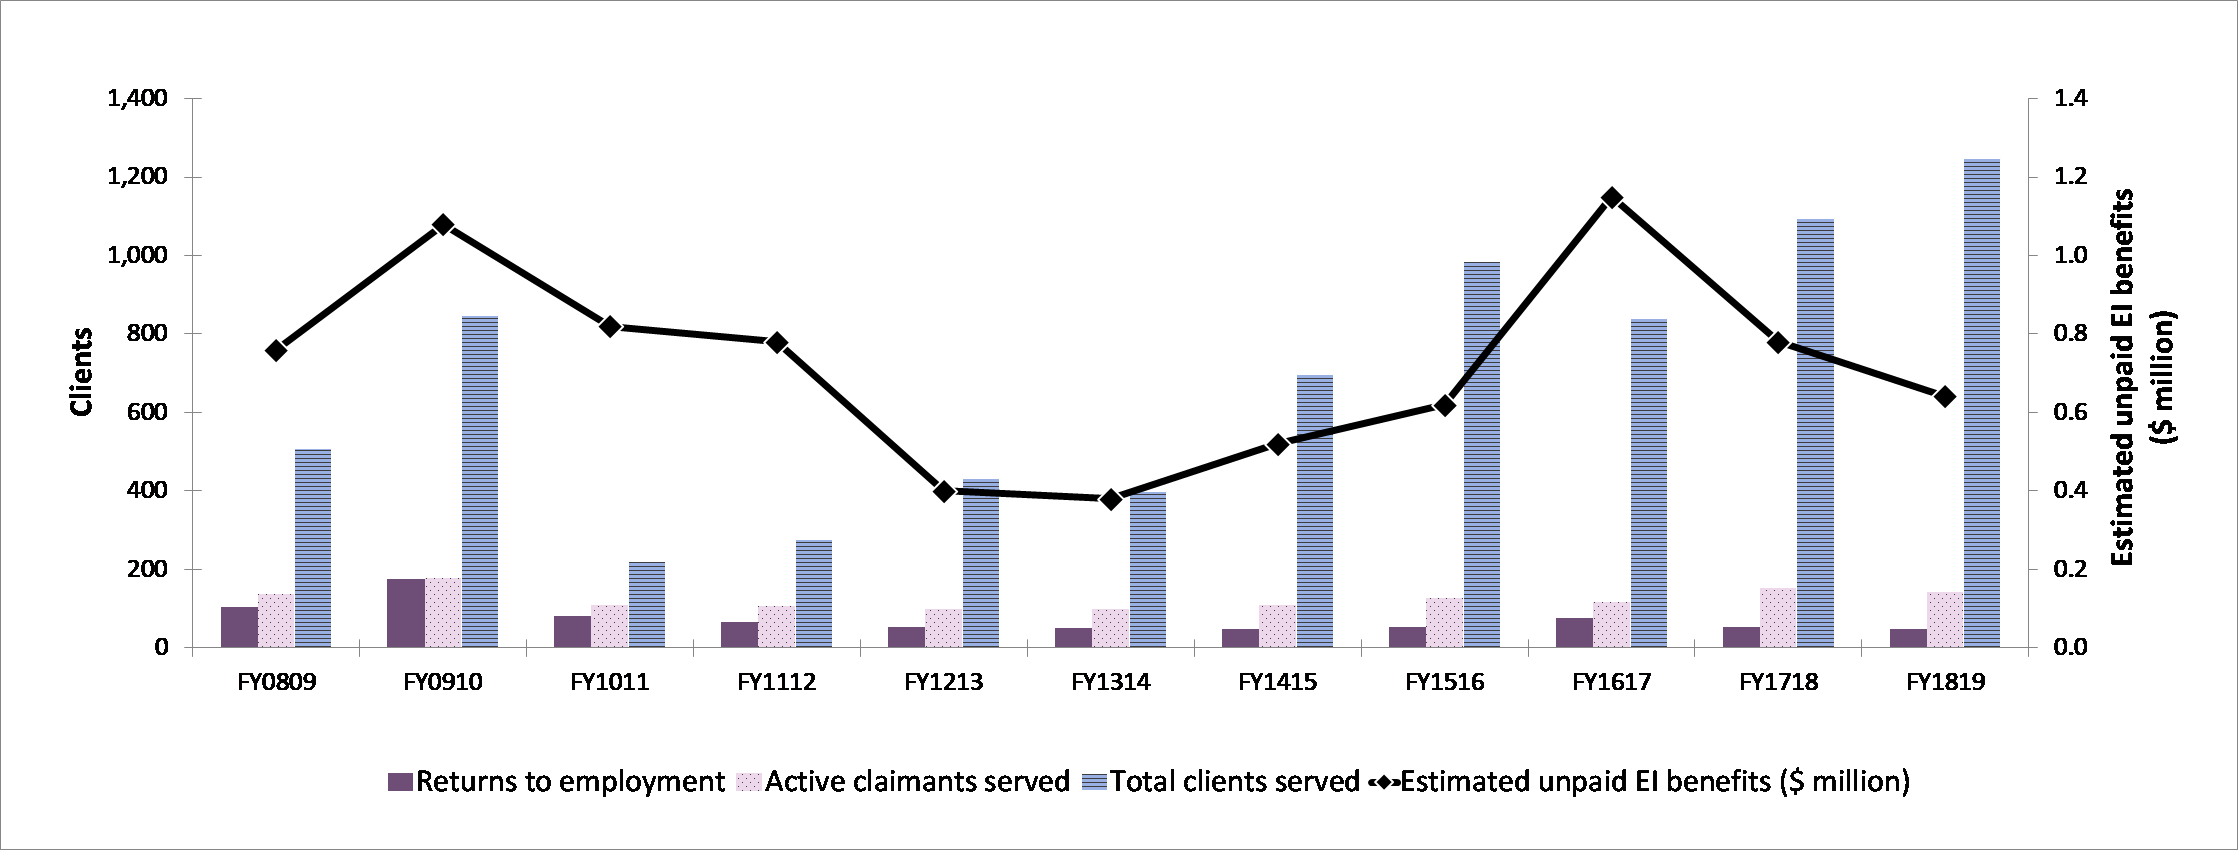
Chart 42 – Text version
| Key performance indicators | FY0809 | FY0910 | FY1011 | FY1112 | FY1213 | FY1314 | FY1415 | FY1516 | FY1617 | FY1718 | FY1819 |
|---|---|---|---|---|---|---|---|---|---|---|---|
| Returns to employment | 104 | 175 | 80 | 65 | 53 | 50 | 47 | 53 | 75 | 52 | 48 |
| Active claimants served | 136 | 179 | 109 | 107 | 100 | 98 | 110 | 126 | 116 | 153 | 142 |
| Total clients served | 507 | 846 | 220 | 276 | 432 | 399 | 696 | 986 | 839 | 1,094 | 1,247 |
| Estimated unpaid EI benefits ($ million) | $0,76 | $1,08 | $0,82 | $0,78 | $0,40 | $0,38 | $0,52 | $0,62 | $1,15 | $0,78 | $0,64 |
Table 18 - Nunavut: EBSM-similar programming, FY1819
For accessibility reasons, the table has been simplified. Consult the PDF version for the full table.
| Employment benefits | Interventions | Year-over-year change |
Expenditures ($ 000s) |
|---|---|---|---|
| SD-R: Adult Learning and Training Supports | 284 | -20.2% | 1,539 |
| SD-A: Adult Learning and Training Supports: Apprenticeship | 41 | +5.1% | |
| TWS: Training on the Job | 0 | -100.0% | 410 |
| SE: Nunavut Entrepreneurship Incentive | 5 | -28.6% | 18 |
| Support measures | Interventions | Year-over-year change |
Expenditures ($ 000s) |
|---|---|---|---|
| EAS: Employment Assistance Services | 1,371 | +14.3% | 154 |
| LMP: Target Training Initiatives | n/a | n/a | 176 |
| R&I: Research and Innovation | n/a | n/a | n/a |
3.2.14.3 Employment benefits
In FY1819, Nunavut delivered 330 Employment Benefit interventions (-24.3%). While SD-A (+2; +5.1%) rose, TWS (-34; -100.0%), SE (-2; -28.6%) and SD-R (-72; -20.2%) fell. The territory spent $2.0 million (+2.6%) on Employment Benefits.
3.2.14.4 Support measures: EAS
Compared to FY1718, EAS interventions in Nunavut, delivered solely through employment services grew, by 14.3%, from 1,200 to 1,371. Nunavut did not offer group services and individual counselling. The territory spent $0.2 million (+2.6%) on EAS.
3.2.14.5 Other support measures: LMP and R&I
In FY1819, LMP total expenditures grew from $172,000 to $176,000, representing a year over year increase of 2.3%. Similar to the previous fiscal year, no R&I expenditures were recorded in FY1819.
3.3 Evaluation of Employment Benefits and Support Measures (EBSMs) and economic security analysis
In this section
- 3.3.1 Design and Delivery of the Job Creation Partnerships Program
- 3.3.2 Participation in LMDAs and economic security
This section contains 2 components. The first part presents findings from the first study conducted as part of the third cycle of LMDA evaluations, currently underway. It summarizes key findings of the Design and Delivery of the Job Creation Partnerships Program evaluation conducted in FY1819.
The second part expands on previous LMDA outcomes and impacts on economic security analyses presented in the FY1617 MAR. It includes a more detailed analysis, which uses a new poverty measure as a proxy for economic security. This new poverty measure allows for a breakdown at a municipal level and is aligned with Opportunity for All - Canada's First Poverty Reduction Strategy, which was introduced by the Government of Canada in 2018.
3.3.1 Design and Delivery of the Job Creation Partnerships Program
Background on LMDA evaluations
The third LMDA evaluation cycle is building on the success and lessons learned from the second LMDA evaluation cycle. This evaluation will focus on filling in knowledge gaps about the effectiveness, efficiency and design/delivery of Employment Benefits and Support Measures (EBSMs). This evaluation cycle will have 100% coverage of LMDA spending.
Evaluation approach
The Job Creation Partnership (JCP) study used a mix of qualitative and quantitative methods to produce the evaluation findings. The qualitative analysis focused on exploring the design and delivery of the JCP program at the time of the data collection (fall 2018). The qualitative analysis is based on document review and key informant interviews.
The document review examined program guidelines from all 8 PTs where the JCP program is implemented. Key informant interviews included semi-structured telephone interviews with key informants, ranging from government officials involved in budget decisions and overseeing program delivery, to training providers that deliver JCP training to participants.
The quantitative component includes a statistical profile of JCP participants, using data on those who started their participation in 2015-2016 and 2016-2017.
Program description
The objective of JCP is to provide participants with the opportunity to gain work experience or training that improves their employment prospects. Program delivery varies in 2 ways:
- in 5 PTs, JCP is project-based with projects are established with organizations (often non-profit), aiming to benefit the community and participants
- in another 3 PTs, the program has a training and a work experience component. Training organizations are tasked with delivering programming that addresses labour market demand, and developing relationships with employers. In addition to a work experience placement, training activities include occupation training (including pre-apprenticeship), employability and/or essential skills training and English training
Program delivery
The following is a summary of responses from key informants, supplemented by program guidelines from 8 PTs where the JCP program is implemented.
- Recruitment of project holders and training providers: PT contract coordinators are responsible for promoting the program mainly to non-profit organizations in 5 PTs. Organizations submit proposals and contract coordinators work with them to ensure compliance with JCP guidelines. Training providers are often selected via a request for proposal process in order to target or address a specific labour market need
- Recruitment of participants: The recruitment of participants is largely the responsibility of project holders or training providers. Project holders and training providers advertise positions non-exclusively through word of mouth (5 PTs), newsletters (4 PTs), the organization's website (3 PTs), local newspapers (3 PTs), job fairs (3 PTs) and social media (3 PTs). Contract coordinators, service providers, and case workers in all 8 PTs also conduct varying degrees of recruitment activities
- Individual assessment process: PTs utilize different processes during the assessment of applicants' eligibility, needs, and suitability. In 7 PTs, the creation of a Return to Work Action Plan is also included in the assessment process. In 3 of these PTs, action plans are developed either at the same time that eligibility is assessed, after an employability assessment is conducted, or after project holders or training providers select participants
- Monitoring: In 3 PTs, participants are case-managed by service providers or case workers. In 5 PTs, service providers, case workers, contract coordinators or training providers also conduct follow-up monitoring. During the project, contract coordinators also monitor implementation by training providers or project holders
Profile of participants
4,658 EI-eligible individuals participated in JCP between April 2015 and March 2017:
- almost a 50-50 split between active and former EI claimants
- 47% women and 53% men
- One-fifth were older workers (55 and over) and one-quarter were 30 and under
- in the year prior to JCP participation, 80% of former claimants earned under $10,000 per year. This percentage was 54% for active claimants
- 34% were long-tenured workers and 45% frequent EI claimants (including 23% seasonal workers)
- before applying for EI, nearly 60% of participants occupied jobs requiring on-the-job training or a high school diploma. A little over 30% of them occupied jobs requiring no or few days of training. As well, JCP participants occupied jobs in the manufacturing, retail trade, construction and public administration sectors prior to their EI claim
Key qualitative findings
- The design and delivery of JCP allows PTs to address a variety of barriers to employment experienced by their residents. JCP can also be used to address labour market needs by targeting sub-groups of individuals, professions or economic sectors in demand and communities.
- Program managers reported that the amount allocated to JCP is influenced by government priorities, demand for the program, previous funding levels and labour market needs. Five PTs have decided not to deliver JCP because of budget priorities, lack of interest by organizations and job seekers and the temporary nature of the jobs.
- In addition to gaining work experience, key informants identified a variety of other benefits that can be expected from JCP projects. Participants are expected to develop work-related skills and enhance their job search abilities, career development and personal economic security. Project holders can benefit from JCP through increased capacity, implementing their projects and increasing their presence within local communities. Benefits for employers providing training participants with work experience are mostly associated with gaining a potential source of trained employees. At the community level, key informants expected projects to support the local economy and provide new assets (for example, restored buildings, hiking trails, and gardens) or services.
- In the current design of JCP, key informants identified delivery challenges related to the recruitment of participants and organizations, addressing participants' barriers to employment, as well as program administration and monitoring.
Incremental impacts and cost-benefit analysis
Incremental impacts and cost-benefit analysis studies were carried out in the 2014 to 2016 period as part of the second LMDA evaluation cycle. Findings from these studies were published in September 2017 in the Synthesis Report for the Evaluation of the Labour Market Development Agreements. Incremental impacts were estimated for the 2002 to 2005 cohort of participants in 2014 and for the 2007 to 2008 cohort of participants in 2015.
LMDA evaluations found that compared to non-participants, active claimants who started their JCP participation between 2002 and 2005 experienced increases in earnings and increased incidence of employment, and also reduced their use of EI benefits in the 5 years post JCP participation. Former claimants, who started their JCP participation between 2002 and 2005, experienced increases in their earnings and increased incidence of employment, but these were accompanied by increases in EI use.Footnote 16 ,Footnote 17 As well, 34.5% and 33.2% of active claimant participants filed a new claim in years 2 and 3, respectively, following the start of program participation.Footnote 18 (Table 19)
As well, a cost-benefit analysis found that the benefits of JCP exceeded the costs of the program within 5.9 years following participation for active claimants. This study showed that, for former claimant participants, the costs may never be recovered.
| Post-program impacts | 2002 to 2005 active claimants (n=5,055) |
2002 to 2005 former claimants (n= 5,013) |
|---|---|---|
| Cumulative employment earnings1 ($) | 16,552* | 4,790* |
| Increased incidence of employment2 (percentage points) | 5.7* | 4.4* |
| Cumulative EI benefits ($) | -893* | 1,006* |
| Cumulative EI weeks | -2.1* | 3.3* |
Significance level * 1%,
1 Cumulative change in participant earnings between year 1 and year 5 after participation,
2 Annual Average over 5 Years Post Participation. This estimate can be interpreted as a difference, between participants and non-participants, in the probability of being employed following participation.
As part of the third cycle of LMDA evaluations, a new round of incremental impacts will be conducted for 2010 to 2012 program participants, along with updated cost-benefit analysis.
Lessons learned and key considerations for program and policy development
Key informants identified the following as contributing factors to participant success:
- Implementation is effective when support is provided to project holders during the writing of their JCP proposal and throughout project implementation
- For training providers, participant recruitment can be enhanced by involving employers in the recruitment process and in curriculum development. Classroom-based training is most effective when it is occupation or sector-specific and aligned with current or forecasted labour demand
- Participants who benefit the most from JCP face one or multiple barriers to employment that can include a variety of needs such as work experience, networking opportunities, skills training, or assistance with reintegrating into the labour force
- Experienced organizations who used JCP previously are found to implement effective projects, having the capacity to manage funding and to provide support to participants
- Projects aligned with community needs, government priorities and labour market issues are best suited, such as event coordination, arts and culture, and construction
- Compared to other Employment Benefits offered under the LMDAs, JCP is a less attractive program and is the least used. The program could benefit from increased promotion to organizations and more importantly from reducing its administrative burden
3.3.2 Participation in LMDAs and economic security
Overview of LMDAs and the effect on economic security using poverty measures and median wages as proxies
Employment benefits under the Labour Market Development Agreements (LMDAs) help clients return to employment after job loss. This sub-section examines the effects of LMDAs on economic security and expands on analysis started in the FY1617 Employment Insurance Monitoring and Assessment ReportFootnote 19 . As poverty and economic security are complex concepts that cannot be fully measured within the scope of this report, poverty measures, such as the Market Basket Measure, low‑income measure, and median wages, will stand in as proxies on a macro level.
In line with Opportunity for All - Canada's First Poverty Reduction StrategyFootnote 20 , this year's report offers evidence that LMDAs provide the tools to succeed in the job market and reduce poverty through active employment programs. An analysis of labour market programs with the Market Basket Measure in four jurisdictions indicates that participation in LMDA programs help active claimants overcome socio‑economic barriers, leave poverty, and in some cases, surpass their highest earning threshold prior to job loss.
While outcomes-based analysis does not allow measured impacts to be unequivocally attributed to LMDAs, the trends observed in this analysis demonstrate that labour market programming has positive effects on poverty and economic security.
Methodology
General outcomes for active claimants who participated in LMDAs between January 2011 to April 2012 show that employment benefits are valuable investments in skills and employment and address some dimensions of poverty. Outcomes were examined against national median wages and poverty measures, to assess how LMDAs improve economic security.
This analysis only consists of active clients. This allows for the use of larger sample sizes and better matches to key individual and labour market characteristics (age, gender, underrepresented labour market group, occupation, and skill level). Cohorts of former clients are therefore excluded.
Analysis of LMDA impacts on economic security
LMDA outcomes were compared with 4 categories of indicators in this section, including data from the Labour Force Survey (LFS) and the Job Vacancy and Wage Survey (JVWS), as well as thresholds derived from the Market Basket Measure (MBM) and the low‑income measures (LIM). See Definitions box below for more information. National median wages from the LFS were indexed as a reference line, to measure the growth rate of earnings pre- and post- LMDA interventions. As well, the LFS was used to look at unemployment and labour market tensions on a regional level.
The LIM is included as a proxy for economic security at a macro level. This is the most commonly used low‑income measure for international comparisons. It was used previously to approximate the economic security of active claimants who participated in LMDAs in the FY1617 EI Monitoring and Assessment Report. This year's section adds poverty analysis using the MBM, which is now the official poverty measure for Canada. This analysis also looks at the general outcomes of program participation and links it to poverty. It also examines how the basic cost-of-living plays a role in program outcomes in different regions. Changes in total income before and after participation in employment benefits from 4 cities were measured against the MBM. Using multiple low‑income indicators provides a more comprehensive picture of income inequality and poverty. While the LIM provides a national overview of economic security, the MBM gives a more granular picture of the effects of LMDAs on poverty at a local levelFootnote 21 .
To control for inflation, all dollar amounts are converted to 2017 constant dollars. To match the program periods, indicators used for the 2011 to 2012 cohort are adjusted to 5 quarter moving averages (January 2010 to April 2011), where possible. This is the amount of time necessary to complete all LMDA programs, as some programs require more time than others. Indicators are then indexed to inflation in order to examine real growth rates. Otherwise, time periods are matched as closely as possible to those of the general outcomes.
The model for wage gap analysis for LMDAs follows the approach of gender-pay gap models used in New Zealand (Statistics NZ, 2018, p. 11), Australia (Workplace Gender Equality Agency, Australian Government, 2019), and New Brunswick (Government of New Brunswick, 2009). The wage gap is the difference between national median wages and those of LMDA participants (expressed as “LMDA” in the equation below), expressed as a percentage of national earnings.
LMDA wage gap = [(median wage - LMDA)/median wage] * 100.
Caveats
- The program period for claimants who only received EAS interventions are shorter than for claimants who participated in other LMDA-funded programs.
- Outcomes can be due to many factors. While there could be a correlation between program participation and outcomes, the methodology in Section 3.2 does not allow outcomes to be unequivocally attributed to LMDAs.
- The Market Basket Measure is a threshold of poverty based on the cost of a basket of goods for a modest standard of living for an economic family of four (2 adults and 2 children). As analysis of LMDAs is based on individual incomes without background on family structure, the MBM has been adjusted, following the guidelines from the Census of the Population DictionaryFootnote 22 , for a person not in an economic family.
- Analysis of labour market tightness follows the quarters in the JVWS. As the survey began in the first quarter of 2015, previous time periods are not available for this analysis. Data from the first quarter of 2015 is unreliable, because it “used only two-thirds of the regular sample. As a result, comparisons of the first quarter of 2015 data with data from subsequent quarters should be made with cautionFootnote 23 .” Therefore, data from 2015Q2 onwards was used for analysis. As the regions are small sub-populations, analysis is based on year-over-year comparisons. The JVWS is not seasonally adjusted.
Definitions
Low income measures (LIM)
Developed by Statistics Canada, LIM is a comparison of individual income relative to society. As LIM does not depend on country-specific consumption, it is used for international comparisons. The OECD uses a version of a LIM methodology to report on international low income. It is a fixed percentage (50%) of median adjusted householdFootnote 24 income, accounting for household needs. LIMs are calculated annuallyFootnote 25 on the Canadian Income Survey. Therefore, they do not require updating with an inflation index. As defined by Statistics Canada (2016), “The concept underlying the LIM is that all persons in a household have low income if their adjusted household income falls below half of the median adjusted income. The household income is adjusted by an equivalence scale to take economies of scale into account. This adjustment for different household sizes reflects the fact that a household's needs increase, but at a decreasing rate, as the number of members increases. The adjustment factor, also known as the equivalence scale, is the square root of the number of persons in the household.”
Market Basket Measure (MBM)
The Government of Canada released Opportunity for All, Canada's first Poverty Reduction StrategyFootnote 26 , whose commitments are legislated through the Poverty Reduction Act included in the Budget Implementation Act I, 2019 (Bill C-97). This recognizes the Market Basket Measure (MBM) as Canada's Official Poverty Line. “The Market Basket Measure (MBM) of low income develops thresholds of poverty based upon the cost of a basket of food, clothing, shelter, transportation, and other items for individuals and families representing a modest, basic standard of livingFootnote 27 ”A family is considered living in poverty if their disposable income is less than the poverty threshold.
The family size for the Market Basket Measure was converted from an economic family of four (2 adults + 2 children) to a single person not in an economic family to match individual‑level participation in labour market programs. To find the amount for an individual person, the amount of the economic family was divided by its square rootFootnote 28 . This analysis uses the latest updated MBM, the 2008 base, indexed to 2017 constant dollars.
Individuals are living in poverty when their disposable income falls below the poverty threshold for their region. “Disposable income is total income (including government transfers) after deducting income taxes and non-discretionary expensesFootnote 29 ,Footnote 30 .” . Total incomeFootnote 31 was used for this analysis rather than disposable income, since information on non-discretionary expenses was not available at this time. Additionally, the variables that make up total income include government transfers, such as Social Assistance, EI benefits, part-time/casual work, and tax-exempt Indigenous earnings, therefore, it was not possible to remove taxes from this group to create a proxy for disposable income. Additionally, EI benefits are only be taxed if net income is above $66,375, and none of the groups have income over that amount. Total income amounts were also at, or below, the level of tax exemptions from the Canada Revenue Agency and the provincesFootnote 32 , therefore, the total income variable will be treated as disposable income for this analysis.
LMDAs, earnings, economic security and poverty
LMDAs help participants leave low-income and poverty by providing skills, training and supports to increase earnings, return to employment and weather socio-economic barriers.
Economic security of LMDA active claimants
Canada is not unique concerning increasing economic security through labour market programs. Around the world, other countries are seeing the benefits and necessity of continuous adult learning and skills upgrades. An OECD publication reported that “Australia requires a strong system of adult learning to position firms and workers to succeed as skill demand changesFootnote 33".
Overall, the economic security of EI claimants who participated in LMDA-funded programs between January 2011 to April 2012 increased after program participation. More precisely, the wage gap between total income and national median wages narrowed after program participation for active claimants, and the income growth rate surpassed the growth of low income.
Median wages
Table 20 examines the economic security of active EI claimants, who participated in LMDA programming between the years of 2011 to 2012. Total income of claimants is assessed against a proxy of economic security, comprised of national median wages and the low-income measures (LIM). Economic security is observed for 3 periods of time:
- the pre-program period (1 to 5 years before starting interventions)
- the program period (start year, duration of the program/1 year post-start year for EAS-only clients), and
- the post-program period (1 to 3 years after intervention); fiscal years are included for reference
Total income for participants in Skills Development - Regular (SD-R) programs between 2011 to 2012 had the strongest overall income growth (Chart 43). Within the first year after program participation, total income for this group exceeded their highest pre-program income level (+4.8%), from $25,711 one year before the start of participation to $26,954 1 year after participation (Table 20). This trend continued, where total income 3 years post-program exceeded the highest pre-participation income by +17.2% ($30,139). The wage gap between income from SD-R participants and national median wages narrowed from 52.3% 5 years before program participation ($19,327 to $40,486) to 31.6% 3 years after participation ($30,139 to $44,064), an overall decrease of 20.7 percentage points.
Similarly, income growth after participation in JCP exceeded the highest pre-program levels (+13.0%), from $19,432 (the highest pre-program income level) 1 year before participation to $21,967 1 year after participation (Chart 43). Over the 3-year period after participation, income for this group remained around 15.1% higher than the highest pre-program income (Table 20). The wage gap between JCP participants and national median wages narrowed by 10.6 percentage points, from 60.6% 5 years before participation ($15,948 to $40,486) to 50.0% 3 years after participation ($22,026 to $44,064).
The overall wage gap between Targeted Wage Subsidy (TWS) income and national median wages also narrowed by 2.8 percentage points, from 46.2% 5 years before participation ($21,768 to $40,496) to 43.4% 3 years after participation ($24,945 to $44,064). While income in the first year post‑participation was 3.0% lower than the highest pre-participation income ($23,972 to $24,709), total income for TWS participants recovered after the second year and exceeded the highest pre-participation income by 1.4% ($25,055).
Unlike the other interventions, Employment Assistance Services (EAS) is a low-cost investment that helps active claimants overcome the challenges from job loss. This intervention is not designed to handle structural impediments to job loss. EAS is the gateway for claimants to enter full, or short-term/light-touch interventions. Active claimants in the EAS-only group did not receive any other interventions, those individuals are filtered out of this group. For EAS-only clients, its focus is on reintegrating workers back into employment as soon as possible. Unlike claimants who participated in other programs in addition to EAS, claimants who only had EAS intervention between 2011 to 2012 did not return to their highest income level. EAS-only interventions are not medium-term investments on human capital, and do not necessarily contribute to improved wages in the long run.
While total income in all groups recovered steadily within 3 years of program participation and closed the wage gap with national median wages, income for EAS‑only participants 3 years after participation was 5.3% below their highest pre-job loss income level ($27,076 1 year pre-program to $25,630 3 years after intervention). Despite this, the income growth rate from EAS-only claimants rose faster than the national median wage, and closed the wage gap by 5.3 percentage points, from 45.7% 5 years prior to participation to 40.3% 3 years after participation.
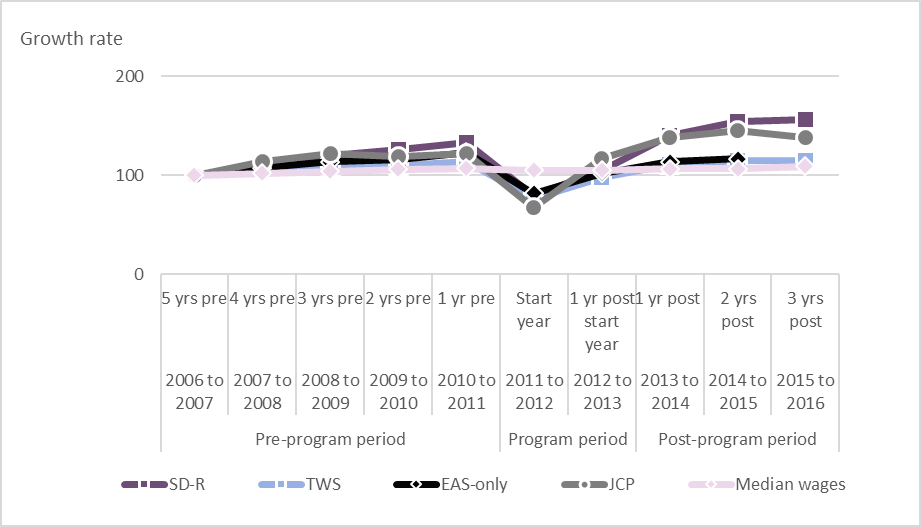
Chart 43 – Text version
| Growth rate | 5 years pre (2006 to 2007) |
4 years pre (2007 to 2008) |
3 years pre (2008 to 2009) |
2 years pre (2009 to 2010) |
1 year pre (2010 to 2011) |
|---|---|---|---|---|---|
| SD-R | 100,0 | 109,2 | 119,4 | 126,0 | 133,0 |
| TWS | 100,0 | 105,7 | 109,2 | 109,9 | 113,5 |
| EAS-only | 100,0 | 107,2 | 113,5 | 116,1 | 123,1 |
| JCP | 100,0 | 113,2 | 121,7 | 119,0 | 121,8 |
| Median wages | 100 | 101,8 | 103,7 | 105,9 | 106,7 |
| Growth rate | Start year (2011 to 2012) |
1 year post start year (2012 to 2013) |
|---|---|---|
| SD-R | 78,8 | 104,5 |
| TWS | 76,5 | 97,5 |
| EAS-only | 81,4 | 101,7 |
| JCP | 66,9 | 117,0 |
| Median wages | 104,7 | 104,7 |
| Growth rate | 1 year post (2013 to 2014) |
2 years post (2014 to 2015) |
3 years post (2015 to 2016) |
|---|---|---|---|
| SD-R | 139,5 | 153,9 | 155,9 |
| TWS | 110,1 | 115,1 | 114,6 |
| EAS-only | 113,6 | 116,5 | n/a |
| JCP | 137,7 | 145,0 | 138,1 |
| Median wages | 106,3 | 106,1 | 108,8 |
Notes EAS-only does not have an extended program period. One-year post start period is outside of the program period.
Sources Statistics Canada. Table 18-10-0005-01 Consumer Price Index, annual average, not seasonally adjusted
Statistics Canada. Table 14-10-0340-01 Employee wages by occupation, annual
Table 20 - Earnings of active EI claimants who participated in LMDAs between 2011 to 2012 compared with median wages and the low-income measure, ages 15 years and older, 2017 constant dollars, Canada
For accessibility reasons, the table has been simplified. Consult the PDF version for the full table.
| LMDAs | 5 years pre (2006 to 2007) |
4 years pre (2007 to 2008) |
3 years pre (2008 to 2009) |
2 years pre (2009 to 2010) |
1 year pre (2010 to 2011) |
|---|---|---|---|---|---|
| SD-R | $19,327 | $21,105 | $23,078 | $24,347 | $25,711 |
| TWS | $21,768 | $23,014 | $23,764 | $23,926 | $24,709 |
| JCP | $15,948 | $18,059 | $19,404 | $18,984 | $19,432 |
| EAS-only | $21,993 | $23,576 | $24,956 | $25,541 | $27,076 |
| Median wages | $40,486 | $41,197 | $41,977 | $42,877 | $43,214 |
| LIM | $20,204 | $20,864 | $21,429 | $21,520 | $21,583 |
Notes: Low income measures (LIMs) after tax are set at 50% of adjusted median household income, for an individual person
EAS-only does not have an extended program period. One-year post start period is outside of the program period.
Sources: Statistics Canada. Table 11-10-0232-01 Low income measure (LIM) thresholds by income source and household size
Statistics Canada. Table 18-10-0005-01 Consumer Price Index, annual average, not seasonally adjusted
Statistics Canada. Table 14-10-0340-01 Employee wages by occupation, annual
| LMDAs | Start year (2011 to 2012) |
1 year post start year (2012 to 2013) |
|---|---|---|
| SD-R | $15,235 | $20,200 |
| TWS | $16,661 | $21,226 |
| JCP | $10,666 | $18,664 |
| EAS-only | $17,896 | $22,377 |
| Median wages | $42,369 | $42,379 |
| LIM | $21,879 | $22,281 |
Notes: Low income measures (LIMs) after tax are set at 50% of adjusted median household income, for an individual person
EAS-only does not have an extended program period. One-year post start period is outside of the program period.
Sources: Statistics Canada. Table 11-10-0232-01 Low income measure (LIM) thresholds by income source and household size
Statistics Canada. Table 18-10-0005-01 Consumer Price Index, annual average, not seasonally adjusted
Statistics Canada. Table 14-10-0340-01 Employee wages by occupation, annual
| LMDAs | 1 year post (2013 to 2014) |
2 years post (2014 to 2015) |
3 years post (2015 to 2016) |
|---|---|---|---|
| SD-R | $26,954 | $29,736 | $30,139 |
| TWS | $23,972 | $25,055 | $24,945 |
| JCP | $21,967 | $23,128 | $22,026 |
| EAS-only | $24,984 | $25,630 | n/a |
| Median wages | $43,053 | $42,958 | $44,064 |
| LIM | $22,391 | $22,746 | $23,020 |
Notes: Low income measures (LIMs) after tax are set at 50% of adjusted median household income, for an individual person
EAS-only does not have an extended program period. One-year post start period is outside of the program period.
Sources: Statistics Canada. Table 11-10-0232-01 Low income measure (LIM) thresholds by income source and household size
Statistics Canada. Table 18-10-0005-01 Consumer Price Index, annual average, not seasonally adjusted
Statistics Canada. Table 14-10-0340-01 Employee wages by occupation, annual
National picture of general outcomes - Low-income measure (LIM)
In addition to closing the gap on median wages, total income for active EI claimants who participated in labour market programming between 2011 to 2012 grew faster than the low-income measure (LIM). Controlling for inflation, income growth for all groups surpassed the growth rate of low-income within 3 years after program intervention (Chart 44).
Total income for SD-R participants grew faster than the LIM after program participation. The income gap between SD-R and LIM widened to 35.3 percentage points, from 4.3% below LIM 5 years pre-program ($19,327 SD‑R to $20,204 LIM), to 30.9% above LIM 3 years post-program ($30,139 SD‑R to $23,020 LIM). Overall, the growth rate from SD-R rose faster than LIM, from 5 years pre‑program to 3 years post‑program (55.9% SD‑R to 13.9% LIM). From the start of the program period to 3 years post-program, the growth rate for SD-R expanded by 97.8%, compared to 5.2% for LIM from the same period.
Similarly, the overall gap between total income for JCP participants and the LIM widened by 16.7 percentage points (from $15,948 JCP and $20,204 LIM, 5 years pre-program, to $22,026 JCP and $23,020 LIM 3 years post-program). Income grew from 21.1% below LIM 5 years pre-program to 1.7% above LIM 2 years post-program. However, the income growth rate fell behind the growth rate for LIM by 4.3% in the third year post-participation. Overall, the indexed growth rate for JCP was stronger than LIM, 38.1% compared to 13.9%, over the entire period. From the start of the program period, JCP grew by 106.5%, compared to 5.2% for LIM.
Total income for TWS participants was 0.6 percentage points above LIM after program participation. While income was 7.7% above LIM 5 years before participation ($21,768 TWS to $20,204 LIM), they fell to 23.9% below LIM at the start of the program year ($16,661 TWS to $21,879 LIM). The gap between income and LIM widened again after participation, to 8.4% above LIM, 3 years after participation ($24,945 TWS to $23,020 LIM). Over the entire analysis period, the indexed growth rate for TWS was slightly above LIM (14.6% to 13.9%). From the program start year to 3 years post-program, TWS grew 49.7% compared to 5.2% for LIM.
Unlike the other employment programs, EAS-only is designed to support job-ready claimants. Income growth for this group remained above LIM, except during the intervention period, where the income dipped to 18.2% below LIM ($17,896 EAS to $21,879 LIM). The gap between income and LIM was 8.9% above LIM 5 years before participation ($21,993 EAS-only to $20,204 LIM), and increased to 12.7% above LIM 3 years post-intervention ($25,630 EAS-only to $22,746 LIM). Overall, the indexed growth rate of the EAS-only group (5 years pre-intervention to 3 years post-intervention) hovered above LIM, 16.5% to 13.9%. From the start of intervention to 3 years post-intervention, the indexed growth rate for EAS-only was 43.2%, compared to 4.0% for LIM for the same period.
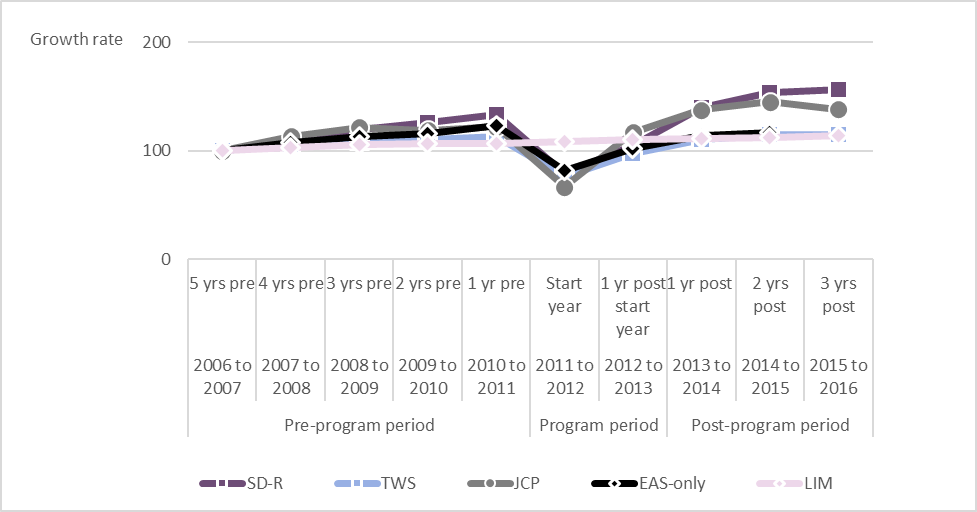
Chart 44 – Text version
| Growth rate | 5 years pre (2006 to 2007) |
4 years pre (2007 to 2008) |
3 years pre (2008 to 2009) |
2 years pre (2009 to 2010) |
1 year pre (2010 to 2011) |
|---|---|---|---|---|---|
| SD-R | 100,0 | 109,2 | 119,4 | 126,0 | 133,0 |
| TWS | 100,0 | 105,7 | 109,2 | 109,9 | 113,5 |
| EAS-only | 100,0 | 107,2 | 113,5 | 116,1 | 123,1 |
| JCP | 100,0 | 113,2 | 121,7 | 119,0 | 121,8 |
| LIM | 100 | 103,3 | 106,1 | 106,5 | 106,8 |
| Growth rate | Start year (2011 to 2012) |
1 year post start year (2012 to 2013) |
|---|---|---|
| SD-R | 78,8 | 104,5 |
| TWS | 76,5 | 97,5 |
| EAS-only | 81,4 | 101,7 |
| JCP | 66,9 | 117,0 |
| LIM | 108,3 | 110,3 |
| Growth rate | 1 year post (2013 to 2014) |
2 years post (2014 to 2015) |
3 years post (2015 to 2016) |
|---|---|---|---|
| SD-R | 139,5 | 153,9 | 155,9 |
| TWS | 110,1 | 115,1 | 114,6 |
| EAS-only | 113,6 | 116,5 | n/a |
| JCP | 137,7 | 145,0 | 138,1151 |
| LIM | 110,8 | 112,6 | 113,9 |
Notes: Low income measures (LIMs) after tax are set at 50% of adjusted median household income, for an individual person
EAS-only does not have an extended program period. One-year post start period is outside of the program period.
Sources: Statistics Canada. Table 11-10-0232-01 Low income measure (LIM) thresholds by income source and household size
Statistics Canada. Table 18-10-0005-01 Consumer Price Index, annual average, not seasonally adjusted
Effect of LMDAs on poverty in 4 cities
The Market Basket Measure (MBM) is Canada's official poverty line. It measures thresholds of poverty based on a basket of goods representing a basic standard of livingFootnote 34 . The basket is the cost of food, clothing, shelterFootnote 35 , transportation and other necessitiesFootnote 36 determined for an individual (see Definitions box for adjustment.) The poverty analysis in this report is limited to income, the MBM, and labour market information. Poverty is a much more complex issue that involves wide-ranging social elements, which cannot be covered within the scope of this report. Participants are considered to be living in poverty if their total income falls below the MBM threshold.
General outcomes from LMDAs from 4 cities were selected to see the effects of labour market programs on poverty in various jurisdictions. Vancouver was chosen for the pressures on the housing market, which drove up the cost-of-living. Toronto was included as the largest city in Canada. Halifax and Montreal were both included as large, urban centres that did not have the same housing pressures as Vancouver or Toronto.
The outcomes of labour market programs are interrelated with regional economic factors, such as unemployment, labour market tightness and cost-of-living. All of these factors work together to affect claimants' progress after job loss. For background, the job vacancy rate and unemployment rate from April to June in 2015 and 2016 (2015Q2 and 2016Q2) provide context to local labour market tightness in the last two years post-program. In addition, regional unemployment rates from 2006 to 2016 frame the economic environment during the program and recovery period. Please note, the Job Vacancy and Wage Survey (JVWS) started in 2015Q1, therefore, previous time periods are not available. The time periods for labour market tightness are as closely matched to the outcomes period as possible (the two final post-period years). Labour market tightness is the gap between the supply and demand of labour. The labour market is tighter when the gap is smaller.
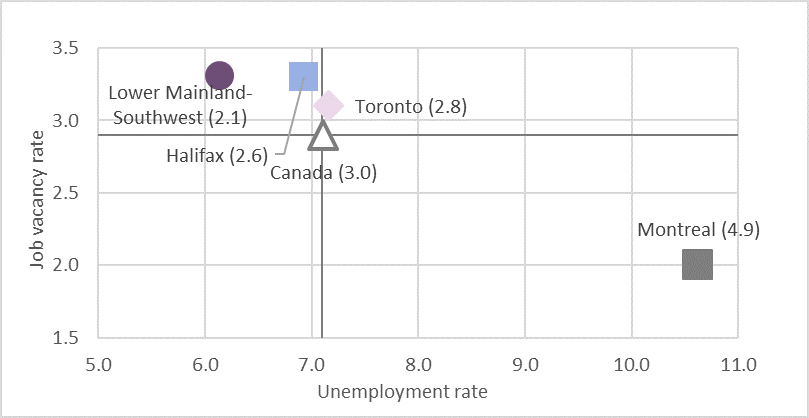
Chart 45 – Text version
| Location | Unemployment rate | Job vacancy rate |
|---|---|---|
| Canada (3.0) | 7,1 | 2,9 |
| Halifax (2.6) | 6,9 | 3,3 |
| Montreal (4.9) | 10,6 | 2 |
| Toronto (2.8) | 7,2 | 3,1 |
| Lower Mainland-Southwest (2.1) | 6,1 | 3,3 |
Note: Unemployment-to-vacancy ratio (UV) ratio indicates the number of unemployed for every job vacancy (in brackets).
Sources: Statistics Canada. Table 14-10-0293-01 Labour force characteristics by economic region, 3-month moving average, unadjusted for seasonality, last 5 months, Statistics Canada. Table 14-10-0356-01 Job vacancies and average offered hourly wage by occupation (broad occupational category), quarterly, unadjusted for seasonality, Claveau, G., Employment and Social Development Canada (2020, January 22), pp. 6-10.
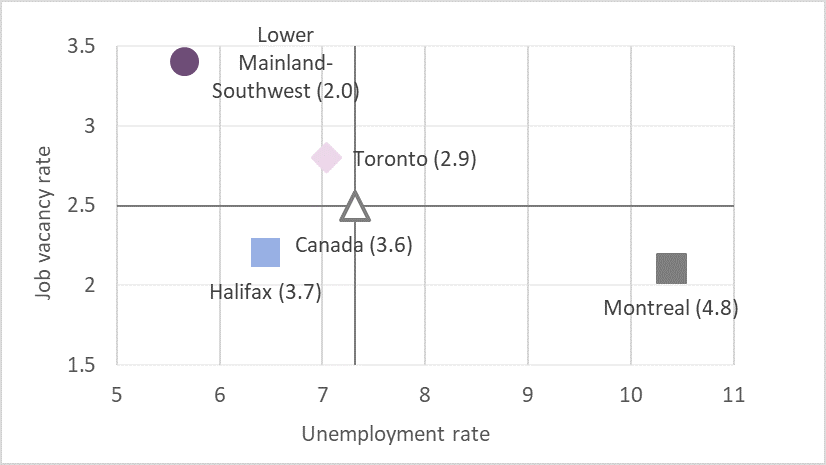
Chart 46 – Text version
| Location | Unemployment rate | Job vacancy rate |
|---|---|---|
| Canada (3.6) | 7,3 | 2,5 |
| Halifax (3.7) | 6,5 | 2,2 |
| Montreal (4.8) | 10,4 | 2,1 |
| Toronto (2.9) | 7,0 | 2,8 |
| Lower Mainland-Southwest (2.0) | 5,7 | 3,4 |
Note: Unemployment-to-vacancy ratio (UV) ratio indicates the number of unemployed for every job vacancy (in brackets).
Sources: Statistics Canada. Table 14-10-0293-01 Labour force characteristics by economic region, three-month moving average, unadjusted for seasonality, last 5 months, Statistics Canada. Table 14-10-0356-01 Job vacancies and average offered hourly wage by occupation (broad occupational category), quarterly, unadjusted for seasonality, Claveau, G., Employment and Social Development Canada (2020, January 22), pp. 6-10.
April to June in 2015 and 2016 (2015Q2 and 2016Q2) provide context to local labour market tightness in the last 2 years post‑program. In addition, regional unemployment rates from 2006 to 2016 frame the economic environment during the program and recovery period. Please note, the Job Vacancy and Wage Survey (JVWS) started in 2015Q1, therefore, previous time periods are not available. The time periods for labour market tightness are as closely matched to the outcomes period as possible (the 2 final post-period years). Labour market tightness is the gap between the supply and demand of labour. The labour market is tighter when the gap is smaller.
Overall, LMDAs help people get out of poverty after job loss, and provide the tools to overcome obstacles in the job market. However, the effects of program participation are dampened if there are multiple setbacks in the region. In all four jurisdictions, the total income of LMDA participants closes the gap on poverty, and most groups rise above the poverty line after participation. Different programs had different outcomes in each of the four jurisdictions.
Halifax
Three out of 4 LMDA groups left poverty after job loss, while the remaining closed the gap on poverty (Chart 47). In Halifax, the poverty threshold (the basic cost-of-living) was below $20,000 per year; making this the second most affordable city (Montreal had a lower cost-of-living). Between 2006 and 2016, the unemployment rate in Halifax averaged 1.1 percentage points below that of Canada, meaning there were fewer unemployed Haligonians compared to the national average, and labour was scarce (Chart 48).
In 2015Q2, Halifax had a tight labour market (Chart 45). There were more vacant jobs, and fewer available workers than for Canada (around 2.6 unemployed workers for every available job in Halifax, versus an unemployment-to-vacancy (UV) ratio of 3.0 for Canada). A tight labour market allows workers to leverage their skills and experience to negotiate higher wages and better working conditions. In 2016Q2, the labour market in Halifax moved to an efficient labour market. While both the unemployment rate and job vacancy rate decreased year-over-year, the largest movement was a 1.1 percentage point drop in the job vacancy rate (from 3.3% in 2015Q2 to 2.2% in 2016Q2). The labour supply moved in line with demand, where the UV ratio for Halifax was 3.7, compared to 3.6 for Canada (Chart 46).
The combination of lower cost‑of‑living, low unemployment rate, and an efficient labour market enabled successful transitions back to work for claimants after participation in LMDA-funded programs. Participation in SD and TWS programs had more impact than EAS-only interventions. Total income for active claimants from these programs moved further out of poverty and surpassed their highest pre‑program income after participation. While total income for JCP remained under the poverty threshold, income rose steadily after program participation, and closed the gap on poverty.
Total income for active claimants who participated in SD programs recovered quickly within the first year after participation, from $11,434 (41.5% below the poverty line) during the start of the program period, to $23,000 (19.5% above the poverty line) 1 year post-program. Income continued to move away from poverty to $27,495, 3 years after participation (42.2% above poverty). Overall, total income for SD participants increased by 42.4% from 5 years before participation, to 3 years after participation ($19,302 to $27,495).
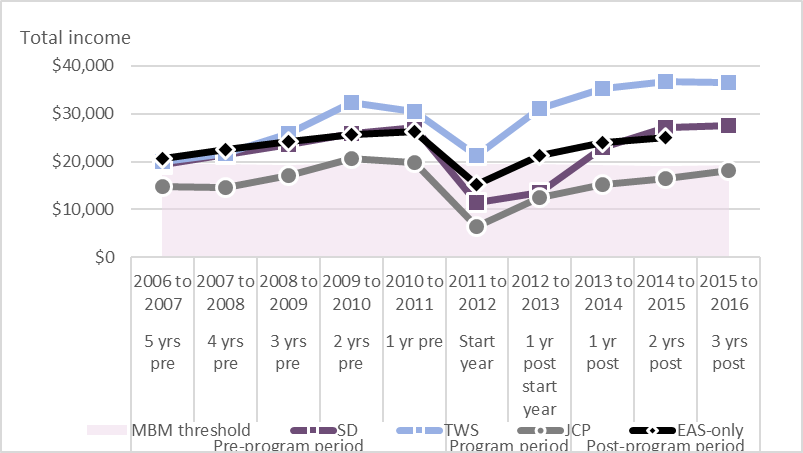
Chart 47 – Text version
| LMDA | 5 years pre (2006 to 2007) |
4 years pre (2007 to 2008) |
3 years pre (2008 to 2009) |
2 years pre (2009 to 2010) |
1 year pre (2010 to 2011) |
|---|---|---|---|---|---|
| EAS-only | $20 666 | $22 621 | $24 132 | $25 618 | $26 278 |
| JCP | $14 708 | $14 647 | $17 120 | $20 671 | $19 873 |
| SD | $19 302 | $21 537 | $23 540 | $25 832 | $27 027 |
| TWS | $20 111 | $21 715 | $25 886 | $32 293 | $30 547 |
| MBM threshold | $19 761 | $19 529 | $19 316 | $19 711 | $19 350 |
| LMDA | Start year (2011 to 2012) |
1 year post start year (2012 to 2013) |
|---|---|---|
| EAS-only | $15 267 | $21 179 |
| JCP | $6 518 | $12 516 |
| SD | $11 434 | $13 573 |
| TWS | $21 374 | $31 185 |
| MBM threshold | $19 535 | $19 440 |
| LMDA | 1 year post (2013 to 2014) |
2 years post (2014 to 2015) |
3 years post (2015 to 2016) |
|---|---|---|---|
| EAS-only | $23 991 | $24 935 | n/a |
| JCP | $15 242 | $16 375 | $18 224 |
| SD | $23 000 | $27 119 | $27 495 |
| TWS | $35 240 | $36 787 | $36 442 |
| MBM threshold | $19 243 | $19 044 | $19 329 |
Sources: Statistics Canada. Table 11-10-0066-01 Market Basket Measure (MBM) thresholds for the reference family by Market Basket Measure region, component and base year Statistics Canada, Income Statistics Division, Table 4.5, Market Basket Measure (MBM) thresholds for economic families and persons not in economic families, 2015 Dictionary Statistics Canada. Table 18-10-0005-01 Consumer Price Index, annual average, not seasonally adjusted
Total income for active claimants in TWS programs did not fall into poverty at the time of job loss. However, there was a similar trajectory as the other labour market programs in Halifax, with a quick recovery after program participation, and a rise away from poverty. Total income bounced back after job loss by 70.5%, from $21,374 at the start of the program, to $36,442 3 years after participation. Overall, total income for TWS participants continued to move above poverty, with an 81.2% increase in total income, from $20,111 5 years before job loss, to $36,442 3 years after participation.
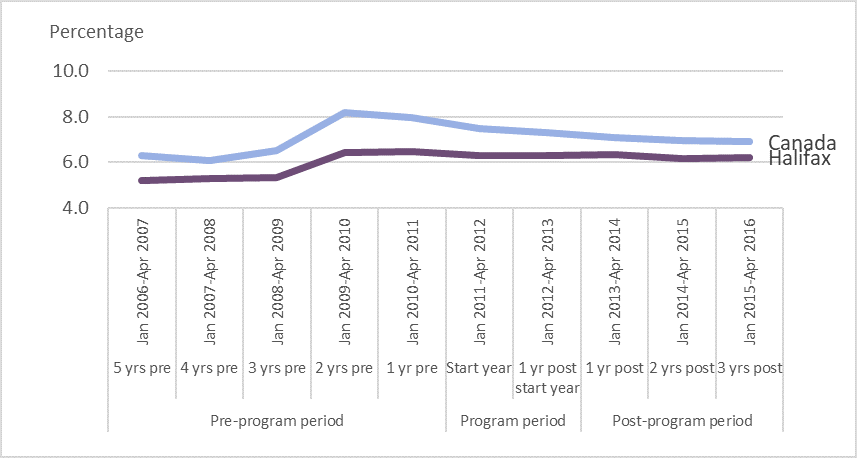
Chart 48 – Text version
| Halifax/Canada | 5 years pre (Jan 2006 to Apr 2007) |
4 years pre (Jan 2007 to Apr 2008) |
3 years pre (Jan 2008 to Apr 2009) |
2 years pre (Jan 2009 to Apr 2010) |
1 year pre (Jan 2010 to Apr 2011) |
|---|---|---|---|---|---|
| Canada | 6,3 | 6,1 | 6,5 | 8,2 | 8,0 |
| Halifax | 5,2 | 5,3 | 5,3 | 6,4 | 6,5 |
| Halifax/Canada | Start year (Jan 2011 to Apr 2012) |
1 year post start year (Jan 2012 to Apr 2013) |
|---|---|---|
| Canada | 7,5 | 7,3 |
| Halifax | 6,3 | 6,3 |
| Halifax/Canada | 1 year post (Jan 2013 to Apr 2014) |
2 years post (Jan 2014 to Apr 2015) |
3 years post (Jan 2015 to Apr 2016) |
|---|---|---|---|
| Canada | 7,1 | 6,9 | 6,9 |
| Halifax | 6,3 | 6,1 | 6,2 |
Source: Statistics Canada. Table 14-10-0294-01 Labour force characteristics by census metropolitan area, 3 month moving average, seasonally adjusted and unadjusted, last 5 months.
While total income for active claimants in JCP programs remained mostly below the poverty line, income rose steadily after program participation, to close the gap on poverty. At the time of job loss and the start year of program participation, income fell to $6,518 (66.6% below the poverty threshold). After program participation, there was a strong and continued income rise, closing the gap on poverty to 5.7% below the poverty line ($18,224) 3 years after program participation. Total income increased overall by 23.9%, from $14,708 5 years before participation to $18,224 3 years after participation.
Total income for those who only had EAS interventions followed the same trajectory as the other programs. At the time of job loss/start of the intervention period, total income fell 21.8% below the poverty threshold ($15,267), but recovered to 8.9% above poverty ($21,179) within the first year after intervention. Income climbed to 30.9% above poverty ($24,935) 2 years after the program period. From the program start year to 2 years after intervention, income increased by 63.3%, from $15,267 to $24,935. Overall, total income for those with EAS‑only interventions increased by 20.7%, from $20,666 5 years before job loss, to $24,935 2 years after intervention. While total income for those in the EAS-only group fell below the poverty line at the time of job loss, this group left the poverty threshold within 1 year after the start period.
Montreal
While total income for active claimants who participated in labour market programs dropped below the poverty line at the time of job loss/program start year, all participants left poverty within 1 year of participation (Chart 49), despite adverse labour market conditions.
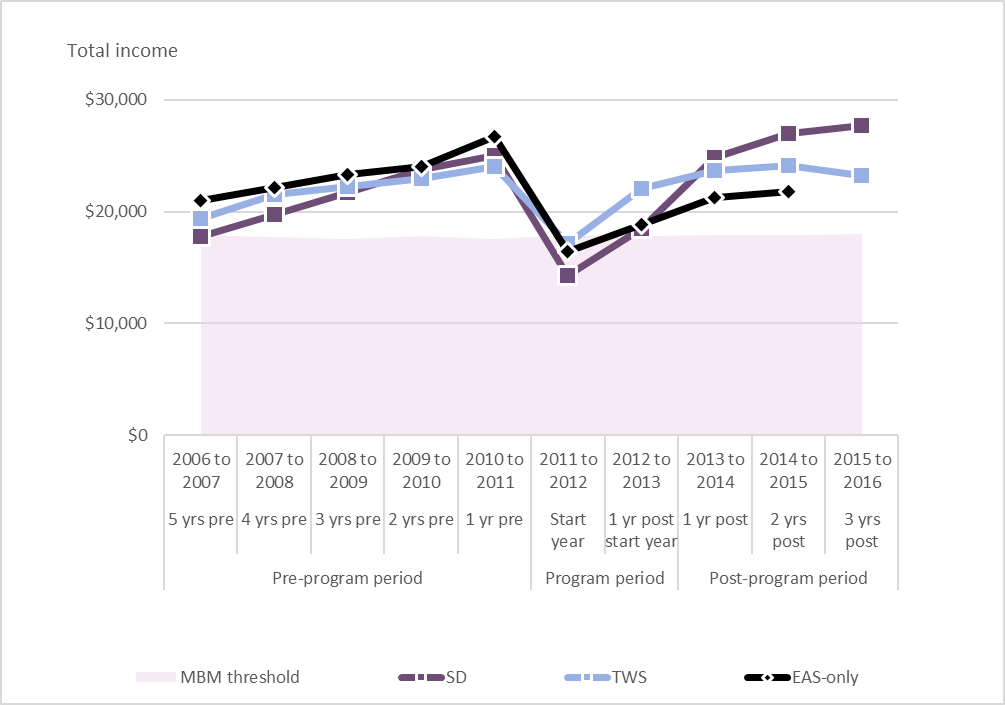
Chart 49 – Text version
| LMDA | 5 years pre (2006 to 2007) |
4 years pre (2007 to 2008) |
3 years pre (2008 to 2009) |
2 years pre (2009 to 2010) |
1 year pre (2010 to 2011) |
|---|---|---|---|---|---|
| EAS-only | $21 000 | $22 147 | $23 305 | $24 071 | $26 718 |
| SD | $17 741 | $19 705 | $21 672 | $23 772 | $25 007 |
| TWS | $19 363 | $21 552 | $22 277 | $22 977 | $24 010 |
| MBM threshold | $17 912 | $17 693 | $17 578 | $17 791 | $17 582 |
| LMDA | Start year (2011 to 2012) |
1 year post start year (2012 to 2013) |
|---|---|---|
| EAS-only | $16 455 | $18 858 |
| SD | $14 288 | $18 451 |
| TWS | $17 176 | $22 081 |
| MBM threshold | $17 876 | $17 861 |
| LMDA | 1 year post (2013 to 2014) |
2 years post (2014 to 2015) |
3 years post (2015 to 2016) |
|---|---|---|---|
| EAS-only | $21 250 | $21 781 | - |
| SD | $24 802 | $26 949 | $27 722 |
| TWS | $23 641 | $24 159 | $23 193 |
| MBM threshold | $17 890 | $17 876 | $18 022 |
Sources: Statistics Canada. Table 11-10-0066-01 Market Basket Measure (MBM) thresholds for the reference family by Market Basket Measure region, component and base year Statistics Canada, Income Statistics Division, Table 4.5, Market Basket Measure (MBM) thresholds for economic families and persons not in economic families, 2015 Dictionary Statistics Canada. Table 18-10-0005-01 Consumer Price Index, annual average, not seasonally adjusted
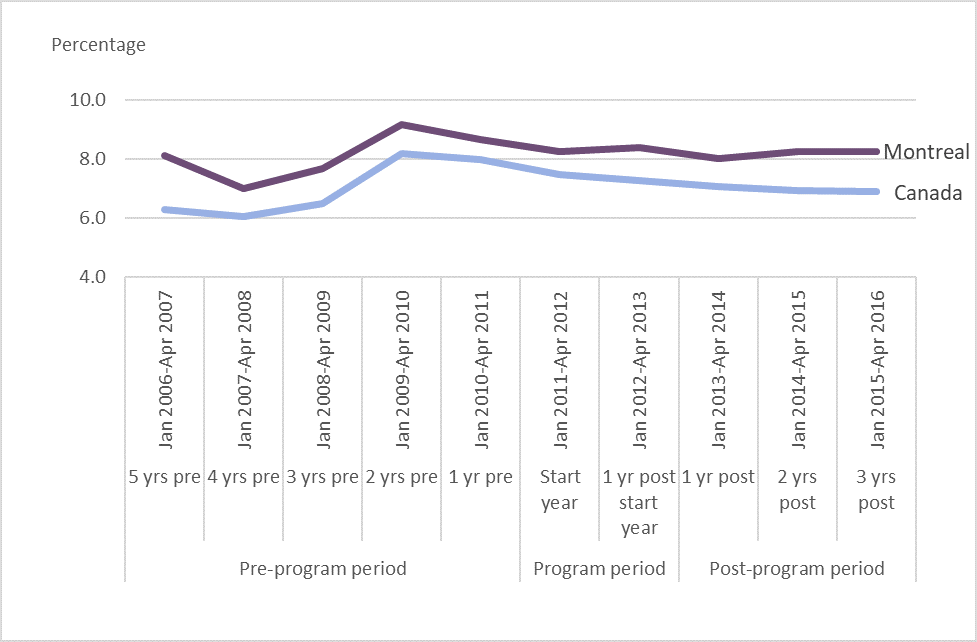
Chart 50 – Text version
| Montreal/Canada | 5 years pre (Jan 2006 to Apr 2007) |
4 years pre (Jan 2007 to Apr 2008) |
3 years pre (Jan 2008 to Apr 2009) |
2 years pre (Jan 2009 to Apr 2010) |
1 year pre (Jan 2010 to Apr 2011) |
|---|---|---|---|---|---|
| Canada | 6,3 | 6,1 | 6,5 | 8,2 | 8,0 |
| Montreal | 8,1 | 7,0 | 7,7 | 9,2 | 8,7 |
| Montreal/Canada | Start year (Jan 2011 to Apr 2012) |
1 year post start year (Jan 2012 to Apr 2013) |
|---|---|---|
| Canada | 7,5 | 7,3 |
| Montreal | 8,2 | 8,4 |
| Montreal/Canada | 1 year post (Jan 2013 to Apr 2014) |
2 years post (Jan 2014 to Apr 2015) |
3 years post (Jan 2015 to Apr 2016) |
|---|---|---|---|
| Canada | 7,1 | 6,9 | 6,9 |
| Montreal | 8,0 | 8,3 | 8,3 |
Source: Statistics Canada. Table 14-10-0294-01 Labour force characteristics by census metropolitan area, 3 month moving average, seasonally adjusted and unadjusted, last 5 months.
Montreal had an unfavourable labour market between 2006 and 2016. The unemployment rate remained around 1.1 percentage points above Canada during this period (see Chart 50). Montreal also had a slack labour market in 2015Q2 and 2016Q2 (see Charts 45 and 46). The local UV ratio remained higher than the national ratio year-over-year, with 4.9 unemployed people for every vacant job in 2015Q2, and 4.8 unemployed per vacancy in 2016Q2. With higher numbers of unemployed workers competing for fewer available jobs, these obstacles created barriers for active claimants returning to the job market.
However, the poverty threshold - cost-of-living - for Montreal hovered around $17,800, making this the most affordable city to live in. The low cost-of-living may have offset the loose labour market and enabled labour market participants to benefit from their programs, recover quickly and leave poverty within a year of program participation.
The program with the strongest trajectory out of poverty is SD-R. While total income for this group started below the poverty line, and fell the lowest at the time of job loss/program start year, it had the strongest growth rate after program participation and surpassed its highest pre-program income within 2 years of participation. Five years before starting the program, total income for SD participants was 1.0% below poverty ($17,741), and fell 20.1% further ($14,288) during the program start year. However, total income for SD participants rose 3.3% above the poverty line while still within the program period ($18,451 1 year post-start year), and rose 53.8% above poverty 3 years post‑participation ($27,722). Total income from start of program to 3 years post-program grew 94.0%, from $14,288 to $27,722. Overall, total income for SD participants rose by 56.3%, from $17,741 5 years before participation, to $27,722 3 years after participation. Total post-participation income exceeded the highest pre-participation income by 10.9%, from $25,007 to $27,722.
Total income for TWS participants fell into poverty at the time of job loss/program start year (3.9% below the poverty line). However, total income recovered quickly, and was 23.6% above the poverty line within 1 year after starting the program. In the first year after program participation, total income was 32.1% above the poverty line, and has remained consistently above poverty since program participation. Total income for TWS participants increased 35.0% from program start year ($17,176) to 3 years after participation ($24,159), and increased 19.8% overall from 5 years before participation ($19,363).
While those who only received EAS intervention had the highest total income before job loss, income for this group did not return to this level after intervention and recovery. At the time of job loss/intervention start year, total income dropped 7.9% ($16,455 EAS to $17,876 MBM) below the poverty line. While income for this group left poverty within 1 year of intervention, this recovery was slower than groups with more intensive program supports, with total income increasing to 21.8% above poverty 2 years after intervention ($21,781 EAS to $17,876 MBM).
Toronto
The basic cost-of-living in Toronto averaged above $21,000 from 2006 to 2016, making this the most expensive city to live in compared to Vancouver, Montreal and Halifax. In addition, the unemployment rate in Toronto was higher than the national average for 10 years (+0.8 percentage points) between 2006 and 2016. As well, the participation rate in Toronto fell 3.6 percentage points from January 2006 (68.0%) to December 2016 (65.6%). While Toronto moved from an inefficient and mismatched labour market in 2015Q2 (high supply + high demand) to a tight labour market in 2016A2 (low supply + high demand) (see Charts 45 and 46), the move was small and was partly due to an increase in the national average unemployment rate. The job vacancy rate in Toronto dropped from 3.1% in 2015Q2 to 2.8% 2016Q2. The UV ratio, the number of unemployed workers to job vacancies, in Toronto remained lower than for Canada. In 2015Q2, there were 2.8 unemployed workers per job vacancy in Toronto, and in 2016Q2 the UV ratio was 2.9.
Multiple economic and social barriers created a more challenging environment for active claimants to recover from job loss and leave poverty after participation in labour market programs. None of the groups regained their highest income levels prior to job loss within the post-program period (Chart 51).
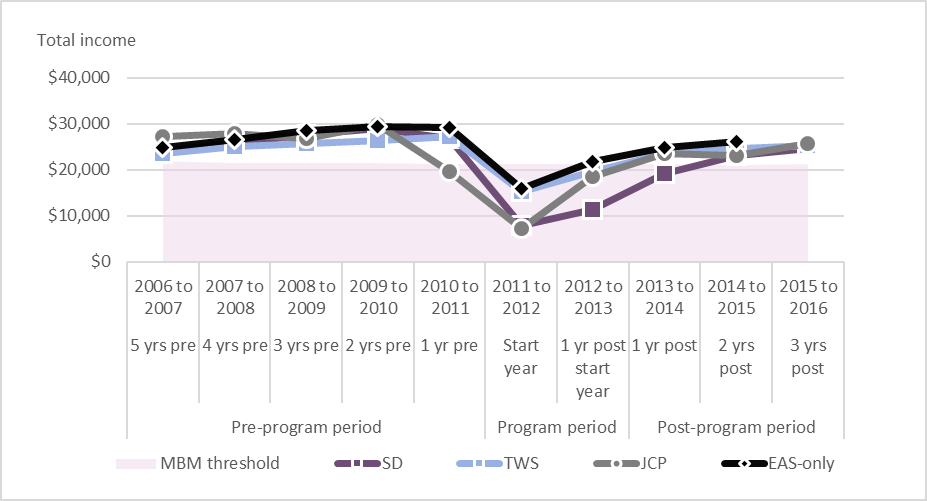
Chart 51 – Text version
| LMDA | 5 years pre (2006 to 2007) |
4 years pre (2007 to 2008) |
3 years pre (2008 to 2009) |
2 years pre (2009 to 2010) |
1 year pre (2010 to 2011) |
|---|---|---|---|---|---|
| EAS-only | $24,936 | $26,669 | $28,606 | $29,463 | $29,165 |
| JCP | $27,341 | $27,971 | $26,892 | $29,873 | $19,713 |
| SD | $24,159 | $25,761 | $27,769 | $29,008 | $26,829 |
| TWS | $23,516 | $25,153 | $25,761 | $26,408 | $27,151 |
| MBM threshold | $21,922 | $21,582 | $21,426 | $21,539 | $21,189 |
| LMDA | Start year (2011 to 2012) |
1 year post start year (2012 to 2013) |
|---|---|---|
| EAS-only | $15,915 | $21,830 |
| JCP | $7,203 | $18,502 |
| SD | $7,883 | $11,381 |
| TWS | $15,307 | $19,591 |
| MBM threshold | $21,340 | $21,306 |
| LMDA | 1 year post (2013 to 2014) |
2 years post (2014 to 2015) |
3 years post (2015 to 2016) |
|---|---|---|---|
| EAS-only | $24,867 | $26,113 | n/a |
| JCP | $23,469 | $23,198 | $25,828 |
| SD | $19,156 | $23,013 | $24,697 |
| TWS | $23,490 | $24,731 | $25,194 |
| MBM threshold | $21,156 | $21,078 | $21,184 |
Sources: Statistics Canada. Table 11-10-0066-01 Market Basket Measure (MBM) thresholds for the reference family by Market Basket Measure region, component and base year Statistics Canada, Income Statistics Division, Table 4.5, Market Basket Measure (MBM) thresholds for economic families and persons not in economic families, 2015 Dictionary Statistics Canada. Table 18-10-0005-01 Consumer Price Index, annual average, not seasonally adjusted
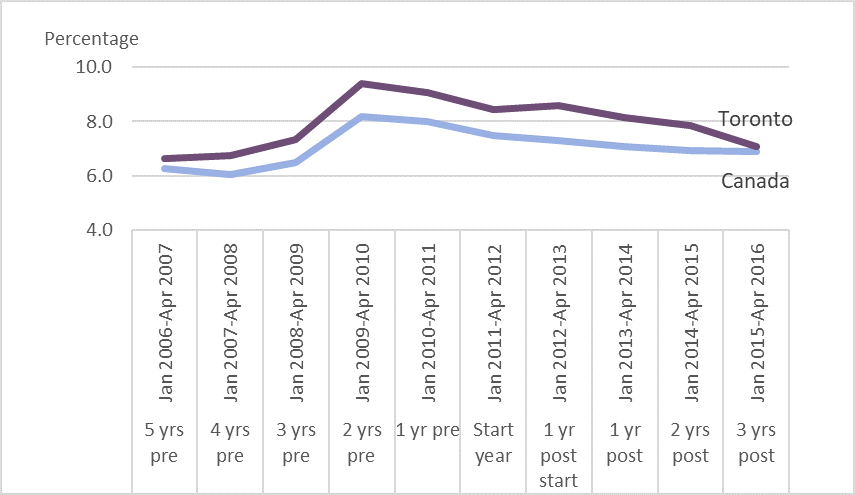
Chart 52 – Text version
| Canada/Toronto | 5 years pre (Jan 2006 to Apr 2007) |
4 years pre (Jan 2007 to Apr 2008) |
3 years pre (Jan 2008 to Apr 2009) |
2 years pre (Jan 2009 to Apr 2010) |
1 year pre (Jan 2010 to Apr 2011) |
|---|---|---|---|---|---|
| Canada | 6,3 | 6,1 | 6,5 | 8,2 | 8,0 |
| Toronto | 6,6 | 6,8 | 7,3 | 9,4 | 9,0 |
| Canada/Toronto | Start year (Jan 2011 to Apr 2012) |
1 year post start year (Jan 2012 to Apr 2013) |
|---|---|---|
| Canada | 7,5 | 7,3 |
| Toronto | 8,4 | 8,6 |
| Canada/Toronto | 1 year post (Jan 2013 to Apr 2014) |
2 years post (Jan 2014 to Apr 2015) |
3 years post (Jan 2015 to Apr 2016) |
|---|---|---|---|
| Canada | 7,1 | 6,9 | 6,9 |
| Toronto | 8,1 | 7,9 | 7,1 |
Source: Statistics Canada. Table 14-10-0294-01 Labour force characteristics by census metropolitan area, 3 month moving average, seasonally adjusted and unadjusted, last 5 months.
Total income for active EI claimants who participated in SD programs fell 63.1% below the poverty line after job loss/start year of program participation ($7,883 SD to $21,306 MBM). While income started to recover after the start year, active EI claimants did not leave poverty until 2 years after program participation, 9.2% above the poverty line ($23,013 SD to $21,078 MBM). Income for SD participants continued to rise, reaching 16.6% above poverty 3 years after participation ($24,697 SD to $21,184 MBM).
Similarly, total income for EI claimants who participated in TWS programming fell 28.3% below poverty during job loss/start of program period ($15,307 TWS to $21,340 MBM). However, income for TWS rose 11.0% out of poverty within the first year post-program ($23,490 TWS to $21,156 MBM) and remained above poverty for the 3 years after program participation. After program participation, income increased 64.6% from $15,307 (program start year) to $25,194 (3 years after participation).
Unlike the other groups, total income for active claimants in JCP programs in Toronto fell 7.0% below poverty the year before the program start year ($19,713 JCP to $21,189 MBM). During the start of the program period, income fell further to 66.2% below poverty ($7,203 JCP to $$21,340 MBM). Income started to recover after the first year post-program, rising 10.9% above poverty ($23,469 JCP to $21,156 MBM). Total income for JCP participants remained above poverty throughout the post-program period, rising 21.9% above poverty by the third year post-program ($25,828 JCP to $21,184 MBM).
As EAS-only claimants are the most job ready, active claimants in Toronto recovered the fastest after job loss. While income fell 25.4% below the poverty line after job loss/intervention start year ($15,915 EAS to $21,340 MBM), income for this group recovered to 2.5% above poverty ($21,830 EAS to $21,306 MBM) within the first year after intervention. Total income post-intervention remains above poverty, increasing to 23.9% above poverty 3 years after intervention ($26,113 EAS to $21,078 MBM).
Vancouver
While Vancouver had a high basic cost-of-living, averaging above $20,000 between 2006 and 2016, the low unemployment rate and tight job market enabled a fast recovery after job loss (see Charts 45 and 46). Between 2006 and 2016, the average unemployment rate in Vancouver was 1.1 percentage points lower than the national average (6.0% to 7.1%), and the UV rate, the number of unemployed workers to job vacancies, in the Lower Mainland‑Southwest (this includes Vancouver) remained lower than Canada in both years (2.6 to 3.0 in 2015Q2 and 2.0 to 3.6 in 2016Q2). The combination of low unemployment (scarcity of job-seeking workers) plus high job vacancies (high demand for workers) contributed to the success of active claimants after program participation and may have allowed active claimants to leverage newly acquired skills. The labour market effect was strong enough to offset the high cost-of-living, and participants surpassed their highest income level prior to job loss (Chart 53).
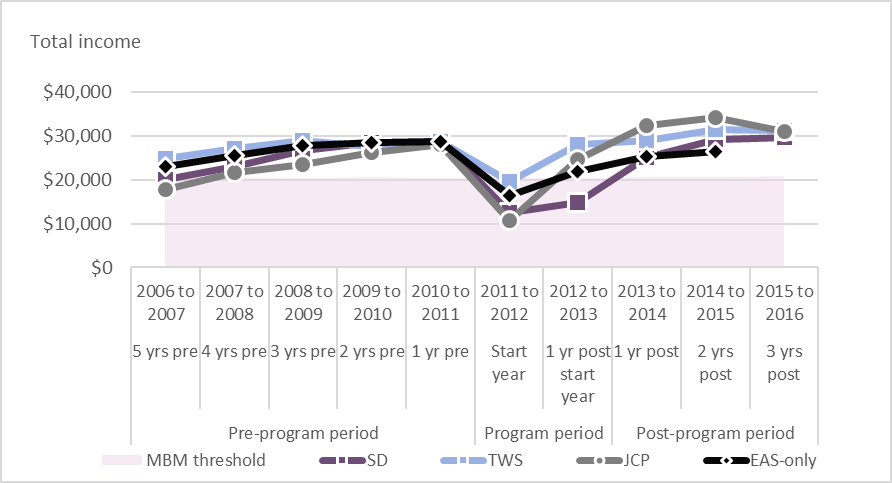
Chart 53 – Text version
| LMDA | 5 years pre (2006 to 2007) |
4 years pre (2007 to 2008) |
3 years pre (2008 to 2009) |
2 years pre (2009 to 2010) |
1 year pre (2010 to 2011) |
|---|---|---|---|---|---|
| EAS-only | $22 941 | $25 451 | $27 749 | $28 330 | $28 643 |
| JCP | $17 665 | $21 627 | $23 484 | $26 267 | $28 084 |
| SD | $19 938 | $23 018 | $26 544 | $28 372 | $28 724 |
| TWS | $24 749 | $26 995 | $28 799 | $27 521 | $28 705 |
| MBM threshold | $20 754 | $20 438 | $20 363 | $20 593 | $20 253 |
| LMDA | Start year (2011 to 2012) |
1 year post start year (2012 to 2013) |
|---|---|---|
| EAS-only | $16 359 | $21 796 |
| JCP | $10 764 | $24 568 |
| SD | $12 618 | $14 688 |
| TWS | $19 635 | $28 069 |
| MBM threshold | $20 391 | $20 434 |
| LMDA | 1 year post (2013 to 2014) |
2 years post (2014 to 2015) |
3 years post (2015 to 2016) |
|---|---|---|---|
| EAS-only | $25 222 | $26 306 | - |
| JCP | $32 347 | $34 086 | $30 859 |
| SD | $25 094 | $29 067 | $29 528 |
| TWS | $28 972 | $31 372 | $31 159 |
| MBM threshold | $20 649 | $20 675 | $20 776 |
Sources: Statistics Canada. Table 11-10-0066-01 Market Basket Measure (MBM) thresholds for the reference family by Market Basket Measure region, component and base year Statistics Canada, Income Statistics Division, Table 4.5, Market Basket Measure (MBM) thresholds for economic families and persons not in economic families, 2015 Dictionary Statistics Canada. Table 18-10-0005-01 Consumer Price Index, annual average, not seasonally adjusted
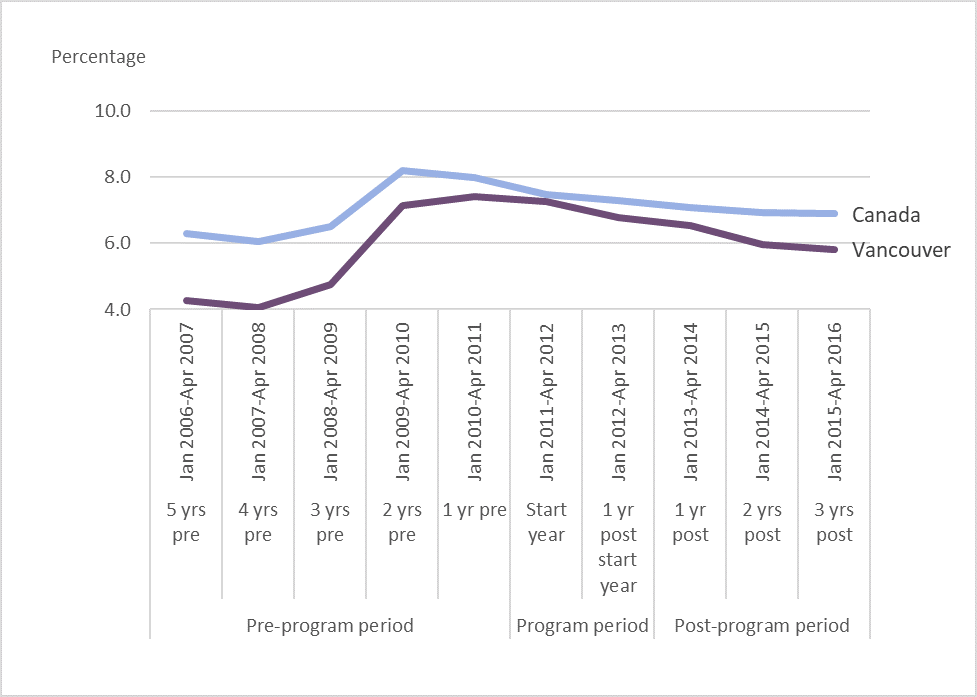
Chart 54 – Text version
| Canada/Vancouver | 5 years pre (Jan 2006 to Apr 2007) |
4 years pre (Jan 2007 to Apr 2008) |
3 years pre (Jan 2008 to Apr 2009) |
2 years pre (Jan 2009 to Apr 2010) |
1 year pre (Jan 2010 to Apr 2011) |
|---|---|---|---|---|---|
| Canada | 6,3 | 6,1 | 6,5 | 8,2 | 8,0 |
| Vancouver | 4,3 | 4,1 | 4,7 | 7,1 | 7,4 |
| Canada/Vancouver | Start year (Jan 2011 to Apr 2012) |
1 year post start year (Jan 2012 to Apr 2013) |
|---|---|---|
| Canada | 7,5 | 7,3 |
| Vancouver | 7,3 | 6,8 |
| Canada/Vancouver | 1 year post (Jan 2013 to Apr 2014) |
2 years post (Jan 2014 to Apr 2015) |
3 years post (Jan 2015 to Apr 2016) |
|---|---|---|---|
| Canada | 7,1 | 6,9 | 6,9 |
| Vancouver | 6,5 | 5,9 | 5,8 |
Source: Statistics Canada. Table 14-10-0294-01 Labour force characteristics by census metropolitan area, 3 month moving average, seasonally adjusted and unadjusted, last 5 months.
While total income for active claimants who participated in SD programs remained in poverty longer during the program period, this may be accounted for by the longer duration of SD programs. Total income fell 38.1% below the poverty line during the time of job loss/start of program period ($12,618 SD to $20,391 MBM), but rose 21.5% above poverty in the first year after program participation ($25,094 SD to $20,649 MBM). Total income climbed to 42.1% above poverty 3 years after program participation ($29,528 SD to $20,776 MBM), higher than the pre-program income level.
Total income for active claimants in TWS programs fell 3.7% below the poverty line during the start year of the program period ($19,635 TWS to $20,391 MBM). However, income recovered quickly, rising 37.4% above the poverty line within 1 year after starting the program ($28,069 TWS to $20,434 MBM). Three years after program participation, total income surpassed the highest pre-program levels, with total income reaching $31,159 (50.0% above the poverty line).
Total income for active claimants who participated in JCP programs also left poverty within the program period within one year after the start of the program. Income rose from $10,764 (47.2% below the poverty line) during the start year to $24,568 (20.2% above the poverty line), 1 year post-start. Total income continued to rise above poverty following program participation, where income 2 years after participation ($34,086) exceeded the highest income level before job loss.
While total income for active claimants who only received EAS interventions in Vancouver recovered and left poverty quickly, the post-intervention income level never regained the highest income level prior to job loss. At the start of the intervention period, income for EAS-only participants dropped 19.8% below the poverty line ($16,359 EAS-only to $20,391 MBM). In the first 5 after intervention, total income rose 6.7% above poverty ($21,796 EAS-only to $20,434 MBM) and remained 27.2% above poverty 3 years following intervention ($26,306 EAS-only to $20,675 MBM).
Conclusion
LMDAs help active claimants recover from job loss, leave poverty, and in some cases, surpass their highest income level prior to participation. Labour market programs not only provide the tools for participants to transition back into employment, they help buffer against socio‑economic obstacles, such as slack labour markets and high costs-of-living.
Successful transitions out of poverty are the result of a combination of factors, such as the program stream, the degree of intensity in the program and outside factors such as a low cost-of-living and available labour market opportunities. While it is clear that regions with relatively more opportunities and fewer barriers provide greater success after program participation, there is evidence that LMDA‑funded programs act as a buffer against economic challenges. The recovery speed of participants returning to employment, and regaining (in some cases surpassing) previous income levels in regions with difficult economic climates, shows that LMDAs provide the tools to return to work and protect against socio-economic challenges.
References
Abraham, K. G., & Haltiwanger, J. C. (2019, May). How Tight is the Labor Market. Retrieved January 24, 2020, from https://www.chicagofed.org/~/media/others/events/2019/monetary-policy-conference/how-tight-labor-market-abraham-haltiwanger-pdf
Claveau, G., and Employment and Social Development Canada. (2020, January 22). Labour Market Conditions in Canada, Quarterly Review. pp. 6 - 10.
Federal Reserve Bank of St. Louis. (2016, May 31). How Tight Is the Labor Market? Retrieved January 23, 2020, from https://www.stlouisfed.org/on-the-economy/2015/november/how-tight-labor-market
Heisz, A., and Statistics Canada (2019, July 18). An update on the Market Basket Measure comprehensive review. Retrieved October 18, 2019, from https://www150.statcan.gc.ca/n1/pub/75f0002m/75f0002m2019009-eng.htm.
Employment and Social Development Canada. (2017). 2016/2017 Employment Insurance Monitoring and Assessment Report (pp. 247 - 263). Retrieved from https://www.canada.ca/en/employment-social-development/programs/ei/ei-list/reports/monitoring2017.html
Employment and Social Development Canada. (2018). Opportunity for All - Canada's First Poverty Reduction Strategy. Retrieved from https://www.canada.ca/en/employment-social-development/programs/poverty-reduction/reports/strategy.html
Employment and Social Development Canada. (2019, August 21). Canada's Poverty Reduction Strategy - An Update. Retrieved November 11, 2019, from https://www.canada.ca/en/employment-social-development/programs/results/poverty-reduction.html
Government of New Brunswick (2009). Calculating Your Wage Gap. Retrieved from: http://www.gnb.ca/0012/womens-issues/wg-es/tools/pdf/wg_calc-e.pdf
Hatfield, Michael, Wendy Pyper and Burton Gustajtis, Government of Canada (2010). First Comprehensive Review of the Market Basket Measure of Low Income, Human Resources and Skills Development Canada (Catalogue no.: HS28-178/2010E-PDF).
Income Statistics Division, Statistics Canada (2010). Revising Statistic's Canada Low Income Measure (LIM) (Catalogue no. 75F0002M — No. 004), pp. 6. Retrieved from: www.statcan.gc.ca/pub/75f0002m/75f0002m2010004-eng.pdf
Income Statistics Division, Statistics Canada (2015). Low Income Lines, 2013 - 2014: Update (Catalogue no. 75F0002M - No. 002), pp. 6-8. Retrieved from: http://statcan.gc.ca/pub/75f0002m/75f0002m2015002-eng.htm
Income Statistics Division, Statistics Canada (2017). Table 4.1 Summary of low income lines in the 2016 Census of Population Program. Retrieved from: http://www12.statcan.gc.ca/census-recensement/2016/ref/dict/tab/t4_1-eng.cfm
Murphy, Brian, Xuelin Zhang and Claude Dionne (2012). Low Income in Canada: a Multi-line and Multi‑index Perspective. Statistics Canada. Retrieved from: www.statcan.gc.ca.
OECD (2019), Financial Incentives to Promote Adult Learning in Australia, Getting Skills Right, OECD Publishing, Paris, https://doi.org/10.1787/c79badcc-en. P. 8.
Samir, D., B. Gustajtis, A. Heisz, K. Lam and S. McDermott (2019, December 20). Defining disposable income in the Market Basket Measure. Retrieved from https://www150.statcan.gc.ca/n1/pub/75f0002m/75f0002m2019014-eng.htm
Simcoe Muskoka District Health Unit. (2019). Market Basket Measure (MBM). Retrieved November 27, 2019, from http://www.simcoemuskokahealthstats.org/topics/determinants-of-health/socioeconomic-characteristics/income/market-basket-measure-(mbm)
Statistics Canada. (2015, November 27). Section 3: Terms and definitions. Retrieved January 31, 2020, from https://www150.statcan.gc.ca/n1/pub/72-210-g/2013001/part-partie3-eng.htm
Statistics Canada (July 12, 2018). Guide to the Job Vacancy and Wage Survey, 2018. Retrieved from https://www150.statcan.gc.ca/n1/en/pub/75-514-g/75-514-g2018001-eng.pdf?st=Rh2f0A9f
Statistics Canada. (2019, January 3). Dictionary, Census of Population, 2016 Table 4.5 Market Basket Measure (MBM) thresholds for economic families and persons not in economic families. Retrieved October 24, 2019, from https://www12.statcan.gc.ca/census-recensement/2016/ref/dict/tab/t4_5-eng.cfm
Statistics Canada. (2019). Methodological changes to the Market Basket Measure in 2019. Income Research Paper Series, pp. 3-7. Catalogue no. 75F0002M, ISSN 1707-2840, ISBN 978-0-660-29620-3.
Statistics Canada. (2019, December 16). Job Vacancy and Wage Survey (JVWS). https://www23.statcan.gc.ca/imdb/p2SV.pl?Function=getSurvey&SDDS=5217
Statistics Canada Prices Division. (1996). Your Guide to the Consumer Price Index, pp 7-8. Catalogue No. 62-557-XPB. ISBN 0-660-59250-9.
Statistics Canada. Table 11-10-0232-01 Low income measure (LIM) thresholds by income source and household size. Retrieved from https://www150.statcan.gc.ca/t1/tbl1/en/tv.action?pid=1110023201. DOI: https://doi.org/10.25318/1110023201-eng.
Statistics Canada. Table 11-10-0066-01 Market Basket Measure (MBM) thresholds for the reference family by Market Basket Measure region, component and base year. Retrieved from https://www150.statcan.gc.ca/t1/tbl1/en/tv.action?pid=1110006601.DOI: https://doi.org/10.25318/1110006601-eng
Statistics Canada. Table 14-10-0063-01 Employee wages by industry, monthly, unadjusted for seasonality. Retrieved from https://www150.statcan.gc.ca/t1/tbl1/en/tv.action?pid=1410006301. DOI: https://doi.org/10.25318/1410006301-eng
Statistics Canada. Table 14-10-0325-01 Job vacancies, payroll employees, job vacancy rate, and average offered hourly wage by provinces and territories, quarterly, unadjusted for seasonality. DOI: https://doi.org/10.25318/1410032501-eng
Statistics Canada. Table 14-10-0340-01 Employee wages by occupation, annual. Retrieved from https://www150.statcan.gc.ca/t1/tbl1/en/tv.action?pid=1410034001. DOI: https://doi.org/10.25318/1410034001-eng
Statistics Canada. Table 18-10-0005-01 Consumer Price Index, annual average, not seasonally adjusted. Retrieved from https://www150.statcan.gc.ca/t1/tbl1/en/tv.action?pid=1810000501. DOI: https://doi.org/10.25318/1810000501-eng
Statistics Netherlands. (2012, March 6). The labour market tension meter. Retrieved February 3, 2020, from https://www.cbs.nl/en-gb/background/2012/07/the-labour-market-tension-meter
Statistics NZ (2018). Organisational gender pay gaps: Measurement and analysis guidelines. Retrieved from www.stats.govt.nz. (P. 11). ISBN 978-1-98-858300-6
Workplace Gender Equality Agency, Australian Government (2019, August 15). Australia's gender pay gap statistics. Retrieved from: https://www.wgea.gov.au/sites/default/files/gender-pay-gap-statistics.pdf
3.4 Pan-Canadian activities and the National Employment Service
In this section
- 3.4.1 Context
- 3.4.2 Indigenous programming
- 3.4.3 Enhancing investments in workplace skills and labour market information
- 3.4.4 Supporting agreements with provinces, territories and Indigenous organizations
This section analyzes pan-Canadian activities that ESDC supports and delivers using EI Part II funds.
3.4.1 Context
The Government of Canada plays a leadership role in EI Part II by establishing objectives with provinces and territories through the LMDAs that develop active labour market policies and ensure accountability and evaluation of LMDA programming. In addition, the federal government plays a primary role in responding to challenges that extend beyond local and regional labour markets by delivering pan-Canadian activities.
Pan-Canadian activities fulfill three primary objectives:
- promoting an efficient and integrated national labour market and preserving and enhancing the Canadian economic union
- helping address common labour market challenges and priorities of international or national scope that transcend provincial and territorial borders, and
- promoting equality of opportunity for all Canadians with a focus on helping underrepresented groups reach their full potential in the Canadian labour market
Pan-Canadian funding is focused on 3 streams of investment:
- Indigenous programming
- enhancing investments in workplace skills and labour market information, and
- supporting agreements with provinces, territories and Indigenous organizations
In FY1819, expenditures on pan-Canadian activities totalled $139.0 million, up 15.6% from FY1718. Pan-Canadian programming delivered through the Aboriginal Skills and Employment Training Strategy (ASETS) increased by 11.8% to $112.9 million, while expenditures on Labour Market Partnerships (LMP) ($22.5 million) increased by 62% and Research and Innovation (R&I) ($3.7 million) declined by 32.0% year-over-year.
3.4.2 Indigenous programmingFootnote 37
Pan-Canadian funding delivered through the Aboriginal Skills and Employment Training Strategy (ASETS) is intended to increase Indigenous peoples' participation in the Canadian labour market, ensuring that First Nations, Inuit and Métis people have access to skills development training and employment supports towards sustainable and meaningful employment. It also supports the development of a skilled Indigenous labour force, which is 1 of the objectives of the Federal Framework for Aboriginal Economic Development.
Pan-Canadian programming in action: Stó:Lō Aboriginal Skills and Employment Training (SASET)
SASET provides access to employment counselling, training, and services to Indigenous clients in British Columbia, from Surrey to Boston Bar and in the communities of Samaquam, Skatin, and Xa'xtsa First Nation. SASET delivers full-time services on-site at Stó:Lō Nation, and part-time services in more than 20 outreach sites. SASET provides quality programming to move clients along the employability continuum. SASET also works closely with other Indigenous labour market service providers such as the Urban agreement holder, Aboriginal Community Career Employment Services Society, and Métis Nation British Columbia.
SASET funds employment support services such as:
- individualized workplans to develop their essential skills for success in training and employment
- identifying barriers to employment and assistance in creating an action plan to overcome barriers to attain employment
- career exploration and decision making
- employability skills development
- job search, resume/cover letter and interview skills
- applying for short- and long-term training
- accessing SASET Vocational funds and transition to work supports
- job-specific training
- employer-targeted interventions
In FY1819, SASET's total success rate was 88%. Among the 1,441 clients served, 814 obtained a job and 464 returned to school. Since the launch of ASETS, SASET has served over 8,118 clients, of which 5,961 obtained a job and more than 2,758 returned to school.
*These numbers were pulled from the ASETS website on October 3rd, 2019.
ASETS was introduced in 2010 and extended to March 31, 2019, funded at $372.68 million for -FY1819, including $113.53 million from EI Part II funds. ASETS funds a network of 85 Indigenous contribution recipients with over 600 points of service across Canada. Indigenous organizations design and deliver labour market programming to meet the needs identified in their communities, in large part by working with employers and Indigenous individuals to ensure skills development and job training responds to local labour demands. This network assists Indigenous peoples to prepare for, find, and retain jobs. In addition, through ASETS funding, Indigenous youth are helped to make a successful transition from school to work or to return to school. ASETS emphasizes increased accountability and improved results for its related activities.
The Indigenous Skills and Employment Training (ISET) Program replaced ASETS on April 1, 2019, with new investments and longer term, more flexible agreements. The ISET Program's objective is to help reduce the skills and employment gaps between Indigenous and non-Indigenous peoples over 10 years. Co-developed with Indigenous partners, the ISET Program includes four distinct labour market strategies with separate funding envelopes for each group: First Nations, Inuit, Métis and Urban/Non-affiliated Indigenous peoples. With Indigenous partners, the Government is advancing reconciliation by creating more job training opportunities for Indigenous peoples.
In FY1819, ASETS served 48,581 clients, including 18,746 EI clients. Out of the total number of clients served, 19,197 found a job, including 9,150 EI clients, and a total of 9,820 clients served returned to school.
3.4.3 Enhancing investments in workplace skills and labour market information
This investment stream helps the federal government ensure that Canada's labour market functions as an integrated national system by:
- removing barriers and impediments to labour mobility
- building capacity among workplace partners to improve skills development as a key factor in increasing productivity
- leveraging investment in, and ownership of, skills issues, especially in addressing skills and labour shortages, as well as
- supporting efforts to ensure Canada's learning system responds to employers' skills requirements
Sectoral Initiatives Program (SIP)
The objective of the Sectoral Initiatives Program (SIP) is to help key sectors of the Canadian economy identify, forecast and address their human resources and skills issues.
The Program supports sectors and employers to address current and future skills shortages through the development and distribution of sector-specific labour market intelligence, national occupational standards, and skills certification and accreditation systems. The Program also supports innovative workforce development approaches, including those targeting under-represented groups.
SIP's key stakeholders are primarily partnership-based organizations engaged in skills and workforce development in their respective economic sectors or employment groups across Canada. These include:
- employer consortia and Sector Councils
- workplace organizations
- industry associations
- unions
- education and training bodies
- professional associations, and
- Indigenous organizations
In FY1819, the SIP was supporting 41 active projects in 18 different economic sectors.
During the FY1819, projects funded by the program produced:
- 172 labour market intelligence reports and 14 forecasting systems
- 76 national occupational standards (NOS)
- 5 certification systems
- 3 accreditation programs
- 56 curricula or training programs, and
- 1 pilot project report
In FY1819, SIP funded 41 multi-year agreements for projects implemented by various stakeholders representing different industry sectors. Products included: labour market information and/or forecasting systems (66% of projects); NOS (27%); certification and accreditation (2%); and creative labour market solutions (5%) producing curricula or training programs and labour market solution pilot project reports. Among them, several projects were cross-sectoral or focused on the construction, environment, tourism, mining, transportation, oil and gas, manufacturing, agriculture, aerospace and information technology sectors.
According to program data on FY1819 product users, 51% of respondents reported that SIP products were used by more than 135,939 users, which include LMI newsletter subscribers but not social media subscribers. The number of users is likely higher as LMI products are shared with members of other organizations who are stakeholders of program recipients.
Furthermore, in FY1819, the program recipients succeeded in leveraging $4.8 million or about 23% of program expenditures from the private sector and other stakeholders.
SIP achieved or progressed towards its priorities by:
- developing sectoral expertise and building intelligence on existing and additional strategic sectors experiencing labour market tightness
- engaging industry on emerging skills gaps in order to exchange information and serve as a platform for Government‑Industry/Employer Collaboration in support of key Government of Canada sectoral strategies and programs (for example, Digital Economy Strategy, Green Jobs, Tourism Vision). SIP's industry partners are also serving as delivery partners for Canada's Youth Employment and Skills Strategy internship program
- supporting a pilot project under the Employer Liaison Services activity area to help employers better connect with EI claimants and under-represented groups in order to solve mismatches and shortages at both ends of the skills spectrum
- collecting data on available outputs and outcomes from FY1718
- responding to the evaluation published in August 2018 and consulting recipients regarding options to improve the program's performance measurement system
- exploring possible future directions for program design to allow the program to continue to improve and evolve in response to changing labour market conditions and priorities
- increasing efforts in disseminating sectoral labour market intelligence and other products (NOS, certification, accreditation) to improve awareness and use among external and internal stakeholders, as well as to increase application and integration of SIP-funded products into programs and activities
National Essential Skills Initiative
The National Essential Skills Initiative (NESI) helps Canadians improve their essential skills so that they can better prepare for, get and keep jobs, as well as adapt and succeed at work. This is aligned with the Government of Canada's overarching goal of helping Canadians develop the skills they need for good quality jobs.
NESI provides catalytic funding for projects that develop and expand literacy and essential skills training. Projects focus on testing, replicating and scaling up proven approaches to skills upgrading, as well as improving the quality of employment and training supports that are responsive to job seekers', workers' and employers' needs. Particular emphasis is placed on supporting individuals with low skills and facing multiple barriers to employment such as Indigenous peoples, newcomers, youth, and official language minority communities (OLMCs).
In FY1415, the program was reoriented to focus efforts on the integration of literacy and essential skills into employment and training supports. The Office of Literacy and Essential Skills continues to work closely with labour market programs, other government departments and agencies, provincial and territorial governments and other key stakeholders, such as post-secondary institutions, employers and labour organizations to provide broader public access to quality employment training.
The program reorientation led to an open call for proposals to solicit projects that develop and evaluate innovative training models for measuring essential skills and psychosocial gains. Multi-year projects began in Fall 2017 and NESI funds continued to be fully expended into the FY1819 and beyond.
Preliminary data from NESI projects have already revealed positive results. For example, in one project, participants showed improvements in reading, document use and numeracy by 16%, 34%, 41%, respectively. In another, 74% of participants demonstrated high levels of resilience and improvements in self-efficacy in goal-setting activities.
NESI funding also supported the Government of Canada's Budget 2018 commitment to provide immediate income support and training to affected workers in seasonal industries who exhausted their Employment Insurance benefits. The program helped Canadians get access to the essential skills training and employment supports they needed (including career counselling, workplace essential skills, and income support while on training) until they returned to work.
In addition, NESI analysts contributed to the development of an Essential Skills playbook of past and present projects that highlight promising practices and lessons learned. The evergreen playbook will be released in 2019-2020 and will be shared widely among Essential Skills development practitioners.
Moving forward, the NESI program will continue to play an active role in piloting innovation for the Government. For example, in partnership with the Privy Council Office's Impact Canada Initiative, NESI funding will support the implementation of a Numeracy Challenge Prize. The Challenge Prize will incentivize applicants to develop innovative and creative approaches for improving the numeracy skills of low-skilled Canadians. It is anticipated that the Initiative will be launched in 2020.
Skilled trades and apprenticeship and Red Seal Program
Apprenticeships are essential to building a highly skilled trades workforce that supports Canadian competitiveness. The Interprovincial Standards Red Seal Program sets common standards for assessing the skills of tradespeople across Canada and provides a vehicle to promote harmonization across the country.
2018 Red Seal Program fast facts
- More than 28,000 Red Seal endorsements were issued to apprenticeship completers and trade qualifiers
- Top 5 Red Seal trades by number of endorsements issued include: construction electrician, automotive service technician, plumber, truck and transport mechanic, and carpenter
- approximately 170 subject matter experts have participated in ESDC organized workshops to develop Red Seal products
- over 300 industry representatives and training providers have participated in meetings and national webinars to harmonize apprenticeship training
- more than 48,000 Red Seal examinations were written
- the Red Seal Program's website counted approximately 473,880 visitors
Source: Canadian Council of Directors of Apprenticeship, Red Seal Program administrative data 2018. Statistics are compiled on a calendar year basis.
The program is well established at developing common interprovincial standards used to harmonize apprenticeship training in provinces and territories, to provide the public with up-to-date descriptions of trades in Canada, and to serve as the basis for assessment. Under this program, experienced tradespeople and apprentices who have completed their training may take the interprovincial Red Seal examination. If successful, they receive a Red Seal endorsement on their provincial or territorial certificate of qualification, indicating they have met both the provincial/territorial requirements and have demonstrated the knowledge required for the national standard in that trade. In most provinces and territories, the Red Seal examination has been adopted as the final examination for certification for Red Seal trades.
The Red Seal endorsement is a nationally recognized standard for skilled trades workers in Canada. In 2018, 48,577 Red Seal examinations were written by completing apprentices and experienced tradespeople from across Canada and 28,749 Red Seals were issued.
The Canadian Council of Directors of Apprenticeship (CCDA) is responsible for the Red Seal Program. All provinces and territories and the federal government participate as members of the CCDA. ESDC sponsors a Red Seal Secretariat to provide strategic and secretariat support to the CCDA and the Red Seal Program.
The Red Seal Program currently covers 56 skilled trades, encompassing 79% of registered apprentices.Footnote 38 ESDC works closely with industry experts and apprenticeship authorities to coordinate the development of high-quality Red Seal products, including occupational standards and interprovincial examinations. These products are updated regularly to reflect evolving labour market needs. Because each province and territory needs standards and examinations to certify thousands of apprentices and experienced tradespersons each year, the collaboration involved in developing interprovincial Red Seal standards and examinations results in significant economies of scale for governments.
The core of the Red Seal Program lies in quality interprovincial standards for industry, against which tradespeople can be trained and assessed. With ESDC support, the CCDA collaborates to build these standards with industry from across Canada. The program also encourages the harmonization of apprenticeship training outcomes through common standards, which provinces and territories use to develop their respective in-school portion of apprenticeship training.
The Red Seal Program continuously evolves to reflect the needs of the Canadian labour market and Government of Canada priorities. In recent years, the Red Seal standards and their associated development processes have undergone significant enhancements. Where appropriate, the standards are now being developed as Red Seal Occupational Standards (RSOS), with broader input from stakeholders (including tradespeople, instructors and employers) and include industry-defined performance expectations, evidence of skills attainment, learning objectives and outcomes, as well as essential skills to encourage greater harmonized training and certification across the country. The RSOS has the capacity to generate several products that are geared to users' needs such as assessment, training and career information.
Because of the additional stakeholder engagement and enhanced content, fewer trades undergo a complete revision of their standards each year. In FY1819, 5 new occupational standards were completed. In this period, there were 28 Red Seal examinations released for seven trades. As more trades' standards become developed in the new format, however, their subsequent revisions will be made more efficiently, allowing for more standards' updates per year.
To further reduce barriers to certification in the skilled trades in Canada and increase opportunities for apprentices, the Government of Canada continues to work closely with provinces and territories and industry through the CCDA to facilitate the harmonization of apprenticeship training requirements in targeted Red Seal trades. Harmonization will facilitate greater labour mobility across the country and help more apprentices complete their training. In October 2016, the Forum of Labour Market Ministers (FLMM) reaffirmed its commitment to harmonize 30 Red Seal trades, representing approximately 90% of apprentices (outside of Quebec) by 2020Footnote 39 ,Footnote 40 ,Footnote 41 . Consensus was reached among provinces and territories for the 30 Red Seal trades over a year ahead of the FLMM's target.
The effectiveness of achieving consensus between industry stakeholders on harmonized training across Canada has been greatly enhanced by aligning the process with the development of the RSOS. Since the standards development process brings together the same key stakeholders that are involved in apprenticeship training development, they are able to share best practices, and provide a rationale for creating the best possible training for apprentices across Canada. This aligned process also ensures long-term sustainability of harmonized training, while keeping training content as up-to-date as the standard.
Innovation and Employer Engagement Initiative fund
ESDC also continues to work with provinces and territories to increase employer engagement in apprenticeship. In October 2016, the FLMM committed to explore innovative approaches to increase employer engagement for improved job opportunities and outcomes for apprentices. In support of this commitment, ESDC established the Innovation and Employer Engagement Initiative to fund innovative supports and increase employer engagement in apprenticeship (for example, help employers to create inclusive workplaces and provide support for employer consortia pilots).
In 2017, 3 provinces (Manitoba, British Columbia and Nova Scotia) came forward with proposals to pilot employer consortia models to help reduce non-financial barriers for employers. Each pilot targets different trades, groups (for example, women and Indigenous peoples), and incorporates various supports (for example, mentorship). Canadian Manufacturers and Exporters (CME) was engaged to manage and evaluate these pilots. This will help ensure that provincial efforts are coordinated and the effectiveness of pilots is appropriately assessed in order to promote the replication of promising approaches to new regions or sectors. The CME projects were launched in 2018 to 2019 and are underway.
In addition, an employer consortia project was proposed by the Ontario Electrical League (OEL), which involves 20 employers. This project started in 2018 to 2019 and is underway. The province of Prince Edward Island (PEI) also came forward with a proposal for a blended learning approach to apprenticeship training. This project aims to help apprentices continue working while completing technical training. This project started in 2017 to 2018 and ended in 2018 to 2019.
Flexibility and innovation in apprenticeship technical training
The Government of Canada also invested to expand the use of innovative approaches for apprentice technical training through the Flexibility and Innovation in Apprenticeship Technical Training (FIATT) Pilot. The pilot consisted of 10 training institutions located across Canada that tested alternative delivery approaches to apprenticeship technical training such as e-learning, blended learning, in-class simulation and technical learning in workplaces and other locations apart from the traditional classroom. The pilot gathered evidence on whether these projects can improve access to apprenticeship training, raise the level of employer engagement in apprenticeship training, improve apprenticeship completion rates and increase the overall efficiency of apprenticeship training systems. The Canadian Apprenticeship Forum produced a final report that included pilot findings and recommendations for alternate delivery that will be shared with apprenticeship stakeholders and policymakers. The report noted that the majority of pilots lessened financial hardship and personal stress for apprentices by reducing the number of weeks away from home and the number of hours away from work. Alternative delivery options, by offering flexibility and accessibility, did encourage apprentices to complete additional levels of training. The pilot ended in FY1819.
Research Project “The Registered Apprenticeship Information System (RAIS)”
The Registered Apprenticeship Information System (RAIS) is an annual mandatory survey conducted by Statistics Canada. The survey compiles data from provinces and territories on the number of registered apprentices taking in-class and on-the-job training in trades that are either Red Seal or non-Red Seal.
The latest 2017 RAIS results showed that there were 333,750 continuing apprentices, 79% of which were in Red Seal trades. There were 71,994 new registrations, 79% of which were in Red Seal trades. There were 39,477 apprenticeship completions, 80% of which were in Red Seal trades.
Beginning in 2016, Statistics Canada and ESDC undertook a review of the wording, data elements, and documentation of the RAIS to strengthen and improve data consistency across jurisdictions and enhance the reliability of its data. Results and recommendations informing an action plan were completed in March 2017. Statistics Canada and ESDC are currently working with jurisdictions to finalize an implementation strategy.
ESDC and Statistics Canada successfully completed the RAIS Longitudinal Pilot project in March 2017. The purpose of the study was to explore the potential of linking RAIS data with other data sources (for example, taxation). The pilot involved Alberta, New Brunswick and Nova Scotia, and was designed to produce statistics on apprenticeship pathways, earnings, and mobility. The project has since been expanded to all jurisdictions.
The RAIS is part of the new Education and Labour Market Longitudinal Platform (ELMLP), announced in Budget 2018 with an investment of $5.5 million per year ongoing starting in FY1819. The Platform will provide up-to-date labour market information Canadians need to make informed career decisions. The core foundation systems linked to the Platform are the RAIS, the Post-Secondary Information System, and Canada Revenue Agency's T1 Family File.
National Apprenticeship Survey (NAS)
The National Apprenticeship Survey (NAS), conducted by Statistics Canada on behalf of ESDC, is Canada's most comprehensive source of data on the experience of apprenticeship, collected from apprentices.
Funded by ESDC with an investment of $6.8 million, the 2015 NAS Canada Overview Report was released in March 2017. The survey presents an overall positive picture of apprenticeship. For example, apprentices who complete their programs have better outcomes - they are more likely to be employed, to hold a permanent job, and to have higher earnings. About 9 in 10 apprentices see apprenticeship as the best way to learn a trade. Approximately 60% of apprentices were aware of the Apprenticeship Grants, and more than half of apprentices applied for EI benefits while on technical training.
In October 2018, ESDC released more focused reports from the 2015 NAS data: “Profile of Indigenous, Women, and Immigrant Apprentices” and “Analysis of Financial Supports available to Canadian apprentices.”
Atlantic Apprenticeship Harmonization Project (AAHP)
The Atlantic Apprenticeship Harmonization Project (AAHP) with this second phase allowed to standardize the requirements for apprentices in 6 trades across Atlantic Canada. The Atlantic provinces are now better positioned to meet the labour demands of business through the improved mobility of apprentices by continuing to harmonize trades in the Atlantic region. Building on the success of the harmonization of the initial 10 trades in the first phase of the AAHP, the Council of Atlantic Premiers now have harmonized a total of 16 trades.
This initiative also supports the Government of Canada and the governments of the 4 Atlantic provinces' Atlantic Growth Strategy. Immigration and a skilled workforce are the first priority area of that strategy. This project started in 2017 and is now complete.
Saskatchewan Apprenticeship and Trade Certification Commission (SATCC)
The SATCC is updating its current information management system in Saskatchewan which is obsolete, inefficient and lacks client-facing capacity. This project will also enable the SATCC to join the information technology platform that the initial 5 partner provinces (Nova Scotia, Newfoundland and Labrador, Prince Edward Island, New Brunswick and Manitoba) developed.
SATCC will be better positioned to support the apprenticeship system in Saskatchewan through increased labour market mobility, as the shared information technology system will allow for the seamless transfer of client information between partnering jurisdictions, facilitating movement of apprentices across the provinces. This is particularly important for mobility between Manitoba and Saskatchewan, both of whom are partners in the New West Partnership.
The adoption of a shared information technology system will extend the same advanced functionality enjoyed by Atlantic Canada and Manitoba to Saskatchewan's apprenticeship authorities, training providers, employers and apprentices, as well as provide enhanced reporting capabilities for the provincial apprenticeship authorities.
Labour Market Information
Labour Market Information (LMI) remains an integral component of the Government of Canada's economic agenda. In the 2016 Federal Budget, the Government of Canada reiterated the importance of LMI by committing to provide access to timely, reliable, and comprehensive LMI to all Canadians to make informed decisions.
LMI in Canada includes any information, qualitative or quantitative that pertains to the enhancement of the economy through labour market development. More precisely, LMI can include relevant information on the supply and demand of the various types of labour services (employment), including information on wages and other forms of compensation, as well as detailed and aggregate-level information about work trends and the skills, experience, education and training Canadians will need for jobs today, and in the future.
National Occupational Classification (NOC)
ESDC's LMI portfolio includes the administration of the National Occupational Classification (NOC), the national framework for collecting, analyzing and disseminating occupational data in Canada in support of employment‑related programming.
The NOC describes job titles, functions, tasks and duties, employment requirements, responsibilities and qualifications. The current version of the NOC gathers more than 35,000 job titles into 500 Unit Groups (groups of occupations that have similar main duties, employment requirements, skill levels and skill types).
Labour market surveys, research, analysis and reports are usually based on the NOC. Employment-based programming, such as EI, the Temporary Foreign Worker Program, and programming for the integration of injured workers and persons with disabilities rely on NOC-based information to analyze labour market conditions for strategic considerations, as well as for policy development, program design and service delivery. Other LMI-based products, such as wages, outlooks, forecasts and career tools enable job seekers to connect with employers seeking workers, students to make informed educational and career choices, and governments and other organizations to design and deliver programming in support of an efficient labour market.
In order to increase the NOC's accuracy and relevance, ESDC, in collaboration with Statistics Canada, agreed to revise the NOC on a more frequent basis. Changes published in November 2017 and November 2018 included the addition of new job titles related to the Cannabis industry. During this time, the program also conducted consultations and research for the next structural revision of the classification, which will be published in 2021. Upwards of 100 submissions from industry associations, unions, academia, provincial and territorial governments, and other stakeholders have been received, to inform this process.
Regional and labour market analysts develop and deliver regular LMI based on the NOC. These products and services, such as wages and wage analyses, job vacancies, employment outlooks and economic forecasts are made available to all Canadians on the Job Bank website. These help match students, immigrants, current and future job seekers to available and potential job opportunities, and provide access to LMI, facilitating the exploration of educational and training choices and career decisions.
The development of a new dynamic IT infrastructure to facilitate the collection and analysis of input from NOC users, and to enable more frequent dissemination of updates to the classification, was substantially completed in FY1819. The NOC Modernization project is a technology solution that features a Collaborative Workspace where stakeholders can share ideas and contribute to ongoing research and validation efforts regarding information found within the classification. A new customizable web interface will allow users to identify, filter, compare and export NOC and related data, and to follow intuitive links to other LMI. Finally, the project will allow more than 20 government programs to download recent versions and benefit from enhanced system interconnectivity.
National Work Plan
ESDC implements a National Work Plan for LMI services in support of the National Employment Service. ESDC is responsible for determining the employment outlooks and wages for detailed occupations at the NOC 4-digit level (500 occupations), at the provincial, territorial and economic region levels, where data permits. ESDC updated wages in October 2018 and disseminated employment outlooks on the Job Bank website in January 2019.
Job vacancies information, weekly Labour Market News, monthly, quarterly and annual Labour Market Bulletins, Sectoral Outlooks, as well as annual and/or semi-annual Environmental Scans, were also made available on the Job Bank website for all regions of the country, along with the education and skill requirements for in-demand occupations, to support a more informed, skilled, competitive and mobile Canadian labour force. In addition, ESDC developed a beta interactive tool, LMI Explore, which was released on Job Bank on July 24, 2018. The tool provides an alternative way to access LMI.
Support for the Labour Market Information Council (LMIC)
In FY1819, ESDC worked alongside Statistics Canada and provincial/territorial governments to support the LMIC on an array of key LMI projects, including:
- qualitative research on the needs of individual LMI users
- understanding the LMI needs of employers through job posting analysis
- addressing calls for more local, granular LMI, through “small area estimation” research efforts, and
- a project studying education and employment outcomes using tax data, via the Educational Labour Market Longitudinal Platform (ELMLP
The LMIC also focused on the development of partnerships, in order to understand and align approaches to the collection, analysis and dissemination of LMI across Canada.
For instance, in FY1819, the LMIC partnered with the MaRS Discovery District on their Employment Pathways project, aimed at supporting thousands of Canadians through career transitions. The Council also partnered with LinkedIn to summarize skills and job titles in 10 major Canadian cities, based on data from the professional networking site.
The LMIC is partnering with ESDC and Statistics Canada on a mapping initiative of skills to National Occupational Classification (NOC) codes. To provide a framework for this work, ESDC developed a Skills and Competencies Taxonomy in FY1819. The Taxonomy proposes a common lexicon and framework for the identification and organization of skills descriptors. The Taxonomy aims to bring coherence to the collection, analysis and dissemination of information on workplace requirements and skills and competency gaps.
National Employment Service Initiatives
Departmental operating funds also support online national employment services administered by ESDC, to help Canadians find suitable employment and help employers find suitable workers. These free, bilingual online services connect job seekers with employers, and help individuals prepare and carry out their return-to-work action plans. Job Bank is designed to improve the way information about jobs and the labour market is disseminated by reducing duplication, improving the quality of information, as well as making online LMI more accessible and easier to use.
In partnership with provinces and territories, ESDC maintains the Job Bank website, which offers an electronic labour exchange service to connect job seekers and employers as part of the National Employment Service. Job Bank provides workers with a listing of employment opportunities across Canada to assist them with their job search. Employers can also use Job Bank to post their job vacancies online in order to find qualified candidates.
Job Bank receives incoming job feeds from Monster, Career Beacon and Jobillico to increase the diversity and coverage of job postings that it provides. In August 2018, Job Bank added a new feed from Jobpostings.ca. Outgoing feeds are systematically established with external sites to improve the visibility of Job Bank jobs.
Job Bank completed a number of online service enhancements in FY1819. Two new Job Match algorithm options were introduced allowing job seekers to customize their matches according to their job search objectives. Other enhancements include splitting the Explore Careers section of the Job Bank site into 2 distinct tasks (career planning and trends analysis), and allowing co-delivery partners to display provincial and territorial branding.
Trends in EI Claimants' Registration with Job Bank
A recent departmental study* examined the use of the Job Alerts service available on the Job Bank platform by job seekers who apply for Employment Insurance (EI) benefits online.
The study found that:
- the share of EI applicants, who subscribed to Job Alerts after receiving an invitation, steadily increased from about 20% in December 2017 to about 35% in April 2019. Subscribers were more likely to be women; 45 years or older; and to have graduated from college or university
- over half of job postings were from sales and service occupations and business, finance, and administration occupations. By educational levels, close to half of job postings required a university degree or college diploma/apprenticeship training. About 37% required a high school diploma and/or job-specific training while 17% required on-the-job-training
- Prince Edward Island, Newfoundland and Labrador, Nova Scotia, New Brunswick were among provinces with the largest share of postings that required on-the-job-training
- the average hourly rate of pay of posted jobs increased from $16.5 in 2017 to $18.6 in 2019, for a percentage increase of 12.7%
- in 2018, the average duration of job postings was 36 days, relative to about 29 days in 2017
* ESDC, Trends in EI Claimants' Registration with Job Bank. (Ottawa: ESDC, Evaluation Directorate, 2020)
The Job Bank mobile application was officially launched in February 2018, and 11 updates were made to the app in FY1819 to improve user experience, including in-app browsing and screen-read enhancements to improve accessibility based on feedback from the Canadian National Institute for the Blind.
Following the introduction of the email address field in Appliweb in December 2017, Job Bank began subscribing EI applicants automatically in Job Alerts and sending them an email to confirm their enrollment (lite auto-enrollment). Only 30% of EI applicants completed their enrollment when there was a confirmation step required. In FY1819, Job Bank experimented with other tactics to increase this rate, including changing the name of the sender and the subject line of the email.
Job Bank worked with stakeholders in ESDC to increase interoperability between programs. In particular, Job Bank made available its job posting capabilities to support the integration of Canada Summer Jobs on the Job Bank website and mobile app. Job Bank also collaborated with the Temporary Foreign Worker program to develop a Labour Market Impact Assessment Online tool which integrates with the Job Bank website and leverages its employer registration process.
Key highlights of FY1819
- The Job Bank website received 42 million visits. This represented 115,000 site visits and 637,000 page views per day
- Of the total visits, 40% included a job search, and 55% viewed job postings
- The Labour Market Information section received 13,000 site visits per day, leading to the generation of 21,000 job market reports on a daily basis
- Job Bank displayed 1.25 million job postings, including those from provincial, territorial and private job boards
- 30,000 new employer files were approved and 65,000 employers posted directly on Job Bank
- 441,000 job seekers newly subscribed to the Job Alerts service. In total, 217 million Job Alerts were sent to over 589,000 subscribers
- 132,000 Job Match profiles were activated
- The Job Bank mobile app had 168,000 installs as of March 31, 2019. It received over 1 million sessions, which resulted in more than 2.3 million job posting views
The Education and Labour Market Longitudinal Platform (ELMLP)
The Education and Labour Market Longitudinal Platform (ELMLP) is designed to provide accurate and up‑to‑date labour market information Canadians need to make informed career decisions. The data platform allows for linkages and analysis of students and apprentices data, tax files and ESDC's program administrative data. Tax data, in particular, provides information on employment outcomes, such as income levels, use of social assistance and Employment Insurance, which is central for assessing the impact of education pathways and labour market programs.
The Platform supports the objectives of EI Part II Pan-Canadian activities by filling gaps identified in labour market information through the integration of data to enable longitudinal analysis of educational trajectories and labour market outcomes. To deliver on Budget 2018's commitment to fund this initiative from existing resources, $5.3 million in Pan‑Canadian program funding was converted to operating funding for FY1819.
The ELMLP consists of 3 core datasets:
- the Postsecondary Student Information System (PSIS) - a data holding of all public college and university enrolments and graduates by type of program and credential, and field of study for each school year since 2009 for all jurisdictions and for earlier years prior to 2009 for select jurisdictions
- the Registered Apprenticeship Information System (RAIS) - an administrative dataset of pan-Canadian (provincial and territorial), annual data on registered apprentices and trade qualifiers since 2008
- T1 Family File - select information from personal income-tax data from 1992 for all PSIS and RAIS records
The results achieved in year FY1819 centered mostly on the dissemination of core datasets including the FY1617 Post‑secondary Student Information System (PSIS) annual, the Registered Apprenticeship Information System (RAIS) 2017 and the release of longitudinal indicators for RAIS and PSIS for cohorts 2008 and ongoing. In November 2018, ESDC, in collaboration with the Canadian Research Data Centre Network (CRDCN) organised a webinar on the ELMLP with joint presentations involving ESDC, the Education Policy Research Initiative from Ottawa University and Statistics Canada.
Key contributors to the Platform are ESDC, Statistics Canada, PT ministries of education, the Council of Ministers of Education (CMEC) and apprenticeship authorities which collaborate through the Canadian Education Statistics Council and the Canadian Council of Directors of Apprenticeship.
Official Language Minority Communities Signature Projects
Launched in 2005, the Enabling Fund for Official Language Minority Communities (OLMCs) represents a sustained effort to enable community-wide economic development. The Enabling Fund is an important part of a broad horizontal Government of Canada strategy for linguistic duality, as described in the Action Plan for Official Languages - 2018 to 2023: Investing in Our Future.Footnote 42
Signature Projects were aligned with ESDC's vision “to build a stronger and more competitive Canada, to support Canadians in making choices that help them live productive and rewarding lives, and to improve Canadians' quality of life.” They also enable a number of partnering federal departments, agencies and external stakeholders (for example, employers, learning institutions) to provide a coordinated response to existing and emerging economic development issues and opportunities in OLMCs.
These projects focus on:
- improving local level labour market information and deepening understanding of Canada's labour markets and skills needs
- helping businesses access the skills needed to meet changing demands
- supporting labour market integration and improving workforce adaptability, and
- fostering engagement, collaboration and innovation.
The Government of Canada has prioritized a number of mechanisms to overcome mismatches between skills supply and demand, while reducing unemployment by using national levers to support labour mobility (for example, LMI). For OLMCs, however, the migration of skilled people out of their communities can negatively affect their overall competitiveness and exacerbate challenges in attracting new opportunities and strengthening their community's vitality. Signature Projects help implement commitments made by the Government of Canada as they relate to Canada's linguistic duality, and help the department develop meaningful collaborative relationships, while engaging in dialogue and active outreach with new partners in the implementation of Signature Projects.
ESDC investments, funded through the Research and Innovation Support Measure of EI Part II, contributed to advancing priority areas as identified in the 2015-2020 Canadian Plan for Economic Development (CPED) of Official Language Minority Communities, including the development of sectoral studies, pursuing synergies, developing tools and supports for employers, in addition to collaboratively resolving concrete challenges and problems in communities. The funding provides opportunities for government, private sector, OLMCs, as well as other stakeholders, to collaborate on economic development and employment priorities, an important determinant for the vitality of OLMCs.
Signature Projects were designed to:
- test innovative collaborative approaches, and
- generate lessons on outcomes related to the scalability of those projects, which, once tested, can be integrated to activities delivered through the Enabling Fund program
In FY1819, 4 projects received support through pan-Canadian funds. All supported government priorities related to enhancing engagement and innovation in improving skills and training, contributing to opportunities for Canadians in addition to the vitality of OLMCs.
The following describes examples of Signature Projects that were implemented in FY1819 and how they aligned with Government of Canada priorities:
- address the successful transfer of businesses by increasing understanding of the value of a robust business transfer strategy and providing the skills and tools so that young entrepreneurs can build and maintain 1
- promote women in non-traditional trades where skilled labour is in demand by highlighting 8 women who have entered non-traditional trades with success through the creation of promotional products and videos
- support youth entrepreneurship in OLMCs by offering skills development and guidance with practical hands-on experience in backing their entrepreneurial ideas or business project, in collaboration with the Association of World Trade Centre Winnipeg, the Fédération de la jeunesse canadienne-française , the Association des collèges et universités de la francophonie canadienne (ACUFC) and the Réseau de développement économique et d'employabilité du Canada
- develop a multi-year strategy to recruit international francophone/bilingual students, support them and eventually retain them in OLMCs once they have completed their studies. The strategy could include support to enter the labour market in their field of studies, and help with immigration processes
These projects met objectives related to the advancement of new partnerships, leveraging of resources, as well as expertise and delivery of practical initiatives in communities. Initiatives have supported OLMCs job seekers, businesses and communities. The projects contributed to enhancing OLMCs' capacity and expanding client reach, in addition to visibility of services. Moreover, this led to the sharing of best practices across the country, which benefited other jurisdictions. Given the positive impacts, a number of the small-scale tested projects were replicated in other regions, and lessons learned are being applied.
Work Integration Social Enterprises research
ESDC launched the WISE research program in 2017. This is a 5-year longitudinal study composed of 6 main projects to measure the impact of social enterprises on labour market outcomes for vulnerable populations including specifically:
- persons with disabilities
- youth
- recent immigrants
- homeless or individuals at risk of homelessness, and
- Indigenous peoples
Funding is strictly for research purposes and does not cover the WISE organizations/interventions themselves. Together with a series of complementary research projects with other funding sources, the WISE research program is expected to provide answers to the following key policy research questions:
- are WISE projects effective in promoting the social and labour market integration of vulnerable individuals
- which WISE models and type of training programs work best
- for whom
- under which circumstances
- what is the return on investment for government
These 6 longitudinal research projects include one project based on a quasi-experimental design and 5 projects based on multi-site extended case studies. Four of the projects are located in Ontario, one in Québec, and one in British Columbia. They focus on different at-risk groups, WISE modes of labour market integration and training programs. Some of these projects build on previous case study research. Almost all projects include cost benefit analysis and/or Social Return on Investment (SROI) to measure the return on investment and the social impacts of WISE interventions.
Contribution agreements for all 6 research projects were signed in mid-Fall 2017 and their implementation started in late 2017 and early 2018.
ESDC continues to monitor the progress of all 6 research projects, funded through the R&I Support Measure of EI Part II. To do so, it has been coordinating periodic teleconference calls with the research teams to monitor the progress of all projects and identify any emerging issues. In order to gain a deeper understanding of WISE intervention approaches and participants' experience, ESDC also started to visit sites (not funded by EI Part II) to discuss with researchers and engage directly with WISE practitioners and community researchers in spring 2018. These site visits are providing key insights for the development and management of the WISE research program and will continue through the life of the project.
This 5-year research program is expected to provide evidence to support the achievement of the Government of Canada's and ESDC's objectives to create a skilled, adaptable and inclusive workforce and an efficient labour market. This evidence will guide policy and program funding decisions for Government of Canada investments in these areas. These objectives emphasize collaboration with the not-for-profit sector and private business on the implementation of innovative ideas, social partnerships and social finance approaches. As such, the approach undertaken for the research program itself is an example of this type of collaboration.
This research strategy aligns well with the Government's Social Innovation and Social Finance Strategy and more broadly with long standing initiatives by various governments to support social enterprise as a key business model. WISEs are primary examples of community organizations developing solutions for society's most difficult problems and adopting new sources of revenue and financing to become more sustainable and achieve greater impact.
WISEs may have the capacity to (re)integrate vulnerable populations into existing labour markets, or to create long‑term new jobs, and more broadly to increase the employability of disadvantaged populations. However, because this is an evolving area for government, there is an absence of a coordinated, focused policy framework, while government funded programs for WISEs have been fragmented and possibly underfunded. The lack of empirical data on the direct labour market impact and other relevant social outcomes of WISEs for different vulnerable populations in Canada presents a barrier to evidence based policy and program development aimed at supporting the growth of labour force participation for individuals facing multiple and complex challenges (for example, disability and homelessness).
To complement the longitudinal WISE research program, ESDC is undertaking an internal research agenda analysing its Grants and Contributions database to estimate how many of these social enterprises are being funded via ESDC's programs and how much money is invested in these organizations annually. ESDC is also exploring the feasibility of using its program administration data to estimate both the relative short-term effectiveness of WISEs in promoting the labour market integration of vulnerable individuals compared to the effects achieved by other types of interventions, and the longer-term effectiveness. Finally, ESDC will also test the possibility of using program administrative data to quantify the results of the Social Innovation and Social Finance Strategy.
Achievements for WISE Research Projects in FY1819:
- data collection plans, instruments and evaluation frameworks have been developed by each of the research teams. These involved undertaking a literature review informing the development of logic models based on theory of change and the identification of potential quantitative (hard) and qualitative (soft) outcomes to be captured in each of these multi-sites studies. Based on these preliminary lists of outcomes, each of the research team has been able to identify potential validated instruments and other metrics for data collection
- all projects developed their recruitment strategies and recruited participants. Most research teams have collected baseline data and several have begun to collect data from participants who have completed their interventions. While participant enrolment required more time and effort than anticipated, recruitment has exceeded expectation and over 800 trainees have agreed to participate, 100 more than originally estimated
- in February 2019, ESDC organized a Workshop (not funded by EI Part II) at which WISE representatives, researchers, and leading measurement experts made presentations on their WISE, their research projects, including preliminary results, and provided guidance on how best to measure the success of WISE interventions with one another and with internal and external stakeholders
- projects have begun to share their interim research reports summarizing baseline information about the participants and preliminary short-term results
WISE research projects are continuing to recruit additional participants during FY1920 after which the projects will monitor the experience of these WISE participants for up to 3 full years. Interim research reports will be delivered in each upcoming fiscal year. The Research teams will submit final research reports by March 31, 2022.
- The estimated notional budget for the entire research program over 5 years would be $2,200,000, dependant on annual allocation through the EI Expenditure Plan for Pan Canadian Projects.
3.4.4 Supporting agreements with provinces, territories and Indigenous organizations
In FY1819, the Department continued its work to enhance and modernize the LMDA data systems including the implementation of the Targeting, Referral, and Feedback (TRF) tool in all PTs, improvements to the Employment Insurance Benefits Information System (EIBIS), data warehousing and the consolidation of external access to data exchange systems.
The TRF allows PTs to receive information on EI applicants immediately following their application for EI based on predefined criteria. PTsthen contact these applicants to offer services and supports to help with their return to work. Suggestions made by the 3 PTs who were early adopters of TRF led to additional work to enhance the application.
PTs and Indigenous organizations are continuing to make use of the EIBIS launched in January 2014, which added new tools to validate the eligibility of potential clients for Part II benefits.
In FY1819, the Department launched the Data Warehouse for Labour Market Programs project to expand and update existing data storage solutions to support the implementation of new LMDA and ISET performance measurement frameworks. The architecture for the overall Data Warehouse solution is scalable to accommodate the evolution of labour market programs, while safeguarding personal information in a secure environment. Follow-up work will provide better access to aggregate data across programs to inform policy development.
A 4-year project to consolidate access by program delivery partners (PTs and Indigenous organizations) advanced through to completion in February 2019. Partners now use a single set of credentials to access the suite of applications that support the labour market agreements.
Also in FY1819, the Department initiated a pilot project to align data exchange methodology with the guiding principles set out in the 2017 to 2021 Government of Canada Strategic Plan for Information Management and Information Technology. The project seeks to achieve program efficiencies by increasing speed of service delivery and data integrity through an Application Programming Interface server to server solution. This solution replaces a manual process to verify client program eligibility, reducing errors and the exposure of data to unauthorized personnel, and improving data integrity and security.