
Chapter 2: Impact and effectiveness of Employment Insurance benefits (Part I of the Employment Insurance Act)
From: Employment and Social Development Canada
Official title: Employment Insurance Monitoring and Assessment Report for fiscal year beginning April 1, 2018 and ending March 31, 2019: Chapter 2: Impact and effectiveness of Employment Insurance benefits (Part I of the Employment Insurance Act)
In chapter 2
- List of abbreviations
- Introduction – Chapter 2
- 2.1 Employment Insurance benefits overview
- 2.2 Employment Insurance regular benefits
- 2.3 Employment Insurance support while on training
- 2.4 Employment Insurance fishing benefits
- 2.5 Employment Insurance Work-Sharing benefits
- 2.6 Employment Insurance special benefits
- 2.7 Employment Insurance financial information
List of abbreviations
This is the complete list of abbreviations for the Employment Insurance Monitoring and Assessment Report for the fiscal year beginning April 1, 2018 and ending March 31, 2019.
Abbreviations
- ASETS
- Aboriginal Skills and Employment Training Strategy
- ATSSC
- Administrative Tribunals Support Service of Canada
- B/C Ratio
- Benefits-to-Contributions ratio
- B/U Ratio
- Benefits-to-Unemployed ratio
- B/UC Ratio
- Benefits-to-Unemployed Contributor ratio
- BDM
- Benefit Delivery Modernization
- CANSIM
- Canadian Socio-Economic Information Management System
- CAWS
- Citizen Access Workstation Services
- CCAJ
- Connecting Canadians with Available Jobs
- CCB
- Canada Child Benefit
- CCDA
- Canadian Council of Directors of Apprenticeship
- CEIC
- Canada Employment Insurance Commission
- COLS
- Community Outreach and Liaison Service
- CSO
- Citizen Service Officer
- CPI
- Consumer Price Index
- CPP
- Canada Pension Plan
- CRA
- Canada Revenue Agency
- CRF
- Consolidated Revenue Fund
- CUSMA
- Canada-United States-Mexico Agreement
- CX
- Client Experience
- EBSMs
- Employment Benefits and Support Measures
- ECC
- Employment Contact Centre
- EF
- Enabling Fund
- EI
- Employment Insurance
- EI PAAR
- Employment Insurance Payment Accuracy Review
- EI PRAR
- Employment Insurance Processing Accuracy Review
- EICS
- Employment Insurance Coverage Survey
- eROE
- Electronic Record of Employment
- ESDC
- Employment and Social Development Canada
- FLMM
- Forum of Labour Market Ministers
- FY
- Fiscal Year
- G7
- Group of Seven
- GDP
- Gross Domestic Product
- HCCS
- Hosted Contact Centre Solution
- HRSDC
- Human Resources and Social Development Canada
- IQF
- Individual Quality Feedback
- IVR
- Interactive Voice Response
- LFS
- Labour Force Survey
- LMDA
- Labour Market Development Agreements
- LMI
- Labour Market Information
- LMP
- Labour Market Partnerships
- MIE
- Maximum Insurable Earnings
- MSCA
- My Service Canada Account
- NAICS
- North American Industry Classification System
- NAFTA
- North American Free Trade Agreement
- NAS
- National Apprenticeship Survey
- NERE
- New-Entrant/Re-Entrant
- NESI
- National Essential Skills Initiative
- NIS
- National Investigative Services
- NOS
- National Occupational Standards
- NQCP
- National Quality and Coaching Program for Call Centres
- OAS
- Old Age Security
- OECD
- Organization for Economic Co-operation and Development
- PPEs
- Clients who are Premiums Paid Eligible
- P/Ts
- Provinces and Territories
- PPTS
- Percentage points
- PRP
- Premium Reduction Program
- QPIP
- Quebec Parental Insurance Plan
- RAIS
- Registered Apprenticeship Information System
- ROE
- Record of Employment
- RSOS
- Red Seal Occupational Standards
- SA
- Social Assistance
- SCC
- Service Canada Centres
- SDP
- Service Delivery Partner
- SEPH
- Survey of Employment, Payrolls and Hours
- SIN
- Social Insurance Number
- SIR
- Social Insurance Registry
- SME
- Small and medium sized enterprises
- SO
- Scheduled Outreach
- SST
- Social Security Tribunal
- STDP
- Short-term disability plan
- SUB
- Supplemental Unemployment Benefit
- UV
- Unemployed-to-job-vacancy ratio
- VBW
- Variable Best Weeks
- VER
- Variable Entrance Requirement
- WWC
- Working While on Claim
Introduction – Chapter 2
This chapter of the Employment Insurance Monitoring and Assessment Report assesses income support provided by Employment Insurance (EI) Part I benefits:
- regular benefits
- fishing benefits
- Work-Sharing benefits
- special benefits
This chapter includes several key indicators, such as the number of new claims established, total amount paid, level of benefits, maximum duration and actual duration of benefits as well as the exhaustion of benefits. Throughout the chapter, key EI program provisions and recent changes made to the EI program are discussed. Indicators related to level of claims and level of benefits are presented for claims established within the fiscal year for which at least 1 dollar in EI benefits was paid. Meanwhile, indicators like maximum and actual duration are based on claims completedFootnote 1 during the fiscal year for which at least 1 dollar was paid in EI benefits. Indicators related to amount of EI benefits paid are presented on a cash basis, which means the expenses are accounted for during the fiscal year in which they are paid. More information on the definitions of the indicators presented throughout this chapter can be found in Annex 2.1 of this report.
This chapter relies on several sources of information to provide a comprehensive analysis of the EI program. EI administrative data, generally based on a 10% sample, underpins the majority of the analysis in this chapter. Some sections of this chapter also make use of tax data provided by the Canada Revenue Agency related to T4 tax slips with employment income or T1 returns. Statistics Canada's Employment Insurance Coverage Survey provides the basis for deeper analysis of coverage, eligibility and access of EI benefits for unemployed people. Throughout the chapter, data for the FY1819 is compared with data from previous years and, in some instances, long-term trends are discussed.
Annex 2 of the report presents additional statistical information on benefits analyzed in this chapter and Annex 7 provides an overview of major changes to the EI program between April 1996 and December 2019.
2.1 Employment Insurance benefits overview
In this section
- 2.1.1 Employment Insurance claims, amount paid and level of benefits
- 2.1.2 Combined Employment Insurance claims
- 2.1.3 Benefits-to-contributions ratios
The Employment Insurance (EI) program provides temporary income support to partially replace employment income for eligible unemployed contributors to the program while they look for new employment or upgrade their skills, and for those who are absent from work due to specific life circumstances, such as:
- sickness
- pregnancy
- providing care to a newborn or newly adopted child
- providing care and support to a critically ill family member, or
- providing end-of-life care to a family member with significant risk of death
In this chapter, EI benefits refer to regular benefits, special benefits, fishing benefits and Work-Sharing benefits (see Table 1). Special benefits include maternity benefits, parental benefits, sickness benefits, family caregiver benefits for adults or children, and compassionate care benefits. All EI benefit types are paid at a benefit rate of 55% of average weekly insurable earnings up to the maximum weekly benefit rate, except for extended parental benefits, which are paid at 33%. Subsection 2.1.1 covers the number of new claims established in the fiscal year, total amount paid over the fiscal year and benefit levels of claims established. Subsection 2.1.2 examines combined (or mixed) benefit claims. Subsection 2.1.3 provides an analysis of the usage of EI benefits relative to EI contribution premiums.
| Benefit type | Circumstance | Insurable employment entrance requirement | Maximum entitlement |
|---|---|---|---|
| Regular | Unemployed with a valid reason for separation and searching for suitable employment or retraining in certain cases | 420 to 700 hours depending on the Variable Entrance Requirement | 14 to 45 weeks, depending on insurable employment and regional unemployment rate1 |
| Fishing | Self-employed fishers without available work | Value of a catch between $2,500 and $4,200 depending on the Variable Entrance Requirement | 26 weeks per season (summer or winter) |
| Work-Sharing | Firm avoiding layoffs during a slowdown in business activity for reasons beyond the firm’s control with a recovery plan and a Work-Sharing agreement in place | 420 to 700 hours depending on the Variable Entrance Requirement and must be a year-round employee | 6 to 26 weeks, with the possibility of an extension by 12 weeks if warranted2 |
| Special3 - Maternity | Unavailable to work because of pregnancy or has recently given birth | 600 hours | 15 weeks |
| Special - Parental | Caring for a newborn or a newly adopted child | 600 hours | Standard parental: 35 weeks plus 5 additional weeks when benefits are shared4 Extended parental (at a lower replacement rate5): 61 weeks plus 8 additional weeks when benefits are shared4 |
| Special - Sickness | Unavailable to work because of illness, injury or quarantine | 600 hours | 15 weeks |
| Special - Family caregiver for children (formerly Parents of Critically Ill Children)7 | Providing care or support to a critically ill or injured child under the age of 18 | 600 hours | 35 weeks6 |
| Special - Family caregiver for adults | Providing care or support to a critically ill or injured person 18 years or older | 600 hours | 15 weeks6 |
| Special - Compassionate care | Providing care to a person of any age who requires end-of-life care | 600 hours | 26 weeks6 |
- 1 Budget Implementation Act, 2016, No. 1 extended the duration of EI regular benefits up to a maximum of 70 weeks of regular benefits for some claimants (see subsection 2.2.4 for further details on the measure).
- 2 Temporary Work-Sharing special measures were announced to support employers affected by the downturn in the forestry sector and the steel and aluminum sector. These measures extend the duration of Work-Sharing agreements across Canada from a maximum of 38 weeks to 76 weeks. The temporary special measure for the forestry sector came into effect on July 30, 2017 and will continue until March 28, 2020. The temporary special measure for the steel and aluminum sector came into effect on August 19, 2018 and will continue until March 27, 2021.
- 3 Self-employed workers (other than fishers) who have opted into EI special benefits must meet an insurable earnings threshold for the calendar year preceding the claim. The threshold was $6,947 for claims established in 2018 and $7,121 for claims established in 2019.
- 4 Since March 17, 2019, the EI parental sharing benefit provides 5 additional weeks to standard parental benefits and 8 additional weeks to extended parental benefits when parental benefits are shared between eligible parents.
- 5 As of December 3, 2017 parents can choose between standard parental benefits at a 55% replacement rate and extended parental benefits at a 33% replacement rate.
- 6 Benefits can be shared between eligible claimants. That is:
- parents, or
- family members
- 7 As of December 3, 2017 benefits for Parents of Critically Ill Children were improved and renamed "the family caregiver benefit for children". Since then child's parents and any qualifying members of the immediate and extended family who are eligible can claim the family caregiver benefit for children. Prior to that date, only parents could receive those benefits.
2.1.1 Employment Insurance claims, amount paid and level of benefits
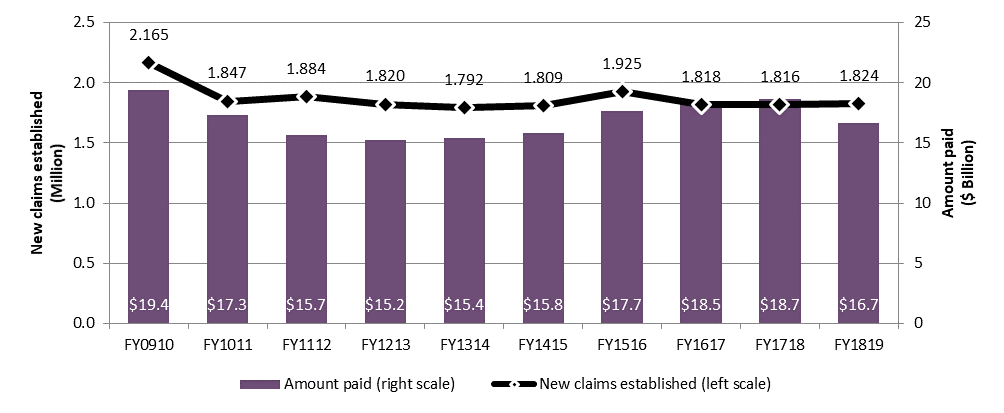
For the period beginning April 1, 2018, and ending March 31, 2019 (FY1819), the number of new EI claims edged up 0.5% (+8,790) to just over 1.8 million new claims. Total EI benefit payments decreased by nearly $2 billion, or -10.6%, to $16.7 billion. This was the lowest level recorded since FY1415 (see Chart 1). This decline is partly due to generally improving labour market conditions and relatively low unemployment rates.
Text description of Chart 1
| Fiscal year | Employment Insurance claims (millions) (left scale) | Amount paid in Employment Insurance benefits ($ billion) (right scale) |
|---|---|---|
| FY0910 | 2.165 | $19.4 |
| FY1011 | 1.847 | $17.3 |
| FY1112 | 1.884 | $15.7 |
| FY1213 | 1.820 | $15.2 |
| FY1314 | 1.792 | $15.4 |
| FY1415 | 1.809 | $15.8 |
| FY1516 | 1.925 | $17.7 |
| FY1617 | 1.818 | $18.5 |
| FY1718 | 1.816 | $18.7 |
| FY1819 | 1.824 | $16.7 |
- Note: Includes all claims for which at least $1 of Employment Insurance benefits was paid.
- Source: Employment and Social Development Canada, Employment Insurance (EI) administrative data. Data are based on a 10% sample of EI administrative data.
According to Statistics Canada, there were 717,600 beneficiaries receiving EI benefits on average each month in FY1819, a decrease of 7.5% from 775,800 beneficiaries during the previous reporting period.Footnote 2
The average weekly benefit rate increased by 2.6% from $454 in FY1718 to $465 to FY1819.Footnote 3,Footnote 4 The proportion of claimants receiving the maximum weekly benefit increased from 46.5% in FY1718 to 48.0% in FY1819.
New Employment Insurance claims established
The slight increase in the number of new EI claims observed during the reporting period is largely due to an increase in claims for sickness and parental benefits, which was partially offset by a decrease in the number of claims for regular, compassionate care and maternity benefits (see Table 2).
| Type of Employment Insurance benefit | New claims established FY1718 | New claims established FY1819 | Change in new claims established (# and %) | Amount paid ($ millions) FY1718 | Amount paid ($ millions) FY1819 | Change in amount paid (%) |
|---|---|---|---|---|---|---|
| Regular | 1,299,710 | 1,292,710 | -7,000 (-0.5%) | $12,640.5 | $10,673.8 | -15.6% |
| Fishing | 30,055 | 30,367 | +312 (+1.0%) | $300.2 | $297.7 | -0.8% |
| Work-Sharing | 3,708 | 3,815 | +107 (+2.9%) | $12.5r1 | $5.7 | -53.9% |
| Special | 597,090 | 606,540 | +9,450 (+1.6%) | $5,739.7r | $5,792.7 | +0.9% |
| Maternity | 171,470 | 170,010 | -1,460 (-0.9%) | $1,150.3 | $1,164.1 | +1.2% |
| Parental | 198,050 | 200,030 | +1,980 (+1.0%) | $2,778.1 | $2,728.0 | -1.8% |
| Sickness | 411,870 | 420,840 | +8,970 (+2.2%) | $1,712.0 | $1,769.6 | +3.4% |
| Family caregiver for children | 4,921r | 5,475 | +554 (+11.3%) | $30.4r | $36.8 | +20.9% |
| Family caregiver for adults | 2,671r,* | 10,106 | n/a* | $7.8r,* | $48.3 | n/a* |
| Compassionate care | 11,010 | 8,385 | -2,625 (-23.8%) | $61.1 | $45.8 | -25.0% |
| Canada | 1,815,540 | 1,824,330 | +8,790 (+0.5%) | $18,654.7 | $16,685.3 | -10.6% |
- Notes: Totals may not add up due to rounding. Includes all claims for which at least $1 of Employment Insurance benefits was paid. The sum of claims by benefit type does not add up as multiple benefit types can be combined in 1 single claim.
- r1 Data has been revised, given that the amount paid in Work-Sharing benefits is now based on a 100% sample of EI administrative data.
- r Revised data.
- * EI family caregiver benefits for adults came into effect on December 3, 2017. Given the short period during which benefits for family caregivers for adults were offered in FY1718, few claims were made. Consequently, the data from FY1819 are not comparable to the previous year's data.
- Source: Employment and Social Development Canada, Employment Insurance (EI) administrative data. Data are based on a sample of 10% of the EI administrative data, except for family caregiver, Work-Sharing and compassionate care benefits as well as claims for fishing benefits (100%).
Most provinces and territories experienced modest declines in the number of new EI claims established between FY1718 and FY1819. However, Alberta (+18,600 or +10.9%), Newfoundland and Labrador (+4,980 or +6.1%), Saskatchewan (+2,960 or +5.8%) and Manitoba (+2,580 or +4.2%) recorded increases over the reporting period (see Table 3).
| Category | New claims established FY1718 | New claims established FY1819 | Change in new claims established (%) | Amount paid ($ millions) FY1718 | Amount paid ($ millions) FY1819 | Change in amount paid (%) |
|---|---|---|---|---|---|---|
| Newfoundland and Labrador | 81,090 | 86,070 | +6.1% | $1,185.2 | $1,022.9 | -13.7% |
| Prince Edward Island | 22,720 | 22,480 | -1.1% | $248.1 | $231.1 | -6.9% |
| Nova Scotia | 85,300 | 84,570 | -0.9% | $892.2 | $845.1 | -5.3% |
| New Brunswick | 91,130 | 89,820 | -1.4% | $954.0 | $869.6 | -8.9% |
| Quebec | 482,990 | 473,060 | -2.1% | $3,558.2 | $3,106.0 | -12.7% |
| Ontario | 562,570 | 556,900 | -1.0% | $5,657.7 | $5,240.4 | -7.4% |
| Manitoba | 61,440 | 64,020 | +4.2% | $631.3 | $619.2 | -1.9% |
| Saskatchewan | 51,250 | 54,210 | +5.8% | $700.9 | $624.7 | -10.9% |
| Alberta | 170,270 | 188,870 | +10.9% | $2,655.3 | $2,171.0 | -18.2% |
| British Columbia | 200,820 | 198,240 | -1.3% | $2,089.5 | $1,878.1 | -10.1% |
| Yukon | 2,200 | 2,310 | +5.0% | $27.8 | $25.0 | -9.8% |
| Northwest Territories | 2,420 | 2,310 | -4.5% | $30.9 | $31.1 | +0.9% |
| Nunavut | 1,340 | 1,470 | +9.7% | $23.6 | $21.0 | -11.1% |
| Men | 974,660 | 988,250 | +1.4% | $9,678.0 | $8,416.6 | -13.0% |
| Women | 840,880 | 836,080 | -0.6% | $8,976.6 | $8,268.7 | -7.9% |
| 24 years old and under | 172,810 | 170,480 | -1.3% | $1,443.0 | $1,284.6 | -11.0% |
| 25 to 44 years old | 876,270 | 882,780 | +0.7% | $9,908.0 | $9,038.7 | -8.8% |
| 45 years to 54 years old | 363,410 | 352,640 | -3.0% | $3,431.5 | $2,883.7 | -16.0% |
| 55 years old and over | 403,050 | 418,430 | +3.8% | $3,872.1 | $3,478.3 | -10.2% |
| Canada | 1,815,540 | 1,824,330 | +0.5% | $18,654.7 | $16,685.3 | -10.6% |
Notes: Totals may not add up to the total due to rounding. Includes claims for which at least $1 of EI benefits was paid.
Source: Employment and Social Development Canada, Employment Insurance (EI) administrative data. Data are based on a sample of 10% of the EI administrative data.
The number of new claims established by men increased slightly during FY1819, while it decreased for women. Men established 54.2% of all new claims. Levels of new EI claims decreased for young workers aged 24 years old and under and for workers aged 45 to 54 years old.
Total amount paid in Employment Insurance benefits
The amount paid for all types of EI benefits combined reached $16.7 billion in FY1819, a decrease of $2 billion or -10.6%. This decline was largely attributable to the decrease in the amount paid in EI regular benefits ($2 billion or -15.6%).
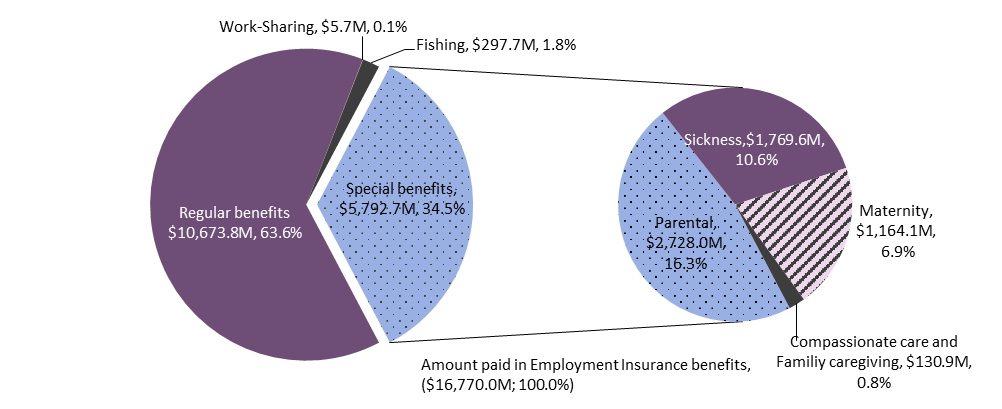
The share of EI benefits paid by benefit type remains relatively unchanged compared to the previous reporting period. However, the share of regular benefits fell slightly between FY1718 and FY1819 from 67.6% to 63.6%, while the share of special benefits climbed from 30.7% to 34.5%. Fishing and Work-Sharing benefits represented less than 2.0% of total EI benefits paid (see Chart 2).
Text description of Chart 2
| Benefits | $ million | % share |
|---|---|---|
| Regular benefits | $10,673.8 | 63.6% |
| Work-Sharing benefits | $5.7 | 0.1% |
| Fishing benefits | $297.7 | 1.8% |
| Special benefits | $5,792.7 | 34.5% |
| Parental benefits | $2,728.0 | 16.3% |
| Sickness benefits | $1,769.6 | 10.6% |
| Maternity benefits | $1,164.1 | 6.9% |
| Compassionate care and Family caregiving benefits | $130.9 | 0.8% |
- *The total amount paid reported in Chart 2 does not correspond to the total reported in Tables 2 and 3 because data on compassionate care benefits and family caregiver benefits can only be reported on a 100% sampling bases on an aggregate level.
- Source: Employment and Social Development Canada, Employment Insurance (EI) administrative data. Data are based on a sample of 10% of the EI administrative data, except for Work-Sharing, family caregiver and compassionate care benefits (100%).
The amount paid in EI benefits decreased in all provinces and territories, except for Northwest Territories. Alberta (-18.2%), Newfoundland and Labrador (-13.7%) and Quebec (-12.7%) recorded the largest declines in benefits paid (see Table 3).
EI benefits received by both men and women declined from the previous fiscal year, with men having experienced a greater decline than women. The amount paid in EI benefits also decreased for each age group.
Levels of benefits
For all claims, excluding those for extended parental benefitsFootnote 5, the average weekly benefit rate increased by 2.6% nationally to $465 over the reporting period (see Annex 2.3.2). This rise is comparable to the 2.7% increase in maximum insurable earnings between 2018 and 2019 (see Section 2.7). All provinces and territories recorded increases, with the exception of Nunavut. Northwest Territories continued to have the highest average weekly benefit rate ($520), while Prince Edward Island and Nova Scotia posted the lowest average rates ($437 each).
Northwest Territories also had the highest proportion of claimants receiving the maximum weekly benefit rate (79.4%) for FY1819, while Prince Edward Island and New Brunswick had the lowest proportions of claimants receiving the maximum rate (35.1% and 35.4%, respectively).
The average weekly benefit rate increased for male and female claimants to $492 and $433, respectively. Men (59.5%) were proportionally more likely to receive the maximum weekly benefit rate compared to women (33.9%) in FY1819.
The average weekly benefit rate also increased for all age groups compared to FY1718. Claimants aged 25 to 44 still received the highest average weekly benefit rate ($478) and were more likely to collect the maximum weekly benefit rate (52.7%). Claimants under 25 years of age received, on average, the lowest amount of weekly benefits ($421), and only 30.0% of them received the maximum weekly benefit rate in FY1819.
Calculating the weekly benefit rate: Variable Best Weeks (VBW)
Since April 7, 2013 under the VBW provision the weekly benefit rate is calculated based on an EI claimant's highest (best) weeks of insurable earnings during the qualifying period. The number of weeks used to calculate the weekly benefit rate ranges from 14 to 22, depending on the monthly regional unemployment rate.*
| Unemployment rate* | Number of weeks |
|---|---|
| 6.0% and under | 22 |
| 6.1% to 7.0% | 21 |
| 7.1% to 8.0% | 20 |
| 8.1% to 9.0% | 19 |
| 9.1% to 10.0% | 18 |
| 10.1% to 11.0% | 17 |
| 11.1% to 12.0% | 16 |
| 12.1% to 13.0% | 15 |
| More than 13.0% | 14 |
- *The monthly regional unemployment rates used for the EI program are a moving average of seasonally adjusted rates of unemployment produced by Statistics Canada, as per section 17 of the Employment Insurance Regulations.
Impacts of Variable Best Weeks on benefit amounts
Prior to the implementation of the Variable Best Weeks (VBW) in April 2013, 2 methods for calculating the weekly benefit rate were in place: the Small Weeks provision and the Best 14 Weeks pilot project. The VBW method aims to strengthen incentives to accepting available work.
A recent departmental study* examined the impacts of the April 2013 change, among other things, on benefit rates by comparing benefits rates based on the VBW method with hypothetical rates that would have been obtained if the 2 previous methods had still been in effect. The analysis covered the period from April 2013 to August 2018.
The results of the study indicate that of the 9.7 million of claims established during the period covered by the study, 75.4% were not impacted by the change (because they would have received the same weekly benefit amounts if the old calculation methods had still been in effect), while 6.8% (0.7 million of claims) resulted in a lower benefit rate, and 17.8% (1.7 million of claims) received a higher benefit rate.
For claims established in regions that were subject to the Best 14 Weeks pilot project and negatively affected by the change, the benefit rate would have been higher by an average of $13 to $19 per week with the Best 14 Weeks method. This represents a decrease of about 5% of the benefit rate following the implementation of Variable Best Weeks.
For claims established in regions that were subject to the Small Weeks Provision and benefited from the change, the benefit rate would have been lower by an average of $43 to $49 per week if the previous Small Weeks method had still been in effect. This represents an increase of about 11% of their benefit rate following the implementation of Variable Best Weeks.
In general, claims established by claimants aged 15 to 24, men and claimants with less than 700 hours of insurable employment, and claims from the goods-producing industries, were the most impacted by the change in the benefit rate calculation method, both for claims established in the Best 14 Weeks pilot project regions and for those established in the Small Weeks provision regions.
- * ESDC, Impacts of Variable Best Weeks on benefit amounts (ESDC, Employment Insurance Policy Directorate, Ottawa, 2020)
Family supplement provision
The Family supplement provision, which targets low-income families, provides additional benefits to EI claimants with children under the age of 18 who have an annual family net income equal to or less than $25,921. The claimant must also receive the Canada Child Benefit. Under the Family supplement provision, which is available to claims in all benefit types, the weekly amount of family supplement can increase a claimant's benefit rate from 55% to a maximum of 80% of his or her weekly insurable earnings, subject to the maximum weekly benefit. The supplement provided to eligible claimants is determined by the claimant's family net income, the number of children in the claimant's family, and the age of the claimant's children.Footnote 6
In FY1819, low-income families received a total of $77.0 million in additional benefits through the Family supplement provision. A total of 72,900 claims received the family supplement in FY1819, a decrease of 4.0% from FY1718. The number of EI claims receiving the family supplement has now decreased for 17 consecutive years from a high of 187,300 claims in FY0102. Women (79.5%) and claimants aged 25 to 44 (72.2%) continue to be the main demographic groups benefitting from the Family supplement provision. The average weekly family supplement was $44 in FY1819 and has remained relatively unchanged over the years (see Annex 2.23 for more statistics on the Family Supplement provision).
2.1.2 Combined Employment Insurance claims
Under certain provisions of the EI program, a claimant may receive multiple types of benefits as part of a single claim, assuming that the claimant meets each benefit type's eligibility requirements.Footnote 7 A "pure" claim is 1 in which an EI claimant receives a single benefit type, while a "combined" claim is 1 in which the claimant receives more than 1 benefit type. Pure claims represented 81.8% of all completed claims in FY1819 (see Table 4).
| Benefit type* | Number of total claims (‘000s) | Number of pure claims (‘000s) |
Share of pure claims (%) | Number of combined claims (‘000s) |
Share of combined claims (%) | Benefit type most often combined with (share of combined claims) |
|---|---|---|---|---|---|---|
| Regular | 1,423.8 | 1,242.0 | 87.2% | 181.8 | 12.8% | Sickness (93.3%) |
| Fishing | 30.2 | 26.1 | 86.5% | 4.1 | 13.5% | Sickness (85.0%) |
| Work-Sharing | 3.3 | 2.3 | 68.9% | 1.0 | 31.1% | Regular (76.7%) |
| Maternity | 166.2 | 2.5 | 1.5% | 163.6 | 98.5% | Parental (98.1%) |
| Parental** | 196.3 | 31.1 | 15.8% | 165.2 | 84.2% | Maternity (97.2%) |
| Sickness | 439.6 | 236.8 | 53.9% | 202.8 | 46.1% | Regular (83.7%) |
| Compassionate care | 10.0 | 5.8 | 58.5% | 4.1 | 41.5% | Sickness (61.4%) |
| All claims*** | 1,891.3 | 1,546.7 | 81.8% | 344.6 | 18.2% | n/a |
- Note: Data may not add up to the total due to rounding. Includes claims for which at least $1 of EI benefits was paid. Completed claims include those that are terminated and those that are dormant and remained inactive as of August the following fiscal year. The sum of claims by benefit type for the “Total claims” and “Combined claims” columns does not add up to the total because more than 1 benefit type can be part of the same claim. This does not apply to pure claims that include only 1 benefit type.
- *Excludes Family Caregiver Benefits for children and adults.
- **Parental benefits include benefits for biological parents and adoptive parents.
- *** The total number of claims is based on claims completed during the fiscal year. This explains why the total number of claims here is different from the total numbers of claims in Tables 2 and 3 which are based on established claims.
- Source: Employment and Social Development Canada, Employment Insurance (EI) administrative data. Data are based on a 10% sample of EI administrative data.
Women were more likely to claim more than 1 type of EI benefit (28.0%) than men (10.1%) mostly due to their high probability of claiming both maternity and parental benefits.
In fact, maternity benefits were the benefits most often combined with other types of benefits, usually parental benefits. However, a significant proportion also claimed sickness benefits with maternity benefits (17.4%), resulting in the claimant starting her leave before becoming eligible for maternity benefits (available 12 weeks prior to the child’s expected date of birth).Footnote 8 The combination of maternity, parental and sickness benefits was the most common among claims with 3 or more benefit types (26,900 claims representing 16.2% of completed claims for maternity benefits in FY1819).
Claims for parental benefits were combined at a slightly lower rate than maternity, as only 11.4% of men who claimed parental also received another benefit payment. Of those male claimants, 86.9% received regular benefits and 17.4% claimed sickness benefits. Among women, virtually all (99.5%) who combined parental benefits with other types of benefits combined them with maternity benefits.
Sickness benefits were the third most likely to be combined with other benefit types, mostly with regular benefits. Men combined their sickness benefits predominantly with regular benefits (96.5%), while sickness claims from women were most often combined with regular (71.3%), maternity (27.7%) and parental benefits (26.3%). Sickness also represented the greatest share of combined regular claims.
When combined, compassionate care benefits are most often shared with sickness benefits (61.4%) or regular benefits (52.2%). Men tended to combine compassionate care benefits with regular benefits (63.3%) more often than women (47.2%). Women were most likely to combine compassionate care benefits with sickness benefits (67.5%) compared to men (47.7%).
One third of all Work-Sharing claims were combined with other benefit types, predominantly regular benefits. This is attributable to the fact that both benefit types are typically used during a downturn in business activity, which increases the risk of layoffs (Work-Sharing benefits) and actual layoffs (regular benefits). Regular benefits are usually claimed following Work-Sharing benefits, reflecting a continued downturn in a participating firm’s activity that eventually leads to a downsizing of the firm’s labour force.
While fishers do have the possibility of sharing fishing benefits with other benefit types (under some restrictions), only 13.5% of fishing claims were combined claims. Of those claims, 85.0% were combined with sickness benefits. No fishing claims were shared with maternity, parental, compassionate care or Work-Sharing benefits during the reporting period.
2.1.3 Benefits-to-contributions ratios
The benefits-to-contributions ratio (B/C ratio) is a measure of EI benefits paid by the program as a share of the contributions paid. It provides an estimate of the use of the EI program by claimants compared to the premiums paid. This section examines 2 different ratios: the total benefits-contributions ratio (total B/C ratio) and the regular benefits-contributions ratio (regular B/C ratio) for 2017.Footnote 9 As EI contributions are not assigned to a specific benefit type, the regular B/C ratio accounts for reductions in EI contributions related to special benefits.Footnote 10
This subsection presents adjusted ratios that are normalized, with Canada’s ratio set at 1.0. This provides a benchmark for examining the ratios based on certain sociodemographic characteristics. An adjusted ratio higher than 1.0 means that the underlying sub-population (such as province or territory, industry) is a net beneficiary of the EI program, while those with an adjusted ratio lower than 1.0 are net contributors to the program relative to Canada as a whole.
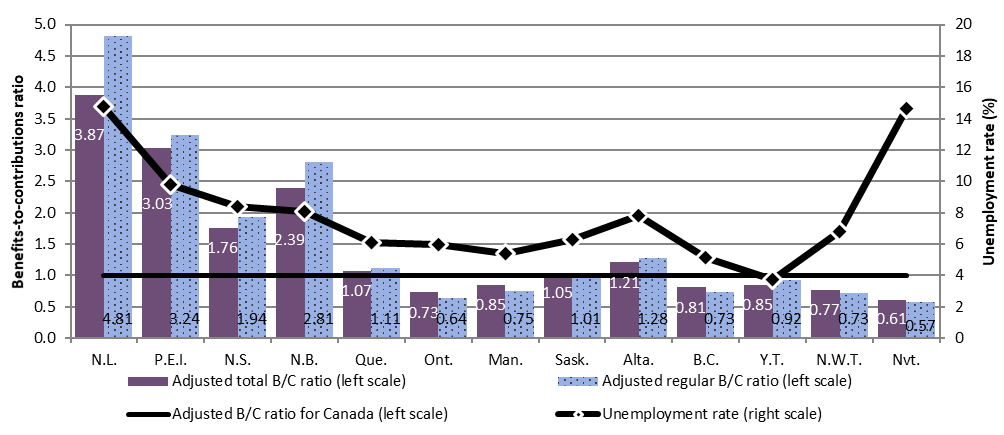
ProvincesFootnote 11 with high numbers of seasonal claimants generally exhibit adjusted total B/C ratios that are above the national average. In 2017, Newfoundland and Labrador, Prince Edward Island, Nova Scotia and New Brunswick received more in EI benefits than they contributed, when compared to the national average (see Chart 3), highlighting these provinces’ greater usage of regular benefits compared to other regions. On the other hand, Ontario, Manitoba, British Columbia and the Territories received fewer EI benefits and regular benefits per dollar contributed in premiums than the national average.
Text description of Chart 3
| Region | Adjusted total benefits-to-contributions ratio (left scale) | Adjusted regular benefits-to-contributions ratio (left scale) | Adjusted total benefits-to-contributions ratio for Canada (1.0) (left scale) | Unemployment rate (right scale) |
|---|---|---|---|---|
| Newfoundland and Labrador | 3.87 | 4.81 | 1.0 | 14.8 |
| Prince Edward Island | 3.03 | 3.24 | 1.0 | 9.8 |
| Nova Scotia | 1.76 | 1.94 | 1.0 | 8.4 |
| New Brunswick | 2.39 | 2.81 | 1.0 | 8.1 |
| Quebec | 1.07 | 1.11 | 1.0 | 6.1 |
| Ontario | 0.73 | 0.64 | 1.0 | 6.0 |
| Manitoba | 0.85 | 0.75 | 1.0 | 5.4 |
| Saskatchewan | 1.05 | 1.01 | 1.0 | 6.3 |
| Alberta | 1.21 | 1.28 | 1.0 | 7.8 |
| British Columbia | 0.81 | 0.73 | 1.0 | 5.2 |
| Yukon | 0.85 | 0.92 | 1.0 | 3.8 |
| Northwest Territories | 0.77 | 0.73 | 1.0 | 6.8 |
| Nunavut | 0.61 | 0.57 | 1.0 | 14.6 |
- Sources: Canada Revenue Agency (CRA), T4 slips with employment income (for data on contributions); Employment and Social Development Canada (ESDC), Employment Insurance (EI) administrative data (for data on benefits); and Statistics Canada, Labour Force Survey, Tables 14-10-0287-01 and 14-10-0292-01 (for data on unemployment rates). CRA data are based on a 10% sample of T4 slips with employment income, and ESDC data are based on a 10% sample of EI administrative data.
In 2017, women continued to receive more in EI benefits than they contributed in premiums compared to male claimants, with adjusted total B/C ratios of 1.03 and 0.97 respectively (see Table 5). Women aged 25 to 44 in particular receive more in benefits than they contribute with an adjusted total B/C ratio of 1.42, compared to women aged 45 to 54 with the lowest ratio (0.65) among women. This is likely due to the fact that women aged 25 to 44 claim maternity and/or parental benefits – their adjusted regular B/C ratio is much lower at 0.65.
| Age category | Adjusted total B/C ratio for men | Adjusted total B/C ratio for women | Adjusted total B/C ratio | Adjusted regular B/C ratio for men | Adjusted regular B/C ratio for women | Adjusted regular B/C ratio |
|---|---|---|---|---|---|---|
| 24 years old and under | 1.26 | 0.84 | 1.08 | 1.55 | 0.50 | 1.09 |
| 25 to 44 years old | 0.90 | 1.42 | 1.13 | 1.13 | 0.65 | 0.92 |
| 45 to 54 years old | 0.89 | 0.65 | 0.78 | 1.15 | 0.78 | 0.98 |
| 55 years old and over | 1.12 | 0.70 | 0.93 | 1.46 | 0.85 | 1.19 |
| Total | 0.97 | 1.03 | 1.00 | 1.23 | 0.71 | 1.00 |
- Sources: Canada Revenue Agency (CRA), T4 slips with employment income (for data on contributions);
- Employment and Social Development Canada (ESDC), Employment Insurance (EI) administrative data (for data on benefits). CRA data are based on a 10% sample of T4 slips with employment income, and ESDC data are based on a 10% sample of EI administrative data.
With respect to regular B/C ratios, the gender gap is reversed: men (ratio of 1.23) received more EI regular benefits than they contributed compared to women (ratio of 0.71). This is true for all age groups.
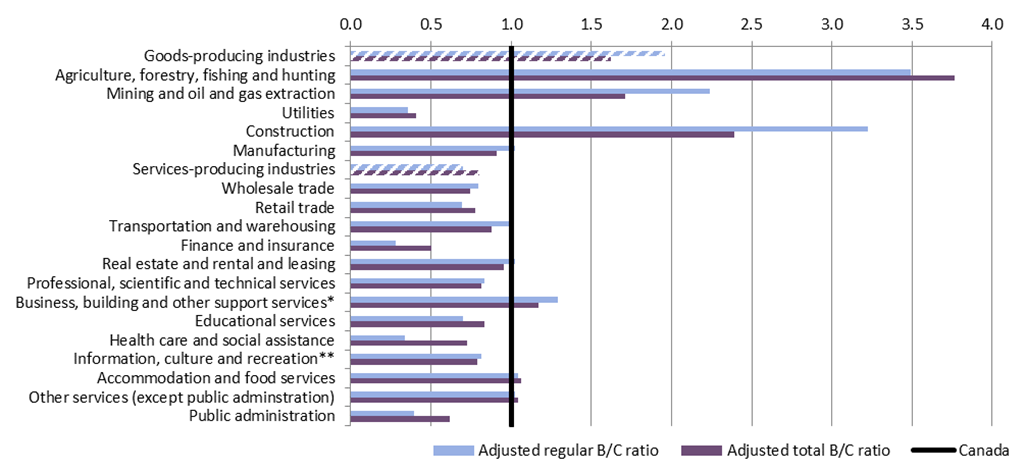
In 2017, claimants working in goods-producing industries were net beneficiaries of EI benefits with adjusted B/C ratios above the national average, while those in service-producing industries were, overall, net contributors (see Chart 4). The greater use of EI regular benefits by workers in goods-producing industries compared to those in service-producing industries may be related to the higher proportion of seasonal employment in these industries, particularly the construction and the agriculture, forestry, fishing and hunting industries. The difference between the adjusted B/C ratios of goods-producing industries compared to those of service-producing industries is smaller for the total B/C ratio. This may be explained in part by the fact that certain industries, such as the health care and social assistance industry and the educational services industry, have a large proportion of female workers who can claim maternity or parental benefits.
Text description of Chart 4
| Industry | Adjusted total benefits-to-contributions ratio | Adjusted regular benefits-to-contributions ratio |
|---|---|---|
| Goods-producing industries | 1.62 | 1.96 |
| Agriculture, forestry, fishing and hunting | 3.76 | 3.49 |
| Mining and oil and gas extraction | 1.71 | 2.24 |
| Utilities | 0.41 | 0.36 |
| Construction | 2.39 | 3.22 |
| Manufacturing | 0.91 | 1.02 |
| Services-producing industries | 0.80 | 0.70 |
| Wholesale trade | 0.75 | 0.79 |
| Retail trade | 0.78 | 0.70 |
| Transportation and warehousing | 0.88 | 0.99 |
| Finance and insurance | 0.50 | 0.28 |
| Real estate and rental and leasing | 0.96 | 1.03 |
| Professional, scientific and technical services | 0.82 | 0.83 |
| Business, building and other support services | 1.17 | 1.29 |
| Educational services | 0.84 | 0.70 |
| Health care and social assistance | 0.73 | 0.34 |
| Information, culture and recreation | 0.79 | 0.82 |
| Accommodation and food services | 1.06 | 1.04 |
| Other services (except public administration) | 1.05 | 1.03 |
| Public administration | 0.62 | 0.40 |
| Canada | 1.00 | 1.00 |
- * Includes management of companies and enterprises and administrative support, waste management and remediation services.
- ** Includes information and cultural industries and arts, entertainment and recreation services.
- Sources: Canada Revenue Agency (CRA), T4 slips with employment income (for data on contributions); Employment and Social Development Canada (ESDC), Employment Insurance (EI) administrative data (for data on benefits). CRA data are based on a 10% sample of T4 slips with employment income, and ESDC data are based on a 10% sample of EI administrative data.
Implicit income redistribution and the Employment Insurance program
Due to differences in income support provided by the EI program across socio-economic sub-populations, the program can act as an implicit income redistribution mechanism in Canada, providing greater income support (relative to contributions) to individuals in the lower part of the income distribution as compared to those with greater earnings. A 2012 evaluation study* showed that the benefit and contribution aspects of the program tend to be redistributive and that the impact of the program on the redistribution of earnings increased substantially during the late 2000s recession.
Moreover, a study on the financial impact of receiving EI benefits** concluded that the EI program has a considerable positive income redistribution effect, with lower income families having a higher adjusted total benefits-to-contributions ratio than higher income families. In fact, families with after-tax incomes below the median received 34% of total EI benefits and paid 18% of all premiums, representing an adjusted total benefits-to-contributions ratio of close to 2.0.
- *Ross Finnie and Ian Irvine, The Redistributional Impact of Employment Insurance 2007 to 2009 (Ottawa: HRSDC, Evaluation Directorate, 2013).
- **Constantine Kapsalis, Financial of Receiving Employment Insurance (Ottawa: Data Probe Economic Consulting Inc., 2010).
2.2 Employment Insurance regular benefits
In this section
- 2.2.1 Employment Insurance regular claims and amount paid
- 2.2.2 Coverage, eligibility and access to Employment Insurance regular benefits for the unemployed population
- 2.2.3 Level of Employment Insurance regular benefits
- 2.2.4 Employment Insurance regular benefit entitlement
- 2.2.5 Employment Insurance regular benefits and seasonal claimants
- 2.2.6 Exhaustion of Employment Insurance regular benefits
- 2.2.7 Working while on claim
2.2.1 Employment Insurance regular claims and amount paid
As shown in Chart 5, the number of new EI regular claims established in FY1819 remained relatively stable at 1.29 million from 1.3 million in FY1718, representing a slight decrease of 0.5%. This decline was largely attributable to the notable decline in new claims established in Quebec (-14,580 claims) and Ontario (-9,510 claims), offsetting the increases in Alberta (+14,690 claims) and Newfoundland and Labrador (+4,510 claims).
Over the same period, the total amount of EI regular benefits paid significantly decreased by 15.6% from $12.6 billion in FY1718 to $10.7 billion in FY1819, which is close to the total amount paid prior to FY1516. This decrease follows a 2 year downward trend in total amount paid, and is attributable in part to many factors, including a continued employment growth, a decrease in the national unemployment rate and the number of beneficiaries receiving EI regular benefits, the conclusion of the extension of EI regular benefits for workers in regions affected by the downturn in commodity prices,Footnote 12 a decrease in the average duration of EI regular weeks paid (-2 weeks) and a lower exhaustion rate.
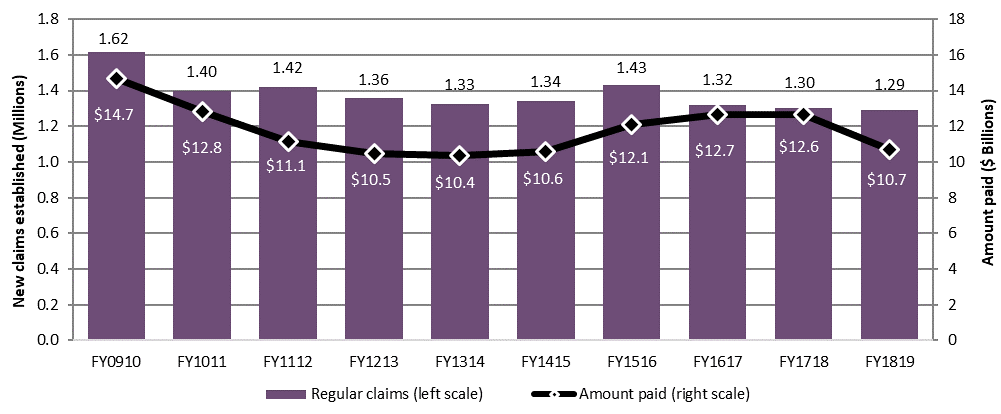
Text description of Chart 5
| Fiscal year | Regular claims (millions) (left scale) | Amount paid ($ billions) (right scale) |
|---|---|---|
| FY0910 | 1.62 | $14.7 |
| FY1011 | 1.40 | $12.8 |
| FY1112 | 1.42 | $11.1 |
| FY1213 | 1.36 | $10.5 |
| FY1314 | 1.33 | $10.4 |
| FY1415 | 1.34 | $10.6 |
| FY1516 | 1.43 | $12.1 |
| FY1617 | 1.32 | $12.7 |
| FY1718 | 1.30 | $12.6 |
| FY1819 | 1.29 | $10.7 |
- Note: Includes claims for which at least $1 of EI regular benefits was paid.
- Source: Employment and Social Development Canada, Employment Insurance (EI) administrative data. Data are based on a 10% sample of EI administrative data.
The number of new claims established tends to be influenced by labour market conditions and overall economic cycles. During periods of economic growth and robust labour market conditions, fewer claims for EI regular benefits are established, while the opposite is true during periods of economic stagnation and unfavourable labour market conditions. This is evident in Chart 5—over the last decade, the number of new claims established was highest at 1.6 million in FY0910 following the recession in FY0809. As discussed in Chapter I, the Canadian economy experienced a moderate growth in FY1819 as GDP increased by 1.7% compared to the previous year, while the labour force increased by 1.1% during the same time period. The national unemployment rate slightly decreased from 6.1% in FY1718 to 5.8% in FY1819 as the number of unemployed individuals moderately declined by 3.9% during the same time period, leading to the corresponding slight decrease in the volume of new claims established for EI regular benefits (-0.5%) in FY1819.
In FY1819, on average, the number of people receiving EI regular benefits each month significantly decreased by 11.4% to 453,400, down from 511,800 in the previous year and continuing the downward trend that began in FY1617.Footnote 13 FY1819 marks the first time since the recession of FY0809 that the number of EI regular beneficiaries has dropped below 500,000.
As the number of monthly beneficiaries is related to the number of new claims established previously, these 2 measures tend to move in similar directions, with the count of monthly beneficiaries usually lagging behind the number of new claims established when there are changes in the average duration of benefits or a sudden and significant increase or decrease in new claims. To illustrate this, suppose there is an increase in the number of claims established for EI regular benefits after an economic shock. The number of monthly beneficiaries will increase following the increase in new claims. However, the count of monthly beneficiaries can still remain elevated even after the volume of new claims established has subsided once the labour market conditions improve, as payments continue to be made on previously established new claims until benefits are exhausted or the claimants have found employment.
Employment Insurance regular claims and amount paid by province or territory, gender and age
As illustrated in Chart 6, on a year-over-year basis, 7 out of 13 provinces and territories experienced a decline in the number of new claims established for EI regular benefits, including Northwest Territories (-10.2% or -180 claims), Prince Edward Island (-5.4% or -890 claims), Quebec (-3.7% or -14,580 claims), Nova Scotia (-3.3% or-2,080 claims), New Brunswick (-3.2% or -2,290 claims), Ontario (-2.5% or -9,510 claims) and British Columbia (-1.3% or -1,550 claims). These decreases partly offset the significant increases in Prairies provinces.
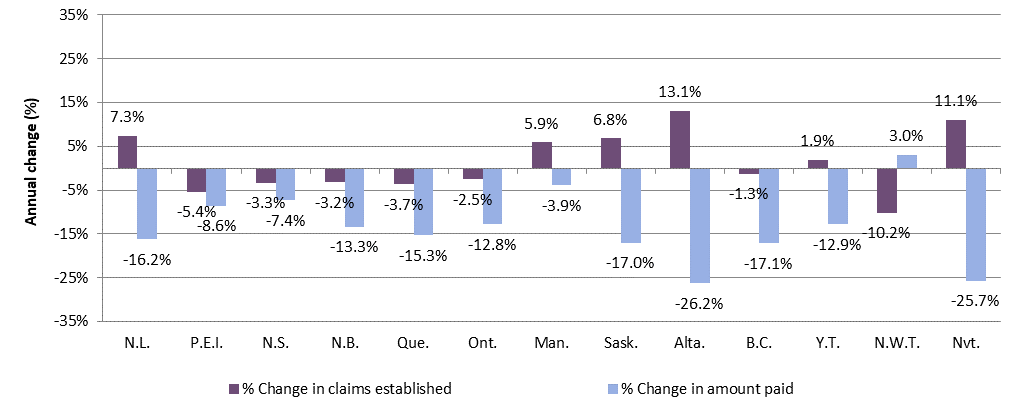
Text description of Chart 6
| Province/territory | % Change claims established | % Change amount paid |
|---|---|---|
| British Columbia | -1.3% | -17.1% |
| Alberta | 13.1% | -26.2% |
| Saskatchewan | 6.8% | -17.0% |
| Manitoba | 5.9% | -3.9% |
| Ontario | -2.5% | -12.8% |
| Quebec | -3.7% | -15.3% |
| New Brunswick | -3.2% | -13.3% |
| Nova Scotia | -3.3% | -7.4% |
| Prince Edward Island | -5.4% | -8.6% |
| Newfoundland and Labrador | 7.3% | -16.2% |
| Yukon | 1.9% | -12.9% |
| Northwestern Territories | -10.2% | -10.2% |
| Nunavut | 11.1% | -25.7% |
- Note: Includes claims for which at least $1 of EI regular benefits was paid.
- Source: Employment and Social Development Canada, Employment Insurance (EI) administrative data. Data are based on a 10% sample of EI administrative data.
In terms of the total EI regular benefits paid in FY1819, it decreased in all provinces and territories (see Chart 6) except in the Northwest Territories as compared to the previous year. The largest percentage decreases in the amount of EI regular benefits paid were observed in Alberta (-26.2%), followed by Nunavut (-25.7%), British Columbia (-17.1%), and Saskatchewan (-17.0%).Footnote 14 The percentage decreases in terms of EI regular benefits payments in Ontario and Quebec were lower than the national percentage decrease, and these 2 provinces continued to account for half (50.2%) of the total of all EI regular benefits paid in FY1819.
Table 6 outlines the number of new EI regular claims established and the total amount paid by gender and age groups. The number of new claims established by men remained relatively stable, while new claims established by women decreased slightly in the reporting period compared to the previous year (+0.3% and -1.8%, respectively). The share of claims established by gender remained stable year-over-year.
In terms of the total amount paid in EI regular benefits, the share of benefits paid to both men and women remained stable in FY1819 compared to the previous year, men accounted for 66.0% and women 34.0% of the total benefits paid.
| Category | Number of claims FY1718 |
Number of claims FY1819 |
Number of claims change (%) |
Amount paid ($ millions) FY1718 |
Amount paid ($ millions) FY1819 |
Amount paid ($ millions) change (%) |
|---|---|---|---|---|---|---|
| Men | 788,880 | 791,220 | +0.3% | $8,359.3 | $7,072.5 | -15.4% |
| Women | 510,830 | 501,490 | -1.8% | $4,281.2 | $3,601.3 | -15.9% |
| 24 years old and under | 118,750 | 113,780 | -4.2% | $1,076.1 | $922.7 | -14.3% |
| 25 to 44 years old | 571,930 | 568,800 | -0.5% | $5,449.7 | $4,585.2 | -15.9% |
| 45 to 54 years old | 289,420 | 278,900 | -3.6% | $2,876.7 | $2,335.9 | -18.8% |
| 55 years old and over | 319,610 | 331,230 | +3.6% | $3,238.0 | $2,830.0 | -12.6% |
| Canada | 1,299,710 | 1,292,710 | -0.5% | $12,640.5 | $10,673.8 | -15.6% |
- Note: Data may not add up to the total due to rounding. Percentage change is based on unrounded numbers. Includes claims for which at least $1 of EI regular benefits was paid.
- Source: Employment and Social Development Canada, Employment Insurance (EI) administrative data. Data are based on a 10% sample of EI administrative data.
The number of new EI regular claims established decreased for all age groups, except individuals aged 55 years old and over, while at the same time the total amount paid for all age groups decreased during the reporting period compared to the previous year. Like in the previous year, claimants who were between 25 and 44 years old continued to account for the largest shares of new regular claims and total amount paid in FY1819, while the smallest shares were for younger claimants aged less than 25 years.
One notable trend that has been observed over the past few years is that, while the shares of new claims established by different age groups has been relatively stable, the share of new claims established by older claimants aged 55 years and over has increased slowly but steadily over the past several years. The trends observed for older claimants are likely attributable in part to Canada’s aging population and the labour force composition. Individuals in this age category accounted for 21.4% of the labour force in FY1819, up from 21.1% in FY1718 (+0.3 percentage points).Footnote 15
Employment Insurance regular claims and amount paid by industry
As outlined in Table 7, there is a slight increase in the number of new claims established for EI regular benefits for the goods-producing industries (+3,120 claims or +0.6%), while for the service producing industries the number of new claims remained stable. Among the goods-producing industries, the Construction industry accounted for more than half (57.9%) of all new claims established, and had an increase of +1.3% compared to the previous year. On the other hand, the largest relative increase was observed in the Mining and oil and gas extraction industry where the number of new claims increased by 17.1%. Among the services-producing industries, the Educational services industry accounted for the largest share of claims in FY1819 (21.3%). On a year-over-year basis, the largest percentage decrease in the number of new claims established in the services-producing sector was observed for the Finance and insurance industry (-15.9%), while the largest increase was for both Transportation and warehousing, and Other services (excluding Public administration) industry, with 4.1% increase for both.
| Industry | Number of claims (% share of all claims) FY1718 |
Number of claims (% share of all claims) FY1819 |
Number of claims change (%) |
Amount paid - $ millions (% share of total amount paid) FY1718 |
Amount paid - $ millions (% share of total amount paid) FY1819 |
Amount paid - $ millions change (%) |
|---|---|---|---|---|---|---|
| Goods-producing industries | 502,080 (38.6%) | 505,200 (39.1%) | +0.6% | $5,343.6 (42.3%) | $4,473.4 (41.9%) | -16.3% |
| Agriculture, forestry, fishing and hunting | 53,760 (4.1%) | 52,440 (4.1%) | -2.5% | $578.2 (4.6%) | $496.8 (4.7%) | -14.1% |
| Mining and oil and gas extraction | 21,340 (1.6%) | 24,980 (1.9%) | +17.1% | $310.0 (2.5%) | $274.2 (2.6) | -11.5% |
| Utilities | 4,150 (0.3%) | 4,150 (0.3%) | 0.0% | $48.2 (0.4%) | $36.4 (0.3) | -24.6% |
| Construction | 288,870 (22.2%) | 292,720 (22.6%) | +1.3% | $3,113.4 (24.6%) | $2,640.3 (24.7) | -15.2% |
| Manufacturing | 133,960 (10.3%) | 130,910 (10.1%) | -2.3% | $1,293.7 (10.2%) | $1,025.7 (9.6%) | -20.7% |
| Services-producing industries | 764,150 (58.8%) | 764,220 (59.1%) | 0.0% | $6,998.6 (55.4%) | $5,995.6 (56.2%) | -14.3% |
| Wholesale trade | 39,790 (3.1%) | 38,920 (3.0%) | -2.2% | $492.3 (3.9%) | $402.6 (3.8%) | -18.2% |
| Retail trade | 79,090 (6.1%) | 69,330 (5.4%) | -12.3% | $763.4 (6.0%) | $620.9 (5.8%) | -18.7% |
| Transportation and warehousing | 60,190 (4.6%) | 62,640 (4.8%) | +4.1% | $533.3 (4.2%) | $466.0 (4.4%) | -12.6% |
| Finance and insurance | 15,020 (1.2%) | 12,630 (1.0%) | -15.9% | $193.9 (1.5%) | $155.0 (1.5%) | -20.0% |
| Real estate, rental and leasing | 17,720 (1.4%) | 18,270 (1.4%) | +3.1% | $207.3 (1.6%) | $175.4 (1.6%) | -15.4% |
| Professional, scientific and technical services | 52,690 (4.1%) | 50,950 (3.9%) | -3.3% | $601.1 (4.8%) | $479.4 (4.5%) | -20.2% |
| Business, building and other support services* | 86,380 (6.6%) | 88,130 (6.8%) | +2.0% | $871.4 (6.9%) | $768.8 (7.2%) | -11.8% |
| Educational services | 157,110 (12.1%) | 163,030 (12.6%) | +3.8% | $850.0 (6.7%) | $774.6 (7.3%) | -8.9% |
| Health care and social assistance | 46,590 (3.6%) | 45,870 (3.5%) | -1.5% | $424.0 (3.4%) | $349.6 (3.3%) | -17.5% |
| Information, culture and recreation** | 39,080 (3.0%) | 40,250 (3.1%) | +3.0% | $377.7 (3.0%) | $324.7 (3.0%) | -14.0% |
| Accommodation and food services | 63,840 (4.9%) | 63,280 (4.9%) | -0.9% | $559.9 (4.4%) | $487.2 (4.6%) | -13.0% |
| Other services (excluding Public administration) | 40,340 (3.1%) | 42,010 (3.2%) | +4.1% | $421.5 (3.3%) | $371.7 (3.5%) | -11.8% |
| Public administration | 66,310 (5.1%) | 68,910 (5.3%) | +3.9% | $702.7 (5.6%) | $619.7 (5.8%) | -11.8% |
| Unclassified*** | 33,480 (2.6%) | 23,290 (1.8%) | -30.4% | $298.4 (2.4%) | $204.8 (1.9%) | -31.4% |
| Canada | 1,299,710 (100.0%) | 1,292,710 (100.0%) | -0.5% | $12,640.5 (100.0%) | $10,673.8 (100.0%) | -15.6% |
- Note: Data may not add up to the total due to rounding. Percentage change is based on unrounded numbers. Includes claims for which at least $1 of EI regular benefits was paid.
- * This industry sector comprises the industries with codes 55 (Management of companies and enterprises) and 56 (Administration and support, waste management and remediation services).
- ** This industry sector comprises the industries with codes 51 (Information and cultural industries) and 71 (Arts, entertainment and recreation).
- *** For some claims, this information was not available in the data.
- Source: Employment and Social Development Canada, Employment Insurance (EI) administrative data. Data are based on a 10% sample of EI administrative data.
The total amount of benefits paid to claimants in both the goods-producing sector and the services-producing sector decreased by $870.2 million (-16.3%) and $1,003 million (-14.3%), respectively, in the reporting period compared to the previous year. The decline in the total amount paid to claimants in the goods-producing industries was mainly attributable to the large decrease in the Construction industry (-$473.1 million or -15.2%) and in the Manufacturing industry (-$268.1 million or -20.7%). As for the services-producing sector, the decrease in total amount paid was in most part driven by the declines in the Retail trade industry (-$142.5 million or -18.7%), the Professional, scientific and technical services industry (-$121.7 million or -20.2%), and the Business, building and other support services industry (-$102.6 million or -11.8%).
Benefit repayments in the 2017 tax year*
EI benefit payments are taxable income, regardless of the type of benefits. In accordance with the Employment Insurance Act, claimants must repay a percentage of EI benefits they have received if their net income** in a given year exceeds 1.25 times the maximum yearly insurable earnings. In the 2017 taxation year, claimants whose net income exceeded $64,125*** were required to repay 30% of the lesser of:
- the net income in excess of $64,125
- the total regular benefits, including regular fishing benefits, paid in the taxation year
However, claimants who received special benefits or less than 1 week of either regular or fishing benefits in the preceding 10 taxation years were exempt from the benefit repayment requirement.
In the 2017 taxation year, around 189,200 EI claimants repaid a total of $285.5 million in EI benefits. On average, each EI claimant subject to the benefit repayment provision repaid $1,509 in 2017, while they received $6,373 in EI benefits in the same year. Compared to the previous year, the increases in both the number of claimants who repaid benefits (+19,900 or +11.8%) and the total amount repaid (+$34.9 million or + 13.9%) were substantial in 2017. However, the average amount of benefit repaid (+$29 or +1.9%) and the average benefit received (-$8 or -0.1%) by these EI claimants remained relatively unchanged in 2017 compared to 2016.
In 2017, 2 out of 3 (66.7%) claimants who repaid benefits lived in Quebec, Ontario and Alberta. Together, these claimants accounted for 58.4% of the total amount repaid in EI benefits. In comparison, Atlantic provinces represented 16.3% of the total number of claimants who repaid benefits, accounting for 25.7% of the total amount repaid.
Benefit repayments also vary by industry. In 2017, around two-thirds (66.5%) of claimants who repaid benefits had worked in the goods-producing industries, unchanged from 2016. These claimants accounted for 67.2% of the total amount repaid. On the other hand, services-producing industries accounted for 28.9% claimants who repaid benefits and 29.7% of total amount repaid. These proportions have remained stable since 2011.
- * The most recent taxation year for which data are available is 2017.
- ** Net income includes employment income and EI benefits received during the taxation year.
- *** The maximum insurable earnings in 2017 was $51,300.
Employment Insurance regular benefits and firms
According to the 2017 tax dataFootnote 16 available from the Canada Revenue Agency (CRA), the number of firms operating in Canada slightly increased (+1.0%) compared to 2016. Among the 1.21 million of firms, 309,100 (representing 25.5% of all firms) employed at least 1 employee who had received EI regular benefits.
Table 8 outlines the number of firms, employment and EI regular claimants by sizeFootnote 17 of firms. The proportion of firms which employed at least 1 employee receiving EI regular benefits varied widely by firm size, with smaller firms being less likely to be the last employer of a claimant. For example, 20.0% of small-sized firms in 2017 had at least 1 former employee who received EI regular benefits, compared to 74.3% of small-to-medium sized firms, 95.1% of medium-to-large sized firms and 99.4%of large-sized firms.
However, when the number of claimants for EI regular benefits is compared with distribution of workforce by firm size, employees from smaller firms are found to be over-represented among EI regular claimants. As shown in Table 8, smaller firms accounted for 21.5% of the total workforce while they represented 26.6% of the total EI regular benefit claimants in 2017. Similarly, employees in the small-to-medium sized firms were also over-represented among EI regular claimants—these firms accounted for 19.8% of the total employees and 24.3% of the total EI regular claimants. This gap between the share of employment and the share of EI regular claimants narrows for the medium-to-large sized firms. For the large-sized firms, however, the opposite was observed—these firms represented 42.6% of the total workforce in Canada in 2017 but accounted for only 31.6% of the total EI regular claimants. The higher proportion of usage of EI regular benefits among employees in the smaller-sized firms suggest that smaller firms are more vulnerable to difficult business or economic conditions than larger firms, and need to make broader adjustments to their workforces, resulting in a larger share of their employees claiming EI regular benefits as a result of layoffs. Moreover, this trend can also be influenced by industry-related characteristics such as the greater prevalence of seasonal jobs in small-sized firms that are generally more likely to rely on EI, relative to the national average in some industries.Footnote 18
| Firm size | Number of all firms | Number of firms with at least 1 employee receiving EI regular benefits | Employment distribution** (% share) |
EI claimant distribution*** (% share) |
|---|---|---|---|---|
| Small | 1,096,760 | 219,460 | 21.5% | 26.6% |
| Small-medium | 95,710 | 71,080 | 19.8% | 24.3% |
| Medium-large | 16,120 | 15,340 | 16.1% | 17.5% |
| Large | 3,240 | 3,220 | 42.6% | 31.6% |
| Canada | 1,211,830 | 309,090 | 100.0% | 100.0% |
- Note: Data may not add up due to rounding.
- * The categories of firm size reflect those found in Business Dynamics in Canada, a Statistics Canada publication. Small-sized firms are defined as those that employ 1 to 19 employees. Small-to-medium sized firms employ 20 to 99 employees. Medium-to-large sized firms employ 100 to 499 employees. Large-sized firms employ 500 employees or more.
- ** The number of workers in a firm is the number of individuals with employment income in that firm, as indicated on a T4 form. The number of workers is adjusted so that each individual in the labour force is only counted once and individuals who work for more than 1 firm are taken into account. For example, if an employee that earned $25,000 in firm 1 and $25,000 in firm 2, then he or she was recorded as 0.5 employees at the first firm and 0.5 employees at the second firm.
- *** These are based on the number of people receiving EI regular benefits in 2017.
- Source: Employment and Social Development Canada, Employment Insurance (EI) administrative data. Data are based on a 100% sample of EI administrative data. Canada Revenue Agency, CRA administrative data. CRA data are based on a 100% sample.
Employment Insurance regular claims and amount paid by EI claimant category
Table 9 outlines the number of new claims established for EI regular benefits and total amount paid by EI claimant category.Footnote 19 In FY1819, both the number of new claims established by and the total amount paid to long-tenured workers decreased by 5.0% and 26.2%, respectively, compared to the previous year. On the other hand, the number of new claims established by occasional claimants remained relatively unchanged (+0.2%) in FY1819, while the total amount paid decreased by 12.2% compared to the previous year. Lastly, the number of new claims established by frequent claimants had a moderate increase (+2.5%) in the reporting period; while the total amount paid to the claimants in this category fell by 10.7% from FY1718.
In FY1819, long-tenured workers accounted for 22.8% of all new regular claims established while they received 23.1% of the total amount paid. Occasional claimants, on the other hand, proportionally benefited less—they accounted for 54.2% of all new claims established in FY1819 but received 51.6% of the total amount paid. Frequent claimants accounted for 23.0% of total new regular claims in the reporting year and received 25.3% of the total amount paid.
| Claimant category | Number of claims (% share of all EI regular claims) FY1718 |
Number of claims (% share of all EI regular claims) FY1819 |
Number of claims change (%) |
Amount paid - $ millions (% share of total amount paid for EI regular benefits) FY1718 |
Amount paid – $ millions (% share of total amount paid for EI regular benefits) FY1819 |
Amount paid - $ millions change (%) |
|---|---|---|---|---|---|---|
| Long-tenured workers | 310,270 (23.9%) | 294,820 (22.8%) | -5.0% | $3,343.6 (26.5%) | $2,467.4 (23.1%) | -26.2% |
| Occasional claimants | 699,370 (53.8%) | 700,580 (54.2%) | +0.2% | $6,272.5 (49.6%) | $5,505.2 (51.6%) | -12.2% |
| Frequent claimants | 290,070 (22.3%) | 297,310 (23.0%) | +2.5% | $3,024.4 (23.9%) | $2,701.2 (25.3%) | -10.7% |
| Canada | 1,299,710 (100.0%) | 1,292,710 (100.0%) | -0.5% | $12,640.5 (100.0%) | $10,673.8 (100.0%) | -15.6% |
- Note: Data may not add up to the total due to rounding. Percentage change is based on unrounded numbers. Includes claims for which at least $1 of EI regular benefits was paid.
- * See Annex 2.1 for definitions of EI claimant categories referenced in this table.
- Source: Employment and Social Development Canada, Employment Insurance (EI) administrative data. Data are based on a 10% sample of EI administrative data.
Chart 7 and Chart 8 show the share of new EI regular claims established and the share of total amount paid by claimant categories from FY1011 to FY1819.
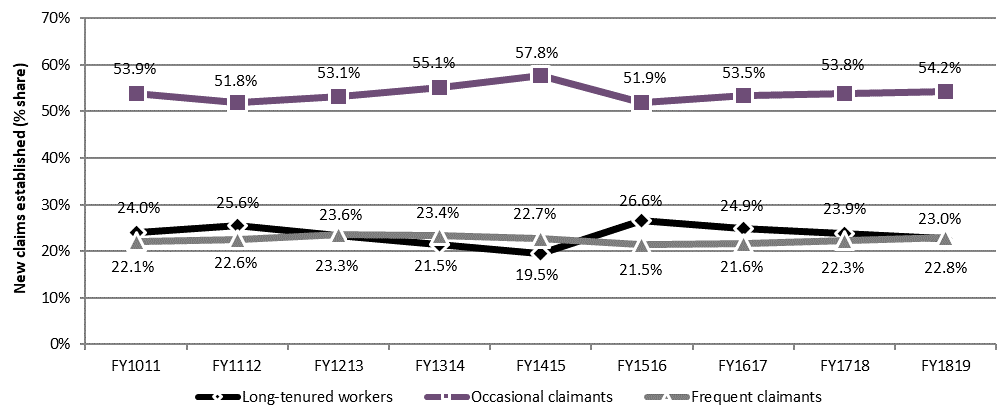
Text description of Chart 7
| Claimants | FY1011 | FY1112 | FY1213 | FY1314 | FY1415 | FY1516 | FY1617 | FY1718 | FY1819 |
|---|---|---|---|---|---|---|---|---|---|
| Long-tenured workers | 24.0% | 25.6% | 23.3% | 21.5% | 19.5% | 26.6% | 24.9% | 23.9% | 22.8% |
| Occasional claimants | 53.9% | 51.8% | 53.1% | 55.1% | 57.8% | 51.9% | 53.5% | 53.8% | 54.2% |
| Frequent claimants | 22.1% | 22.6% | 23.6% | 23.4% | 22.7% | 21.5% | 21.6% | 22.3% | 23.0% |
- Note: Includes claims for which at least $1 of EI regular benefits was paid.
- Source: Employment and Social Development Canada, Employment Insurance (EI) administrative data. Data are based on a 10% sample of EI administrative data.
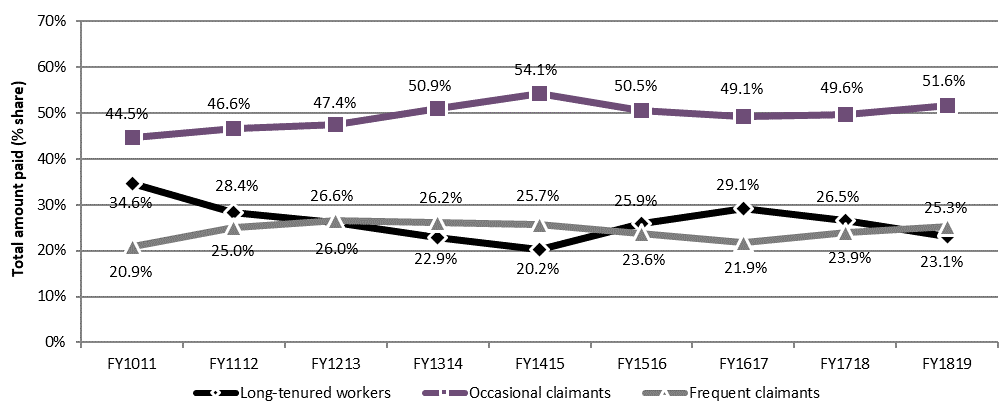
Text description of Chart 8
| Claimants | FY1011 | FY1112 | FY1213 | FY1314 | FY1415 | FY1516 | FY1617 | FY1718 | FY1819 |
|---|---|---|---|---|---|---|---|---|---|
| Long-tenured workers | 34.6% | 28.4% | 26.0% | 22.9% | 20.2% | 25.9% | 29.1% | 26.5% | 23.1% |
| Occasional claimants | 44.5% | 46.6% | 47.4% | 50.9% | 54.1% | 50.5% | 49.1% | 49.6% | 51.6% |
| Frequent claimants | 20.9% | 25.0% | 26.6% | 26.2% | 25.7% | 23.6% | 21.9% | 23.9% | 25.3% |
- Note: Includes claims for which at least $1 of EI regular benefits was paid.
- Source: Employment and Social Development Canada, Employment Insurance (EI) administrative data. Data are based on a 10% sample of EI administrative data.
Employment Insurance regular claims by hours of insurable employment and unemployment rate in the Employment Insurance economic region of establishment
One of the eligibility conditions for EI regular benefits is the accumulation of enough hours of insurable employment during the qualifying period. The number of required hours depends on the unemployment rate in the EI economic region where the claimant resides and is known as the Variable Entrance Requirement (VER). The higher the unemployment rate in a given region, the lower the number of hours needed to qualify for EI regular benefits (see Annex 2.2 for the full breakdown of required number of hours of insurable employment with corresponding regional rate of unemployment). A detailed discussion is provided in subsection 2.2.2 on eligiblity and access to EI regular benefits.
Variable entrance requirement
In order to qualify for EI regular benefits, a worker must accumulate between 420 and 700 hours of insurable employment in the qualifying period, depending on the applicable regional rate of unemployment where the claimant resides. As outlined below, a higher regional unemployment rate corresponds to a lower required number of hours of insurable employment.
| EI regional unemployment rate | Variable entrance requirement |
|---|---|
| 6.0% and under | 700 hours |
| 6.1% to 7.0% | 665 hours |
| 7.1% to 8.0% | 630 hours |
| 8.1% to 9.0% | 595 hours |
| 9.1% to 10.0% | 560 hours |
| 10.1% to 11.0% | 525 hours |
| 11.1% to 12.0% | 490 hours |
| 12.1% to 13.0% | 455 hours |
| More than 13.0% | 420 hours |
Table 10 outlines the distribution of EI regular claims for the past 5 years by the number of hours of insurable employment used to qualify for EI regular benefits. Consistent with previous years, claimants who accumulated more than 1,820 hours of insurable employment accounted for the largest share (25.0%) of total new EI regular claims established in FY1819. This was relatively unchanged from the previous year. On the other hand, claimants with less than 700 hours of insurable employment represented the smallest share (4.7%), decreasing by 0.4 percentage points compared to the previous year. All of the categories shown in Table 10 experienced a change in their share in FY1819 that was less than 1.0 percentage point compared to the previous year.
| Number of hours of insurable employment in the qualifying period | FY1415 | FY1516 | FY1617 | FY1718 | FY1819 |
|---|---|---|---|---|---|
| Less than 700 hours | 64,390 (4.8%) | 67,170 (4.7%) | 76,340 (5.8%) | 66,150 (5.1%) | 60,150 (4.7%) |
| 700 to 979 hours | 203,690 (15.2%) | 207,610 (14.5%) | 216,650 (16.4%) | 215,600 (16.6%) | 212,640 (16.4%) |
| 980 to 1,259 hours | 256,210 (19.1%) | 264,500 (18.5%) | 242,610 (18.4%) | 234,850 (18.1%) | 239,650 (18.5%) |
| 1,260 to 1,539 hours | 245,530 (18.3%) | 260,870 (18.2%) | 239,030 (18.1%) | 239,600 (18.4%) | 243,490 (18.8%) |
| 1,540 to 1,819 hours | 218,840 (16.3%) | 235,120 (16.4%) | 207,440 (15.7%) | 211,880 (16.3%) | 213,480 (16.5%) |
| 1,820 hours and more | 353,950 (26.4%) | 395,820 (27.7%) | 339,060 (25.7%) | 331,630 (25.5%) | 323,300 (25.0%) |
| Canada | 1,342,610 (100.0%) | 1,431,090 (100.0%) | 1,321,130 (100.0%) | 1,299,710 (100.0%) | 1,292,710 (100.0%) |
- Note: Data may not add up to the total due to rounding. Includes claims for which at least $1 of EI regular benefits was paid.
- Source: Employment and Social Development Canada, Employment Insurance (EI) administrative data. Data are based on a 10% sample of EI administrative data.
Chart 9 shows the average number of hours of insurable employment per claim receiving EI regular benefits from FY1011 to FY1819 by gender. In the reporting period, on average in Canada, claimants had accumulated 1,371 hours of insurable employment during their qualifying period, up from 1,369 hours in FY1718. The difference between the average number of hours of insurable employment for men and women has stayed around 60 hours over the years. In FY1819, men on average had 63 more hours of insurable employment than women. This can be attributable to the fact that a higher proportion of women work in part-time and/or temporary jobs than men, and thus accumulate fewer hours of insurable employment on average.
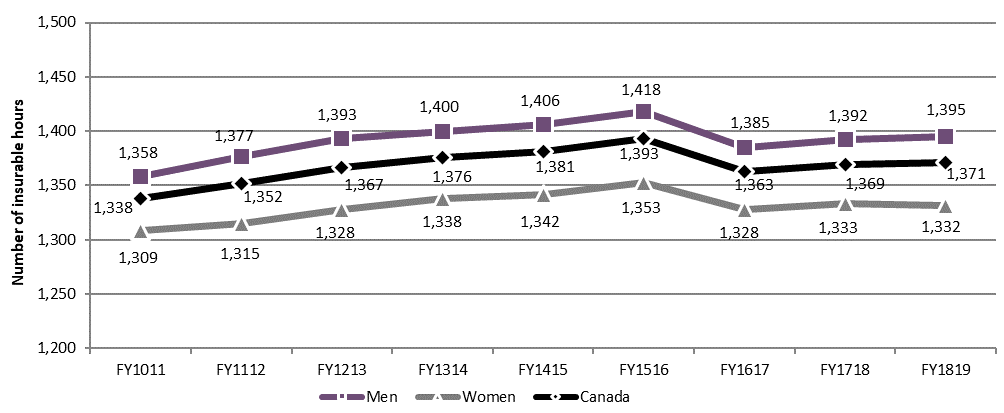
Text description of Chart 9
| Claimants | FY1011 | FY1112 | FY1213 | FY1314 | FY1415 | FY1516 | FY1617 | FY1718 | FY1819 |
|---|---|---|---|---|---|---|---|---|---|
| Men | 1,358 | 1,377 | 1,393 | 1,400 | 1,406 | 1,418 | 1,385 | 1,392 | 1,395 |
| Women | 1,309 | 1,315 | 1,328 | 1,338 | 1,342 | 1,353 | 1,328 | 1,333 | 1,332 |
| Canada | 1,338 | 1,352 | 1,367 | 1,376 | 1,381 | 1,393 | 1,363 | 1,369 | 1,371 |
- Note: Includes claims for which at least $1 of EI regular benefits was paid.
- Source: Employment and Social Development Canada, Employment Insurance (EI) administrative data. Data are based on a 10% sample of EI administrative data.
In FY1819, claimants who were aged between 25 and 44 years accumulated the highest number of hours of insurable employment during their qualifying period (1,406 hours), followed by those who were 45 to 54 years old (1,395 hours). Older claimants (that is, 55 years old and above), on the other hand, accumulated the lowest number of hours of insurable employment (1,308 hours) in FY1819, closely followed by younger claimants aged less than 25 years (1,315 hours).
Furthermore, the average number of hours of insurable employment per claim during the qualifying period in FY1819 varied by province and territory as well. Generally, the number of hours of insurable employment per claim in the Atlantic provinces and the territories tend to be lower than other regions. This trend continued in the reporting period—the lowest average hours of insurable employment per claim among all provinces and territories was observed in Newfoundland and Labrador (1,126 hours), followed by Nunavut (1,180 hours), Prince Edward Island (1,182 hours) and New Brunswick (1,236 hours). On the other hand, the highest average hours of insurable employment per claim in FY1819 was observed in Alberta (1,462 hours), followed by Ontario (1,436 hours) and British Columbia (1,403 hours).
Table 11 outlines the number and distribution of new claims established for EI regular benefits as well as the labour force and the unemployed population by regional unemployment rate. The share of new regular claims established in EI economic regions where the unemployment rate was between 0.1% and 7.0% was higher (+80,450 claims) in FY1819 compared to previous fiscal years. This increase can be mainly attributable to the increase in the number of EI regular claims established in EI economic regions of Alberta (+71,990 claims) and Newfoundland and Labrador (+ 15,080 claims) where the unemployment rate thresholds were less than or equal to 7%. Table 11 also shows that, in FY1819, EI regular claims established and the unemployed population were similarly spread across regional unemployment rate categories.
| Unemployment rate | EI regular claims established (,000) (% share of total claims) FY1415 |
EI regular claims established (,000) (% share of total claims) FY1516 |
EI regular claims established (,000) (% share of total claims) FY1617 |
EI regular claims established (,000) (% share of total claims) FY1718 |
EI regular claims established (,000) (% share of total claims) FY1819 |
Labour force (,000) (% share of labour force) FY1819 |
Number of unemployed (,000) (% share of unemployed) FY1819 |
|---|---|---|---|---|---|---|---|
| 0.1% to 6% | 273.4 (20.4%) | 218.0 (15.2%) | 171.4 (13.0%) | 384.2 (29.6%) | 411.2 (31.8%) | 8,222.6 (40.9%) | 411.7 (31.9%) |
| 6.1% to 7% | 158.1 (11.8%) | 363.7 (25.4%) | 363.2 (27.5%) | 425.6 (32.7%) | 479.0 (37.1%) | 8,389.4 (41.7%) | 533.4 (41.3%) |
| 7.1% to 8% | 329.9 (24.6%) | 279.0 (19.5%) | 299.0 (22.6%) | 134.8 (10.4%) | 129.4 (10.0%) | 1,735.0 (8.6%) | 129.1 (10.0%) |
| 8.1% to 9% | 236.5 (17.6%) | 216.3 (15.1%) | 169.3 (12.8%) | 110.9 (8.5%) | 40.8 (3.2%) | 527.7 (2.6%) | 43.8 (3.4%) |
| 9.1% to 10% | 78.5 (5.8%) | 75.7 (5.3%) | 65.5 (5.0%) | 31.7 (2.4%) | 13.9 (1.1%) | 175.9 (0.9%) | 16.7 (1.3%) |
| 10.1% to 11% | 56.0 (4.2%) | 50.4 (3.5%) | 35.4 (2.7%) | 8.0 (0.6%) | 37.0 (2.9%) | 378.6 (1.9%) | 40.2 (3.1%) |
| 11.1% to 12% | 44.4 (3.3%) | 16.7 (1.2%) | 21.4 (1.6%) | 60.1 (4.6%) | 49.0 (3.8%) | 174.6 (0.9%) | 20.0 (1.5%) |
| 12.1% to 13% | 7.7 (0.6%) | 43.9 (3.1%) | 35.3 (2.7%) | 13.4 (1.0%) | 4.1 (0.3%) | 32.7 (0.2%) | 4.2 (0.3%) |
| 13.1% to 14% | 0.5 (0.0%) | 16.9 (1.2%) | 11.4 (0.9%) | 28.2 (2.2%) | 7.0 (0.5%) | 28.8 (0.1%) | 3.8 (0.3%) |
| 14.1% to 15% | 25.9 (1.9%) | 23.7 (1.7%) | 38.2 (2.9%) | 24.0 (1.8%) | 17.9 (1.4%) | 58.0 (0.3%) | 8.6 (0.7%) |
| 15.1% to 16% | 25.1 (1.9%) | 32.0 (2.2%) | 25.4 (1.9%) | 10.3 (0.8%) | 25.0 (1.9%) | 75.7 (0.4%) | 11.8 (0.9%) |
| 16% or higher | 107.0 (8.0%) | 94.8 (6.6%) | 85.8 (6.5%) | 68.6 (5.3%) | 78.6 (6.1%) | 319.7 (1.6%) | 69.0 (5.3%) |
| Canada | 1,342.6 (100.0%) | 1,431.1 (100.0%) | 1,321.1 (100.0%) | 1,299.7 (100.0%) | 1,292.7 (100.0%) | 20,118.6 (100.0%) | 1,292.3 (100.0%) |
- Note: Data may not add up to the total due to rounding. Includes claims for which at least $1 of EI regular benefits was paid.
- * Unemployment rates used for the Employment Insurance program are a moving average of seasonally adjusted rates of unemployment produced by Statistics Canada, as per section 17 of the Employment Insurance Regulations.
- Source: Employment and Social Development Canada, Employment Insurance (EI) administrative data and Statistics Canada, special tabulations from the Labour Force Survey. EI data are based on a 10% sample of EI administrative data.
Claimant obligations to search for and accept suitable employment
Under the Employment Insurance Act, claimants for EI regular benefits must generally be capable of and available for suitable employment and must demonstrate this by searching for and taking advantage of an opportunity for suitable employment in order to receive EI regular benefits.
As specified under section 27 of the Employment Insurance Act, a claimant is disqualified from receiving EI regular benefits in cases where he/she does not apply for suitable employment after becoming aware it is vacant, or fails to accept the employment after it being offered; has not taken advantage of an opportunity for suitable employment; or has not followed written direction by the Canada Employment Insurance Commission given to assist the claimant in finding suitable employment.
The Government made legislative and regulatory changes in July 2016 to simplify job search responsibilities for claimants of EI regular benefitsFootnote 20
Before the legislative change in July 2016, the Connecting Canadians with Available Jobs (CCAJ) initiative that started on January 6, 2013 was in effect. A departmental evaluation reportFootnote 21 found that the number of disqualifications or disentitlements due to inadequate job searches or failing to accept suitable jobs increased, but remained low relative to the total number of disqualifications and disentitlements during the period in which CCAJ was in effect (January 2013 to July 2016), indicating enhanced and more efficient monitoring of claimants by Service Canada. These conditions should be considered when comparing the results presented in Table 12.
Table 12 outlines the number of disqualifications and disentitlements related to refusal and failure to search for work in the past 5 years. In FY1819, there were a total of 1,430 disqualifications and disentitlements related to failure to search for work, compared to 1,730 incidents in the previous year. On the other hand, there were a total of 170 disqualifications and disentitlements related to refusal of suitable work in FY1819, compared to 130 incidents in the previous year. However, these 2 factors represent only a fraction (0.1%) of all disqualifications and disentitlements in FY1819, and do not take into consideration that benefits would generally have been reinstated in some situations once the claimants demonstrated that they were fulfilling their responsibilities.
| Type of disqualification or disentitlement | FY1415 | FY1516 | FY1617 | FY1718 | FY1819 | Change (%) FY1718 to FY1819 |
|---|---|---|---|---|---|---|
| Refusal of suitable work | 190 | 180 | 170 | 130 | 170 | +30.8% |
| Failure to search for work | 940 | 1,020 | 1,340 | 1,730 | 1,430 | -17.3% |
- Source: Statistics Canada, monthly Employment Insurance disqualifications and disentitlements, Table 14-10-0004-01.
2.2.2 Coverage, eligibility and access to Employment Insurance regular benefits for the unemployed population
As mentioned at the beginning of section 2.2, there are 3 eligibility criteria to qualify for EI regular benefits: the claimants must have had insurable employment and paid EI premiums during their qualifying period (defined as either the previous 52 weeks or since the establishment of their last claim, whichever is shorter); they must have a valid reason for job separation according to the Employment Insurance Act; and they must have worked a minimum number of insurable hours (ranging from 420 to 700 hours, depending on the regional unemployment rate where they live at the time of the claim) within their qualifying period. This subsection examines the unemployed population from the perspective of these 3 eligibility criteria in 2018 and presents measures of coverage, eligibility and access to EI regular benefits for the unemployed population. Results are from the Employment Insurance Coverage Survey (EICS)Footnote 22 published annually by Statistics Canada. The survey provides statistics on the contributors and non-contributors to the EI program among the unemployed individuals, as well as on the eligible recipients and those who did not qualify for EI regular benefits. The survey also provides information on the take-up of EI maternity and parental benefits in Canada (see subsection 2.6.2).
Chart 10 illustrates the distribution of the unemployed population in Canada in 2018 with respect to their eligibility criteria for EI regular benefits. It shows that on average there were 1,108,500 unemployed individuals per month in Canada in 2018. Among them, 36.1% did not pay premiums, because they did not work in the previous 12 months or have never worked, or because they were self-employed or unpaid family workers. On the other hand, 63.9% of all unemployed individuals had paid EI premiums in the 12 months prior to becoming unemployed in 2018, and thus were covered by the EI program. However, a share of those unemployed people who paid premiums were ineligible to receive EI benefits because of an invalid job separation (15.8% of the total unemployed population). For example, some quit their jobs without just cause as per the Employment Insurance Act, while others quit to go to school. Therefore, the remaining unemployed individuals who contributed to the EI program and had a valid job separation represented 48.2% of the total unemployed population in 2018. Among those, a portion (6.1% of the total unemployed population) did not accumulate enough hours of insurable employment within their qualifying period to be eligible for EI regular benefits. This is in contrast to an estimated 466,900 unemployed individuals (42.1% of the total unemployed population) that had enough hours of insurable employment within their qualifying period and were eligible to receive EI regular benefits as they met all 3 requirements of the EI program.
Chart 10 also shows that the majority of the eligible unemployed individuals with enough hours of insurable employment were receiving EI regular benefits at the time they were surveyed in 2018. However, some did not receive benefits, even though they were eligible, for any 1 of the following reasons:
- their benefits were temporarily interrupted or they were serving their mandatory waiting period
- they had already exhausted their EI benefits
- they were receiving non-regular EI benefits, or
- they did not claim or did not receive benefits for unknown reasons
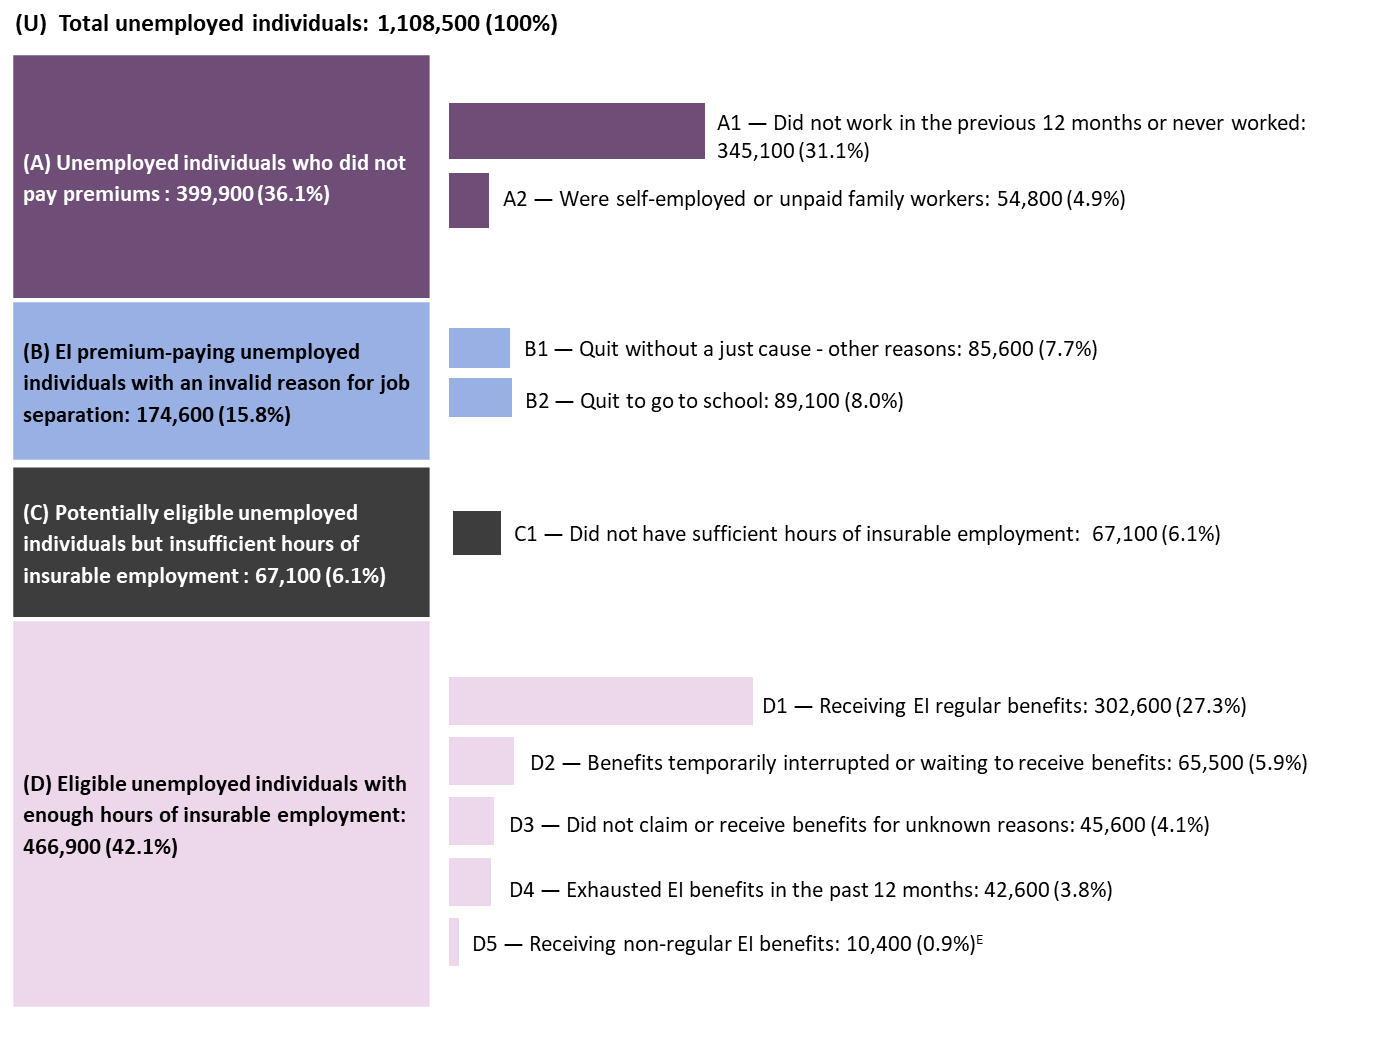
Text description of Chart 10
| (U) Total unemployed individuals: 1,108,500 (100%) | Description |
|---|---|
| (A) Unemployed individuals who did not pay premiums: 399,900 (36.1%) |
|
| (B) EI premium-paying unemployed individuals with an invalid reason for job separation: 174,600 (15.8%) |
|
| (C) Potentially eligible unemployed individuals but insufficient hours of insurable employment: 67,100 (6.1%) |
|
| (D) Eligible unemployed individuals with enough hours of insurable employment: 466,900 (42.1%) |
|
- Note: Data may not add up to totals due to rounding.
- E Use with caution, as there are high levels of error in this estimate.
- Source: Statistics Canada, Employment Insurance Coverage Survey, 2018.
The breakdown of the unemployed population according to their eligibility for EI regular benefits in 2018 remained relatively comparable to 2017 (see Chart 11). Nevertheless, the share of unemployed individuals with an invalid reason for job separation increased by 3.8 percentage points over the previous year mainly due to a larger proportion quitting their jobs to go to school, whereas the proportion of potentially eligible unemployed people with insufficient hours of insurable employment decreased by 1.9 percentage points.
Two main trends in terms of eligibility to EI regular benefits have been observed over the past decade (see Chart 11). First, the share of eligible unemployed individuals who met the 3 eligibility criteria increases during an economic downturn, as seen following the recession in FY0809 and the downturn in commodity prices in 2015. Second, the share of unemployed individuals who did not contribute to the EI program by paying premiums trends upwards after the recession in FY0809.Footnote 23
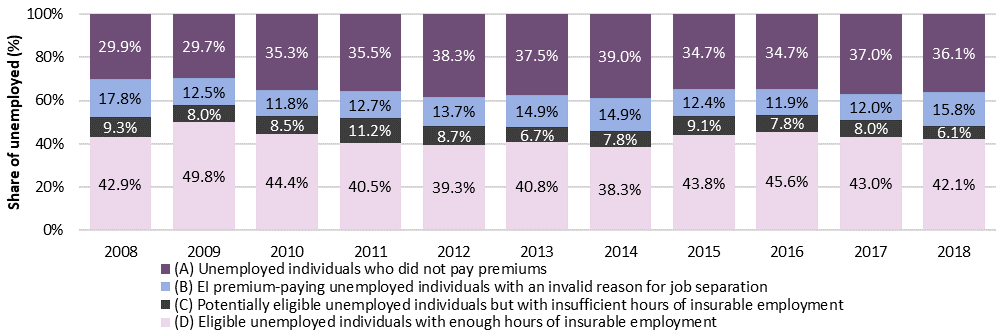
Text description of Chart 11
| Category | 2008 | 2009 | 2010 | 2011 | 2012 | 2013 | 2014 | 2015 | 2016 | 2017 | 2018 |
|---|---|---|---|---|---|---|---|---|---|---|---|
| (A) Unemployed individuals who did not pay premiums | 29.9% | 29.7% | 35.3% | 35.5% | 38.3% | 37.5% | 39.0% | 34.7% | 34.7% | 37.0% | 36.1% |
| (B) EI premium-paying unemployed individuals with an invalid reason for job separation | 17.8% | 12.5% | 11.8% | 12.7% | 13.7% | 14.9% | 14.9% | 12.4% | 11.9% | 12.0% | 15.8% |
| (C) Potentially eligible unemployed individuals but with insufficient hours of insurable employment | 9.3% | 8.0% | 8.5% | 11.2% | 8.7% | 6.7% | 7.8% | 9.1% | 7.8% | 8.0% | 6.1% |
| (D) Eligible unemployed individuals with enough hours of insurable employment | 42.9% | 49.8% | 44.4% | 40.5% | 39.3% | 40.8% | 38.3% | 43.8% | 45.6% | 43.0% | 42.1% |
- Source: Statistics Canada, Employment Insurance Coverage Survey, 2008 to 2018.
Coverage of Employment Insurance regular benefits
The share of the unemployed population covered by the EI program is represented by the coverage rate of EI regular benefits, which is calculated by dividing the number of unemployed EI contributors (those who had insurable employment and contributed to the EI program by paying premiums within the previous 52 weeks) by the total number of unemployed individuals in Canada. In 2018, the coverage rate was 63.9%, a slight increase from 63.0% in 2017.
Higher EI coverage rates are usually observed during economic downturns, as slowing economic activities lead to layoffs that increase the share of unemployed EI contributors among all unemployed individuals. The coverage rates within the past decade in Canada peaked in 2008 and 2009, corresponding with the FY0809 recession and rose again during the downturn in commodity prices in 2015 and 2016 (see Chart 12).
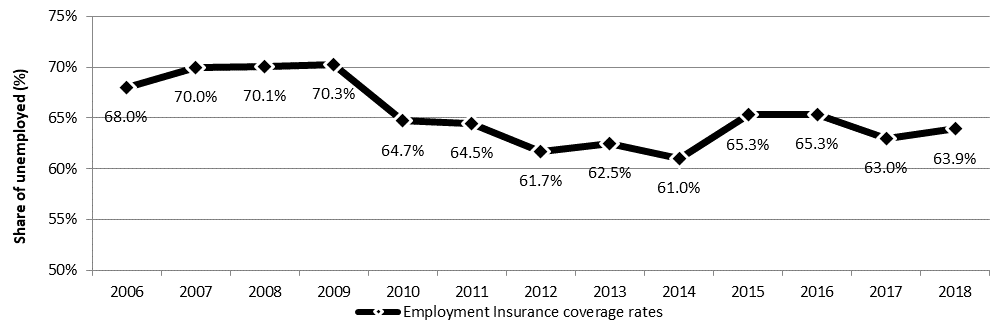
Text description of Chart 12
| Category | 2006 | 2007 | 2008 | 2009 | 2010 | 2011 | 2012 | 2013 | 2014 | 2015 | 2016 | 2017 | 2018 |
|---|---|---|---|---|---|---|---|---|---|---|---|---|---|
| Employment Insurance coverage rates | 68.0% | 70.0% | 70.1% | 70.3% | 64.7% | 64.5% | 61.7% | 62.5% | 61.0% | 65.3% | 65.3% | 63.0% | 63.9% |
- Source: Statistics Canada, Employment Insurance Coverage Survey, 2006 to 2018.
By province, Prince Edward Island posted the highest coverage rate (91.0%) in 2018, while Ontario had the lowest rate (59.6%) (see Table 13). Historically, Atlantic provinces have higher coverage rates than the rest of the country—this can be explained by the prevalence of the seasonal employment pattern in that region.Footnote 24
| Category | Coverage rate |
|---|---|
| Newfoundland and Labrador | 87.3% |
| Prince Edward Island | 91.0% |
| Nova Scotia | 73.0% |
| New Brunswick | 69.7% |
| Quebec | 67.0% |
| Ontario | 59.6% |
| Manitoba | 62.5% |
| Saskatchewan | 70.2% |
| Alberta | 61.7% |
| British Columbia | 61.7% |
| Men | 68.3% |
| Women | 58.1% |
| 24 years old and under | 57.1% |
| 25 to 44 years old | 64.4% |
| 45 years old and over | 67.5% |
| Previous work pattern - Permanent | 72.1% |
| Previous work pattern - Permanent full-time | 74.0% |
| Previous work pattern - Permanent part-time | 67.1% |
| Previous work pattern - Non-permanent | 81.1% |
| Previous work pattern - Non-permanent seasonal* | 86.9% |
| Previous work pattern - Non-permanent other non-standard** | 77.2% |
| Canada | 63.9% |
- * Seasonal employment is temporary work that is expected to last only until the end of a ‘season’—the period for which services are in demand.
- ** Other non-standard refers to non-permanent paid jobs that were either temporary, term, contractual, casual or other non-permanent (but not seasonal) employment. Doesn’t include unemployed individuals that were self-employed.
- Source: Statistics Canada, Employment Insurance Coverage Survey, 2018.
On the basis of gender, 68.3% of unemployed men contributed EI premiums in 2018, compared to 58.1% of unemployed women. The lower coverage rate among unemployed women can be explained by the fact that women are less likely to have recent insurable employment compared to unemployed men. Coverage rates among unemployed youth tend to be significantly lower than those of unemployed adults because they are more likely to have never worked.
When the unemployed population is categorized by their previous work pattern, it can be seen that a lower share of unemployed individuals who occupied permanent jobs contributed EI premiums (72.1%) than those who were in non-permanent jobs (81.1%). This can be explained by the high coverage rate of unemployed individuals who worked in non-permanent seasonal jobs (86.9%). As these individuals work for few weeks or months on a cyclical pattern over a year, they are more likely to have paid EI premiums in the previous 52 weeks than other individuals who were in permanent jobs that might be unemployed for more than a year. Among unemployed individuals who previously held permanent jobs, those who had full-time jobs posted a higher coverage rate (74.0%) than those who had part-time jobs (67.1%).
Eligibility for Employment Insurance regular benefits
As mentioned previously, to be eligible for EI regular benefits, unemployed individuals must have paid EI premiums, have had a valid reason for job separation and have accumulated enough hours of insurable employment during their qualifying period. The eligibility rate represents the share of the unemployed individuals who have accumulated enough hours of insurable employment among those who meet the other 2 eligibility criteria (paid premiums and had a valid reason for job separation).
As illustrated by the all unemployed individuals line in Chart 13, the eligibility rate for EI regular benefits in Canada has ranged from 78.4% to 87.4% in the past decade. The rate increased from 84.3% in 2017 to 87.4% in 2018, the highest rate over the past 10 years. The overall increase in 2018 was driven particularly by youth and by individuals in Ontario.
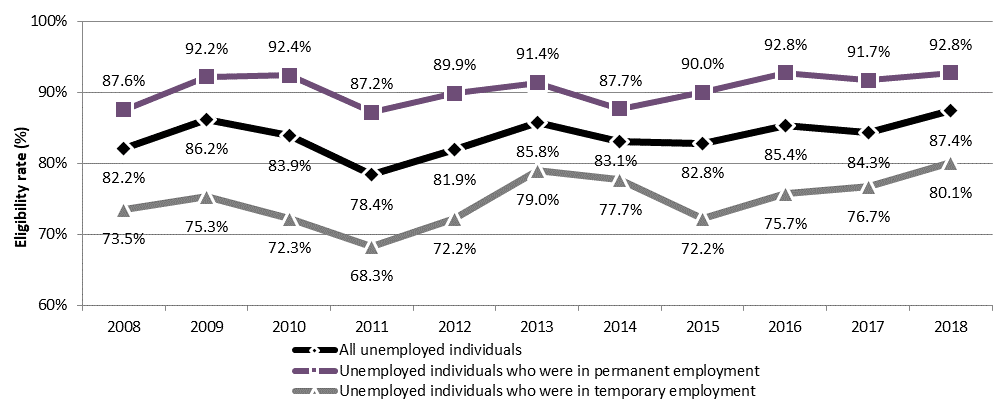
Text description of Chart 13
| Category | 2008 | 2009 | 2010 | 2011 | 2012 | 2013 | 2014 | 2015 | 2016 | 2017 | 2018 |
|---|---|---|---|---|---|---|---|---|---|---|---|
| All unemployed individuals | 82.2% | 86.2% | 83.9% | 78.4% | 81.9% | 85.8% | 83.1% | 82.8% | 85.4% | 84.3% | 87.4% |
| Unemployed individuals who were in permanent employment | 87.6% | 92.2% | 92.4% | 87.2% | 89.9% | 91.4% | 87.7% | 90.0% | 92.8% | 91.7% | 92.8% |
| Unemployed individuals who were in temporary employment | 73.5% | 75.3% | 72.3% | 68.3% | 72.2% | 79.0% | 77.7% | 72.2% | 75.7% | 76.7% | 80.1% |
- Source: Statistics Canada, Employment Insurance Coverage Survey, 2008 to 2018.
The eligibility rates for EI regular benefits are sensitive to economic conditions and specific employment patterns during the qualifying period, such as the incidence of full-time versus part-time hours, permanent versus temporary employment, etc. Because of this, significant variations are found when unemployed individuals are classified based on regional, demographic and previous employment characteristics.
Among all provinces in 2018, the highest eligibility rate was observed in Prince Edward Island (98.2%) while the lowest was in Alberta (79.6%) (see Table 14). Compared with the previous year, the eligibility rate increased in 4 provinces, notably in Ontario, decreased in 3 provinces and remained relatively unchanged in the other 3 provinces in 2018. With the larger demographic weight of Ontario compared to other provinces, the rise of eligibility rate in this province was responsible for much of the overall increase at the national level. Nevertheless, Atlantic provinces continue to have the highest eligibility rate among all provinces in Canada, whereas Ontario and the Western provinces have comparatively lower eligibility rates. An internal analysisFootnote 25 also found that urban EI economic regions have lower eligibility rate (84%) compared to rural EI economic regions (90%).
| Category | 2014 | 2015 | 2016 | 2017 | 2018 | Change (p.p.) 2017 to 2018 |
|---|---|---|---|---|---|---|
| Newfoundland and Labrador | 94.1% | 93.7% | 95.9% | 96.7% | 93.8% | -2.9 |
| Prince Edward Island | 93.4% | 92.7% | 98.5% | 94.3% | 98.2% | +3.9 |
| Nova Scotia | 81.2% | 82.3% | 93.3% | 86.0% | 93.8% | +7.8 |
| New Brunswick | 90.5% | 96.2% | 94.6% | 93.1% | 94.0% | +0.9 |
| Quebec | 84.3% | 81.5% | 86.7% | 85.1% | 85.5% | +0.4 |
| Ontario | 81.0% | 84.8% | 81.3% | 79.6% | 88.7% | +9.1 |
| Manitoba | 91.4% | 82.9% | 75.3% | 84.9% | 83.1% | -1.8 |
| Saskatchewan | 85.4% | 89.9% | 78.9% | 69.7% | 86.6% | +16.9 |
| Alberta | 80.4% | 78.6% | 84.9% | 85.2% | 79.6% | -5.6 |
| British Columbia | 77.3% | 75.2% | 87.3% | 90.0% | 91.0% | +1.0 |
| Men | 84.0% | 82.0% | 87.2% | 85.8% | 88.3% | +2.5 |
| Women | 81.3% | 84.3% | 81.6% | 82.1% | 86.1% | +4.0 |
| 24 years old and under | 44.0% | 54.0% | 50.8% | 40.7% | 60.5% | +19.8 |
| 25 to 44 years old | 86.9% | 82.1% | 88.4% | 89.4% | 90.7% | +1.3 |
| 45 years old and over | 88.8% | 90.7% | 94.0% | 90.2% | 90.5% | +0.3 |
| Previous work pattern - Permanent | 87.7% | 90.0% | 92.8% | 91.7% | 92.8% | +1.1 |
| Previous work pattern - Permanent full-time | 90.1% | 93.3% | 95.3% | 94.5% | 93.6% | -0.9 |
| Previous work pattern - Permanent part-time | 66.2% | 65.8% | 62.4% | 69.3% | 86.0%E | +16.7 |
| Previous work pattern - Non-permanent | 77.7% | 72.2% | 75.7% | 76.7% | 80.1% | +3.4 |
| Previous work pattern - Non-permanent seasonal* | 84.6% | 82.6% | 87.5% | 86.7% | 82.0% | -4.7 |
| Previous work pattern - Non-permanent other non-standard** | 73.0% | 64.0% | 66.4% | 66.8% | 78.5% | +11.7 |
| Canada | 83.1% | 82.8% | 85.4% | 84.3% | 87.4% | +3.1 |
- E As per the EICS release guidelines, this estimate should be used with caution.
- * Seasonal employment is temporary work that is expected to last only until the end of a ‘season’—the period for which services are in demand.
- ** Other non-standard work pattern refers to non-permanent paid jobs that were either temporary, term, contractual, casual or other non-permanent (but not seasonal) employment. Doesn’t include unemployed individuals that were self-employed.
- Source: Statistics Canada, Employment Insurance Coverage Survey, 2014 to 2018.
Unemployed men tend to have higher eligibility rates than unemployed women, which may be attributable to the fact that a higher proportion of men hold full-time and/or permanent jobs while a higher proportion of women work in part-time and/or temporary jobs. In 2018, the eligibility rate for men was 88.3% compared to 86.1% for women.
In terms of age groups, unemployed youth aged 24 years and under had the lowest eligibility rate (60.5%) in 2018, compared to unemployed individuals aged between 25 and 44 years (90.7%) and those aged 45 years and over (90.5%) (see Table 14). The largest variation in eligibility rates in 2018 compared to the previous year was observed for youthFootnote 26 (+19.8 percentage points) while the eligibility rate of unemployed individuals in the other 2 age groups showed little change.
Eligibility rates also vary across different employment characteristics. Intuitively, unemployed individuals who previously held full-time positions would be more likely to have accumulated the required number of hours of insurable employment and have a higher eligibility rate than those in part-time jobs. Similarly, unemployed individuals who previously had permanent jobs would be more likely to post a higher eligibility rate than those who had temporary employment.
Chart 13 above shows that the eligibility rate for unemployed people who held permanent positions ranged between 87.2% and 92.8%, while the eligibility rate for those who occupied temporary work ranged between 68.3% and 80.1% over the past decade.
Chart 14 presents the eligibility rates by previous work pattern where permanent employment is further classified in 2 categories, full-time work and part-time work, and temporary employment is also split between seasonal and non-seasonal jobs.
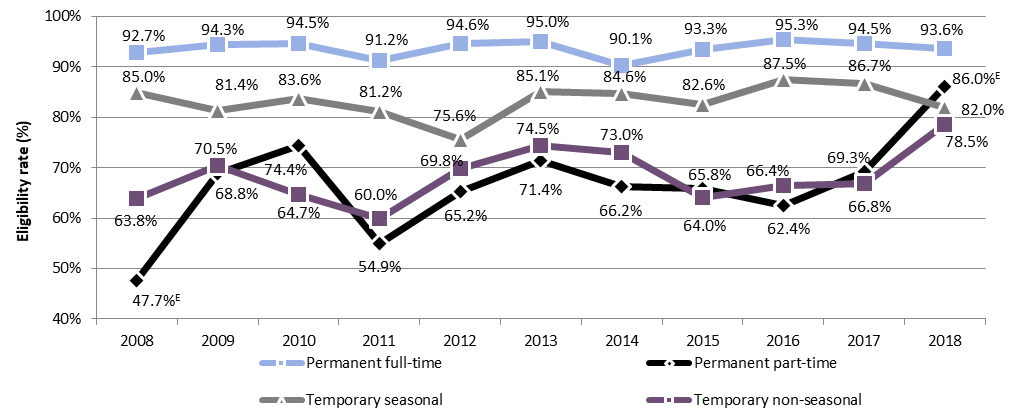
Text description of Chart 14
| Category | 2008 | 2009 | 2010 | 2011 | 2012 | 2013 | 2014 | 2015 | 2016 | 2017 | 2018 |
|---|---|---|---|---|---|---|---|---|---|---|---|
| Permanent full-time | 92.7% | 94.3% | 94.5% | 91.2% | 94.6% | 95.0% | 90.1% | 93.3% | 95.3% | 94.5% | 93.6% |
| Permanent part-time | 47.7% | 68.8% | 74.4% | 54.9% | 65.2% | 71.4% | 66.2% | 65.8% | 62.4% | 69.3% | 86.0% |
| Temporary seasonal | 85.0% | 81.4% | 83.6% | 81.2% | 75.6% | 85.1% | 84.6% | 82.6% | 87.5% | 86.7% | 82.0% |
| Temporary non-seasonal | 63.8% | 70.5% | 64.7% | 60.0% | 69.8% | 74.5% | 73.0% | 64.0% | 66.4% | 66.8% | 78.5% |
- E As per the EICS release guidelines, this estimate should be used with caution.
- Source: Statistics Canada, Employment Insurance Coverage Survey, 2008 to 2018.
The eligibility rate for unemployed individuals who held permanent full-time jobs continued to be the highest across the different previous work patterns in 2018 (see Chart 14). The eligibility rate for unemployed individuals who worked in temporary seasonal jobs decreased from 86.7% in 2017 to 82.0% in 2018, lower than the rate of those who were in permanent part-time work. The eligibility rate for this latter group posted a notable rise (+16.7 percentage points) between 2017 and 2018,Footnote 27 as well as for unemployed individuals who occupied temporary non-seasonal work (+11.7 percentage points). These increases in 2018 may be explained by the fact that a higher proportion of unemployed people whose previous employment fall under these 2 categories quit their job without a valid reason for separation compared to 2017, excluding them from the denominator of the eligibility rate. These unemployed people are generally youth who are less likely to accumulate sufficient hours of insurable employment.
Eligibility for EI regular benefits has also been estimated in the past using Record of Employment data to estimate the proportion of job separators who met the required number of hours of insurable employment to qualify for EI regular benefits. Results based on this methodology can be found in the 2017/2018 Employment Insurance Monitoring and Assessment Report.
Access to Employment Insurance regular benefits
Access to EI regular benefits is another way to measure how well the EI program is functioning to meet the needs of Canada’s unemployed population in helping them transition to new employment. For the purpose of the EI Monitoring and Assessment Report, 2 ratios are used to measure accessibility to EI regular benefits: the Beneficiary-to-Unemployed (B/U) ratio and the Beneficiary-to-Unemployed Contributor (B/UC) ratio.
The Beneficiary-to-Unemployed (B/U) ratio
The Beneficiary-to-Unemployed (B/U) ratio is calculated by expressing the average number of EI regular beneficiaries that comes from Statistics Canada’s monthly EI Statistics releases as a share of the overall unemployed population obtained from the EICS.Footnote 28 As such, it includes a significant segment of the unemployed population who are ineligible for EI regular benefits (such as those who did not work in the previous year or never worked, who did not have a valid job separation, and those who were self-employed). Because of this, the B/U ratio is sensitive to changes in the composition of the unemployed population and the proportion of the unemployed individuals outside the scope of the EI program coverage.
The Beneficiary-to-Unemployed Contributor (B/UC) ratio
The Beneficiary-to-Unemployed Contributor (B/UC) ratio is calculated by expressing the average number of EI regular beneficiaries that comes from Statistics Canada’s monthly EI Statistics releases as a share of the unemployed population who contributed EI premiums in the previous 12 months derived from the EICS. This ratio considers a narrower target population than the B/U ratio. Because the B/UC ratio measures accessibility among unemployed individuals for whom the EI regular benefits are designed to provide coverage, and excludes those who did not contribute EI premiums during their last employment period or did not have any labour force attachment, this ratio may provide a better assessment of accessibility to EI regular benefits than the B/U ratio.
The B/U and B/UC ratios in 2018 were 39.3% and 61.5%, respectively (see Chart 15). It can be seen that the B/U ratio decreased by 2.8 percentage points compared to the previous year, while the decrease in the B/UC ratio was larger (-5.4 percentage points) during this time. These decreases are attributable to a larger decline in the numerator (B) than in both denominators (U and UC). This is partly due to the continuing decline in the unemployment rate over the past year which resulted in EI claimants generally being entitled to less weeks of regular benefits, and also to a slight decrease in the proportion of regular benefits’ weeks used by EI claimants, as well as the end of the temporary measure that provided additional weeks of benefits to certain regions affected by the commodities downturn (see subsection 2.2.4). These 3 factors contributed to decreasing the number of EI claimants as beneficiaries over the given time period.
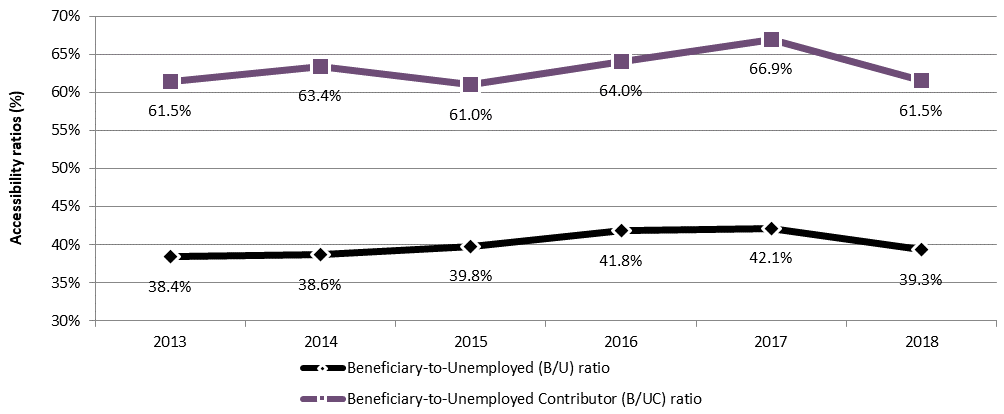
Text description of Chart 15
| Category | 2013 | 2014 | 2015 | 2016 | 2017 | 2018 |
|---|---|---|---|---|---|---|
| Beneficiary-to-Unemployed (B/U) Ratio | 38.4% | 38.6% | 39.8% | 41.8% | 42.1% | 39.3% |
| Beneficiary-to-Unemployed Contributor (B/UC) Ratio | 61.5% | 63.4% | 61.0% | 64.0% | 66.9% | 61.5% |
- Sources: Statistics Canada, monthly Employment Insurance statistics release, Table 14-10-0010-01 (for data on EI regular beneficiaries (B)); and Statistics Canada, Employment Insurance Coverage Survey (for data on the number of unemployed (U) and the number of unemployed contributors (UC)).
2.2.3 Level of Employment Insurance regular benefits
Under the Variable Best Weeks (VBW) provision, the weekly regular benefit rate that eligible claimants are entitled to receive is calculated as 55% of the average of the claimant’s highest (best) weeks of earnings in insurable employment during the qualifying period.Footnote 29 The number of weeks used to determine the weekly benefit rate ranges from 14 to 22, depending on the monthly regional unemployment rate of the claimant’s EI economic region. Therefore, EI benefit rates are based on the claimant’s weeks of higher earnings. The maximum rate of weekly benefits paid for all types of benefits under the EI program is based on the maximum insurable earnings (MIE), which was $53,100 in 2019. As the weekly regular benefit rate is calculated as 55% of average weekly earnings, the maximum weekly regular benefit rate was $562 in 2019.
In addition to the EI regular benefits, claimants with children (under the age of 18 years) and low annual family income may be eligible to receive additional benefits under the Family Supplement Provision, which can increase their benefit rate from 55% to a maximum of 80%, subject to the maximum weekly benefit rate (see subsection 2.1.1 for detailed discussion). The level of EI regular benefits discussed in this subsection includes Family Supplement top-ups paid to eligible claimants with EI regular benefits.
In FY1819, the average weekly benefit rate for EI regular benefits increased to $469, up from $457 observed in the previous fiscal year (+$12 or +2.7%). This increase is attributable to the increase in the MIE.Footnote 30 As illustrated in Chart 16, the average weekly regular benefit rate has been rising steadily on a year-over-year basis over the past 10 years.
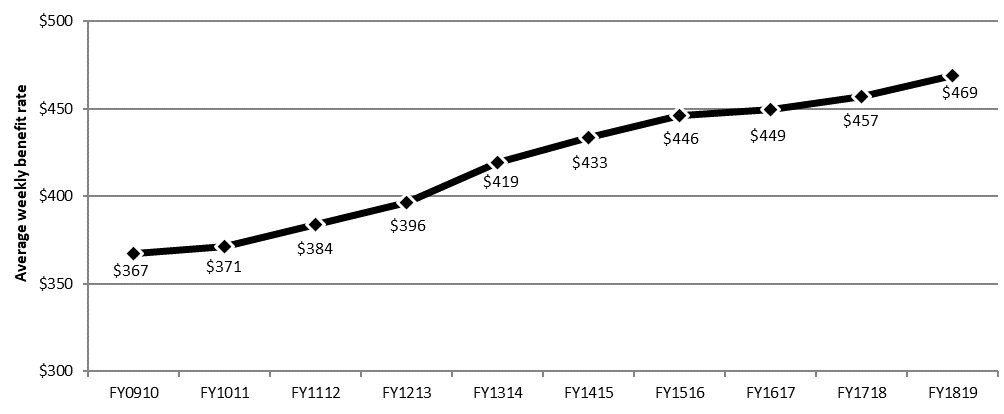
Text description of Chart 16
| Category | FY0910 | FY1011 | FY1112 | FY1213 | FY1314 | FY1415 | FY1516 | FY1617 | FY1718 | FY1819 |
|---|---|---|---|---|---|---|---|---|---|---|
| Average weekly benefit rate | $367 | $371 | $384 | $396 | $419 | $433 | $446 | $449 | $457 | $469 |
- Note: Includes all claims for which at least $1 of EI regular benefits was paid.
- Source: Employment and Social Development Canada, Employment Insurance (EI) administrative data. Data are based on a 10% sample of EI administrative data.
As shown in Annex 2.5.3, the average weekly regular benefit rate increased in FY1819 in all provinces and territories compared to the previous fiscal year, except Northwest Territories and Nunavut (-0.7% and -2.5%, respectively). The highest growth was observed in Yukon (+3.8%), followed by Ontario (+3.2%). The average weekly regular benefit rate varied across provinces and territories—from the highest observed in Northwest Territories ($523) to the lowest observed in Prince Edward Island and Nova Scotia ($433). As in previous years, claims from the Atlantic provinces, Quebec and Manitoba continued to receive weekly regular benefit rates below the national average, while claims from Saskatchewan, Alberta and the territories remained well over the national average.
In the past 5 years, the average weekly regular benefit rate for men has been higher compared to that for women, as shown in Annex 2.5.3. Historically, this has also been the case. However, since FY1112 the growth in average weekly regular benefit rate for women has surpassed that for men. This trend continued in the reporting period—the average weekly regular benefit rate for men was $493 in FY1819, up from $481 in FY1718 (+2.4%); while for women it was $432 in FY1819, up from $419 in FY1718 (+3.1%). This overall gap (in absolute values) is observable for all categories of hours of insurable employment worked during the qualifying period, and is more apparent at lower levels of labour market attachment, as indicated by the number of hours of insurable employment (see Chart 17). Among claimants who had the lowest level of labour market attachment with 420 to 559 hours of insurable employment during their qualifying period in FY1819, the average weekly regular benefit rate for women ($287) was around three-quarters (75.5%) of men’s ($380). Among claimants with the highest level of labour market attachment with 1820 or more hours of insurable employment, the average weekly regular benefit rate for women ($490) was approximately 92.9% of men’s ($527).
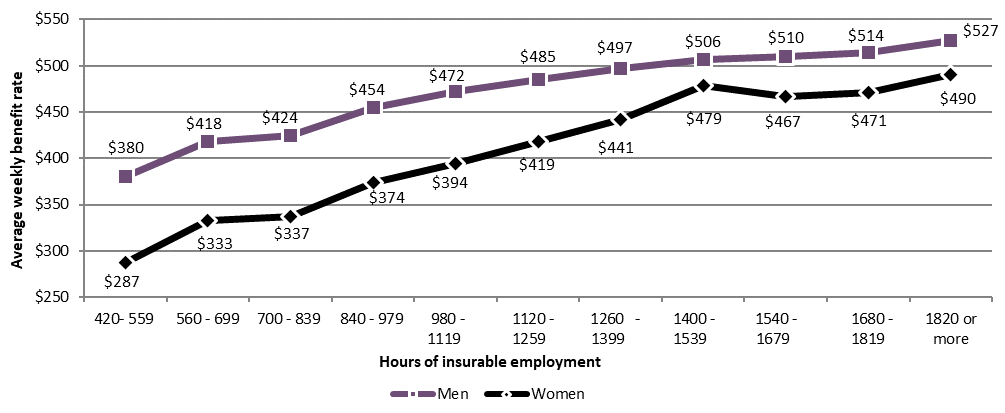
Text description of Chart 17
| Insurable hours worked | Men's average weekly benefit rate | Women's average weekly benefit rate |
|---|---|---|
| 420 to 559 | $380 | $287 |
| 560 to 699 | $418 | $333 |
| 700 to 839 | $424 | $337 |
| 840 to 979 | $454 | $374 |
| 980 to 1119 | $472 | $394 |
| 1120 to 1259 | $485 | $419 |
| 1260 to 1399 | $497 | $441 |
| 1400 to 1539 | $506 | $479 |
| 1540 to 1679 | $510 | $467 |
| 1680 to 1819 | $514 | $471 |
| 1820 or more | $527 | $490 |
- Note: Includes all claims for which at least $1 of EI regular benefits was paid.
- Source: Employment and Social Development Canada, Employment Insurance (EI) administrative data. Data are based on a 10% sample of EI administrative data.
Table 15 outlines the average weekly regular benefit rates by age group for men and women in the current reporting period and the previous year. Claimants who were aged between 25 and 44 years had the highest average weekly regular benefit rate ($481) in FY1819, up from $470 in the previous year (+$11 or +2.3%). However, the highest increase was observed for those who were aged 24 years and under (+$17 or +4.1%). When claimants are categorized by age group and gender, it can be seen that men who were aged between 45 and 54 years had the highest average weekly regular benefit rate ($507) in FY1819, while for women the highest benefit rate was among those who were aged between 25 and 44 years ($447). The difference in the average weekly regular benefit rate between men and women was the highest for claimants who were aged between 45 and 54 years ($71 more for men) in the reporting year, down from a difference of $74 in the previous year.
| Category | Men FY1718 | Men FY1819 | Women FY1718 | Women FY1819 | All claimants FY1718 | All claimants FY1819 |
|---|---|---|---|---|---|---|
| 24 years old and under | $436 | $452 | $367 | $384 | $416 | $433 |
| 25 to 44 years old | $491 | $502 | $436 | $447 | $470 | $481 |
| 45 to 54 years old | $496 | $507 | $422 | $436 | $463 | $475 |
| 55 years old and over | $471 | $482 | $399 | $414 | $442 | $455 |
| Canada | $481 | $493 | $419 | $432 | $457 | $469 |
- Note: Includes all claims for which at least $1 in EI regular benefits was paid.
- Source: Employment and Social Development Canada, Employment Insurance (EI) administrative data. Data are based on a 10% sample of EI administrative data.
In FY1819, the average weekly regular benefit rate was the highest for long-tenured workers ($503), while the lowest was for occasional claimants ($452).Footnote 31 However, compared to the previous year, occasional claimants’ average weekly benefit rate had the highest growth in FY1819 (+3.4%)—see Table 16.
| Category | Average weekly regular benefit rate ($) FY1718 |
Average weekly regular benefit rate ($) FY1819 |
Average weekly regular benefit rate Change (%) |
|---|---|---|---|
| Long-tenured workers | $495 | $503 | +1.6% |
| Occasional claimants | $437 | $452 | +3.4% |
| Frequent claimants | $464 | $477 | +2.7% |
| Canada | $457 | $469 | +2.7% |
- Note: Includes all claims for which at least $1 in EI regular benefits was paid.
- Source: Employment and Social Development Canada, Employment Insurance (EI) administrative data. Data are based on a 10% sample of EI administrative data.
As outlined in Table 17, a little less than half (49.1%) of all claims established for EI regular benefits in FY1819 received the maximum weekly benefit rate, up from 47.3% in the previous fiscal year. The share of claims receiving the maximum weekly benefit rate established by men (60.4%) was almost double the share of such claims established by women (31.3%), which is partly attributable to the fact that a higher proportion of women work in part-time jobs than men, leading to a lower average weekly insurable earnings for them.Footnote 32 By age group, the share of claims receiving the maximum weekly benefit rate was the highest for claimants aged between 25 and 44 years (53.6%), while the lowest was for those who were aged 24 years and under (33.3%). Long-tenured workers had the highest share of claims (64.5%) receiving the maximum weekly benefit rate in FY1819, followed by frequent claimants (51.5%).
| Category | Share of claims that received the maximum weekly benefit rate FY1718 |
Share of claims that received the maximum weekly benefit rate FY1819 |
|---|---|---|
| Men | 58.4% | 60.4% |
| Women | 30.2% | 31.3% |
| 24 years old and under | 30.6% | 33.3% |
| 25 to 44 years old | 51.8% | 53.6% |
| 45 to 54 years old | 49.8% | 51.4% |
| 55 years old and over | 43.3% | 45.1% |
| Long-tenured workers | 63.7% | 64.5% |
| Occasional claimants | 39.5% | 41.7% |
| Frequent claimants | 48.5% | 51.5% |
| Canada | 47.3% | 49.1% |
- Note: Includes all claims for which at least $1 in EI regular benefits was paid.
- * See Annex 2.1 for definitions claimant categories referenced in this table.
- Source: Employment and Social Development Canada, Employment Insurance (EI) administrative data. Data are based on a 10% sample of EI administrative data.
2.2.4 Employment Insurance regular benefit entitlement
Claimants who have successfully established an EI claim receive up to a set maximum number of weeks of EI regular benefits, known as their entitlement. This entitlement ranges between 14 and 45 weeks, and is determined by the number of hours of insurable employment accumulated during the qualifying period and the effective unemployment rate in the claimant’s EI economic region at the time the claim is established (see Annex 2.2 for the entitlement table).Footnote 33
This subsection presents detailed analysis on the duration of EI regular benefits, both maximum entitlement and actual weeks used. Statistics presented in this subsection are based on claims that were completedFootnote 34 during the fiscal year. Statistics for the reporting fiscal year are preliminary estimates and are subject to revision in the future.
Maximum and actual duration of Employment Insurance regular benefits
As mentioned, the maximum entitlement of EI regular benefits available to an EI claimant is between 14 and 45 weeks. Higher maximums are associated with greater hours of insurable employment accumulated during the qualifying period and higher regional unemployment rates. The EI program is designed to respond automatically to changes in economic conditions that affect local labour markets. In general, when a region’s unemployment rate rises, the entrance requirements are reduced and the maximum entitlement of benefits increases. Therefore, the number of weeks of EI benefits provided adjusts to the changing needs of unemployed individuals in different regions and communities with different labour market conditions.
The maximum entitlement is the maximum number of weeks during which benefits may be paid for a claim, whereas the actual duration of a claim is the number of weeks of benefits an EI claimant actually receives during a claim.Footnote 35 Average actual duration of EI regular claims is usually lower than the maximum entitlement, reflecting circumstances that can lead to reduced use of EI regular benefits over a claim’s benefit period (such as the claimant has found work and is no longer unemployed, has switched to EI special benefits or became unavailable to workFootnote 36).
As illustrated in Chart 18, the average maximum entitlement of completed EI regular claims decreased from 32.6 weeks in FY1718 to 30.3 weeks in FY1819 (-2.3 weeks or -7.2%). The average actual duration, on the other hand, decreased from 20.3 weeks in FY1718 to 18.2 weeks in FY1819 (-2.0 weeks or -9.9%). This decline in both durations is attributable, in part, to the continued improvement in labour market condition from last year in several provinces and territories,Footnote 37 and the conclusion of the temporary EI support measure introduced through the Budget Implementation Act, 2016, No.1, which temporarily extended the duration of EI regular benefits for eligible claimants in 15 EI economic regions most affected by the downturn in commodity prices observed in late 2014.Footnote 38 Effects of this measure on EI regular claims are presented later in this subsection.

Text description of Chart 18
| Category | FY0910 | FY1011 | FY1112 | FY1213 | FY1314 | FY1415 | FY1516 | FY1617 | FY1718 | FY1819 |
|---|---|---|---|---|---|---|---|---|---|---|
| Average actual duration in weeks (left scale) | 21.9 | 24.0 | 21.6 | 20.1 | 19.7 | 19.4 | 19.3 | 20.7 | 20.3 | 18.2 |
| Average maximum duration in weeks (left scale) | 38.8 | 41.7 | 35.4 | 33.0 | 32.1 | 31.6 | 32.1 | 33.7 | 32.6 | 30.3 |
| Unemloyment rate (right scale) | 8.5% | 7.9% | 7.5% | 7.2% | 7.0% | 6.9% | 7.0% | 6.9% | 6.1% | 5.8% |
- Note: Includes all claims completed during the fiscal year for which at least $1 of EI regular benefits was paid.
- * Coincides with the Employment Insurance temporary measures that increased the maximum number of weeks for which EI regular benefits could be paid.
- p Preliminary data.
- r Revised data.
- Source: Employment and Social Development Canada, Employment Insurance (EI) administrative data (for durations of EI regular benefits); and Statistics Canada, Labour Force Survey, Table 14-10-0287-01 (for data on unemployment rates). EI administrative data are based on a 10% sample.
The average maximum entitlement of EI regular claims completed in FY1819 varied significantly across provinces and territories, reflecting differences in regional labour market and labour force characteristics, as outlined in Table 18. As in the previous year, EI regular claims established in Nunavut had the highest average maximum entitlement (42.1 weeks) in the reporting year, followed by Newfoundland and Labrador (39.9 weeks). These significantly higher maximum entitlements compared to the national average can be explained by the high unemployment rate observed in these jurisdictions (the unemployment rate was 14.2% in Nunavut and 13.0% in Newfoundland and Labrador in FY1819).Footnote 39 In comparison, EI regular claims established in Yukon had the lowest average maximum entitlement (27.1 weeks), followed by Quebec (27.7 weeks), corresponding to the low unemployment rates generally observed in these jurisdictions (the unemployment rate in Yukon and Quebec was 3.2% and 5.4% in FY1819, respectively).Footnote 40
The average maximum entitlement of EI regular claims were higher for men, and those aged between 45 and 54 years in FY1819. Long-tenured workers generally have higher maximum entitlements than occasional and frequent claimants, as they are more likely to accumulate hours of insurable employment well above the minimum requirements for EI regular benefits (see Table 18).
| Category | Average maximum entitlement (weeks) FY1718 |
Average maximum entitlement (weeks) FY1819p |
Average maximum entitlement Change (%) |
Average actual duration (weeks) FY1718 |
Average actual duration (weeks) FY1819p |
Average actual duration Change (%) |
|---|---|---|---|---|---|---|
| Newfoundland and Labrador | 43.5 | 39.9 | -8.2% | 32.7r | 28.4 | -12.9% |
| Prince Edward Island | 34.1 | 33.7 | -0.9% | 23.1r | 22.2 | -3.9% |
| Nova Scotia | 32.5 | 32.8 | +0.9% | 22.7r | 21.8 | -3.8% |
| New Brunswick | 33.4 | 30.8 | -7.9% | 22.4r | 20.4 | -9.2% |
| Quebec | 28.8 | 27.7 | -3.6% | 16.8r | 15.4 | -8.7% |
| Ontario | 30.0 | 28.6 | -4.5% | 17.6r | 16.7 | -5.2% |
| Manitoba | 31.1 | 30.5 | -1.9% | 19.3r | 18.4 | -4.7% |
| Saskatchewan | 40.3 | 35.5 | -12.0% | 26.0r | 22.5 | -13.5% |
| Alberta | 44.4r | 34.3 | -22.7% | 28.5r | 21.3 | -25.2% |
| British Columbia | 32.3 | 29.4 | -8.9% | 19.9r | 17.6 | -11.1% |
| Yukon | 30.2r | 27.1 | -10.0% | 21.7r | 19.4 | -10.8% |
| Northwest Territories | 30.9r | 33.0 | +6.8% | 22.3 | 22.5 | +1.2% |
| Nunavut | 45.2r | 42.1 | -6.9% | 32.8r | 28.2 | -14.1% |
| Men | 33.3 | 30.9 | -7.2% | 20.5r | 18.4 | -10.2% |
| Women | 31.5 | 29.2 | -7.2% | 19.8r | 17.9 | -9.6% |
| 24 years old and under | 30.8 | 29.3 | -4.8% | 17.7r | 16.3 | -8.3% |
| 25 to 44 years old | 32.7 | 30.4 | -7.1% | 19.3r | 17.2 | -10.7% |
| 45 to 54 years old | 33.5 | 30.9 | -7.7% | 20.9r | 18.8 | -9.9% |
| 55 years old and over | 32.3 | 29.8 | -7.5% | 22.5r | 20.3 | -9.7% |
| Long-tenured workers | 39.1r | 34.2 | -12.4% | 21.1r | 17.7 | -15.8% |
| Occasional claimants | 30.6 | 29.2 | -4.8% | 19.1r | 17.6 | -8.1% |
| Frequent claimants | 29.7 | 28.7 | -3.4% | 22.1r | 20.5 | -7.4% |
| Canada | 32.6 | 30.3 | -7.2% | 20.3r | 18.2 | -9.9% |
- Note: Includes all claims completed during the fiscal year for which at least $1 of EI regular benefits was paid. Percentage change is based on unrounded numbers.
- * See Annex 2.1 for definitions of EI claimant categories referenced in this table.
- P Preliminary data.
- r Revised data.
- Source: Employment and Social Development Canada, Employment Insurance (EI) administrative data. Data are based on a 10% sample of EI administrative data.
Similar to the average maximum entitlement, the average actual duration of EI regular benefits in provinces and territories are also affected by regional labour market conditions, leading to variations across provinces and territories (see Table 18). As the EI program uses the regional unemployment rate as a proxy for availability of work, claims established for EI regular benefits in regions with higher unemployment rates generally have a higher average actual duration than those established in regions with lower unemployment rates. In FY1819, EI regular claims established in Newfoundland and Labrador had the highest average actual duration (28.4 weeks), closely followed by Nunavut (28.2 weeks), attributable to the high unemployment rates observed in these provinces and territories. In comparison, EI regular claims established in Quebec had the lowest average actual duration (15.4 weeks), corresponding to the low unemployment rate observed in FY1819. Notably, the average actual duration of EI regular claims decreased in all provinces and territories in FY1819 compared to the previous year, except for Northwest Territories. Claims established in Alberta had the largest decline on average (-7.2 weeks or -25.2%), attributable to the conclusion of the extension of EI regular benefits for eligible claimants affected by the downturn in commodity prices in late 2014. EI regular claims established in Nunavut and Newfoundland and Labrador also saw significant decreases in their average duration (-4.6 weeks or -14.1%, and -4.2 weeks or -12.9%, respectively).
In terms of industry classification, as outlined in Annex 2.6.2, completed EI regular claims by unemployed individuals from the Finance and insurance industry had the highest average actual duration (23.7 weeks) in FY1819. Notably, the average actual duration decreased in each industry in the reporting year compared to the previous year. This decline was the most significant in the Mining and oil and gas extraction industry (-5.9 weeks or -21.8%), likely attributable to the conclusion of the temporary extension of the duration of EI regular benefits for eligible workers who were affected by commodity prices downturn. As in past years, EI regular claims from the Educational services industry had the lowest average actual duration (11.8 weeks) in FY1819, due to its seasonal nature and the relatively short and well-defined “off-season” over the summer months.
Proportion of Employment Insurance regular benefit weeks used
The average proportion of regular benefit weeks used is defined as the average number of weeks of EI regular benefits received by claimants as a share of their maximum entitlement. As with the duration of EI regular benefits, a few factors may influence the proportion of entitlement used by claimants; for instance, the number of hours of insurable employment and the regional unemployment rates. Claimants with greater hours of insurable employment and those residing in regions with lower unemployment rates are more likely to find employment following a job separation, and thus use a lower proportion of their maximum entitlement for EI regular benefits. Consequently, greater maximum entitlements are generally associated with lower proportions of regular benefits’ weeks used.
As outlined in Table 19, the average proportion of EI regular benefit weeks used was 62.9% in FY1819, down from 64.2% in FY1718 (-1.3 percentage points). This average proportion went down in all provinces and territories in the reporting year compared to the previous year, except Ontario where it remained unchanged. The most significant change was observed in Nunavut (-7.2 percentage points). Across provinces and territories, the average proportion of regular benefit weeks used by claimants varied—from the lowest observed in Quebec (59.8%) to the highest in Yukon (74.6%). Generally, the average proportions of benefit weeks used were above the national average in the Atlantic provinces and in the Territories in FY1819.
In FY1819, the average proportion of regular benefit entitlement weeks used by women and men were identical. In terms of age group, the average proportion of regular benefit entitlement used increased with age—with the older claimants (aged 55 and over) having used the highest proportion of their regular benefit entitlement and the younger claimants (aged 24 years or less) having used the lowest proportion.
Frequent claimants for EI benefits receive relatively shorter entitlements on average compared to long-tenured workers, leading them to use a greater proportion of their entitlement for EI regular benefits.Footnote 41 Also, long-tenured workers have stronger labour market attachment, as indicated by the number of hours of insurable employment during the qualifying period, relative to frequent claimants, which explains the difference between their average proportion of regular benefit weeks used as they have a higher average maximum entitlement. This also applies to claimants working while on claim, as they may have a stronger labour market attachment and may also defer weeks of EI regular benefits—leading to a lower proportion of their entitlement weeks used compared to claimants who did not work while on claim (see Table 19).Footnote 42
| Category | Proportion of weeks of Employment Insurance regular benefits used (%) FY1415 |
Proportion of weeks of Employment Insurance regular benefits used (%) FY1516 |
Proportion of weeks of Employment Insurance regular benefits used (%) FY1617 |
Proportion of weeks of Employment Insurance regular benefits used (%) FY1718 |
Proportion of weeks of Employment Insurance regular benefits used (%) FY1819p |
Proportion of weeks of Employment Insurance regular benefits used Change (% points) FY1718 to FY1819 |
|---|---|---|---|---|---|---|
| Newfoundland and Labrador | 70.8% | 69.1% | 76.7% | 76.3%r | 72.6% | -3.7 |
| Prince Edward Island | 71.6% | 73.0% | 71.9% | 70.8%r | 68.2% | -2.6 |
| Nova Scotia | 70.5% | 72.1% | 72.4% | 72.7%r | 69.5% | -3.2 |
| New Brunswick | 68.0% | 69.4% | 71.0% | 69.9%r | 69.8% | -0.2 |
| Quebec | 63.4% | 63.9% | 63.7% | 62.4%r | 59.8% | -2.6 |
| Ontario | 62.5% | 61.8% | 62.6% | 61.0%r | 61.1% | 0.0 |
| Manitoba | 60.2% | 61.8% | 62.6% | 64.0%r | 62.6% | -1.4 |
| Saskatchewan | 58.5% | 54.0% | 63.2% | 66.3%r | 65.0% | -1.4 |
| Alberta | 58.8% | 52.4% | 58.7% | 64.7%r | 63.8% | -0.9 |
| British Columbia | 64.6% | 63.4% | 64.8% | 64.3%r | 62.9% | -1.4 |
| Yukon | 66.2% | 66.7% | 71.7% | 76.2%r | 74.6% | -1.6 |
| Northwest Territories | 58.5% | 73.8% | 65.2% | 75.2% | 71.6% | -3.6 |
| Nunavut | 76.1% | 68.6% | 71.2% | 73.8%r | 66.7% | -7.2 |
| Men | 63.9% | 63.4% | 64.5% | 64.4%r | 62.9% | -1.4 |
| Women | 63.6% | 62.6% | 64.0% | 64.0%r | 62.8% | -1.2 |
| 24 years old and under | 60.0% | 59.9% | 60.7% | 60.2%r | 58.5% | -1.7 |
| 25 to 44 years old | 61.0% | 60.2% | 60.8% r | 61.1%r | 59.3% | -1.8 |
| 45 to 54 years old | 63.9% | 63.5% | 65.0% | 64.1%r | 63.1% | -1.0 |
| 55 years old and over | 70.9% | 70.1% | 72.2% r | 71.6%r | 70.5% | -1.2 |
| Long-tenured workers | 52.9% | 50.0% | 51.7% | 53.3%r | 52.4% | -0.9 |
| Occasional claimants | 63.0% | 63.5% | 64.9% | 64.4%r | 62.8% | -1.6 |
| Frequent claimants | 75.5% | 76.2% | 78.1% | 76.7%r | 74.2% | -2.5 |
| Not working while on claims | 67.0% | 66.0% | 67.6% | 68.3%r | 66.7% | -1.6 |
| Working while on claim | 60.7% | 60.4% | 61.1% | 60.4%r | 59.0% | -1.3 |
| Canada | 63.8% | 63.1% | 64.3% | 64.2%r | 62.9% | -1.3 |
- * See Annex 2.1 for definitions of EI claimant categories referenced in this table.
- P Preliminary data.
- r Revised data.
- Source: Employment and Social Development Canada, Employment Insurance (EI) administrative data. Data are based on a 10% sample of EI administrative data.
Table 20 outlines the proportion of entitlement used by weeks of entitlement and regional unemployment rateFootnote 43 in FY1718 and FY1819. The proportion of entitlement used generally fell as entitlement weeks increased, as claimants with shorter entitlements tend to use a greater proportion of their entitlement. Proportion of EI regular benefit weeks used, on the other hand, generally increased with the regional unemployment rate. Regions with higher unemployment rates are often characterized by weaker labour market conditions. This is partly attributable to the greater importance of seasonal employment and the relatively smaller share of permanent employment in these regions, leading to a larger share of frequent EI claimants in these regions relative to those with lower unemployment rates. This is reflected in the higher proportion of entitlement used in EI economic regions with relatively higher unemployment rates, as frequent claimants tend to use a greater proportion of their entitlement.
| Category | Proportion of entitlement used in FY1718r | Proportion of entitlement used in FY1819p | Proportion of entitlement used Change (% points) FY1718 to FY1819 |
|---|---|---|---|
| Entitlement between 14 and 19 weeks | 82.8% | 81.3% | -1.5 |
| Entitlement between 20 and 24 weeks | 74.0% | 72.1% | -1.9 |
| Entitlement between 25 and 29 weeks | 63.3% | 61.4% | -1.9 |
| Entitlement between 30 and 34 weeks | 61.2% | 59.3% | -1.9 |
| Entitlement between 35 and 39 weeks | 54.4% | 51.5% | -2.9 |
| Entitlement between 40 and 44 weeks | 58.4% | 55.8% | -2.6 |
| Entitlement 45 weeks or more | 59.8% | 57.6% | -2.2 |
| 6.0% or less unemployment rate | 59.4% | 60.8% | +1.3 |
| Between 6.1% and 8.0% unemployment rate | 63.4% | 60.7% | -2.7 |
| Between 8.1% and 10.0% unemployment rate | 66.0% | 68.2% | +2.2 |
| Between 10.1% and 13.0% unemployment rate | 64.6% | 67.2% | +2.6 |
| 13.1% or more unemployment rate | 72.5% | 70.7% | -1.8 |
| Canada | 64.2% | 62.9% | -1.3 |
- Note: Changes in percentage points are based on unrounded numbers. Includes all completed claims for which at least $1 of EI regular benefits was paid.
- P Preliminary data.
- r Revised data.
- Source: Employment and Social Development Canada, Employment Insurance (EI) administrative data. Data are based on a 10% sample of EI administrative data.
Conclusion of the extension of Employment Insurance regular benefits for workers in regions affected by the downturn in commodity prices
Following the global downturn in commodity prices in late 2014, the Government of Canada introduced temporary measures to provide eligible workers in 15 EI economic regions that were hit the hardest by this event. Through this measure, all eligible EI claimants who had established a claim between January 4, 2015 and July 8, 2017 and remained unemployed had their EI regular benefit weeks extended by 5 weeks, while long-tenured workersFootnote 44 received up to 20 weeks of EI regular benefits in addition, for a total of up to 25 weeks.Footnote 45 These extended benefits were available for 1 year, starting from July 3, 2016. In order to claim the additional weeks of EI regular benefits, eligible claimants had their benefit period extended by the number of additional weeks of benefits they were entitled to receive, plus 12 weeks. As the last effective day in order to be eligible for these additional benefits was July 8, 2017, no EI regular claims established in the reporting year was affected by this measure. However, eligible claims, especially those by long-tenured workers, that were established on or near the last effective day of the measure could still receive extended benefits in FY1819.
A total of 354,440 claims that were established between January 4, 2015 and July 8, 2017 received additional weeks of EI benefits because of this measure, representing 45.4% of all potentially eligible claims. Almost half (45.6%) of the total number of claims with additional weeks of benefits were established in Alberta,Footnote 46 followed by Newfoundland and Labrador (18.3%), as the commodity-based industries in Canada are concentrated in these provinces. Almost two-thirds (62.6%) of the total claims with additional weeks of benefits were established by men, while non long-tenured workers accounted for almost three-quarters (73.2%) of the total claims with additional weeks of benefits through this measure.Footnote 47
While some eligible claimants did not use any additional weeks from the temporary extension measure, they nevertheless benefited from the benefit period extension, as they either claimed weeks of EI regular benefits from their original entitlement or weeks of special benefits during the benefit period extension. Table 21 outlines the average durations and the average amount received by these claims over the course of the measure. Completed EI regular claims that received at least 1 week of additional benefits and/or at least 1 week of EI benefits during their extended benefit period received an average of $16,334 over their entire duration. Excluding the extra weeks of benefits received due to the temporary extension measure, on average these claims received $12,100 in EI benefits. This increase in the EI benefits received likely prevented a subsequent claim from the same claimant being established or it displaced subsequent EI claim amounts from a subsequent claim. In comparison, claims established in these regions that did not benefit from the temporary extension measure received $7,839 on average over the same period.
| Type of benefits under the temporary support measure | Average claim duration1 (weeks) excluding weeks of benefits paid under the temporary extension measure | Average amount of EI benefits paid per claim3 ($) excluding weeks of benefits paid under the temporary extension measure | Average claim duration2 (weeks) including weeks of benefits paid under the temporary extension measure | Average amount of EI benefits paid per claim3 ($)including weeks of benefits paid under the temporary extension measure |
|---|---|---|---|---|
| Claims with additional regular benefits only | 32.2 | $13,867 | 40.7 | $17,627 |
| Claims with original entitlement weeks or special benefits only during the benefit period extension | 17.8 | $8,004 | 26.8 | $12,095 |
| Claims with weeks of additional regular benefits and weeks of original entitlement or of special benefits during the benefit period extension | 28.8 | $12,875 | 42.5 | $19,135 |
| Canada | 27.7 | $12,100 | 37.2 | $16,334 |
- Note: Includes all claims that benefited from the temporary extension measure.
- 1 Average duration of completed claims that were unaffected by the temporary extension.
- 2 Average duration of completed claims that were affected by the temporary extension.
- 3 Average amount of EI benefits (regular or special) paid per completed claim that was established for EI regular benefits.
- Source: Employment and Social Development Canada, Employment Insurance (EI) administrative data.
- Data are based on a 10% sample of EI administrative data.
As outlined in Table 22, a total of $2,068.5 million were paid to eligible EI claimants who benefited from the temporary extension of EI regular benefits in these 15 affected EI economic regions. Of this, $1,253.3 million were paid to eligible claimants who received additional weeks of EI regular benefits because of the temporary extension measure, while the other $815.2 million were associated with benefit payments to claimants who had qualified for EI regular benefits prior to the implementation of the measure, or special benefits that were paid during their benefit period extension.
| Type of benefits paid | Amount paid in FY1617 ($ million) | Amount paid in FY1718 ($ million) | Amount paid in FY1819 ($ million) | Total amount paid under the temporary support measure ($ million) |
|---|---|---|---|---|
| EI regular benefits paid because of the additional weeks provided under the measure | $675.0 | $510.3 | $68.1 | $1,253.3 |
| Benefits paid to claimants who had qualified for EI regular benefits prior to the implementation of the measure, or EI special benefits paid during extension period | $323.4 | $358.1 | $133.7 | $815.2 |
| Canada | $998.4 | $868.3 | $201.8 | $2,068.5 |
- Note: Data may not add up to the total due to rounding.
- Source: Employment and Social Development Canada, Employment Insurance (EI) administrative data.
- Data are based on a 10% sample of EI administrative data.
2.2.5 Employment Insurance regular benefits and seasonal claimants
EI claimants who had at least 3 regular or fishing claims within past 5 years from the reference year, with at least 2 of these claims having started during the same period of the year as the current claim, are referred to as seasonal claimants.Footnote 48 The definition of seasonal claimants is not exclusive of the definitions for other claimant categories.Footnote 49
A total of 425,000 claims were established by seasonal claimants in FY1819, up from 410,500 in FY1718 (+3.5%). Of these, 395,300 claims (93.0%) were for EI regular benefits and the remaining 29,700 claims (7.0%) were for EI fishing benefits.Footnote 50 The analysis presented in this subsection is focused on seasonal regular claims.Footnote 51
As illustrated in Chart 19, the share of seasonal regular claims among all regular claims increased for the second consecutive year in FY1819 to reach 30.6%. The number of seasonal regular claims also increased for the second consecutive year in FY1819, since the sharp decline in FY1617.
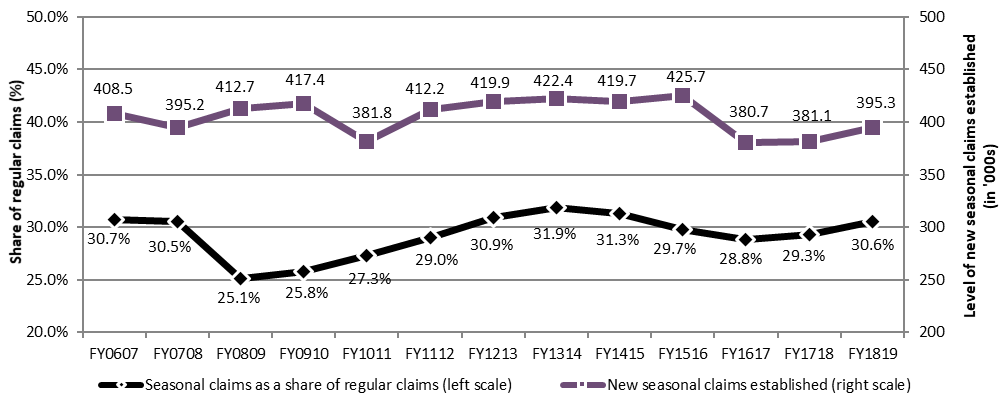
Text description of Chart 19
| Category | FY0607 | FY0708 | FY0809 | FY0910 | FY1011 | FY1112 | FY1213 | FY1314 | FY1415 | FY1516 | FY1617 | FY1718 | FY1819 |
|---|---|---|---|---|---|---|---|---|---|---|---|---|---|
| New seasonal claims established (right scale) | 408.5 | 395.2 | 412.7 | 417.4 | 381.8 | 412.2 | 419.9 | 422.4 | 419.7 | 425.7 | 380.7 | 381.1 | 395.3 |
| Seasonal claims as a share of regular claims (left scale) | 30.7% | 30.5% | 25.1% | 25.8% | 27.3% | 29.0% | 30.9% | 31.9% | 31.3% | 29.7% | 28.8% | 29.3% | 30.6% |
- Note: Includes claims for which at least $1 of EI regular benefits was paid.
- Source: Employment and Social Development Canada, Employment Insurance (EI) administrative data. Data are based on a 10% sample of EI administrative data.
Table 23 outlines the number of seasonal regular claims and the share of seasonal regular claims as a percentage of regular claimsFootnote 52 in the reporting year by region, gender, age category and industry. Similar to previous years, the share of seasonal regular claims over total regular claims was the highest in the Atlantic provinces, followed by Quebec. This share was much lower in the Western provinces and in the territories.
| Category | Seasonal regular claims (number) | Seasonal regular claims as a share of total seasonal claims | Seasonal regular claims as a share of total regular claims |
|---|---|---|---|
| Newfoundland and Labrador | 21,170 | 5.4% | 31.7% |
| Prince Edward Island | 8,120 | 2.1% | 52.3% |
| Nova Scotia | 24,640 | 6.2% | 39.9% |
| New Brunswick | 33,650 | 8.5% | 49.3% |
| Quebec | 153,030 | 38.7% | 39.8% |
| Ontario | 99,060 | 25.1% | 27.2% |
| Manitoba | 11,720 | 3.0% | 27.5% |
| Saskatchewan | 6,010 | 1.5% | 16.0% |
| Alberta | 11,980 | 3.0% | 9.4% |
| British Columbia | 25,220 | 6.4% | 20.9% |
| Territories | 680 | 0.2% | 16.5% |
| Men | 245,400 | 62.1% | 31.0% |
| Women | 149,880 | 37.9% | 29.9% |
| 24 years old and under | 7,630 | 1.9% | 6.7% |
| 25 to 44 years old | 149,160 | 37.7% | 26.2% |
| 45 to 54 years old | 99,610 | 25.2% | 35.7% |
| 55 years old and over | 138,880 | 35.1% | 41.9% |
| Goods-producing industries | 174,740 | 44.2% | 34.6% |
| Services-producing industries | 216,090 | 54.7% | 28.3% |
| Unclassified* | 4,450 | 1.1% | 19.1% |
| Canada | 395,280 | 100.0% | 30.6% |
- Note: Includes claims for which at least $1 of EI regular benefits was paid.
- * For some claims, this information was not available in the data.
- Source: Employment and Social development Canada, Employment Insurance (EI) administrative data. Data are based on a 10% sample of EI administrative data.
In the reporting year, almost two-thirds (62.1%) of all seasonal regular claims were established by men; however, the share of seasonal claims of total regular claims established by men (31.0%) was similar to the share established by women (29.9%). In terms of age groups, the largest share of seasonal regular claims was established by claimants aged between 25 and 44 years. Notably, the share of seasonal regular claims established by the younger claimants (aged 24 years and less) was particularly low (1.9%). This is because younger individuals are more likely to quit jobs and return to school—this is an invalid reason for job separation under the Employment Insurance Act and consequently they do not qualify to receive EI benefits (see subsection 2.2.2 for detailed discussion on coverage, eligibility and access to EI regular benefits). Because of this reason, younger individuals are less likely to meet the condition to be defined as seasonal claimants by having 3 or more EI regular or fishing claims in the 5 years preceding the reference year, with at least 2 of these claims having started at the same time of year as the claim in the reference year.
Seasonal workers in the Labour Force Survey
Every month, Statistics Canada provides information on employment, unemployment and other key labour market indicators by a variety of demographic characteristics through the Labour Force Survey (LFS). The LFS defines seasonal workers as those whose employment is in an industry where employment levels rise and fall with the seasons. This is different from the definition used for EI claim purposes, which is not related to a claimant’s industry of employment, but rather is based on the claimant’s recent history of EI regular or fishing benefits usage.
According to the LFS, there were 426,800 seasonal workers in Canada in FY1819*, representing 2.7% of total employment and 20.4% of temporary employment, virtually unchanged from last year. In Atlantic provinces, seasonal workers accounted for 5.7% of total employment. Compared to the previous year, Prince Edward Island had the largest increase in seasonal employment (+21.8%), whereas the largest decrease was observed in Alberta (-13.1%) and New Brunswick (-12.1%).
Historically, younger individuals aged between 15 and 24 years are more likely to work in seasonal jobs, attributed to summer employment patterns for students. Similar to the pattern observed for EI seasonal regular claims, men are also over-represented in seasonal employment—in FY1819, they accounted for 63.8% of all seasonal employment.
* Statistics Canada, Labour Force Survey, Table 14-10-0071-01.
In terms of industry classification, as outlined in Table 23, the services-producing industries accounted for the largest share of seasonal regular claims (54.7%) established in FY1819. However, seasonal claims as a share of total regular claims in the goods-producing industries (34.6%) was higher than the services-producing industries (28.3%). The larger share of seasonal regular claims of total regular claims established in the Atlantic provinces may be attributed to the composition of industries in that region, which contains a large share of goods-producing industries, leading to a much higher proportion of seasonal employment in these industries relative to the rest of the country.
The number of EI seasonal regular claims established throughout the year varies by quarter; for instance, nearly half (48.0%) of all seasonal regular claims established in FY1819 were established in the third quarter (October to December) of the fiscal year, while just over a quarter (27.1%) were established in the second quarter (July to September). The greater number of claims established in the third quarter of the fiscal year corresponds to the slowdown in many seasonal industries during that time of year. As illustrated in Chart 20, the share of seasonal regular claims established in the third quarter was the highest in Quebec, followed by the Atlantic provinces. Notably, the share of seasonal regular claims established in the second quarter of the fiscal year was particularly higher in Ontario and Western provinces relative to the rest of the country.
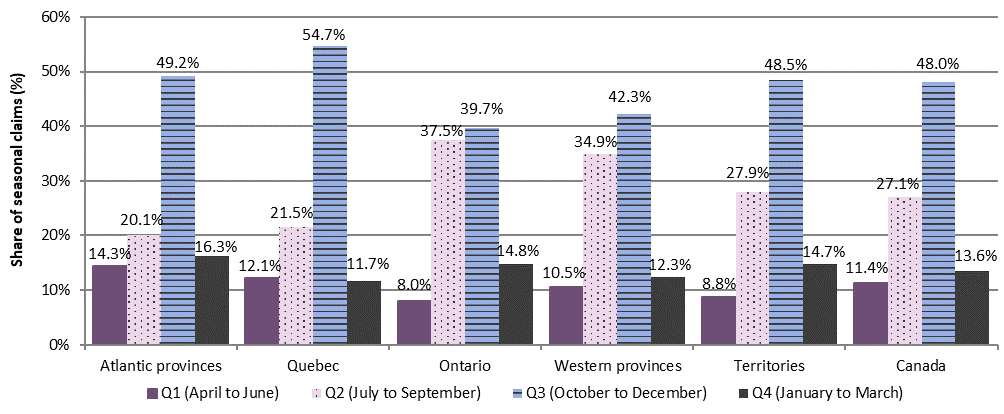
Text description of Chart 20
| Region | Q1 (April to June) | Q2 (July to September) | Q3 (October to December) | Q4 (January to March) |
|---|---|---|---|---|
| Atlantic provinces | 14.3% | 20.1% | 49.2% | 16.3% |
| Quebec | 12.1% | 21.5% | 54.7% | 11.7% |
| Ontario | 8.0% | 37.5% | 39.7% | 14.8% |
| Western provinces | 10.5% | 34.9% | 42.3% | 12.3% |
| Territories | 8.8% | 27.9% | 48.5% | 14.7% |
| Canada | 11.4% | 27.1% | 48.0% | 13.6% |
- Note: Includes claims for which at least $1 of EI regular benefits was paid.
- Source: Employment and Social development Canada, Employment Insurance (EI) administrative data. Data are based on a 10% sample of EI administrative data.
When analyzed by gender, seasonal regular claims by men are more likely to be established in the third quarter, while those by women are more likely to be established in the second quarter of the fiscal year. By industry classification, seasonal regular claims are more likely to be established in the third quarter by claimants in the goods-producing industries, while claimants in the services-producing industries are more likely to establish claims in the second quarter of the fiscal year. This is likely due to the summer “off-season” in the Educational services industry, reflecting school closures during that period of the year (see Table 24).
| Category | Distribution of seasonal regular claims in quarter 1 (April to June) (%) | Distribution of seasonal regular claims in quarter 2 (July to September) (%) | Distribution of seasonal regular claims in quarter 3 (October to December) (%) | Distribution of seasonal regular claims in quarter 4 (January to March) (%) |
|---|---|---|---|---|
| Men | 8.7% | 13.3% | 61.1% | 16.9% |
| Women | 15.8% | 49.5% | 26.6% | 8.1% |
| Goods-producing-industries | 6.3% | 12.3% | 64.3% | 17.1% |
| Services-producing industries | 15.5% | 39.2% | 34.6% | 10.6% |
| Unclassified* | 8.3% | 13.9% | 58.4% | 19.3% |
| Canada | 11.4% | 27.1% | 48.0% | 13.6% |
- Note: Includes claims for which at least $1 of EI regular benefits was paid.
- * For some claims, this information was not available in the data.
- Source: Employment and Social Development Canada, Employment Insurance (EI) administrative data. Data are based on a 10% sample of EI administrative data.
Duration of Employment Insurance regular benefits among seasonal claimants
The average maximum entitlementFootnote 53 of seasonal regular claims completedFootnote 54 in the reporting fiscal year was 28.3 weeks, down from 29.8 weeks (-1.5 weeks or -5.2%) in FY1718. In comparison, the average maximum entitlement of completed non-seasonal regular claims was 31.1 weeks in the reporting fiscal year, down from 33.8 weeks (-2.7 weeks or -7.9%) in FY1718.
The average actual durationFootnote 55 of seasonal regular claims completed in FY1819 was 16.0 weeks, decreasing from 17.9 weeks (-1.9 weeks or -10.7%) in FY1718. In comparison, the average actual duration of non-seasonal regular claims in FY1819 was 19.2 weeks, decreasing from 21.2 weeks (-2.1 weeks or -9.7%) in FY1718. The average maximum entitlement and the average actual duration of seasonal regular claims are generally shorter than those for non-seasonal regular claims, reflecting the fact that seasonal claimants typically accumulate fewer hours of insurable employment prior to establishing a claim than non-seasonal claimants.
Changing trends in the time period between claims for Employment Insurance regular claims
A recent study by ESDC* examined the changes in time between EI repeat regular claims over the 2001 to 2016 period and the demographic differences associated with time between claims.
The study found that about 47% of EI regular claims were followed by a successive claim for EI regular benefits within 1 year following the end of the first claim. Overall, the average number of weeks between claims and the average number of weeks worked between claims decreased over time. The average weeks between the start dates of claims remained stable at around 56 weeks, suggesting that the seasonality of a job played an important role among repeat regular claims because seasonal claimants establish their claims at the same time of year.
It was found that approximately 63.5% of repeat regular claims were seasonal claims and this share did not vary over time. Seasonal claimants had a shorter period of time and fewer weeks worked between claims compared to non-seasonal claimants. Non-seasonal claimants, however, had a more consistent share of weeks worked between claims over time compared to seasonal claimants. In addition, the majority of seasonal claimants returned to the same employer in comparison to non-seasonal claimants. The profile of repeat claimants was comparable for seasonal and non-seasonal claims; men, older claimants, those living in Atlantic provinces and those working in goods-producing industries had fewer weeks between claims.
*ESDC. Weeks between repeat regular claims. (Ottawa: ESDC, Employment Insurance Policy Directorate, 2020).
Pilot project: Additional weeks of EI regular benefits for seasonal claimants in 13 EI economic regions
Following the commitment made in Budget 2018 to support seasonal workers over the next 2 years, a new pilot project (number 21) was introduced in August 2018 to provide additional weeks of EI regular benefits to eligible seasonal claimants in 13 EI economic regions*. Under this pilot project, eligible seasonal claimants in these 13 EI regions who start a benefit period between August 5, 2018 and May 30, 2020 would be eligible for up to 5 additional weeks of EI regular benefits.
As the pilot project affected eligible seasonal regular claims whose benefit period started on August 5, 2018 in the reporting year, the availability of data to report on the number of affected claims is limited in the extent of this report. Because average maximum entitlements and average actual durations are based on completed claims, the full effect of this pilot project on the maximum entitlement and average durations of EI regular claims by seasonal claimants, as well as the number of affected claims and additional amounts paid over more than a fiscal year will be reported in next year’s Employment Insurance Monitoring and Assessment Report, as more mature data becomes available.
* These selected EI economic regions are: Newfoundland-Labrador (excluding St. John’s), Charlottetown, Prince Edward Island, Eastern Nova Scotia, Western Nova Scotia, Madawaska-Charlotte, Restigouche-Albert, Gaspésie-Îles-de-la-Madeleine, Central Quebec, North Western Quebec, Lower Saint Lawrence and North Shore, Chicoutimi-Jonquière and Yukon (excluding Whitehorse).
Overlapping definitions of seasonal and frequent claimants
Frequent EI claimants are defined as those who have had 3 or more regular or fishing claims and have collected benefits for more than 60 weeks in total within the past 5 years. There is a significant overlap between frequent and seasonal claimants.Footnote 56
Frequent and seasonal EI claimants differ in 2 criteria:
- frequent claimants must have received more than 60 weeks of EI regular or fishing benefits, whereas seasonal claimants do not need to have received EI benefits for a specific number of weeks, and
- the timing of establishing claims determines a claimant’s status as seasonal, whereas this is not the case for defining frequent claimants
Chart 21 outlines the number of EI regular claims established by frequent and seasonal claimants in the past 10 years. During this period, in terms of EI regular benefits, the number of seasonal claimants were much higher than the frequent claimants. This suggests that many seasonal regular claimants collect less than 60 weeks of EI regular benefits over the course of 5 fiscal years, while a large proportion of frequent claimants can also be considered seasonal. This is evident in Chart 22—in FY1819, the number of claims established by seasonal and frequent claimants (235,400) were almost 1.5 times the number of claims established by seasonal claimants that were non-frequent claimants (159,900).

Text description of Chart 21
| Category | Distribution of seasonal regular claims in quarter 1 (April to June) (%) | Distribution of seasonal regular claims in quarter 2 (July to September) (%) | Distribution of seasonal regular claims in quarter 3 (October to December) (%) | Distribution of seasonal regular claims in quarter 4 (January to March) (%) |
|---|---|---|---|---|
| Men | 8.7% | 13.3% | 61.1% | 16.9% |
| Women | 15.8% | 49.5% | 26.6% | 8.1% |
| Goods-producing-industries | 6.3% | 12.3% | 64.3% | 17.1% |
| Services-producing industries | 15.5% | 39.2% | 34.6% | 10.6% |
| Unclassified* | 8.3% | 13.9% | 58.4% | 19.3% |
| Canada | 11.4% | 27.1% | 48.0% | 13.6% |
- Note: Includes claims for which at least $1 of EI regular benefits was paid.
- * See Annex 2.1 for definitions of frequent and seasonal claimants referenced in this chart.
- Source: Employment and Social Development Canada, Employment Insurance (EI) administrative data. Data are based on a 10% sample of EI administrative data.
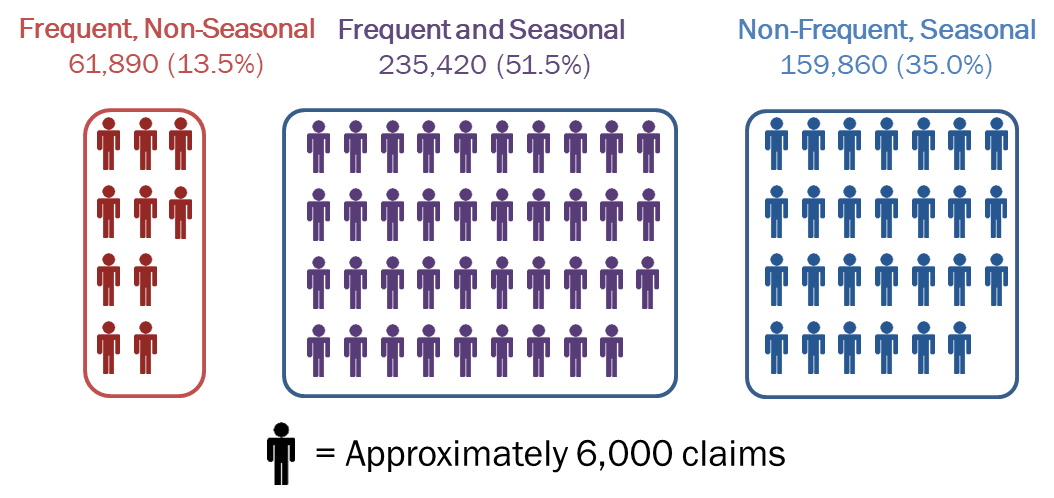
Text description of Chart 22
| Category | Frequent, non-seasonal | Frequent and seasonal | Non-frequent, seasonal |
|---|---|---|---|
| Level of claims | 61,890 | 235,420 | 159,860; |
| Share of total frequent and seasonal claims | 13.5% | 51.5% | 35.0% |
- Note: Includes claims for which at least $1 of EI regular benefits was paid.
- *See Annex 2.1 for definitions of frequent and seasonal claimants referenced in this chart.
- Source: Employment and Social Development Canada, Employment Insurance (EI) administrative data. Data are based on a 10% sample of EI administrative data.
As outlined in Table 25, the 2 non-overlapping populations by claimant type (that are, the frequent, non-seasonal claimants and the non-frequent, seasonal claimants) had different characteristics in terms of duration, proportion of regular benefits paid and exhaustion rate in FY1819. Frequent non-seasonal claimants were paid, on average, for a much longer duration, used a greater proportion of their regular weeks of entitlement and were more likely to exhaust their entitlement than non-frequent, seasonal claimants. However, once defined as frequent claimants, there are no observed differences in the proportion of regular weeks paid and the exhaustion rate between non-seasonal and seasonal claimants.
| Claimant type | Average duration of EI regular benefits (in weeks)p | Proportion of regular benefits paid (%)p | Exhaustion rate (%)p |
|---|---|---|---|
| Frequent, non-seasonal | 23.2 | 74.0% | 34.5% |
| Frequent and seasonal | 19.6 | 74.3% | 33.2% |
| Non-frequent, seasonal | 10.9 | 40.2% | 8.6% |
- Note: Completed claims include those that are terminated and those that are dormant and remained inactive as of August the following fiscal year.
- * See Annex 2.1 for definitions of frequent and seasonal claims referenced in this table.
- P Preliminary data.
- Source: Employment and Social Development Canada, Employment Insurance (EI) administrative data. Data are based on a 10% sample of EI administrative data.
2.2.6 Exhaustion of Employment Insurance regular benefits
Claimants have exhausted their entitlement to Employment Insurance regular benefits when the number of weeks of benefits received (actual duration) equals the entitlement available over the course of the benefit period. The incidence of exhaustion of regular benefit entitlement can inform analysis related to the adequacy of EI regular benefits provided to those looking for suitable employment following a job separation. Since a claim must be completedFootnote 57 in order to determine whether the entitlement is exhausted or non-exhausted, the analysis in this section focuses on EI regular claims completed during FY1819, regardless of the claim's start date.
Entitlement exhaustion of Employment Insurance regular benefits
Of the EI regular claims completed during FY1819, 445,500 claims (32.4%) were completed with their regular benefit entitlement exhausted. As shown in Chart 23, the volume of EI regular claims with exhausted entitlement has decreased from 484,000 to 445,500, representing 38,500 claims or -8.0% between FY1718 and FY1819, after remaining relatively stable at around 485,000 over the past 2 years. This decline can be attributed to an improvement in economic conditions observed in 2018 and during the first quarter of 2019. During the reporting period, the national unemployment rate fell to an average of 5.8%, down from 6.1% in FY1718, the lowest annual rate since 1976. Over the same period, employment continued to strengthen in the second half of 2018 and during the first half of 2019 supported by growth in full-time jobs and among private sector workers - see Chapter 1 for detailed discussion on Canada's labour market in FY1819.
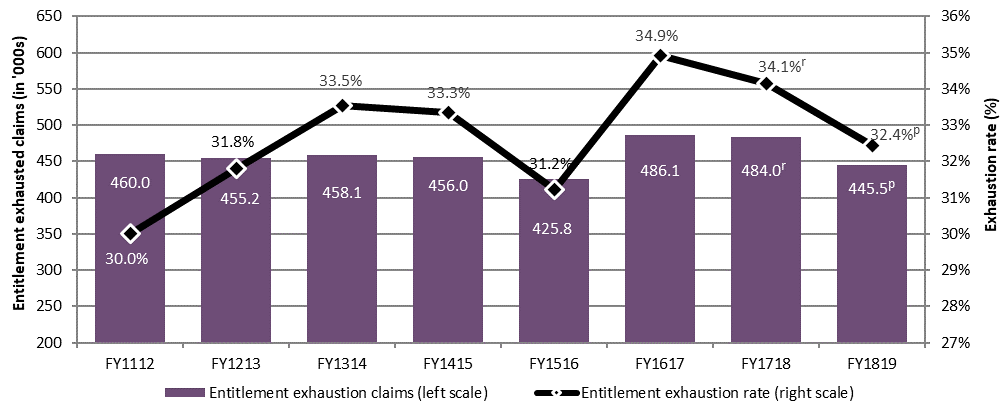
Text description of Chart 23
| Entitlement | FY1112 | FY1213 | FY1314 | FY1415 | FY1516 | FY1617 | FY1718 | FY1819 |
|---|---|---|---|---|---|---|---|---|
| Entitlement exhaustion claims (in thousands) (left scale) | 460.0 | 455.2 | 458.1 | 456.0 | 425.8 | 486.1 | 484.0 | 445.5 |
| Entitlement exhaustion rate (right scale) | 30.0% | 31.8% | 33.5% | 33.3% | 31.2% | 34.9% | 34.1% | 32.4% |
- Note: Includes completed claims for which at least $1 of regular benefits was paid.
- r Revised data.
- p Preliminary data.
- Source: Employment and Social Development Canada, Employment Insurance (EI) administrative data. Data are based on a 10% sample of EI administrative data.
In FY1819, the exhaustion rates decreased in all provinces and territories, except New Brunswick, Ontario and Alberta where they were relatively unchanged. As illustrated in Table 26, the most notable decreases in exhaustion rates were in Newfoundland and Labrador, the territories, Saskatchewan and Nova Scotia. By gender, claims established by women tend to have a higher entitlement exhaustion rate than those established by men. This is due, in part, to women on average qualifying for fewer weeks of EI regular benefit entitlement. Among age groups, claims established by claimants aged 55 years old and over posted the highest exhaustion rate (38.8%), followed by claimants under 25 years old (32.9%). The remaining 2 age groups had a lower exhaustion rate than the national level.
| Category | Entitlement exhaustion rate FY1718 |
Entitlement exhaustion rate FY1819p |
Entitlement exhaustion rate Change (ppts) |
Benefit period exhaustion rate FY1718 |
Benefit period exhaustion rate FY1819p |
Benefit period exhaustion rate Change (ppts) |
|---|---|---|---|---|---|---|
| Newfoundland and Labrador | 45.2%r | 36.0% | -9.3 | 19.1% | 23.1% | +4.0 |
| Prince Edward Island | 34.6%r | 32.2% | -2.3 | 28.6% | 20.4% | -8.2 |
| Nova Scotia | 40.9%r | 37.6% | -3.4 | 22.6% | 21.0% | -1.6 |
| New Brunswick | 34.8%r | 34.9% | 0.0 | 30.1% | 21.2% | -9.0 |
| Quebec | 31.6%r | 29.3% | -2.4 | 22.8% | 20.0% | -2.9 |
| Ontario | 32.0%r | 32.1% | +0.1 | 15.9% | 15.9% | 0.0 |
| Manitoba | 35.1%r | 32.5% | -2.7 | 19.2% | 18.9% | -0.3 |
| Saskatchewan | 37.8%r | 33.2% | -4.6 | 9.8% | 16.1% | +6.3 |
| Alberta | 35.7%r | 35.2% | -0.5 | 7.8% | 13.0% | +5.2 |
| British Columbia | 35.9%r | 34.0% | -1.9 | 12.9% | 15.6% | +2.7 |
| Yukon | 49.2%r | 42.5% | -6.6 | 8.9% | 12.6% | +3.7 |
| Northwest Territories | 50.6% | 45.7% | -4.9 | 16.7% | 16.0% | -0.7 |
| Nunavut | 43.9%r | 39.2% | -4.7 | 7.3% | 8.8% | +1.5 |
| Men | 33.3%r | 31.9% | -1.4 | 19.0% | 18.6% | -0.4 |
| Women | 35.4%r | 33.3% | -2.1 | 16.9% | 16.6% | -0.3 |
| 24 years old and under | 33.5%r | 32.9% | -0.6 | 14.8% | 15.5% | +0.7 |
| 25 to 44 years old | 31.3%r | 29.4% | -1.8 | 16.9% | 17.5% | +0.6 |
| 45 to 54 years old | 32.5%r | 31.0% | -1.5 | 20.2% | 19.5% | -0.7 |
| 55 years old and over | 41.3%r | 38.8% | -2.4 | 19.9% | 17.8% | -2.2 |
| Long-tenured workers* | 25.6%r | 26.0% | +0.4 | 15.6% | 18.0% | +2.4 |
| Occasional claimants* | 36.3%r | 34.9% | -1.5 | 16.0% | 16.4% | +0.4 |
| Frequent claimants* | 39.0%r | 33.5% | -5.5 | 26.5% | 21.1% | -5.5 |
| Canada | 34.1%r | 32.4% | -1.7 | 18.2%r | 17.8% | -0.3 |
- Note: Change in percentage points is based on unrounded numbers. Includes all completed claims for which at least $1 of regular benefits was paid.
- * See Annex 2.1 for definitions of claimant categories referenced in this table.
- r Revised data.
- p Preliminary data.
- Source: Employment and Social Development Canada, Employment Insurance (EI) administrative data. Data are based on a 10% sample of EI administrative data.
Benefit period exhaustion vs entitlement exhaustion
Claims may also end because their benefit period - the period during which an EI claimant can receive EI benefitsFootnote 58 - ends before all potential regular benefit weeks of entitlement have been paid. When this occurs, unless the claimant has stopped filing EI biweekly reportsFootnote 59, the claim is considered to have exhausted its benefit period. Claims that exhausted their benefits periods represented 17.8% of all completed regular claims in FY1819 (see Table 26).
The circumstances that result in benefit period exhaustion are generally different than those associated with entitlement exhaustion. There are many variables that influence benefit period exhaustion. These include regular benefit entitlement, weeks worked while on claim (leading to deferred benefit weeks) and the use of special benefits (adding another type of entitlement to the claim).
For instance, a much greater proportion of claims that exhausted the benefit period were associated with at least 1 week worked while on claim (70.6% in FY1819) compared with claims that were completed by entitlement exhaustion (33.7%) (see Table 27). Claims that exhausted the benefit period through Working While on Claim had, on average, a greater number of weeks worked while on claim (15 weeks in FY1819) compared to claims that exhausted their entitlement (11.5 weeks in FY1819). Claimants who exhaust their benefit period are thus more likely to accumulate enough hours of insurable employment during their benefit period to meet the eligibility requirements to establish a new claim following the end of their claim. As a result, a much greater proportion of claimants who exhausted their benefit period requalified for a new claim within 4 weeks following the termination of their claim (69.9% in FY1819 compared to 9.9% for claims that exhausted their entitlement).
| Category | Entitlement exhausted claims FY1718r | Entitlement exhausted claims FY1819p | Benefit period exhausted claims FY1718r | Benefit period exhausted claims FY1819p |
|---|---|---|---|---|
| Exhaustion rate ─ Overall | 34.1% | 32.4% | 18.2% | 17.8% |
| Exhaustion rate ─ Seasonal claim | 26.5% | 23.0% | 28.9% | 23.8% |
| Exhaustion rate ─ Non-seasonal claim | 37.3% | 36.3% | 13.7% | 15.4% |
| Exhaustion rate by local unemployment rate at the time the claim was established: 6.0% or less |
32.4% | 32.1% | 11.9% | 15.7% |
| Exhaustion rate by local unemployment rate at the time the claim was established: 6.1% to 8.0% |
33.6% | 31.7% | 18.6% | 17.2% |
| Exhaustion rate by local unemployment rate at the time the claim was established: 8.1% to 10.0% |
36.0% | 35.7% | 18.0% | 21.1% |
| Exhaustion rate by local unemployment rate at the time the claim was established: 10.1% to 13.0% |
34.7% | 32.8% | 14.2% | 19.1% |
| Exhaustion rate by local unemployment rate at the time the claim was established: 13.1% or above |
36.3% | 33.6% | 28.2% | 22.9% |
| Proportion of claims involving at least 1 week worked while on claim | 35.7% | 33.7% | 72.2% | 70.6% |
| Requalification rate for EI benefits* | 11.2% | 9.9% | 69.3% | 69.9% |
| Average weeks worked while on claim** | 12.1 | 11.5 | 16.3 | 15.0 |
| Average weeks of regular benefits paid | 28.8 | 26.3 | 19.0 | 17.8 |
| Share of mixed claims (collected special benefits) | 10.6% | 11.8% | 18.6% | 18.4% |
| Average proportion of regular entitlement used | 100.0% | 100.0% | 56.6% | 55.4% |
- Note: Includes all completed claims for which at least $1 of regular benefits was paid.
- r Revised data
- p Preliminary data
- * Requalification rate refers to the proportion of claimants who are able to requalify for a new claim within 4 weeks following the termination of their claim.
- ** Includes only claims with at least 1 week worked while on claim.
- Source: Employment and Social Development Canada, Employment Insurance (EI) administrative data. Data are based on a 10% sample of EI administrative data.
Exhaustion type is also reflective of the characteristics of a beneficiary's claim. A greater share of claims that have exhausted their benefit period had an interaction with special benefits (18.4%) compared with claims that exhausted their entitlement (11.8%). Claims that exhausted the benefit period were also paid fewer weeks of EI regular benefits (17.8 weeks) compared to claims that exhausted their entitlement (26.3 weeks).
Entitlement exhaustion of Employment Insurance regular benefits: seasonal and non-seasonal gappers
Entitlement exhaustion rates for the current reporting year are lower for seasonal claimsFootnote 60 (23.0%) than non-seasonal claims (36.3%) (see Table 27). This is attributable to the fact that many seasonal employees are laid off temporarily and are likely to find work in the same industry and possibly with the same employer the following season.
Claimants who exhaust their entitlement weeks without finding work may go through a period without income from either employment or EI benefits. These claimants, known as “gappers”, have not accumulated sufficient hours of insurable employment during their qualifying period for their entitlement to cover the entire duration of their unemployment spell. While this is especially common for seasonal claimants, it can affect non-seasonal claimants as well.
Starting with the FY1718 EI Monitoring and Assessment Report, the definition of gappers was broadened to better represent the levels of EI claimants experiencing periods with no income. To be considered a gapper, a claimant must have established a regular claim during the reporting fiscal year, have completed their previous regular benefit claim during the reporting fiscal year or the previous fiscal year and must have experienced a period without employment income or EI income immediately following the exhaustion of the preceding claim. The period with no income must be 15 weeks or less. Of the 1.29 million regular claims in FY1819, approximately 83,750 (6.5%) experienced a gap in income. There were 38,100 seasonal claimants and 45,650 non-seasonal claimants (see Table 28) that experienced a gap in income. Of the 83,750 gappers, the average length of their gap was 5.3 weeks.
| Claimant type | FY1718 | FY1819 | Change (%) |
|---|---|---|---|
| Seasonal | 33,020 (44.1%) |
38,100 (45.5%) |
+15.4% |
| Non-seasonal | 41,820 (55.9%) |
45,650 (54.5%) |
+9.2% |
| Total | 74,840 (100.0%) |
83,750 (100.0%) |
+11.9% |
| Average gap length (week) | 5.0 | 5.3 | +5.1% |
- Notes: Includes claims for which at least $1 of EI regular benefits was paid. Percentage change is based on unrounded numbers.
- Source: Employment and Social Development Canada, Employment Insurance (EI) administrative data. Data are based on a 10% sample of EI administrative data.
The regional distribution of these gappers is presented in Chart 24. All provinces and territories, except Ontario, Alberta and British Columbia, were overrepresented among gappers compared to the overall national share of gappers (6.5%). This is mostly attributable to the composition of the local labour markets.

Text description of Chart 24
| Region | Gapper claims | Share of all regular claims |
|---|---|---|
| Newfoundland and Labrador | 5,160 | 7.7% |
| Prince Edward Island | 1,510 | 9.7% |
| Nova Scotia | 5,270 | 8.5% |
| New Brunswick | 6,340 | 9.3% |
| Quebec | 26,890 | 7.0% |
| Ontario | 19,000 | 5.2% |
| Manitoba | 3,030 | 7.1% |
| Saskatchewan | 2,360 | 6.3% |
| Alberta | 6,630 | 5.2% |
| British Columbia | 7,130 | 5.9% |
| Territories | 430 | 10.4% |
| Canada | 83,750 | 6.5% |
- Note: Includes claims for which at least $1 of EI regular benefits was paid.
- Source: ESDC, Employment Insurance (EI) administrative data. Data are based on a 10% sample of EI administrative data.
2.2.7 Working while on claim
The purpose of the Working While on Claim (WWC) provision of the Employment Insurance Act is to encourage claimants to accept available jobs while receiving EI benefits to enable them to earn additional income while on claim, maintain their skills and remain connected to the labour market. The provision, which existed under legislation or pilot projects, is intended to determine how EI benefits will be adjusted to reflect earned employment income. It allows claimants to keep their total employment earnings and continue to receive a portion of their EI benefits. If benefits are reduced to zero, then the week of entitlement is deferred and can be used later during the benefit period.Footnote 61
In FY1819, the effective WWC provision was linked to Pilot Project 20Footnote 62 (in place from August 7, 2016 to August 11, 2018) and to the default earnings rule under this Pilot Project; that is, the “50 cents on the dollar rule” that became a permanent part of the EI program as of August 12, 2018. Under this rule, claimants can keep 50 cents of their EI benefits for every dollar earned while on claim, up to a maximum of 90% of the average weekly insurable earnings used to calculate their weekly benefit rate, before benefits are deducted dollar-for-dollar.Footnote 63
Some eligible claimantsFootnote 64 may choose a temporary alternate earnings rule that allows them to earn $75 per week or 40% of their weekly benefits, whichever is greater, without their EI benefits being reduced; any amount earned above is deducted from their benefits dollar-for-dollar. This alternate earnings rule is in place for a three-year transition period until August 14, 2021.
Throughout the reporting period, the WWC provision applied to EI claimants receiving regular, fishing, parental, compassionate care and family caregiver benefits for children or adults. Since August 12, 2018, sickness and maternity beneficiaries have also been eligible for the WWC rules.Footnote 65
This subsection focuses on claims and their beneficiaries who reported employment income from part-time or full-time work in at least 1 week while on claim, regardless of whether the EI benefits paid for those weeks were completed in full, partial or 0. It is important to note that the WWC provisions also apply to many other forms of income, such as pensions or severance pay, which are not included in the results presented.
Number of Employment Insurance regular claims and claimants working while on claim
The use of the WWC provision is presented using 2 different approaches: one based on claimants who had an active regular claimFootnote 66 during the reporting fiscal year (regardless of the year in which their claim was established) and the other based on regular claims completed in the reporting fiscal year. These 2 approaches provide different but complementary WWC results. The first approach, which focuses on the WWC activity in the fiscal year under review, better reflects the labour market conditions and WWC provisions in effect during the reporting period. The second approach provides a better estimate of the relative incidence of WWC because it is based on the entire duration of the claim (rather than a specific time period as under the first approach).
Of all EI regular benefit claimants with an active claim in FY1819, 730,000 (or 43.1%) worked at least 1 week while on claim in that fiscal year (see Table 29). In that same period, 49.8% of all completed regular claims included at least 1 week worked while on claim.
| Category | Number of claimants with an active claim during the fiscal year who have worked at least 1 week while on claim during the fiscal year | Share (%) of claimants with an active claim during the fiscal year who have worked at least 1 week while on claim during the fiscal year | Numberp of completed claims with at least 1 week worked while on claim over a claim’s life | Sharep (%) of completed claims with at least 1 week worked while on claim over a claim’s life |
|---|---|---|---|---|
| Newfoundland and Labrador | 44,970 | 53.8% | 44,280 | 60.8% |
| Prince Edward Island | 8,790 | 46.4% | 8,610 | 51.2% |
| Nova Scotia | 38,030 | 48.3% | 35,410 | 54.5% |
| New Brunswick | 42,820 | 51.4% | 40,240 | 57.1% |
| Quebec | 247,180 | 51.0% | 230,800 | 56.4% |
| Ontario | 173,270 | 36.1% | 157,030 | 41.5% |
| Manitoba | 20,020 | 35.8% | 19,310 | 43.7% |
| Saskatchewan | 19,280 | 35.7% | 18,960 | 45.4% |
| Alberta | 67,240 | 35.9% | 65,300 | 46.2% |
| British Columbia | 66,410 | 40.4% | 61,740 | 47.9% |
| Territories | 2,160 | 36.4% | 1,920 | 42.6% |
| Men | 431,560 | 41.6% | 407,900 | 48.5% |
| Women | 298,610 | 45.3% | 275,700 | 51.8% |
| 24 years old and under | 62,660 | 40.8% | 62,060 | 49.4% |
| 25 to 44 years old | 344,320 | 46.1% | 325,620 | 53.9% |
| 45 to 54 years old | 181,760 | 49.7% | 171,470 | 57.1% |
| 55 years old and over | 141,430 | 32.9% | 124,450 | 36.2% |
| Seasonal* | n/a | n/a | 222,470 | 56.0% |
| Non-seasonal | n/a | n/a | 461,130 | 47.3% |
| Canada | 730,170 | 43.1% | 683,600 | 49.8% |
- Note: Includes all claimants (or claims) to which at least $1 of regular benefits was paid.
- p Preliminary.
- * See Annex 2.1 for definitions of seasonal claims referenced in this table.
- Source: Employment and Social Development Canada, Employment Insurance (EI) administrative data. Data are based on a 10% sample of EI administrative data.
The proportion of regular benefit claimants (or completed claims) with at least 1 week worked while on claim varies by, among other things, region and industry, which may be partly explained by local labour market conditions in the regions where the claimants resided. The greater shares of EI regular benefit claimants who worked at least 1 week while on claim are related to regions and industries that have a higher proportion of seasonal claimants, such as the Atlantic provinces (50.9%), Quebec (51.0%), and the Educational services (57.7%) and Construction (48.6%) industries. This may be due in part to limited available hours of work during the “off-peak season” and better opportunities for re-employment should the benefit period of claimants exceed the “off-peak season” duration.
Weeks worked while on claim
This subsection examines the WWC provision in relation to the number of weeks worked while on claim. Specifically, it examines whether employment income was reported during a week in which a claimant was entitled to receive EI regular benefits during the fiscal year, regardless of when the claim was established.
The proportion of weeks of EI regular benefits worked while on claim (23.4% in FY1819) among weeks for which claimants were entitled to receive EI regular benefits remained largely unchanged from the previous fiscal year, and remained relatively stable over the past 4 years after declining since early 2010 (see Chart 25). The average number of weeks worked while on claim, which has followed a slight downward trend in recent years, decreased slightly from 11.4 weeks in FY1718 to 10.9 weeks in FY1819.
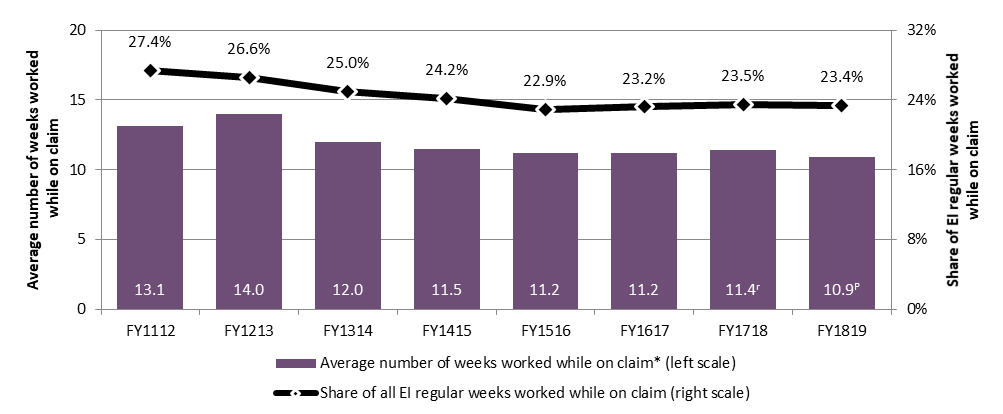
Text description of Chart 25
| Category | FY1112 | FY1213 | FY1314 | FY1415 | FY1516 | FY1617 | FY1718 | FY1819 |
|---|---|---|---|---|---|---|---|---|
| Average number of weeks worked while on claim (left scale) | 13.1 | 14.0 | 12.0 | 11.5 | 11.2 | 11.2 | 11.4 | 10.9 |
| Share of all EI regular weeks worked while on claim (right scale) | 27.4% | 26.6% | 25.0% | 24.2% | 22.9% | 23.2% | 23.5% | 23.4% |
- Note: Includes all claims for which at least $1 of regular benefits was paid.
- * Based on claims completed during the fiscal year.
- r Revised.
- P Preliminary estimates.
- Source: ESDC, Employment Insurance (EI) administrative data. ESDC data are based on a 10% sample of EI administrative data.
An analysis by demographic characteristics shows that the proportion of weeks worked while on claim varied in the same way as the proportion of claimants who worked at least 1 week while on claim. Seasonal claimants, women, claimants aged 45 to 54, and claimants in the Atlantic and Quebec provinces had higher proportions of weeks worked while on claim than the national average (see Table 30).
| Category | FY1415 | FY1516 | FY1617 | FY1718 | FY1819 |
|---|---|---|---|---|---|
| Newfoundland and Labrador | 27.0% | 25.8% | 27.4% | 25.9% | 26.7% |
| Prince Edward Island | 25.9% | 25.1% | 26.0% | 25.2% | 23.1% |
| Nova Scotia | 27.8% | 26.7% | 26.7% | 26.6% | 26.0% |
| New Brunswick | 32.4% | 31.2% | 31.7% | 32.9% | 30.8% |
| Quebec | 31.2% | 31.2% | 32.5% | 32.7% | 32.8% |
| Ontario | 17.7% | 17.1% | 17.1% | 16.7% | 16.5% |
| Manitoba | 12.7% | 12.1% | 12.4% | 12.8% | 12.8% |
| Saskatchewan | 12.9% | 12.6% | 13.3% | 13.5% | 12.5% |
| Alberta | 11.8% | 10.7% | 13.5% | 14.5% | 14.0% |
| British Columbia | 19.9% | 18.7% | 19.4% | 19.6% | 19.0% |
| Territories | 11.1% | 12.5% | 11.4% | 10.5%r | 11.7% |
| Men | 23.1% | 21.5% | 22.0% | 22.5% | 22.7% |
| Women | 26.1% | 25.6% | 25.4% | 25.3% | 24.6% |
| 24 years old and under | 22.7% | 21.1% | 21.4% | 22.4% | 22.6% |
| 25 to 44 years old | 25.0% | 23.7% | 24.3% | 24.9% | 25.2% |
| 45 to 54 years old | 29.5% | 28.2% | 28.3% | 28.9% | 28.6% |
| 55 years old and over | 17.7% | 16.9% | 17.0% | 17.1% | 16.8% |
| Seasonal** | 32.1% | 31.1% | 31.7% | 31.3% | 29.9% |
| Non-seasonal | 20.5% | 19.4% | 19.8% | 20.5% | 20.7% |
| Canada | 24.2% | 22.9% | 23.2% | 23.5% | 23.4% |
- Note: Includes all claims for which at least $1 of regular benefits was paid.
- * Data are based on the weeks worked while on claim during the specified period, regardless of when the claim was established.
- ** See Annex 2.1 for definitions of seasonal claims referenced in this table.
- r Revised.
- Source: Employment and Social Development Canada, Employment Insurance (EI) administrative data. Data are based on a 10% sample of EI administrative data.
Overall, changes to the WWC pilot projects over the years since 2005, combined with changes in economic conditions, have contributed, at various levels, to encouraging claimants to work more while on claim and to changing trends in the number of weeks worked while on claim and in the intensity of work. A 2018 departmental evaluationFootnote 67 of the impact of the various WWC pilot projects confirmed these observations.
The evaluation first examined the effects of Pilot Projects 8, 12 and 17Footnote 68 compared to previous legislative rules. Those pilot projects increased the eligibility threshold of employment income that claimants could earn to $75 or 40% of the weekly benefit rate (whichever is greater) before benefits were reduced dollar-for-dollar, compared to $50 or 25% of the weekly benefit under the Act. The evaluation results demonstrated that Pilot Projects 8, 12 and 17 partially met the objective of encouraging claimants to work more while on claim. They increased the likelihood of claimants working, but only for levels of work where claimants could still receive all or part of their benefits. They reduced the probability of working for claimants whose EI benefits were reduced to zero. As a result, the evaluation indicated that the duration of work performed while on claim did not increase under Pilot Projects 8, 12 and 17.
The evaluation also compared the impact of Pilot Projects 8, 12 and 17 to those of Pilot Projects 18 and 19Footnote 69, which had the same parameters as Pilot Project 20 in effect during the fiscal year under review; that is, the “50 cents on the dollar rule”. Unlike previous EI pilot projects where EI benefits were reduced dollar-for-dollar above a set threshold, a claimant’s total income (EI benefits and employment earnings) increased proportionately to the number of hours worked until it reached 90% of weekly insurable earnings under Pilot Projects 18 and 19. The results of the evaluation showed that the latter pilots encouraged claimants not eligible to revert to the alternate earnings ruleFootnote 70 (97% of claimants) to work more while on claim for all levels of earned employment income. The greatest impact was observed for levels of work above which claimants received more EI benefits compared to previous pilot projects. The evaluation also found that the number of weeks worked increased by approximately 1 week under Pilot Projects 18 and 19. However, they discouraged the majority of claimants eligible for the alternate earnings rule (that is, the remaining 3% of claimants) who were less likely to work than under previous pilot projects.
As a result, the provisions of the most recent pilot projects in effect have likely smoothed the distribution of hours worked by EI claimants, compared to other pilot projects or the legislation, and have contributed to a greater intensity of work.
This increase in work intensity since the implementation of WWC Pilot Project 18 is also reflected in the average weekly earnings (that is, weekly EI regular benefits and employment earnings) of EI regular claimants who worked while on claim. Table 31 shows that the difference, in real terms, between the total weekly income of claimants who work while on claim and those who do not work is larger since the provisions of Pilot Project 18 came into effect in August 2012. This large difference is mainly due to higher real average weekly employment earnings reported during weeks worked while on claim, under the provisions of Pilot Projects 18, 19 and 20 ($794 in the fiscal year covered in the report). Table 31 also shows that although claimants who worked while on claim had, on average, a higher total weekly income over the entire claim period compared to those who did not work while on claim, they received on average less EI benefits ($325 per week compared to $436 for those who did not work while on claim).
| Income type | FY1112 Pilots 12 and 17 |
FY1213 Pilots 12, 17 and 18 |
FY1314 Pilots 17 and 18 |
FY1415 Pilot 18 |
FY1516 Pilots 18 and 19 |
FY1617 Pilots 18, 19 and 20 |
FY1718 Pilot 20 |
FY1819 Pilot 20 and legislative change |
|---|---|---|---|---|---|---|---|---|
| (A) Claims without WWC: Average real weekly income (EI regular benefits only) | $399 | $405 | $417 | $428 | $437 | $441 | $436 | $436 |
| (B) Claims with WWC (all weeks**): Average real weekly EI regular benefits | $301 | $300 | $303 | $314 | $326 | $332 | $330 | $325 |
| (C) Claims with WWC (all weeks**): Average real weekly employment earnings | $279 | $306 | $314 | $316 | $311 | $307 | $311 | $321 |
| (D=B+C) Claims with WWC (all weeks**): Average real weekly income (EI regular benefits and employment earnings) | $581 | $605 | $617 | $629 | $637 | $640 | $641 | $645 |
| (D-A) Difference in average real weekly income between claims with WWC and claims without WWC | +$182 | +$201 | +$201 | +$201 | +$199 | +$199 | +$205 | +$210 |
| Claims with WWC: Average real weekly employment earnings during weeks worked only*** | $657 | $684 | $748 | $767 | $784 | $782 | $779 | $794 |
- Note: Based on completed claims which include those that are terminated and those that are dormant and remained inactive as of August the following fiscal year.
- * Earnings and EI benefits are adjusted in real FY1819 dollars using the All Items Consumer Price Index.
- ** Claims working while on claim in this report includes claims with deferred weeks of EI benefits (that have thus $0 of EI benefits paid and high amount of employment earnings). The figures presented are the sum of all regular benefits and/or employment earnings divided by the number of weeks the claim was active.
- *** The average real weekly employment earnings are total employment earnings divided by the number of weeks worked while on claim.
- Sources: Employment and Social Development Canada, Employment Insurance (EI) administrative data (for data on claims with WWC) and Statistics Canada, Table 18-10-0004-01 (for data on the consumer price index). Data are based on a 10% sample of EI administrative data.
Factors associated with working while on claim
A 2016 study* found that 73.8% of regular claimants who worked while on claim worked for a single employer.
Furthermore, this study found that virtually all claimants (94.8%) who worked while on claim worked for the same employer before or after their claim. In fact, 64.7% worked for the same employer before and after their claim, 19.1% worked for the same employer only before their claim, and 16.2% worked for the same employer only after their claim.
* ESDC, Who are Workers Working for When Working While on Claim? (Ottawa: ESDC, Evaluation Directorate, 2016).
2.3 Employment Insurance support while on training
In this section
The EI program flexibilities allow unemployed EI claimants to train and get the skills they need to succeed in the workforce. Individuals who qualify for EI regular benefits may pursue training under different scenarios.
A claimant may be referred to training by a designated authority, such as a province or territory. Such training may be funded through provincial and territorial Labour Market Development Agreements (LMDA), or it may be self-funded by the claimant. In either of the circumstances, the provincial or territorial government must agree that the desired training is a reasonable part of the claimant’s return-to-work action plan. In such cases, claimants continue to receive EI benefits while they upgrade their skills. See Chapter 3 for more information on LMDA.
Alternatively, claimants may choose to undertake training on their own initiative, without being referred to training by a designated authority. To keep receiving EI benefits, claimants must demonstrate that they are capable of and available for work. They must also continue to seek employment to maintain their eligibility for EI benefits, and they must show that attendance at the course has not created impediments to their work availability. These situations are assessed by Service Canada on a case-by-case basis, taking into account the individual circumstances of the claimant.
Finally, through Skills Boost, which was introduced in August 2018, EI claimants who are long-tenured workers and wish to self-fund full-time training at an approved institution can request permission directly from Service Canada to continue receiving EI benefits during training that would otherwise restrict their ability to meet program requirements (that is, searching and being available for work). Skills Boost also introduced measures that took effect August 1, 2018, to provide enhanced Student Financial Assistance targeted to working or unemployed Canadians looking to return to school to upgrade their skills.
In FY1819, a total of 118,000 claims established received at least $1 of EI regular benefits while on training.
Subsection 2.3.1 examines support for apprentices and subsection 2.3.2 discusses the training permission provided by Service Canada.
2.3.1 Employment Insurance support for apprentices
For many skilled trades, apprenticeship is the path to gain the skills and experience that are necessary for certification and to participate fully in the labour market. In Canada, the apprenticeship system is an industry-driven learning system that combines on-the-job and technical training. Each province or territory is responsible for apprenticeship training within its jurisdiction. As a result, apprenticeship programs in Canada, including the duration and delivery method of technical training, vary across trades and across provinces and territories.
In Quebec for instance, apprentices generally complete all of their technical training at a college (CEGEP) or at a training institution before beginning on-the-job training. In the rest of Canada, apprentices start with on-the-job training followed by technical training through a variety of approaches. These include in-class learning, self-learning, distance learning, night classes or day release programs.
In most jurisdictions, to enter an apprenticeship program, a prospective apprentice must be at least 16 years old and have successfully completed Grade 12 or have an equivalent amount of work experience or related education. In addition, the potential apprentice must find a job with an employer who will sponsor and train him or her under the mentorship of a qualified person.
To help EI contributors continue their apprenticeship and become certified journeypersons or tradespeople, the EI program offers temporary income support to those who are unemployed and attending full-time school technical training (sometimes referred to as block-release training). To qualify, they must meet EI regular benefits eligibility requirementsFootnote 71, and their respective province, territory or Indigenous organization must have referred them to training under section 25 of the Employment Insurance Act for each block of full time technical training that is required as part of their apprenticeship. Employers may also offer their apprentices Supplemental Unemployment Benefit (SUB) plans to increase their weekly income during their periods of technical training, up to 95% of the apprentice’s normal weekly earnings.Footnote 72
Apprentices can apply for EI benefits up to 7 days before their last day of work and they are only required to serve 1 waiting period for the full duration of their apprenticeship, even if it involves multiple blocks of full-time technical training, as long as they remain in the same apprenticeship program.
To help ensure that apprentices receive EI benefits without delay while they attend full-time technical training, their province, territory or Indigenous organization provides them with a special reference code issued for each block of full-time technical training. This code facilitates faster processing and payment of their EI benefits and helps speed up payment to apprentices. A departmental study showed that 84.5% of EI apprentices in FY1617 received their first benefits payment within 28 days of filing.Footnote 73
Apprentices may be entitled to receive financial support under Part 2 of the Employment Insurance ActFootnote 74 which is delivered by the provinces and territories (under the Labour Market Development Agreements) and Indigenous organizations (under the Aboriginal Skills and Employment Training StrategyFootnote 75). These EI benefits help cover accommodation, childcare, transportation and other costs incurred while attending technical training. Other financial support from the Government of Canada is also available through programs such as the Canada Apprentice Loan and various apprenticeship grants.
The following sections present detailed statistics on the number of EI claims from apprentices, their weekly level of benefits and the duration of their benefits. EI claims from apprentices are those referred under section 25 of the Employment Insurance Act and who received at least 1 dollar of EI regular benefits during a period of full-time apprenticeship training.
Employment Insurance claims from apprentices and amount paid
In FY1819, apprentices established 50,200 new claims, an increase of 4,300 claims or +9.3% from the previous year. The number of claims increased in all provinces and territories, except Newfoundland and Labrador and New Brunswick. In relative terms, provinces with the largest year-over-year increase were Prince Edward Island (+41.7%), followed by Nova Scotia (+20.0%), Ontario (+18.7%), and British Columbia (+11.6%). The largest decrease was in Newfoundland and Labrador (-20.6%).
Outside of periods of full-time training and during the benefit period of a claim, an apprentice may experience a loss of employment income due to circumstances that may require the apprentice to access other types of EI benefits (for instance, regular benefits for lack of available work or special benefits for care for a newborn child). The claimant may claim those benefits if he or she meets the eligibility requirements for the relevant EI benefits. Of all claims established by apprentices in the reporting fiscal year, 35.8% (or 18,000 claims) contained at least 1 week of regular benefits paid outside of periods of full-time training. Meanwhile, 1.3% (or 640 claims) contained at least 1 week of special benefits paid outside of periods of full-time training, including 560 claims for sickness benefits.
The total amount of EI benefits paid to apprentices rose by +2.5% to $294.3 million compared to the previous year and the largest relative increase among provinces occurred in Ontario (+23.3%) followed by Prince Edward Island (+18.5%). Of the total of $294.3 million paid in benefits, $213.7 million (or 72.6% of the total EI benefits paid to apprentices) were paid while the apprentices attended full-time technical training. EI regular benefits paid outside of periods of full-time training accounted for most of the remaining benefits paid to apprentices ($73.7 million or 25.1% of the total $294.3M EI benefits paid), with a small fraction paid in special benefits ($6.9M or 2.3%).
In FY1819, just over three-quarters of EI claims from apprentices were established in Ontario, Alberta, and British Columbia. Total benefits paid followed a similar distribution.
As in previous years, men established the vast majority of claims from apprentices (95.6% of all claims) and also accounted for the largest share of all EI benefits paid to apprentices (95.3%) in FY1819. The low proportion of claims by women and benefits paid to them is largely due to the low share of women amongst all apprenticeship-training registrations (13.6% in 2018).Footnote 76
| Category | New claims established FY1718 | New claims established FY1819 | New claims established change (%) | Amount paid ($ millions) FY1718 | Amount paid ($ millions) FY1819 | Amount paid ($ millions) change (%) |
|---|---|---|---|---|---|---|
| Newfoundland and Labrador | 1,410 | 1,120 | -20.6% | $16.4 | $10.9 | -33.4% |
| Prince Edward Island | 240 | 340 | +41.7% | $1.4 | $1.7 | +18.5% |
| Nova Scotia | 1,400 | 1,680 | +20.0% | $9.0 | $9.4 | +4.2% |
| New Brunswick | 1,570 | 1,480 | -5.7% | $9.2 | $8.2 | -11.6% |
| Quebec* | 100 | 110 | +10.0% | $1.0 | $1.2 | +18.6% |
| Ontario | 12,510 | 14,850 | +18.7% | $67.5 | $83.2 | +23.3% |
| Manitoba | 3,120 | 3,110 | -0.3% | $18.4 | $18.4 | 0.0% |
| Saskatchewan | 2,850 | 2,950 | +3.5% | $19.1 | $17.6 | -7.7% |
| Alberta | 13,100 | 13,720 | +4.7% | $93.5 | $88.0 | -6.0% |
| British Columbia | 9,520 | 10,620 | +11.6% | $50.6 | $54.2 | +7.1% |
| Territories | 120 | 240 | +100.0% | $0.8 | $1.5 | +74.9% |
| Men | 43,650 | 47,990 | +9.9% | $269.2 | $280.4 | +4.2% |
| Women | 2,290 | 2,230 | -2.6% | $17.9 | $13.9 | -22.4% |
| 24 years old and under | 19,990 | 22,140 | +10.8% | $111.8 | $117.2 | +4.8% |
| 25 to 44 years old | 24,380 | 26,580 | +9.0% | $162.3 | $166.0 | +2.3% |
| 45 years old and over | 1,570 | 1,500 | -4.5% | $13.1 | $11.0 | -15.5% |
| Canada | 45,940 | 50,220 | +9.3% | $287.1 | $294.3 | +2.5% |
- Note: Totals may not add up due to rounding. Percentage change is based on unrounded numbers. Includes all claims from apprentices referred under Section 25 of the Employment Insurance Act for which at least $1 of EI benefits was paid while the claimant was on training.
- * The low number of claims from apprentices in Quebec is due to the unique program design in which apprentices complete all of the technical training prior to beginning on-the-job training.
- Source: Employment and Social Development Canada, Employment Insurance (EI) administrative data. Data are based on a 10% sample of EI administrative data.
Claimants aged 25 to 44 years old established the largest share of EI claims associated with apprenticeship programs and full-time technical training (52.9%), followed by those aged 15 to 24 years old who accounted for 44.1%. Claimants aged 45 years and over accounted for almost half of all EI regular claims established, but only 3.0% of all EI apprenticeship claims. This is expected, as the incidence of job-related training declines with age, though the gap between older and younger workers appears to be shrinking over time.Footnote 77
Apprenticeships before and after the 2008 recession
A departmental study* analyzed the number of claims, total amount paid, duration of benefits and average benefit amount before and after the 2008 recession. The total number of claims from apprentices more than doubled between 1991 and 2009. There was a substantial decrease in the number of new registrations (-15.2%) during the 2008 recession along with a general decline since 2014.
Apprentices have some distinguishing characteristics. The large majority were men, young (under 25 years of age in 2015 and between 25 and 34 in 2007) with high school diploma as their highest level of education upon registration, and most of them registered in Quebec, Ontario, Alberta and British Columbia. Between 1991 and 2016, about half of all apprentices were registered in 4 large occupations: electricians (16.2%), carpenters (11.9%), automotive service technicians (11.8%) and plumbers, pipefitters and steamfitters (9.8%).
Not all apprentices complete their training. According to 2015 National Apprenticeship Survey (NAS), 57.5% of registered apprentices completed their apprenticeship training while 42.5% did not. The most commonly cited reasons for not completing apprenticeship training were financial constraints, inconsistent work or lack of work, medical reasons as well as family or personal issues.
Throughout training, a large number of apprentices applied for the financial support of EI benefits. According to EI administrative data, the number of EI claims from apprentices increased by 24.2% with the recession. There were 49,982 before the recession in 2007 and 62,071 by the end of the recession in 2009. Layoffs were key drivers of the increase. The duration of EI benefits also increased after the 2008 recession. However, the average duration of non-training related benefits was higher than for training-related benefits that was relatively constant. This means that EI apprentice benefits were exercised in conjunction with other EI benefits during the recession. Moreover, the total amount of EI benefits paid out for apprentices also increased with the recession by almost doubling from $176 million in 2007 to $326 million in 2009 (expressed in 2002 dollars).
* ESDC, Employment Insurance Monitoring and Assessment Report: Apprenticeships Before and After the 2008 Recession, (Ottawa: ESDC, Labour Market Information Directorate, 2019)
Similar to previous years, the majority of the apprentice claims established and amount paid were from the Construction sector (61.3% of claims established and 66.4% for amount paid) in FY1819 (see Table 33).
From the occupational grouping perspective, the majority of EI claimants participating in apprenticeship programs and attending full-time technical training were associated with the Trades and skilled transport and equipment operators occupational groupFootnote 78 (91.2%). These claimants also received 90.7% of total benefits paid to apprentices. While apprentice claimants from this occupational group were mainly employed in the Construction sector, they were also found in Manufacturing, Other services (excluding Public administration) and Retail trade sectors.
| Category | New claims established FY1718 | New claims established FY1819 | New claims established change (%) | Amount paid ($ millions) FY1718 | Amount paid ($ millions) FY1819 | Amount paid ($ millions) change (%) |
|---|---|---|---|---|---|---|
| Construction | 28,400 | 30,790 | +8.4% | $190.8 | $195.5 | +2.4% |
| Manufacturing | 3,140 | 3,480 | +10.8% | $18.6 | $18.8 | +1.4% |
| Other services (excluding public administration) | 3,050 | 3,760 | +23.3% | $14.8 | $16.9 | +14.1% |
| Other sectors | 11,350 | 12,190 | +7.4% | $62.9 | $63.1 | +0.2% |
| Trades and skilled transport and equipment operators | 41,650 | 45,820 | +10.0% | $258.4 | $266.8 | +3.3% |
| Other occupations | 4,290 | 4,400 | +2.6% | $28.7 | $27.4 | -4.4% |
| Canada | 45,940 | 50,220 | +9.3% | $287.1 | $294.3 | +2.5% |
- Note: Totals may not add up to the total due to rounding. Percentage change is based on unrounded numbers. Includes all claims from apprentices referred under Section 25 of the Employment Insurance Act for which at least $1 of EI benefits was paid while the claimant was on training.
- Source: Employment and Social Development Canada, Employment Insurance (EI) administrative data. Data are based on a 10% sample of EI administrative data.
Level and duration of Employment Insurance benefits for apprentices
During the reporting period, the average weekly benefit rate payable to apprentices increased by +2.2% to $502. Consistent with previous years, the average weekly benefit rate for apprentices was higher than the average for EI regular claims ($469) overall.
Similar to the previous year, apprentice claimants from the territories and Alberta received the highest average weekly benefit rate during the reporting period ($543 and $523, respectively). On average, the weekly benefit rate received was higher among men ($503) than women ($476) and among claimants aged between 25 and 44 years old ($513) compared to claimants over 45 years old ($505) and those under 25 years old ($486).
On a year-over-year basis, the average duration of EI regular claims completedFootnote 79 by EI claimants while on full-time technical training increased by 12.2%, from 8.1 weeks in the previous year to 9.1 weeks during the reporting fiscal year. Claims in Manitoba (9.6 weeks), Alberta (9.4 weeks), and Ontario (9.2 weeks) were above the national average (9.1 weeks). The average duration of EI regular benefits received by men and women while on full-time technical training was almost equal, with 9.0 weeks and 9.3 weeks respectively. Claimants aged 55 years or older received somewhat fewer weeks of benefits (6.8 weeks) relative to claimants under 25 years old (9.1 weeks) and aged between 25 and 54 years old (9.1 weeks).
Characteristics of firms that hire apprentices
A recent ESDC study* examined the characteristics of firms that employ EI-supported apprentices from 2001 to 2016.
The study found that the share of apprentices in a firm’s workforce was positively correlated with its productivity, a pattern that has become more apparent since the FY0809 recession. Larger firms (more than 500 employees) are more likely to hire an apprentice every year and are more likely to have hired an apprentice at least once in the study period than other sizes of firms. However, smaller firms hire disproportionately more apprentices; almost 1 in 2 apprentices work in a firm with 5 to 49 employees.
On average, 4 out of 5 apprentices claimed EI from a single employer from 2001 to 2012. However, apprentices in the construction sector were more likely to make claims from multiple employers. In addition, just under 50% of apprentices stay for more than 3 years with the firm that trained them.
*ESDC, Characteristics of firms that hire apprentices. (Ottawa: ESDC, Labour Market Information Directorate, 2020)
2.3.2 Training with permission from Service Canada to keep receiving EI
Under Skills Boost, claimants who are long-tenured workersFootnote 80 and wish to self-fund full-time training at an approved institution may request permission directly from Service Canada to continue receiving EI benefits during training that would otherwise restrict their ability to meet program requirements (that is, searching and being available for work). With regards to training referrals, Service Canada does not provide services normally provided by the provinces and territories such as employment counselling, job search assistance, needs assessments and assistance with the development of return to work action.
Between August 5, 2018 and March 31, 2019, Service Canada gave permission to (or “referred”) 900 additional claimants to continue receiving EI benefits in order to train, using the new option available to long-tenured workers under Skills Boost. The largest number of training referrals by Service Canada was in Quebec (30.7%), followed by Ontario (23.4%), and Alberta (21.7%). Men accounted for just over half of referrals (52.1%); and claimants under 44 years old established almost three-quarters of referrals (74.3%). In terms of industry, claimants who worked in Manufacturing industry accounted for the largest share of referrals (12.4%), followed by those from Construction (11.3%) and Retail trade (9.3%) industries.
In FY1819, claimants who had been referred by Service Canada received benefits totalling $11.5 million. Quebec (29.1%), Ontario (24.1%), Alberta (22.5%) and British Columbia and the territories (13.4%) accounted for 89.1% of the total amount paid in benefits. In terms of gender and age, men and women were evenly distributed for the total amount paid (50.9% and 49.1% respectively) and claimants under 44 years old accounted for 72.9% of the benefits paid. Further, claims associated with Manufacturing industry received the largest share of benefits paid (13.0%), followed by claims established by claimants who worked in the Construction (12.1%), Retail trade (9.1%), and Health care and social assistance (7.3%) industries.
Claimants with a referral to training by Service Canada received an average of $475 in weekly benefits, which was higher than the average weekly regular benefit rate paid ($469), but lower than that paid to long-tenured worker regular benefit claimants ($503). Using a breakdown by gender and age, men had the highest weekly benefit rate ($491) than women ($460); and among different age groups, claimants aged 45 years and over had the highest weekly benefit rate ($479).
Long-tenured workers who returned to school under Skills Boost received, on average, 13.5 weeks of EI benefits while taking a training and 14.3 weeks of EI benefits while looking for a job during their claim.
Claimants from Manitoba and Saskatchewan, on average, received most EI weeks while taking training (16.7 weeks). On average, women received more weeks of EI benefits than men when attending full-time training.
| Category | Claims established during which claimants received permission from Service Canada to train | Amount paid ($ million) | Average weekly benefit rate | Average duration1 of benefits while on trainingP (weeks) |
|---|---|---|---|---|
| Atlantic Canada | 36 | $0.5 | $431 | 13.5 |
| Quebec | 276 | $3.3 | $459 | 12.9 |
| Ontario | 211 | $2.8 | $479 | 14.1 |
| Manitoba and Saskatchewan | 63 | $0.8 | $476 | 16.7 |
| Alberta | 195 | $2.6 | $498 | 14.0 |
| British Columbia and Territories | 119 | $1.5 | $481 | 11.8 |
| Men | 469 | $5.8 | $491 | 12.9 |
| Women | 431 | $5.6 | $460 | 14.1 |
| 44 years old and under | 669 | $8.3 | $473 | 14.0 |
| 45 years old and over | 231 | $3.1 | $479 | 12.1 |
| Construction | 102 | $1.4 | $501 | 11.6 |
| Manufacturing | 112 | $1.5 | $489 | 16.0 |
| Other goods-producing industries | 39 | $0.5 | $521 | 14.3 |
| Wholesale trade | 48 | $0.6 | $477 | 13.7 |
| Retail trade | 84 | $1.0 | $437 | 12.0 |
| Transportation and warehousing | 39 | $0.5 | $481 | 10.1 |
| Finance and insurance | 32 | $0.4 | $495 | 13.9 |
| Real estate and rental and leasing | 23 | $0.3 | $487 | 11.0 |
| Professional, scientific and technical services | 52 | $0.7 | $498 | 13.2 |
| Business, building and support services* | 62 | $0.8 | $481 | 13.9 |
| Educational services | 51 | $0.6 | $462 | 11.4 |
| Health care and social assistance | 66 | $0.8 | $456 | 14.2 |
| Information, culture and recreation** | 44 | $0.5 | $455 | 14.0 |
| Accommodation and food services | 39 | $0.4 | $415 | 14.4 |
| Other services (except public administration) | 30 | $0.4 | $440 | 17.5 |
| Public administration | 63 | $0.8 | $492 | 14.2 |
| Unclassified*** | 14 | $0.2 | $453 | 23.8 |
| Canada | 900 | $11.5 | $475 | 13.5 |
- 1 Average duration of benefits while on training is based on claims completed during the reporting fiscal year.
- * This industry sector comprises the industries with codes 55 (Management of companies and enterprises) and 56 (Administration and support, waste management and remediation services).
- ** This industry sector comprises the industries with codes 51 (Information and cultural industries) and 71 (Arts, entertainment and recreation).
- *** For some claims, this information was not available in the data.
- P Preliminary estimates.
- Source: Employment and Social Development Canada, Employment Insurance (EI) administrative data. Data are based on a 100% sample of EI administrative data.
2.4 Employment Insurance fishing benefits
In this section
Employment Insurance (EI) provides fishing benefits to qualifying, self-employed fishers who are actively seeking work. Under the EI Fishing Regulations, a “fisher” is defined as a self-employed person engaged in fishing and includes a person engaged, other than under a contract of service or for their own or another person’s sport:
- in making a catch
- in doing any work incidental to making or handling catch,Footnote 81 or
- in the construction of a fishing vessel for their own use or for the use of a crew of which the person is a member in making a catch
To be entitled to receive EI fishing benefits, applicants must meet the definition of self-employed fishers, must be unemployed and available for work with respect to their fishing activities, and must have accumulated enough in insurable earnings to qualify.Footnote 82 Unlike EI regular benefits, qualification for EI fishing benefits are based on earnings, rather than hours of insurable employment.Footnote 83 Claimants must be ineligible for EI regular benefits and must have earned between $2,500 and $4,200 from insurable self-employed fishing activities, depending on the regional unemployment rate where they live at the time their claim is established (see Table 35). A fisher’s weekly benefit rate is calculated by dividing the fishing insured earnings by the divisor associated with the claimant’s regional unemployment rate. Fishing benefits are subject to the same maximum insurable earnings threshold as other types of EI benefits (a maximum benefit of $547 per week in 2018 and $562 in 2019).
| Regional unemployment rate | Required insurable earnings | Earnings divisor |
|---|---|---|
| 6.0% or lower | $4,200 | 22 |
| 6.1% to 7.0% | $4,000 | 21 |
| 7.1% to 8.0% | $3,800 | 20 |
| 8.1% to 9.0% | $3,600 | 19 |
| 9.1% to 10.0% | $3,400 | 18 |
| 10.1% to 11.0% | $3,200 | 17 |
| 11.1% to 12.0% | $2,900 | 16 |
| 12.1% to 13.0% | $2,700 | 15 |
| 13.1% or higher | $2,500 | 14 |
- Note: Divisor is applied to the insurable earnings during the qualifying period to determine the equivalent weekly earnings that will be subject to the standard 55% replacement rate.
Fishing benefits can be paid in 2 defined benefit periods (winter and summer). The benefit period for a winter claim can start as early as the week of April 1 and must end no later than the week of December 15, whereas the benefit period for a summer claim can start as early as the week of October 1 and must end no later than the week of June 15.Footnote 84 These weeks of benefits may be received consecutively or intermittently, but are limited by the fixed start and end dates of the benefit period. Claimants who qualify for EI fishing benefits are eligible to receive a maximum entitlement of 26 weeks per claim within the benefit period. Claimants may establish 2 claims per year and can, in some cases, defer earnings from 1 season to the other.
For the purpose of this section, EI fishing claims refer to claims for which at least 1 dollar of EI fishing benefits were paid.
2.4.1 Employment Insurance fishing claims and benefits paid
The number of new EI fishing claims increased for the fifth consecutive year to reach 30,400 in FY1819, up by 1.0% from FY1718. The total amount of EI fishing benefits paid decreased slightly (-0.8%) in the reporting year to $297.7 million (see Chart 26). The total amount of EI fishing benefits paid represents 1.8% of the total amount paid for all EI benefit types.
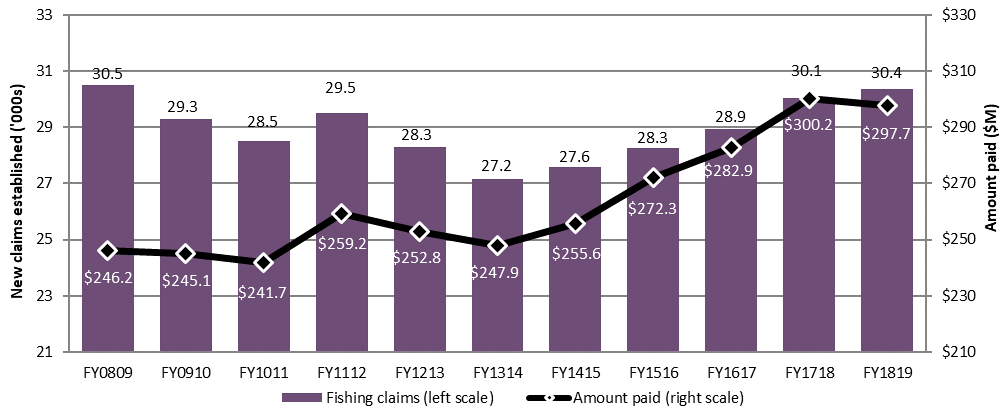
Text description of Chart 26
| Category | FY0809 | FY0910 | FY1011 | FY1112 | FY1213 | FY1314 | FY1415 | FY1516 | FY1617 | FY1718 | FY1819 |
|---|---|---|---|---|---|---|---|---|---|---|---|
| Fishing claims (in thousands) (left scale) | 30.5 | 29.3 | 28.5 | 29.5 | 28.3 | 27.2 | 27.6 | 28.3 | 28.9 | 30.1 | 30.4 |
| Amount paid ($ millions) (right scale) | $246.2 | $245.1 | $241.7 | $259.2 | $252.8 | $247.9 | $255.6 | $272.3 | $282.9 | $300.2 | $297.7 |
- Note: Includes claims for which at least $1 of fishing benefits was paid.
- Source: Employment and Social Development Canada, Employment Insurance (EI) administrative data. Data on claims are based on a 100% sample of EI administrative data, while data on amount paid are based on a 10% sample.
6 provinces in Canada (Newfoundland and Labrador, Prince Edward Island, Nova Scotia, New Brunswick, Quebec and British Columbia) have a significant fishing industry due to their geographic locations. As outlined in Table 36, on a year-over-year basis, the number of new fishing claims in FY1819 increased in Newfoundland and Labrador, Nova Scotia and Prince Edward Island, while it decreased in British Columbia, New Brunswick and Quebec. Historically, Atlantic Canada accounts for the largest share of EI fishing claims and this reporting year was no exception—81.9% of the total fishing claims established in FY1819 were from Atlantic Canada. Within that region, Newfoundland and Labrador had the largest share of claims (41.8%), followed by Nova Scotia (18.8%), Prince Edward Island (10.8%) and New Brunswick (10.5%). Atlantic Canada accounted for 81.1% of the total amount of EI fishing benefits paid in FY1819. Newfoundland and Labrador had the largest share (39.8%) of the total amount of EI fishing benefits paid, followed by Nova Scotia (20.1%), New Brunswick (11.5%) and Prince Edward Island (9.8%).
| Category | Claims established FY1718 |
Claims established FY1819 |
Claims established change (%) |
Amount paid ($ millions) FY1718 |
Amount paid ($ millions) FY1819 |
Amount paid change (%) |
|---|---|---|---|---|---|---|
| Newfoundland and Labrador | 12,278 | 12,682 | +3.3% | $121.4 | $118.4 | -2.5% |
| Prince Edward Island | 3,258 | 3,278 | +0.6% | $29.5 | $29.1 | -1.3% |
| Nova Scotia | 5,633 | 5,701 | +1.2% | $59.8 | $59.9 | +0.2% |
| New Brunswick | 3,310 | 3,203 | -3.2% | $34.7 | $34.1 | -1.6% |
| Quebec | 1,412 | 1,408 | -0.3% | $11.2 | $12.0 | +7.2% |
| British Columbia | 2,942 | 2,843 | -3.4% | $30.4 | $29.8 | -2.1% |
| Other provinces and territories | 1,222 | 1,252 | +2.5% | $13.3 | $14.5 | +8.9% |
| Men | 24,015 | 24,319 | +1.3% | $241.0 | $238.9 | -0.9% |
| Women | 6,040 | 6,048 | +0.1% | $59.2 | $58.8 | -0.6% |
| 24 years old and under | 1,564 | 1,535 | -1.9% | $14.8 | $16.4 | +10.8% |
| 25 to 44 years old | 8,683 | 8,556 | -1.5% | $90.1 | $89.9 | -0.2% |
| 45 to 54 years old | 8,217 | 8,095 | -1.5% | $82.0 | $78.4 | -4.4% |
| 55 years old and over | 11,591 | 12,181 | +5.1% | $113.3 | $113.0 | -0.2% |
| Canada | 30,055 | 30,367 | +1.0% | $300.2 | $297.7 | -0.8% |
- Note: Data may not add up to the total due to rounding. Percentage change is based on unrounded numbers. Includes all claims for which at least $1 in EI fishing benefits was paid.
- Source: Employment and Social Development Canada, Employment Insurance (EI) administrative data. Data are based on a 100% sample of EI administrative data, except for amount paid which is based on a 10% sample.
As in previous years, fishing claims were predominantly established by men (80.1%). The number and share of claims established by women remained relatively unchanged in FY1819 from the previous year. The shares of amount paid in EI fishing benefits to both men and women were proportional to their shares of claims established.
In FY1819, the number of fishing claims established decreased for all age categories except those who were 55 years old and over (+5.1%). Notably, claims established by younger claimants (aged 24 years and under) decrease slightly (-1.9%) in FY1819 compared to the previous year but the amount of EI fishing benefits paid to them increased substantially (+10.8%). This may be attributable to the growth in average weekly benefit rate—claims established by younger claimants had the highest growth rate in average weekly benefit rate (+2.2%) in FY1819 compared to claims established by individuals in other age groups.
The average weekly fishing benefit rate increased from $510 in FY1718 to $514 in the reporting period (+1.0%). As in previous years, this rate was above the average weekly regular benefit rate in FY1819 ($469). The weekly fishing benefit rate increased in all provinces with a significant fishing industry in FY1819 compared to the previous year, except for Prince Edward Island where it decreased slightly (-$4 or -0.7%). The average weekly fishing benefit rate was the highest in Quebec ($538), while it was the lowest in British Columbia ($475). The average weekly fishing benefit rates in Atlantic Canada were above the national average. The average weekly fishing benefit rate for men ($518) was higher than that for women ($499). Claimants who were aged between 45 and 54 years had the highest weekly fishing benefit rate ($522) (see Annex 2.10.3).
The proportion of fishing claims that received the maximum benefit rate remained relatively unchanged in FY1819 (74.1%) compared to the previous fiscal year (74.2%). This proportion, however, is still higher than the proportion of EI regular claims that received the maximum benefit rate for regular benefits in the reporting period (49.1%).Footnote 85 This is partly attributable to the fact that more than half (57.8%) of the total fishing claims in FY1819 were established in EI economic regions where the unemployment rates were higher than 13% (minimum divisor of 14) and required $14,296 in insurable earnings over their qualifying period to receive the maximum weekly benefit rate of $562. As illustrated in Chart 27, a significant number of fishing claims established in the reporting year had insurable earnings at, or very close to, the amount required to obtain the maximum benefit rate.
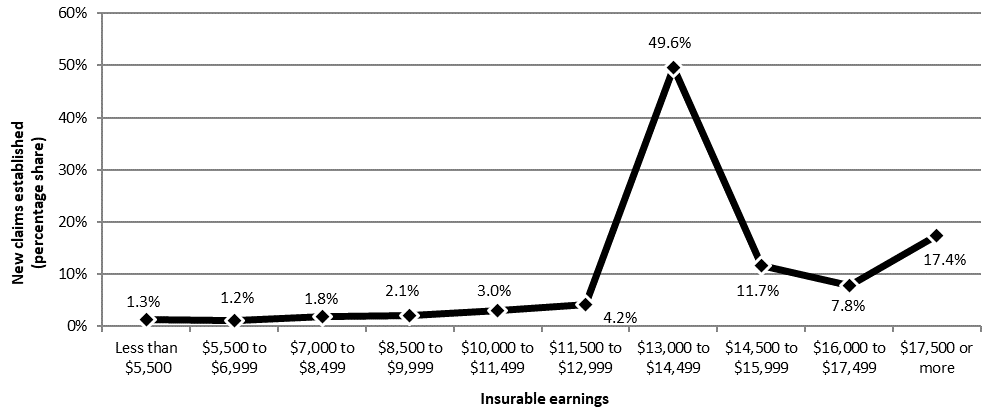
Text description of Chart 27
| Insurable earnings | New claims established (percentage share) |
|---|---|
| Less than $5,500 |
1.3% |
| $5,500 to $6,999 |
1.2% |
| $7,000 to $8,499 |
1.8% |
| $8,500 to $9,999 |
2.1% |
| $10,000 to $11,499 |
3.0% |
| $11,500 to $12,999 |
4.2% |
| $13,000 to $14,499 |
49.6% |
| $14,500 to $15,999 |
11.7% |
| $16,000 to $17,499 |
7.8% |
| $17,500 or more | 17.4% |
| Total | 100.0% |
- Note: Includes claims for which at least $1 of EI fishing benefits was paid.
- Source: Employment and Social Development Canada, Employment Insurance (EI) administrative data. Data are based on a 100% sample of EI administrative data.
2.4.2 Seasonal component of Employment Insurance fishing benefits
EI fishing benefits are available for 2 fishing seasons per year (winter and summer), allowing eligible claimants to establish more than 1 claim in a year. The 30,400 new fishing claims established during the reporting period were established by 21,500 fishers—of them, 12,600 had established a single claim while the rest (8,900 fishers) had established 2 claims.
Table 37 outlines the number of fishers that established claims by season of establishment for the past 5 years. Overall, the number of fishers who established a fishing claim during the reporting period remained relatively unchanged from the previous year. The number of fishers who established a single claim also remained relatively unchanged during this period, while the number of fishers with 2 claims increased (+2.4%).
| Season of establishment | FY1415 | FY1516 | FY1617 | FY1718 | FY1819 | Change (%) FY1718 to FY1819 |
|---|---|---|---|---|---|---|
| One season | 11,880 | 11,996 | 12,398 | 12,709 | 12,611 | -0.8% |
| Winter | 2,596 | 2,605 | 2,720 | 3,031 | 3,145 | +3.8% |
| Summer | 9,284 | 9,391 | 9,678 | 9,678 | 9,466 | -2.2% |
| Two seasons | 7,852 | 8,132 | 8,267 | 8,667 | 8,876 | +2.4% |
| Canada | 19,732 | 20,128 | 20,665 | 21,376 | 21,487 | +0.5% |
Source: Employment and Social Development Canada, Employment Insurance (EI) administrative data. Data are based on a 100% sample of EI administrative data.
In FY1819, fishers who established a single claim received an average of $11,256 in EI fishing benefits. On the other hand, those who had established 2 fishing claims received an average of $9,601 for the first claim and an average of $8,420 for the second claim, for a total average of $18,021 received in EI fishing benefits in FY1819. These amounts have not changed much within the past 5 years. In comparison, the average EI regular benefit paid to claimants in FY1819 was $7,075.
2.4.3 Duration of Employment Insurance fishing benefits
Regardless of the local labour market conditions in a claimant’s region of residence, the maximum entitlement of a claim established for EI fishing benefits is 26 weeks. In FY1819, the average duration of a fishing claim was 19.7 weeks, down from 19.9 weeks (-0.2 weeks or -1.2%) from the previous fiscal year. Among the provinces with a significant fishing industry, claims established in British Columbia have historically had the highest average duration in fishing benefits and this reporting year was of no exception—the average duration in FY1819 was 23.3 weeks. On the other hand, the average duration of EI fishing benefits in Atlantic Canada has historically been lower than the national average (19.7 weeks in the reporting year)—in FY1819, they ranged between 18.8 weeks in Prince Edward Island and 19.1 weeks in both Newfoundland and Labrador and New Brunswick. Claims established in Quebec had the lowest average duration at 17.1 weeks in FY1819 (see Annex 2.10.2). The lower average duration of claims in Atlantic provinces and Quebec may be attributable to the fact that a greater share of fishers in these regions establish 2 claims per year compared to those in other regions who mostly establish a single claim per year. For example, within the past 5 years, 48.0% fishers in the Atlantic provinces and 67.8% fishers in Quebec had established 2 claims on average per year, whereas the share of fishers with 2 claims during this period was 1.8% in British Columbia and 10.8% in all other provinces and territories combined.
Table 38 outlines the average duration of fishing benefits by fishers. During the reporting period, fishers who established a single fishing claim received an average of 23.0 weeks, relatively unchanged from the previous fiscal year. Fishers who established 2 claims received an average of 18.4 weeks for their first claim and 16.2 weeks for their second claim, for a total average of 34.6 weeks for the whole year in FY1819, down slightly (-0.5 weeks or -1.3%) from FY1718.
| Season | Average duration (weeks) FY1718 |
Average duration (weeks) FY1819 |
Change (%) FY1718 to FY1819 |
|---|---|---|---|
| One season/one claim | 23.1 | 23.0 | -0.6% |
| Two seasons/two claims | 35.1 | 34.6 | -1.3% |
| First claim | 18.7 | 18.4 | -1.4% |
| Second claim | 16.4 | 16.2 | -1.2% |
Source: Employment and Social Development Canada, Employment Insurance (EI) administrative data. Data are based on a 100% sample of EI administrative data.
2.5 Employment Insurance Work-Sharing benefits
In this section
Work-Sharing is an adjustment program designed to help avoid layoffs of all or a number of a firm’s employees when there is a temporary reduction in the level of the business activities that is beyond the control of the employer. Layoffs are avoided by offering temporary income support to all employees eligible for EI regular benefits who accept to work a temporarily reduced work week while their employer recovers. The goal of the program is for all participating employees to return to normal working hours by the end of the Work-Sharing agreement. The employer and the employees must agree to participate in a work-sharing agreement and must apply together.
To be eligible for a Work-Sharing agreement, employers must be in operation year-round in Canada for at least 2 years, must be a publicly-held company, private business or a not-for-profit organization experiencing temporary shortages of work and reductions in business activity that are beyond their control, and the shortage of work is not a cyclical or recurring slowdown.Footnote 86 The employer must also employ a minimum of 2 EI-eligible employees within a work unit, and agreements must be signed by the employer, the employees and Service Canada. Furthermore, the employer must demonstrate a recent decrease of approximately 10% or more of its business activity and must submit and implement a recovery plan which demonstrates how the business will return to normal working hours by the end of the Work-Sharing agreement. Employers who are experiencing a reduced-level of business activity attributable to a predictable seasonal shortage are not eligible to participate in the Work-Sharing program. Those who are involved in work stoppages from a labour dispute are also not eligible to participate.
To be eligible for Work-Sharing benefits, affected workers must be year-round permanent full-time or part-time employees who are required to carry out the everyday functions of normal business activity.Footnote 87 They must be eligible to receive EI regular benefits; and must agree to a reduction of their normal working hours and to share equally the available work among all members of their Work-Sharing unit over a specified period of time. This reduction in work activity of the employees’ regular work schedule can vary depending on available work, as long as the work reduction on average over the life of the agreement is between 10% and 60%.
By participating in the Work-Sharing program, employers are able to retain skilled employees, thus avoiding the costly process of recruiting and training new employees once the business activities return to normal level. At the same time, participating workers can maintain their employment and skills by supplementing the reduced wages with EI Work-Sharing benefits for the days they are not working. Also, within a Work-Sharing period the employers are required to maintain all existing employee benefits.
Employer initiated training activities, whether on-the-job training or off-site courses, may take place during the period of the Work-Sharing agreement. Depending on the cause of the work shortage, the employer’s Recovery Plan may include plans to initiate training activities for members of the Work-Sharing unit.
The salary costs of employees taking part in training activities during normal scheduled working hours/days cannot be compensated through the Work-Sharing agreement. Training could take place during the non-working days/hours for which the participating employees are in receipt of EI Work-Sharing benefits; however, attendance would be optional.
Example: Receiving Employment Insurance Work-Sharing benefits (illustrative example)
Samantha works as a full-time employee at an engineering firm in the Mining and oil and gas extraction industry in Edmonton, Alberta, and earns $40,000 per year (weekly earnings of $769). Due to the global downturn in commodity prices, the firm is experiencing a significant reduction in workload, and is considering laying off a quarter of its employees. The firm decides to enter into a Work-Sharing agreement with Service Canada. Under this Work-Sharing agreement, all eligible employees in Samantha’s work unit agree to reduce their work hours per week by 35% and receive EI Work-Sharing benefits for days where they are not working.
If Samantha and her co-workers did not agree to voluntarily reduce their work hours to participate in the Work-Sharing program and were laid off, each of them would have been entitled to apply for EI regular benefits and receive 55% of their weekly income ($423). By participating in the Work-Sharing program, Samantha and her co-workers receive 35% less of their regular weekly income (earning $500 per week); and collect EI benefits for that 35% of their average hours worked per week (equal to 55% of the value of the insurable earnings she would have received from the firm, which is $148).
By participating in the Work-Sharing program, Samantha and her co-workers are able to earn a total of $648 per week ($500 worth of income from working at the firm plus $148 from EI Work-Sharing benefits), compared to $423 if they had been on EI regular benefits following a layoff. This enables Samantha and her co-workers to maintain more of their original earnings, keep their jobs, and retain their skills and employee benefits for the duration of the Work-Sharing agreement. For example:
- health/dental insurance
- pension benefits
- vacation
- group disability
At the same time, the firm is able to retain its skilled and experienced workforce.
Work-Sharing agreements must have a duration between 6 and 26 weeks. The duration can be extended for up to 12 additional weeks (up to 38 weeks total) under exceptional circumstances, such as an unanticipated and prolonged period of economic contraction.
Work-Sharing temporary special measures
To avoid layoffs and retain skilled workers in some firms affected by the downturn in the forestry sector and the steel and aluminum industries, the Government of Canada has put in place Work-Sharing temporary special measures to assist employers experiencing reduced business activity.
On June 1, 2017, as part of Canada’s Softwood Lumber Action Plan, the Government of Canada announced temporary special Work-Sharing measures to support re-employment and needs for long-term adjustments in the forest sector. Effective July 30, 2017 to March 28, 2020, these temporary special measures extend the maximum duration of Work-Sharing agreements from 38 weeks to 76 weeks, and waive the mandatory waiting period between agreements and ease Recovery Plan requirements. These special measures apply to employers which had a Work-Sharing agreement that ended between October 30, 2016 and July 29, 2017; have an agreement that will be signed between July 30, 2017 and March 28, 2020; or have an agreement that will begin or end between July 30, 2017 and March 28, 2020.
For employers affected by the downturn in the steel and aluminum industries, the Government of Canada also announced the extension of the maximum duration of Work-Sharing agreements up to 76 weeks and waive the mandatory waiting period between expired and new agreements. Effective August 19, 2018 to March 27, 2021, these special measures apply to employers which were affected by the downturn in steel and aluminum sectors, and had a Work-Sharing agreement that ended between November 25, 2017 and August 18, 2018; have a Work-Sharing agreement that will be signed between August 19, 2018 and March 27, 2021; or have an agreement that will begin or end between August 19, 2018 and March 27, 2021.
For the purpose of this section, EI Work-Sharing claims refers to any claims for which at least 1 dollar of Work-Sharing benefit was paid.
2.5.1 Employment Insurance Work-Sharing agreements
The number of Work-Sharing agreements established in a given fiscal year increases during periods of economic shocks and uncertainty, and decreases during periods of economic growth and stability. This countercyclical pattern can be observed by looking at the number of Work-Sharing agreements established in Canada in the past few years (see Chart 28).
For the third year in a row, the total number of Work-Sharing agreements decreased from 198 agreements established in FY1718 to 158 agreements in FY1819, which is consistent with the recovery of the Canadian economy that was observed during past years (see Chapter 1). The number of agreements decreased in all provinces, except Saskatchewan and Manitoba, with the largest decrease reported in British Columbia (-52.9%), followed by Nova Scotia (-40.0%), and New Brunswick (-33.3%). In absolute terms, the number of agreements dropped more in Ontario (-16 agreements), British Columbia (-9 agreements) and Alberta (-8 agreements). The highest number of Work-Sharing agreements was established in Ontario (55 agreements), representing 34.8% of all agreements, followed by Quebec with 50 agreements (31.6% of all agreements).
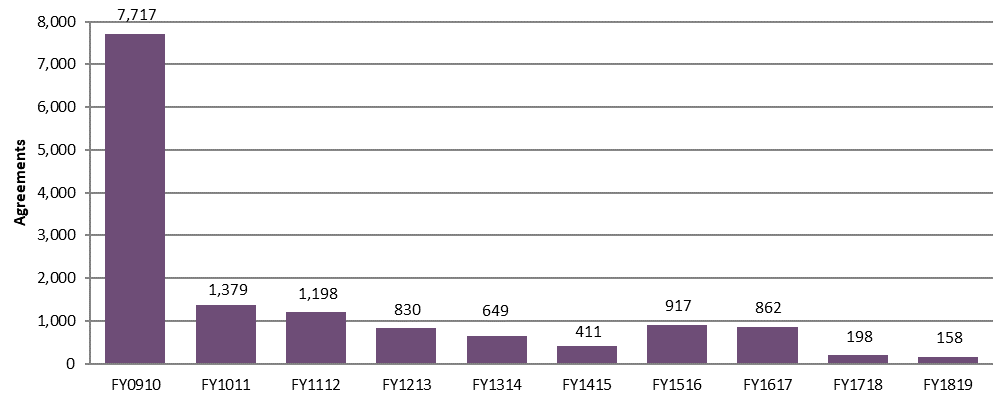
Text description of Chart 28
| Agreements | FY0910 | FY1011 | FY1112 | FY1213 | FY1314 | FY1415 | FY1516 | FY1617 | FY1718 | FY1819 |
|---|---|---|---|---|---|---|---|---|---|---|
| Total count of Work-Sharing agreements | 7,717 | 1,379 | 1,198 | 830 | 649 | 411 | 917 | 862 | 198 | 158 |
Source: Employment and Social Development Canada, Common System of Grants and Contributions.
Continuing with the trend observed in previous years, the goods-producing industries represented the majority (79.7%) of all Work-Sharing agreements established in FY1819 (see Table 39).
| Industry | FY1415 | FY1516 | FY1617 | FY1718 | FY1819 |
|---|---|---|---|---|---|
| Goods-producing industries | 267 (65.0%) |
638 (69.6%) |
606 (70.3%) |
130 (65.7%) |
126 (79.7%) |
| Mining, quarrying, and oil and gas extract | 6 (1.5%) |
53 (5.8%) |
90 (10.4%) |
3 (1.5%) |
4 (2.5%) |
| Construction | 28 (6.8%) |
52 (5.7%) |
86 (10.0%) |
14 (7.1%) |
11 (7.0%) |
| Manufacturing | 227 (55.2%) |
526 (57.4%) |
426 (49.4%) |
109 (55.1%) |
106 (67.1%) |
| Services-producing industries | 144 (35.0%) |
279 (30.4%) |
256 (29.7%) |
68 (34.3%) |
32 (20.3%) |
| Wholesale trade | 34 (8.3%) |
80 (8.7%) |
65 (7.5%) |
14 (7.1%) |
4 (2.5%) |
| Retail trade | 17 (4.1%) |
21 (2.3%) |
26 (3.0%) |
12 (6.1%) |
4 (2.5%) |
| Professional, scientific and technical services | 55 (13.4%) |
84 (9.2%) |
66 (7.7%) |
25 (12.6%) |
11 (7.0%) |
| Rest of services-producing industries | 38 (9.2%) |
94 (10.3%) |
99 (11.5%) |
17 (8.6%) |
13 (8.2%) |
| Canada | 411 (100.0%) |
917 (100.0%) |
862 (100.0%) |
198 (100.0%) |
158 (100.0%) |
Source: Employment and Social Development Canada, Common System of Grants and Contributions.
When assessed by firm size, small-sized enterprises (with fewer than 50 employees) comprised 69.6% of all Work-Sharing agreements in the fiscal year examined, down from 76.8% reported in the previous fiscal year. Combined, small and medium-sized enterprises (SMEs) with fewer than 500 employees accounted for 99.4% of all Work-Sharing agreements in FY1819, which is quite similar to the level in the previous fiscal year (99.5%). The number of Work-Sharing agreements involving large-sized enterprise (with 500 employees or more) remained stable from FY1718 to FY1819, with only 1 agreement. This was consistent with the general trend observed since the 2008 recession, as Work-Sharing agreements have been primarily initiated to assist SMEs in recovering from economic shocks to their normal levels of business activity.
2.5.2 Employment Insurance Work-Sharing claims and amount paid
The use of Work-Sharing benefits is linked to the trends observed in Work-Sharing agreements, and is countercyclical to economic conditions (similar to the number of new claims established and amounts paid under EI regular benefits). As with the number of Work-Sharing agreements, the total number of Work-Sharing claims established and the total amounts paid in Work-Sharing benefits increase during labour market contraction and economic uncertainties, and decrease during periods of economic expansion.
Chart 29 illustrates the number of Work-Sharing claims and benefits paid from FY1011 to FY1819.
In FY1819, the number of Work-Sharing claims established increased slightly, from 3,708 claims in FY1718 to 3,815 in FY1819 (+2.9%). This is the first increase since FY1516. It was in part attributable to the increase in the number of claims established by firms whose main activities consist of manufacturing wood products (from 108 claims in FY1718 to 494 claims in FY1819).
Unlike the number of new claims, the total amount paid in Work-Sharing benefits decreased from $12.5 million in FY1718 to $5.7 million in FY1819, representing a decrease of 53.9%.
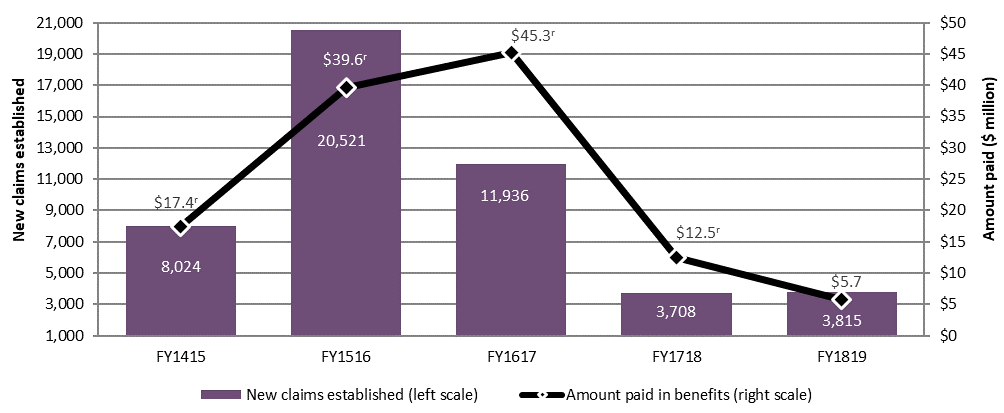
Text description of Chart 29
| Category | FY1415 | FY1516 | FY1617 | FY1718 | FY1819 |
|---|---|---|---|---|---|
| New claims established (left scale) | 8,024 | 20,521 | 11,936 | 3,708 | 3,815 |
| Amount paid in benefits ($ millions) (right scale) | $17.4 | $39.6 | $45.3 | $12.5 | $5.7 |
- Note: Includes all claims for which at least $1 of work-sharing benefits was paid.
- *In previous EI monitoring and assessment reports, amounts paid for Work-Sharing benefits were based on a 10% sample of EI administrative data. Starting in FY1819, amounts paid are based on a 100% sample. Consequently, statistics reported for previous years have been revised.
- Source: Employment and Social Development Canada, Employment Insurance (EI) administrative data. Data are based on a 100% sample of EI administrative data.
Employment Insurance Work-Sharing claims and amount paid, by region, gender, age and industry
As outlined in Table 40, the most notable decline in the number of claims was in Ontario (-398 claims), followed by Atlantic Canada (-205 claims), the largest increase was in Manitoba (+428 claims), followed by Alberta (+197 claims) and Saskatchewan (+127 claims). Like in the previous year, claimants from Ontario established the largest share of total new claims (35.1%), followed by claimants from Quebec (26.2%) and Alberta (15.7%); however, in terms of amount paid, claims established in Quebec received the largest share of total amount paid with 32.1%, followed by claims established in Ontario (25.9%) and Alberta (19.0%) in FY1819. There were no claims established in the territories.
| Category | New claims established FY1718 | New claims established FY1819 | Amount paid ($ millions) FY1718r |
Amount paid ($ millions) FY1819 |
|---|---|---|---|---|
| Atlantic provinces | 231 (6.2%) |
26 (0.7%) |
$0.6 (4.7%) |
$0.0 (0.8%) |
| Quebec | 941 (25.4%) |
1,001 (26.2%) |
$3.2 (25.3%) |
$1.8 (32.1%) |
| Ontario | 1,737 (46.8%) |
1,339 (35.1%) |
$2.8 (22.7%) |
$1.5 (25.9%) |
| Manitoba | 111 (3.0%) |
539 (14.1%) |
$0.6 (4.4%) |
$0.5 (8.4%) |
| Saskatchewan | 85 (2.3%) |
212 (5.6%) |
$0.9 (7.2%) |
$0.5 (8.9%) |
| Alberta | 403 (10.9%) |
600 (15.7%) |
$4.1 (32.7%) |
$1.1 (19.0%) |
| British Columbia | 200 (5.4%) |
98 (2.6%) |
$0.4 (3.0%) |
$0.3 (5.0%) |
| Men | 2,487 (67.1%) |
2,721 (71.3%) |
$9.2 (73.7%) |
$4.3 (74.1%) |
| Women | 1,221 (32.9%) |
1,094 (28.7%) |
$3.3 (26.3%) |
$1.5 (25.9%) |
| 24 years old and under | 151 (4.1%) |
235 (6.2%) |
$0.6 (4.6%) |
$0.3 (4.5%) |
| 25 to 54 years old | 2,478 (66.8%) |
2,489 (65.2%) |
$8.8 (70.6%) |
$3.7 (65.2%) |
| 55 years old and over | 1,079 (29.1%) |
1,091 (28.6%) |
$3.1 (24.8%) |
$1.7 (30.3%) |
| Goods-producing industries | 3,031 (81.7%) |
3,461 (90.7%) |
$9.1 (72.6%) |
$4.9 (85.3%) |
| Manufacturing | 2,855 (77.0%) |
3,258 (85.4%) | $8.0 (64.3%) |
$4.6 (80.3%) |
| Rest of goods-producing industries | 176 (4.7%) |
203 (5.3%) |
$1.0 (8.3%) |
$0.3 (5.0%) |
| Service-producing industries | 633 (17.1%) |
352 (9.2%) |
$3.4 (27.4%) |
$0.8 (14.7%) |
| Wholesale trade | 180 (4.9%) |
63 (1.7%) |
$1.1 (8.5%) |
$0.2 (3.4%) |
| Professional, scientific and technical services | 282 (7.6%) |
64 (1.7%) |
$1.2 (9.3%) |
$0.2 (3.7%) |
| Rest of service-producing industries | 171 (4.6%) |
225 (5.9%) |
$1.1 (9.2%) |
$0.4 (7.6%) |
| Canada | 3,708 (100.0%) |
3,815 (100.0%) |
$12.5 (100.0%) |
$5.7 (100.0%) |
- Note: Data may not add up to the total due to rounding. Percentage share is based on unrounded numbers. Includes claims for which at least $1 of Employment Insurance (EI) Work-Sharing benefits was paid.
- r In previous EI monitoring and assessment reports, amounts paid for Work-Sharing benefits were based on a 10% sample of EI administrative data. Starting in FY1819, amounts paid are based on a 100% sample. Consequently, statistics reported for previous years have been revised.
- Source: Employment and Social Development Canada, EI administrative data. Data for claims and amount paid are based on a 100% sample of EI administrative data.
Men continue to be more likely to make use of the Work-Sharing program—a trend that has been persistent over the years. In FY1819 men accounted for 71.3% of new Work-Sharing claims and 74.1% of total benefits paid. Workers aged 25 to 54 years accounted for 65.2% of all new Work-Sharing claims and benefits. Similar to previous years, youth were under-represented among new Work-Sharing claims established (6.2%) and benefits paid (4.5%) compared with their total share of employment (13.1%) in FY1819.Footnote 88
From an industry perspective, the Work-Sharing program was most frequently used by workers in the Manufacturing industry, which is consistent with historical patterns. Employees in the Manufacturing industry accounted for the largest share of new EI Work-Sharing claims (85.4%) established in FY1819, up from 77.0% in the previous fiscal year. These workers received the largest share of the total EI Work-Sharing benefits paid (80.3%), up from 64.3% in FY1718 (see Table 40), which was disproportionate to their share of total employment (which was around 9.4% in recent years).Footnote 89
Among the services-producing industries, workers in the Wholesale trade and in the Professional, scientific and technical services industries each accounted for 1.7% of Work-Sharing claims. In terms of amount paid, workers in the Professional, scientific and technical services industry received 3.7% of total Work-Sharing benefits paid in FY1819, closely followed by workers in the Wholesale trade industry, who accounted for 3.4% of total Work-Sharing benefits paid in FY1819. See Annex 2.21.1 for detailed information on new claims established and Annex 2.21.4 for amount paid by industry.
2.5.3 Level and duration of Employment Insurance Work-Sharing benefits
The Work-Sharing program is designed to provide income support for workers in firms that experience temporary reductions in demand for reasons beyond their control. In view of this, the program provides partial income stabilization to offset reductions in hours that are agreed upon by the employees participating in the program. However, the program is not meant to provide full coverage of insurable hours or insurable earnings. As a result, the data reported on Work-Sharing claims are not directly comparable to other types of EI benefits. This is particularly true of the weekly benefit rates paid to claimants, which are meant to only cover 10% to 60% of a regular work week for affected employees in a work unit subject to a Work-Sharing agreement, depending on the agreed upon decrease in work levels. Because of this, the weekly benefit rates for Work-Sharing claimants are lower on average than for other types of EI benefits. Because the weekly Work-Sharing benefit rate is determined by employees’ wage and the degree of reductions in the hours worked (between 10% and 60%), significant variability is also observed across industries in the reported weekly benefit rates.
In FY1819, the average weekly Work-Sharing benefit rate increased by +10.4% to $121, up from the average weekly benefit rate of $109 in the previous fiscal year (see Table 41). Similar to the previous years, a high degree of variability can be observed among the average weekly benefit paid in each region in the fiscal year examined. For example, in FY1819, the highest average weekly benefit rate was in British Columbia ($167), followed by Atlantic provinces ($152) and Saskatchewan ($151), while the lowest was in Ontario ($105). The average weekly Work-Sharing benefit rate for men increased by 12.8% to $129, while the rate for women remained at the same level as the previous year ($99). The average weekly benefit rate for all age groups increased; the highest average rate was observed for workers aged 25 to 54 years ($122), followed by those aged below 25 years ($120) and those aged 55 years and over ($118).
| Category | FY1718 | FY1819 | Change (%) |
|---|---|---|---|
| Atlantic provinces | $113 | $152 | +34.0% |
| Quebec | $109 | $127 | +15.8% |
| Ontario | $102 | $105 | +3.2% |
| Manitoba | $113 | $110 | -2.7% |
| Saskatchewan | $160 | $151 | -5.4% |
| Alberta | $124 | $135 | +9.0% |
| British Columbia | $118 | $167 | +42.1% |
| Men | $115 | $129 | +12.8% |
| Women | $99 | $99 | +0.5% |
| 24 years old and under | $102 | $120 | +17.8% |
| 25 to 54 years old | $110 | $122 | +10.5% |
| 55 years old and over | $108 | $118 | +9.2% |
| Goods-producing industries | $106 | $119 | +12.4% |
| Agriculture, forestry, fishing and hunting, and Mining and oil and gas extraction | $110c | $180c | +63.5% |
| Construction | $112 | $130 | +16.1% |
| Manufacturing | $106 | $119 | +11.9% |
| Service-producing industries | $123 | $133 | +8.4% |
| Wholesale trade | $113 | $145 | +28.1% |
| Accommodation and food services, and Other services (excl. public administration) | $108c | $111c | +2.7% |
| Canada | $109 | $121 | +10.4% |
- Note: Percentage change is based on unrounded numbers. Includes claims for which at least $1 of Work-Sharing benefits was paid.
- c Data for some industries have been combined for confidentiality purposes.
- Source: Employment and Social Development Canada, Employment Insurance (EI) administrative data. Data are based on a 100% sample of EI administrative data.
The average weekly Work-Sharing benefit rate in goods-producing industries increased by +12.4% to $119 in FY1819. The average weekly Work-Sharing benefit rate increased to $133 from $123 in service-producing industries. See Annex 2.21.3 for detailed information on average Work-Sharing weekly benefit rate by industry.
The average duration of Work-Sharing claims completed in FY1819 was 15.5 weeks, a decrease of 8.3 weeks from FY1718 (23.8 weeks). This represents the first decline in the average duration of Work-Sharing claims since FY1516 (see Chart 30). This decrease in the duration of claims was driven mainly by the recovery of the economy observed during the reporting period.
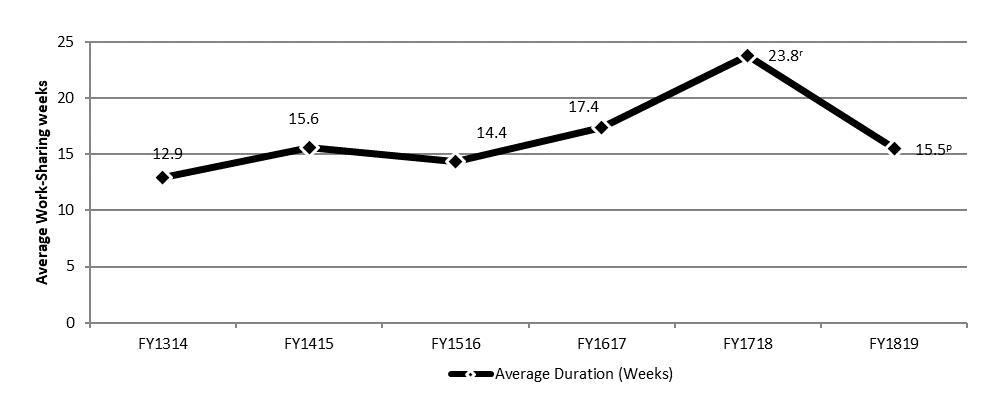
Text description of Chart 30
| Duration | FY1314 | FY1415 | FY1516 | FY1617 | FY1718 | FY1819 |
|---|---|---|---|---|---|---|
| Average duration (weeks) | 12.9 | 15.6 | 14.4 | 17.4 | 23.8 | 15.5 |
- Note: Includes all claims for which at least $1 of Work-Sharing benefits was paid.
- r Revised
- P Preliminary estimates.
- Source: Employment and Social Development Canada, Employment Insurance (EI) administrative data. Data are based on a 100% sample of EI administrative data.
2.5.4 Employment Insurance Work-Sharing agreements subject to early termination
When a firm returns to normal levels of business activity ahead of recovery plan timelines, or withdraws from the Work-Sharing agreement for other reasons (for example, the firm is shutting down or deciding to go ahead with layoffs),Footnote 90 the Work-Sharing agreement ends before the anticipated end date—this is referred to as early termination. During the last 5 fiscal years, just over one-third (36%) of agreements were terminated earlier than their scheduled end date and just over two-thirds (70%) of firms returned to their normal level of employment.
Effectiveness of the Work-Sharing program over the years
A recent study* examined the usage of the Work-Sharing program since 2000 and estimated the number and distribution of layoffs averted by the Work-Sharing program, and the number of shutdowns by employers who participated in the program. The study found that Work-Sharing claims that started at the beginning of a recession and that ended during the recession were most likely associated with a layoff after the agreement had terminated, whereas claims that started once the recession was already underway and ended as the economy recovered were less likely associated with a subsequent layoff. For example, during the economic slowdown in 2001, the proportion of net layoffs averted** improved from 34% in FY0001 to 67% in FY0102. Again during the 2008 recession, the proportion of net layoffs averted improved from 26% in FY0708 to 51% in FY0809, and 69% in FY0910. Following the decline in commodity prices in FY1415, the proportion of net layoffs averted improved from 42% in FY1415 to 58% in FY1516.
The study also looked at the incidence of shutdowns among employers who participated in the Work-Sharing program and those who did not. It was found that in the short to medium term, the cumulative shutdown rate among non-Work-Sharing employers was about 6 percentage points higher than for employers who participated in the program. The shutdown rate for non-Work-Sharing employers was almost 20 percentage points higher than for participating employers in the longer term.
* ESDC, Usage of the Work-Sharing Program: 2000/2001 to 2016/2017 (Ottawa: ESDC, Evaluation Directorate, 2018).
** The methodology used to estimate the number of layoffs averted assumes a perfect substitution between 1 hour of work reduction with the Work-Sharing program and 1 hour of work reduction through the layoff alternative (a conversion rate of 1.0). The number of layoffs that occurred subsequent to the program was subtracted from the estimated number of layoffs averted to calculate the net layoffs averted.
2.6 Employment Insurance special benefits
In this section
- 2.6.1 Employment Insurance special benefit claims overview
- 2.6.2 Employment Insurance maternity and parental benefits
- 2.6.3 Employment Insurance sickness benefits
- 2.6.4 Employment Insurance compassionate care benefits
- 2.6.5 Employment Insurance family caregiver benefit for adults
- 2.6.6 Employment Insurance family caregiver benefit for children
- 2.6.7 Employment Insurance special benefits for self-employed persons
EI special benefits provide temporary income support to eligible insured employees or self-employed persons (including fishers) who are unable to work due to specific life circumstances. These include:
- sickness
- pregnancy
- providing care to a newborn or newly adopted child, and
- providing care and support to a critically ill family member or provide end-of-life care to a family member with significant risk of death
To qualify for EI special benefits, insured employees must have accumulated a minimum of 600 hours of insurable employment during their qualifying period, meet the eligibility criteria of the specific special benefits being claimed, and experience a reduction in their normal weekly earnings by over 40%. Self-employed persons may qualify if they opted into the EI program and paid EI premiums at least 1 full year prior to claiming benefits, have self-employment income that meets the minimum self-employment eligibility thresholdFootnote 91 in the calendar year preceding the claim, and meet other eligibility criteria specific to the special benefits being claimed.
Subsection 2.6.1 provides a summary overview of special benefits in terms of the number of new claims established, amount paid and level of benefits. The following subsections examine the EI special benefits by type. Subsection 2.6.2 discusses maternity and parental benefits. Sickness benefits are introduced in subsection 2.6.3. Subsections 2.6.4, 2.6.5 and 2.6.6 examine compassionate care benefits, the family caregiver benefit for adults and the family caregiver benefits for children, respectively. Finally, subsection 2.6.7 looks at the use of special benefits by self-employed persons who have opted into the EI program. For the purpose of this section, EI special benefit claims refer to EI claims for which at least 1 dollar of special benefits was paid.Footnote 92
2.6.1 Employment Insurance special benefit claims overview
In FY1819, there were about 606,500 new special benefit claims established, which represents a 1.6% increase from the previous fiscal year (see Table 42) and the eighth consecutive year-over-year increase in claims established. Over two thirds of those special benefit claims were sickness benefits (69.4%), while 33.0% and 28.0% included parental and maternity benefits, respectively. About 1.7% of all special benefit claims were family caregiver benefits for adults, 1.4% were compassionate care benefits and 0.9% were family caregiver benefits for children.Footnote 93
| Benefit type | Number of claims FY1718 |
Number of claims FY1819 |
Number of claims change (%) |
Amount paid ($ millions) FY1718 |
Amount paid ($ millions) FY1819 |
Amount paid ($ millions) change (%) |
|---|---|---|---|---|---|---|
| Maternity | 171,470 | 170,010 | -0.9% | $1,150.3 | $1,164.1 | +1.2% |
| Parental | 198,050 | 200,030 | +1.0% | $2,778.1 | $2,728.0 | -1.8% |
| Sickness | 411,870 | 420,840 | +2.2% | $1,712.0 | $1,769.6 | +3.4% |
| Compassionate care | 11,010 | 8,385 | -23.8% | $61.1 | $45.8 | -25.0% |
| Family caregiver for adults | 2,671r,* | 10,106 | n/a* | $7.8r,* | $48.3 | n/a* |
| Family caregiver for children | 4,921r | 5,475 | +11.3% | $30.4r | $36.8 | +20.9% |
| Canada | 597,090 | 606,540 | +1.6% | $5,739.7r | $5,792.7 | +0.9% |
- Note: Data may not add up to total due to rounding. Percentage change is based on unrounded numbers. Includes all claims for which at least $1 in EI special benefit was paid. New claims established by benefit type may not sum as claimants can receive multiple benefit types on a single claim.
- r Revised data.
- * EI family caregiver benefits for adults came into effect on December 3, 2017. Given the short period during which benefits for family caregivers for adults were offered in FY1718, few claims were made. Consequently, the data from FY1819 are not comparable to the previous year’s data.
- Source: Employment and Social Development Canada, Employment Insurance (EI) administrative data. Data on maternity, parental and sickness benefits are based on a 10% sample of EI administrative data, whereas data on compassionate care benefits, family caregiver benefits for adults and family caregiver benefits for children are based on a 100% sample.
In FY1819, compassionate care benefits experienced the largest percentage change with a 23.8% decrease in new claims from the previous fiscal year, while family caregiver benefits for children experienced an increase of 11.3% in new claims from FY1718.
The total amount of special benefits paid increased slightly by 0.9% over the previous fiscal year, totaling $5.8 billion for FY1819. Amounts paid increased for all benefits, except compassionate care and parental benefits. The decrease in amount of parental benefits paid could be due to the fact that extended parental benefits are paid at a replacement rate of 33% over a 61-week period. In this case, some of the amount paid to extended parental beneficiaries would be paid outside of the reporting period.
As in previous years, almost two thirds of special benefit claims were established by women (63.7%). Women also received the majority of the amount paid in special benefits (80.6%), mainly because they received the majority of parental benefits and because only women can access maternity benefits.
By age, claimants between the ages of 25 and 39 years old established almost half (47.9%) of all new special benefit claims and received the largest share of total special benefits paid (69.6%). The same age group also received 89.3% and 88.2% of the total amounts paid for maternity benefits and parental benefits, respectively. Claimants aged 40 years old and over received the highest proportion of amounts paid in sickness benefits (63.6%) and in compassionate care benefits (78.4%).
Excluding extended parental benefits, which are paid out at a lower weekly rate than other types of special benefits (see sub-section 2.6.2), the average weekly benefit rate for new special benefit claims established in FY1819 jumped 2.3% to $450. The share of special benefit claims for which the maximum weekly benefit rate was paid was 43.0%, an increase of 1.3 percentage points compared to the previous fiscal year.
Employment Insurance special benefits and firms
According to 2017 tax data, which is the most recent microdata available when writing this report, there were approximately 203,400 firms (16.8% of all firms in 2017) which were associated with the establishment of an EI special benefit claim as a claimant’s current or most recent employer (see Table 43). This is an increase of 3.1% from 2016.
| Firm size | All firms | Firms with at least 1 employee receiving EI special benefits | Employment distribution** (% share) |
EI claimant*** (% share) |
|---|---|---|---|---|
| Small | 1,096,760 | 117,910 | 21.5% | 18.6% |
| Small-medium | 95,710 | 66,860 | 19.8% | 21.9% |
| Medium-large | 16,120 | 15,390 | 16.1% | 18.4% |
| Large | 3,240 | 3,220 | 42.6% | 41.1% |
| Canada | 1,211,830 | 203,380 | 100.0% | 100.0% |
- * The categories of firm size reflect those found in Business Dynamics in Canada, a Statistics Canada publication. Small-sized firms are defined as those that employ 1 to 19 employees. Small-to-medium sized firms employ 20 to 99 employees. Medium-to-large sized firms employ 100 to 499 employees. Large-sized firms employ 500 employees or more.
- ** The number of workers in a firm is the number of individuals with employment income in that firm, as indicated on a T4 form. The number of workers is adjusted so that each individual in the labour force is only counted once and individuals who work for more than 1 firm are taken into account. For example, if an employee earned $25,000 in firm 1 and $25,000 in firm 2, then he or she would be recorded as 0.5 employees at the first firm and 0.5 employees at the second firm.
- *** These figures are based on the number of people receiving EI special benefits in 2017.
- Sources: Employment and Social Development Canada, Employment Insurance (EI) administrative data. Data are based on a 100% sample of EI data. Canada Revenue Agency (CRA) administrative data. CRA data are based on a 100% sample.
The distribution of the workforce and of EI special benefit claimants is roughly similar by firm size, which is unlike EI regular benefits in that larger firms are typically under-represented (see section 2.2). For special benefits, the biggest difference between employee and claimant distributions was observed in small-sized firms, with a difference of 2.9 percentage points. Workforce adjustment issues during a difficult business or economic context may offer some explanation of the higher relative use of EI regular benefits among small firms, the use of EI special benefits is more likely related to the demographic profile of the workforce, individual circumstances, and the nature of the work in the industry.
2.6.2 Employment Insurance maternity and parental benefits
EI maternity benefits are available to eligible persons who cannot work because they are pregnant or have recently given birth. EI maternity claimants need to provide Service Canada with a signed statement attesting to their pregnancy and their expected or actual date of delivery.Footnote 94 Qualified claimants may receive up to 15 weeks of maternity benefits per benefit period. Benefits can begin to be paid as early as 12 weeks prior to the expected date of birth and can end as late as 17 weeks after the child’s actual birth date.Footnote 95
EI parental benefits are available to eligible parents who take a leave from work to care for a newborn or recently adopted child or children. Applicants must provide a signed certificate certifying the child’s date of birth or the date of the child’s placement in their home for an adoption. Parents whose children were born or placed for adoption on December 3, 2017, or later must choose between standard parental benefits or extended parental benefits. Before this date, only standard parental benefits were available.
- Standard parental benefits provide up to 35 weeks of benefits paid over a maximum of 12 months at a benefit rate of 55% of weekly insurable earnings, to a maximum of $547 in 2018 and $562 in 2019.
- Extended parental benefits provide up to 61 weeks of benefits paid over a maximum of 18 months. The benefit rate is 33% of weekly insurable earnings, up to a maximum of $328 in 2018 and $337 in 2019.
Parents can share and use benefits at the same time or different times. Parents must choose the same parental benefits option (standard or extended) when they apply for benefits. The choice of the first parent who completes the application is binding on other parents. When parental benefits are shared by parents, only 1 parent will need to serve a waiting period. Once parental benefits have been paid out to any eligible parent, they cannot change their duration option but may change how they share the weeks of benefits.
It should be noted that the maternity and parental benefits offered under the EI program are available across Canada with the exception of Quebec. For parents who reside in Quebec, the Quebec Parental Insurance Plan (QPIP) has provided salaried workers and self-employed persons with maternity, paternity, parental, or adoption benefits since January 1, 2006.
EI parental sharing benefit
In Budget 2018, the government committed to offering additional weeks of parental benefits to eligible parents, when those benefits are shared. The goal is to encourage all parents, including fathers, to take leave when a new child comes into the family and to share more equally in the work of raising their children. This measure is offered to parents eligible for EI parental benefits, including adoptive parents and same-sex parents, whose children were born or placed for adoption on March 17, 2019 or later and who agree to share parental benefits. Under this measure:
- Parents who share standard parental benefits are eligible for 5 additional weeks of benefits, for a total of 40 weeks. No parent is eligible to receive more than 35 weeks of standard benefits.
- Parents who share extended parental benefits are eligible for 8 additional weeks of benefits, for a total of 69 weeks. No parent is eligible to receive more than 61 weeks of extended parental benefits.
This measure was implemented on March 17, 2019, and as a result, was not in effect during most of the period examined in this report. Preliminary data will be available in the Monitoring and Assessment Report covering FY1920.
Employment Insurance maternity and parental benefits: coverage and accessibility
According to the 2018 Employment Insurance Coverage Survey (EICS), 209,700 recent mothers (those with a child aged 12 months or less) living outside Quebec had insurable employment in 2018, which represents 71.5% of all recent mothers. Among these recent mothers with insurable employment, 85.4% reported having received maternity or parental benefits, which represents a slight decrease of 1.8 percentage points from 2017 (87.2%) (see Chart 31).
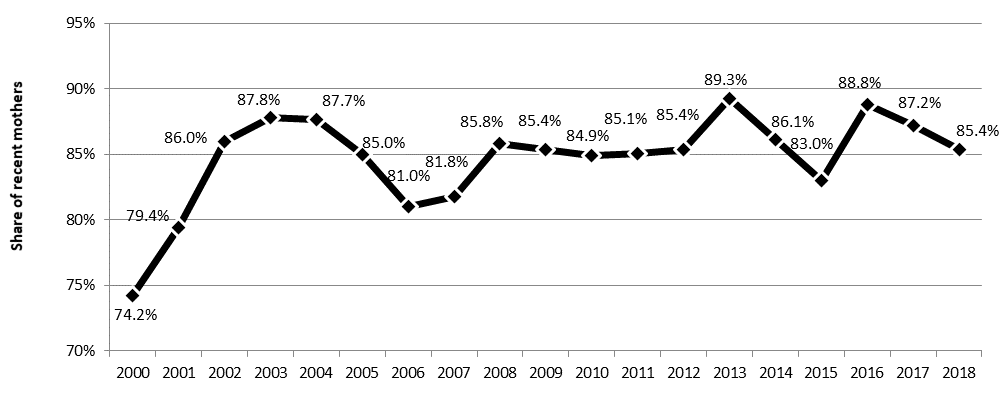
Text description of Chart 31
| Year | Share of recent mothers |
|---|---|
| 2000 | 74.2% |
| 2001 | 79.4% |
| 2002 | 86.0% |
| 2003 | 87.8% |
| 2004 | 87.7% |
| 2005 | 85.0% |
| 2006 | 81.0% |
| 2007 | 81.8% |
| 2008 | 85.8% |
| 2009 | 85.4% |
| 2010 | 84.9% |
| 2011 | 85.1% |
| 2012 | 85.4% |
| 2013 | 89.3% |
| 2014 | 86.1% |
| 2015 | 83.0% |
| 2016 | 88.8% |
| 2017 | 87.2% |
| 2018 | 85.4% |
Source: Statistics Canada, Employment Insurance Coverage Survey, 2000 to 2018
According to EICS data, the proportion of spouses of recent mothers living outside Quebec who received or intended to claim EI parental benefits went from 11.9% in 2017 to 15.0% in 2018. In Quebec, a larger share of spouses of recent mothers received parental benefits or intended to receive them (79.6%), which may be largely due to the paternity benefits paid specifically to fathers as part of QPIP.
Access to maternity and parental benefits and coverage
According to the 2018 EICS data, the share of recent mothers with insurable employment in Quebec who received maternity or parental benefits under QPIP (96.5%) is greater than that of persons having received EI maternity or parental benefits in the rest of Canada (85.4%). This situation can be explained by several factors, most notably the lower eligibility requirement based on earnings under QPIP ($2,000) and the mandatory participation of self-employed persons under QPIP in comparison to the voluntary participation in the EI program.
Employment Insurance maternity claims, amount paid and level of benefits
In FY1819, there were 170,000 new maternity claims established, which represents a slight decrease of 0.9% from the previous fiscal year (see Table 44).
| Category | Number of claims FY1718 |
Number of claims FY1819 |
Number of claims change (%) |
Amount paid ($ millions) FY1718 |
Amount paid ($ millions) FY1819 |
Amount paid ($ millions) change (%) |
|---|---|---|---|---|---|---|
| Newfoundland and Labrador | 2,730 | 2,550 | -6.6% | $17.8 | $17.5 | -1.4% |
| Prince Edward Island | 900 | 890 | -1.1% | $6.5 | $5.9 | -10.3% |
| Nova Scotia | 5,060 | 5,410 | +6.9% | $31.4 | $33.3 | +6.0% |
| New Brunswick | 4,180 | 4,350 | +4.1% | $25.1 | $27.7 | +10.7% |
| Quebec | n/a | n/a | n/a | n/a | n/a | n/a |
| Ontario | 83,920 | 83,500 | -0.5% | $566.4 | $576.3 | +1.7% |
| Manitoba | 8,610 | 8,580 | -0.3% | $55.4 | $55.5 | +0.3% |
| Saskatchewan | 8,330 | 8,340 | +0.1% | $55.4 | $58.1 | +5.0% |
| Alberta | 29,470 | 29,360 | -0.4% | $206.2 | $203.9 | -1.1% |
| British Columbia | 27,430 | 26,110 | -4.8% | $179.9 | $179.5 | -0.2% |
| Yukon | 240 | 280 | +16.7% | $1.9 | $2.1 | +11.2% |
| Northwest Territories | 300 | 380 | +26.7% | $2.3 | $2.5 | +10.4% |
| Nunavut | 300 | 260 | -13.3% | $2.1 | $1.8 | -14.8% |
| 24 years old and under | 15,080 | 14,120 | -6.4% | $76.1 | $75.6 | -0.8% |
| 25 to 39 years old | 149,440 | 148,960 | -0.3% | $1,027.1 | $1,039.6 | +1.2% |
| 40 years old and over | 6,950 | 6,930 | -0.3% | $47.1 | $49.0 | +4.2% |
| Canada | 171,470 | 170,010 | -0.9% | $1,150.3 | $1,164.1 | +1.2% |
- Note: Data may not add up to the total due to rounding. Percentage change is based on unrounded numbers. Includes claims for which at least $1 of EI maternity benefits was paid.
- Source: Employment and Social Development Canada, Employment Insurance (EI) administrative data. Data are based on a 10% sample of EI administrative data.
Women between 25 and 39 years old established 87.6% of new maternity claims during the reporting period, while women aged 24 and under and those aged 40 years old and over represented 8.3% and 4.1%, respectively. While the number of new claims established by mothers aged 25 to 39 years old has remained stable, the number of claims for mothers 24 years old and under reported a large decrease (‑6.4%) compared to the previous year.
The total amount paid out in maternity benefits was nearly 1.2 billion dollars for FY1819, an increase of 1.2% from FY1718. The total amount paid increased in most provinces, notably in Nova Scotia (+6.0%), New Brunswick (+10.7%), Yukon (+11.2%) and Northwest Territories (+10.4%), where number of claims also increased. Notable decreases in amount paid include Prince Edward Island (-10.3%) and Nunavut (-14.8%). Women over 40 years old represented the group with the largest increase in maternity benefit payments (+4.2%).
Maternity benefits are frequently combined in the same claim with other benefit types, particularly parental and sickness benefits; 98.5% of all EI maternity claims completed during FY1819 included another type of EI benefit (see subsection 2.1.2).
The average weekly maternity benefit rate increased by 2.6% to $465 in FY1819. About half of all maternity claimants (51.2%) received the maximum weekly benefit rate. On average, the highest weekly maternity benefit rate was for claims established in Yukon ($506) and the Northwest Territories ($503) and by mothers aged 40 years old and over ($482).
Employment Insurance parental benefits, amount paid and level of benefits
The total number of new parental claims established increased by 1.0% over the previous year to reach 200,030 in FY1819 (see Table 45). About 16.0% of all parental claims were for extended parental benefits and less than 1.0% of all parental claims came from adoptive parents (approximately 1,500). Nova Scotia, New Brunswick, Yukon and the Northwest Territories had the highest relative increases in new claims established.
| Category | Number of claims FY1718 |
Number of claims FY1819 |
Number of claims change (%) |
Amount paid ($ millions) FY1718 |
Amount paid ($ millions) FY1819 |
Amount paid ($ millions) change (%) |
|---|---|---|---|---|---|---|
| Standard | 189,350 | 168,120 | n/a* | $2,777.1 | $2,511.5 | n/a* |
| Extended | 8,700 | 31,910 | n/a* | $1.0 | $216.6 | n/a* |
| Newfoundland and Labrador | 2,790 | 2,720 | -2.5% | $42.6 | $38.4 | -10.0% |
| Prince Edward Island | 1,000 | 960 | -4.0% | $15.1 | $14.3 | -5.2% |
| Nova Scotia | 5,830 | 6,190 | +6.2% | $77.1 | $74.0 | -4.0% |
| New Brunswick | 4,710 | 4,960 | +5.3% | $59.8 | $63.3 | +5.8% |
| Quebec | n/a | n/a | n/a | n/a | n/a | n/a |
| Ontario | 97,880 | 99,620 | +1.8% | $1,375.4 | $1,347.0 | -2.1% |
| Manitoba | 10,050 | 10,220 | +1.7% | $131.0 | $131.6 | +0.4% |
| Saskatchewan | 9,290 | 9,480 | +2.0% | $133.6 | $135.0 | +1.0% |
| Alberta | 33,130 | 33,840 | +2.1% | $495.3 | $477.6 | -3.6% |
| British Columbia | 32,250 | 30,790 | -4.5% | $433.4 | $431.5 | -0.5% |
| Yukon | 310 | 400 | +29.0% | $5.0 | $4.7 | -6.6% |
| Northwest Territories | 430 | 490 | +14.0% | $5.7 | $5.4 | -6.0% |
| Nunavut | 380 | 360 | -5.3% | $4.1 | $5.5 | +34.5% |
| Men | 30,850 | 33,600 | +8.9% | $252.4 | $257.4 | +2.0% |
| Women | 167,200 | 166,430 | -0.5% | $2,525.7 | $2,470.6 | -2.2% |
| 24 years old and under | 15,420 | 14,660 | -4.9% | $176.1 | $169.7 | -3.6% |
| 25 to 39 years old | 170,170 | 172,690 | +1.5% | $2,448.6 | $2,404.9 | -1.8% |
| 40 years old and over | 12,460 | 12,680 | +1.8% | $153.5 | $153.4 | 0.0% |
| Canada | 198,050 | 200,030 | +1.0% | $2,778.1 | $2,728.0 | -1.8% |
- Note: Data may not add up to the total due to rounding. Percentage change is based on unrounded numbers. Includes claims for which at least $1 of EI parental benefits was paid.
- * Given the short period during which benefits for extended parental benefits were offered in FY1718, few claims were made. Consequently, the data on standard and extended parental benefits from FY1819 are not comparable to the previous year’s data.
- Source: Employment and Social Development Canada, Employment Insurance (EI) administrative data. Data are based on a 10% sample of EI administrative data.
Parents of children born or placed for adoption on or after December 3, 2017, could choose to receive extended parental benefits (up to 61 weeks of benefits, paid at a lower replacement rate). Before December 3, 2017, only standard parental benefits (up to 35 weeks of benefits) were available. The reporting period of this report covers the first full fiscal year during which extended parental benefits were offered. The majority of claimants selected the standard parental benefit duration, while about 32,000 (or 16.0%) opted for the extended parental benefit duration (see Annex 2.15 for a more comprehensive breakdown of extended parental benefits).
As in the past, women established the vast majority of parental claims (83.2%) in FY1819, although they registered a slight decrease (-0.5%). In contrast, men registered an increase in number of claims (+8.9%), which continues to reflect a year-over-year increase in parental claims made by men.
The amount paid in EI parental benefits decreased by 1.8% compared to FY1718, totalling $2.7 billion in FY1819. All provinces and territories, except New Brunswick, Manitoba, Saskatchewan and Nunavut, observed decreases in their respective amounts paid in parental benefits compared to FY1718.
The benefits paid out in extended parental benefits totalled $217 million dollars, which represents 7.9% of the total amount paid in parental benefits, and is an increase from $1 million dollars paid in FY1718. The large increase can be explained by the short period in FY1718 during which parents could receive extended parental benefits (as of December 3, 2017).
As with new claims, the majority of the total amount of parental benefits was paid to women (90.6%). Men experienced an annual increase in total amount paid in parental benefits (+2.0%), while women experienced a decrease in benefits paid (-2.2%). By age, claimants 24 years old and under, and 25 to 39 years old experienced decreases in amounts paid (-3.6% and -1.8%, respectively), while claimants aged 40 years old and over remained stable.
As stated above, weekly parental benefit rates are calculated differently depending on whether the claimant is receiving standard or extended benefits.Footnote 96 The average weekly standard parental benefit reached $475, an increase of 2.4% from FY1718. More than half (55.2%) of all claimants received the maximum weekly standard parental benefit rate. On average, the weekly benefit rate was higher for standard parental claims established in Yukon ($523), by men ($517) and by claimants aged 40 years old and over ($499).
The average weekly extended parental benefit rate was $297 in FY1819. More than half (56.9%) of all claimants received the maximum weekly extended parental benefit rate.
Duration of Employment Insurance maternity and parental benefits
As observed during previous fiscal years, claimants typically use almost all of the EI maternity and parental weeks to which they were entitled to. In FY1819, 90.4% of mothers received maternity benefits during the 15 weeks available to them. The average duration of completed maternity claims was 14.6 weeks during the reporting period.
Statistics on standard parental claims completedFootnote 97 during the reporting period show that when weeks of benefits were shared, women received an average of 23.6 weeks, whereas men received 10.2 weeks (see Chart 32). The average duration of standard parental claims on a family basis was 33.8 weeks for parents who decided to share benefits (see Table 46). For parents who did not share the available weeks of benefits, the average duration of standard parental benefits was 33.2 weeks for claims completed in FY1819.
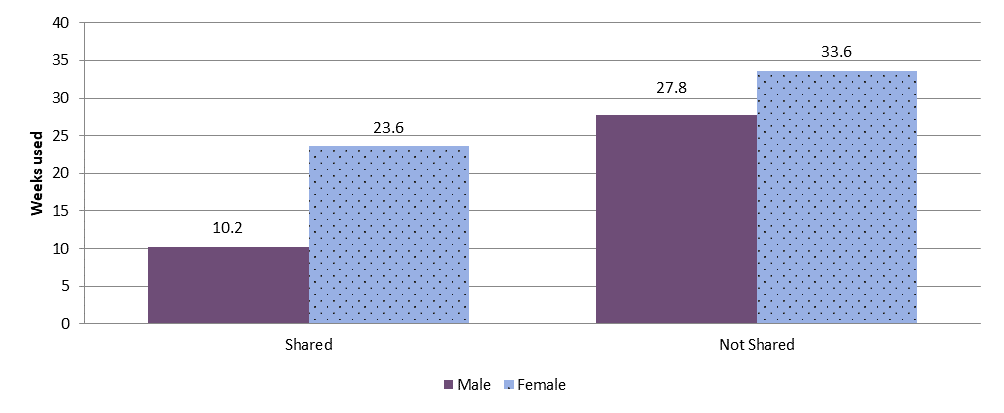
Text description of Chart 32
| Parents | Weeks used |
|---|---|
| Men (shared) | 10.2 |
| Women (shared) | 23.6 |
| Men (non-shared) | 27.8 |
| Women (non-shared) | 33.6 |
- Source: Employment and Social Development Canada, Employment Insurance (EI) administrative data. Data are based on a 10% sample of EI administrative data.
| Type of benefit | FY1415 | FY1516 | FY1617 | FY1718 | FY1819p |
|---|---|---|---|---|---|
| Maternity | 14.6 | 14.6 | 14.6 | 14.7r | 14.6 |
| Standard parental, shared | 33.5 | 33.2 | 33.2 | 33.3r | 33.8 |
| Standard parental, not shared | 33.0 | 32.9 | 33.0 | 33.0 | 33.2 |
| Combined maternity and standard parental benefits, per family (Share of total entitlement used) |
47.7 (95.4%) |
47.6 (95.1%) |
47.6 (95.3%) |
47.7 (95.5%) |
48.0 (95.9%) |
- Note: Completed claims include those that are terminated and those that are dormant and remained inactive as of August the following fiscal year. Shares of entitlement used are based on unrounded numbers.
- P Preliminary estimates.
- r Revised data.
- Source: Employment and Social Development Canada, Employment Insurance (EI) administrative data. Data are based on a 10% sample of EI administrative data.
Based on completed claims, the combined number of weeks of EI maternity and standard parental benefits used by families was an average of 48.0 weeks on a family basis or 95.9% of the 50 weeks of maternity and standard parental benefits to which they were entitled (see Table 46). Of these 48.0 weeks, 33.3 were paid in parental benefits and 14.6 were paid in maternity benefits.
2.6.3 Employment Insurance sickness benefits
EI sickness benefits are paid for up to 15 weeks to eligible people who are unable to work because of illness, injury or quarantine, but would otherwise be available to work. The maximum duration of benefits to which a sickness claimant is entitled depends on the recommendations from their physician or an approved medical practitioner. With job protection through the Canada Labour Code and the provincial and territorial statutes under labour law, EI sickness benefits allow claimants to recover while maintaining their attachment to the labour market. Claimants must provide Service Canada with a medical certificate signed by a doctor or approved medical practitioner.
Premium Reduction Program
Employers who offer short-term disability plans to their employees that meet requirements stipulated in the Employment Insurance Act and Employment Insurance Regulations can register their plans with the Employment Insurance Commission to obtain a lower EI premium rate than the regular employer rate through the Premium Reduction Program (PRP).
More information on the effect on premiums and the number of firms affected can be found in section 2.7.
Employment Insurance sickness claims, amount paid and level of benefits
Over FY1819, there were 420,800 new sickness claims established, an increase of 2.2% from FY1718. The number of sickness claims increased in all provinces, except Prince Edward Island, Manitoba and British Columbia (see Table 47).
| Category | Number of claims FY1718 |
Number of claims FY1819 |
Number of claims change (%) |
Amount paid ($ millions) FY1718 |
Amount paid ($ millions) FY1819 |
Amount paid ($ millions) change (%) |
|---|---|---|---|---|---|---|
| Newfoundland and Labrador | 11,070 | 11,500 | +3.9% | $49.0 | $48.7 | -0.7% |
| Prince Edward Island | 6,100 | 5,960 | -2.3% | $21.1 | $21.4 | +1.5% |
| Nova Scotia | 21,060 | 21,130 | +0.3% | $79.0 | $81.4 | +3.1% |
| New Brunswick | 29,440 | 30,080 | +2.2% | $103.7 | $111.2 | +7.3% |
| Quebec | 131,510 | 134,600 | +2.3% | $490.2 | $507.0 | +3.4% |
| Ontario | 111,480 | 112,990 | +1.4% | $502.3 | $519.7 | +3.5% |
| Manitoba | 11,250 | 11,030 | -2.0% | $47.3 | $48.2 | +1.9% |
| Saskatchewan | 7,670 | 8,200 | +6.9% | $34.6 | $36.4 | +5.1% |
| Alberta | 27,750 | 31,430 | +13.3% | $138.3 | $150.3 | +8.7% |
| British Columbia | 53,710 | 53,190 | -1.0% | $242.3 | $241.5 | -0.3% |
| Yukon | 450 | 300 | -33.3% | $1.9 | $1.8 | -6.3% |
| Northwest Territories | 250 | 280 | +12.0% | $1.5 | $1.4 | -6.8% |
| Nunavut | 130 | 150 | +15.4% | $0.9 | $0.6 | -33.0% |
| Men | 179,810 | 184,820 | +2.8% | $797.0 | $830.0 | +4.1% |
| Women | 232,060 | 236,020 | +1.7% | $915.0 | $939.6 | +2.7% |
| 24 years old and under | 29,990 | 30,250 | +0.9% | $98.6 | $99.5 | +0.9% |
| 25 to 34 years old | 88,670 | 90,000 | +1.5% | $340.3 | $356.4 | +4.7% |
| 35 to 44 years old | 83,000 | 85,520 | +3.0% | $353.2 | $368.8 | +4.4% |
| 45 to 54 years old | 96,350 | 94,980 | -1.4% | $425.7 | $426.4 | +0.2% |
| 55 to 64 years old | 93,830 | 98,340 | +4.8% | $407.1 | $426.4 | +4.7% |
| 65 years old and over | 20,030 | 21,750 | +8.6% | $87.2 | $92.1 | +5.6% |
| Canada | 411,870 | 420,840 | +2.2% | $1,712.0 | $1,769.6 | +3.4% |
- Note: Data may not add up to the total due to rounding. Percentage change is based on unrounded numbers. Includes claims for which at least $1 of EI sickness benefits was paid.
- Source: Employment and Social Development Canada, Employment Insurance (EI) administrative data. Data are based on a 10% sample of EI administrative data.
As in the past, a larger share of new EI sickness claims were established by women (56.1%) than men (43.9%). Men and women both recorded increases in the number of sickness claims of 2.8% and 1.7%, respectively.
Claimants aged 45 to 54 and 55 to 64 years old established the largest shares of new sickness claims in FY1819, with 22.6% and 23.4%, respectively. Claimants 65 years old and over experienced the largest increase in claims (+8.6%), while those aged 45 to 54 years old experienced a decrease in new claims (-1.4%). Relative to their representation in the labour force, people aged 24 years old and under were the most underrepresented, while those aged 55 to 64 were the most overrepresented age group (see Chart 33).Footnote 98
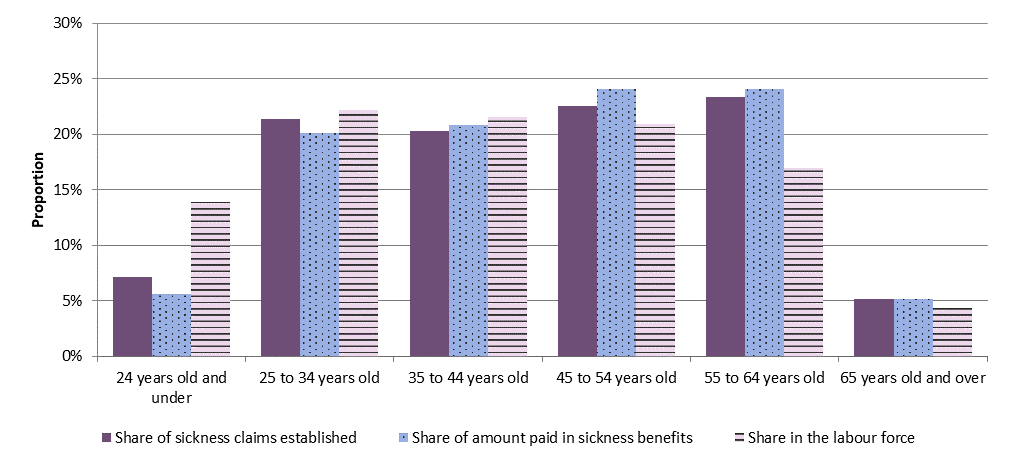
Text description of Chart 33
| Age | Share of sickness claims established | Share of amount paid in sickness benefits | Share in the labour force |
|---|---|---|---|
| 24 years old and under | 7.2% | 5.6% | 13.9% |
| 25 to 34 years old | 21.4% | 20.1% | 22.2% |
| 35 to 44 years old | 20.3% | 20.8% | 21.6% |
| 45 to 54 years old | 22.6% | 24.1% | 20.9% |
| 55 to 64 years old | 23.4% | 24.1% | 17.0% |
| 65 years old and over | 5.2% | 5.2% | 4.4% |
- Note: Includes claims for which at least $1 of EI sickness benefits was paid.
- Sources: Employment and Social Development Canada, Employment Insurance (EI) administrative data. Data are based on a 10% sample of EI administrative data. Statistics Canada, Labour Force Survey, Table 14-10-0017-01.
The total amount paid in sickness benefits went up 3.4% to $1.8 billion during FY1819. The majority of provinces recorded an increase in sickness benefits paid, with the exception of Newfoundland and Labrador, British Columbia and the Territories (see Table 47).
As with new claims, women received a slightly larger share of the amount paid in sickness benefits than men, with 53.1% and 46.9%, respectively. However, men experienced a larger annual increase in the amount paid than women (+4.1% compared to +2.7%, respectively).
In terms of age, the results observed follow a similar pattern as those observed for the number of claims. Claimants over the age of 45 received a larger share of the total amount of payments for sickness benefits than their share in the labour force, while claimants under the age of 44 received a smaller share (see Chart 33).
By industry, the goods-producing industries were overrepresented among EI sickness claims and total benefits paid, as they accounted for 27.0% of new EI sickness claims and 28.5% of sickness benefits paid, while they represented only 21.0% of workers (see Table 48).
| Industry | Number of claims ‘000s (Percentage share) |
Amount paid ($ millions) (Percentage share) |
Employment ‘000s (Percentage share) |
|---|---|---|---|
| Good-producing industries | 113.7 (27.0%) |
$503.7 (28.5%) |
3,930.6 (21.0%) |
| Agriculture, forestry, fishing, hunting, mining and oil and gas extraction | 17.8 (4.2%) |
$79.6 (4.5%) |
620.4 (3.3%) |
| Utilities | 0.6 (0.1%) |
$3.1 (0.2%) |
146.3 (0.8%) |
| Construction | 42.3 (10.0%) |
$199.2 (11.3%) |
1,438.5 (7.7%) |
| Manufacturing | 53.1 (12.6%) |
$221.8 (12.5%) |
1,725.4 (9.2%) |
| Services-producing industries | 300.7 (71.4%) |
$1,238.4 (70.0%) |
14,816.5 (79.0%) |
| Wholesale and retail trade | 68.7 (16.3%) |
$258.3 (14.6%) |
2,796.3 (14.9%) |
| Transportation and warehousing | 22.8 (5.4%) |
$107.7 (6.1%) |
1,006.4 (5.4%) |
| Finance, insurance, real estate, rental and leasing | 13.1 (3.1%) |
$59.6 (3.4%) |
1,176.3 (6.3%) |
| Professional, scientific and technical services | 12.0 (2.8%) |
$54.0 (3.1%) |
1,490.0 (7.9%) |
| Business, building and other support services* | 30.7 (7.3%) |
$127.6 (7.2%) |
788.6 (4.2%) |
| Educational services | 12.9 (3.1%) |
$47.8 (2.7%) |
1,338.4 (7.1%) |
| Healthcare and social assistance | 54.4 (12.9%) |
$234.3 (13.2%) |
2,423.8 (12.9%) |
| Information, culture and recreation** | 8.5 (2.0%) |
$34.9 (2.0%) |
779.8 (4.2%) |
| Accommodation and food services | 31.6 (7.5%) |
$107.0 (6.0%) |
1,232.7 (6.6%) |
| Other services (excluding public administration) | 18.1 (4.3%) |
$72.3 (4.1%) |
806.4 (4.3%) |
| Public administration | 27.9 (6.6%) |
$134.8 (7.6%) |
977.9 (5.2%) |
| Unclassified*** | 6.5 (1.5%) |
$27.5 (1.6%) |
n/a |
| Canada | 420.8 (100.0%) |
$1,769.6 (100.0%) |
18,747.1 (100.0%) |
- Note: Data may not add up to the total due to rounding. Percentage shares are based on unrounded numbers. Includes claims for which at least $1 of EI sickness benefits was paid.
- * Includes management of companies and enterprises and administrative support, waste management and remediation services.
- ** Includes information and cultural industries and arts, entertainment and recreation services.
- *** For some claims, this information was not available in the data.
- Sources: Employment and Social Development Canada, Employment Insurance (EI) administrative data. Data are based on a 10% sample of EI administrative data. Statistics Canada, Labour Force Survey, Table 14-10-0022-01 (for employment data).
The average weekly sickness benefit rate was $438 in FY1819, an increase of 2.8% from the previous fiscal year. A little more than a third (35.9%) of all sickness claimants received the maximum weekly benefit rate, which represented an increase of 1.2 percentage points compared to FY1718. On average, the highest weekly sickness benefit rate was paid for claims established in Nunavut ($519), by men ($475), and by claimants aged 35 to 44 years old ($453).
Duration of Employment Insurance sickness benefits
A maximum of 15 weeks of EI sickness benefits may be paid, though the number of weeks could be less depending on the claimant’s physician’s assessment.
The actual average duration of sickness benefits completed during FY1819 remained the same as FY1718 at 9.8 weeks. On average, men and women received 9.4 and 10.1 weeks of sickness benefits, respectively.
As in the past, the average number of weeks of sickness benefits paid increased with the age of claimants. Claimants aged 24 years old and under experienced, on average, the shortest duration (8.8 weeks), while those aged 55 years old and over registered the longest duration (10.2 weeks).
A little more than one-third (34.3%) of all completed sickness claims used the maximum number of 15 weeks of sickness benefits, which is similar to previous fiscal years. Women (35.6%) were more likely than men (32.6%) to use the maximum number of sickness weeks.
The use of all 15 weeks of benefits appears to be correlated with the age of claimants, with 25.6% of claimants 24 years old and under and 39.2% of claimants 55 years old and over using the maximum number of sickness weeks (see Table 49).
| Age category | FY1415 | FY1516 | FY1617 | FY1718r | FY1819p |
|---|---|---|---|---|---|
| 24 years old and under | 29.4% | 27.0% | 28.2% | 26.6% | 25.6% |
| 25 to 44 years old | 32.6% | 32.8% | 32.2% | 31.7% | 31.2% |
| 45 to 54 years old | 38.2% | 37.6% | 38.9% | 38.2% | 36.6% |
| 55 years old and over | 41.7% | 41.9% | 42.7% | 40.5% | 39.2% |
| Canada | 36.1% | 35.9% | 36.3% | 35.3% | 34.3% |
- Note: Includes all claims for which at least $1 in EI sickness benefits was paid. Completed claims include those that are terminated and those that are dormant and remained inactive as of August the following fiscal year.
- p Preliminary data
- r Revised data
- Source: Employment and Social Development Canada, Employment Insurance (EI) administrative data. Data are based on a 10% sample of EI administrative data.
Employment Insurance sickness benefits and short-term disability plans (STDP) offered by employers
A departmental study* showed that the number of employers who offered qualifying STDPs (recognized by the Premium Reduction Program) decreased between 2000 and 2015, but this was offset by an increase in large employers (500 or more employees) offering STDPs. Despite the overall decrease in number of employers offering STDPs, the number of employees covered by those plans increased over the same period.
The study also compared the characteristics of EI sickness claims established by claimants who benefitted from a STDP offered by their employer before turning to EI sickness benefits with people who turned directly to EI sickness benefits. Claimants for whom the EI program was the second payer were proportionally more likely to use the maximum 15-week period provided for EI sickness benefits than those who received only EI sickness benefits (an average of 39.7% compared to 32.0%, respectively, for the period between 2000 and 2015). In 2015, 21.9% of all EI sickness claimants used EI as a second payer, while the remaining 78.1% of EI sickness claimants used EI as a first payer.
The majority of employers offered weekly indemnity plans, which provide benefits for a minimum of 15 weeks. Given that claimants who were covered by a plan offered by their employer had to use all of their short-term disability insurance benefits before establishing an EI sickness claim, it appears that those who used all 15 weeks of EI sickness benefits were more likely to have severe medical issues that require longer recovery time.
* ESDC, Enhance Understanding of the Use of the Premium Reduction Program. (Ottawa: ESDC, Evaluation Directorate, 2019)
2.6.4 Employment Insurance compassionate care benefits
EI compassionate care benefits offer temporary income support for up to 26 weeks to eligible claimants who need to take time away from work to provide end-of-life care to family members who have a serious medical condition with a significant risk of death within 26 weeks.Footnote 99 The benefits may be paid to 1 caregiver or shared among caregivers, and only 1 of them needs to serve the waiting period. Claimants must submit a medical certificate issued by the family member’s medical doctor or nurse practitioner to Service Canada.Footnote 100
Employment Insurance compassionate care claims, amount paid and level of benefits
Over FY1819, there were almost 8,400 new claims established for compassionate care benefits, which represented a decrease of 23.8% over the previous fiscal year. This annual change was greater than the change recorded in FY1617. Less than 1 in 10 claims established in FY1819 had weeks of benefits that were shared among 2 or more caregivers (7.5%). This proportion has remained stable from FY1718 (6.9%).
All regions experienced a decrease in the number of claims for compassionate care benefits over the reporting period (see Table 50). Both men and women experienced decreases in number of claims, although women experienced a larger decrease (-24.6%). Women still continue to establish the majority of compassionate care claims (70.9%) compared to men (29.1%).
| Category | Number of claims FY1718 |
Number of claims FY1819 |
Number of claims change (%) |
Amount paid ($ millions) FY1718 |
Amount paid ($ millions) FY1819 |
Amount paid ($ millions) change (%) |
|---|---|---|---|---|---|---|
| Newfoundland and Labrador | 129 | 92 | -28.7% | $0.8 | $0.5 | -34.6% |
| Prince Edward Island | 66 | 40 | -39.4% | $0.4 | $0.2 | -36.9% |
| Nova Scotia | 351 | 281 | -19.9% | $2.0 | $1.4 | -32.4% |
| New Brunswick | 283 | 193 | -31.8% | $1.5 | $1.1 | -28.4% |
| Quebec | 1,808 | 1,497 | -17.2% | $8.5 | $6.5 | -24.3% |
| Ontario | 4,966 | 3,574 | -28.0% | $27.3 | $20.0 | -26.9% |
| Manitoba | 397 | 346 | -12.8% | $2.2 | $1.8 | -16.7% |
| Saskatchewan | 284 | 219 | -22.9% | $1.8 | $1.4 | -19.2% |
| Alberta | 1,032 | 866 | -16.1% | $6.7 | $5.7 | -15.3% |
| British Columbia | 1,658 | 1,243 | -25.0% | $9.5 | $7.0 | -26.4% |
| Territories | 36 | 34 | -5.6% | $0.3 | $0.2 | -19.8% |
| Men | 3,120 | 2,436 | -21.9% | $19.1 | $15.0 | -21.8% |
| Women | 7,890 | 5,949 | -24.6% | $42.0 | $30.9 | -26.4% |
| 24 years old and under | 167 | 116 | -30.5% | $0.8 | $0.5 | -38.8% |
| 25 to 44 years old | 3,494 | 2,723 | -22.1% | $18.9 | $14.4 | -23.5% |
| 45 to 54 years old | 3,641 | 2,681 | -26.4% | $20.5 | $15.1 | -26.4% |
| 55 years old and over | 3,708 | 2,865 | -22.7% | $21.0 | $15.9 | -24.3% |
| Canada | 11,010 | 8,385 | -23.8% | $61.1 | $45.8 | -25.0% |
- Note: Data may not add up to the total due to rounding. Percentage change is based on unrounded numbers. Includes claims for which at least $1 of EI compassionate care benefits was paid.
- Source: Employment and Social Development Canada, Employment Insurance (EI) administrative data. Data are based on a 100% sample of EI administrative data.
Individuals aged between 25 and 44 years old had established a smaller share of compassionate care claims (32.5%) than their relative weight in the Canadian labour forceFootnote 101 (43.8%). Conversely, people aged between 45 and 54 years old and those aged 55 years old and over established a larger share of claims for compassionate care benefits (32.0% and 34.2%, respectively) than their presence in the Canadian labour force (20.9% and 21.4%, respectively).
The total amount paid in compassionate care benefits was at $45.8 million in FY1819, which represents a decrease of 25.0% compared to the previous year.
As with new claims, the amount paid in compassionate care benefits during FY1819 decreased in all provinces, including the territories. Both men and women experienced a decrease in amounts received (see Table 50), although women still received over two thirds (67.4%) of the total amount of compassionate care benefits paid.
Claimants aged between 25 and 44 years old received a smaller share of the amount paid in compassionate care benefits than their demographic weight in the Canadian labour force: 31.5% of all benefits paid versus 43.8% of the labour force. Conversely, claimants aged between 45 and 54 years old and those aged 55 years old and over received 32.8% and 34.6% of the total amount of payments for compassionate care benefits, while they represent 20.9% and 21.4% of the labour force, respectively. All age groups reported decreases in the amounts received from the previous year.
The average weekly benefit rate for compassionate care benefits increased by 3.1% to $468 during FY1819. A little less than half (48.0%) of claimants received the maximum weekly benefit rate. On average, the highest weekly benefit rate for compassionate care benefits was paid for claims established in the Territories ($496), by men ($498), and by claimants aged between 25 and 44 years old ($478).
Duration of Employment Insurance compassionate care benefits
The average duration of EI compassionate care claims completed in FY1819 was 11.5 weeks. While this is a slight decrease from the average recorded in FY1718 (12.0 weeks), it continues to mark significant increase from previous fiscal years (see Table 51). This change can be attributed, in particular, to the change in the maximum number of weeks of compassionate care benefits available since January 3, 2016.
| Duration and share of claims | FY1415 | FY1516 | FY1617 | FY1718 | FY1819p |
|---|---|---|---|---|---|
| 6 weeks of benefits or more | 57.4% | 54.8% | 64.5% | 64.9%r | 62.2% |
| 26 weeks of benefits | n/a | n/a | 13.8% | 20.3%r | 17.3% |
| Average duration (weeks) | 4.7 | 4.6 | 9.8 | 12.0 | 11.5 |
- Note: Includes claims for which at least $1 of EI compassionate care benefits was paid. Completed claims include those that are terminated and those that are dormant and remained inactive as of August the following year.
- P Preliminary data.
- r Revised data.
- Source: Employment and Social Development Canada, Employment Insurance (EI) administrative data. Data are based on a 100% sample of EI administrative data.
Men and women received, on average, a similar number of weeks of compassionate care benefits for claims completed during FY1819 (11.8 and 11.3 weeks, respectively). Over the same period, claimants aged 44 years old and under received, on average, close to 11 weeks of compassionate care benefits, while claimants aged 55 years old and over received an average of around 12 weeks (see Annex 2.18.2).
Among compassionate care claims completed in FY1819, 62.2% used 6 weeks of benefits or more. This proportion, which is similar to those recorded over the previous 2 fiscal years (see Table 51), appears to show that despite an increase in the maximum number of weeks of compassionate care benefits available since January 3, 2016, a large share of claims did not receive any extra available weeks, which may be in part due to the death of a care recipient. In total, 17.3% of completed compassionate care claims received the maximum number of 26 weeks of benefits during FY1819, a decrease compared to FY1718 (20.3%).
A departmental studyFootnote 102 updating research results on the use and duration of compassionate care benefits confirmed that claimants who took care of their spouse or lived with the care recipient are most likely to use the entire benefit entitlement. However, 1 of the main reasons for not receiving or claiming the maximum number of weeks of benefits is related to the death of a care recipient, which would cause benefits to end in the week of the death.
Similar proportions of men and women used 6 weeks or more of compassionate care benefits, as well as those who used all 26 weeks of benefits, among the claims completed during the reporting fiscal year. However, claimants aged 55 years old and over were more likely to receive 6 weeks or more of compassionate care benefits (66.1%) than claimants aged 24 years old and under (57.9%). They were also more likely to use the total 26 weeks of compassionate care benefits than claimants aged 24 years old and under (18.3% and 13.1%, respectively).
2.6.5 Employment Insurance family caregiver benefit for adults
The EI family caregiver benefit for adults was announced in Budget 2017 and came into effect on December 3, 2017. They are offered to any EI eligible person who need to take temporary leave from work to provide care or support to a family member aged 18 or older who is suffering from a critical illness or injury and whose life is at risk. Family caregivers can obtain up to 15 weeks of benefits, which may be shared among eligible family members or other eligible people who are considered members of the family. Claimants must provide Service Canada with a medical certificate issued by the medical doctor or nurse practitioner of the family member who is critically ill or injured.
Employment Insurance claims for family caregiver benefits for adults, amount paid and level of benefits
About 10,100 claims were established for family caregiver benefits for adults during FY1819. Women established over two thirds of these claims (69.2%) (see Table 52). In terms of age, people aged 55 years old and older accounted for about one-third of all claims (37.4%), while claimants 44 and under accounted for 30.9% of all claims.
| Category | Number of claims | Amount paid ($ thousands) |
|---|---|---|
| Newfoundland and Labrador | 195 | $966.6 |
| Prince Edward Island | 65 | $330.8 |
| Nova Scotia | 290 | $1,337.9 |
| New Brunswick | 277 | $1,230.1 |
| Quebec | 1,772 | $8,192.8 |
| Ontario | 4,658 | $22,423.6 |
| Manitoba | 332 | $1,513.7 |
| Saskatchewan | 232 | $1,190.2 |
| Alberta | 899 | $4,617.8 |
| British Columbia | 1,234 | $6,058.5 |
| Territories | 27 | $155.9 |
| Unknown* | 125 | $326.8 |
| Men | 3,117 | $16,047.8 |
| Women | 6,989 | $32,296.9 |
| 24 years old and under | 170 | $630.3 |
| 25 to 34 years old | 1,066 | $4,938.7 |
| 35 to 44 years old | 1,887 | $8,803.9 |
| 45 to 54 years old | 3,201 | $15,657.8 |
| 55 to 64 years old | 3,206 | $15,549.2 |
| 65 years old and over | 576 | $2,764.8 |
| Canada | 10,106 | $48,344.6 |
- Note: Data may not add up to total due to rounding. Includes claims for which at least $1 of EI family caregiver benefit for adults was paid. Given the short period during which benefits for family caregivers for adults were offered in FY1718, few claims were made. Consequently, the data from FY1819 cannot be compared to the previous year’s data.
- * For some claims, this information was not available in the data.
- Source: Employment and Social Development, Employment Insurance (EI) administrative data. Data are based on a 100% sample of EI administrative data.
During FY1819, the amount paid out in family caregiver benefits for adults totalled $48.3 million. Similar to the number of claims established, women and claimants aged between 45 and 54 years old, and between 55 and 64 years old received a larger share of benefits paid out compared to men and claimants in other age groups, respectively.
The average weekly benefit rate for family caregiver benefits for adults was $451. On average, the highest weekly benefit rate was paid for claims established by men ($490), those living in the Territories ($535) and by claimants aged 35 to 44 years old ($463).
Duration of Employment Insurance family caregiver benefits for adults
Under the family caregiver benefit for adults, claimants are provided with up to 15 weeks of benefits that can be shared among eligible caregivers and split into segments over a claimant’s 52-week benefit period. Given that FY1819 is the first full fiscal year during which benefits for family caregivers were offered, duration for the current fiscal year is not comparable to the previous year, during which the benefit was only available for 4 months.
The average duration of EI family caregiver benefits for adults completed in FY1819 was 10.7 weeks. Men and women received 10.6 and 10.8 weeks of family caregiver benefits for adults on average, respectively. The average number of weeks was higher for claimants 65 years old and over (12.0 weeks) and for claimants 55 to 64 years old (11.1 weeks) (see Annex 2.19.2 ).
2.6.6 Employment Insurance family caregiver benefit for children
The EI family caregiver benefit for childrenFootnote 103 offers temporary income support for a maximum period of 35 weeks to eligible workers and self-employed persons who take leave from work to provide care for or support to a critically ill or injured child. Caregivers can include, in addition to the child’s parents, any qualifying members of the immediate and extended family. Benefits can be shared among caregivers, who may receive them simultaneously or separately, up to the maximum number of weeks of eligibility.
Claimants need to provide Service Canada with a medical certificate signed by the medical doctor or nurse practitioner of the critically ill or injured child.Footnote 104 To be considered critically ill, a child’s life must be at risk as a result of illness or injury, there must have been a significant change in the child’s baseline state of health and the child must require the care or support of his/her parent(s) or other qualifying family members.
Employment Insurance claims for family caregiver benefits for children, amount paid and level of benefits
The number of new claims established for family caregiver benefits for children grew by 11.3% compared to FY1718, to 5,500 claims in FY1819. All regions experienced an increase in their number of claims over the reporting period, except for Newfoundland and Labrador (see Table 53).
| Category | Number of claims FY1718 |
Number of claims FY1819 |
Number of claims change (%) |
Amount paid ($ millions) FY1718 |
Amount paid ($ millions) FY1819 |
Amount paid ($ millions) change (%) |
|---|---|---|---|---|---|---|
| Newfoundland and Labrador | 70r | 55 | -21.4% | $450.2 | $542.9 | +20.6% |
| Prince Edward Island | 18 | 30 | +66.7% | $133.1 | $171.1 | +28.5% |
| Nova Scotia | 92r | 104 | +13.0% | $522.9 | $757.5 | +44.9% |
| New Brunswick | 94r | 101 | +7.4% | $520.0 | $654.7 | +25.9% |
| Quebec | 884r | 1,050 | +18.8% | $5,761.5 | $6,480.2 | +12.5% |
| Ontario | 1,941r | 2,089 | +7.6% | $12,006.6 | $14,828.9 | +23.5% |
| Manitoba | 182r | 208 | +14.3% | $1,090.7 | $1,310.1 | +20.1% |
| Saskatchewan | 195r | 222 | +13.8% | $1,142.3r | $1,707.8 | +49.5% |
| Alberta | 765r | 852 | +11.4% | $4,893.3r | $5,691.4 | +16.3% |
| British Columbia | 628r | 708 | +12.7% | $3,707.1 | $4,360.7 | +17.6% |
| Territories | 12 | 18 | +50.0% | $63.8 | $154.4 | +142.0% |
| Unknown* | 40 | 38 | -5.0% | $113.8 | $96.9 | -14.9% |
| Men | 1,008r | 1,151 | +14.2% | $6,332.8 | $8,090.5 | +27.8% |
| Women | 3,913r | 4,324 | +10.5% | $24,072.4r | $28,666.0 | +19.1% |
| 24 years old and under | 257r | 242 | -5.8% | $1,312.1 | $1,240.3 | -5.5% |
| 25 to 44 years old | 4,282r | 4,684 | +9.4% | $25,978.2 | $30,846.9 | +18.7% |
| 45 to 54 years old | 341r | 478 | +40.2% | $2,796.3 | $4,025.2 | +43.9% |
| 55 years old and over | 41r | 71 | +73.2% | $318.5 | $644.1 | +102.2% |
| Canada | 4,921r | 5,475 | +11.3% | $30,405.2r | $36,756.5 | +20.9% |
- Note: Data may not add up to the total due to rounding. Percentage change is based on unrounded numbers. Includes claims for which at least $1 of EI family caregiver benefit for children was paid.
- * For some claims, this information was not available in the data.
- r Revised data
- Source: Employment and Social Development Canada, Employment Insurance (EI) administrative data. Data are based on a 100% sample of EI administrative data.
More claims for family caregiver benefits for children were established by women (79.0%) rather than men (21.0%). However, men and women both recorded an annual increase in the number of new claims.
By age, claimants aged 25 to 44 years old established the largest share of new claims for family caregiver benefits for children (85.5%), while those aged 24 years old and under and 45 years old and over represented 4.4% and 10.0%, respectively.
The amount paid in family caregiver benefits for children reached $36.8 million during FY1819, representing an increase of 20.9% from the previous fiscal year. As with established claims, women received most of the benefits paid (78.0%), while by age, claimants aged between 25 and 44 received the majority of benefits paid for this benefit type (83.9%).
The average weekly benefit rate paid to family caregivers for children was $464 for FY1819, which represents a growth of 1.6% from the previous fiscal year. On average, the highest weekly benefit rate was paid for claims established by men ($500) and for claimants aged between 25 to 44 years old ($468). By region, the highest average weekly benefit rates were seen in Newfoundland and Labrador ($486) and the Territories ($489).
Duration of Employment Insurance family caregiver benefits for children
Under the family caregiver benefits for children, claimants are provided with up to 35 weeks of benefits that can be shared among eligible caregivers over a claimant’s 52-week benefit period.
Individuals receiving family caregiver benefits for children used, on average, 17.0 weeks of benefits over the reporting period, a slight increase of 0.3 weeks compared to FY1718. On average, women received more weeks of benefits than men, with 18.3 weeks and 14.4 weeks respectively. The average number of weeks used was higher for claimants aged 55 years old or older (20.5 weeks) and for those aged 45 to 54 years old (18.7 weeks) (see Annex 2.20.2).
2.6.7 Employment Insurance special benefits for self-employed persons
Self-employed persons may make a claim for EI special benefits after signing up for the EI program. The special benefits available to self-employed persons are the same as those offered to salaried employees.
To be eligible for EI special benefits for self-employed persons, an individual must:
- register with Service Canada
- pay EI premiums at the same rate as salaried employees for at least 1 year before they may claim benefits
- wait for 12 months from the date of their confirmed registration before claiming EI special benefits
- have earned the minimum number of self-employed earnings during the calendar year preceding the year they apply for benefitsFootnote 105
- have reduced the amount of time devoted to their business by more than 40%, and
- meet the eligibility criteria specific to the special benefits being claimedFootnote 106
During FY1819, there were 2,000 additional self-employed persons who entered into a voluntary agreement with Service Canada, bringing the total number of participating self-employed persons to almost 23,300 participants. This represents a growth of 9.6% compared to FY1718 (see Table 54).
| Number of workers | FY1415 | FY1516 | FY1617 | FY1718 | FY1819 |
|---|---|---|---|---|---|
| Net Enrolments | 1,448 | 1,704 | 1,820 | 1,874 | 2,046 |
| New Participants to the Program (Opted in) |
1,946 | 2,338 | 2,547 | 2,475 | 2,627 |
| Registrants who cancelled or terminated participation (opted out) | -498 | -634 | -727 | -601 | -581 |
| Cumulative total, at the end of the fiscal year | 15,842 | 17,546 | 19,366 | 21,240 | 23,286 |
Source: Employment and Social Development Canada, Service Canada administrative data, 100% sample.
A studyFootnote 107 by Employment and Social Development Canada compared self-employed persons who do not participate in the EI program to participants. The study revealed that, on average, at the time of registration, participants were younger and more often women, reported lower net incomes from self-employment and more declared income from paid employment, which may indicate that they were in transition to self-employment. However, when a claim is established, only 3 out of 10 self-employed persons reported any income from paid employment in the year before their claim. According to the same study, self-employed claimants started receiving benefits, on average, about 1.5 years (82 weeks) after registration.
Self-employed participants to the EI program who also have paid employment earnings have the choice to apply for EI special benefits as self-employed persons or as insured claimants (if they have paid EI premiums through their paid employment). If they claim benefits under the former, their benefits would be calculated on the basis of both self-employment and paid employment income, whereas for the latter, only earnings from paid employment would be taken into account. If they receive benefits under the self-employed scheme, they would have to pay premiums on their self-employment earnings for the rest of their self-employment career.
Example: Self-employed participants with some paid employment income
Before being laid off, Terry worked as an electrician at a large pulp and paper mill in Corner Brook, Newfoundland. Terry decided to start his own company. He earns approximately $32,000 a year from his company, while working on call at the paper mill for about $10,000 a year.
Terry worries about being unable to work for a period of time due to an illness or injury. He decides to opt in to the EI program to be able to access benefits for self-employed in the future.
If Terry suffers an injury and applies and qualifies for sickness benefits as a self-employed person, assuming he paid premiums for at least 1 year before making a claim, he would be eligible to receive about $444 per week in sickness benefits for up to 15 weeks (based on the aggregate of his self-employment and insurable employment income).
Employment Insurance special benefits for self-employed persons, claims, amount paid and level of benefits
A total of 728 special benefit claims were established by self-employed persons in FY1819, representing a decrease of 2.4% from the previous fiscal year. The benefit types most frequently received by self-employed EI claimants were maternity benefits and parental benefits (see Table 55).
| Category | Number of claims FY1718 |
Number of claims FY1819 |
Number of claims change (%) |
Amount paid ($ millions) FY1718 |
Amount paid ($ millions) FY1819 |
Amount paid ($ millions) change (%) |
|---|---|---|---|---|---|---|
| Maternity | 566 | 543 | -4.1% | $2,878.8 | $2,491.7 | -13.4% |
| Parental | 598 | 615 | +2.8% | $6,310.3 | $6,385.9 | +1.2% |
| Other EI special benefits | 167 | 158 | -5.4% | $609.3 | $251.7 | -58.7% |
| Atlantic | 40 | 52 | +30.0% | $685.7 | $827.1 | +20.6% |
| Quebec | 29 | 19 | -34.5% | $73.4 | $5.2 | -92.9% |
| Ontario | 340 | 310 | -8.8% | $4,756.0 | $3,682.3 | -22.6% |
| Prairies | 161 | 179 | +11.2% | $2,300.6 | $2,401.2 | +4.4% |
| British Columbia and the Territories | 176 | 168 | -4.5% | $1,982.7 | $2,213.4 | +11.6% |
| Men | 26 | 37 | +42.3% | $234.2 | $31.4 | -86.6% |
| Women | 720 | 691 | -4.0% | $9,564.2 | $9,097.8 | -4.9% |
| 29 years old and under | 123 | 118 | -4.1% | $1,418.9 | $1,892.7 | +33.4% |
| 30 to 39 years old | 526 | 532 | +1.1% | $7,442.9 | $6,681.9 | -10.2% |
| 40 years old and over | 97 | 78 | -19.6% | $936.6 | $554.6 | -40.8% |
| Canada | 746 | 728 | -2.4% | $9,798.4 | $9,129.2 | -6.8% |
- Note: Data may not add up to the total due to rounding. Percentage change is based on unrounded numbers. Includes all claims to self-employed persons for which at least $1 in EI special benefits was paid. New claims established by benefit type may not sum as claimants can receive multiple benefit types on a single claim.
- Source: Employment and Social Development Canada, Employment Insurance (EI) administrative data. Data on claims are based on a 100% sample of EI administrative data, while data on amounts paid are based on a 10% sample.
Ontario is the region that established the largest number of claims in FY1819, however it did record a decrease, along with Quebec and British Columbia and the Territories. Quebec’s under-representation in terms of new claims established (2.6% of all self-employed benefits) reflects the fact that the province offers maternity, parental, adoption and paternity benefits outside the EI program with mandatory participation of self-employed persons under QPIP (see subsection 2.6.2).
As in the past, women made up the vast majority (94.9%) of new claims established for self-employed persons. By age, claimants between 30 and 39 years old accounted for the largest share of new claims (73.1%) and also saw the only increase in new claims established compared to FY1718. Claimants aged 29 years old and under and 40 years old and over saw decreases in the number of claims established in FY1819.
The total amount paid in EI special benefits to self-employed persons was at $9.1 million for the reporting period, a 6.8% decrease from FY1718. Ontario and Quebec accounted for this decrease, which is due in part to shorter duration of claims and lower average weekly benefit rates in these regions. The Atlantic provinces, the Prairies and British Columbia and the Territories experienced increases in amount paid in FY1819.
As observed with claims, women received the largest share of the total special benefits paid to self-employed persons. However, both men and women experienced decreases in total amount received in benefits.
Persons aged 29 years old and under posted an increase in special benefits paid for self-employed workers, whereas those aged 30 to 39 years old and 40 years old and over experienced a decrease in benefits paid.
The average weekly benefit rateFootnote 108 for special benefits paid to self-employed persons increased by 3.5% to $349 per claim. On average, the highest weekly benefit rate was for claims established in British Columbia and the Territories ($387), by women ($350), and by claimants aged between 30 to 39 years old ($359).
2.7 Employment Insurance financial information
In this section
- 2.7.1 Employment Insurance premium rate
- 2.7.2 Premium Refund Provision
- 2.7.3 Premium Reduction Program
- 2.7.4 Recent trends in revenues and expenditures
The EI program is financed through mandatory premium contributions made by both employers and employees across Canada. These contributions are based on the employees’ insurable earnings up to the annual Maximum Insurable Earnings (MIE).Footnote 109 Since January 2010, self-employed persons that have opted into the EI program are also required to pay EI premiums in order to be eligible for EI special benefits.
EI premiums and all other revenues related to the EI program under the authority of the Employment Insurance Act are first deposited into the Consolidated Revenue Fund (CRF)Footnote 110 and then credited to the EI Operating Account (Account). All EI benefits paid and administrative costs provided for under the Employment Insurance Act are paid out of the CRF and debited from the Account.
The following section provides information on EI premium rates and recent trends in revenues and expenditures recorded for the Account.
2.7.1 Employment Insurance premium rate
After recording successive deficits in the early 2010s, the EI Operating Account returned to cumulative balance in FY1415 (see Chart 35 in subsection 2.7.4). To ensure affordability, predictability and stability of EI premium rates, the Government froze the 2014 rate at the 2013 level of $1.88 for every $100 of insurable earnings, and legislated the 2015 and 2016 rates at that amount. Chart 34 shows the EI premium rates for employees and employersFootnote 111 in Quebec and the rest of Canada in the past 10 years.
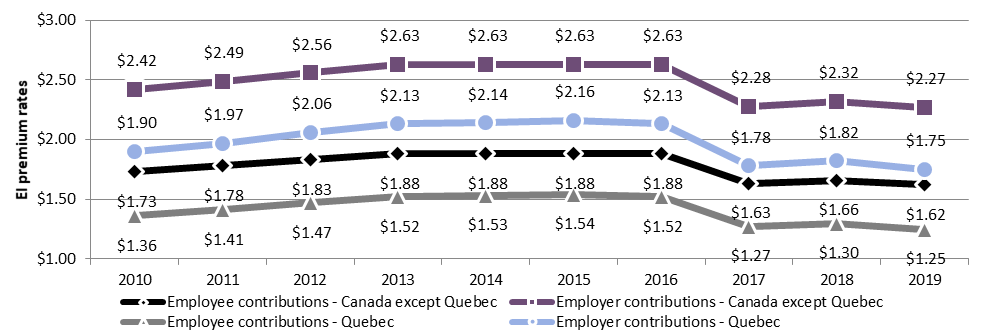
Text description of Chart 34
| Category | 2010 | 2011 | 2012 | 2013 | 2014 | 2015 | 2016 | 2017 | 2018 | 2019 |
|---|---|---|---|---|---|---|---|---|---|---|
| Employee contributions - Canada except Quebec | 1.73 | 1.78 | 1.83 | 1.88 | 1.88 | 1.88 | 1.88 | 1.63 | 1.66 | 1.62 |
| Employer contributions - Canada except Quebec | 2.42 | 2.49 | 2.56 | 2.63 | 2.63 | 2.63 | 2.63 | 2.28 | 2.32 | 2.27 |
| Employee contributions - Quebec | 1.36 | 1.41 | 1.47 | 1.52 | 1.53 | 1.54 | 1.52 | 1.27 | 1.30 | 1.25 |
| Employer contributions - Quebec | 1.90 | 1.97 | 2.06 | 2.13 | 2.14 | 2.16 | 2.13 | 1.78 | 1.82 | 1.75 |
- Source: Government of Canada, Public Accounts of Canada 2019, Volume I: Summary Report and Consolidated Financial Statements (Ottawa: Receiver General for Canada, 2019) and past year versions of the Public Accounts report.
Beginning with the 2017 EI premium rate, the Canada Employment Insurance Commission (CEIC) assumed the responsibility for setting the EI premium rate each year, according to a seven-year break-even mechanism (under which the projected balance for the Account is expected to be $0 in 7 years), as forecasted by the EI Senior Actuary. Premium rates are therefore expected to generate sufficient premium revenue to cover expected EI expenditures over the following 7 years and eliminate any existing surplus or deficit in the Account. Annual changes to the EI premium rate are legislatively limited to increases or decreases of no more than 5 cents each year.Footnote 112
The Senior Actuary’s forecasted EI premiums are calculated based on the forecasted insurable earnings on which premiums are paid. EI premiums are paid for by employers, employees and self-employed persons who have opted into the EI program, for every $100 of insurable earnings up to the annual MIE threshold. In 2019, the MIE was $53,100, increasing by $1,400 (+2.7%) from the previous year’s MIE of $51,700.
In 2019, the EI premium rate for employees (who were not covered by a provincial parental insurance plan) was set by the CEIC at $1.62 per $100 of insurable earnings, down 4 cents from the previous year. As a result, the maximum annual premiums paid by employees was $860 in 2019. Employers, on the other hand, pay EI premiums that are 1.4 times the employee rate (such that employers contribute approximately 58% of the total EI premium revenues versus approximately 42% contributed by the employees). This means that employers paid $2.27 for every $100 of insurable earnings of their employees in 2019, up to a maximum of $1,204. Self-employed persons who opted into the program pay the same EI premium rate as employees, and also pay premiums up to the annual MIE.Footnote 113
The EI program grants a reduction in the EI premium rate paid on insurable earnings to employees who are covered by a provincial parental insurance plan. Quebec is the only province in Canada that administers its own parental insurance plan, known as the Quebec Parental Insurance Plan (QPIP), which provides paid parental, adoption, maternity and paternity benefits to eligible claimants and is financed by contributions made by workers and employers in Quebec. These benefits replace maternity and parental benefits provided by the EI program and, as such, EI premiums in Quebec are lower to reflect the savings that are generated for the EI program as a result of the existence of QPIP. In 2019, the EI premium rate for employees in Quebec was set at $1.25 per $100 of insurable earnings, while for employers it was $1.75 per $100 of insurable earnings of their employees (see Table 56).
| Category | 2016 | 2017 | 2018 | 2019 |
|---|---|---|---|---|
| Employees ─ Premium rates for residents of a province without a provincial parental insurance plan | $1.88 | $1.63 | $1.66 | $1.62 |
| Employers ─ Premium rates for residents of a province without a provincial parental insurance plan | $2.63 | $2.28 | $2.32 | $2.27 |
| Employees ─ Premium rates for residents of a province with a provincial parental insurance plan (Quebec) | $1.52 | $1.27 | $1.30 | $1.25 |
| Employers ─ Premium rates for residents of a province with a provincial parental insurance plan (Quebec) | $2.13 | $1.78 | $1.82 | $1.75 |
| Employees ─ Maximum insurable earnings | $50,800 | $51,300 | $51,700 | $53,100 |
| Employees ─ Annual maximum contribution | $955.04 | $836.19 | $858.22 | $860.22 |
| Employers ─ Annual maximum contribution | $1,137.06 | $1,170,67 | $1,201.51 | $1,204.31 |
- * Per $100 of insurable earnings.
- Source: Government of Canada, Public Accounts of Canada 2019, Volume I: Summary Report and Consolidated Financial Statements (Ottawa: Receiver General for Canada, 2019) and past year versions of the Public Accounts report.
Example: Employment Insurance premium contributions
Emily is an employee working at a call centre in Fredericton, New Brunswick, and earns $35,000 per year.
Based on Emily’s income level and assuming she remained employed throughout the year; her annual contribution to the EI program in 2019 would be $567 at the premium rate of $1.62 for every $100 of insurable earnings. Her employer would contribute $794.50 in EI premiums on her earnings, for a combined total of $1,361.50 in contributions made to the EI Operating Account in 2019.
However, if Emily was working and living in Quebec, her annual EI contribution in 2019 would be reduced to $437.50, and her employer would have contributed $612.50 in EI premiums on her earnings, for a combined total of $1,050 in contributions made to the EI Operating Account. At the premium rate of $0.526 for every $100 of insurable earnings in 2019, Emily’s contribution to the Quebec Parental Insurance Plan (QPIP) would be $184.10, while her employer’s contribution would be $257.60. Note that QPIP premiums are set by the Quebec Parental Insurance Plan’s Conseil de gestion and not by the CEIC.
2.7.2 Premium Refund Provision
Under certain circumstances a share or all of EI premiums paid can be refunded to contributors if certain conditions are met.
The EI program includes a provision that grants EI premium refunds to employees with insurable earnings equal to or less than $2,000 in a given calendar year, as they are unlikely to qualify for EI benefits. In addition to this, some employees may pay EI premiums on earnings that exceed the MIE and the maximum annual contribution in a given tax year, such as those with multiple jobs or those who change jobs during the year. Under these circumstances, affected employees are entitled to receive a refund of all or a portion of their EI premiums paid in the year when filing their tax returns. It is important to note that employers do not receive a corresponding refund.
According to Canada Revenue Agency (CRA) data on T4 slipsFootnote 114 from employers, there were 915,600 individuals in 2017 (the most recent taxation year for which data is available) that were eligible to receive full EI premium refund under the Premium Refund Provision, representing 5.1% of those with insurable earnings. Of these individuals who were eligible to receive full refund paid on EI premiums, 73.3% had filed income taxes and 64.5% received a full premium refund based on CRA T1 tax filer data. A total of $8.9 million in premiums were refunded to the eligible individuals in 2017, while on average each person received a refund amount of $15.10.
2.7.3 Premium Reduction Program
The Premium Reduction Program (PRP) was introduced in 1971 to encourage employers to provide short-term income protection coverage plans to their employees. The PRP recognized employer-based plans that already existed and encouraged employers to continue to offer them as the EI sickness benefits became available.
Under the Employment Insurance Act, employers who provide qualified wage-loss plans, also known as short-term disability plans, to their employees that are at least equivalent to the protection provided by EI sickness benefits may be eligible to receive a reduction in the EI premiums payable through the PRP. The PRP puts less strain on the EI program as employees who are covered by such short-term disability plans may not have to collect EI benefits, or may collect them for a shorter period of time, as benefits from the registered plans have to be paid before EI benefits are paid.
There are 2 types of wage-loss replacement plans for which EI premium reductions may be granted: the cumulative paid sick leave plans and the weekly indemnity programs. These plans must also meet certain requirements established by the CEIC.Footnote 115 The premium reduction reflects the average savings generated to the EI Account due to the existence of these plans, and is provided directly to employers. As EI premiums are paid by both employers and employees in a proportion of 7/12 and 5/12, respectively, employers are required to ensure that their employees benefit from the reduction of the employers’ premium in an amount at least equal to 5/12 of the reduction.
In each calendar year, the rates of premium reduction are established based on 4 categories of qualified plans, with a distinct rate for each category, as explained below:
- Category 1: Cumulative paid sick leave plans that allow for a minimum monthly accumulation of at least 1 day and for a maximum accumulation of at least 75 days
- Category 2: Enhanced cumulative paid sick leave plans that allow for a minimum monthly accumulation of at least 1 day and two-thirds and for a maximum accumulation of at least 125 days
- Category 3: Weekly indemnity plans with a maximum benefit period of at least 15 weeks.
- Category 4: Special weekly indemnity plans with a maximum benefit period of at least 52 weeks (this reduction is available only to public and para-public employers of a province)
Rates of premium reduction are expressed as a percentage of the insurable earnings of employees. In 2019, the rates of reduction were 0.21%, 0.36%, 0.35% and 0.39% of insurable earnings for categories 1 through 4, respectively.Footnote 116 An estimated $922.3 million in premium reductions were generated by the wage-loss plans in 2017 (the most recent taxation year for which data is available), compared to $871.2 million in 2016 and $837.4 million in 2015.Footnote 117
Based on the most recent departmental studyFootnote 118 on the PRP, there were approximately 27,220 employers receiving EI premium reductions through the PRP in 2015. About 7.8 million of workers were employed in those firms receiving a premium reduction in 2015. The departmental study also shows that, during the period of 2000 to 2015, approximately 89.0% of all employers in the program offered a Category 3 plan with weekly indemnity to their employees. Another 7.0% of employers offered Category 1 with cumulative paid sick leave plans, followed by 1.5% offering the combination of 2 or more types of short-term disability plan. The last 2.5% is shared between employers offering Type 2 plans with enhanced paid sick leave or Type 4 plans with special weekly indemnity. These breakdowns have remained stable during the 15 years examined.
2.7.4 Recent trends in revenues and expenditures
As required by Section 64 of the Financial Administration Act, the Receiver General prepares the Public Accounts of Canada annually to report on the financial transactions of the Government for the fiscal year. According to the Public Account of Canada, the total EI revenues were $22.8 billion in FY1819, an increase of 5.4% from the previous year. The EI expenditures decreased (-3.9%) over the same time period, from $21.7 billion in FY1718 to $20.8 billion in FY1819. This generated a net surplus of $2.0 billion at the end of FY1819 (see Table 57). See Annex 5 for a detailed breakdown of the Account.
| Operating Account | FY1314 | FY1415 | FY1516 | FY1617 | FY1718 | FY1819 |
|---|---|---|---|---|---|---|
| Revenues* | $22,226.9 | $23,014.8 | $23,586.1 | $22,603.3 | $21,614.0 | $22,781.6 |
| Expenditures** | $18,997.2 | $19,759.3 | $21,192.9 | $22,518.9 | $21,662.0 | $20,817.4 |
| Employment Insurance benefits (Part I) | 81.7% | 82.2% | 83.2% | 83.5% | 82.4% | 81.0% |
| Employment benefits and support measures (Part II) | 10.5% | 10.4% | 9.7% | 9.7% | 10.0% | 11.1% |
| Benefit repayments | -1.1% | -1.2% | -1.2% | -1.2% | -1.4% | -1.4% |
| Administration costs | 8.8% | 8.4% | 7.8% | 7.9% | 8.7% | 8.8% |
| Bad debts | 0.1% | 0.3% | 0.6% | 0.1% | 0.3% | 0.5% |
| Annual surplus (deficit) | $3,229.7 | $3,255.4 | $2,393.2 | $84.4 | ($48.0) | $1,964.3 |
- Note: Data may not add up to the total due to rounding.
- * Includes all revenues and funding from EI premiums, interest owed on accounts receivable, penalties applied to claimants for violations of terms and conditions of the EI program and additional funding measures introduced for Employment Insurance under federal budgets.
- ** Includes all expenses related to funding and operations of the EI program, including benefit payments under Part I of the EI program, Employment Benefit and Support Measure (EBSM) expenditures under Part II of the EI program, EI benefit repayments, administrative costs and outstanding debts counted as liabilities against the EI Operating Account.
- Source: Government of Canada, Public Accounts of Canada 2019, Volume I: Summary Report and Consolidated Financial Statements (Ottawa: Receiver General for Canada, 2019) and past year versions of the Public Accounts report.
Chart 35 illustrates the financial position of the EI Operating account at the end of fiscal year for the past 10 years. On March 31, 2019, the accumulated surplus in the EI Operating Account was $4.92 billion, an increase of +66.6% from the previous fiscal year. This rise in the accumulated surplus is mainly attributable to the decline (-$989 million) in EI Part I benefits paid and to the increase (+$1.2 billion) in EI premiums collected in FY1819 which can be explained in part by the continuing favorable labour market performance observed during the reference period.
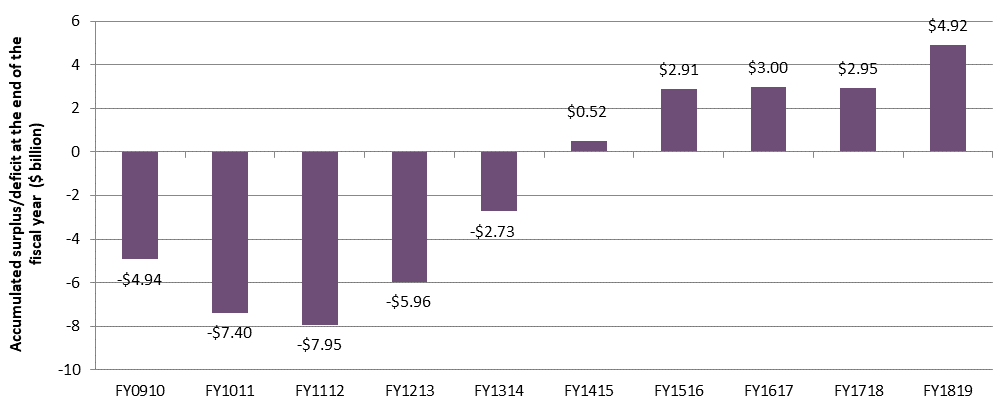
Text description of Chart 35
| Category | FY0910 | FY1011 | FY1112 | FY1213 | FY1314 | FY1415 | FY1516 | FY1617 | FY1718 | FY1819 |
|---|---|---|---|---|---|---|---|---|---|---|
| Accumulated surplus/deficit at the end of the fiscal year ($ billion) | -$4.94 | -$7.40 | -$7.95 | -$5.96 | -$2.73 | $0.52 | $2.91 | $3.00 | $2.95 | $4.92 |
- Source: Government of Canada, Public Accounts of Canada 2019, Volume I: Summary Report and Consolidated Financial Statements (Ottawa: Receiver General for Canada, 2019) and past year versions of the Public Accounts report.