
Chapter 1: Labour market context
Official title: Employment Insurance Monitoring and Assessment Report for the fiscal year beginning April 1, 2021 and ending March 31, 2022: Chapter 1: Labour market context
In chapter 1
List of abbreviations
This is the complete list of abbreviations for the Employment Insurance Monitoring and Assessment Report for the fiscal year beginning April 1, 2021 and ending March 31, 2022.
Abbreviations
- AD
- Appeal Division
- ADR
- Alternative Dispute Resolution
- AI
- Artificial Intelligence
- ASETS
- Aboriginal Skills and Employment Training Strategy
- B
- Beneficiary
- B/C Ratio
- Benefits-to-Contributions ratio
- B/U
- Beneficiary-to-Unemployed (ratio)
- B/UC
- Beneficiary-to-Unemployed Contributor (ratio)
- BDM
- Benefits Delivery Modernization
- CAWS
- Client Access Workstation Services
- CCAJ
- Connecting Canadians with Available Jobs
- CCDA
- Canadian Council of Directors of Apprenticeship
- CCIS
- Corporate Client Information Service
- CEGEP
- College of General and Professional Teaching
- CEIC
- Canada Employment Insurance Commission
- CERB
- Canada Emergency Response Benefit
- CESB
- Canada Emergency Student Benefit
- CEWB
- Canada Emergency Wage Subsidy
- COEP
- Canadian Out of Employment Panel Survey
- COLS
- Community Outreach and Liaison Service
- CPP
- Canada Pension Plan
- CRA
- Canada Revenue Agency
- CRB
- Canada Recovery Benefit
- CRCB
- Canada Recovery Caregiving Benefit
- CRF
- Consolidated Revenue Fund
- CRSB
- Canada Recovery Sickness Benefit
- CSO
- Citizen Service Officer
- CWLB
- Canada Worker Lockdown Benefit
- CX
- Client Experience
- EAS
- Employment Assistance Services
- EBSM
- Employment Benefits and Support Measures
- ECC
- Employer Contact Centre
- EI
- Employment Insurance
- EI-ERB
- Employment Insurance Emergency Response Benefit
- EICS
- Employment Insurance Coverage Survey
- EIPR
- Employment Insurance Premium Ratio
- eROE
- Electronic Record of Employment
- ESDC
- Employment and Social Development Canada
- eSIN
- Electronic Social Insurance Number
- FY
- Fiscal Year
- G7
- Group of Seven
- GDP
- Gross Domestic Product
- GIS
- Guaranteed Income Supplements
- HCCS
- Hosted Contact Centre Solution
- HR
- Human Resources
- ID
- Identification
- IQF
- Individual Quality Feedback
- IS
- Income Security
- ISET
- Indigenous Skills and Employment Training
- IVR
- Interactive Voice Response
- JCP
- Job Creation Partnerships
- LFS
- Labour Force Survey
- LMDA
- Labour Market Development Agreements
- LMI
- Labour Market Information
- LMP
- Labour Market Partnerships
- LWF
- Longitudinal Worker File
- MAR
- Monitoring and Assessment Report
- MBM
- Market Basket Measure
- MIE
- Maximum Insurable Earnings
- MSCA
- My Service Canada Account
- NAICS
- North American Industry Classification System
- NESI
- National Essential Skills Initiative
- NIS
- National Investigative Services
- NOM
- National Operating Model
- NQCP
- National Quality and Coaching Program
- OAG
- Office of the Auditor General of Canada
- OAS
- Old Age Security
- OSC
- Outreach Support Centre
- PAAR
- Payment Accuracy Review
- PEAQ
- Processing Excellence, Accuracy and Quality
- PPE
- Premium-paid eligible individuals
- PRAR
- Processing Accuracy Review
- PRP
- Premium Reduction Program
- PTs
- Provinces and Territories
- QPIP
- Quebec Parental Insurance Plan
- RAIS
- Registered Apprenticeship Information System
- RCMP
- Royal Canadian Mounted Police
- R&I
- Research and Innovation
- ROE
- Record of employment
- ROE Web
- Record of employment on the web
- RPA
- Robotics Process Automation
- SAT
- Secure Automated Transfer
- SCC
- Service Canada Centre
- SD
- Skills Development
- SD-A
- Skills Development – Apprenticeship
- SD-R
- Skills Development – Regular
- SDP
- Service Delivery Partner
- SEPH
- Survey of Employment, Payrolls and Hours
- SIN
- Social Insurance Number
- SIR
- Social Insurance Registry
- SRS
- Simple Random Sampling
- SST
- Social Security Tribunal
- STDP
- Short-term disability plan
- SUB
- Supplemental Unemployment Benefit
- TRF
- Targeting, Referral and Feedback
- TTY
- Teletypewriter
- TWS
- Targeted Wage Subsidies
- U
- Unemployed
- UC
- Unemployed contributor
- UV
- Unemployment-to-vacancy
- VBW
- Variable Best Weeks
- VER
- Variable Entrance Requirement
- VRI
- Video Remote Interpretation
- WCAG
- Web Content Accessibility Guidelines
- WWC
- Working While on Claim
Introduction
This chapter provides an overview of the economic situation and key labour market developments in Canada during the fiscal year (FY) beginning on April 1, 2021 and ending on March 31, 2022 (FY2122).Footnote 1 This is the same period for which this Report assesses the Employment Insurance (EI) program. Section 1.1 provides a general overview and context of the economic situation for FY2122, notably the impact of the subsequent waves of the COVID-19 pandemic, including public health measures and emergency programs that were put in place. Section 1.2 summarizes key labour market developments in the Canadian economy during the reporting period.Footnote 2 Section 1.3 concentrates on the evolution of regional labour market conditions. Definitions and more detailed statistical tables related to key labour market concepts discussed in the chapter can be found in Annex 1.
1.1 Economic overviewFootnote 3
The COVID-19 pandemic and public health measures in Canada
Over FY2122, with increased public immunity (through vaccination and infection) to the COVID-19 disease, governments and businesses in Canada began to ease up on public health restrictions and resume regular economic activities. During this period, the Canadian economy experienced a fast recovery overall with some intermittent fluctuations due to subsequent waves of COVID-19.
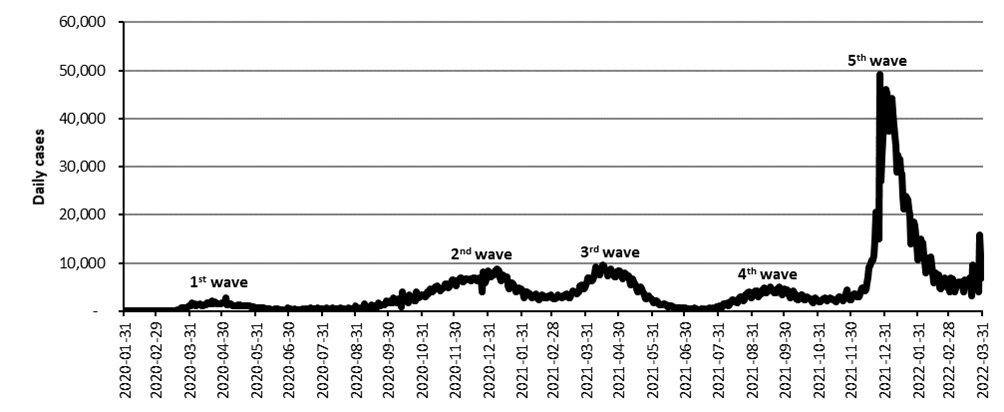
FY2122 started with the peak of the third wave of the COVID-19 pandemic in April 2021 (consult Chart 1), which led to public health measures being tightened again in several provinces. In addition, temporary travel restrictions and the closure of the Canada-United States borderFootnote 4 were extended. At the same time, the national vaccination campaign was underway, and by August 2021, around 67% of eligible people in Canada had received 2 vaccine doses and more than 73% had received at least 1 dose.Footnote 5 This contributed to decisions by many of provincial governments to start to progressively ease public health measures in their jurisdictions, leading to more businesses re-opening.
When the fourth wave of the COVID-19 pandemic began in September 2021, close to 4 out of 5 eligible Canadians had already received 2 vaccine doses. Some public health measures were renewed at this time but their economic impact was milder than during previous waves. The fifth and strongest wave of COVID-19 began in early November 2021 with the emergence of the Omicron variant, leading to unprecedented numbers of COVID-19 infections in Canada. In late November, the Government of Canada adjusted international travel measures and some provinces renewed public health restrictions, including postponing return to school after the winter break, reducing indoor gathering capacity limits, and tightening restrictions on restaurants, bars, entertainment activities. These restrictions were gradually eased in early 2022 with this fifth wave coming under control.
Text description for chart 1
| Date | Daily cases |
|---|---|
| 2020-01-31 | - |
| 2020-02-08 | 3 |
| 2020-02-16 | 1 |
| 2020-02-21 | 1 |
| 2020-02-24 | 1 |
| 2020-02-25 | 1 |
| 2020-02-26 | 1 |
| 2020-02-27 | 1 |
| 2020-02-29 | 2 |
| 2020-03-01 | 9 |
| 2020-03-03 | 9 |
| 2020-03-05 | 12 |
| 2020-03-06 | 6 |
| 2020-03-07 | 6 |
| 2020-03-08 | 5 |
| 2020-03-09 | 15 |
| 2020-03-11 | 26 |
| 2020-03-12 | 38 |
| 2020-03-13 | 38 |
| 2020-03-15 | 54 |
| 2020-03-16 | 88 |
| 2020-03-17 | 99 |
| 2020-03-18 | 157 |
| 2020-03-19 | 276 |
| 2020-03-20 | 131 |
| 2020-03-21 | 367 |
| 2020-03-22 | 100 |
| 2020-03-23 | 620 |
| 2020-03-24 | 701 |
| 2020-03-25 | 617 |
| 2020-03-26 | 634 |
| 2020-03-27 | 646 |
| 2020-03-28 | 736 |
| 2020-03-29 | 833 |
| 2020-03-30 | 1,179 |
| 2020-03-31 | 1,111 |
| 2020-04-01 | 1,065 |
| 2020-04-02 | 1,670 |
| 2020-04-03 | 1,254 |
| 2020-04-04 | 1,367 |
| 2020-04-05 | 1,608 |
| 2020-04-06 | 1,155 |
| 2020-04-07 | 1,230 |
| 2020-04-08 | 1,392 |
| 2020-04-09 | 1,476 |
| 2020-04-10 | 1,383 |
| 2020-04-11 | 1,169 |
| 2020-04-12 | 1,066 |
| 2020-04-13 | 1,297 |
| 2020-04-14 | 1,383 |
| 2020-04-15 | 1,318 |
| 2020-04-16 | 1,711 |
| 2020-04-17 | 1,792 |
| 2020-04-18 | 1,469 |
| 2020-04-19 | 1,432 |
| 2020-04-20 | 2,045 |
| 2020-04-21 | 1,591 |
| 2020-04-22 | 1,769 |
| 2020-04-23 | 1,920 |
| 2020-04-24 | 1,778 |
| 2020-04-25 | 1,466 |
| 2020-04-26 | 1,541 |
| 2020-04-27 | 1,605 |
| 2020-04-28 | 1,526 |
| 2020-04-29 | 1,571 |
| 2020-04-30 | 1,639 |
| 2020-05-01 | 1,825 |
| 2020-05-02 | 1,653 |
| 2020-05-03 | 2,760 |
| 2020-05-04 | 1,298 |
| 2020-05-05 | 1,274 |
| 2020-05-06 | 1,449 |
| 2020-05-07 | 1,426 |
| 2020-05-08 | 1,512 |
| 2020-05-09 | 1,268 |
| 2020-05-10 | 1,146 |
| 2020-05-11 | 1,133 |
| 2020-05-12 | 1,175 |
| 2020-05-13 | 1,121 |
| 2020-05-14 | 1,211 |
| 2020-05-15 | 1,126 |
| 2020-05-16 | 1,251 |
| 2020-05-17 | 1,138 |
| 2020-05-18 | 1,070 |
| 2020-05-19 | 1,040 |
| 2020-05-20 | 1,011 |
| 2020-05-21 | 1,201 |
| 2020-05-22 | 1,156 |
| 2020-05-23 | 1,141 |
| 2020-05-24 | 1,078 |
| 2020-05-25 | 1,012 |
| 2020-05-26 | 936 |
| 2020-05-27 | 872 |
| 2020-05-28 | 993 |
| 2020-05-29 | 906 |
| 2020-05-30 | 772 |
| 2020-05-31 | 757 |
| 2020-06-01 | 758 |
| 2020-06-02 | 705 |
| 2020-06-03 | 675 |
| 2020-06-04 | 641 |
| 2020-06-05 | 609 |
| 2020-06-06 | 722 |
| 2020-06-07 | 642 |
| 2020-06-08 | 545 |
| 2020-06-09 | 409 |
| 2020-06-10 | 472 |
| 2020-06-11 | 405 |
| 2020-06-12 | 413 |
| 2020-06-13 | 467 |
| 2020-06-14 | 377 |
| 2020-06-15 | 360 |
| 2020-06-16 | 320 |
| 2020-06-17 | 386 |
| 2020-06-18 | 367 |
| 2020-06-19 | 409 |
| 2020-06-20 | 390 |
| 2020-06-21 | 318 |
| 2020-06-22 | 300 |
| 2020-06-23 | 326 |
| 2020-06-24 | 279 |
| 2020-06-25 | 380 |
| 2020-06-26 | 172 |
| 2020-06-27 | 238 |
| 2020-06-28 | 218 |
| 2020-06-29 | 668 |
| 2020-06-30 | 286 |
| 2020-07-01 | - |
| 2020-07-02 | 567 |
| 2020-07-03 | 319 |
| 2020-07-04 | 226 |
| 2020-07-05 | 219 |
| 2020-07-06 | 399 |
| 2020-07-07 | 232 |
| 2020-07-08 | 267 |
| 2020-07-09 | 371 |
| 2020-07-10 | 321 |
| 2020-07-11 | 221 |
| 2020-07-12 | 244 |
| 2020-07-13 | 565 |
| 2020-07-14 | 331 |
| 2020-07-15 | 341 |
| 2020-07-16 | 437 |
| 2020-07-17 | 405 |
| 2020-07-18 | 330 |
| 2020-07-19 | 339 |
| 2020-07-20 | 786 |
| 2020-07-21 | 573 |
| 2020-07-22 | 543 |
| 2020-07-23 | 432 |
| 2020-07-24 | 534 |
| 2020-07-25 | 350 |
| 2020-07-26 | 355 |
| 2020-07-27 | 686 |
| 2020-07-28 | 397 |
| 2020-07-29 | 412 |
| 2020-07-30 | 393 |
| 2020-07-31 | 513 |
| 2020-08-01 | 287 |
| 2020-08-02 | 285 |
| 2020-08-03 | 147 |
| 2020-08-04 | 761 |
| 2020-08-05 | 395 |
| 2020-08-06 | 374 |
| 2020-08-07 | 424 |
| 2020-08-08 | 236 |
| 2020-08-09 | 230 |
| 2020-08-10 | 681 |
| 2020-08-11 | 289 |
| 2020-08-12 | 423 |
| 2020-08-13 | 390 |
| 2020-08-14 | 418 |
| 2020-08-15 | 237 |
| 2020-08-16 | 198 |
| 2020-08-17 | 785 |
| 2020-08-18 | 282 |
| 2020-08-19 | 336 |
| 2020-08-20 | 383 |
| 2020-08-21 | 499 |
| 2020-08-22 | 257 |
| 2020-08-23 | 267 |
| 2020-08-24 | 750 |
| 2020-08-25 | 323 |
| 2020-08-26 | 448 |
| 2020-08-27 | 401 |
| 2020-08-28 | 492 |
| 2020-08-29 | 363 |
| 2020-08-30 | 267 |
| 2020-08-31 | 1,008 |
| 2020-09-01 | 477 |
| 2020-09-02 | 498 |
| 2020-09-03 | 570 |
| 2020-09-04 | 631 |
| 2020-09-05 | 371 |
| 2020-09-06 | 400 |
| 2020-09-07 | 247 |
| 2020-09-08 | 1,606 |
| 2020-09-09 | 546 |
| 2020-09-10 | 630 |
| 2020-09-11 | 702 |
| 2020-09-12 | 515 |
| 2020-09-13 | 518 |
| 2020-09-14 | 1,351 |
| 2020-09-15 | 793 |
| 2020-09-16 | 944 |
| 2020-09-17 | 1,120 |
| 2020-09-18 | 1,044 |
| 2020-09-19 | 863 |
| 2020-09-20 | 875 |
| 2020-09-21 | 1,766 |
| 2020-09-22 | 1,248 |
| 2020-09-23 | 1,090 |
| 2020-09-24 | 1,341 |
| 2020-09-25 | 1,362 |
| 2020-09-26 | 1,215 |
| 2020-09-27 | 1,454 |
| 2020-09-28 | 2,176 |
| 2020-09-29 | 1,660 |
| 2020-09-30 | 1,797 |
| 2020-10-01 | 1,777 |
| 2020-10-02 | 2,124 |
| 2020-10-03 | 1,812 |
| 2020-10-04 | 1,685 |
| 2020-10-05 | 2,804 |
| 2020-10-06 | 2,363 |
| 2020-10-07 | 1,800 |
| 2020-10-08 | 2,436 |
| 2020-10-09 | 2,558 |
| 2020-10-10 | 2,062 |
| 2020-10-11 | 1,685 |
| 2020-10-12 | 975 |
| 2020-10-13 | 4,042 |
| 2020-10-14 | 2,506 |
| 2020-10-15 | 2,345 |
| 2020-10-16 | 2,374 |
| 2020-10-17 | 2,215 |
| 2020-10-18 | 1,827 |
| 2020-10-19 | 3,289 |
| 2020-10-20 | 2,251 |
| 2020-10-21 | 2,672 |
| 2020-10-22 | 2,788 |
| 2020-10-23 | 2,584 |
| 2020-10-24 | 2,227 |
| 2020-10-25 | 2,145 |
| 2020-10-26 | 4,109 |
| 2020-10-27 | 2,674 |
| 2020-10-28 | 2,699 |
| 2020-10-29 | 2,956 |
| 2020-10-30 | 3,457 |
| 2020-10-31 | 3,445 |
| 2020-11-01 | 3,244 |
| 2020-11-02 | 3,273 |
| 2020-11-03 | 2,974 |
| 2020-11-04 | 3,283 |
| 2020-11-05 | 3,922 |
| 2020-11-06 | 3,669 |
| 2020-11-07 | 4,246 |
| 2020-11-08 | 4,594 |
| 2020-11-09 | 4,086 |
| 2020-11-10 | 4,302 |
| 2020-11-11 | 4,559 |
| 2020-11-12 | 4,981 |
| 2020-11-13 | 4,741 |
| 2020-11-14 | 5,267 |
| 2020-11-15 | 4,805 |
| 2020-11-16 | 4,802 |
| 2020-11-17 | 4,276 |
| 2020-11-18 | 4,641 |
| 2020-11-19 | 4,642 |
| 2020-11-20 | 4,968 |
| 2020-11-21 | 5,705 |
| 2020-11-22 | 5,418 |
| 2020-11-23 | 5,713 |
| 2020-11-24 | 4,889 |
| 2020-11-25 | 5,022 |
| 2020-11-26 | 5,631 |
| 2020-11-27 | 5,967 |
| 2020-11-28 | 6,496 |
| 2020-11-29 | 6,476 |
| 2020-11-30 | 6,103 |
| 2020-12-01 | 5,329 |
| 2020-12-02 | 6,307 |
| 2020-12-03 | 6,493 |
| 2020-12-04 | 6,300 |
| 2020-12-05 | 6,999 |
| 2020-12-06 | 6,987 |
| 2020-12-07 | 6,499 |
| 2020-12-08 | 5,981 |
| 2020-12-09 | 6,295 |
| 2020-12-10 | 6,739 |
| 2020-12-11 | 6,771 |
| 2020-12-12 | 6,710 |
| 2020-12-13 | 6,580 |
| 2020-12-14 | 6,731 |
| 2020-12-15 | 6,352 |
| 2020-12-16 | 6,416 |
| 2020-12-17 | 7,008 |
| 2020-12-18 | 6,707 |
| 2020-12-19 | 6,895 |
| 2020-12-20 | 6,693 |
| 2020-12-21 | 6,381 |
| 2020-12-22 | 6,196 |
| 2020-12-23 | 6,845 |
| 2020-12-24 | 6,796 |
| 2020-12-25 | 4,092 |
| 2020-12-26 | 8,129 |
| 2020-12-27 | 5,903 |
| 2020-12-28 | 5,790 |
| 2020-12-29 | 6,441 |
| 2020-12-30 | 7,477 |
| 2020-12-31 | 8,446 |
| 2021-01-01 | 7,512 |
| 2021-01-02 | 7,437 |
| 2021-01-03 | 7,137 |
| 2021-01-04 | 7,911 |
| 2021-01-05 | 7,447 |
| 2021-01-06 | 8,372 |
| 2021-01-07 | 8,340 |
| 2021-01-08 | 8,766 |
| 2021-01-09 | 8,665 |
| 2021-01-10 | 8,320 |
| 2021-01-11 | 6,849 |
| 2021-01-12 | 6,287 |
| 2021-01-13 | 6,860 |
| 2021-01-14 | 7,565 |
| 2021-01-15 | 6,809 |
| 2021-01-16 | 7,063 |
| 2021-01-17 | 7,080 |
| 2021-01-18 | 5,225 |
| 2021-01-19 | 4,679 |
| 2021-01-20 | 5,744 |
| 2021-01-21 | 5,955 |
| 2021-01-22 | 5,957 |
| 2021-01-23 | 5,651 |
| 2021-01-24 | 5,323 |
| 2021-01-25 | 4,630 |
| 2021-01-26 | 4,011 |
| 2021-01-27 | 4,204 |
| 2021-01-28 | 4,877 |
| 2021-01-29 | 4,690 |
| 2021-01-30 | 4,663 |
| 2021-01-31 | 4,397 |
| 2021-02-01 | 3,736 |
| 2021-02-02 | 2,828 |
| 2021-02-03 | 3,234 |
| 2021-02-04 | 4,083 |
| 2021-02-05 | 4,022 |
| 2021-02-06 | 3,729 |
| 2021-02-07 | 3,668 |
| 2021-02-08 | 2,967 |
| 2021-02-09 | 2,677 |
| 2021-02-10 | 3,185 |
| 2021-02-11 | 3,181 |
| 2021-02-12 | 3,143 |
| 2021-02-13 | 3,499 |
| 2021-02-14 | 2,862 |
| 2021-02-15 | 2,522 |
| 2021-02-16 | 2,387 |
| 2021-02-17 | 2,605 |
| 2021-02-18 | 3,314 |
| 2021-02-19 | 3,091 |
| 2021-02-20 | 3,219 |
| 2021-02-21 | 2,825 |
| 2021-02-22 | 2,878 |
| 2021-02-23 | 2,790 |
| 2021-02-24 | 2,896 |
| 2021-02-25 | 3,134 |
| 2021-02-26 | 3,219 |
| 2021-02-27 | 3,295 |
| 2021-02-28 | 2,852 |
| 2021-03-01 | 2,596 |
| 2021-03-02 | 2,457 |
| 2021-03-03 | 2,812 |
| 2021-03-04 | 2,832 |
| 2021-03-05 | 3,363 |
| 2021-03-06 | 2,876 |
| 2021-03-07 | 3,025 |
| 2021-03-08 | 3,037 |
| 2021-03-09 | 2,820 |
| 2021-03-10 | 3,223 |
| 2021-03-11 | 3,022 |
| 2021-03-12 | 3,459 |
| 2021-03-13 | 3,539 |
| 2021-03-14 | 3,445 |
| 2021-03-15 | 2,846 |
| 2021-03-16 | 2,819 |
| 2021-03-17 | 3,384 |
| 2021-03-18 | 3,599 |
| 2021-03-19 | 4,214 |
| 2021-03-20 | 4,010 |
| 2021-03-21 | 3,866 |
| 2021-03-22 | 3,775 |
| 2021-03-23 | 3,606 |
| 2021-03-24 | 4,041 |
| 2021-03-25 | 5,200 |
| 2021-03-26 | 5,095 |
| 2021-03-27 | 5,364 |
| 2021-03-28 | 5,126 |
| 2021-03-29 | 4,574 |
| 2021-03-30 | 4,878 |
| 2021-03-31 | 5,513 |
| 2021-04-01 | 5,805 |
| 2021-04-02 | 6,921 |
| 2021-04-03 | 6,822 |
| 2021-04-04 | 6,448 |
| 2021-04-05 | 6,267 |
| 2021-04-06 | 6,520 |
| 2021-04-07 | 7,146 |
| 2021-04-08 | 7,995 |
| 2021-04-09 | 9,243 |
| 2021-04-10 | 8,542 |
| 2021-04-11 | 8,656 |
| 2021-04-12 | 8,539 |
| 2021-04-13 | 7,542 |
| 2021-04-14 | 8,598 |
| 2021-04-15 | 9,570 |
| 2021-04-16 | 9,341 |
| 2021-04-17 | 8,867 |
| 2021-04-18 | 8,524 |
| 2021-04-19 | 8,311 |
| 2021-04-20 | 7,275 |
| 2021-04-21 | 8,419 |
| 2021-04-22 | 8,381 |
| 2021-04-23 | 8,738 |
| 2021-04-24 | 8,305 |
| 2021-04-25 | 7,829 |
| 2021-04-26 | 7,203 |
| 2021-04-27 | 7,069 |
| 2021-04-28 | 7,749 |
| 2021-04-29 | 8,343 |
| 2021-04-30 | 8,340 |
| 2021-05-01 | 8,450 |
| 2021-05-02 | 7,828 |
| 2021-05-03 | 7,565 |
| 2021-05-04 | 6,688 |
| 2021-05-05 | 7,390 |
| 2021-05-06 | 8,001 |
| 2021-05-07 | 7,826 |
| 2021-05-08 | 7,398 |
| 2021-05-09 | 7,297 |
| 2021-05-10 | 6,338 |
| 2021-05-11 | 5,382 |
| 2021-05-12 | 6,212 |
| 2021-05-13 | 6,619 |
| 2021-05-14 | 6,000 |
| 2021-05-15 | 5,710 |
| 2021-05-16 | 5,396 |
| 2021-05-17 | 4,588 |
| 2021-05-18 | 4,034 |
| 2021-05-19 | 4,247 |
| 2021-05-20 | 5,052 |
| 2021-05-21 | 4,682 |
| 2021-05-22 | 4,000 |
| 2021-05-23 | 3,738 |
| 2021-05-24 | 3,151 |
| 2021-05-25 | 2,502 |
| 2021-05-26 | 2,592 |
| 2021-05-27 | 2,965 |
| 2021-05-28 | 3,204 |
| 2021-05-29 | 2,718 |
| 2021-05-30 | 2,473 |
| 2021-05-31 | 2,109 |
| 2021-06-01 | 1,638 |
| 2021-06-02 | 2,062 |
| 2021-06-03 | 2,169 |
| 2021-06-04 | 2,060 |
| 2021-06-05 | 1,887 |
| 2021-06-06 | 1,521 |
| 2021-06-07 | 1,232 |
| 2021-06-08 | 1,268 |
| 2021-06-09 | 1,403 |
| 2021-06-10 | 1,479 |
| 2021-06-11 | 1,425 |
| 2021-06-12 | 1,385 |
| 2021-06-13 | 1,233 |
| 2021-06-14 | 949 |
| 2021-06-15 | 807 |
| 2021-06-16 | 1,048 |
| 2021-06-17 | 1,107 |
| 2021-06-18 | 1,012 |
| 2021-06-19 | 959 |
| 2021-06-20 | 802 |
| 2021-06-21 | 560 |
| 2021-06-22 | 621 |
| 2021-06-23 | 725 |
| 2021-06-24 | 708 |
| 2021-06-25 | 668 |
| 2021-06-26 | 668 |
| 2021-06-27 | 505 |
| 2021-06-28 | 660 |
| 2021-06-29 | 602 |
| 2021-06-30 | 548 |
| 2021-07-01 | 604 |
| 2021-07-02 | 428 |
| 2021-07-03 | 416 |
| 2021-07-04 | 524 |
| 2021-07-05 | 379 |
| 2021-07-06 | 438 |
| 2021-07-07 | 554 |
| 2021-07-08 | 567 |
| 2021-07-09 | 770 |
| 2021-07-10 | 391 |
| 2021-07-11 | 475 |
| 2021-07-12 | 272 |
| 2021-07-13 | 336 |
| 2021-07-14 | 381 |
| 2021-07-15 | 425 |
| 2021-07-16 | 397 |
| 2021-07-17 | 380 |
| 2021-07-18 | 498 |
| 2021-07-19 | 265 |
| 2021-07-20 | 339 |
| 2021-07-21 | 400 |
| 2021-07-22 | 570 |
| 2021-07-23 | 618 |
| 2021-07-24 | 517 |
| 2021-07-25 | 675 |
| 2021-07-26 | 436 |
| 2021-07-27 | 578 |
| 2021-07-28 | 765 |
| 2021-07-29 | 894 |
| 2021-07-30 | 907 |
| 2021-07-31 | 769 |
| 2021-08-01 | 1,086 |
| 2021-08-02 | 701 |
| 2021-08-03 | 737 |
| 2021-08-04 | 958 |
| 2021-08-05 | 1,447 |
| 2021-08-06 | 1,520 |
| 2021-08-07 | 1,367 |
| 2021-08-08 | 1,810 |
| 2021-08-09 | 1,209 |
| 2021-08-10 | 1,346 |
| 2021-08-11 | 1,861 |
| 2021-08-12 | 2,141 |
| 2021-08-13 | 2,416 |
| 2021-08-14 | 2,259 |
| 2021-08-15 | 1,885 |
| 2021-08-16 | 1,979 |
| 2021-08-17 | 1,780 |
| 2021-08-18 | 2,418 |
| 2021-08-19 | 2,732 |
| 2021-08-20 | 2,962 |
| 2021-08-21 | 2,878 |
| 2021-08-22 | 2,843 |
| 2021-08-23 | 2,058 |
| 2021-08-24 | 2,333 |
| 2021-08-25 | 3,326 |
| 2021-08-26 | 3,364 |
| 2021-08-27 | 3,768 |
| 2021-08-28 | 3,918 |
| 2021-08-29 | 3,167 |
| 2021-08-30 | 2,735 |
| 2021-08-31 | 2,909 |
| 2021-09-01 | 3,838 |
| 2021-09-02 | 4,048 |
| 2021-09-03 | 4,161 |
| 2021-09-04 | 4,023 |
| 2021-09-05 | 4,134 |
| 2021-09-06 | 2,958 |
| 2021-09-07 | 3,319 |
| 2021-09-08 | 3,641 |
| 2021-09-09 | 4,178 |
| 2021-09-10 | 4,628 |
| 2021-09-11 | 4,861 |
| 2021-09-12 | 4,225 |
| 2021-09-13 | 3,897 |
| 2021-09-14 | 4,044 |
| 2021-09-15 | 4,283 |
| 2021-09-16 | 4,689 |
| 2021-09-17 | 5,094 |
| 2021-09-18 | 4,536 |
| 2021-09-19 | 4,335 |
| 2021-09-20 | 3,857 |
| 2021-09-21 | 3,818 |
| 2021-09-22 | 3,852 |
| 2021-09-23 | 4,618 |
| 2021-09-24 | 4,605 |
| 2021-09-25 | 4,952 |
| 2021-09-26 | 4,333 |
| 2021-09-27 | 4,279 |
| 2021-09-28 | 3,488 |
| 2021-09-29 | 4,278 |
| 2021-09-30 | 4,588 |
| 2021-10-01 | 4,417 |
| 2021-10-02 | 4,427 |
| 2021-10-03 | 3,634 |
| 2021-10-04 | 3,403 |
| 2021-10-05 | 2,814 |
| 2021-10-06 | 3,716 |
| 2021-10-07 | 4,100 |
| 2021-10-08 | 4,128 |
| 2021-10-09 | 3,701 |
| 2021-10-10 | 3,530 |
| 2021-10-11 | 2,657 |
| 2021-10-12 | 2,323 |
| 2021-10-13 | 2,640 |
| 2021-10-14 | 3,193 |
| 2021-10-15 | 3,438 |
| 2021-10-16 | 3,347 |
| 2021-10-17 | 2,894 |
| 2021-10-18 | 2,272 |
| 2021-10-19 | 2,257 |
| 2021-10-20 | 2,642 |
| 2021-10-21 | 2,894 |
| 2021-10-22 | 2,762 |
| 2021-10-23 | 2,551 |
| 2021-10-24 | 2,280 |
| 2021-10-25 | 1,856 |
| 2021-10-26 | 1,773 |
| 2021-10-27 | 2,496 |
| 2021-10-28 | 2,666 |
| 2021-10-29 | 2,592 |
| 2021-10-30 | 2,375 |
| 2021-10-31 | 2,056 |
| 2021-11-01 | 1,937 |
| 2021-11-02 | 1,853 |
| 2021-11-03 | 2,224 |
| 2021-11-04 | 2,577 |
| 2021-11-05 | 2,533 |
| 2021-11-06 | 2,754 |
| 2021-11-07 | 2,442 |
| 2021-11-08 | 2,138 |
| 2021-11-09 | 2,387 |
| 2021-11-10 | 2,601 |
| 2021-11-11 | 2,716 |
| 2021-11-12 | 2,628 |
| 2021-11-13 | 2,638 |
| 2021-11-14 | 2,310 |
| 2021-11-15 | 2,171 |
| 2021-11-16 | 1,915 |
| 2021-11-17 | 2,422 |
| 2021-11-18 | 2,754 |
| 2021-11-19 | 2,875 |
| 2021-11-20 | 2,895 |
| 2021-11-21 | 2,461 |
| 2021-11-22 | 2,305 |
| 2021-11-23 | 2,235 |
| 2021-11-24 | 2,606 |
| 2021-11-25 | 2,878 |
| 2021-11-26 | 4,357 |
| 2021-11-27 | 3,020 |
| 2021-11-28 | 2,619 |
| 2021-11-29 | 2,332 |
| 2021-11-30 | 2,352 |
| 2021-12-01 | 3,146 |
| 2021-12-02 | 3,222 |
| 2021-12-03 | 3,497 |
| 2021-12-04 | 3,608 |
| 2021-12-05 | 3,401 |
| 2021-12-06 | 2,876 |
| 2021-12-07 | 2,967 |
| 2021-12-08 | 3,530 |
| 2021-12-09 | 4,258 |
| 2021-12-10 | 4,756 |
| 2021-12-11 | 4,929 |
| 2021-12-12 | 4,306 |
| 2021-12-13 | 4,149 |
| 2021-12-14 | 4,388 |
| 2021-12-15 | 5,875 |
| 2021-12-16 | 7,125 |
| 2021-12-17 | 9,173 |
| 2021-12-18 | 9,402 |
| 2021-12-19 | 10,605 |
| 2021-12-20 | 10,673 |
| 2021-12-21 | 11,679 |
| 2021-12-22 | 15,002 |
| 2021-12-23 | 20,693 |
| 2021-12-24 | 15,969 |
| 2021-12-25 | 17,402 |
| 2021-12-26 | 15,024 |
| 2021-12-27 | 49,148 |
| 2021-12-28 | 27,053 |
| 2021-12-29 | 32,120 |
| 2021-12-30 | 40,002 |
| 2021-12-31 | 45,837 |
| 2022-01-01 | 46,118 |
| 2022-01-02 | 45,329 |
| 2022-01-03 | 38,077 |
| 2022-01-04 | 37,408 |
| 2022-01-05 | 39,433 |
| 2022-01-06 | 43,137 |
| 2022-01-07 | 44,331 |
| 2022-01-08 | 41,056 |
| 2022-01-09 | 38,588 |
| 2022-01-10 | 34,174 |
| 2022-01-11 | 28,949 |
| 2022-01-12 | 32,475 |
| 2022-01-13 | 31,357 |
| 2022-01-14 | 31,670 |
| 2022-01-15 | 28,896 |
| 2022-01-16 | 28,538 |
| 2022-01-17 | 23,606 |
| 2022-01-18 | 21,163 |
| 2022-01-19 | 22,297 |
| 2022-01-20 | 23,949 |
| 2022-01-21 | 23,161 |
| 2022-01-22 | 21,301 |
| 2022-01-23 | 19,993 |
| 2022-01-24 | 13,863 |
| 2022-01-25 | 14,165 |
| 2022-01-26 | 18,489 |
| 2022-01-27 | 18,497 |
| 2022-01-28 | 17,695 |
| 2022-01-29 | 15,520 |
| 2022-01-30 | 13,561 |
| 2022-01-31 | 10,721 |
| 2022-02-01 | 11,077 |
| 2022-02-02 | 15,097 |
| 2022-02-03 | 14,215 |
| 2022-02-04 | 14,122 |
| 2022-02-05 | 11,500 |
| 2022-02-06 | 10,311 |
| 2022-02-07 | 7,877 |
| 2022-02-08 | 8,853 |
| 2022-02-09 | 11,139 |
| 2022-02-10 | 10,632 |
| 2022-02-11 | 10,190 |
| 2022-02-12 | 11,205 |
| 2022-02-13 | 7,811 |
| 2022-02-14 | 5,801 |
| 2022-02-15 | 6,034 |
| 2022-02-16 | 8,016 |
| 2022-02-17 | 7,583 |
| 2022-02-18 | 7,023 |
| 2022-02-19 | 7,545 |
| 2022-02-20 | 4,803 |
| 2022-02-21 | 4,729 |
| 2022-02-22 | 5,555 |
| 2022-02-23 | 6,374 |
| 2022-02-24 | 6,927 |
| 2022-02-25 | 6,742 |
| 2022-02-26 | 6,224 |
| 2022-02-27 | 4,795 |
| 2022-02-28 | 5,902 |
| 2022-03-01 | 3,921 |
| 2022-03-02 | 6,907 |
| 2022-03-03 | 5,995 |
| 2022-03-04 | 6,769 |
| 2022-03-05 | 5,436 |
| 2022-03-06 | 4,092 |
| 2022-03-07 | 5,654 |
| 2022-03-08 | 5,925 |
| 2022-03-09 | 6,034 |
| 2022-03-10 | 5,686 |
| 2022-03-11 | 6,169 |
| 2022-03-12 | 5,179 |
| 2022-03-13 | 5,023 |
| 2022-03-14 | 3,939 |
| 2022-03-15 | 6,427 |
| 2022-03-16 | 5,856 |
| 2022-03-17 | 5,631 |
| 2022-03-18 | 5,284 |
| 2022-03-19 | 6,968 |
| 2022-03-20 | 5,413 |
| 2022-03-21 | 3,142 |
| 2022-03-22 | 9,562 |
| 2022-03-23 | 5,207 |
| 2022-03-24 | 5,928 |
| 2022-03-25 | 5,951 |
| 2022-03-26 | 7,930 |
| 2022-03-27 | 7,051 |
| 2022-03-28 | 4,018 |
| 2022-03-29 | 15,847 |
| 2022-03-30 | 6,880 |
| 2022-03-31 | 7,127 |
- Source: Public Health Agency of Canada
Global economic development
On February 24, 2022, Russia launched a full-scale invasion of Ukraine. The impacts have been felt throughout the world’s economy including Canada and many of Canada’s important trading partners.Footnote 6 International supply chains were interrupted and energy and food prices surged, resulting in global inflation rates surging to multi-decade highs in the second half of 2022 (consult Chart 4, for Canada) and causing uncertainty in the economic development of many countries, including Canada.
Canadian economic context in FY2122
During FY2122, the global economy had been recovering strongly from the COVID-19 pandemic, especially in advanced economies. In Canada, real Gross Domestic Product (GDP) increased by 5.7% compared to FY2021.Footnote 7 By the end of FY2122, the real GDP level was 3.2% higher than its pre-pandemic level.
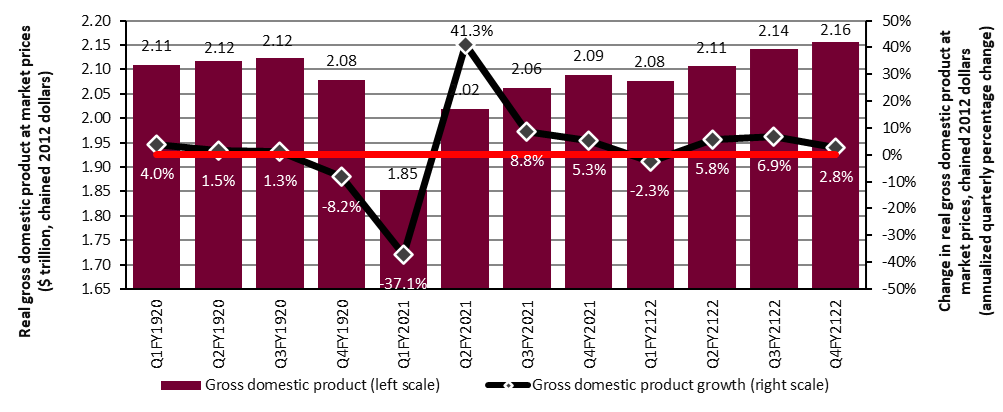
Looking at quarterly movement, the third wave of the COVID-19 pandemic slowed economic growth in the first quarter of FY2122 (-2.3%), but a robust growth resumed in the 2 quarters that followed (+5.8% and +6.9%) (consult Chart 2). While the Canadian economy slowed again in the last quarter of FY2122 (+2.8%) due to the reintroduction of public health measures in response to the Omicron variant and widespread worker absences due to the disease, the economic impact was less severe than during previous waves.
Text description for chart 2
| Quarter | Gross domestic product (left scale) | Gross domestic product growth (right scale) |
|---|---|---|
| Q1FY1920 | $2.11 | 4.0% |
| Q2FY1920 | $2.12 | 1.5% |
| Q3FY1920 | $2.12 | 1.3% |
| Q4FY1920 | $2.08 | -8.2% |
| Q1FY2021 | $1.85 | -37.1% |
| Q2FY2021 | $2.02 | 41.3% |
| Q3FY2021 | $2.06 | 8.8% |
| Q4FY2021 | $2.09 | 5.3% |
| Q1FY2122 | $2.08 | -2.3% |
| Q2FY2122 | $2.11 | 5.8% |
| Q3FY2122 | $2.14 | 6.9% |
| Q4FY2122 | $2.16 | 2.8% |
- Source: Statistics Canada, Table 36-10-0104-01.
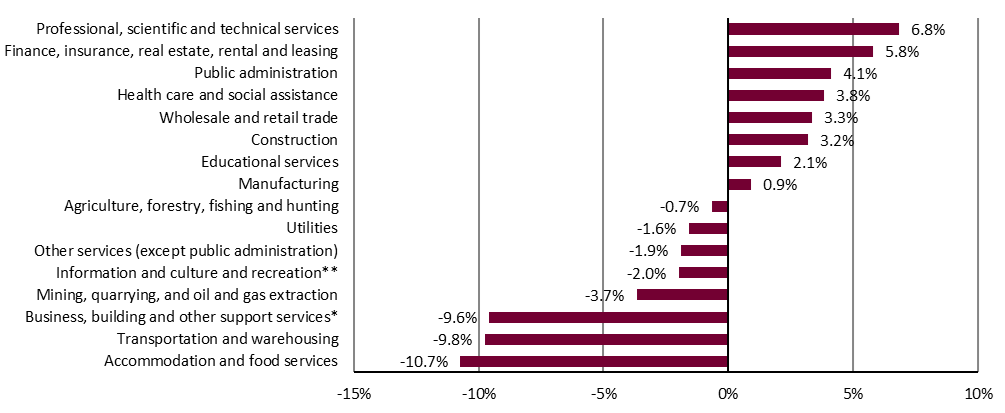
Over FY2122, recovery remained uneven across sectors (consult Chart 3). In March 2022, 8 out of 16 main industries had fully recovered output losses stemming from the first months of the COVID‑19 pandemic. Among these, Professional, scientific and technical services (+6.8%); Finance insurance, real estate, rental and leasing (+5.8%); and Public administration (+4.1%) saw the highest growth relative to February 2020. Among the remaining 8 industries, output was still lagging compared to their pre-pandemic levels. Accommodation and food services, Transportation and warehousing, and Business, building and other support services were the most affected compared to February 2020, with growth of -10.7%, ‑9.8%, and -9.6%. These 3 sectors were affected by the continuous supply chain disruptions,Footnote 8 and changes in work patterns (such as teleworking arrangements).
Text description for chart 3
| Industry | Change in real GDP |
|---|---|
| Professional, scientific and technical services | 6.8% |
| Finance, insurance, real estate, rental and leasing | 5.8% |
| Public administration | 4.1% |
| Health care and social assistance | 3.8% |
| Wholesale and retail trade | 3.3% |
| Construction | 3.2% |
| Educational services | 2.1% |
| Manufacturing | 0.9% |
| Agriculture, forestry, fishing and hunting | -0.7% |
| Utilities | -1.6% |
| Other services (except public administration) | -1.9% |
| Information and culture and recreation** | -2.0% |
| Mining, quarrying, and oil and gas extraction | -3.7% |
| Business, building and other support services* | -9.6% |
| Transportation and warehousing | -9.8% |
| Accommodation and food services | -10.7% |
- * Includes management of companies and enterprises and administrative and support, waste management and remediation services.
- ** Includes information and cultural industries and arts, entertainment and recreation industries.
- Source: Statistics Canada, Table 36-10-0434-01.
Faced with high demand, supply chain disruptions and labour shortages in FY2122, Canadian firms passed the higher costs of production onto consumers. The war in Ukraine also added to inflationary pressure through increased prices for energy and other commodities and pre-existing supply chain disruptions. The inflation rate rose in FY2122, especially in the last two quarters, well above its target level of 2% set by the Bank of Canada. The year-over-year rate of increase of the all-item Consumer Price Index (CPI), or the CPI inflation, rose from 2.2% in March 2021 to 6.7% in March 2022, comparable to the highs experienced in early 1990s (consult Chart 4). Footnote 9 In response to rising inflation and inflation expectations, the Bank of Canada increased interest rates in March 2022 for the first time since the onset of the COVID-19 pandemic, a process that was continued for the remainder of the year 2022.

Text description for chart 4
| Month | 12-month CPI change rate |
|---|---|
| Jan-1996 | 1.6% |
| Feb-1996 | 1.3% |
| Mar-1996 | 1.5% |
| Apr-1996 | 1.4% |
| May-1996 | 1.5% |
| Jun-1996 | 1.5% |
| Jul-1996 | 1.3% |
| Aug-1996 | 1.5% |
| Sep-1996 | 1.5% |
| Oct-1996 | 1.8% |
| Nov-1996 | 1.9% |
| Dec-1996 | 2.2% |
| Jan-1997 | 2.2% |
| Feb-1997 | 2.3% |
| Mar-1997 | 1.9% |
| Apr-1997 | 1.7% |
| May-1997 | 1.5% |
| Jun-1997 | 1.7% |
| Jul-1997 | 1.7% |
| Aug-1997 | 1.8% |
| Sep-1997 | 1.7% |
| Oct-1997 | 1.5% |
| Nov-1997 | 0.9% |
| Dec-1997 | 0.8% |
| Jan-1998 | 1.1% |
| Feb-1998 | 1.0% |
| Mar-1998 | 1.0% |
| Apr-1998 | 0.9% |
| May-1998 | 1.1% |
| Jun-1998 | 1.0% |
| Jul-1998 | 1.0% |
| Aug-1998 | 0.9% |
| Sep-1998 | 0.7% |
| Oct-1998 | 1.1% |
| Nov-1998 | 1.2% |
| Dec-1998 | 1.0% |
| Jan-1999 | 0.7% |
| Feb-1999 | 0.7% |
| Mar-1999 | 1.0% |
| Apr-1999 | 1.6% |
| May-1999 | 1.5% |
| Jun-1999 | 1.6% |
| Jul-1999 | 1.9% |
| Aug-1999 | 2.1% |
| Sep-1999 | 2.6% |
| Oct-1999 | 2.3% |
| Nov-1999 | 2.2% |
| Dec-1999 | 2.6% |
| Jan-2000 | 2.2% |
| Feb-2000 | 2.7% |
| Mar-2000 | 3.0% |
| Apr-2000 | 2.2% |
| May-2000 | 2.4% |
| Jun-2000 | 2.8% |
| Jul-2000 | 2.9% |
| Aug-2000 | 2.6% |
| Sep-2000 | 2.7% |
| Oct-2000 | 2.8% |
| Nov-2000 | 3.2% |
| Dec-2000 | 3.2% |
| Jan-2001 | 3.0% |
| Feb-2001 | 2.9% |
| Mar-2001 | 2.4% |
| Apr-2001 | 3.5% |
| May-2001 | 3.9% |
| Jun-2001 | 3.4% |
| Jul-2001 | 2.7% |
| Aug-2001 | 2.8% |
| Sep-2001 | 2.6% |
| Oct-2001 | 1.9% |
| Nov-2001 | 0.6% |
| Dec-2001 | 0.7% |
| Jan-2002 | 1.3% |
| Feb-2002 | 1.4% |
| Mar-2002 | 1.9% |
| Apr-2002 | 1.7% |
| May-2002 | 1.1% |
| Jun-2002 | 1.2% |
| Jul-2002 | 2.1% |
| Aug-2002 | 2.5% |
| Sep-2002 | 2.3% |
| Oct-2002 | 3.2% |
| Nov-2002 | 4.4% |
| Dec-2002 | 3.8% |
| Jan-2003 | 4.5% |
| Feb-2003 | 4.7% |
| Mar-2003 | 4.2% |
| Apr-2003 | 2.9% |
| May-2003 | 2.8% |
| Jun-2003 | 2.6% |
| Jul-2003 | 2.1% |
| Aug-2003 | 2.0% |
| Sep-2003 | 2.2% |
| Oct-2003 | 1.6% |
| Nov-2003 | 1.6% |
| Dec-2003 | 2.1% |
| Jan-2004 | 1.3% |
| Feb-2004 | 0.7% |
| Mar-2004 | 0.8% |
| Apr-2004 | 1.7% |
| May-2004 | 2.4% |
| Jun-2004 | 2.5% |
| Jul-2004 | 2.3% |
| Aug-2004 | 1.8% |
| Sep-2004 | 1.8% |
| Oct-2004 | 2.3% |
| Nov-2004 | 2.4% |
| Dec-2004 | 2.1% |
| Jan-2005 | 1.9% |
| Feb-2005 | 2.1% |
| Mar-2005 | 2.3% |
| Apr-2005 | 2.4% |
| May-2005 | 1.6% |
| Jun-2005 | 1.7% |
| Jul-2005 | 2.0% |
| Aug-2005 | 2.6% |
| Sep-2005 | 3.2% |
| Oct-2005 | 2.6% |
| Nov-2005 | 2.0% |
| Dec-2005 | 2.1% |
| Jan-2006 | 2.8% |
| Feb-2006 | 2.2% |
| Mar-2006 | 2.2% |
| Apr-2006 | 2.4% |
| May-2006 | 2.8% |
| Jun-2006 | 2.4% |
| Jul-2006 | 2.3% |
| Aug-2006 | 2.1% |
| Sep-2006 | 0.7% |
| Oct-2006 | 1.0% |
| Nov-2006 | 1.4% |
| Dec-2006 | 1.7% |
| Jan-2007 | 1.1% |
| Feb-2007 | 2.0% |
| Mar-2007 | 2.3% |
| Apr-2007 | 2.2% |
| May-2007 | 2.2% |
| Jun-2007 | 2.2% |
| Jul-2007 | 2.2% |
| Aug-2007 | 1.7% |
| Sep-2007 | 2.5% |
| Oct-2007 | 2.4% |
| Nov-2007 | 2.5% |
| Dec-2007 | 2.4% |
| Jan-2008 | 2.2% |
| Feb-2008 | 1.8% |
| Mar-2008 | 1.4% |
| Apr-2008 | 1.7% |
| May-2008 | 2.2% |
| Jun-2008 | 3.1% |
| Jul-2008 | 3.4% |
| Aug-2008 | 3.5% |
| Sep-2008 | 3.4% |
| Oct-2008 | 2.6% |
| Nov-2008 | 2.0% |
| Dec-2008 | 1.2% |
| Jan-2009 | 1.1% |
| Feb-2009 | 1.4% |
| Mar-2009 | 1.2% |
| Apr-2009 | 0.4% |
| May-2009 | 0.1% |
| Jun-2009 | -0.3% |
| Jul-2009 | -0.9% |
| Aug-2009 | -0.8% |
| Sep-2009 | -0.9% |
| Oct-2009 | 0.1% |
| Nov-2009 | 1.0% |
| Dec-2009 | 1.3% |
| Jan-2010 | 1.9% |
| Feb-2010 | 1.6% |
| Mar-2010 | 1.4% |
| Apr-2010 | 1.8% |
| May-2010 | 1.4% |
| Jun-2010 | 1.0% |
| Jul-2010 | 1.8% |
| Aug-2010 | 1.7% |
| Sep-2010 | 1.9% |
| Oct-2010 | 2.4% |
| Nov-2010 | 2.0% |
| Dec-2010 | 2.4% |
| Jan-2011 | 2.3% |
| Feb-2011 | 2.2% |
| Mar-2011 | 3.3% |
| Apr-2011 | 3.3% |
| May-2011 | 3.7% |
| Jun-2011 | 3.1% |
| Jul-2011 | 2.7% |
| Aug-2011 | 3.1% |
| Sep-2011 | 3.2% |
| Oct-2011 | 2.9% |
| Nov-2011 | 2.9% |
| Dec-2011 | 2.3% |
| Jan-2012 | 2.5% |
| Feb-2012 | 2.6% |
| Mar-2012 | 1.9% |
| Apr-2012 | 2.0% |
| May-2012 | 1.2% |
| Jun-2012 | 1.5% |
| Jul-2012 | 1.3% |
| Aug-2012 | 1.2% |
| Sep-2012 | 1.2% |
| Oct-2012 | 1.2% |
| Nov-2012 | 0.8% |
| Dec-2012 | 0.8% |
| Jan-2013 | 0.5% |
| Feb-2013 | 1.2% |
| Mar-2013 | 1.0% |
| Apr-2013 | 0.4% |
| May-2013 | 0.7% |
| Jun-2013 | 1.2% |
| Jul-2013 | 1.3% |
| Aug-2013 | 1.1% |
| Sep-2013 | 1.1% |
| Oct-2013 | 0.7% |
| Nov-2013 | 0.9% |
| Dec-2013 | 1.2% |
| Jan-2014 | 1.5% |
| Feb-2014 | 1.1% |
| Mar-2014 | 1.5% |
| Apr-2014 | 2.0% |
| May-2014 | 2.3% |
| Jun-2014 | 2.4% |
| Jul-2014 | 2.1% |
| Aug-2014 | 2.1% |
| Sep-2014 | 2.0% |
| Oct-2014 | 2.4% |
| Nov-2014 | 2.0% |
| Dec-2014 | 1.5% |
| Jan-2015 | 1.0% |
| Feb-2015 | 1.0% |
| Mar-2015 | 1.2% |
| Apr-2015 | 0.8% |
| May-2015 | 0.9% |
| Jun-2015 | 1.0% |
| Jul-2015 | 1.3% |
| Aug-2015 | 1.3% |
| Sep-2015 | 1.0% |
| Oct-2015 | 1.0% |
| Nov-2015 | 1.4% |
| Dec-2015 | 1.6% |
| Jan-2016 | 2.0% |
| Feb-2016 | 1.4% |
| Mar-2016 | 1.3% |
| Apr-2016 | 1.7% |
| May-2016 | 1.5% |
| Jun-2016 | 1.5% |
| Jul-2016 | 1.3% |
| Aug-2016 | 1.1% |
| Sep-2016 | 1.3% |
| Oct-2016 | 1.5% |
| Nov-2016 | 1.2% |
| Dec-2016 | 1.5% |
| Jan-2017 | 2.1% |
| Feb-2017 | 2.0% |
| Mar-2017 | 1.6% |
| Apr-2017 | 1.6% |
| May-2017 | 1.3% |
| Jun-2017 | 1.0% |
| Jul-2017 | 1.2% |
| Aug-2017 | 1.4% |
| Sep-2017 | 1.6% |
| Oct-2017 | 1.4% |
| Nov-2017 | 2.1% |
| Dec-2017 | 1.9% |
| Jan-2018 | 1.7% |
| Feb-2018 | 2.2% |
| Mar-2018 | 2.3% |
| Apr-2018 | 2.2% |
| May-2018 | 2.2% |
| Jun-2018 | 2.5% |
| Jul-2018 | 3.0% |
| Aug-2018 | 2.8% |
| Sep-2018 | 2.2% |
| Oct-2018 | 2.4% |
| Nov-2018 | 1.7% |
| Dec-2018 | 2.0% |
| Jan-2019 | 1.4% |
| Feb-2019 | 1.5% |
| Mar-2019 | 1.9% |
| Apr-2019 | 2.0% |
| May-2019 | 2.4% |
| Jun-2019 | 2.0% |
| Jul-2019 | 2.0% |
| Aug-2019 | 1.9% |
| Sep-2019 | 1.9% |
| Oct-2019 | 1.9% |
| Nov-2019 | 2.2% |
| Dec-2019 | 2.2% |
| Jan-2020 | 2.4% |
| Feb-2020 | 2.2% |
| Mar-2020 | 0.9% |
| Apr-2020 | -0.2% |
| May-2020 | -0.4% |
| Jun-2020 | 0.7% |
| Jul-2020 | 0.1% |
| Aug-2020 | 0.1% |
| Sep-2020 | 0.5% |
| Oct-2020 | 0.7% |
| Nov-2020 | 1.0% |
| Dec-2020 | 0.7% |
| Jan-2021 | 1.0% |
| Feb-2021 | 1.1% |
| Mar-2021 | 2.2% |
| Apr-2021 | 3.4% |
| May-2021 | 3.6% |
| Jun-2021 | 3.1% |
| Jul-2021 | 3.7% |
| Aug-2021 | 4.1% |
| Sep-2021 | 4.4% |
| Oct-2021 | 4.7% |
| Nov-2021 | 4.7% |
| Dec-2021 | 4.8% |
| Jan-2022 | 5.1% |
| Feb-2022 | 5.7% |
| Mar-2022 | 6.7% |
- Note: The grey band indicates Bank of Canada’s 1-3% control range for the inflation target with inflation measured as the 12-month rate of change in the consumer price index (CPI), Bank of Canada, Monetary Policy Report, July 2022.
- Source: Statistics Canada, Table 18-10-0004-01.
The COVID-19 pandemic has brought a challenging environment for many Canadian businesses. The impact was uneven on firms; it hit harder to small businesses in high-contact service industries. However, with governments’ financial support, many businesses managed cash flow pressures in spite of falls in revenues. Default risks was generally contained. By the end of FY2122, 4 out of 5 businesses reported capacity pressures related to labour or supply chain challenges. This is reflected in job vacancy figures reported in this chapter.Footnote 10,Footnote 11
On the international horizon, among G7 countries—a group consisting of the world’s major industrialized and advanced countries including CanadaFootnote 12—real GDP in Canada grew by 5.7% in FY2122Footnote 13 compared to FY2021. By the end of FY2122, economic output in all G7 countries, except for Japan and Italy, had returned to pre-pandemic levels. Canada continued to enjoy a high standard of living and ranked third among G7 nations in terms of real GDP per capita (using fixed Purchasing Power Parity) with roughly US$45,600 per capita on average over FY2122.Footnote 14
1.2 The Canadian labour market
This section highlights key labour market developments in CanadaFootnote 15 during FY2122, including some labour market elements linked to the EI program. Overall, the Canadian labour market was characterised by strong employment growth, a low national unemployment rate and tighter labour market conditions.Footnote 16,Footnote 17
Labour force growth and the labour force participation rate
In FY2122, the size of the total Canadian labour forceFootnote 18 grew by 2.8% (+556,780, from 20.0 million to 20.6 million) relative to FY2021. Compared to its pre-pandemic level recorded in February 2020, the size of the overall Canadian labour market stood 1.8% higher by March 2022. With population aging, the labour force for youth (15 to 24 years old), constrained by its decreasing size of population, was the only group still slightly below its pre-pandemic level (-0.6%) compared to the labour force for individuals aged 25 to 54 years and those aged 55 years and over (+2.7% and +0.6% respectively).
During the 12-month period of FY2122, the growth in the size of the labour force outpaced that of the working age population, leading to an increase in the overall participation rate. Accounting for the negative impact of the COVID-19 at the onset of the pandemic at the beginning of FY2021, the overall participation rate increased from 64.3% in FY2021 to 65.5% in FY2122. However, the participation rate in March 2022 (65.6%) remained slightly lower than what was observed in February 2020 (65.9%).
Compared to its pre-pandemic levels, the participation rate for individuals aged 25 to 54 years was higher in March 2022 (+1.2 percentage points, or p.p.) while it stood at the same level for youth. However, among population 55 years old and over, as the size of the working age population grew faster than the size of the labour force, the participation rate for this age group was still 1.4 p.p. lower. This could be explained by the share of those aged 65 and older among the age group 55 and over that continues to increase, which lower the overall participation rate for the group.
Employment growth
During the reporting period, total employment continued a gradual upward trend, increasing from 18.0 million in FY2021 to 19.2 million in FY2122 (+6.6%). Part-time employment, which was more impacted by the COVD-19 pandemic, grew stronger than full-time employment (+10.0% versus +5.9%) in FY2122 compared to FY2021. As shown in Chart 5, by September 2021, employment regained its pre-pandemic level recorded in February 2020, and by the end of March 2022, employment was 2.3% higher than its pre-pandemic level (+439,900). By March 2022, both full-time employment and part-time employment had surpassed their pre-pandemic levels recorded in February 2020 (by +2.6% and +1.0% respectively).

Text description for chart 5
| Month | Total employment (in millions) |
|---|---|
| Feb-20 | 19.22340 |
| Mar-20 | 18.07500 |
| Apr-20 | 16.08360 |
| May-20 | 16.39540 |
| Jun-20 | 17.43120 |
| Jul-20 | 17.84760 |
| Aug-20 | 18.07290 |
| Sep-20 | 18.50140 |
| Oct-20 | 18.56610 |
| Nov-20 | 18.60250 |
| Dec-20 | 18.53980 |
| Jan-21 | 18.35300 |
| Feb-21 | 18.62250 |
| Mar-21 | 18.87510 |
| Apr-21 | 18.67810 |
| May-21 | 18.61940 |
| Jun-21 | 18.87290 |
| Jul-21 | 18.98200 |
| Aug-21 | 19.05240 |
| Sep-21 | 19.21860 |
| Oct-21 | 19.25510 |
| Nov-21 | 19.39430 |
| Dec-21 | 19.47320 |
| Jan-22 | 19.28600 |
| Feb-22 | 19.64380 |
| Mar-22 | 19.66330 |
- Source: Statistics Canada, Labour Force Survey, Table 14-10-0287-01.
Employment by class of workerFootnote 19
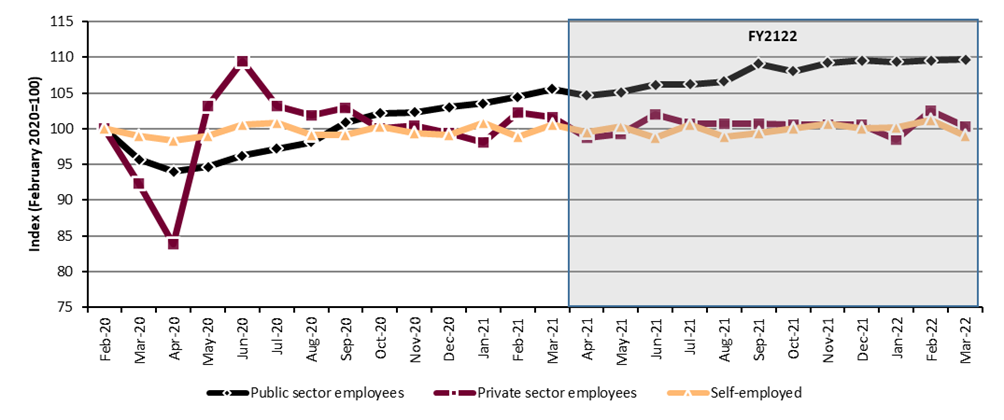
Public health measures imposed at the onset of the COVID-19 pandemic in 2020 led to massive lay-offs in the private sector (consult Chart 6). By the end of March 2022, the size of employment for public and private sectors were above their pre-pandemic levels recorded in February 2020 (+9.7% and +1.9% respectively). However, by the end of FY2122, self-employment was well below its pre-COVID level (‑5.7%). During the decade before the pandemic, self-employment persistently accounted for around 15% of total employment. It stood at 13.8% in FY2122.
Text description for chart 6
| Month | Public sector employees | Private sector employees | Self-employed |
|---|---|---|---|
| Feb-20 | 100 | 100 | 100 |
| Mar-20 | 96 | 93 | 99 |
| Apr-20 | 94 | 78 | 97 |
| May-20 | 94 | 81 | 96 |
| Jun-20 | 95 | 88 | 97 |
| Jul-20 | 96 | 91 | 96 |
| Aug-20 | 97 | 93 | 94 |
| Sep-20 | 101 | 95 | 93 |
| Oct-20 | 101 | 96 | 94 |
| Nov-20 | 101 | 96 | 95 |
| Dec-20 | 102 | 96 | 93 |
| Jan-21 | 102 | 94 | 93 |
| Feb-21 | 103 | 96 | 93 |
| Mar-21 | 104 | 98 | 95 |
| Apr-21 | 104 | 96 | 95 |
| May-21 | 104 | 95 | 95 |
| Jun-21 | 105 | 97 | 93 |
| Jul-21 | 104 | 98 | 92 |
| Aug-21 | 105 | 99 | 92 |
| Sep-21 | 107 | 100 | 92 |
| Oct-21 | 107 | 100 | 91 |
| Nov-21 | 107 | 101 | 92 |
| Dec-21 | 108 | 101 | 92 |
| Jan-22 | 108 | 100 | 92 |
| Feb-22 | 108 | 102 | 91 |
| Mar-22 | 108 | 103 | 93 |
- Source: Statistics Canada, Labour Force Survey, Table 14-10-0288-01.
Employment by industry and firm sizeFootnote 20
During FY2122, employment continued to grow in most industries. 11 out of 16 broad industrial groups saw employment fully recover to pre-pandemic levels recorded in February 2020. However, employment in Agriculture (-16.5%); Accommodation and food services (‑14.7%); Other services (-9.1%); Business, building and other support services (-8.1%); and Transportation and warehousing (-4.3%) was still below pre-pandemic levels (consult Chart 7). Employment in these industrial groups was more affected by public health measures aiming to control the COVID-19 pandemic waves, such as closureFootnote 21 of non-essential businesses, teleworking arrangements, border closures that reduced the number of foreign workers, and supply chain interruptions.

Text description chart 7
| Industry | Change in total employment by industry Feb 2020 to March 2022 |
|---|---|
| Agriculture | -16.5% |
| Accommodation and food services | -14.7% |
| Other services (except public administration) | -9.1% |
| Business, building and other support services | -8.1% |
| Transportation and warehousing | -4.3% |
| Construction | 1.9% |
| Wholesale and retail trade | 2.2% |
| Total employed, all industries | 2.3% |
| Manufacturing | 2.8% |
| Utilities | 3.5% |
| Health care and social assistance | 3.8% |
| Information, culture and recreation | 3.8% |
| Forestry, fishing, mining, quarrying, oil and gas | 6.8% |
| Finance, insurance, real estate, rental and leasing | 8.0% |
| Educational services | 9.8% |
| Public administration | 11.3% |
| Professional, scientific and technical services | 13.2% |
- Source: Statistics Canada, Labour Force Survey, Table 14-10-0355-01.
Compared to FY2021, employment grew in enterprises of all sizes.Footnote 22 The distribution of employment across enterprises of various sizes in FY2122 mostly recovered to its pre-pandemic allocation recorded in FY1920. In FY2122, 19.8% of employment was in small-sized enterprises, 19.1% in small-to-medium sized enterprises, 15.3% in medium-to-large sized enterprises and 45.9% in large-sized enterprises.Footnote 23
Employment by age group
Employment increased among workers of all age groups during FY2122 as the labour market continued its recovery. Employment growth was most pronounced for youth who were hard hit with pandemic job losses (+16.1% compared to +5.4% and +4.8%, respectively, among workers aged 25 to 54 years and workers aged 55 years and over). Focusing on the recovery, with successive waves of closures and reopenings in the industries where youth are generally overrepresented (for example, Accommodation and food services; and Wholesale and retail trade), youth employment had a more volatile recovery path. It dropped in May 2021 (due to the 3rd wave) and January 2022 (due to the 5th wave) (consult Chart 8). In February 2022, it finally surpassed its pre-pandemic level recorded in February 2020. Employment in the 25 to 54 age group recovered faster than for youth and surpassed its pre-pandemic level as early as in September 2021, while employment for the 55 years old and over age group returned to its pre-pandemic levels in March 2022.

Text description chart 8
| Month | 15 to 24 years | 25 to 54 years | 55 years and over |
|---|---|---|---|
| Feb-20 | 100 | 100 | 100 |
| Mar-20 | 83 | 96 | 95 |
| Apr-20 | 65 | 87 | 86 |
| May-20 | 66 | 88 | 88 |
| Jun-20 | 77 | 94 | 91 |
| Jul-20 | 82 | 95 | 93 |
| Aug-20 | 85 | 96 | 94 |
| Sep-20 | 91 | 98 | 95 |
| Oct-20 | 90 | 98 | 96 |
| Nov-20 | 90 | 98 | 97 |
| Dec-20 | 88 | 98 | 97 |
| Jan-21 | 84 | 97 | 97 |
| Feb-21 | 89 | 98 | 98 |
| Mar-21 | 93 | 99 | 100 |
| Apr-21 | 90 | 98 | 98 |
| May-21 | 87 | 98 | 98 |
| Jun-21 | 94 | 99 | 99 |
| Jul-21 | 96 | 99 | 99 |
| Aug-21 | 98 | 99 | 99 |
| Sep-21 | 99 | 101 | 99 |
| Oct-21 | 99 | 101 | 98 |
| Nov-21 | 100 | 102 | 99 |
| Dec-21 | 100 | 102 | 99 |
| Jan-22 | 96 | 102 | 99 |
| Feb-22 | 101 | 103 | 100 |
| Mar-22 | 101 | 103 | 101 |
- Source: Statistics Canada, Labour Force Survey, Table 14-10-0287-01.
Employment by gender
Though women’s employment was impacted more by the COVID-19 pandemic than that of men in FY2021, it recovered more quickly during FY2122. Compared to the previous fiscal year, total employment of women grew by 7.4% in FY2122 compared to 5.9% for men. By the end of FY2122, employment for both genders was higher than their pre-pandemic levels recorded in February 2020 (+2.1% among men and +2.5% among women). Employment of men working part-time was above its pre-pandemic level in March 2022 (+2.7%), whereas employment of women working part-time was closed to (+0.1%) its pre-pandemic level.
Employment rates
Employment growth may be shaped by demographic trends such as growth in the working-age population or by improved labour market conditions. In order to examine net job creation in the Canadian labour market, this section looks at the employment rate indicator, that is the proportion of the working age population 15 years and over who are currently employed.
On yearly basis, in FY2122, the employment rate was up by 3.2 p.p., increasing from 57.8% in FY2021 to 61.0% (consult Table 1). Yet, it was still below its pre-pandemic level recorded in FY1920 (61.9%) and also below its historical peak of 63.4% recorded in FY0708. The employment rate for men increased by 3.0 p.p., slightly below the increase of 3.4 p.p. for women between FY2021 and FY2122. Higher rates were also registered for individuals across all 3 age groups in FY2122 (+8.2 p.p. for youth, +3.8 p.p. for those aged 25 to 54 years and +1.0 p.p. for those aged 55 years and over, respectively) compared to FY2021.
Focusing on the recovery path between time points of February 2020 and March 2022, the employment rate recovered to its pre-pandemic level for women (by +0.2 p.p.). However, it was still slightly below its pre-pandemic level for men (by -0.1 p.p.) By age group, only employment rate for youth and individuals aged 25 to 54 years had fully recovered (+0.9 p.p. and +1.5 p.p. respectively). For those aged 55 years and over the employment rate remained below its pre-pandemic level ( 1.3 p.p.), mostly due to the increasing share of those aged 65 and over among the age group, as they tend to have low employment rate.
| Category | Employment rate FY2021 |
Employment rate FY2122 |
Change in employment rate FY2021 to FY2122 (p.p.) |
Employment rate February 2020 |
Employment rate March 2022 |
Change in employment rate February 2020 to March 2022 (p.p.) |
|---|---|---|---|---|---|---|
| Men | 61.9% | 64.9% | +3.0 | 66.1% | 66.0% | -0.1 |
| Women | 53.8% | 57.2% | +3.4 | 58.2% | 58.4% | +0.2 |
| 15 to 24 years old | 49.0% | 57.2% | +8.2 | 58.7% | 59.6% | +0.9 |
| 25 to 54 years old | 79.5% | 83.3% | +3.8 | 83.3% | 84.7% | +1.5 |
| 55 years old and over | 33.9% | 34.8% | +1.0 | 36.4% | 35.1% | -1.3 |
| Canada | 57.8% | 61.0% | +3.2 | 62.1% | 62.2% | +0.1 |
- Note: Percentage point change is based on unrounded numbers.
- Source: Statistics Canada, Labour Force Survey, Table 14-10-0287-01.
Compared to other G7 countries, Canada registered the largest increase in employment rate between FY2021 and FY2122. With this, Canada ranked first in terms of employment rate in FY2122, up from the fourth place in FY2021.Footnote 24
Unemployment rates
Unemployment rate is one of the core elements that determines eligibility for EI regular benefits. Under EI original rules, a lower unemployment rate in an EI economic region translates into a higher required number of hours of insurable employment within the qualifying period to be eligible for EI regular benefits. The unemployment rate in an EI economic region also plays a role in determining the EI regular benefit entitlement available to a claimant and the number of weeks of earnings (knows as divisor) used in the calculation of their weekly benefit rate. Regional variations of the unemployment rate are discussed in subsection 1.3. Consult section 2.1 in Chapter II to learn how the different EI temporary measures affected the eligibility for, and entitlement to, EI regular benefits.
With the reopening of businesses and tightening labour market conditions, the number of unemployed individuals decreased significantly in FY2122, from 2.0 million in FY2021 to 1.4 million in FY2122, registering a 31.0% decline. Combined with the increase in the size of the Canadian labour force during the same period, the unemployment rate dropped from 10.2% in FY2021 to 6.8% in FY2122 (consult Table 2). The unemployment rate decreased at similar pace for men and women between FY2021 and FY2122 while it decreased at varied paces across age groups. The unemployment rate for youth experienced the largest drop (-9.0 p.p.), followed by that for the 25 to 54 age group (-2.7 p.p.) and the 55 years old and over age group (-1.6 p.p.).
The unemployment rates for youth and individuals aged 25 to 54 years registered lower levels in March 2022 compared to February 2020, with youth seeing the largest decline (-1.4 p.p.). This is mainly because the labour force for youth was still below its pre-pandemic level due to faster drop in the number of unemployed (-13.6%) among youth. However, the unemployment rate for individuals aged 55 years and over was slight above its pre-pandemic level (+0.1 p.p.) The unemployment rate for women was the same as its pre-pandemic level, while that for men was slightly lower (-0.8 p.p.) (consult Table 2).
| Category | Unemployment rate FY2021 |
Unemployment rate FY2122 |
Change in unemployment rate FY2021 to FY2122 (p.p.) |
Unemployment rate February 2020 |
Unemployment rate March 2022 |
Change in unemployment rate February 2020 to March 2022 (p.p.) |
|---|---|---|---|---|---|---|
| Men | 10.3% | 7.0% | -3.3 | 6.0% | 5.2% | -0.8 |
| Women | 10.0% | 6.6% | -3.4 | 5.4% | 5.4% | 0.0 |
| 15 to 24 years old | 21.0% | 11.9% | -9.0 | 10.6% | 9.2% | -1.4 |
| 25 to 54 years old | 8.3% | 5.6% | -2.7 | 4.8% | 4.4% | -0.4 |
| 55 years old and over | 8.7% | 7.1% | -1.6 | 5.3% | 5.3% | +0.1 |
| Canada | 10.2% | 6.8% | -3.3 | 5.7% | 5.3% | -0.5 |
- Note: Percentage point change is based on unrounded numbers.
- Source: Statistics Canada, Labour Force Survey, Table 14-10-0287-01.
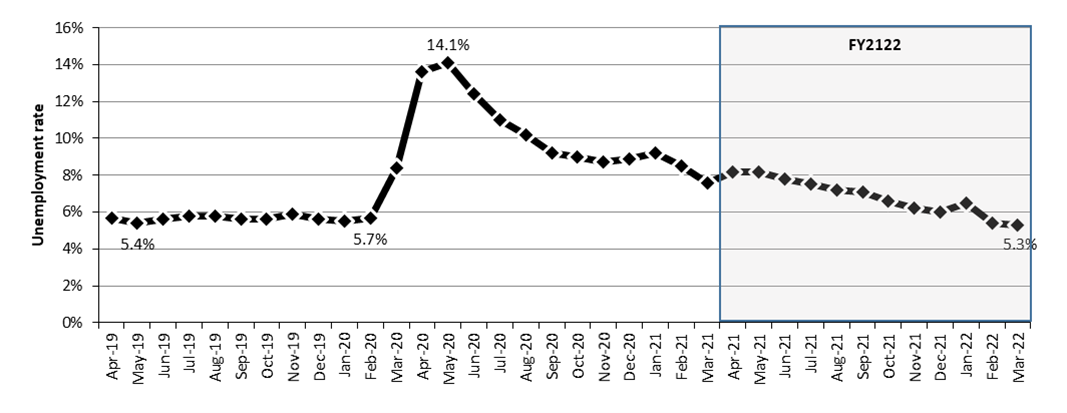
Before the COVID-19 pandemic, the monthly unemployment rate hit a historical low of 5.4% in May 2019 (consult Chart 9). It peaked at 14.1% in May 2020 at the onset of the pandemic and trended down afterwards with small increases associated with subsequent pandemic waves. During FY2122, the unemployment rate rose slightly in January 2022 due to the impact of the fifth wave but resumed its downward trend afterwards. In March 2022, the unemployment rate stood at a new historical low level of 5.3%, indicating tighter conditions in the Canadian labour market. This was not only lower than the pre-pandemic level of 5.7% recorded in February 2020, but it also registered a new historical low of monthly unemployment rate since comparable data became available in January 1976.
Text description chart 9
| Month | Unemployment rate |
|---|---|
| Apr-19 | 5.7% |
| May-19 | 5.4% |
| Jun-19 | 5.6% |
| Jul-19 | 5.8% |
| Aug-19 | 5.8% |
| Sep-19 | 5.6% |
| Oct-19 | 5.6% |
| Nov-19 | 5.9% |
| Dec-19 | 5.6% |
| Jan-20 | 5.5% |
| Feb-20 | 5.7% |
| Mar-20 | 8.4% |
| Apr-20 | 13.6% |
| May-20 | 14.1% |
| Jun-20 | 12.4% |
| Jul-20 | 11.0% |
| Aug-20 | 10.2% |
| Sep-20 | 9.2% |
| Oct-20 | 9.0% |
| Nov-20 | 8.7% |
| Dec-20 | 8.9% |
| Jan-21 | 9.2% |
| Feb-21 | 8.5% |
| Mar-21 | 7.6% |
| Apr-21 | 8.2% |
| May-21 | 8.2% |
| Jun-21 | 7.8% |
| Jul-21 | 7.5% |
| Aug-21 | 7.2% |
| Sep-21 | 7.1% |
| Oct-21 | 6.6% |
| Nov-21 | 6.2% |
| Dec-21 | 6.0% |
| Jan-22 | 6.5% |
| Feb-22 | 5.4% |
| Mar-22 | 5.3% |
- Source: Statistics Canada, Labour Force Survey, Table 14-10-0287-01.
Internationally, Canada posted the second largest decline in unemployment rate among the G7 countries in FY2122 compared to FY2021. Canada recorded the third highest unemployment rates in FY2122 among the G7, just below France and Italy.Footnote 25 Unemployment rate rose sharply in Canada and in the United States at the onset of the pandemic, whereas there were relatively small increases in the remaining G7 countries. As noted by the Organization for Economic Co-Operation and Development (OECD), the heterogeneity of the impact on unemployment across OECD countries reflected fundamental differences in countries’ policy mix to cushion the economic and social effects of the crisis.Footnote 26
Duration of unemploymentFootnote 27
Along with the decrease in the national unemployment rate in FY2122, 2 indicators measuring unemployment duration also exhibited a downward trend over the reporting period: average duration of unemployment and share of long-term unemployment (looking for work for 52 weeks or more). The average duration of unemployment (the number of continuous weeks of unemployment where an individual is looking for work or is on temporary layoff) at the early stage of the pandemic dropped noticeably due to a significant increase in recent unemployed individuals. This was followed by large growth in average duration of unemployment as the pandemic’s impact lingered (consult Chart 10). It was 22.3 weeks in March 2021, peaked at 25.6 weeks in October 2021 and then went down to 19.6 weeks in March 2022 with the gradual re-opening of nonessential businesses. However, this was still above the 16.7-week level recorded in February 2020. On an annual basis, the average duration of unemployment was 22.3 weeks for FY2122, up by 4.9 weeks from 17.4 weeks recorded in FY2021.
Accompanying the evolution of the average duration of unemployment, the proportion of unemployed Canadians who had been continuously searching for a job for a period of at least 52 consecutive weeksFootnote 28 (the share of long-term unemployment) rose dramatically in the second half of FY2021. In FY2122, it peaked in April 2021 at 18.9% of total unemployed (accounting for 313,100 long-term unemployed) and gradually trended down to 11.8% of total unemployed (representing 129,000 long-term unemployed) in March 2022. This share of long-term unemployment was still above its pre-pandemic level of 8.4% observed in February 2020. Among G7 countries, Canada reported the lowest proportion of unemployment lasting for one year or over in 2021.Footnote 29

Text description chart 10
| Month | Average weeks of unemployment spells (left scale) | Share of long-term unemployment (%) (right scale) |
|---|---|---|
| Mar-19 | 17.2 | 9.7 |
| Apr-19 | 16.8 | 8.1 |
| May-19 | 16.3 | 8.0 |
| Jun-19 | 16.2 | 7.1 |
| Jul-19 | 16.8 | 8.1 |
| Aug-19 | 15.8 | 7.4 |
| Sep-19 | 15.5 | 6.7 |
| Oct-19 | 17 | 7.7 |
| Nov-19 | 16.1 | 7.3 |
| Dec-19 | 16.4 | 7.8 |
| Jan-20 | 17.4 | 8.6 |
| Feb-20 | 16.7 | 8.4 |
| Mar-20 | 11.7 | 5.4 |
| Apr-20 | 8.7 | 2.8 |
| May-20 | 11.1 | 3.0 |
| Jun-20 | 13 | 3.7 |
| Jul-20 | 16.1 | 4.4 |
| Aug-20 | 17 | 4.8 |
| Sep-20 | 20.1 | 5.5 |
| Oct-20 | 18.8 | 6.2 |
| Nov-20 | 18.6 | 5.9 |
| Dec-20 | 20.5 | 7.3 |
| Jan-21 | 21 | 8.7 |
| Feb-21 | 21.7 | 10.1 |
| Mar-21 | 22.3 | 16.3 |
| Apr-21 | 21.3 | 18.9 |
| May-21 | 21.9 | 18.1 |
| Jun-21 | 24.4 | 18.6 |
| Jul-21 | 23.1 | 18.0 |
| Aug-21 | 23 | 16.8 |
| Sep-21 | 24.6 | 16.5 |
| Oct-21 | 25.6 | 17.1 |
| Nov-21 | 22 | 13.7 |
| Dec-21 | 21.3 | 13.2 |
| Jan-22 | 20.6 | 12.6 |
| Feb-22 | 19.9 | 11.7 |
| Mar-22 | 19.6 | 11.8 |
- Source: Statistics Canada, Labour Force Survey, Table 14-10-0342-01.
Individuals aged 55 years and over are generally more likely to have longer durations of unemployment. The COVID-19 period was no exception. In February 2020, the share of long-term unemployed was 14.5% among those aged 55 years and over, compared to 8.2% among those aged 25 to 54 years and 4.2% among youth. By the end of FY2122, it increased to 17.8%, 11.6% and 6.7% respectively for the 3 age groups. Similarly, relative to February 2020, in March 2022, the average duration of unemployment reached 26.2 weeks (+3.0 weeks) among workers aged 55 years and over, 20.9 weeks (+4.0 weeks) among those aged 25 to 54 years, and 12.5 weeks (+1.6 week) among youth.
In February 2020, the share of long-term unemployment was similar for men and women (8.9% and 7.8% respectively). By the end of FY2122, it reached 13.3% for men and 10.1% for women. Compared to February 2020, the average duration of unemployment increased by 3.6 weeks for men, reaching 20.9 weeks in March 2022, while it increased by 2.8 weeks for women, reaching 18.4 weeks.
Reasons for unemploymentFootnote 30
In general, workers can become unemployed for a number of reasons, and the cause of unemployment is a key factor in determining if the individual is eligible for EI benefits. EI regular benefits are only available to individuals who have lost their job for reasons outside their control or who left their job with just cause. As labour market conditions improved from the onset of the COVID-19 pandemic, reasons for unemployment continued to change during FY2122.
In the Labour Force Survey, 5 categories of reasons for unemployment are reported: job leavers, permanent layoff, temporary layoff, not worked last year and never worked. Among these, the permanent and temporary layoff are most relevant to the administration of the EI program.
Before May 2021, individuals who became unemployed because they lost their job (due to temporary or permanent layoffs) accounted for the largest share of the unemployed population in Canada. As many individuals lost their jobs at the beginning of the pandemic and remained unemployed through FY2021, unemployed individuals who did not work in the last year dominated the unemployment population starting May 2021 until January 2022 (consult Chart 11).
With public health restrictions easing and gradual re-opening of businesses, the share of temporary layoffs among the unemployed population decreased from 22.2% in FY2021 to 7.1% in FY2122, and the share of permanent layoffs decreased from 41.2% to 32.7% over the same period. The share of job leavers and unemployed individuals who have never worked stood at 12.6% and 11.2% in FY2122, similar to their levels in FY2021.
From an EI perspective, eligibility for regular benefits is largely based on the number of hours of insurable employment that an individual has accumulated in the previous 52 weeks (hours threshold for eligibility varies depending on the EI economic region where worker resides). The COVID-19 pandemic led to a higher proportion of unemployed individuals who did not work in the last year among the unemployed population (increased from 15.6% in FY2021 to 36.5% in FY2122). This, in conjunction with the different EI temporary measures put in place to facilitate access to EI benefits, would likely affect the indicators of access and coverage of the EI program in FY2122.

Text description chart 11
| Month | Job leavers | Permanent layoff | Temporary layoff | Not worked last year | Never worked |
|---|---|---|---|---|---|
| Mar-19 | 20.8% | 40.6% | 5.0% | 23.2% | 10.5% |
| Apr-19 | 20.7% | 40.9% | 4.7% | 22.6% | 11.2% |
| May-19 | 25.4% | 36.0% | 3.5% | 23.2% | 11.9% |
| Jun-19 | 22.2% | 35.5% | 3.6% | 24.7% | 14.0% |
| Jul-19 | 20.2% | 36.5% | 5.4% | 22.0% | 15.9% |
| Aug-19 | 19.2% | 41.4% | 4.2% | 21.2% | 14.0% |
| Sep-19 | 24.6% | 32.4% | 2.9% | 27.1% | 12.9% |
| Oct-19 | 23.7% | 33.0% | 3.8% | 26.2% | 13.3% |
| Nov-19 | 22.3% | 37.1% | 3.9% | 24.4% | 12.4% |
| Dec-19 | 20.2% | 39.7% | 5.6% | 24.4% | 10.1% |
| Jan-20 | 19.1% | 39.8% | 7.1% | 24.0% | 10.0% |
| Feb-20 | 18.0% | 40.9% | 5.5% | 25.6% | 10.0% |
| Mar-20 | 11.7% | 31.2% | 36.1% | 13.9% | 7.1% |
| Apr-20 | 7.1% | 27.8% | 54.1% | 7.3% | 3.6% |
| May-20 | 11.1% | 31.8% | 42.3% | 9.2% | 5.7% |
| Jun-20 | 11.7% | 39.3% | 27.5% | 12.1% | 9.4% |
| Jul-20 | 13.6% | 42.1% | 17.7% | 14.7% | 12.1% |
| Aug-20 | 12.8% | 48.4% | 13.2% | 13.7% | 11.9% |
| Sep-20 | 14.2% | 44.8% | 10.2% | 18.8% | 12.0% |
| Oct-20 | 15.0% | 45.3% | 10.0% | 19.9% | 9.9% |
| Nov-20 | 13.1% | 47.8% | 8.7% | 20.1% | 10.3% |
| Dec-20 | 10.9% | 46.7% | 12.2% | 19.8% | 10.4% |
| Jan-21 | 9.7% | 43.5% | 19.6% | 18.0% | 9.2% |
| Feb-21 | 12.4% | 43.3% | 14.1% | 21.4% | 8.8% |
| Mar-21 | 11.7% | 45.0% | 9.6% | 23.0% | 10.6% |
| Apr-21 | 10.6% | 30.8% | 13.6% | 33.5% | 11.5% |
| May-21 | 10.5% | 28.2% | 12.0% | 38.3% | 11.0% |
| Jun-21 | 11.3% | 28.0% | 7.2% | 41.5% | 12.1% |
| Jul-21 | 10.4% | 33.1% | 5.3% | 37.0% | 14.2% |
| Aug-21 | 11.4% | 36.5% | 4.5% | 37.0% | 10.5% |
| Sep-21 | 12.8% | 31.3% | 3.6% | 41.4% | 10.9% |
| Oct-21 | 14.9% | 29.4% | 3.0% | 42.4% | 10.2% |
| Nov-21 | 15.2% | 33.1% | 2.9% | 39.2% | 9.6% |
| Dec-21 | 12.5% | 35.2% | 3.5% | 38.0% | 10.9% |
| Jan-22 | 13.2% | 36.0% | 14.5% | 27.7% | 8.5% |
| Feb-22 | 15.6% | 35.9% | 5.3% | 31.0% | 12.2% |
| Mar-22 | 15.7% | 37.3% | 4.7% | 30.6% | 11.7% |
- Source: Statistics Canada, Labour Force Survey, Table 14-10-0125-01, seasonally unadjusted.
Hours of workFootnote 31
“Hours of work” is closely related to the administration of the EI program. The number of hours of insurable employment is a key eligibility criterion of the EI program, as claimants must have worked a minimum number of insurable hours in the qualifying period to be eligible for EI benefits. It also determines, along with the regional unemployment rate, the maximum number of weeks of EI regular benefits a claimant is entitled to receive.
The average number of hours usually worked from all jobs by Canadians—hours usually worked in a typical week, not including any overtime—held constant at 36.4 per week in FY2122. It has been flat in recent years and below the FY0809 pre-recession level.
In contrast, the average actual hours worked often reflects temporary decreases or increases in work hours (for example, hours lost due to illness or vacation, or more hours worked due to overtime). At the onset of the COVID-19 pandemic, the average actual hours worked per worker from all jobs (including overtime) fell from 33.1 hours a week in February 2020 to 27.9 hours in April 2020 (consult chart 12). The average then rebounded in the following months and remained close to levels observed before the pandemic. Over the FY2122, the average actual hours worked from all jobs per week steadily followed a regular month-to-month fluctuation. In March 2022, the average actual hours worked from all jobs stood at 32.5 hours a week.

Text description chart 12
| Month | Hours worked |
|---|---|
| Mar-19 | 32.6 |
| Apr-19 | 30.5 |
| May-19 | 34 |
| Jun-19 | 34.6 |
| Jul-19 | 32 |
| Aug-19 | 31.6 |
| Sep-19 | 34.3 |
| Oct-19 | 31 |
| Nov-19 | 32.4 |
| Dec-19 | 33.9 |
| Jan-20 | 33 |
| Feb-20 | 33.1 |
| Mar-20 | 28.8 |
| Apr-20 | 27.9 |
| May-20 | 30.6 |
| Jun-20 | 32.1 |
| Jul-20 | 30.8 |
| Aug-20 | 30.4 |
| Sep-20 | 33.2 |
| Oct-20 | 31.1 |
| Nov-20 | 32 |
| Dec-20 | 33.3 |
| Jan-21 | 32.9 |
| Feb-21 | 31.6 |
| Mar-21 | 33.5 |
| Apr-21 | 33.1 |
| May-21 | 34 |
| Jun-21 | 33.8 |
| Jul-21 | 31.7 |
| Aug-21 | 31.3 |
| Sep-21 | 33.8 |
| Oct-21 | 32 |
| Nov-21 | 32.4 |
| Dec-21 | 33.7 |
| Jan-22 | 32.3 |
| Feb-22 | 33.3 |
| Mar-22 | 32.5 |
- Source: Statistics Canada, Labour Force Survey, Table 14-10-0042-01, seasonally unadjusted.
Job vacanciesFootnote 32 and labour market tightness
Over FY2122, both job vacancies and job vacancy rates reached record levels in Canada. This was potentially influenced by factors such as population aging, declines in immigration inflows during the COVID-19 pandemic, and structural changes of the labour market brought by economic lockdowns.
The number of job vacancies is the number of unoccupied positions for which employers are actively seeking workers. As the economy continued to recover, in the third quarterFootnote 33 of FY2122, the number of job vacancies went up by 63.4% compared to the same quarter of FY2021 (+80.0% compared to the third quarter of FY1920), hitting a historical high of 915,545 vacant positions (consult Chart 13). This increase was larger than the increase in employment. The same situation prevailed in the last quarter of FY2122, with job vacancies being 60.9% higher than a year earlier (+73.6% compared to two years earlier). Over this period, the job vacancy rate (number of job vacancies expressed as a percentage of all occupied and vacant jobs) hit historical high of 5.4% in the second quarter of FY2122. It remained high at 5.3% and 5.2% in the last two quarters of FY2122.

Text description chart 13
| Quarter | Job vacancies, in thousands (left scale) | Job vacancy rate (right scale) |
|---|---|---|
| Q1FY1920 | 581.6 | 3.5% |
| Q2FY1920 | 562.9 | 3.3% |
| Q3FY1920 | 508.6 | 3.0% |
| Q4FY1920 | 512.8 | 3.1% |
| Q1FY2021 | n.a. | n.a. |
| Q2FY2021 | n.a. | n.a. |
| Q3FY2021 | 560.2 | 3.5% |
| Q4FY2021 | 553.5 | 3.6% |
| Q1FY2122 | 731.9 | 4.6% |
| Q2FY2122 | 912.6 | 5.4% |
| Q3FY2122 | 915.5 | 5.3% |
| Q4FY2122 | 890.4 | 5.2% |
- * Statistics Canada temporarily suspended the data collection of the Job Vacancy and Wage Survey during the first and second quarters of FY2021.
- Source: Statistics Canada, Job Vacancy and Wage Survey, Table 14-10-0326-01, seasonally unadjusted.
An increase in the job vacancies has been observed in all industrial groups (consult Table 3). Among them, Management of companies and enterprises (+117.2%), Construction (+107.0%), and Accommodation and food services (+101.8%) had the highest increases, more than doubling in the last quarter of FY2122 compared to the same period two years ago.
| Industry | Fourth quarter of FY1920 | Fourth quarter of FY2021 | Fourth quarter of FY2122 | Change (%) fourth quarter of FY1920 to fourth quarter of FY2122 |
|---|---|---|---|---|
| Agriculture, forestry, fishing and hunting | 12,105 | 11,700 | 13,745 | +13.5% |
| Mining, quarrying, and oil and gas extraction | 4,500 | 5,090 | 8,760 | +94.7% |
| Utilities | 2,080 | 1,560 | 2,850 | +37.0% |
| Construction | 34,830 | 46,370 | 72,090 | +107.0% |
| Manufacturing | 42,075 | 52,205 | 82,705 | +96.6% |
| Wholesale trade | 21,875 | 23,425 | 36,105 | +65.1% |
| Retail trade | 50,380 | 54,795 | 85,740 | +70.2% |
| Transportation and warehousing | 24,840 | 27,170 | 44,130 | +77.7% |
| Information and cultural industries | 12,860 | 11,225 | 17,720 | +37.8% |
| Finance and insurance | 22,820 | 23,760 | 35,450 | +55.3% |
| Real estate and rental and leasing | 7,535 | 6,790 | 11,240 | +49.2% |
| Professional, scientific and technical services | 42,565 | 47,795 | 69,565 | +63.4% |
| Management of companies and enterprises | 2,215 | 2,320 | 4,810 | +117.2% |
| Administrative and support, waste management and remediation services | 38,895 | 36,750 | 57,930 | +48.9% |
| Educational services | 15,380 | 15,760 | 23,505 | +52.8% |
| Health care and social assistance | 71,035 | 98,715 | 135,570 | +90.8% |
| Arts, entertainment and recreation | 11,270 | 6,630 | 15,160 | +34.5% |
| Accommodation and food services | 60,300 | 48,785 | 121,665 | +101.8% |
| Other services (except public administration) | 23,845 | 21,920 | 35,745 | +49.9% |
| Public administration | 11,355 | 10,715 | 15,900 | +40.0% |
| All industries | 512,760 | 553,480 | 890,385 | +73.6% |
- Source: Statistics Canada, Job Vacancy and Wage Survey, Table 14-10-0326-01, seasonally unadjusted.
The job vacancy rate saw the strongest growth in Accommodation and food services industry (+5.5 p.p.), hitting 9.9% in the last quarter of FY2122, the highest among all industries (consult Table 4). Construction (+3.1 p.p.), Manufacturing (+2.6 p.p.), Health care and social assistance (+2.5 p.p.), and Transportation and warehousing (+2.3 p.p.) were among the industries with faster growth in job vacancy rate in the last quarter of FY2122 relative to the same quarter in FY1920.
| Industry | Fourth quarter of FY1920 | Fourth quarter of FY2021 | Fourth quarter of FY2122 | Change (p.p.) fourth quarter of FY1920 to fourth quarter of FY2122 |
|---|---|---|---|---|
| Agriculture, forestry, fishing and hunting | 5.7% | 5.4% | 6.2% | +0.5 |
| Mining, quarrying, and oil and gas extraction | 2.2% | 2.7% | 4.2% | +2.0 |
| Utilities | 1.6% | 1.3% | 2.2% | +0.6 |
| Construction | 3.4% | 4.6% | 6.5% | +3.1 |
| Manufacturing | 2.6% | 3.4% | 5.2% | +2.6 |
| Wholesale trade | 2.6% | 2.9% | 4.1% | +1.7 |
| Retail trade | 2.4% | 2.8% | 4.1% | +1.7 |
| Transportation and warehousing | 3.0% | 3.4% | 5.3% | +2.3 |
| Information and cultural industries | 3.6% | 3.2% | 4.6% | +1.0 |
| Finance and insurance | 2.9% | 3.1% | 4.3% | +1.4 |
| Real estate and rental and leasing | 2.5% | 2.6% | 3.9% | +1.4 |
| Professional, scientific and technical services | 4.1% | 4.6% | 5.9% | +1.8 |
| Management of companies and enterprises | 1.9% | 2.0% | 3.7% | +1.8 |
| Administrative and support, waste management and remediation services | 4.6% | 4.6% | 6.8% | +2.2 |
| Educational services | 1.0% | 1.1% | 1.6% | +0.6 |
| Health care and social assistance | 3.3% | 4.5% | 5.8% | +2.5 |
| Arts, entertainment and recreation | 3.8% | 3.7% | 6.0% | +2.2 |
| Accommodation and food services | 4.4% | 5.3% | 9.9% | +5.5 |
| Other services (except public administration) | 4.2% | 4.4% | 6.4% | +2.2 |
| Public administration | 2.2% | 2.2% | 3.0% | +0.8 |
| All industries | 3.1% | 3.6% | 5.2% | +2.1 |
- Source: Statistics Canada, Job Vacancy and Wage Survey, Table 14-10-0326-01, seasonally unadjusted.
Job vacancies usually become more difficult to fill when the available labour force, primarily unemployed individuals, declines relative to the number of vacant positions. The labour market is tightening in this case. On the other hand, job vacancies should become easier to fill when the number of unemployed individuals increases relative to the number of vacant positions. In this case, the labour market is loosening. An indicator of labour market tightness is the Unemployment-to-Vacancy (UV) ratio. It measures the potential number of available unemployed people for every vacant position, providing a measure of labour market tightness. A lower UV ratio corresponds to a lower number of unemployed people relative to the total job vacancies, which indicates a tighter labour market. As fewer unemployed persons are available to fill the vacant positions, it could result in longer vacancy durations. A higher UV ratio corresponds to a higher number of unemployed people relative to the total job vacancies, which indicates a looser labour market. A comparison of the UV ratio at two points of time indicates how the labour market condition evolves over this period. Tightening condition is associated with a decrease in UV ratio and loosening condition is associated with an increase in UV ratio.
Public health measures put in place to contain the COVID-19 virus in FY2021 led to a loosening of the labour market during this period. The UV ratio increased by 0.7 points (to 3.5 in the fourth quarter of FY1920) at the beginning of the pandemic (consult Chart 14). It continued to climb in FY2021 and started to trend down in FY2122. By the fourth quarter of FY2122, it reached 2.0, lower than the pre-pandemic level indicating tightening labour market conditions.

Text description chart 14
| Quarter | Unemployment-to-vacancy ratio |
|---|---|
| Q1FY1920 | 2.7 |
| Q2FY1920 | 2.9 |
| Q3FY1920 | 2.8 |
| Q4FY1920 | 3.5 |
| Q1FY2021 | n.a. |
| Q2FY2021 | n.a. |
| Q3FY2021 | 3.8 |
| Q4FY2021 | 4.2 |
| Q1FY2122 | 3.4 |
| Q2FY2122 | 2.5 |
| Q3FY2122 | 1.9 |
| Q4FY2122 | 2.0 |
- * Statistics Canada temporarily suspended the data collection of the Job Vacancy and Wage Survey during the first and second quarters of FY2021.
- Sources: Statistics Canada, Job Vacancy and Wage Survey, Table 14-10-0326-01, seasonally unadjusted (for job vacancies) and Labour Force Survey, Table 14-10-0022-01 (for unemployment).
Over the same period, which is from the last quarter of FY1920 to the last quarter of FY2122, the UV ratio decreased in all industries due to lower unemployment and higher job vacancies (consult Chart 15).

Descriptive text chart 15
| Industry | Q4FY2122 | Q4FY1920 |
|---|---|---|
| All industries | 1.4 | 2.6 |
| Public Administration | 1.6 | 2.4 |
| Other services (except public administration) | 0.7 | 1.6 |
| Accommodation and food services | 0.7 | 2.0 |
| Information, culture and recreation** | 1.7 | 2.5 |
| Health care and social assistance | 0.4 | 0.8 |
| Education | 1.5 | 3.1 |
| Business, building and other support services* | 0.8 | 1.2 |
| Professional, scientific and technical services | 0.4 | 1.1 |
| Finance insurance, real estate, rental and leasing | 0.4 | 0.7 |
| Transportation and warehousing | 0.8 | 1.6 |
| Wholesale and retail trades | 0.8 | 1.9 |
| Manufacturing | 0.8 | 2.2 |
| Construction | 1.5 | 3.9 |
| Utilities | 0.9 | 1.4 |
| Mining, quarrying, and oil and gas extraction | 1.0 | 3.4 |
| Agriculture, forestry, fishing and hunting | 2.1 | 2.7 |
- Sources: Statistics Canada, Job Vacancy and Wage Survey, Table 14-10-0326-01, seasonally unadjusted (for job vacancies) and Labour Force Survey, Table 14-10-0022-01 (for unemployment).
Nominal offered wage associated with vacant positions under tightened labour market conditions
Tighter labour market conditions may lead to increases in hourly offered wages associated with vacant positions. Compared to the fourth quarter of FY1920, average nominal offered wage increased from $22.60 to $24.20 in the fourth quarter of FY2122, representing a growth of 7.1% over the 2-year period. This growth was slightly slower than the growth in CPI between March 2020 and March 2022 (+9.0%).* The increase of average nominal offered wages associated with vacant positions varied across industries. For example, it stood at +21.7% in Information and cultural industries. Whereas in the Education industry and Transportation and warehousing industry, offered wage grew at +1.9% and +3.0% respectively, indicating varied labour market tightness across industries.**
- *Statistics Canada, Job Vacancy and Wage Survey, Table 14-10-0326-01, seasonally unadjusted, quarterly based (for offered wages). Statistics Canada, Consumer Price Index Measures, Table 18-10-0004-01, monthly based (for CPI).
- **Statistics Canada, Job Vacancy and Wage Survey, Table 14-10-0326-01 (for offered hourly wage by industry) and Consumer Price Index Measures, Table 18-10-0004-01 (for CPI).
WagesFootnote 34
Employment earnings are another important element for the administration of the EI program. They determine the EI premiums paid by employers and employees, as well as the level of benefits that claimants can receive. Employment earnings can be a combination of hourly wages and hours worked, a fixed amount paid for a specific time period (a week, for example) or in the form of commissions, tips or bonuses. Average hourly wages and average weekly earnings are therefore examined.
Wage growth dynamics are linked to a variety of factors, notably labour productivity, labour market tightness, inflation expectations, demographic shifts, structural changes and minimum wage increases.
Average nominal hourly wages increased from $30.39 in FY2021 to $30.89 in FY2122, representing a +1.6% year-over-year change.Footnote 35 This increase was lower than the 6.2% increase observed between FY1920 and FY2021 (from $28.60 to $30.39) when employment in low-wage jobs was hit hard by the COVID-19 pandemic and decreased significantly (-20.5%). This shift was not present in FY2122.
Even without the impact of the COVID-19 pandemic, some evidence showed that average hourly wage was still trending upwards. A fixed-weighted average wage using LFS data produced by Statistics Canada maintains employment composition by occupation and tenure at the 2019 average. This indicator paints a picture of wage trends that are less influenced by structural shifts.Footnote 36 At the onset of the pandemic, it shows that there was a large discrepancy between the year-over-year change in average wages calculated with the actual wage measure and the fixed-weighted wage measure. This was due to the sudden reduction in the number of lower-wage jobs. In the following months, the difference between the actual and the fixed-weighted average wage narrowed. Up to November 2021, when the latest public data on the fixed-weighted average wage was released, the fixed-weighted nominal average hourly wage picked up an upward trend. This was probably partly led by the tightening labour market conditions during that period.
Based on the actual wage measure, though average nominal hourly wages gradually trended up, increases in CPI have been faster than the increase in average nominal hourly wages. During FY2122, the year-over-year growth rate of CPI ranged between +4.2% and +9.3%, faster than the year-over-year growth rate observed in average nominal hourly wage (ranged between -1.5% to +3.3%) (consult Chart 16). This indicates that wage gains workers had been seeing in the strong pre-pandemic labour market conditions have been partially eroded by inflation.

Text description chart 16
| Month | Year-over-year change in average hourly wage | Year-over-year change in consumer price index (CPI) |
|---|---|---|
| Mar-19 | 2.1 | 2.5 |
| Apr-19 | 2.2 | 2.7 |
| May-19 | 2.3 | 3.2 |
| Jun-19 | 3.1 | 2.7 |
| Jul-19 | 3.2 | 2.7 |
| Aug-19 | 3.1 | 2.6 |
| Sep-19 | 3.3 | 2.5 |
| Oct-19 | 3.1 | 2.5 |
| Nov-19 | 2.9 | 2.9 |
| Dec-19 | 2.6 | 3.0 |
| Jan-20 | 2.8 | 3.2 |
| Feb-20 | 3.3 | 2.9 |
| Mar-20 | 6.2 | 1.2 |
| Apr-20 | 10.5 | -0.3 |
| May-20 | 10.1 | -0.5 |
| Jun-20 | 7.2 | 0.9 |
| Jul-20 | 6.5 | 0.2 |
| Aug-20 | 6.3 | 0.2 |
| Sep-20 | 5.0 | 0.7 |
| Oct-20 | 5.6 | 0.9 |
| Nov-20 | 5.1 | 1.3 |
| Dec-20 | 5.4 | 1.0 |
| Jan-21 | 6.3 | 1.4 |
| Feb-21 | 5.3 | 1.5 |
| Mar-21 | 1.9 | 3.0 |
| Apr-21 | -1.3 | 4.6 |
| May-21 | -1.5 | 4.9 |
| Jun-21 | - | 4.2 |
| Jul-21 | 1.2 | 5.1 |
| Aug-21 | 1.9 | 5.6 |
| Sep-21 | 2.7 | 6.0 |
| Oct-21 | 2.0 | 6.4 |
| Nov-21 | 2.7 | 6.5 |
| Dec-21 | 3.3 | 6.6 |
| Jan-22 | 2.7 | 7.1 |
| Feb-22 | 2.7 | 7.9 |
| Mar-22 | 3.2 | 9.3 |
- Sources: Statistics Canada, Consumer Price Index Measures, Table 18-10-0004-01 (for CPI) and Labour Force Survey, Table 14-10-0063-01 (for hourly wage).
Average nominal weekly earnings are influenced not only by the average nominal hourly wage, but also by the number of actual hours worked per week. As mentioned previously, average actual hours worked per week remained relatively stable over the reference period. As a result, average nominal weekly earnings followed the same patterns observed in the average nominal hourly wages. They trended up by 1.8% from $1,118 in FY2021 to $1,139 in FY2122, equivalent to $20 increase weekly.Footnote 37 In real terms, the average weekly earnings declined relative to the increase in the CPI.
Employer responses to labour shortages
According to results from the Bank of Canada’s Business Outlook Survey in March 2022*, 2 fifths of firms reported recruitment difficulties due to labour shortages, significantly higher than pre-pandemic levels in 2019 and 2018. More than 2 thirds (68%) of firms surveyed reported more intense shortages than a year ago. About 63% of businesses reported hiring intentions in the last quarter of FY2122. Several firms, especially those in industries facing tighter labour market conditions, expected that a tighter labour market might limit their ability to hire over the next year.
Faced with the labour demand pressure and supply chain challenges, many firms reported that they are expecting to increase investment in technology and machinery/equipment and automation in order to alleviate labour-related constraints, physical capacity bottlenecks and transportation and logistics challenges. Affected by higher prices for energy and other commodities, supply chain disruptions, and persistent labour shortages, many firms that were surveyed expect growth in wages, input prices and output prices.
A Statistics Canada’s study** investigated the strategies that businesses in the private sector plan to use in 2022 to deal with labour shortages by using data from the first quarter of the 2022 Canadian Survey on Business Conditions.
The study found that among all the businesses or organizations considered, more than one third (38%) expected labour shortages to be an obstacle over the next 3 months. The most obvious strategy these businesses plan to implement is to increase the wages and benefits for new and existing employees. In fact, 45.9% indicate that they plan to increase wage offered to new employees and 64.4% indicate that they plan to increase the wage offered to existing employees over the 12 months. In general, employers, even those do not expect labour shortage to be an obstacle over the next 3 months, expect the average wage to grow by 3.6% in 2022 as demand pressure for labour increases. Among the businesses that do expect labour shortages to be an obstacle, the anticipated growth rate for the average wages mounted to 6.1% in 2022. The expected growth rate for average wage is higher in industries that face tighter labour market conditions, such as Professional, scientific and technical services and Accommodation and food services.
Some businesses also plan to offer flexible work arrangements, such as working remotely or flexible scheduling. In addition, some businesses plan to combat labour shortage issues by providing more support for training.
- * Bank of Canada, “Business Outlook Survey – First Quarter of 2022”, Ottawa: Bank of Canada, 2022.
- ** Statistics Canada, “Employer responses to labour shortages”, Ottawa: Statistics Canada, Social Analysis and Modelling Division, Analytical Studies and Modelling Branch, July 2022.
1.3 Canada’s regional labour market
General labour market developments at the national level may not be consistently observed across regions. This subsection examines labour market developments in Canada at the provincial and territorial level.Footnote 38
Labour force and participation rate
In FY2122, each province and territory experienced an increase in its respective labour force compared to FY2021. Over the 2 fiscal periods, Prince Edward Island posted the highest growth in the size of its labour force (+5.3%), followed by Ontario (+3.7%), Nova Scotia (+3.4%) and Newfoundland and Labrador (+2.7%) (consult Table 5). By March 2022, all the provinces and territories, except Saskatchewan, had resumed their pre-pandemic labour force sizes recorded in February 2020.
In FY2122, participation rates in all provinces and territories were higher than those observed in FY2021. Prince Edward Island, Ontario, Manitoba, Saskatchewan and Alberta were at or above the national level during the reporting period (consult Table 5). Alberta registered the highest participation rate (69.7%) in FY2122. Compared to their pre-pandemic rates (February 2020), only Newfoundland and Labrador and Ontario saw full recoveries of their participation rates by March 2022.
| Province or territory | Change in labour force FY2021 to FY2122 |
Change in labour force February 2020 to March 2022 |
Participation rate FY2021 |
Participation rate FY2122 |
Change in participation rate (p.p. ) February 2020 to March 2022 |
|---|---|---|---|---|---|
| Newfoundland and Labrador | +2.7% | +2.6% | 56.5% | 58.0% | +1.3 |
| Prince Edward Island | +5.3% | +4.2% | 64.5% | 66.6% | -0.1 |
| Nova Scotia | +3.4% | +0.8% | 60.7% | 62.1% | -1.1 |
| New Brunswick | +1.0% | 0.0% | 61.0% | 61.1% | -1.2 |
| Quebec | +1.8% | +0.8% | 63.6% | 64.3% | -0.4 |
| Ontario | +3.7% | +3.0% | 63.8% | 65.5% | +0.4 |
| Manitoba | +2.5% | +0.3% | 65.6% | 67.0% | -0.6 |
| Saskatchewan | +1.7% | -1.2% | 66.9% | 67.9% | -1.3 |
| Alberta | +2.3% | +0.9% | 69.0% | 69.7% | -1.3 |
| British Columbia | +2.6% | +2.1% | 64.6% | 65.3% | -0.6 |
| Yukon | +4.2% | +3.4% | 71.7% | 73.4% | 0.0 |
| Northwest Territories | +4.2% | +7.8% | 71.4% | 74.1% | +4.7 |
| Nunavut | +10.2% | +1.3% | 57.9% | 62.7% | -2.0 |
| Canada* | +2.8% | +1.8% | 64.3% | 65.5% | -0.3 |
- * Figures for Canada’s labour force and participation rate exclude the territories. Percentage change is based on unrounded numbers.
- Sources: Statistics Canada; Labour Force Survey, Table 14-10-0287-01 and 14-10-0292-01.
Employment and employment rate
Each province and territory experienced growth in employment in FY2122 compared to FY2021. The greatest employment gains were recorded in Ontario (+7.3%), Alberta (+7.2%) and British Columbia (+6.6%) (consult Table 6). Nunavut and Northwest Territories also posted strong increases during the same period (+14.8% and +8.6%, respectively). By March 2022, employment in each province and territory (except for Nunavut) had fully recovered, and often exceeded, their pre-pandemic levels recorded in February 2020.
The employment rate increased between 1.3 p.p. to 3.7 p.p. in each province in FY2122 compared to FY2021. In FY2122, employment rates in Alberta, Saskatchewan, Manitoba, and British Columbia were higher than the national level (consult Table 6). By March 2022, employment rates in Newfoundland and Labrador, Ontario, and Northwest Territories had recovered to their pre-pandemic rates recorded in February 2020.
| Province or territory | Change in employment FY2021 to FY2122 |
Change in employment February 2020 to March 2022 |
Employment rate FY2021 |
Employment rate FY2122 |
Change in employment rate (p.p.) February 2020 to March 2022 |
|---|---|---|---|---|---|
| Newfoundland and Labrador | +4.8% | +1.4% | 48.1% | 50.4% | +0.6 |
| Prince Edward Island | +6.4% | +3.8% | 57.5% | 60.0% | -0.3 |
| Nova Scotia | +5.5% | +2.1% | 54.7% | 57.1% | -0.3 |
| New Brunswick | +3.2% | +0.1% | 54.5% | 55.8% | -1.0 |
| Quebec | +6.0% | +1.2% | 57.7% | 60.8% | -0.1 |
| Ontario | +7.3% | +3.3% | 57.1% | 60.6% | +0.5 |
| Manitoba | +5.7% | +0.8% | 60.0% | 63.1% | -0.3 |
| Saskatchewan | +4.4% | +0.3% | 61.2% | 63.8% | -0.3 |
| Alberta | +7.2% | +2.1% | 60.7% | 64.4% | -0.4 |
| British Columbia | +6.6% | +2.6% | 58.4% | 61.5% | -0.2 |
| Yukon | +5.0% | +2.2% | 67.3% | 69.4% | -0.8 |
| Northwest Territories | +8.6% | +11.6% | 64.6% | 70.0% | +6.8 |
| Nunavut | +14.8% | -3.6% | 49.0% | 55.3% | -4.4 |
| Canada* | +6.6% | +2.3% | 57.8% | 61.0% | +0.1 |
- * Figures for Canada’s employment and employment rate exclude the territories. Percentage change is based on unrounded numbers.
- Sources: Statistics Canada; Labour Force Survey, Table 14-10-0287-01 and 14-10-0292-01, seasonally adjusted data.
Unemployment and unemployment rate
All provinces and territories noticed a significant decrease in unemployment in FY2122 compared to the previous fiscal period (consult Table 7). Quebec (-39.9%), British Columbia (-35.7%) and Alberta (‑34.4%) registered the largest drops. Northwest Territories also registered a 37.6% drop, followed by Nunavut (‑13.4%) and Yukon (-7.6%) compared to FY2021. Despite these declines, by March 2022, 9 out of 13 provinces and territories had levels of unemployment that were higher than pre-pandemic ones recorded in February 2020.
In FY2122, all provinces and territories experienced a drop in their unemployment rates compared to FY2021, resulting from lower unemployment and a growing labour force. In FY2122, Quebec (5.5%), Manitoba (5.7%), British Columbia (5.9%) and Saskatchewan (6.0%) saw unemployment rates below the national level (6.8%) (consult Table 7). Yukon (5.5%) and Northwest Territories (5.7%) also reported lower unemployment rates in FY2122. Though the national monthly unemployment rate recorded a historical low, only 2 provinces (Nova Scotia and Quebec) saw historical low marks during FY2122. By March 2022, only Newfoundland and Labrador, Prince Edward Island, Yukon and Nunavut had unemployment rates above their pre-pandemic levels recorded in February 2020. All other provinces and territories had dropped to lower levels compared to their pre-pandemic situation.
| Province or territory | Change in unemployment FY2021 to FY2122 |
Change in unemployment February 2020 to March 2022 |
Unemployment rate FY2021 |
Unemployment rate FY2122 |
Change in unemployment rate (p.p.) February 2020 to March 2022 |
|---|---|---|---|---|---|
| Newfoundland and Labrador | ‑9.6% | +10.6% | 14.8% | 13.0% | +1.0 |
| Prince Edward Island | -4.0% | +9.7% | 10.9% | 9.9% | +0.4 |
| Nova Scotia | -15.9% | -13.7% | 9.9% | 8.1% | -1.2 |
| New Brunswick | -16.8% | -1.7% | 10.6% | 8.8% | -0.1 |
| Quebec | -39.9% | -7.9% | 9.2% | 5.5% | -0.4 |
| Ontario | -26.9% | -1.6% | 10.5% | 7.4% | -0.2 |
| Manitoba | -31.5% | -8.5% | 8.6% | 5.7% | -0.5 |
| Saskatchewan | -27.3% | -22.5% | 8.5% | 6.0% | -1.4 |
| Alberta | -34.4% | -13.8% | 11.9% | 7.6% | -1.1 |
| British Columbia | -35.7% | -7.5% | 9.5% | 5.9% | -0.5 |
| Yukon | -7.6% | +27.3% | 6.2% | 5.5% | +1.1 |
| Northwest Territories | -37.6% | -31.6% | 9.4% | 5.7% | -2.8 |
| Nunavut | -13.4% | +36.8% | 15.2% | 11.9% | +4.3 |
| Canada* | -31.0% | -6.3% | 10.2% | 6.8% | -0.5 |
- * Figures for Canada’s unemployment and unemployment rate exclude the territories. Percentage change is based on unrounded numbers.
- Sources: Statistics Canada; Labour Force Survey, Table 14-10-0287-01 and 14-10-0292-01.
Duration of unemployment
In FY2122, all provinces saw their average duration of unemployment increase for a second consecutive fiscal year. This followed a decrease recorded at the end of FY1920 due to the sudden rise in the number of recent unemployed individuals at the start of the COVID-19 pandemic. However, on a monthly basis, this indicator showed an upward trend at the beginning of FY2122, but started to drop significantly later in FY2122.
Each province’s unemployment duration was impacted differently by the COVID-19 pandemic. By March 2022, only 3 provinces (New Brunswick, Saskatchewan and Quebec) had lower average durations of unemployment compared to pre-pandemic levels recorded in February 2020. Most noticeably, the average duration was higher by 35.6% in Ontario, 33.8% in British Columbia and 27.0% in Manitoba in March 2022 compared to February 2020 (consult Table 8).
| Province or territory | Average weeks of unemployment FY2021 | Average weeks of unemployment FY2122 | Difference in average weeks of unemployment FY2021 to FY2122 |
Change (%) in average duration of unemployment FY2021 to FY2122 |
Difference in average weeks of unemployment February 2020 to March 2022 |
Change (%) in average duration of unemployment February 2020 to March 2022 |
|---|---|---|---|---|---|---|
| Newfoundland and Labrador | 18.5 | 21.6 | +3.0 | +16.3% | +0.4 | +2.2% |
| Prince Edward Island | 14.9 | 17.2 | +2.3 | +15.7% | +1.2 | +8.3% |
| Nova Scotia | 19.8 | 21.7 | +1.9 | +9.6% | +1.7 | +11.0% |
| New Brunswick | 16.2 | 19.1 | +2.9 | +18.0% | -3.9 | -20.2% |
| Quebec | 14.8 | 19.0 | +4.2 | +28.7% | -0.7 | -4.2% |
| Ontario | 17.5 | 23.0 | +5.5 | +31.2% | +5.7 | +35.6% |
| Manitoba | 15.4 | 20.5 | +5.1 | +33.4% | +4.8 | +27.0% |
| Saskatchewan | 18.2 | 23.1 | +5.0 | +27.3% | -2.3 | -12.1% |
| Alberta | 20.2 | 27.7 | +7.5 | +37.1% | +3.2 | +15.8% |
| British Columbia | 17.5 | 20.2 | +2.8 | +15.7% | +4.6 | +33.8% |
| Canada* | 17.4 | 22.3 | +4.9 | +28.0% | +2.9 | +17.4% |
- * Excludes the territories. Percentage change is based on unrounded numbers.
- Sources: Statistics Canada; Labour Force Survey, Table 14-10-0342-01.
Weekly hours and earnings
As the labour market conditions gradually improved, the average weekly hours actually worked in FY2122 in all provinces increased from the previous fiscal year. Newfoundland and Labrador, Alberta, British Columbia and Quebec saw higher growth than the national average (consult Table 9).
Similarly, weekly earnings increased in FY2122 in all provinces and territories except Prince Edward Island (remained unchanged), compared to FY2021. However, the CPI also increased during the same period. In all provinces and territories, the increase in nominal weekly earnings was lower than the increase in CPI, indicating a decrease in the average purchasing power of workers in FY2122 (consult Table 9).
| Province or territory | Average weekly hours worked* FY2122 |
Change in average weekly hours worked (%) FY2021 to FY2122 |
Average nominal weekly earnings** FY2122 |
Change in average nominal weekly earnings (%) FY2021 to FY2122 |
Change in consumer price index (%) FY2021 to FY2122 |
|---|---|---|---|---|---|
| Newfoundland and Labrador | 33.9 | +6.4% | $1,109 | +0.7% | +4.5% |
| Prince Edward Island | 33.9 | +3.4% | $954 | 0.0% | +6.6% |
| Nova Scotia | 32.6 | +3.5% | $989 | +1.4% | +5.1% |
| New Brunswick | 33.8 | +3.4% | $1,022 | +1.5% | +5.1% |
| Quebec | 32.0 | +4.0% | $1,082 | +2.3% | +4.8% |
| Ontario | 32.8 | +3.4% | $1,172 | +1.5% | +4.7% |
| Manitoba | 33.5 | +2.5% | $1,029 | +1.7% | +4.6% |
| Saskatchewan | 34.0 | +3.2% | $1,116 | +1.3% | +3.5% |
| Alberta | 34.3 | +5.5% | $1,232 | +1.4% | +4.3% |
| British Columbia | 32.2 | +4.2% | $1,136 | +2.9% | +3.7% |
| Yukon | Not available | Not available | $1,310 | +2.9% | +4.3% |
| Northwest Territories | Not available | Not available | $1,548 | +2.0% | +3.8% |
| Nunavut | Not available | Not available | $1,506 | +2.2% | +2.2% |
| Canada*** | 32.8 | +3.8% | $1,139 | +1.8% | +4.5% |
- * Weekly hours worked reflect the number of hours actually worked in the reference week of the Labour Force Survey from all jobs, including overtime.
- ** Earnings data are based on gross payroll before source deductions; this includes earnings for overtime.
- *** Excludes the territories. Percentage change is based on unrounded numbers.
- Sources: Statistics Canada, Labour Force Survey, Table 14-10-0042-01, unadjusted for seasonally (for hours worked), Survey of Employment, Payrolls and Hours, Table 14-10-0203-01, unadjusted for seasonality (for nominal weekly earnings) and Consumer Price Index Measures, Table 18-10-0004-01, unadjusted for seasonality (for CPI).
Change in minimum wage
An increase in minimum wage in some jurisdictions contributed to the overall growth in average earnings. In FY2122, 6 out of 10 provinces and 2 out of 3 territories had increased their minimum wage rates (consult the table below). In March 2022, the largest increases in general minimum wage rates, relative to April 2021, were found in Northwest Territories (+12.9%), Yukon (+9.7%), Ontario (+5.3%), and British Columbia (+4.1%).
| Province or territory | April 2021 | March 2022 | Change (%) in minimum wage April 2021 to March 2022 |
|---|---|---|---|
| Newfoundland and Labrador | $12.50 | $12.75 | +2.0% |
| Prince Edward Island | $13.00 | $13.00 | +0.0% |
| Nova Scotia | $12.95 | $12.95 | +0.0% |
| New Brunswick | $11.75 | $11.75 | +0.0% |
| Quebec | $13.10 | $13.50 | +3.1% |
| Ontario | $14.25 | $15.00 | +5.3% |
| Manitoba | $11.90 | $11.95 | +0.4% |
| Saskatchewan | $11.45 | $11.81 | +3.1% |
| Alberta | $15.00 | $15.00 | +0.0% |
| British Columbia | $14.60 | $15.20 | +4.1% |
| Yukon | $13.85 | $15.20 | +9.7% |
| Northwest Territories | $13.46 | $15.20 | +12.9% |
| Nunavut | $16.00 | $16.00 | +0.0% |
| Canada** | n/a | $15.00 | n/a |
- * Hourly minimum wages for adult workers. Some jurisdictions allow for lower wages under certain circumstances (for example, students under age 18, workers receiving gratuities).
- ** The federal minimum wage for federally regulated industries came into effect on December 29, 2021. In provinces and territories where the minimum wage was higher, the higher wage was applied.
Job vacancy and labour market tightness
In the last 2 quarters of FY2122, as the economy continued to recover from the pandemic, the number of job vacancies was up in all provinces and in 2 out of 3 territories (except for Nunavut), compared to the same quarters in FY2021 (consult Table 10). The largest increases were recorded in Prince Edward Island (+84.4%), Alberta (+83.1%), Saskatchewan (+77.2%), and Ontario (+68.5). The smallest increase was observed in New Brunswick (+26.7%).
In addition to an increase in job vacancies, the job vacancy rate also increased in all the provinces and 2 out of 3 territories (except for Nunavut) in FY2122. Among the provinces, British Columbia and Quebec posted job vacancy rates (6.1% and 5.8%, respectively) that were higher than the national level (5.1%). These 2 provinces were also among those with the lowest unemployment rates (5.9% and 5.5%, respectively), indicating that they had the tightest labour market conditions across Canada over FY2122 (consult Tables 7 and 10). This was echoed by the low UV ratios (1.2 and 1.1, respectively) they registered in the reporting period. Ontario recorded a job vacancy rate (5.0%) and a UV ratio (1.9) close to the national average (5.1% and 1.6, respectively), and an unemployment rate slightly higher than the national level (7.4% versus 6.8%) in FY2122. This suggests that Ontario’s labour market tightness was less pronounced than the national average in FY2122. Compared to the national level, Manitoba and Saskatchewan reported slightly lower unemployment rates, slightly lower job vacancy rates and slightly higher UV ratios. This indicates that labour supply in these 2 provinces was broadly in line with labour demand, and labour market pressures were similar or slightly below national average. However, the least tight labour market conditions were observed in Newfoundland and Labrador. This province had the highest unemployment rate and the lowest job vacancy rate in the country, resulting in an UV ratio of 4.8, highest across all provinces and territories. Alberta, New Brunswick, Prince Edward Island and Nova Scotia also underperformed the national average in terms of both unemployment and job vacancy rates. With UV ratios ranging from 2.3 to 2.7, these 4 provinces demonstrated a larger amount of slack in their respective labour markets in comparison with most other provinces.
| Province and territory | Change in number of job vacancies Last two quarters-FY2021 to FY2122 |
Job vacancy rate FY2122 |
Unemployment-to-vacancy ratio FY2122 |
|---|---|---|---|
| Newfoundland and Labrador | +56.1% | 3.5% | 4.8 |
| Prince Edward Island | +84.4% | 4.8% | 2.7 |
| Nova Scotia | +50.0% | 4.3% | 2.3 |
| New Brunswick | +26.7% | 4.5% | 2.4 |
| Quebec | +56.6% | 5.8% | 1.1 |
| Ontario | +68.5% | 5.0% | 1.9 |
| Manitoba | +49.2% | 4.1% | 1.6 |
| Saskatchewan | +77.2% | 4.0% | 1.9 |
| Alberta | +83.1% | 4.2% | 2.3 |
| British Columbia | +53.5% | 6.1% | 1.2 |
| Yukon | +54.3% | 6.8% | Not available |
| Northwest Territories | +78.8% | 5.9% | Not available |
| Nunavut | -0.6% | 3.3% | Not available |
| Canada | +62.2% | 5.1% | 1.6 |
- Sources: Statistics Canada, Job Vacancy and Wage Survey, Table 14-10-0326-01, unadjusted for seasonality (for job vacancies) and Labour Force Survey, Table 14-10-0287-01, unadjusted for seasonality (for unemployment).
The relative intensity of labour market tightness across provinces remained similar to what it was prior to the pandemic, as shown in Chart 17. This suggests that regional disparities in terms of economic conditions, industrial structure and demographic trends have persisted.
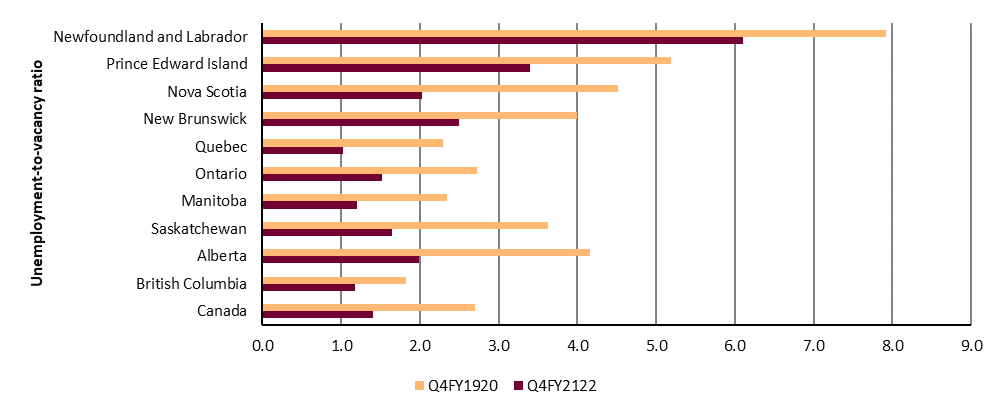
Text description chart 17
| Region | Q4FY2122 | Q4FY1920 |
|---|---|---|
| Canada | 1.4 | 2.7 |
| British Columbia | 1.2 | 1.8 |
| Alberta | 2.0 | 4.2 |
| Saskatchewan | 1.6 | 3.6 |
| Manitoba | 1.2 | 2.3 |
| Ontario | 1.5 | 2.7 |
| Quebec | 1.0 | 2.3 |
| New Brunswick | 2.5 | 4.0 |
| Nova Scotia | 2.0 | 4.5 |
| Prince Edward Island | 3.4 | 5.2 |
| Newfoundland and Labrador | 6.1 | 7.9 |
- Sources: Statistics Canada, Job Vacancy and Wage Survey, Table 14-10-0326-01, seasonally unadjusted (for job vacancies) and Labour Force Survey, Table 14-10-0287-01 (for unemployment).
Interprovincial mobility trends
Each year, a substantial number of people in Canada relocate across provincial and territorial borders due to job opportunities, education, school, or family reasons. Interprovincial mobility gives workers the possibility to access labour markets in other jurisdictions. It also gives them the opportunity to find a job that may be better suited for their particular skillset. Between July 1, 2021 and June 30, 2022, an estimated 272,000 individuals relocated within Canada. From a national perspective, interprovincial mobility can increase real GDP and aggregate labour productivity growth. It can also improve individual outcomes in terms of finding suitable employment. This occurs when workers from provinces with higher unemployment and an excess labour supply move to provinces with lower unemployment and labour shortages.
The regions with the highest net migrationFootnote 39 from July 2021 to June 2022 were the Atlantic provinces (Newfoundland and Labrador, Prince Edward Island, Nova Scotia, and New Brunswick) (+1.5%), Alberta (+0.5%) and British Columbia (+0.4%) (consult Chart 18). Conversely, negative mobility trends continued in the resource and agriculture dependent provinces of Manitoba (‑0.8%) and Saskatchewan (‑0.7%). Ontario continued its downward trends in net migration for the second consecutive fiscal year (‑0.4%).
Most of these trends were a continuation of those observed in July 2019 to June 2021. In particular, large number of people relocated to the Atlantic region from Ontario, in part related to an increased ability of teleworking during the pandemic, and to a faster increase in housing prices observed in Ontario than the Atlantic provinces.Footnote 40 For Alberta, the historical gain of residents from other provinces had reversed in FY1415, with the downturn in crude oil prices and less favourable labour market conditions. However, due to teleworking practices and relatively more affordable housing prices, Alberta saw a net gain from July 2021 to June 2022.
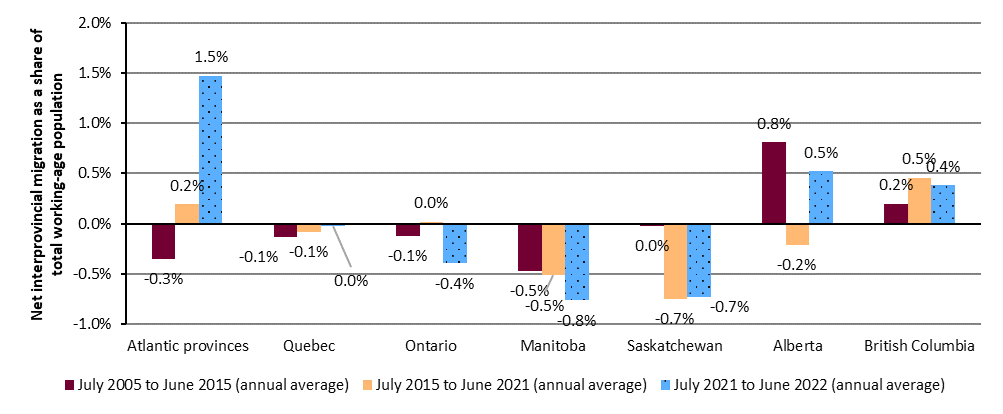
Text description chart 18
| Regions | 2005-2015 | 2015-2021 | 2021-2022 |
|---|---|---|---|
| Atlantic provinces | -0.3% | 0.2% | 1.5% |
| Quebec | -0.1% | -0.1% | 0.0% |
| Ontario | -0.1% | 0.0% | -0.4% |
| Manitoba | -0.5% | -0.5% | -0.8% |
| Saskatchewan | 0.0% | -0.7% | -0.7% |
| Alberta | 0.8% | -0.2% | 0.5% |
| British Columbia | 0.2% | 0.5% | 0.4% |
- Note: Annual is defined as the period from July 1 to June 30.
- P Preliminary data for July 1, 2021 to June 30, 2022.
- Source: Statistics Canada, Table 17-10-0015-01 (for interprovincial migration) and 17-10-0005-01 (for population estimates).
1.4 Summary
In FY2122, Canada’s economy had largely recovered from the COVID-19 pandemic restrictions. This was characterized by a robust growth in real GDP (+5.7%), high inflation and tighter labour market conditions compared to the previous fiscal year.
Under these circumstances, employment rose by 6.6% compared to FY2021 and had resumed its pre-pandemic level, overall and across all age groups and both genders. Women and youth had the strongest recovery in employment in FY2122 compared to the previous year. However, self-employment continued to trend down as the number of paid employees trended up.
The number of unemployed decreased significantly and the unemployment rate dropped to 6.8%, the second lowest among the G7 countries in FY2122. In March 2022, the unemployment rate stood at 5.3%, registering a historical low level since January 1976. Meanwhile both job vacancies and job vacancy rates had risen to record levels in Canada, indicating a tighter labour market. Higher labour demand pressures led to an upward trend in offered wages for vacant jobs. However, as the impact from the COVID‑19 pandemic lingered in some sectors, the duration of unemployment and the share of long-term unemployment were still higher in FY2122 than their pre-pandemic levels.
By the end of FY2122, the labour market in all provinces and territories had recovered from the COVID-19 pandemic restrictions. However, there were regional variations in labour market conditions. British Columbia and Quebec had the tightest labour markets, while Alberta and the Atlantic provinces had looser labour market conditions compared to the nation as a whole. Ontario, Manitoba and Saskatchewan had conditions that were similar or slightly worse than the national average in FY2122.
The impact of these recent labour market developments on the EI program is shown in the following sections in this report.