
Chapter 3: Impact and effectiveness of Employment Benefits and Support Measures for workers and employers (Part II of the Employment Insurance Act)
Official Title: Employment Insurance Monitoring and Assessment Report for the fiscal year beginning April 1, 2024, and ending March 31, 2025 – Chapter 3: Impact and effectiveness of Employment Benefits and Support Measures for workers and employers (Part II of the Employment Insurance Act)
On this page
List of abbreviations
This is the complete list of abbreviations for the Employment Insurance Monitoring and Assessment Report for the fiscal year beginning April 1, 2024 and ending March 31, 2025.
- ACG
- Apprenticeship Completion Grants
- ADR
- Alternative Dispute Resolution
- AI
- Artificial Intelligence
- AIG
- Apprenticeship Incentive Grants
- B/C
- Benefits-to-Contributions
- B/U
- Beneficiary-to-Unemployed (rate)
- B/UC
- Beneficiary-to-Unemployed Contributor (rate)
- BDM
- Benefits Delivery Modernization
- CAL
- Canada Apprenticeship Loans
- CEEDD
- Canadian Employer-Employee Dynamics Database
- CCB
- Compassionate Care Benefits
- CCDA
- Canadian Council of Directors of Apprenticeship
- CEIC
- Canada Employment Insurance Commission
- CEIFB
- Canada Employment Insurance Financing Board
- CFP
- Call for Proposals
- CIRNAC
- Crown-Indigenous Relations and Northern Affairs Canada
- COLS
- Community Outreach and Liaison Service
- CPI
- Consumer Price Index
- CPP
- Canada Pension Plan
- CRA
- Canada Revenue Agency
- CRF
- Consolidated Revenue Fund
- CSO
- Citizen Service Officers
- CWDP
- Community Workforce Development Program
- CX
- Client Experience
- EAS
- Employment Assistance Services
- EB
- Employment Benefits
- EBSM
- Employment Benefits and Support Measures
- ECC
- Employer Contact Centre
- EDI
- Equity, Diversity and Inclusion
- EI
- Employment Insurance
- EI-A
- Employment Insurance Regular Benefits - Apprentices
- EIACC
- Employment Insurance Appeals Consultative Committee
- EICS
- Employment Insurance Coverage Survey
- ELMLP
- Education and Labour Market Longitudinal Platform
- eROE
- Electronic Record of Employment
- ES
- Employment Services
- ESDC
- Employment and Social Development Canada
- FS
- Family Supplement
- FTE
- Full-Time Equivalent
- FY
- Fiscal Year
- G7
- Group of 7
- GC
- Government of Canada
- GDP
- Gross Domestic Product
- HCCS
- Hosted Contact Centre Solution
- HR
- Human Resources
- IBD
- Integrity-by-Design
- IC
- Individual Counselling
- IQF
- Individual Quality Feedback
- ISET
- Indigenous Skills and Employment Training
- IVR
- Interactive Voice Response
- IWW
- Integrated Workload and Workforce
- JCP
- Job Creation Partnership
- KPI
- Key Performance Indicators
- LFS
- Labour Force Survey
- LMDA
- Labour Market Development Agreements
- LMI
- Labour Market Information
- LMIA
- Labour Market Impact Assessment
- LMP
- Labour Market Partnerships
- LTU
- Long-Term Unemployed
- MIE
- Maximum Insurable Earnings
- MSCA
- My Service Canada Account
- MUS
- Monetary Unit Sampling
- NEET
- Not in Employment, Education or Training
- NERE
- New Entrant and Re-Entrant
- NESI
- National Essential Skills Initiative
- NHQ
- National Headquarters
- NIS
- National Investigative Services
- NOC
- National Occupation Classification
- OAS
- Old Age Security
- OASIS
- Occupational and Skills Information System
- OECD
- Organisation for Economic Co-operation and Development
- p.p.
- Percentage point
- PAAR
- Payment Accuracy Review
- PCIC
- Parents of Critically Ill Children
- PCS
- Post Call Survey
- PEAQ
- Processing, Excellence, Accuracy and Quality
- PPE
- Premiums-paid Eligible Individuals
- PRAR
- Processing Accuracy Review
- PRP
- Premium Reduction Program
- PSPC
- Public Services and Procurement Canada
- PT
- Provinces and Territories
- QPIP
- Quebec Parental Insurance Plan
- R&I
- Research and Innovation
- RAIS
- Registered Apprenticeship Information System
- RN
- Registered Nurse
- ROE
- Record of Employment
- RPA
- Robotics Processing Automation
- SCC
- Service Canada Centre
- SCT
- Skills and Competency Taxonomy
- SD
- Skills Development
- SD-A
- Skills Development - Apprentices
- SD-R
- Skills Development - Regular
- SE
- Self-Employment
- SEAQ
- Service, Excellence, Accuracy and Quality
- SEPH
- Survey of Employment, Payrolls and Hours
- SFS
- Skills for Success
- SIN
- Social Insurance Number
- SIP
- Sectoral Initiatives Program
- SIR
- Social Insurance Register
- SM
- Support Measures
- SME
- Small and medium enterprise
- SRI
- Service Referral Initiative
- SRS
- Simple Random Sampling
- SST
- Social Security Tribunal
- STDP
- Short-Term Disability Plan
- SUB
- Supplemental Unemployment Benefit
- SWSP
- Sectoral Workforce Solutions Program
- TES
- Targeted Earning Supplements
- TFW
- Temporary Foreign Worker
- TIS
- Telephone Interpretation Service
- TRF
- Targeting, Referral and Feedback
- TTY
- Teletypewriter
- TWS
- Targeted Wage Subsidies
- UTIP
- Union Training and Innovation Program
- VBW
- Variable Best Weeks
- VER
- Variable Entrance Requirement
- VET
- Vocational Education and Training
- VRI
- Video Remote Interpretation
- VRS
- Video Relay Service
- WCAG
- Web Content Accessibility Guidelines
- WISE
- Work Integration Social Enterprises
- WWC
- Working While on Claim
List of figures
- Chart 3.1.1.1: Canada, 1990 to 2024, employment growth by skill level
- Chart 3.1.2.1: Canada, 2015-16 to 2024-25, key performance indicators
- Chart 3.1.2.2: Canada, 2024-25, total EBSM expenditures, by service type
- Chart 3.1.3.1: Canada, 2024-25, Labour Market Development Agreements at-a-glance, by service type
- Chart 3.1.4.1: Canada, 2015-16 to 2024-25, clients served, by client type
- Chart 3.1.4.2: Canada, 2015-16 to 2024-25, clients served, by client age category
- Chart 3.2.1.1: Newfoundland and Labrador, 2015-16 to 2024-25, clients served, by client type
- Chart 3.2.1.2: Newfoundland and Labrador, 2015-16 to 2024-25, client served, by client age
- Chart 3.2.1.3: Newfoundland and Labrador, 2015-16 to 2024-25, key performance indicators
- Chart 3.2.2.1: Prince Edward Island, 2015-16 to 2024-25, clients served, by client type
- Chart 3.2.2.2: Prince Edward Island, 2015-16 to 2024-25, clients served, by client age
- Chart 3.2.2.3: Prince Edward Island, 2015-16 to 2024-25, key performance indicators
- Chart 3.2.3.1: Nova Scotia, 2015-16 to 2024-25, clients served, by client type
- Chart 3.2.3.2: Nova Scotia, 2015-16 to 2024-25, clients served, by client age
- Chart 3.2.3.3: Nova Scotia, 2015-16 to 2024-25, key performance indicators
- Chart 3.2.4.1: New Brunswick, 2015-16 to 2024-25, clients served, by client type
- Chart 3.2.4.2: New Brunswick, 2015-16 to 2024-25, clients served, by client age
- Chart 3.2.4.3: New Brunswick, 2015-16 to 2024-25, key performance indicators
- Chart 3.2.5.1: Quebec, 2015-16 to 2024-25, clients served, by client type
- Chart 3.2.5.2: Quebec, 2015-16 to 2024-25, clients served, by client age
- Chart 3.2.5.3: Quebec, 2015-16 to 2024-25, key performance indicators
- Chart 3.2.6.1: Ontario, 2015-16 to 2024-25, clients served, by client type
- Chart 3.2.6.2: Ontario, 2015-16 to 2024-25, clients served, by client age
- Chart 3.2.6.3: Ontario, 2015-16 to 2024-25, key performance indicators
- Chart 3.2.7.1: Manitoba, 2015-16 to 2024-25, clients served, by client type
- Chart 3.2.7.2: Manitoba, 2015-16 to 2024-25, clients served, by client age
- Chart 3.2.7.3: Manitoba, 2015-16 to 2024-25, key performance indicators
- Chart 3.2.8.1: Saskatchewan, 2015-16 to 2024-25, clients served, by client type
- Chart 3.2.8.2: Saskatchewan, 2015-16 to 2024-25, clients served, by client age
- Chart 3.2.8.3: Saskatchewan, 2015-16 to 2024-25, key performance indicators
- Chart 3.2.9.1: Alberta, 2015-16 to 2024-25, clients served, by client type
- Chart 3.2.9.2: Alberta, 2015-16 to 2024-25, clients served, by client age
- Chart 3.2.9.3: Alberta, 2015-16 to 2024-25, key performance indicators
- Chart 3.2.10.1: British Columbia, 2015-16 to 2024-25, clients served, by client type
- Chart 3.2.10.2: British Columbia, 2015-16 to 2024-25, client served, by client age
- Chart 3.2.10.3: British Columbia, 2015-16 to 2024-25, key performance indicators
- Chart 3.2.11.1: Yukon, 2015-16 to 2024-25, clients served, by client type
- Chart 3.2.11.2: Yukon, 2015-16 to 2024-25, clients served, by client age
- Chart 3.2.11.3: Yukon, 2015-16 to 2024-25, key performance indicators
- Chart 3.2.12.1: Northwest Territories, 2015-16 to 2024-25, clients served, by client type
- Chart 3.2.12.2: Northwest Territories, 2015-16 to 2024-25, clients served, by client age
- Chart 3.2.12.3: Northwest Territories, 2015-16 to 2024-25, key performance indicators
- Chart 3.2.13.1: Nunavut, 2015-16 to 2024-25, clients served, by client type
- Chart 3.2.13.2: Nunavut, 2015-16 to 2024-25, clients served, by client age
- Chart 3.2.13.3: Nunavut, 2015-16 to 2024-25, key performance indicators
- Chart 3.4: Canada, 2024-25, EI Part II program expenditures for the Pan-Canadian activities, by program
- Chart 3.4.1.1: Canada, 2024-25, clients served by the Indigenous Skills and Employment Training program and performance indicator
List of tables
- Table 3.1.2.1: Canada, 2024-25 results based on key performance indicators
- Table 3.1.2.2: Canada, 2024-25, supplemental indicators, by province or territory
- Table 3.1.2.3: Canada, 2023-24 and 2024-25, year-over-year change in services delivered, by service type
- Table 3.1.3.1: Canada, 2024-25, services delivered, by service type
- Table 3.1.3.2: Canada, 2024-25, Employment Benefits key facts, by service type
- Table 3.1.3.3: Canada, 2024-25, Support Measures key facts, by service type
- Table 3.1.4.1: Canada, 2023-24 and 2024-25, year-over-year change in client volumes, by client type
- Table 3.1.4.2: Canada, 2024-25, clients served and relative share, by client type
- Table 3.1.4.3: Canada, 2024-25, clients served, by client age
- Table 3.1.4.4: Canada, 2023-24 and 2024-25, year-over-year change in clients served, by client age category
- Table 3.1.4.5: Canada, 2015-16 to 2024-25, relative client share, by client age
- Table 3.1.4.6: Canada, 2023-24 and 2024-25, year-over-year change in total services delivered, by client's designated group
- Table 3.1.4.7: Canada, 2024-25, service delivered, by client's designated group
- Table 3.1.4.8: Canada, 2024-25, official language (OL) preference for service interaction, by province and territory
- Table 3.1.4.9: Canada, 2024-25, official language (OL) of service delivered, by province and territory
- Table 3.1.4.10: Canada, 2024-25, clients served, by client type and province or territory
- Table 3.1.4.11: Canada, 2024-25, Targeting, Referral and Feedback (TRF), by province and territory
- Table 3.1.4.12: Canada, 2024-25, final EBSM expenditures, by province or territory
- Table 3.2.1.1: Newfoundland and Labrador, 2024-25, clients served and relative share, by client type
- Table 3.2.1.2: Newfoundland and Labrador, 2015-16 to 2024-25, relative client share, by client type
- Table 3.2.1.3: Newfoundland and Labrador, 2015-16 to 2024-25, relative client share, by client age
- Table 3.2.1.4: Newfoundland and Labrador, 2024-25, services delivered key facts, by service type
- Table 3.2.1.5: Newfoundland and Labrador, 2024-25, services delivered, by service type
- Table 3.2.2.1: Prince Edward Island, 2024-25, clients served and relative share, by client type
- Table 3.2.2.2: Prince Edward Island, 2015-16 to 2024-25, relative client share, by client type
- Table 3.2.2.3: Prince Edward Island, 2015-16 to 2024-25, relative client share, by client age
- Table 3.2.2.4: Prince Edward Island, 2024-25, services delivered key facts, by service type
- Table 3.2.2.5: Prince Edward Island, 2024-25, services delivered, by service type
- Table 3.2.3.1: Nova Scotia, 2024-25, clients served and relative share, by client type
- Table 3.2.3.2: Nova Scotia, 2015-16 to 2024-25, relative client share, by client type
- Table 3.2.3.3: Nova Scotia, 2015-16 to 2024-25, relative client share, by client age
- Table 3.2.3.4: Nova Scotia, 2024-25, services delivered key facts, by service type
- Table 3.2.3.5: Nova Scotia, 2024-25, services delivered, by service type
- Table 3.2.4.1: New Brunswick, 2024-25, clients served and relative share, by client type
- Table 3.2.4.2: New Brunswick, 2015-16 to 2024-25, relative client share, by client type
- Table 3.2.4.3: New Brunswick, 2015-16 to 2024-25, relative client share, by client age
- Table 3.2.4.4: New Brunswick, 2024-25, services delivered key facts, by service type
- Table 3.2.4.5: New Brunswick, 2024-25, services delivered, by service type
- Table 3.2.5.1: Quebec, 2024-25, clients served and relative share, by client type
- Table 3.2.5.2: Quebec, 2015-16 to 2024-25, relative client share, by client type
- Table 3.2.5.3: Quebec, 2015-16 to 2024-25, relative client share, by client age
- Table 3.2.5.4: Quebec, 2024-25, services delivered key facts, by service type
- Table 3.2.5.5: Quebec, 2024-25, services delivered, by service type
- Table 3.2.6.1: Ontario, 2024-25, clients served and relative share, by client type
- Table 3.2.6.2: Ontario, 2015-16 to 2024-25, relative client share, by client type
- Table 3.2.6.3: Ontario, 2015-16 to 2024-25, relative client share, by client age
- Table 3.2.6.4: Ontario, 2024-25, services delivered key facts, by service type
- Table 3.2.6.5: Ontario, 2024-25, services delivered, by service type
- Table 3.2.7.1: Manitoba, 2024-25, clients served and relative share, by client type
- Table 3.2.7.2: Manitoba, 2015-16 to 2024-25, relative client share, by client type
- Table 3.2.7.3: Manitoba, 2015-16 to 2024-25, relative client share, by client age
- Table 3.2.7.4: Manitoba, 2024-25, services delivered key facts, by service type
- Table 3.2.7.5: Manitoba, 2024-25, services delivered, by service type
- Table 3.2.8.1: Saskatchewan, 2024-25, clients served and relative share, by client type
- Table 3.2.8.2: Saskatchewan, 2015-16 to 2024-25, relative client share, by client type
- Table 3.2.8.3: Saskatchewan, 2015-16 to 2024-25, relative client share, by client age
- Table 3.2.8.4: Saskatchewan, 2024-25, services delivered key facts, by service type
- Table 3.2.8.5: Saskatchewan, 2024-25, services delivered, by service type
- Table 3.2.9.1: Alberta, 2024-25, clients served and relative share, by client type
- Table 3.2.9.2: Alberta, 2015-16 to 2024-25, relative client share, by client type
- Table 3.2.9.3: Alberta, 2015-16 to 2024-25, relative client share, by client age
- Table 3.2.9.4: Alberta, 2024-25, services delivered key facts, by service type
- Table 3.2.9.5: Alberta, 2024-25, services delivered, by service type
- Table 3.2.10.1: British Columbia, 2024-25, clients served and relative share, by client type
- Table 3.2.10.2: British Columbia, 2015-16 to 2024-25, relative client share, by client type
- Table 3.2.10.3: British Columbia, 2015-16 to 2024-25, relative client share, by client age
- Table 3.2.10.4: British Columbia, 2024-25, services delivered key facts, by service type
- Table 3.2.10.5: British Columbia, 2024-25, services delivered, by service type
- Table 3.2.11.1: Yukon, 2024-25, clients served and relative share, by client type
- Table 3.2.11.2: Yukon, 2015-16 to 2024-25, relative client share, by client type
- Table 3.2.11.3: Yukon, 2015-16 to 2024-25, relative client share, by client age
- Table 3.2.11.4: Yukon, 2024-25, services delivered key facts, by service type
- Table 3.2.11.5: Yukon, 2024-25, services delivered, by service type
- Table 3.2.12.1: Northwest Territories, 2024-25, clients served and relative share, by client type
- Table 3.2.12.2: Northwest Territories, 2015-16 to 2024-25, relative client share, by client type
- Table 3.2.12.3: Northwest Territories, 2015-16 to 2024-25, relative client share, by client age
- Table 3.2.12.4: Northwest Territories, 2024-25, services delivered key facts, by service type
- Table 3.2.12.5: Northwest Territories, 2024-25, services delivered, by service type
- Table 3.2.13.1: Nunavut, 2024-25, clients served and relative share, by client type
- Table 3.2.13.2: Nunavut, 2015-16 to 2024-25, relative client share, by client type
- Table 3.2.13.3: Nunavut, 2015-16 to 2024-25, relative client share, by client age
- Table 3.2.13.4: Nunavut, 2024-25, services delivered key facts, by service type
- Table 3.2.13.5: Nunavut, 2024-25, services delivered, by service type
Introduction
Activities conducted under Part II of the Employment Insurance Act (EI Act) help individuals in Canada prepare for, find, and maintain employment. These activities are conducted through the Labour Market Development Agreements (LMDAs) and the Government of Canada's pan-Canadian programming:
- LMDAs are bilateral agreements between the Government of Canada (GC) and each province and territory (PT). Each year, under the LMDAs, base funding of $2.1 billion is provided for individuals and employers to receive training and employment supports in the form of Employment Benefits and Support Measures (EBSMs).Footnote 1 Part II of the EI Act sets out the framework for the LMDAs, including information such as who is eligible for employment supports and the categories of programs and supports that can be delivered by PTs
- Part II of the EI Act also includes the framework for the Government of Canada's pan-Canadian programming. Pan-Canadian programming includes the National Employment Service and serves to respond to labour market challenges that surpass local and regional labour markets. In 2024‑25, $181.3 million was invested in pan-Canadian programming across 3 streamsFootnote 2
Note: In 2024-25, Part II received $425 million less than in previous years, due to sunsetting of the temporary additional funding that had been in place since 2016-17. This reduction in temporary funding has affected program outcomes
Sections in this chapter
This chapter presents results achieved under Part II of the EI Act during the fiscal year beginning on April 1st, 2024, and ending on March 31st, 2025 (2024-25).
Section 3.1 provides economic and labour market context for EI Part II and a national overview of EBSM programs delivered through the LMDAs and pan-Canadian programming. This year's aggregated outcomes, funding and client distributions, and key program delivery results are also highlighted.
Section 3.2 reviews employment programming activities carried out by each PT under their respective LMDA, analyzing regional approaches, key outcomes, client demographics, and service types offered.
Section 3.3 reviews results presented in the 2022 LMDA evaluation report. Clients are compared to non-clients to assess impacts on employment and reliance on income supports. The fourth evaluation cycle of the LMDAs was launched in the Fall of 2025 to continue assessing program effectiveness and labour market outcomes.Footnote 3
Section 3.4 details pan-Canadian activities (i.e., EI Part II initiatives that respond to issues of national and strategic importance or challenges extending beyond local or regional labour markets).
Note to readers: Data for EBSM activities were collected from PTs and ISET holders using standardized LMDA and pan-Canadian datasets. While GC and PTs aim for accurate and consistent data, system changes may affect year-to-year comparability. The Performance Measurement Strategy, developed jointly through the Forum of Labour Market Ministers, was implemented in 2019 and is being updated to improve indicators and data quality. Financial data in Chapter 3 and Annex 3 are based on PT reports; some figures may be preliminary. Results for 2024-25 reflect the absence of prior years' temporary top-up funding, affecting comparability.
3.1 National overview
In this section
- 3.1.1 Economic and labour market context
- 3.1.2 Main results
- 3.1.3 Interventions funded by the LMDAs
- 3.1.4 Clients served by the LMDAs
3.1.1 Economic and labour market context
The LMDAs are designed to help Canadians gain the skills, training, and supports needed to participate fully in the labour market. Recent labour market trends underscore the importance of these programs. Between April 2023 and March 2024, Canada added nearly 320,000 new jobs.Footnote 4 However, the population grew even faster, by close to 1 million people. With population growth outpaced job growth, the share of Canadians aged 15 and older who were employed fell by 0.9 percentage points, reaching 61.4% in March 2024.Footnote 5 This was also seen in a rising unemployment rate, reaching 6.5% in March 2024.Footnote 6
Despite this increasing supply of labour, there remain labour market shortages in certain sectors due to employers being unable to find the individuals with the right skillsets. Over the past 2 decades, skills mismatches remain a significant challenge for the Canadian labour market with gaps in both technical and knowledge-based occupations.
The LMDAs play a crucial role in addressing shortages in skilled trades and other positions by providing funding for skills training targeted to Canadians. The training provided through these programs can help Canadians gain the credentials to work in in-demand jobs, providing support to the Canadian economy. It is within this context that the LMDAs are operating: providing programming that can improve clients' job readiness and align workers' skillsets with employer demand.
Canada's higher education and comparison to peer nations
The education level of Canadians is crucial context for how the LMDAs can support Canadians in the labour market. Higher levels of education can increase employment opportunities, while those with lower levels of education can face difficult employment prospects, lower incomes and greater risk of unemployment.Footnote 7
Canada has consistently had an extremely high level of post-secondary attainment compared to its global peers. In 2024, 64.7% of Canadians aged 25 to 64 had a post-secondary certificate or degree, placing Canada well above the OECD average of 41.2%, and the highest among the Organisation for Economic Co-operation and Development (OECD) countries. This demonstrates Canada's prioritization of post-secondary education, at government and public levels.
Demonstrating this is the fact that 39.1% of Canada's core working-age population hold a university degree, which exceeds the OECD average of 36.0%. Also notable is that 25.6% of Canadians have completed short-cycle tertiary education (college-level), placing Canada 10 percentage points ahead of the next highest OECD country, Austria. Additionally, only 19.4% of Canadians aged 25-64 have a high school diploma as their highest credential, ranking third lowest among OECD countries, behind Ireland and the UK.Footnote 8 It is important to interpret these results in the context of differences in educational systems across countries. For example, 36.5% of Germany's working age population has an upper secondary education as their highest educational achievement. However, Germany's much celebrated vocational education and training (VET) and apprenticeship programs are considered part of their secondary education system.Footnote 9 Therefore, a high proportion of their population has employable skillsets upon completion of their VET education. Switzerland and other countries have similar programs and have a correspondingly higher proportion of adults with an upper secondary level as their highest level of education. This provides graduates of a post-secondary diploma with a highly employable vocational skillset.
In contrast, vocational education is broadly unavailable at the secondary level in Canada, and additional training is required for vocational qualifications. Consider that 35.1% of Canadian working-age adults have a VET qualification as their highest level of education (9.5% post-secondary non-tertiary level, 25.6% short-cycle tertiary level).Footnote 10 As a point of comparison, only 13.4% of Germany's working age population has post-secondary non-tertiary education (a short additional education attainment), and 0.6% hold short-cycle tertiary education (which are for specialized and master craftsmen programming).Footnote 11
Meanwhile, highly skilled employment-jobs generally requiring a university degree-has grown steadily over the past several decades, even during the early stages of the COVID-19 pandemic. Medium-skill employment (which generally requires some post-secondary education) has also grown consistently but less drastically, while low skilled employment (which requires a high-school education or relevant job training) has seen minimal growth over the last 20 years. Chart 1 demonstrates both the increased demand for skilled workers, and the greater stability that more highly skilled positions have compared to medium and low-skilled workers.
As of 2024, in Canada, highly skilled employment accounted for 4.8 million jobs. Medium-skill employment represented 8.1 million jobs, and low-skilled accounted for 5.8 million jobs. While highly skilled employment now holds a significant share of total employment at 23.1%, medium and low skill positions are still more common.Footnote 12

Text description
| Year | Management | High | Medium | Low |
|---|---|---|---|---|
| 1990 | 100% | 100% | 100% | 100% |
| 1991 | 102% | 103% | 98% | 96% |
| 1992 | 101% | 103% | 97% | 95% |
| 1993 | 103% | 105% | 97% | 94% |
| 1994 | 103% | 112% | 97% | 97% |
| 1995 | 108% | 114% | 99% | 98% |
| 1996 | 108% | 111% | 101% | 99% |
| 1997 | 109% | 119% | 102% | 101% |
| 1998 | 109% | 122% | 106% | 103% |
| 1999 | 109% | 127% | 107% | 107% |
| 2000 | 111% | 130% | 109% | 111% |
| 2001 | 104% | 134% | 112% | 112% |
| 2002 | 105% | 138% | 115% | 114% |
| 2003 | 107% | 139% | 119% | 117% |
| 2004 | 111% | 141% | 120% | 119% |
| 2005 | 112% | 150% | 122% | 118% |
| 2006 | 114% | 152% | 124% | 120% |
| 2007 | 113% | 158% | 128% | 122% |
| 2008 | 117% | 161% | 133% | 119% |
| 2009 | 115% | 166% | 131% | 115% |
| 2010 | 114% | 172% | 132% | 117% |
| 2011 | 110% | 173% | 135% | 119% |
| 2012 | 112% | 177% | 137% | 120% |
| 2013 | 109% | 180% | 141% | 120% |
| 2014 | 106% | 181% | 143% | 120% |
| 2015 | 106% | 190% | 143% | 120% |
| 2016 | 105% | 194% | 148% | 116% |
| 2017 | 112% | 196% | 150% | 119% |
| 2018 | 112% | 201% | 154% | 120% |
| 2019 | 114% | 210% | 158% | 120% |
| 2020 | 110% | 221% | 149% | 105% |
| 2021 | 111% | 237% | 157% | 109% |
| 2022 | 123% | 249% | 161% | 114% |
| 2023 | 134% | 253% | 165% | 116% |
| 2024 | 139% | 264% | 167% | 117% |
- Source: Statistics Canada (October, 2025). Labour force characteristics by occupation, annual; Author calculations.
While, broadly, Canada has a high level of educational achievement, there is still a significant portion of the population that has limited skills. 1 in 5 (20.0%) working age (aged 25 to 64) Canadians have only basic literacy skills, although Canada does compare favourably with other nations (OECD average is 27.0%).Footnote 13 Strong literacy skills help employment prospects and increase wages, and are also connected with improved health outcomes.Footnote 14
There were 46,971 certificates awarded to registered apprentices and trade qualifiers in 2024, a 1.0% increase from the previous year. While this growth was minimal, there has been a 45.0% increase in certificates per year since 2020. The largest number of certificates in 2024 went to electricians (7,263), automotive service (6,000), and plumbers, pipefitter and steamfitters (4,572).Footnote 15
Red Seal certifications grew by 3.3%, demonstrating the continued interest in these credentials.Footnote 16 Despite the increasing supply, concerns remain about the aging population of skilled trades workers. For example, results from the 2021 census showed that 30.2% of employed individuals with an apprenticeship in mechanic and repair technologies or precision production were 55 or older.Footnote 17
While the LMDAs support clients of all educational backgrounds, only 7.7% of clients in 2024-25 had a university degree. In contrast, 41.7% had a high school diploma or less, and 37.4% had at least some post-secondary education other than university degree. The LMDAs can help provide greater job stability by providing skills training that will allow participants to move up the skilled labour ladder, where employment rates and average wages are higher.Footnote 18
Job vacancies and skills mismatch
While Canada has a heavily educated workforce, there are areas of disconnect between the skillsets of workers and those demanded by employers. Over one quarter (28.3%) of businesses reported having challenges recruiting skilled employees in the fourth quarter of 2024, with 9.8% reporting this as the most significant difficulty facing their business.Footnote 19 A similar proportion of businesses (29.4%) reported the same challenge a year previously,Footnote 20 despite a more favourable labour market compared to 2023, with the unemployment rate rising by close to a whole percentage point (5.4% in 2023 to 6.3% 2024).Footnote 21 This demonstrates the gap between labour supply and demand from employers.
In looking closer, health care and social assistance (35.9%), administrative and support, waste management and remediation services (34.1%), and manufacturing (33.3%) were the business types most likely to report difficulty with hiring skilled workers.Footnote 22
Job vacancies in the fourth quarter of 2024 stood at 517,570, down from 646,365 twelve months earlier. The job vacancy rate had also dropped from 3.6% to 2.9%, mirroring a loosening labour market.Footnote 23
The health care sector has had a long-standing challenge with hiring workers and filling vacancies. While the job vacancy rate within the health care and social assistance sector fell from 5.5% in the fourth quarter of 2023 to 4.7% twelve months later, it still had the highest vacancy rate of any sector, with 118,435 positions unfilled.Footnote 24 In their 2024 report on the Canadian labour market, the C.D. Howe Institute proposed that recognizing the credentials of individuals trained outside Canada could increase productivity and supply the country with much needed healthcare workers.Footnote 25
Underemployment
Underemployment is a long-standing issue for many Canadian workers, who are working fewer hours than they would like to. Over the 2024-25 fiscal year, an average of 7.9% of workers were reported as underemployed, an increase of 0.3 percentage points from 2023-24. However, for youth, the number is much higher, with 17.8% of young workers (aged 15 to 24) reported as underemployed. core-aged workers (aged 25 to 54) were the lowest at 6.7% (with men slightly lower than women at 6.6% versus 6.8%).Footnote 26
To support clients who are underemployed, the LMDAs provide valuable employment assistance services including job search support, resume writing assistance and career counselling. These assistance measures, which are available to all Canadians, help individuals from all backgrounds (including youth, Indigenous peoples, individuals with disabilities, and racialized communities) achieve full-time employment in secure jobs that match their education, skill sets and interests.
Youth
Underemployment and unemployment among youth (aged 15 to 24) is a particular concern in Canada's labour market - especially recently. In 2024, the youth unemployment rate rose to 13.1% - a significant jump from the previous year at 10.7%.Footnote 27 This is important, as youth employment can help develop skills, boost future employment opportunities, and drive economic growth.
Further to unemployment and underemployment, the youth NEET (Not in Employment, Education or Training) indicator provides an important lens for assessing the risk of social disconnect and exclusion among youth as they transition from education to employment.Footnote 28 In 2024, 12% of youth were NEET-1 percentage point higher than in 2019-and the upward trajectory remains concerning. Youth aged 20 to 29 were most affected by rising NEET rates between the 2022-23 and 2023-24 academic years. This increase was driven primarily by rising unemployment among men (-2.1 percentage points) and women (-1.9 percentage points) aged 20 to 29 who did not hold a bachelor's degree and were not enrolled in an education program.Footnote 29 Among youth aged 20 to 24, outcomes diverged significantly depending on engagement in postsecondary education. Those with lower levels of educational attainment continued to experience higher NEET rates. While individuals may be out of school or employment for a range of personal or economic reasons, sustained increases in NEET at this stage of early adulthood point to a heightened risk of social exclusion.Footnote 30
The LMDAs can be leveraged to help youth develop new skill sets as they begin their careers. Career counselling and skills development can provide new direction to young clients, setting them up for long-term success. In fiscal year 2024-25, over 167,000 youths received LMDA services. Of these youths, over 32,000 were receiving apprenticeships, and more than 24,000 received other skill development services.
Underemployment and job mismatching
While a majority of core-aged workers in Canada have an appropriate match between their education and occupation, there is a significant proportion that are overqualified for their employment and therefore underemployed. According to 2021 census data, 61.2% of Canadian workers held occupations that matched their education level. A quarter (25.3%) were marginally overeducated for their positions, and 13.5% were considered overeducated,Footnote 31 representing a potential productivity gain if these workers were employed in roles that better match their qualifications. Recent data shows why this matters: Canadian business labour productivity grew only 0.6% in 2024,Footnote 32 following 3 years of decline, reflecting ongoing challenges in raising output per hour worked.
Mismatches between education levels and occupation types were much higher among recent and established immigrants.
A 2014 study on occupation-to-education mismatches in Canada found that overqualified workers who participated in job-related training were nearly twice as likely to transition into roles aligned with their education level compared to those who did not receive such training.Footnote 33 This finding highlights how better job matching-especially for highly educated workers-could improve labour market outcomes and strengthen Canada's overall productivity performance. This approach could be leveraged for immigrants with medical degrees acquired outside Canada. Only 36.5% of immigrants with a registered nursing degree outside Canada worked as a registered nurse (RN) or in a closely related position, while 41.1% of immigrants with a foreign medical degree were employed as a doctor. In contrast, close to 90% of Canadian nurses (87.4%) and medical degree (90.1%) holders were employed in closely related positions.Footnote 34
The LMDAs provide job-related skills development training and career counselling that can support overeducated individuals to better apply their educational background.
Strategic next steps
Across Canada, persistent hiring challenges and skills mismatches-particularly in trades and other high-demand sectors-underscore the need for a modernized approach to developing the labour force. While Canada's labour market shows signs of loosening, structural gaps remain, especially for roles requiring advanced education and specialized training.
The LMDAs are well-positioned to address these challenges by focusing on reskilling and upskilling initiatives that align with Canada's priorities of improving productivity, fostering inclusive growth, and strengthening labour market resilience. The LMDAs are also a part of Canada's broader solution framework when it comes to dealing with contemporary challenges of U.S. tariffs, global market shifts, adaptation to the advent of artificial intelligence, and mitigating climate change.
In the coming year, LMDA programming will focus on maximizing impact by strengthening training pathways in sectors with persistent labour shortages, support reskilling and upskilling for unemployed, midcareer, and long-tenured workers, and improving job retention and career transitions into high-demand roles. It will also expand supports for underemployed individuals and youth-such as career counselling and job search assistance-to reduce NEET rates, while integrating labour market intelligence to ensure programs remain aligned with evolving employer needs. Through these targeted efforts, LMDAs will help Canadians move into in demand jobs, support employers in filling critical vacancies, and advance broader economic and social priorities.
3.1.2 Main results
LMDA evaluation results indicate that participation in EBSMs improves clients' labour market attachment and reduces their dependence on government income supports, compared to similar non-clients.Footnote 35
Key performance indicators and results (2024-25)
ESDC monitors and evaluates EBSM programming delivered by PTs using 3 key performance indicators (KPIs). These KPIs assess the core objective of the LMDAs: (1) supporting EI active claimants with employment support and benefit services; (2) helping EI claimants return to work; and (3) generating savings for the EI Part I system. Performance from FY 2024-25 is shown in the table below:
| Key performance indicators | Description | 2024-25 Result | Year-over-year change |
|---|---|---|---|
| Active claimant clients served | Measures the extent to which LMDAs served EI claimants, the principal client group. | 172,339 | -2.3% |
| EI-insured clients who returned to employment | Assesses success in helping EI-insured clients return to work. | 169,845 | -0.5% |
| Non-insured clients who returned to work | Additional measure of LMDA impact beyond EI-insured clients. | 60,774 | -10.4%5 |
| Unpaid EI Part I benefits resulting from returns to employment | Indicates EI Part I savings from clients returning to work before exhausting their EI benefits. | $1.1 billion | +20.3% |
- Notes:
- 1 60.3% of active claimants received services within the first 12 weeks of their benefit period.
- 2 52.4% of EI Part I benefit entitlements were saved due to early returns to employment.
- 3 In 2024-25, the LMDAs continued to support individuals and employers across Canada in obtaining skills training and employment support services. Results for this year reflect the end of $425 million in additional "top-up" funding, which will have affected program outcomes and expenditures compared to previous years.
- 4 All national level results presented in this section include pan-Canadian programming data, except for the breakdown by service type, as Indigenous pan-Canadian programs do not separate services into these categories.
- 5 The year‑over‑year decrease is due to the methodological correction being applied in 2024-25 but not to previous years.
Amid evolving labour market and economic conditions in 2024-25 across Canada, the number of active EI claimants served decreased by 2.3% compared to the previous year, serving 172,339 active EI claimants. The number of EI-insured clients who returned to work slightly decreased by 0.5% to 169,845.Footnote 36 In contrast, non-insured clients experienced a sharper decline of 10.4%, with 60,774 individuals returning to work. Meanwhile, unpaid EI Part I benefits resulting from active EI claimants' early returns to work rose significantly to $1.1 billion, up from $909 million in the previous year, representing a 20.3% increase.
Historical (10-year) view
Since 2015-16, the total number of clients served under the LMDAs has gradually decreased, from 734,124 in 2015-16 to 502,007 in 2024-25. This overall decrease includes a significant drop in the total number of active claimants served, which decreased by more than half - from 356,828 in 2015-16 to 172,399 in 2024-25.
EI-insured clients: The number of EI-insured clients returning to employment has fluctuated over the past 10 years, increasing from 186,416 in 2015-16 to 202,749 in 2018-19 before decreasing to 169,845 in 2024-25. Per the 10-year chart below, this trend aligns with broader improvements in labour market attachment among insured participants, wherein fewer active claimant clients participated in services and-of those who did participate-more of them returned to work.
Non-insured clients: In contrast, the number of non-insured clients returning to employment increased gradually from 50,055 in 2015-16 to 66,774 in 2024-25, reflecting sustained demand for employment services among individuals not eligible for EI benefits.
Savings from unpaid EI benefits due to returns to work: Over the same 10-year period, the trendline of savings from unpaid EI benefits savings has proven more volatile. Unpaid EI benefits savings declined alongside the volume of services from $1.15 billion in 2015-16 to $800.2 million in 2020-21 but then peaked at $1.6 billion in 2022-23 before stabilizing at $1.1 billion in 2024-25. These fluctuations are attributed to pandemic-related disruptions and the subsequent recovery.

Text description
| Year | Unpaid EI benefits | EI-insured clients - returns to employment3 | Non-insured clients - returns to employment | Active claimant clients served | Total clients served4 |
|---|---|---|---|---|---|
| 2015-16 | $1,154,581,388 | 186,416 | 50,035 | 356,828 | 734,124 |
| 2016-17 | $1,344,613,965 | 195,814 | 55,191 | 351,362 | 751,872 |
| 2017-18 | $1,103,167,911 | 186,888 | 59,513 | 313,998 | 715,658 |
| 2018-19 | $1,070,684,378 | 202,749 | 62,902 | 286,197 | 695,610 |
| 2019-20 | $1,054,344,499 | 204,203 | 55,769 | 262,196 | 652,267 |
| 2020-21 | $800,239,777 | 165,603 | 68,765 | 169,514 | 414,379 |
| 2021-22 | $1,588,456,667 | 202,668 | 67,699 | 163,672 | 433,898 |
| 2022-23 | $856,401,107 | 172,065 | 72,631 | 153,909 | 478,744 |
| 2023-24 | $909,578,874 | 170,641 | 67,818 | 176,392 | 519,184 |
| 2024-25 | $1,094,408,333 | 169,845 | 60,774 | 172,399 | 502,007 |
- Notes:
- 1 This chart includes Indigenous pan-Canadian data.
- 2 Volatility in the Unpaid EI Benefits from 2021‑22 to 2022‑23 correlates with the speed of recovery of the labour market that allowed many Canadians to return to work before exhausting their EI benefits.
- 3 The EI-insured return to employment returns includes active claimants, former claimants, and PPE clients
- 4 "Total Clients Served" refers to the count of EI-insured clients served (active claimant clients, former claimant clients, and PPE clients) and non-insured clients.
- 5 Historical data has been adjusted to enhance accuracy.
Supplemental performance indicators
Unpaid EI Benefits - Driving EI system savings
As noted in the KPIs section, unpaid EI Part I benefits reached nearly $1.1 billion in 2024-25 from an investment of just over $2.1 billion, leading to a return on investment of 51.1%. This represents, a 15.7% increase from the previous year. This growth is significant given the context of reduced funding and reflects the impact of early interventions that help clients return to work before exhausting their EI entitlements.
Two main factors contributed to this rise:
- higher unused entitlements per claimant: The average amount of benefits left unclaimed on a per-client basis grew from $5,300 to $6,300 year-over-year
- more claimants returning to work early: The number of clients who did not use all their benefits increased from 81,000 to 94,000, expanding the group generating unpaid benefits
Together, these factors amplified savings and underscore the importance of early engagement. In fact, 59.8% of active claimants (including pan-Canadian clients) started an Action Plan within 12 weeks of their benefit period, helping drive these results.
Regional highlights
Savings were concentrated in provinces with the largest populations:
- Ontario: $296.5M from 53,752 returns to work
- Quebec: $186.8M from 39,335 returns to work
- British Columbia: $168.7M from 19,941 returns to work
While most provinces saw returns to work representing less than 1.0% of their labour force, New Brunswick (1.42%) and Prince Edward Island (2.16%) exceeded this level, partly because these provinces serve a higher proportion of their workforce through LMDA programs. See the table below for further insight into unpaid benefits and returns to work.
| Province/Territory | % of active claimants whose action plan started within 12 weeks of their benefit period's commencement | EI-insured Part II clients who returned to work after participation as a percentage of the total size of the labour force in the region 2 | Non-insured Part II clients who returned to work after participation as a percentage of the total size of the labour force in the region 3 | Unpaid EI benefits due to active claimant clients having returned to work as a proportion of the total benefits they would have received had they not returned to work |
|---|---|---|---|---|
| Newfoundland and Labrador | 41.4% | 0.70% | 0.04% | 47.3% |
| Prince Edward Island | 68.0% | 2.16% | 0.49% | 36.9% |
| Nova Scotia | 62.0% | 0.81% | 0.32% | 50.4% |
| New Brunswick | 56.8% | 1.42% | 1.08% | 45.5% |
| Quebec | 58.1% | 0.81% | 0.19% | 37.0% |
| Ontario | 51.4% | 0.61% | 0.35% | 55.3% |
| Manitoba | 72.0% | 0.82% | 0.65% | 60.7% |
| Saskatchewan | 68.2% | 0.87% | 0.03% | 63.9% |
| Alberta | 73.9% | 0.63% | 0.03% | 66.6% |
| British Columbia | 68.9% | 0.64% | 0.23% | 58.2% |
| Yukon | 77.6% | 0.59% | 0.12% | 58.7% |
| Northwest Territories | 47.1% | 0.57% | 0.08% | 56.9% |
| Nunavut | 0.0% | 0.11% | 0.00% | 73.9% |
| Canada | 61.0% | 0.70% | 0.27% | 52.9% |
| Pan-Canadian | 35.3% | 1.65% | n/a | 36.7% |
| Total | 59.8% | 0.76% | 0.27% | 52.4% |
- Notes:
- 1 These indicators reflect outcomes influenced by multiple factors beyond the scope of the EI Part II and should not be solely attributed to EI Part II services.
- 2 EI-insured Return to work/total labour force represents the percentage of Active claimant clients, Former claimant clients and PPE clients who successfully re-entered employment between April 1, 2024 and March 31, 2025, after participating in an EI Part II service, measured against the total labour force.
- 3 Non-insured Return to work/total labour force represents the percentage of non-insured clients who successfully re-entered employment between April 1, 2024 and March 31, 2025, after participating in a LMDA service, measured against the total labour force.
- 4 Pan-Canadian program labour force is defined as the total number of Indigenous people in Canada's labour force.
Comparing LMDA and Pan-Canadian programming
In 2024-25, a combined 847,992 pan-Canadian and non-pan-Canadian training and employment support services were provided under Part II of the EI Act for a decline of 2.7% compared to the last fiscal year. Of particular significance for EI part II non-pan-Canadian programming is a 19.5% decline in more intensive and costly employment benefit services-these are the primary vehicle for spurring skills development through job training. The decrease in these interventions can be attributed at least in part to the end of temporary funding, which took effect in the 2024-25 fiscal year. In contrast, services delivered under the Indigenous Skills and Employment Training (ISET) program under pan-Canadian programming rose by 4.1% to 53,851.
| National level data | 2023-24 | 2024-25 | Year-over-year change |
|---|---|---|---|
| Total Employment Benefits Services | 192,365 | 154,892 | -19.5% |
| Total Support Measures: Employment Assistance Services | 627,664 | 639,249 | +1.8% |
| Total EBSM | 820,029 | 794,141 | -3.2% |
| Indigenous pan-Canadian | 51,740 | 53,851 | +4.1% |
| Total EBSM and Indigenous pan-Canadian services delivered | 871,769 | 847,992 | -2.7% |
- Notes:
- 1 This table reflects all new services started between April 1, 2024 and March 31, 2025.
Pan-Canadian changes
ISET program KPIs showed a modest decline in 2024-25. The program served 25,781 clients, including active EI claimants, former EI claimants, and Premiums Paid Eligible clients for a net decline of 1.9% compared to the previous year. Of all clients served, 12,772 secured employment for a 3.6% drop from the previous fiscal year. Despite the decreases, the program generated a notable increase in savings. Active EI claimants who returned to work before exhausting their EI Part I benefits saved the program $22.4 million, a 9.5% increase compared to 2023-24, when savings totaled $20.4 million.
Summary of spending
Combined expenditures under Part II of the EI Act, for both EBSM programming and pan-Canadian activities, decreased by 16.7% in 2024-25, totalling $1.9 billion.
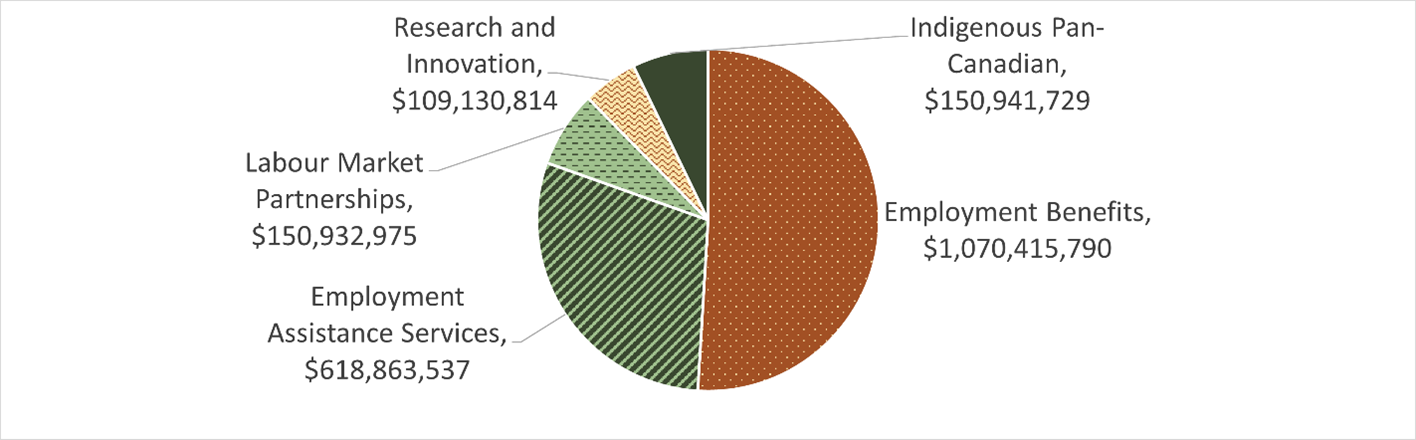
Under the LMDAs, Employment Benefits remained the largest area of investment, totalling $1.7 billion, representing the majority of expenditures by PTs. Compared to 2023‑24, spending on Employment Benefits decreased by $0.2 billion (14.1%). Spending on Employment Assistance Services decreased as well, down 13.1%, to $618.9 million. Other significant investments included $150.9 million in Labour Market Partnerships, $109.1 million in Research and Innovation, and $150.9 million in Indigenous pan-Canadian programming.
Note: Spending trends for 2024-25 reflect the end of temporary top-up funding, which supported higher expenditures in previous years.
Text description
| Employment Benefits | Employment Assistance Services | Labour Market Partnerships | Research and Innovation | Indigenous Pan-Canadian |
|---|---|---|---|---|
| $1,070,415,790 | $618,863,537 | $150,932,975 | $109,130,814 | $150,941,729 |
- Source: Provincial/Territorial Audited Statements.
- Notes:
- 1 Totals may not add due to rounding.
- 2 The financial totals in the MAR are based on finalized reports provided by PTs. At the time of publication, final audited financial statements for YT and NU had not been received. As such, expenditures for these jurisdictions are based on draft reports or previous-year financial statements.
3.1.3 Interventions funded by the LMDAs
A variety of service types - known as EBSMs - are delivered under the LMDAs. This subsection outlines the types of services offered, highlighting key trends in 2024-25, and providing a breakdown of expenditures on them. This subsection also presents supplemental performance indicators to help illustrate the effectiveness of these services.
Types of services
Under the LMDAs, PTs deliver programs and services that are reported according to the EBSM categories established under Part II of the EI Act. The categories are organized into 2 classifications: Employment Benefits (EBs), which encompass 5 types of interventions, and Support Measures (SMs), which comprise 3 types.
Employment Benefits are longer-term training and employment supports, providing individuals with the skills or work experience required to regain employment. Through the LMDAs, PTs provide Employment Benefits consistent with the 5 intervention categories outlined in the EI Act:
- Targeted Wage Subsidies (TWS): Assist clients in obtaining on-the-job work experience by providing employers with financial assistance to help pay clients' wages
- Targeted Earnings Supplements (TES)Footnote 37: Encourage unemployed persons to accept employment through financial incentives
- Self-Employment (SE): Provide financial assistance and business planning advice to eligible clients to help Canadians start their own business
- Job Creation Partnerships (JCP): Provide clients with opportunities to gain work experience that will lead to ongoing employment
- Skills Development - Regular (SD-R): Helps clients obtain employment skills by giving direct financial assistance that enables them to select, arrange for, and pay for training
Skills Development - Apprentices (SD-A): Apprentices are paid by their employer during periods of practical training. During the classroom portion of their training, apprentices are eligible for regular benefits under Part I of the EI Act if approved by their PT government. Depending on the regional and local priorities of the province or territory, the apprentice may receive EI Part II support to cover classroom-related expenses.
Support Measures fall into the subcategories of either (a) Employment Assistance Services (EAS) or (b) other Support Measures (SMs):
- Employment Assistance Services (EAS): Provide individual counselling in the form of 1-on-1 job seeking support; action planning; job search skills; job-finding clubs; job placement services; and more.
- Labour Market Partnerships (LMP): Help employers, employee and employer associations, and communities to improve their capacity to deal with human resource requirements and to implement labour force adjustments.
- Research and Innovation (R&I): Support activities that identify better ways of helping people to prepare for or keep employment and to be productive clients in the labour force.
Expenditures by service type
Spending on services varies across PTs - as do decisions about which types of services to prioritize. The national picture of EBSM service delivery reflects this diversity accordingly. The visual below provides a breakdown of the different intervention types deployed in 2024-25, including average duration, the total amount invested in each, and the year-over-year change in the number of services delivered.

Text description
| Service type | Expenditure amount | Average duration | Services delivered |
|---|---|---|---|
| Employment Benefits and Support Measures (EBSM) | $1.9B | n/a | 847,992 |
| EBSM- Employment Benefits (EB) | $1.1B | n/a | 154,892 |
| EB - Targeted Wage Subsidies (TWS) | $0.2B | 187 days | 9,195 |
| EB - Self Employment Benefit (SE) | $0.04B | 198 days | 1,559 |
| EB - Job Creation Partnerships (JCP) | $0.1B | 88 days | 1,678 |
| EB - Skills Development - Regular (SD-R) | $0.8B | 91 days | 62,084 |
| EB - Skills Development - Apprentices (SD-A) | Included under SD-R | 55 days | 80,376 |
| EB - Targeted Earning Supplements (TES) | Not currently used | 150 days | n/a |
| EBSM - Support Measures (SM) | $0.9B | n/a | 639,249 |
| SM - Other Support Measures | $0.3B | n/a | n/a |
| Other Support Measures- Labour Market Partnerships (LMP) | $0.1B | n/a | n/a |
| Other Support Measures- Research and Innovation (R&I) | $0.1B | n/a | n/a |
| SM - Employment Assistance Services (EAS) | $0.6B | n/a | 639,249 |
| EAS - Employment Services | Included under EAS | 1 days | 448,781 |
| EAS - Individual Counselling | Included under EAS | 1 days | 190,468 |
| Indigenous pan-Canadian | $0.2B | n/a | 53,851 |
- Notes:
- 1 This chart reflects all new services started between April 1, 2024 and March 31, 2025.
- 2 Figures expressed in thousands of dollars by service. Totals may not add due to rounding.
- 3 The financial totals in the MAR are based on finalized reports provided by PTs. At the time of publication, final audited financial statements for YT and NU had not been received. As such, expenditures for these jurisdictions are based on draft reports or previous-year financial statements.
2024-25 service trends and patterns
In 2024-25, a total of 847,992 services were delivered to Canadians (including Indigenous pan-Canadian services), a 2.7% decline from 2023-24, when 871,769 services were provided. Similarly, client volumes receded, dropping 3.3% to 502,007 from 519,184 in previous year.
- Employment Benefits (EBs) accounted for 154,892 services to Canadians in 2024-25, a 19.5% decrease from 192,365 in 2023-24. EBs tend to be more costly and complex, with stricter eligibility criteria, but they often lead to deeper and longer-lasting result for clients. In 2024-25, EBs accounted for 18.3% of all intervention services provided. As previously noted, the significant reduction in these services can be reasonably correlated with reduced funding
- Support Measures (SMs), including Employment Assistance Services (EAS), continue to represent the majority of services provided. In 2024-25, delivery of SM services increased by 1.8% to 639,249 from 627,664 in 2023-24 - accounting for 75.4% of all services provided. Clients typically begin with an SM to assess their needs, determining which additional benefits or services might best support their return to the labour market. As these services increased in a time of reduced funding, it can be reasonably hypothesized that they stood in for their more expensive EB counterpart services in at least some cases in 2024-25
The mix of SMs and EBs reflects broad use of lower‑cost and more broadly accessible employment assistance services, while EBs are costlier because they deliver more targeted, skills‑based supports.
| Service type | Services delivered | Year-over-year change | Share of total | Year-over-year change (p.p.) |
|---|---|---|---|---|
| Total Employment Benefits | 154,892 | -19.5% | 18.3% | -3.8 |
| Total Support Measures | 639,249 | +1.8% | 75.4% | +3.4 |
| Total EBSM | 794,141 | -3.2% | 93.6% | -0.5 |
| Indigenous pan-Canadian | 53,851 | +4.1% | 6.4% | +0.5 |
| Total EBSM and Indigenous pan-Canadian services delivered | 847,992 | -2.7% | 100.0% | n/a |
- Notes:
- 1 This table reflects all new services started between April 1, 2024 and March 31, 2025.
- 2 The decrease in Employment Benefits (EB) is mostly attributable to a coding correction made by 3 provinces who had in prior years been coding some of their single day workshops as an EB instead of as a Support Measure. Prior to this coding correction, EB counts had been stable between 2023-24 and 2024-25.
- 3 The financial totals in the MAR are based on finalized reports provided by PTs. At the time of publication, final audited financial statements for YT and NU had not been received. As such, expenditures for these jurisdictions are based on draft reports or previous-year financial statements.
Delivery of Employment Benefits (EBs) services in 2024-25
As noted elsewhere, employment Benefits provided 154,892 services in 2024-25, a 19.5% decline from the previous year, reflecting lower EB expenditures, which also fell by 14.1% to $1.1 billion.
Skills Development (SD) programs continued to be the primary Employment Benefit in 2024-25, accounting for 92.0% of all EB services undertaken - ensuring clients have the necessary skills for Canada's labour market. Expenditures on SD totalled $798.9 million, down 19.7% from the previous year.
- Skills Development - Regular services (SD-R) which include occupational skills training, literacy and essential skills programs, and language training-fell by 37.8% to 62,084 services. This significant decline is due in part to a coding issue where some workshops provided by PTs were accidentally coded as SD-R rather than EAS Employment Services. SD-R services accounted for 40.1% of all Employment Benefits services in 2024-25
- In contrast, Skills Development - Apprentices (SD-A) services rose by 3.2% to 80,376, representing 51.9% of all EB services. This growth in SD-A services reflects a sustained emphasis on equipping workers with the specialized skills needed to meet specific labour market demands so they can fill well-defined job opportunities
Accounting for 5.9% of all EB services, Targeted Wage Subsidies (TWS) fell by 16.7% to 9,195 services in 2024-25. Despite lower volumes, expenditures on TWS fell by 3.5%, totalling $172.9 million. Self-Employment (SE) supports, which represents 1.0% of all EB services, incurred a steeper decline, dropping by 27.2% to 1,559 services even as spending on them fell by 25.5% to $41.8 million.
Job Creation Partnerships (JCPs)-which provide clients with opportunities to gain work experience that will lead to ongoing employment-saw service volumes increase by 10.1%, to 1,678 - accounting for 1.1% of all EB services. This growth in JCP volumes occurred alongside a 271.8% increase in spending on them as disbursements totalled $56.6 million.
| Employment Benefits | Services | Year-over-year change | Share of employment benefits total | Expenditures | Year-over-year change |
|---|---|---|---|---|---|
| Targeted Wage Subsidies | 9,195 | -16.7% | 5.9% | $172,976,482 | -3.5% |
| Self-Employment | 1,559 | -27.2% | 1.0% | $41,843,113 | -25.5% |
| Job Creation Partnerships | 1,678 | +10.1% | 1.1% | $56,611,963 | +271.8% |
| Skills Development-Regular | 62,084 | -37.8% | 40.1% | $798,984,231 | -19.7% |
| Skills Development-Apprentices | 80,376 | +3.2% | 51.9% | Included above | Included above |
| Targeted Earning Supplements | n/a | n/a | n/a | n/a | n/a |
| Total | 154,892 | -19.5% | 100.0% | $1,070,415,790 | -14.1% |
- Notes:
- 1 This table reflects all new services started between April 1, 2024 and March 31, 2025.
- 2 This table excludes Indigenous pan-Canadian data, which does not separate services into these categories.
- 3 The decrease in SD-R is due to coding correction, where some workshops provided by some provinces were previously coded as Skills Development - Regular (SD-R) instead of an Employment Services (ES). Prior to this coding correction, SD-R counts were stable between 2023-24 and 2024-25.
- 4 Expenditure figures are expressed in the thousands of dollars by service. Totals may not add due to rounding.
- 5 The financial totals in the MAR are based on finalized reports provided by PTs. At the time of publication, final audited financial statements for YT and NU had not been received. As such, expenditures for these jurisdictions are based on draft reports or previous-year financial statements.
Delivery of Employment Assistance Services (EAS) in 2024-25
Employment Assistance Services (EAS), delivered under the Support Measure (SM) service type, typically serve as the point-of-entry or first contact for individuals seeking services through which to re-enter the labour market. EAS play a critical role: they assess a person's needs and identify appropriate training or other employment supports that can facilitate their reattachment to the workforce. EAS is especially vital for individuals who have been disconnected from the labour market for a prolonged period or who exhibit low job attachment. Through a range of supports-from Employment Services (ES) to Individual Counselling (IC)-EAS assist clients in pursuing stable employment by offering tailored strategies and personalized guidance.
The number of EAS provided rose by 1.8% in 2024-25, totalling 639,249:
- Employment Services (ES), which includes services such as job search assistance, remained the most frequently accessed type of EAS with 448,781 services delivered, accounting for 70.2% of all EAS. This represents a 5.4% increase compared to the previous year, underscoring the continued emphasis on early client engagement through needs assessments and personalized employment strategies, as well as a need to further leverage lower cost services in a time of reduced funding. In 2024‑25, EAS expenditures totalled $618.8 million, a 13.1% decrease from the previous year
- Individual Counselling (IC) services declined by 6.1% to 190,468 services, representing 29.8% of all EAS delivered. Despite this decrease, IC remains a key component of employment support, offering personalized and in-depth assistance to help clients overcome barriers to employment. These services continue to play a vital role in supporting job seekers as they navigate a dynamic and evolving labour market
Delivery of other Support Measures in 2024-25
Other Support Measures include Labour Market Partnerships (LMP) and Research and Innovation (R&I), both of which play a critical role in strengthening the labour market and supporting workforce development.
Labour Market Partnerships (LMP) offer crucial support to employers, assisting them in managing workforce adjustments and addressing human resources needs and challenges. These supports are also extended to employee and employer associations, community organizations, and local communities, enabling them to develop and implement strategic workforce solutions. In 2024‑25, LMP expenditures totalled $150.9 million for a 33.6% decline over the previous year.
Research and Innovation (R&I) initiatives aim to identify more effective ways of helping individuals prepare for, return to, or maintain employment, and be productive participants in the labour force. In 2024‑25, R&I expenditures totalled $109.1 million, compared to $185.2 million the previous year. The outcomes of R&I projects are reviewed through evaluations, where applicable, and impactful approaches are shared as best practices to inform and enhance other employment programs.
| Support Measures | Services | Year-over-year change | Share of total support measures | Expenditures | Year-over-year change |
|---|---|---|---|---|---|
| Employment Services (ES) | 448,781 | +5.4% | 70.2% | $618,863,537 | -13.1% |
| Individual Counselling (IC) | 190,468 | -6.1% | 29.8% | Included above | Included above |
| Labour Market Partnerships (LMP) | n/a | n/a | n/a | $150,932,975 | -33.6% |
| Research & Innovation (R&I) | n/a | n/a | n/a | $109,130,814 | -41.1% |
| Totals | 639,249 | +1.8% | 100.0% | $878,927,326 | -21.9% |
- Notes:
- 1 This table reflects all new services started between April 1, 2024 and March 31, 2025.
- 2 This table excludes Indigenous pan-Canadian data, as the program do not separate services into these categories.
- 3 The increase in ES is mostly due to a coding correction, where some workshops provided by some provinces were previously coded as Skills Development - Regular (an Employment Benefit) instead of as an ES. Prior to this coding correction, EAS counts were stable between 2023-24 and 2024-25.
- 4 There are no data on any distinct services provided to individual clients under LMP and R&I; only expenditure amounts are provided by Chief Financial Officer Branch.
- 5 Expenditure figures expressed in thousands of dollars by service. Totals may not add due to rounding.
- 6 The financial totals in the MAR are based on finalized reports provided by PTs. At the time of publication, final audited financial statements for YT and NU had not been received. As such, expenditures for these jurisdictions are based on draft reports or previous-year financial statements.
3.1.4 Clients served by the LMDAs
This section describes the types of clients served by the LMDAs, including socio-demographic profiles and a breakdown by PT, offering insight into who accesses services across jurisdictions.
A client is an individual who has received at least 1 training and/or employment support or service that started in fiscal year 2024-25 and was funded by the LMDAs or by Indigenous organizations. Clients are categorized into different types based on their eligibility and EI claim history.
A training and/or employment support or service is a discrete program or service in which a client participates. Each service is attributed to the fiscal year in which it started.
Types of clients
Broadly, LMDA client types are as follows:
- active claimant clients are those who were receiving EI Part I regular benefits when they requested labour market supports. Typically, they have stronger and more recent job attachment. They tend to return to work more quickly than those with weaker ties to employment
- former claimant clients are those who received EI benefits in the previous 5 years
- Premiums Paid Eligible (PPE) are unemployed individuals who have made EI premium contributions on $2,000 or more in earnings in at least 5 of the last 10 years. This criterion helps support individuals with weaker or less consistent labour force attachment
- non-insured clients are those who are not eligible for Employment Benefits under EI Part II, but access Employment Assistance Services. This group includes new labour-market entrants and people who were previously self-employed without paid employment income
2024-25 client trends and patterns
In 2024-25, the total number of clients served under the LMDAs declined 3.3% to 502,007-down from 519,184 in 2023-24. Active claimant clients (including Indigenous pan-Canadian clients) accounted for the largest share of clients, representing 34.3% of all clients despite a 2.3% decrease in their number to 172,399.
Meanwhile, the number of former claimant clients served (including Indigenous pan-Canadian clients) rose by 2.7% to 119,159. The increase pushed the share of former claimant clients up 1.4 percentage points to 23.7%. The continued predominance of active claimants over former claimants suggests that services are effectively reaching individuals shortly after they begin receiving EI benefits.
The share of Premiums Paid Eligible (PPE) individuals-clients who are not currently on EI but paid EI premiums contributions in at least 5 of the past 10 years-declined slightly from 9.5% to 9.2% for 0.3 percentage point decline.
Finally, the share of non-insured clients served decreased from 33.9.% to 32.4% for a 1.5 percentage point decline, indicating a comparative reduction in service uptake among individuals with the weakest labour market attachment.
| National level data | 2023-24 Clients Served | 2023-24 Share of total clients | 2024-25 Clients Served | 2024-25 Share of total clients | Year-over-year change (clients served) |
|---|---|---|---|---|---|
| Active claimant clients (including Indigenous pan-Canadian clients) | 176,392 | 34.0% | 172,399 | 34.3% | -2.3% |
| Former claimant clients (including Indigenous pan-Canadian clients) | 115,999 | 22.3% | 119,159 | 23.7% | +2.7% |
| Premiums-paid eligible (PPE) individuals (including Indigenous pan-Canadian clients) | 49,443 | 9.5% | 46,389 | 9.2% | -6.2% |
| Non-insured | 175,945 | 33.9% | 162,893 | 32.4% | -7.4% |
| Client type unspecified | 1,4052 | 0.3% | 1,1673 | 0.2% | -16.9% |
| Total | 519,184 | 100.0% | 502,007 | 100.0% | -3.3% |
- Notes:
- 1 This table reflects all clients served between April 1, 2024 and March 31, 2025.
- 2 In 2023-24, the 1,405 represents the estimated total number of clients served by NU and YU, with NU accounting for 1,167 and YK for 238, which cannot be disaggregated by type due to data limitations.
- 3 In 2024-25, the 1,167 represents the estimated total number of clients served by NU, which can not be disaggregated by type due to data limitation.
- 4 This table includes Indigenous pan-Canadian data.
The distribution of clients remains similar when excluding Indigenous pan-Canadian clients. Active claimant clients continue to represent the largest share of clients at 34.5% (163,949 individuals), followed by non-insured clients at 34.3% (162,893 individuals), former claimant clients accounted for 22.4% (106,695 individuals) and PPE clients represented 8.7% (41,522 individuals). Indigenous pan-Canadian clients represented 5.1% of total clients (25,781 individuals), including 8,450 active claimants, 12,464 former claimants, and 4,867 PPE clients.
| Indicator | Active claimant clients | Former claimant clients | PPE clients | Non-insured clients | Client type not unspecified2 | Total |
|---|---|---|---|---|---|---|
| Clients served under the LMDAs (excluding Indigenous pan-Canadian clients) | 163,949 | 106,695 | 41,522 | 162,893 | 1,167 | 476,226 |
| Indigenous pan-Canadian clients | 8,450 | 12,464 | 4,867 | n/a | 0 | 25,781 |
| Total | 172,399 | 119,159 | 46,389 | 162,893 | 1,167 | 502,007 |
| Share of total (including Indigenous pan-Canadian clients) | 34.3% | 23.7% | 9.2% | 32.4% | 0.2% | 100.0% |
| Share of total (excluding Indigenous pan-Canadian clients) | 34.4% | 22.4% | 8.7% | 34.3% | 0.2% | 100.0% |
- Notes:
- 1 This table reflects all clients served between April 1, 2024 and March 31, 2025.
- 2 In 2024-25, the 1,167 represents the estimated total number of clients served by NU, which cannot be disaggregated by type due to data limitations.
Since 2015-16, the number of clients (including Indigenous pan-Canadian clients) served under the LMDAs showed different shifts across client types, reflecting evolving labour market conditions, changes in EI Part II eligibility rules, and the effects of the COVID-19 pandemic. The number of active claimant clients declined overall during this period, from 356,828 in 2015-16 to 172,399 in 2024-25, after reaching a low of 153,909 in 2022-23. This sharp drop can be broadly attributed to public health restrictions which, at that point in the COVID-19 pandemic, limited service delivery. More recently, participation has risen as the national unemployment rate rose slightly to 6.6% in 2024-25.
Over the last decade, the number of former claimant clients increased from 92,689 in 2015-16 to 119,159 in 2024-25, indicating greater uptake of services by individuals no longer receiving EI benefits. Non insured client use declined from 284,607 to 162,893 over the same period, following a pattern similar to active clients, with a sharp drop between 2018-19 and 2020-21 and a modest rebound thereafter before declining again in 2024-25. PPE clients also decreased, falling from 67,490 in 2018-19 to 46,389 in 2024-25.

Text description
| Year | Active claimant clients (including pan-Canadian clients) | Former claimant clients (including pan-Canadian clients) | PPE clients (including pan-Canadian clients) | Non-insured clients | Client type unspecified2 | Unemployment Rate |
|---|---|---|---|---|---|---|
| 2015-16 | 356,828 | 92,689 | n/a | 284,607 | n/a | 7.0% |
| 2016-17 | 351,362 | 95,583 | n/a | 304,927 | n/a | 7.1% |
| 2017-18 | 313,998 | 115,927 | n/a | 285,733 | n/a | 6.4% |
| 2018-19 | 286,197 | 101,848 | 67,490 | 240,075 | n/a | 5.8% |
| 2019-20 | 262,196 | 104,333 | 67,388 | 218,350 | n/a | 5.7% |
| 2020-21 | 169,514 | 72,723 | 40,038 | 132,104 | n/a | 7.5% |
| 2021-22 | 163,672 | 94,238 | 41,667 | 134,321 | n/a | 5.3% |
| 2022-23 | 153,909 | 119,565 | 45,556 | 158,321 | 1,393 | 5.4% |
| 2023-24 | 176,392 | 115,999 | 49,443 | 175,945 | 1,405 | 6.3% |
| 2024-25 | 172,399 | 119,159 | 46,389 | 162,893 | 1,167 | 6.6% |
- Notes:
- 1 This chart reflects all clients served between April 1, 2024 and March 31, 2025.
- 2 Historical data has been adjusted to enhance accuracy.
- 3 This chart includes Indigenous pan-Canadian data.
- 4 In 2022-23, the 1,393 represents the estimated total number of clients served by NU and YU, with NU accounting for 1,155 and YK for 238, which cannot be disaggregated by type due to data limitations.
- 5 In 2023-24, the 1,405 represents the estimated total number of clients served by NU and YU, with NU accounting for 1,167 and YK for 238, which cannot be disaggregated by type due to data limitations.
- 6 In 2024-25, the 1,167 represents the estimated total number of clients served by NU, which can not be disaggregated by type due to data limitation.
Clients by socio-demographic group
The following section provides a detailed breakdown of LMDA clients across key demographic dimensions: (1) age distribution, (2) designated and/or under-represented groups and (3) official language preference and service delivery. These insights help illustrate who is accessing employment supports and how service delivery aligns with the diverse needs of Canada's labour force.
Age distribution
In 2024-25, the age profile of LMDA clients shifted slightly compared to the previous year. Youth clients (aged 15-24) accounted for 21.1% of all clients, up from 20.8%, despite a small decline in their numbers from 107,884 to 105,932. Core-age clients (25-54) remained the largest group, representing 66.0%, up marginally from 65.6%, with participation falling from 340,612 to 331,148. The share of clients aged 55 and older declined from 12.6% to 11.8%, with their numbers decreasing from 65,213 to 58,870, indicating reduced engagement among older workers.
| Age group | Number | Share of total |
|---|---|---|
| 15 to 19 | 28,107 | 5.6% |
| 20 to 24 | 77,825 | 15.5% |
| 25 to 29 | 77,755 | 15.5% |
| 30 to 34 | 73,185 | 14.6% |
| 35 to 39 | 60,623 | 12.1% |
| 40 to 44 | 49,674 | 9.9% |
| 45 to 49 | 38,566 | 7.7% |
| 50 to 54 | 31,345 | 6.2% |
| 55 to 59 | 26,859 | 5.4% |
| 60 to 64 | 21,118 | 4.2% |
| 65 and over | 10,893 | 2.2% |
| Age undisclosed2 | 6,057 | 1.2% |
- Notes:
- 1 This table reflects all clients served between April 1, 2024, and March 31, 2025.
- 2 Clients for whom valid dates of birth were not provided are included in the 'Age undisclosed' category.
| National level data | 2023-24 Clients Served | 2023-24 Share of total clients | 2024-25 Clients Served | 2024-25 Share of total clients | Year-over-year change (clients served) |
|---|---|---|---|---|---|
| Youth clients (15-24 years old) | 107,884 | 20.8% | 105,932 | 21.1% | -1.8% |
| Core age clients (25-54 years old) | 340,612 | 65.6% | 331,148 | 66.0% | -2.8% |
| Workers aged 55+ | 65,213 | 12.6% | 58,870 | 11.7% | -9.7% |
| Age undisclosed2 | 5,475 | 1.1% | 6,057 | 1.2% | +10.6% |
| Total | 519,184 | 100.0% | 502,007 | 100.0% | -3.3% |
- Notes:
- 1 This table reflects all clients served between April 1, 2024, and March 31, 2025.
- 2 Clients for whom valid dates of birth were not provided are included in the 'Age undisclosed' category.
From 2015-16 to 2024-25, core-age clients (25-54 years old) consistently represented the majority of LMDA clients. Their share fluctuated modestly, starting at 66.9% in 2015-16, before dipping to 63.1% in 2018-19, and gradually climbing back to 66.0% in 2024-25. The number of core-age clients followed a similar pattern, falling to 270,881 in 2020-21, then recovering to 281,876 in 2024-25 as labour market conditions stabilized. These proportions are similar to the broader labour force, where core aged workers represented 65.1% of the labour market.Footnote 38
Youth (15-24 years old) participation exhibited more volatility. Although the number of youth clients declined from 130,538 in 2015-16 to 105,932 in 2024-25, their share as clients rose to a peak of 24.6% in 2021-22. This spike coincided with pandemic-related disruptions, which disproportionately affected younger workers, reflected in the youth unemployment rate that peaked at 21.1% in 2020-21, before falling to 13.4% by 2024-25.Footnote 39 These trends suggest that LMDA services remain a critical resource for young people, even as demand among other age groups stabilizes. The representation of youth in the labour market at large remained near constant between the 2 years (13.8% in 2023-24 and 14.0% in 2024-25).Footnote 40
Older workers (55+) consistently made up a smaller share of LMDA clients. Their participation increased from 12.5% in 2014-15 to 13.9% in 2019-20, before dropping to 9.5% in 2020-21. A partial recovery followed, with their share rising to 12.6% in 2023-24, before dipping to 11.7% in the most recent year. The number of older clients fell from 78,696 in 2015-16 to 58,870 in 2024-25, following a similar pattern to other age groups and mirroring lower participation among older Canadians within the broader labour force (decreasing from 21.1% to 20.5%).Footnote 41
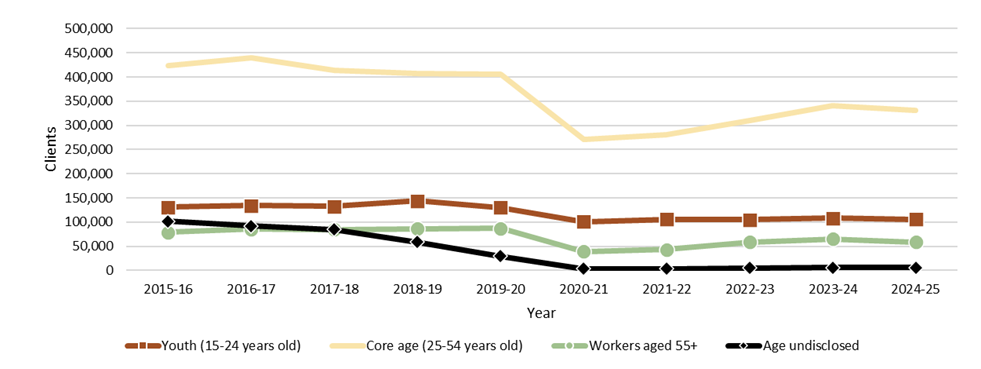
Text description
| Client age | 2015-16 | 2016-17 | 2017-18 | 2018-19 | 2019-20 | 2020-21 | 2021-22 | 2022-23 | 2023-24 | 2024-25 |
|---|---|---|---|---|---|---|---|---|---|---|
| Youth (15-24 years old) | 130,538 | 134,465 | 132,814 | 143,684 | 130,345 | 100,583 | 105,930 | 104,843 | 107,884 | 105,932 |
| Core age (25-54 years old) | 423,049 | 440,176 | 413,524 | 406,743 | 405,644 | 270,881 | 281,287 | 310,432 | 340,612 | 331,148 |
| Workers aged 55+ | 78,696 | 85,056 | 84,918 | 86,370 | 86,615 | 39,132 | 42,931 | 58,249 | 65,213 | 58,870 |
| Age undisclosed2 | 101,841 | 92,175 | 84,402 | 58,813 | 29,663 | 3,783 | 3,750 | 5,220 | 5,475 | 6,057 |
- Notes:
- 1 This chart reflects all clients served between April 1, 2024, and March 31, 2025.
- 2 Clients for whom a valid date of birth was not provided are included in the 'Age undisclosed'' category.
| Client age | 2015-16 | 2016-17 | 2017-18 | 2018-19 | 2019-20 | 2020-21 | 2021-22 | 2022-23 | 2023-24 | 2024-25 |
|---|---|---|---|---|---|---|---|---|---|---|
| Youth (15-24 years old) | 17.8% | 17.9% | 18.6% | 20.7% | 20.0% | 24.3% | 24.4% | 21.9% | 20.8% | 21.1% |
| Core age (25-54 years old) | 57.6% | 58.5% | 57.8% | 58.5% | 62.2% | 65.4% | 64.8% | 64.8% | 65.6% | 66.0% |
| Workers aged 55+ | 10.7% | 11.3% | 11.9% | 12.4% | 13.3% | 9.4% | 9.9% | 12.2% | 12.6% | 11.7% |
| Age undisclosed2 | 13.9% | 12.3% | 11.8% | 8.5% | 4.5% | 0.9% | 0.9% | 1.1% | 1.1% | 1.2% |
- Notes:
- 1 This chart reflects all clients served between April 1, 2024, and March 31, 2025.
- 2 Clients for whom valid dates of birth were not provided are included in the 'Age undisclosed' category.
Designated and under-represented groups
Between 2023-24 and 2024-25, representation among the different designated and/or under-represented groups remained largely stable, with year-over-year changes of less than 1 percentage point in each designated group's overall share of total services provided. Services delivered to Persons with disabilities rose 1.9% to 157,461 services - pushing the group's share of services to 18.6%.Footnote 42
Also increasing their share of LMDA services were racialized people, representing 20.6% of all services received. On a nominal bases, racialized people received 176,262 services in 2024-25, a 1.0% decrease from the previous year. The decrease in representation for services countered the increase in representation among the broader labour force of racialized people within the same fiscal period. Furthermore, LMDA service share for this group remains below that of the national labour force -34.8% in 2024-25).Footnote 43
Indigenous people accessed 121,304 services in 2024-25, a 1.3% drop in volume compared to the previous year. Despite the decline, the group's share of LMDA services rose 0.2 percentage points to 14.3%. In contrast, Indigenous workers' share of the labour force held steady at 3.5% in 2024-25).Footnote 44 The representation of youth in the labour market at large remained near constant between the 2 years (13.8% in 2023-24 and 14.0% in 2024-25).Footnote 45
The proportion of women that received supports declined from 43.5% to 42.6% (0.9 percentage points decrease), remaining below their share of the broader labour force at 47.1%.Footnote 46
| Designated and under-represented groups | 2023-24 Service provided | 2023-24 Share of total services | 2024-25 Service provided | 2024-25 Share of total services | Year-over-year (services provided) |
|---|---|---|---|---|---|
| Persons with disabilities | 154,570 | 17.7% | 157,461 | 18.6% | +1.9% |
| Racialized people | 176,262 | 20.2% | 174,525 | 20.6% | -1.0% |
| Indigenous Peoples | 122,930 | 14.1% | 121,304 | 14.3% | -1.3% |
| Youth (15-24 years old) | 176,583 | 20.3% | 172,706 | 20.4% | -2.2% |
| Older workers (aged 55+) | 104,248 | 12.0% | 95,923 | 11.3% | -8.0% |
| Women | 379,027 | 43.5% | 361,136 | 42.6% | -4.7% |
| Services provided to all clients (for reference) | 871,769 | 100.0% | 847,992 | 100.0% | -2.7% |
- Notes:
- 1 This table reflects services provided between April 1, 2024 and March 31, 2025.
- 2 Indigenous pan-Canadian clients are included in all rows except racialized people, which is an identity that these clients are not asked about.
- 3 Reported counts may be lower than actual numbers due to reliance on voluntary self-identification.
The table below presents the distribution of services accessed by LMDA clients across different demographic groups, highlighting engagement in Employment Benefits compared to Support Measures. Please note, Indigenous pan-Canadian programs do not separate services into these categories. In total, 794,141 services were delivered to all LMDA clients in 2024-25. Of these, 154,892 were Employment Benefits, representing 19.5% of all services, while 639,249 were Support Measures (i.e. EAS), accounting for 80.5% of the total.
Persons with disabilities accessed 18,848 Employment Benefits services, representing 12.5% of the total services delivered to this group, and 132,103 Support Measures services, accounting for 87.5%. Racialized people received 16,458 Employment Benefits services (9.4%) and 158,067 Support Measures services (90.6%). Indigenous peoples accessed 10,895 Employment Benefits services and 56,558 Support Measures services, with Employment Benefits representing 16.2% and Support Measures 83.8%, showing slightly higher engagement in Employment Benefits compared to other groups.
Youth (15-24 years old) recorded the highest engagement in Employment Benefits services, receiving 44,457 Employment Benefits services, representing 27.5% of their total, and 117,111 Support Measures services, or 72.5%. This higher engagement in Employment Benefits reflects the uptake in apprenticeship training taken up by this group. In contrast, older workers (aged 55+) accessed only 9,530 Employment Benefits services, accounting for 10.4% of their total and 81,947 Support Measures services or 89.6%, indicating they are less likely to participate in similar training programs as youth clients (15-24 years old). Finally, women accessed 41,552 Employment Benefits services, representing 12.4% alongside 292,876 Support Measures services or 87.6%.
| Designated and under-represented groups | Employment Benefit (EB) services | Employment Benefit Share of total services | Support Measures (SM) (i.e. EAS) | Support Measures (SM) Share of total services | Total service provided |
|---|---|---|---|---|---|
| Persons with Disabilities | 18,848 | 12.5% | 132,103 | 87.5% | 150,951 |
| Racialized people | 16,458 | 9.4% | 158,067 | 90.6% | 174,525 |
| Indigenous Peoples | 10,895 | 16.2% | 56,558 | 83.8% | 67,453 |
| Youth (15-24 years old) | 44,457 | 27.5% | 117,111 | 72.5% | 161,568 |
| Older workers (aged 55+) | 9,530 | 10.4% | 81,947 | 89.6% | 91,477 |
| Women | 41,552 | 12.4% | 292,876 | 87.6% | 334,428 |
| Services provided to all LMDA clients (for reference) | 154,892 | 19.5% | 639,249 | 80.5% | 794,141 |
- Notes:
- 1 This table reflects services provided between April 1, 2024 and March 31, 2025.
- 2 This table excludes Indigenous pan-Canadian data, as the program do not separate services into these categories.
- 3 Reported counts may be lower than actual numbers due to reliance on voluntary self-identification.
- 4 The equivalent table in last year's MAR (Table 3.1.3.7) contained inaccuracies in the rows for youth and older workers. The correct number of EBs and SMs provided to youth in 2023-24 were 48,788 and 117,357 respectively while for older workers the correct counts were 14,472 and 85,387, respectively.
Official languages
To promote the full recognition and use of English and French in Canadian society, and to ensure that labour market programs and services are delivered in both official languages, all LMDAs include commitments by PTs to deliver services in both official languages where there is significant demand. The data presented also include Pan-Canadian programs, which similarly support bilingual delivery and accessibility across Canada.
The tables below show clients' official language preferences and the language in which services were delivered outside of Quebec during the 2024-25 fiscal year, where data was available. Clients with French language preferences received 17,871 services, representing 2.1% of the national total of services, and 2.6% of services where the client's language was known outside of Quebec.Footnote 47 Most of these services were provided in provinces with significant francophone populations such as Ontario, New Brunswick, Manitoba and Alberta, which, while having a smaller francophone population, still offers services where there is significant demand. Comparisons between the number of services provided to francophones and those delivered in French indicate most francophone clients in these provinces were served in their preferred official language.
Clients with English language preferences received 635,534 services, representing 74.9% of the national total, and 93.2% of services of where the client's language was known outside of Quebec.
Bilingual (English and French speaking) clients received 8,138 services, representing 1.0% of the national total and 1.2% of the services where the client's language was known outside of Quebec. Clients using a non-official language received 19,916 services, making up 2.3% of the national total, and accounting for 2.9% of services provided to clients whose language was known outside of Quebec. Finally, clients whose language was unknown (not reported) received 166,133 services, representing 19.6% of the national total, of which 151,465 were provided in Quebec.
| Province/Territory | French | English | Bilingual (English and French) | Non-Official Language3 | Not reported4 | Total number of services |
|---|---|---|---|---|---|---|
| Newfoundland and Labrador | 18 | 16,665 | 26 | 28 | 132 | 16,869 |
| Prince Edward Island | 11 | 10,105 | 897 | 389 | 10 | 11,412 |
| Nova Scotia | 2 | 21,092 | 0 | 0 | 1,890 | 22,984 |
| New Brunswick | 4,026 | 20,882 | 5,471 | 38 | 16 | 30,433 |
| Quebec5 | n/a | n/a | n/a | n/a | 151,465 | 151,465 |
| Ontario | 5,507 | 195,053 | 1 | 13 | 970 | 201,544 |
| Manitoba | 4,526 | 102,672 | 0 | 6,794 | 47 | 114,039 |
| Saskatchewan | 33 | 13,291 | 77 | 227 | 5,895 | 19,523 |
| Alberta | 2,335 | 87,577 | 0 | 550 | 1,233 | 91,695 |
| British Columbia | 189 | 118,626 | 126 | 11,095 | 179 | 130,215 |
| Yukon | 11 | 746 | 0 | 35 | 47 | 839 |
| Northwest Territories | 0 | 425 | 0 | 2 | 4 | 431 |
| Nunavut | 0 | 4 | 0 | 2 | 2,686 | 2,692 |
| Canada | 16,658 | 587,138 | 6,598 | 19,173 | 164,174 | 794,141 |
| Indigenous Pan-Canadian | 1,213 | 48,396 | 1,540 | 743 | 1,959 | 53,851 |
| Total | 17,871 | 635,534 | 8,138 | 19,916 | 166,133 | 847,992 |
- Notes:
- 1 This table reflects services provided between April 1, 2024 and March 31, 2025.
- 2 This table reflect the official language of choice or the language in which clients interacted with service providers, which may differ from the language of service delivery.
- 3 Refers to languages other than English and French, which are the official languages of the Government of Canada.
- 4 "Not reported" refers to instances in which the language of the service was not specified. Quebec is exempt from providing the language of its services. Other instances of non-reporting may include information not being provided for apprenticeships, human error, or administrative limitations.
- 5 Quebec does not provide information on client language or language of service. Consequently, total counts are for services provided to francophone clients outside Quebec.
- 6 For Indigenous pan-Canadian clients, "Non-Official Language" refers to those who spoke only an Indigenous language. The categories French, English, and Bilingual (English and French) include clients who spoke the specified OL(s) alone or together with an Indigenous language. In total, 3,783 services were delivered to indigenous pan-Canadian clients who spoke at least 1 Indigenous language, either exclusively or in addition to an OL.
| Province/Territory | French | English | Non-official language3 | Not reported4 | Total number of services |
|---|---|---|---|---|---|
| Newfoundland and Labrador | 1 | 16,455 | 0 | 413 | 16,869 |
| Prince Edward Island | 17 | 11,263 | 99 | 33 | 11,412 |
| Nova Scotia | 451 | 20,385 | n/a | 2,148 | 22,984 |
| New Brunswick | 6,932 | 23,404 | 1 | 96 | 30,433 |
| Quebec5 | n/a | n/a | n/a | 151,465 | 151,465 |
| Ontario | 4,732 | 182,347 | 8,882 | 5,583 | 201,544 |
| Manitoba | 4,934 | 108,080 | 0 | 1,025 | 114,039 |
| Saskatchewan | 0 | 16,992 | 0 | 2,531 | 19,523 |
| Alberta | 1,777 | 87,002 | 700 | 2,216 | 91,695 |
| British Columbia | 0 | 129,310 | 0 | 905 | 130,215 |
| Yukon | n/a | n/a | n/a | 839 | 839 |
| Northwest Territories | 0 | 414 | 0 | 17 | 431 |
| Nunavut | 0 | 1 | 0 | 2,691 | 2,692 |
| Total | 18,844 | 595,653 | 9,682 | 169,962 | 794,141 |
- Notes:
- 1 This table reflects services provided between April 1, 2024 and March 31, 2025.
- 2 This table reflect the language in which the service was actually delivered, regardless of the client's preferred official language (OL).
- 3 Refers to languages other than English and French, which are the official languages of the Government of Canada.
- 4 The 'Not reported' category refers to instances where PTs did not submit data for a specified category. Quebec is exempt from providing the language of its services. Non-reporting may occur due to a variety of reasons, including but not limited to differences in apprenticeship counts, variations in PT reporting requirements or inability to accurately collect language related data.
- 5 Quebec does not provide information on client language or language of service. Consequently, total counts for French represent services provided to clients outside Quebec.
- 6 This table excludes Indigenous pan-Canadian data, as the program does not provide the language(s) in which services were provided.
Clients by province and territory
| Province/Territory | Active claimants target3 | Active claimants served | Former claimants served | PPE clients served | Total insured clients served | Non-insured clients served | Client type unspecified2 | Total clients served |
|---|---|---|---|---|---|---|---|---|
| Newfoundland and Labrador | 5,000 | 3,734 | 2,106 | 227 | 6,067 | 982 | n/a | 7,049 |
| Prince Edward Island | 2,800 | 3,030 | 1,115 | 265 | 4,410 | 1,243 | n/a | 5,653 |
| Nova Scotia | 5,000 | 4,781 | 2,228 | 703 | 7,712 | 4,133 | n/a | 11,845 |
| New Brunswick | 4,700 | 5,120 | 2,671 | 885 | 8,676 | 6,518 | n/a | 15,194 |
| Quebec3 | 92,857 | 53,040 | 23,994 | 8,986 | 86,020 | 43,817 | n/a | 129,837 |
| Ontario | 30,218 | 36,818 | 46,200 | 17,078 | 100,096 | 46,800 | n/a | 146,896 |
| Manitoba | 4,678 | 6,470 | 4,096 | 2,474 | 13,040 | 12,575 | n/a | 25,615 |
| Saskatchewan | 18,593 | 5,712 | 4,763 | 3,648 | 14,123 | 794 | n/a | 14,917 |
| Alberta | 18,000 | 23,463 | 9,768 | 3,118 | 36,349 | 22,085 | n/a | 58,434 |
| British Columbia | 22,000 | 21,477 | 9,558 | 3,982 | 35,017 | 23,664 | n/a | 58,681 |
| Yukon | 200 | 205 | 107 | 92 | 404 | 255 | n/a | 659 |
| Northwest Territories | 275 | 87 | 88 | 64 | 239 | 27 | n/a | 266 |
| Nunavut | 75 | 12 | 1 | 0 | 13 | 0 | 1,167 | 1,180 |
| Total EBSM | 204,396 | 163,949 | 106,695 | 41,522 | 312,166 | 162,893 | 1,167 | 476,226 |
| Indigenous Pan-Canadian | n/a | 8,450 | 12,464 | 4,867 | 25,781 | n/a | n/a | 25,781 |
| Totals | 204,396 | 172,399 | 119,159 | 46,389 | 337,947 | 162,893 | 1,167 | 502,007 |
- Notes:
- 1 This table reflects all clients served between April 1, 2024 and March 31, 2025.
- 2 In 2024-25, the 1,167 represents the estimated total number of clients served by NU, which can not be disaggregated by type due to data limitation.
- 3 QC includes both active and former claimants in the "Active claimants target" column, whereas other jurisdictions only include active EI claimants.
- 4 "0" indicates data was not provided by the PT, while "n/a" indicates data is not available and PT doesn't have anything to report.
Targeting clients with the Targeting Referral and Feedback system
Targeting Referral and Feedback (TRF): Connecting EI applicants to jobs faster
The TRF system plays an important role in achieving the objectives highlighted earlier in Chapter 3-helping EI claimants return to work quickly and reducing reliance on income supports. By enabling early interventions, TRF strengthens the impact of Employment Benefits and Support Measures (EBSMs) and contributes directly to LMDA performance outcomes. Research shows that connecting individuals to training or job opportunities within the first 4 weeks of an EI claim significantly improves employment results and earnings, making TRF a key tool for maximizing program effectiveness.
TRF works by securely sharing data between ESDC and provinces and territories, allowing them to identify EI applicants early and offer services tailored to local labour market needs. Each jurisdiction sets its own criteria-such as occupation, education, or location-and can adjust these at any time to reflect changing conditions. When someone applies for EI online, TRF checks their profile against these criteria and sends referrals to the province if there's a match. Daily data exchanges keep referrals timely, and privacy safeguards are built in. TRF also supports targeted outreach to groups such as persons with disabilities, women, and visible minorities.
2024-25 results
- Applicants processed: 1.5 million
- Referrals made: 674,347 (44.0% referral rate, up from 42.9%)
- Top performers: Northwest Territories (86.3%) and Ontario (77.0%)
Key trends
- Women: 47.1% of the labour force but only 35.3% of applicants and 35.8% of referrals-likely linked to part-time work and EI eligibility rules
- Lower education: High school or less made up 49.3% of applicants and 52.3% of referrals (vs. 23.9% of the labour force). Most worked in sales, trades, or manufacturing-jobs more vulnerable to layoffs
- Higher education: Post-secondary graduates were underrepresented (41.3% of applicants vs. 76.1% of the labour force), reflecting greater job stability
- Work history: Referred individuals averaged 774 days of prior employment, about 10% longer than other applicants
Regional highlights
- Northwest Territories: Highest referral rate (86.3%), with most referred workers having lower education (approximately 81%) and working in trades (40.5%)
- Ontario: Second highest (77.3%), with more referrals for those in manufacturing, business/finance, and science-reflecting its diverse economy
| Provinces/Territories | % referrals from EI applicants, 2023-24 | % referrals from EI applicants, 2024-25 | Number of referrals, 2024-25 |
|---|---|---|---|
| Newfoundland and Labrador | 67.3% | 30.3% | 21,616 |
| Prince Edward Island | 0.0% | 0.0% | 0 |
| Nova Scotia | 52.1% | 29.6% | 17,864 |
| New Brunswick | 0.0% | 0.0% | 0 |
| Quebec | 49.9% | 36.0% | 143,803 |
| Ontario | 56.8% | 77.3% | 380,871 |
| Manitoba | 12.3% | 29.0% | 14,245 |
| Saskatchewan | 19.0% | 18.3% | 7,479 |
| Alberta | 23.1% | 24.6% | 41,761 |
| British Columbia | 29.3% | 27.8% | 44,982 |
| Yukon | 0.0% | 0.7% | 12 |
| Northwest Territories | 85.3% | 86.3% | 1,714 |
| Nunavut | 0.0% | 0.0% | 0 |
| Canada | 42.9% | 44.0% | 674,347 |
Spending by province and territory
A breakdown of spending by each high-level service type (Employment Benefits, Support Measures, Indigenous Pan-Canadian) as well as associated total administrative costs is presented in the table below:
| Province/Territory | Employment Benefits | Support Measures | Over-contributions | Indigenous Pan-Canadian | Adjustments4 | Subtotal | Administrative costs5 | Total |
|---|---|---|---|---|---|---|---|---|
| Prince Edward Island (NL) | $72,895 | $50,650 | $0 | $2,766 | $415 | $126,726 | $8,937 | $135,663 |
| Prince Edward Island (PE) | $17,568 | $4,765 | $0 | $281 | $0 | $22,613 | $2,695 | $25,309 |
| Nova Scotia (NS) | $27,792 | $46,947 | $0 | $2,324 | $2,157 | $79,219 | $10,149 | $89,368 |
| New Brunswick (NB) | $53,160 | $32,739 | $0 | $1,712 | $0 | $87,611 | $8,922 | $96,533 |
| Quebec (QC) | $356,942 | $177,602 | $0 | $14,288 | $1,810 | $550,642 | $58,920 | $609,562 |
| Ontario (ON) | $205,724 | $378,026 | $0 | $27,079 | $8,052 | $618,882 | $57,277 | $676,159 |
| Manitoba (MB) | $26,849 | $17,601 | $54 | $19,783 | $64 | $64,351 | $6,079 | $70,430 |
| Saskatchewan (SK) | $28,717 | $9,490 | $0 | $18,349 | $1,145 | $57,700 | $6,022 | $63,722 |
| Alberta (AB) | $88,927 | $68,686 | $0 | $17,127 | $1,582 | $176,324 | $9,594 | $185,918 |
| British Columbia (BC) | $187,010 | $88,016 | $2,882 | $19,377 | -$788 | $296,497 | $20,530 | $317,027 |
| Yukon (YT) | $1,544 | $1,622 | $0 | $1,395 | $0 | $4,562 | $80 | $4,642 |
| Northwest Territories (NT) | $1,693 | $1,375 | $0 | $3,686 | -$370 | $6,383 | $1,450 | $7,833 |
| Nunavut (NU) | $1,595 | $1,408 | $0 | $4,255 | -$1 | $7,258 | $787 | $8,045 |
| National Headquarters (NHQ)3 | $0 | $0 | $0 | $18,518 | -$18,518 | $0 | $0 | $0 |
| Totals by category | $1,070,416 | $878,927 | $2,936 | $150,941 | -$4,453 | $2,095,767 | $191,443 | $2,290,210 |
- Source: Provincial/Territorial Audited Statements
- Notes:
- 1 This table reflects all new services started between April 1, 2024 and March 31, 2025.
- 2 This was referred to as Table 3.4A in last year's report.
- 3 Expenditure figures expressed in thousands of dollars by service. Totals may not add due to rounding.
- 4 Represents Pan-Canadian (ISET) funding for Indigenous organizations that operate nationally rather than within a specific province or territory. A dedicated NHQ row ensures these funds are properly accounted for.
- 5 This adjustment reflects overpayments established, refunds of previous years' expenditures and other accounting adjustments.
- 6 Net Administrative costs include salary and non-salary to administer LMDAs and $11 million for rent.
- 7 The financial totals in the MAR are based on finalized reports provided by PTs. At the time of publication, final audited financial statements for YT and NU had not been received. As such, expenditures for these jurisdictions are based on draft reports or previous-year financial statements.
3.2 Provincial and territorial activities
In this section
- 3.2.1 Newfoundland and Labrador
- 3.2.2 Prince Edward Island
- 3.2.3 Nova Scotia
- 3.2.4 New Brunswick
- 3.2.5 Quebec
- 3.2.6 Ontario
- 3.2.7 Manitoba
- 3.2.8 Saskatchewan
- 3.2.9 Alberta
- 3.2.10 British Columbia
- 3.2.11 Yukon
- 3.2.12 Northwest Territories
- 3.2.13 Nunavut
In 2024-25, Canada’s LMDAs continued to be an essential tool for PTs, enabling them to design and deliver tailored employment programs that address their specific labour market needs. These agreements provide PTs the flexibility to implement tailored solutions that support local workers and employers. Under the LMDAs, PTs deliver programs and services that align with the EBSMs detailed under Part II of the EI Act.
The duty to consult
Article 4 of the International Labour Organization (ILO's) Employment Service Convention (No. 88), established in 1948, is in force for Canada.Footnote 48 This convention applies in the case of EI Part II: stakeholder consultation must be built into the design and delivery of employment services. As the convention states:
- suitable arrangements shall be made through advisory committees for the co-operation of representatives of employers and workers in the organisation and operation of the employment service and in the development of employment service policy
- these arrangements shall provide for 1 or more national advisory committees and where necessary for regional and local committees
- the representatives of employers and workers on these committees shall be appointed in equal numbers after consultation with representative organisations of employers and workers, where such organisations exist
The distinct needs and challenges of each PT are central to the LMDA framework. Each year, PTs carry out consultations with a diverse range of stakeholders-including employers, industry associations, labour unions, community groups, Indigenous organizations, post-secondary institutions, and representatives of Official Language Minority Communities. These dialogues ensure that programs and services remain relevant to local labour market conditions, connect job seekers to meaningful opportunities, and provide businesses with access to skilled talent.
The approaches used for these consultations are as varied as the regions themselves. For example:
- the Government of Quebec uses a formal mechanism (Commission des partenaires du marché du travail) to engage all stakeholders on all Quebec programs at once
- New Brunswick implements Regional Labour Market Partnership Forums in 12 regions across the province
- Northwest Territories tailors its consultation process to each region of the territory via Regional Training Committees
- Alberta meets with stakeholders through ad-hoc roundtables, national advisory committees, and labour market information sessions
These targeted approaches allow PTs to gather crucial feedback and insights that directly inform their LMDA programming, ensuring a responsive and adaptable approach to evolving labour demands. By focusing on increasing labour market participation among underrepresented groups and enhancing employer access to a skilled workforce, PTs contribute to the inclusivity and resilience of Canada's economy.
Through the LMDAs, each PT not only addresses local labour market challenges but also contributes to national economic goals by building a workforce that is skilled, diverse, and ready for the future. The 2024-25 LMDA allocations reflect this commitment, as PTs work to bridge skills gaps, support workforce transitions, and create employment pathways that benefit both individuals and communities. Below are the 2024-25 LMDA allocations:
| Province/Territory | Base funding | Administrative funding | Total funding |
|---|---|---|---|
| Newfoundland and Labrador | $123,544,634 | $8,937,456 | $132,482,090 |
| Prince Edward Island | $22,332,111 | $2,695,332 | $25,027,443 |
| Nova Scotia | $74,738,706 | $10,148,601 | $84,887,307 |
| New Brunswick | $85,899,051 | $8,922,000 | $94,821,051 |
| Quebec | $534,544,015 | $58,920,000 | $593,464,015 |
| Ontario | $583,750,801 | $57,277,082 | $641,027,883 |
| Manitoba | $44,450,496 | $6,079,000 | $50,529,496 |
| Saskatchewan | $38,206,816 | $6,022,000 | $44,228,816 |
| Alberta | $157,613,720 | $9,594,000 | $167,207,720 |
| British Columbia | $275,606,902 | $20,535,000 | $296,141,902 |
| Yukon | $3,166,484 | $389,000 | $3,555,484 |
| Northwest Territories | $3,067,904 | $1,450,000 | $4,517,904 |
| Nunavut | $3,078,360 | $787,000 | $3,865,360 |
| Totals | $1,950,000,000 | $191,756,471 | $2,141,756,471 |
3.2.1 Newfoundland and Labrador
In this section
- Employment Benefits and Support Measures key facts
- Labour market context
- Canada-Newfoundland and Labrador Labour Market Development Agreement
- Designated and under-represented groups
- Stakeholder consultations
- Program delivery and participant supports
Employment Benefits and Support Measures key facts
| Indicator | Active claimant clients | Former claimant clients | PPE clients | Non-insured clients | Total |
|---|---|---|---|---|---|
| Clients served | 3,734 | 2,106 | 227 | 982 | 7,049 |
| Share of total | 53.0% | 29.9% | 3.2% | 13.9% | 100.0% |
- Notes:
- 1 This table reflects all clients served between April 1, 2024, and March 31, 2025.
- 2 This table excludes Indigenous pan-Canadian data.
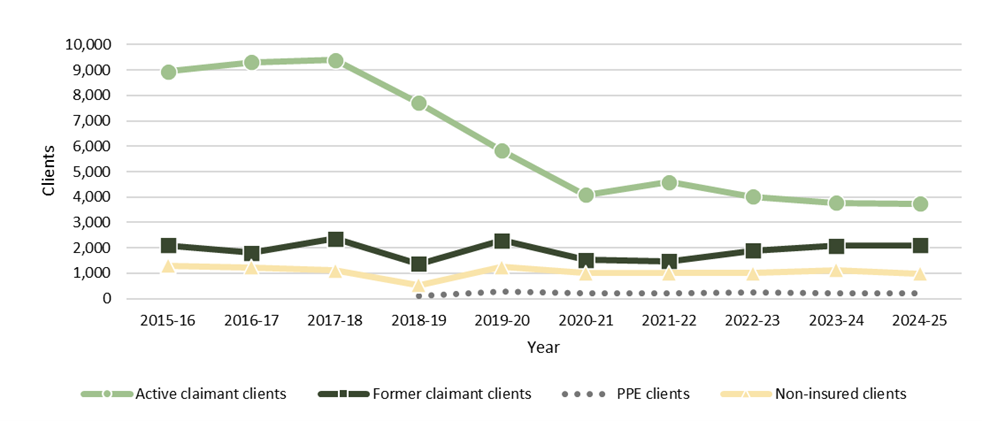
Text description
| Year | Active claimant clients | Former claimant clients | PPE clients | Non-insured clients |
|---|---|---|---|---|
| 2015-16 | 8,941 | 2,095 | n/a | 1,297 |
| 2016-17 | 9,308 | 1,812 | n/a | 1,232 |
| 2017-18 | 9,390 | 2,370 | n/a | 1,107 |
| 2018-19 | 7,716 | 1,371 | 124 | 542 |
| 2019-20 | 5,831 | 2,284 | 281 | 1,253 |
| 2020-21 | 4,090 | 1,526 | 196 | 1,001 |
| 2021-22 | 4,596 | 1,467 | 220 | 1,003 |
| 2022-23 | 4,023 | 1,893 | 237 | 1,009 |
| 2023-24 | 3,775 | 2,082 | 219 | 1,126 |
| 2024-25 | 3,817 | 2,106 | 227 | 982 |
- Notes:
- 1 This chart reflects all clients served between April 1, 2024, and March 31, 2025.
- 2 This chart excludes Indigenous pan-Canadian data.
| Year | Active claimant clients | Former claimant clients | PPE clients | Non-insured clients |
|---|---|---|---|---|
| 2015-16 | 72.5% | 17.0% | n/a | 10.5% |
| 2016-17 | 75.4% | 14.7% | n/a | 10.0% |
| 2017-18 | 73.0% | 18.4% | n/a | 8.6% |
| 2018-19 | 79.1% | 14.1% | 1.3% | 5.6% |
| 2019-20 | 60.4% | 23.7% | 2.9% | 13.0% |
| 2020-21 | 60.0% | 22.4% | 2.9% | 14.7% |
| 2021-22 | 63.1% | 20.1% | 3.0% | 13.8% |
| 2022-23 | 56.2% | 26.4% | 3.3% | 14.1% |
| 2023-24 | 52.4% | 28.9% | 3.0% | 15.6% |
| 2024-25 | 53.0% | 29.9% | 3.2% | 13.9% |
- Notes:
- 1 This table reflects all clients served between April 1, 2024 and March 31, 2025.
- 2 This table excludes Indigenous pan-Canadian data.

Text description
| Year | Youth (15-24 years old) | Core-age (25-54 years old) | Workers aged 55+ | Age undisclosed2 |
|---|---|---|---|---|
| 2015-16 | 1,700 | 4,021 | 676 | 5,936 |
| 2016-17 | 1,545 | 4,216 | 769 | 5,822 |
| 2017-18 | 1,547 | 4,204 | 804 | 6,312 |
| 2018-19 | 1,466 | 3,840 | 832 | 3,615 |
| 2019-20 | 2,196 | 5,445 | 1,126 | 882 |
| 2020-21 | 1,724 | 4,099 | 698 | 292 |
| 2021-22 | 2,015 | 4,338 | 611 | 322 |
| 2022-23 | 1,931 | 4,156 | 824 | 251 |
| 2023-24 | 2,020 | 4,249 | 780 | 153 |
| 2024-25 | 1,840 | 4,298 | 786 | 125 |
- Notes:
- 1 This chart reflects all clients served between April 1, 2024 and March 31, 2025.
- 2 Clients for whom valid dates of birth were not provided are included in the 'Age undisclosed' category.
- 3 This chart excludes Indigenous pan-Canadian data.
- 4 Before 2019-20, NL provided aggregate counts for many of its clients which were not broken out by age, leading to a high number of clients of unknown age.
- 5 Apprentice clients were excluded from the age breakout prior to 2024-25. Starting 2024-25 they are reported under a "known" age unless their date of birth was invalid or missing.
| Year | Youth (15-24 years old) | Core-age (25-54 years old) | Workers aged 55+ | Age undisclosed2 |
|---|---|---|---|---|
| 2015-16 | 13.8% | 32.6% | 5.5% | 48.1% |
| 2016-17 | 12.5% | 34.1% | 6.2% | 47.1% |
| 2017-18 | 12.0% | 32.7% | 6.2% | 49.1% |
| 2018-19 | 15.0% | 39.4% | 8.5% | 37.1% |
| 2019-20 | 22.8% | 56.4% | 11.7% | 9.1% |
| 2020-21 | 25.3% | 60.2% | 10.2% | 4.3% |
| 2021-22 | 27.7% | 59.5% | 8.4% | 4.4% |
| 2022-23 | 27.0% | 58.0% | 11.5% | 3.5% |
| 2023-24 | 28.0% | 59.0% | 10.8% | 2.1% |
| 2024-25 | 26.1% | 61.0% | 11.2% | 1.8% |
- Notes:
- 1 This chart reflects all clients served between April 1, 2024 and March 31, 2025.
- 2 Clients for whom valid dates of birth were not provided are included in the 'Age undisclosed' category.
- 3 This chart excludes Indigenous pan-Canadian data.
- 4 Before 2019-20, NL did not provide aggregate age information for some of its clients leading to high percentages for the "Age undisclosed" age category.
- 5 Apprentice clients were excluded from the age breakout prior to 2024-25. Starting 2024-25 they are reported under a "known" age unless their date of birth was invalid or missing.
| Service type | Services delivered | Year-over-year change | Share of total | Year-over-year change (p.p.) |
|---|---|---|---|---|
| Employment Benefits | 5,070 | -17.8% | 30.1% | -3.7 |
| Support Measures | 11,799 | -2.4% | 69.9% | +3.7 |
| Total services | 16,869 | -7.6% | 100.0% | n/a |
- Notes:
- 1 This table reflects all new services started between April 1, 2024 and March 31, 2025.
- 2 This table excludes Indigenous pan-Canadian data.
| Service type | Services | Year-over-year change | Expenditures | Year-over-year change |
|---|---|---|---|---|
| Targeted Wage Subsidies | 791 | +13.6% | $8,116,171 | -15.5% |
| Self-Employment | 146 | -14.6% | $3,688,821 | -34.2% |
| Job Creation Partnerships | 685 | -14.1% | $6,806,614 | -12.5% |
| Skills Development-Regular | 2,178 | -33.7% | $54,283,035 | -5.6% |
| Skills Development-Apprentices | 1,270 | +4.0% | Included above | Included above |
| Targeted Earning Supplements | n/a | n/a | n/a | n/a |
| Totals Employment Benefits | 5,070 | -17.8% | $72,894,641 | -9.5% |
| Employment Services | 6,238 | +4.5% | $8,312,834 | -32.5% |
| Individual Counselling | 5,561 | -9.2% | Included above | Included above |
| Labour Market Partnerships | n/a | n/a | $28,805,043 | +48.5% |
| Research & Innovation | n/a | n/a | $13,532,116 | -46.3% |
| Total Support Measure | 11,799 | -2.4% | $50,649,993 | -11.0% |
| Total EBSMs | 16,869 | -7.6% | $123,544,634 | -10.1% |
- Notes:
- 1 This table reflects all new services started between April 1, 2024 and March 31, 2025.
- 2 This table excludes Indigenous pan-Canadian data.

Text description
| Year | Unpaid EI benefits | EI-insured clients - returns to employment3 | Non-insured clients - returns to employment | Active claimantclients served | Total clients served4 |
|---|---|---|---|---|---|
| 2015-16 | $22,251,760 | 3,306 | 84 | 8,941 | 12,333 |
| 2016-17 | $23,234,836 | 3,696 | 146 | 9,308 | 12,352 |
| 2017-18 | $17,468,413 | 2,795 | 139 | 9,390 | 12,867 |
| 2018-19 | $16,161,345 | 3,055 | 157 | 7,716 | 9,753 |
| 2019-20 | $16,744,493 | 2,990 | 133 | 5,831 | 9,649 |
| 2020-21 | $9,698,804 | 1,536 | 77 | 4,090 | 6,813 |
| 2021-22 | $23,563,713 | 3,002 | 109 | 4,596 | 7,286 |
| 2022-23 | $16,693,473 | 2,179 | 95 | 4,023 | 7,162 |
| 2023-24 | $15,606,524 | 1,770 | 108 | 3,775 | 7,202 |
| 2024-25 | $16,108,291 | 1,889 | 107 | 3,734 | 7,049 |
- Notes:
- 1 This chart excludes Indigenous pan-Canadian data.
- 2 Volatility in the Unpaid EI Benefits from 2021‑22 to 2022‑23 correlates with the speed of recovery of the labour market that allowed many Canadians to return to work before exhausting their EI benefits.
- 3 The EI-insured return to employment returns includes active claimants, former claimants, and PPE clients
- 4 "Total Clients Served" refers to the count of EI-insured clients served (active claimant clients, former claimant clients, and PPE clients) and non-insured clients.
- 5 Historical data has been adjusted to enhance accuracy.
Labour market context
Both the Government of Newfoundland and Labrador's Department of Finance and the Conference Board of Canada (CBOC) have provided recent outlooks into Newfoundland and Labrador's economy and labour market.Footnote 49Footnote 50 The majority of data and trends presented below are taken from these sources, unless otherwise noted.
In 2025, Newfoundland and Labrador has continued to experience a strong economy, with positive GDP growth forecasted for the year by the Department of Finance (up to 4.4. per cent). Unlike previous years, this year's economic profile has been more heavily affected by factors such as market prices, political impacts (e.g., the Ukraine war and fertilizer prices), and most notably tariffs. This has created heightened economic uncertainty across Canada which is also being felt in Newfoundland and Labrador. As a result, annual provincial employment for 2025 is expected to increase only slightly from the previous year (CBOC) or even decrease (Department of Finance), with most of the increase likely occurring during the earlier months of 2025 (and further contraction expected during the second half). Outlooks are expected to vary by industry, with most industries projected to see an employment decline in 2025, except for agriculture, construction, wholesale trade, and retail trade. Further factors impacting the current and future labour market include the following:
- demographic shifts (such as a decreasing population coupled with an aging population) are expected to become more impactful on the economy and labour market in the months leading up to 2026 and beyond. For example, a shrinking population and rising retirements will potentially contract the labour force, lowering unemployment over the longer term but also increasing the competition for workers. The partial contraction of employment in the later months of 2025 is expected to be followed by a further weakening of the job market in 2026 due to these less positive demographic prospects
- Newfoundland and Labrador's unemployment rate has remained relatively stable, consistently hovering around 10% in recent years. The rate was 9.9% in 2023 and edged up only slightly to 10.0% in 2024. The most recent year-to-date data for January to September 2025 shows a similar pattern, with the provincial rate averaging 10.2%
- on the other hand, Canada's national unemployment rate was 6.3% in 2024 and 5.4% in 2023.Footnote 51 The year-to-date unemployment rate nationally is also higher than last year (at 7.0 per cent). In other words, both geographies are showing a similar trend of higher unemployment over these time periods, with the rate increase currently less severe for Newfoundland and Labrador than for Canada
- furthermore, youth unemployment has become a growing issue both provincially and nationally, but again to different degrees over different time periods. Canada's youth's unemployment rate increased substantially between 2023 and 2024, from 10.7 per cent to 13.1 percent (with the year-to-date average for January to September 2025 even higher at 14.3 per cent).Footnote 52 In contrast, the unemployment rate for Newfoundland and Labrador youth decreased slightly from 2023 to 2024 (from 14.6 per cent to 14.2 per cent). The current YTD rate for this group is noticeably higher at 16.7 per cent, although this is more due to very high unemployment rates in the early months of 2025; with the rates between July and August actually being lower than for the same months in 2024. It remains to be seen if the challenge of provincial youth unemployment will become as prominent an issue in the months ahead as for Canadian youth overall
- despite these less positive labour market indicators over the short term, Newfoundland and Labrador has potential for much stronger economic growth over the longer term. Among other positives, the province's exports are growing in areas such as oil, seafood, and tourism, as well as service exports. Future major projects could also help create an economic boom in the province. Added to this, the province is investing in new areas of emerging sectors such as renewable energy as well as greater investment in a number of affordable housing projects
At the same time, it is likely that skills mismatches in various occupations, industries and regions will continue to occur. Supporting this notion, in July 2025, the province had 3,760 job vacanciesFootnote 53 compared to 25,000 individuals who were unemployed.Footnote 54 Meaning, even with a large number of unemployed individuals looking for work in the province, vacancies in that summer month remained high.
In summary, the most prominent factors impacting the provincial economy are: economic and political factors such as tariffs; changes in labour market size and focus associated with a decreasing/aging population; greater challenges in obtaining employment (especially among the younger age group); increased labour market requirements to strengthen the province's new and emerging industries; and skill mismatches that could be occurring.
Due to these challenges, the need for training supports remains strong, particularly in the following areas:
- ensuring workers are available to meet labour market requirements in the industries where they are needed, especially given the increased demand for some services associated with an aging population as well as a decrease in the provincial labour supply due to the retirements of this older population
- ensuring workers have access to skills development and training which will allow them to meet needs in emerging sectors, as well as emerging areas of specialization within existing industries
- supplying workers and employers with the foundational skills necessary to innovate inside of the province's existing industries, as well as in new industries
- preparing workers and businesses to be more responsive to sudden changes in the economy and labour market (e.g., to better address/alleviate the negative impacts of factors such as tariffs). This could include addressing skill mismatches in specific areas and regions and adapting industry goods and production in ways that alleviate tariff impacts
- encouraging enhanced access to up-to-date labour market information to help inform and shape future supports (e.g., micro-credentials and other flexible training opportunities to meet new skills demands as they arise)
Canada-Newfoundland and Labrador Labour Market Development Agreement
In 2024-25, Newfoundland and Labrador received approximately $132 million through its LMDA with Canada, supporting programs and services that address the province's labour market challenges. Approximately 7,000 clients were served and, within 6 months of receiving training and employment supports, approximately 42.1% of active claimant clients had secured employment, spurring an estimated $16.1 million in unpaid EI benefits.
The LMDA continued to serve as the primary funding mechanism in Newfoundland and Labrador to enhance skills, support employment, assist employers in finding qualified workers, and increase labour market participation among underrepresented groups. Through a broad range of programs and services, the LMDA has consistently delivered positive outcomes for diverse groups of clients, employers, and communities. These investments supported economic growth, educational advancement, job creation and overall economic development in Newfoundland and Labrador
In 2024-25, the LMDA funded the delivery of the following programs:
- Wage Subsidies
- Job Creation Partnerships
- Self-employment Assistance
- Skills Development
- Employment Assistance Services
- Labour Market Partnerships
- Research and Innovation
The Skills Development program, a key program under the LMDA, provided financial assistance to EI-insured clients, helping them gain the skills needed for employment. By covering training costs beyond tuition fees, the program ensured greater accessibility and affordability for clients, removing financial barriers for clients.
In 2024-25, an investment of $46,555,714 was allocated to the Skills Development program, which included providing 1,801 clients with access to post-secondary training. This strategic funding not only enhanced participants' skills but also improved their employability in a competitive labour market.
Additionally, Newfoundland and Labrador in collaboration with community organizations, delivered the Supported Employment program to develop employment opportunities for individuals with developmental disabilities. This program provides tailored support to allow eligible individuals to participate in integrated community employment. Services range from job orientation and analysis to full-time assistance from job trainers, providing clients with the support they need to meet job requirements and succeed in their roles.
In 2024-25, an investment of $1,598,131 provided essential job support for individuals with developmental disabilities. As a result, 1,273 individuals participated in the program, with 174 successfully securing employment, showcasing the program's impact in promoting workforce inclusion and empowering individuals with intellectual disabilities to thrive in the job market.
Designated and under-represented groups
Newfoundland and Labrador continued its commitment to addressing labour market challenges by focusing on supporting designated and under-represented groups, including persons with disabilities, youth, Indigenous peoples, and women. In 2024-25, LMDA funding was allocated towards initiatives aimed at reducing barriers to employment and providing tailored training and work opportunities tailored for these groups.
Women in Resource Development Corporation (WRDC) received LMDA funding to deliver consultation services and customized training solutions aimed at fostering equitable and inclusive recruitment and retention practices among employers. This initiative was designed to support organizations in building more diverse and inclusive workplaces through targeted engagement and capacity-building activities.
The project encompassed a range of strategic actions, including employer-focused information and training sessions, workplace assessments, participation in job fairs, professional development workshops, and collaboration with industry, education, and community stakeholders. These efforts were instrumental in promoting inclusive hiring practices and enhancing organizational awareness of equity-related issues. All project deliverables were successfully achieved, including stakeholder engagement sessions and employer interviews. This initiative contributed meaningfully to advancing inclusive workforce development across the province. A total of $441,400 was approved for this project with $321,592 expended in 2024-25.
Additionally, The John Howard Society of Newfoundland and Labrador (JHS-NL) received funding for its Pathways Initiative; a program designed to address skilled labour shortages in the province while reducing employment barriers for individuals with prior involvement in the criminal justice system. The initiative provides targeted training, certifications, and job placements to improve participants' employability and reduce recidivism. Using a 2‑phased approach, phase 1 focuses on data collection and employer engagement, with research questions now developed for stakeholders and individuals with lived experience. Phase 2, which will deliver training and job placements with ongoing JHS‑NL support, remains on schedule to launch in September 2025. During the 2024-25 fiscal year, $363,102 was spent from the total project budget of $605,171. The initiative is scheduled to conclude in April 2028.
Stakeholder consultations
In 2024-25, Newfoundland and Labrador continued to engage industry, labour, community, and education stakeholders to ensure programs and services remained effective, relevant, and responsive to evolving labour market needs. Alongside formal consultations, the province gathered ongoing feedback from Employment Centre staff and affiliated community partners to inform future program design.
The Newfoundland and Labrador Workforce Innovation Centre (NLWIC) played a pivotal role in these efforts by hosting engagement sessions with underrepresented groups such as Indigenous peoples, persons with disabilities, youth, older workers, women, and newcomers. These sessions provided a platform to explore labour market challenges and opportunities, with findings directly informing program and policy development.
Key themes included the importance of fostering collaboration and partnerships, improved access to labour market information, and targeted skills development and mentorship. Stakeholders also emphasized immigration and talent attraction, foreign credential recognition, readiness for emerging sectors and advanced technologies, and the need for inclusive and diverse workplaces.
As the nature of work continues to evolve, sustained collaboration with partners will remain essential in supporting the province address current and future labour market challenges while fostering long-term economic growth.
The Office to Advance Women Apprentices
The Office to Advance Women Apprentices launched a 3-year initiative to research, develop, and implement an all-female construction and renovation crew, structured as a social enterprise or cooperative model. The initiative is designed to reflect the apprenticeship framework, enabling women to work toward achieving their Red Seal certification by accumulating required work hours and obtaining logbook skill verification from certified Journeypersons.
This project aims to support female apprentices in securing their first and often most challenging employment opportunity in the skilled trades. The goal is to advance 12 female apprentices through 2 cohorts of 6 participants each, focusing on carpentry, plumbing, and electrical trades, and supporting them through one to two apprenticeship blocks. The construction enterprise will prioritize service delivery to vulnerable populations, including women living independently, survivors of domestic violence, seniors, elderly individuals with limited mobility, and persons with disabilities. Funding was expended toward the initiative in fiscal year 2024-25. The project is scheduled to conclude in March 2028, with a total of $3,540,068 approved for the duration of the initiative.
Program delivery and participant supports
This section provides an overview of the specific programs and financial supports available under the LMDA. It includes specific details on the programs and initiatives available, their duration, their associated funding, and how clients are supported.
Skills Development
Program: Skills Development
Expenditures: $46,555,714 (36.3%)
Description: Assists EI-insured clients to develop essential skills needed for employment, ranging from basic to advanced skills through direct support to the individual. Funding covers costs paid to publicly funded training institutions beyond tuition recovery.
Target client groups: EI-Insured clients
Benefits and expected results: 1,801 clients received funding for post-secondary training.
Program: Adult Basic Education (ABE) supports
Expenditures: $2,084,164 (1.6%)
Description: Provides support for EI-eligible clients to participate in ABE or General Educational Development (GED) preparation. Program targets EI-eligible clients. Tuition for some clients was paid directly by the Department of Education to ABE service providers, and individual supports were paid under the Skills Development Employment Benefit.
Target client groups: EI-Insured clients
Benefits and expected results: 558 clients received benefits enabling participation and progress towards post-secondary training
Program: Apprenticeship Supports
Expenditures: $1,384,073 in supports to apprentices (1.1%) and $5,417,439 in tuition costs (4.2%)
Description: Provides financial assistance to apprentices, directed by Newfoundland and Labrador to attend full-time, in-school apprenticeship training. Assistance includes living allowance, dependent care, and travel costs.
Tuition costs were issued directly to training institutions by the Apprenticeship and Trades Certification Division.
Target client groups: EI-Insured clients
Benefits and expected results: 1,268 apprentices benefitted, progressing toward journeyperson certification
Program: Educational Assessments
Expenditures: $37,750 (0.03%)
Description: An educational assessment helps identify strengths and areas for improvement in academic and cognitive functioning. It can reveal learning disabilities, intellectual disabilities, or giftedness. This type of assessment is particularly valuable for individuals facing academic or workplace learning challenges, as it provides a deeper understanding of the underlying causes and supports effective employment planning.
Target client groups: EI-Insured clients
Benefits and expected results:15 clients received funding for educational assessments
Program: Job Creation Partnerships Program (JCP)
Expenditures: $6,741,739 (5.2%)
Description: Provides EI-insured clients with meaningful work experience to improve their employment prospects. While project activities offer benefits to both the participant and the community, the primary focus is on helping insured clients gain the work experience needed to secure lasting employment. Through JCP, clients will maintain or enhance their employability skills in a practical setting. EI-Eligible participants may receive a living allowance and sponsors may qualify for assistance with project overhead cost.
Target client groups: EI-Insured clients
Benefits and expected results: 725 individual clients received funding to participate in 173 JCP projects
Wage subsidies
Program: Supported Employment program
Expenditures: $1,598,131 (1.2%)
Description: Delivered in partnership with community organizations, this program creates meaningful employment opportunities for individuals with intellectual disability. It offers tailored support to allow eligible individuals to participate in meaningful, integrated employment within the community.
The program provides a range of supports, from orientation and job analysis to full-time assistance from a job trainer, ensuring that the clients successfully meet workplace exceptions and employer satisfaction.
Target client groups: EI-Insured clients
Benefits and expected results: 1,273 individuals participated; 174 successfully gained meaningful employment
Program: Wage Subsidy Community Coordinator
Expenditures: $597,082 (0.5%)
Description: Receives contribution to encourage employers to hire female apprentices by offering wage subsidies to provide work experience that supports progression towards journeyperson status. The program targets EI-eligible women apprentices.
Target client groups: EI-Insured clients
Benefits and expected results: 21 placements were secured for clients by the Office to Advance Women Apprentices, supporting women apprentices in non-traditional occupations
Program: Jobs NL Wage Subsidy
Expenditures: $2,993,607 (2.3%)
Description: Connects employers and employees together by providing wage subsides for sustainable long-term employment or seasonal employment.
Two streams were offered:
- Jobs NL - 42: Provides a wage subsidy over 28 weeks within a 42-week period of employment period:
- first 14 weeks: 60.0% subsidy, up to $12/ hour
- second 14 weeks: no subsidy
- third 14 weeks: 80.0% subsidy, up to $12/hour
- Jobs N - 28: Provides a wage subsidy for a period of 10 to 28 weeks; supporting seasonal or short-term employment with a 60.0% subsidy, up to $12/hour.
Target client groups: EI-Insured clients
Benefits and expected results: 480 clients' work experience
Program: Apprentice Wage Subsidy (AWS) program
Expenditures: $2,883,904 (2.2%)
Description: Assists apprentices in gaining work experience in a skilled trade and progressing towards journeyperson certification. Employers hiring apprentices receive a 75.0% wage subsidy, up to $14/hour, which is paid directly to the employer.
Target client groups: EI-Insured clients
Benefits and expected results: 319 apprentices acquired work experience towards journeyperson certification.
Program: Employment Enhancement program
Expenditures: $43,447 (0.03%)
Description: Supports employers in secondary processing sectors (forestry, aquaculture, agriculture, and fishing) by providing funding to create sustainable, long-term employment or seasonal employment opportunities and a training allowance for new employees.
Target client groups: EI-Insured clients
Benefits and expected results: 7 individuals gained work experience with 1 participating employer.
Self-employment assistance
Program: Community Coordinator/Self employment assistance
Expenditures: $996,777 to 17 organizations (0.8%) and $2,692,045 to 220 individuals (2.1%)
Description: Provides funding to organizations to assist eligible unemployed clients with starting entrepreneurial training, general information sessions, and business plan development.
Target client groups: EI-Insured clients
Benefits and expected results: 17 organizations were provided with funding under this activity and 220 individuals participated.
Labour Market Partnerships
Program: Labour market integration for newcomers
Expenditures: $6,713,589 (5.2%)
Description: Provides funding to organizations for pilot initiatives aimed at helping unemployed newcomers integrate into the workforce. These initiatives enable service-providing organizations, groups and communities to develop and/or deliver programs that expedites newcomers' entry into the labour market, support advancement in their professional fields, and promote career progression.
Target client groups: EI-Insured clients
Benefits and expected results: 20 projects were supported with 20 different organizations
Program: Labour Market Partnerships
Expenditures: $28,295,886 (22.1%)
Description: Supports employers, employer or employee associations, community groups and communities in developing and implement labour market strategies and activities to address labour force adjustments and meet human resource requirements. These partnerships focus on identifying labour market challenges, helping employed individuals at risk of job loss and fostering a positive outcome through collaborative initiatives. These initiatives address the employment needs of persons with disabilities, newcomers, Indigenous peoples, and needs of specific labour market sector such as: agriculture, petroleum, healthcare, skilled trades, early childhood education, environment, fisheries and aquaculture, tourism and hospitality, and information technology.
Target client groups: EI-Insured clients
Benefits and expected results: 77 projects received support under this program activity with 58 different organizations supported.
Employment Assistance Services
Program: Employment Assistance Services (EAS) program
Expenditures: $8,312,834 (6.4%)
Description: Provides funding to organizations to offer Employment Assistance Services (EAS) to unemployed or underemployed individuals in individual or in a group setting.
Key services include self-serve employment resources, needs assessments, development of employment plans, case management, employment counselling, and workshops on topics such as job search, resume writing, and transitional employment support.
Target client groups: EI-Insured clients
Benefits and expected results: 27 agreements were funded, resulting in over 16,747 services provided to clients.
Research and Innovation
Program: Research and Innovation
Expenditures: $13,532,116 (10.6%)
Description: Provides funding support for research and innovative projects that explore and identify better ways of helping individuals prepare for and attach to the labour market as productive employees.
Target client groups: Research institutions
Benefits and expected results: One key outcome of the Research and Innovation program is the micro-credential pilot, which helps individuals gain industry-recognized skills while working. This initiative addresses labour market gaps, supports under-represented groups, and creates pathways to higher-paying, sustainable employment.
3.2.2 Prince Edward Island
In this section
- Employment Benefits and Support Measures key facts
- Labour market context
- Canada-Newfoundland and Labrador Labour Market Development Agreement
- Designated and under-represented groups
- Stakeholder consultations
- Program delivery and participant supports
Employment Benefits and Support Measures key facts
| Indicator | Active claimant clients | Former claimant clients | PPE clients | Non-insured clients | Total |
|---|---|---|---|---|---|
| Clients served | 3,030 | 1,115 | 265 | 1,243 | 5,653 |
| Share of total | 53.6% | 19.7% | 4.7% | 22.0% | 100.0% |
- Notes:
- 1 This table reflects all clients served between April 1, 2024 and March 31, 2025.
- 2 This table excludes Indigenous pan-Canadian data.

Text description
| Year | Active claimant clients | Former claimant clients | PPE clients | Non-insured clients |
|---|---|---|---|---|
| 2015-16 | 2,876 | 657 | n/a | 1,681 |
| 2016-17 | 2,798 | 709 | n/a | 1,893 |
| 2017-18 | 3,487 | 784 | n/a | 1,852 |
| 2018-19 | 3,624 | 712 | 438 | 1,595 |
| 2019-20 | 3,293 | 739 | 421 | 1,408 |
| 2020-21 | 3,354 | 552 | 243 | 864 |
| 2021-22 | 3,807 | 752 | 231 | 843 |
| 2022-23 | 3,717 | 955 | 286 | 974 |
| 2023-24 | 3,316 | 1,186 | 275 | 1,301 |
| 2024-25 | 3,030 | 1,115 | 265 | 1,243 |
- Notes:
- 1 This chart reflects all clients served between April 1, 2024 and March 31, 2025.
- 2 This chart excludes Indigenous pan-Canadian data.
| Year | Active claimant clients | Former claimant clients | PPE clients | Non-insured clients |
|---|---|---|---|---|
| 2015-16 | 55.2% | 12.6% | n/a | 32.2% |
| 2016-17 | 51.8% | 13.1% | n/a | 35.1% |
| 2017-18 | 56.9% | 12.6% | n/a | 30.2% |
| 2018-19 | 56.9% | 11.2% | 6.9% | 25.0% |
| 2019-20 | 56.2% | 12.6% | 7.2% | 24.0% |
| 2020-21 | 66.9% | 11.0% | 4.8% | 17.2% |
| 2021-22 | 67.6% | 13.3% | 4.1% | 15.0% |
| 2022-23 | 62.7% | 16.1% | 4.8% | 16.4% |
| 2023-24 | 54.6% | 19.5% | 4.5% | 21.4% |
| 2024-25 | 53.6% | 19.7% | 4.7% | 22.0% |
- Notes:
- 1 This table reflects all clients served between April 1, 2024 and March 31, 2025.
- 2 This table excludes Indigenous pan-Canadian data.
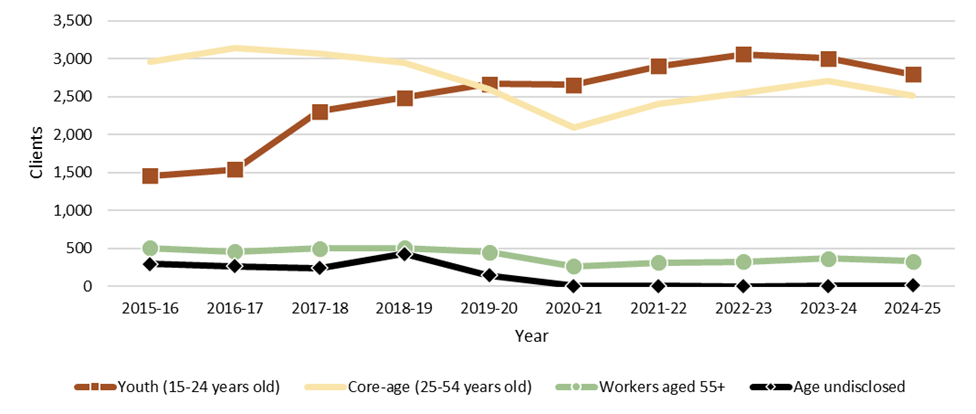
Text description
| Year | Youth (15-24 years old) | Core-age (25-54 years old) | Workers aged 55+ | Age undisclosed2 |
|---|---|---|---|---|
| 2015-16 | 1,456 | 2,954 | 508 | 296 |
| 2016-17 | 1,542 | 3,137 | 458 | 263 |
| 2017-18 | 2,309 | 3,072 | 499 | 243 |
| 2018-19 | 2,488 | 2,943 | 507 | 431 |
| 2019-20 | 2,665 | 2,600 | 452 | 144 |
| 2020-21 | 2,654 | 2,087 | 266 | 6 |
| 2021-22 | 2,903 | 2,410 | 316 | 4 |
| 2022-23 | 3,056 | 2,553 | 323 | 0 |
| 2023-24 | 3,003 | 2,702 | 369 | 4 |
| 2024-25 | 2,794 | 2,517 | 332 | 10 |
- Notes:
- 1 This chart reflects all clients served between April 1, 2024 and March 31, 2025.
- 2 Clients for whom valid dates of birth were not t provided are included in the 'Age undisclosed' category.
- 3 This chart excludes Indigenous pan-Canadian data.
- 4 Apprentice clients were excluded from the age breakout prior to 2024-25. Starting 2024-25 they are reported under a "known" age unless their date of birth was invalid or missing.
| Year | Youth (15-24 years old) | Core-age (25-54 years old) | Workers aged 55+ | Age undisclosed2 |
|---|---|---|---|---|
| 2015-16 | 27.9% | 56.7% | 9.7% | 5.7% |
| 2016-17 | 28.6% | 58.1% | 8.5% | 4.9% |
| 2017-18 | 37.7% | 50.2% | 8.1% | 4.0% |
| 2018-19 | 39.1% | 46.2% | 8.0% | 6.8% |
| 2019-20 | 45.5% | 44.4% | 7.7% | 2.5% |
| 2020-21 | 52.9% | 41.6% | 5.3% | 0.1% |
| 2021-22 | 51.5% | 42.8% | 5.6% | 0.1% |
| 2022-23 | 51.5% | 43.0% | 5.4% | 0.0% |
| 2023-24 | 49.4% | 44.5% | 6.1% | 0.1% |
| 2024-25 | 49.4% | 44.5% | 5.9% | 0.2% |
- Notes:
- 1 This table reflects all clients served between April 1, 2024 and March 31, 2025.
- 2 Clients for whom valid dates of birth were not provided are included in the 'Age undisclosed' category.
- 3 This table excludes Indigenous pan-Canadian data.
- 4 Apprentice clients were excluded from the age breakout prior to 2024-25. Starting 2024-25 they are reported under a "known" age whenever a valid date of birth was provided.
| Service type | Services delivered | Year-over-year change | Share of total | Year-over-year change (p.p.) |
|---|---|---|---|---|
| Employment Benefits | 3,320 | -6.9% | 29.1% | -1.1 |
| Support Measure | 8,092 | -2.0% | 70.9% | +1.1 |
| Total services | 11,412 | -3.5% | 100.0% | n/a |
- Notes:
- 1 This table reflects all new services started between April 1, 2024 and March 31, 2025.
- 2 This table excludes Indigenous pan-Canadian data.
| Service type | Services | Year-over-year change | Expenditures | Year-over-year change |
|---|---|---|---|---|
| Targeted Wage Subsidies | 265 | -27.4% | $3,594,593 | +7.7% |
| Self-Employment | 84 | -19.2% | $1,252,495 | -15.9% |
| Job Creation Partnerships | 16 | 0.0% | $326,700 | +39.8% |
| Skills Development-Regular | 2,444 | -5.2% | $12,393,812 | -13.9% |
| Skills Development-Apprentices | 511 | +1.6% | Included above | Included above |
| Targeted Earning Supplements | n/a | n/a | n/a | n/a |
| Totals Employment Benefits | 3,320 | -6.9% | $17,567,600 | -9.7% |
| Employment Services | 6,621 | -2.3% | $3,982,170 | -21.2% |
| Individual Counselling | 1,471 | -0.9% | Included above | Included above |
| Labour Market Partnerships | n/a | n/a | $782,341 | -51.0% |
| Research & Innovation | n/a | n/a | n/a | n/a |
| Total Support Measure | 8,092 | -2.0% | $4,764,511 | -28.4% |
| Total EBSMs | 11,412 | -3.5% | $22,332,111 | -14.4% |
- Notes:
- 1 This table reflects all new services started between April 1, 2024 and March 31, 2025.
- 2 This table excludes Indigenous pan-Canadian data.
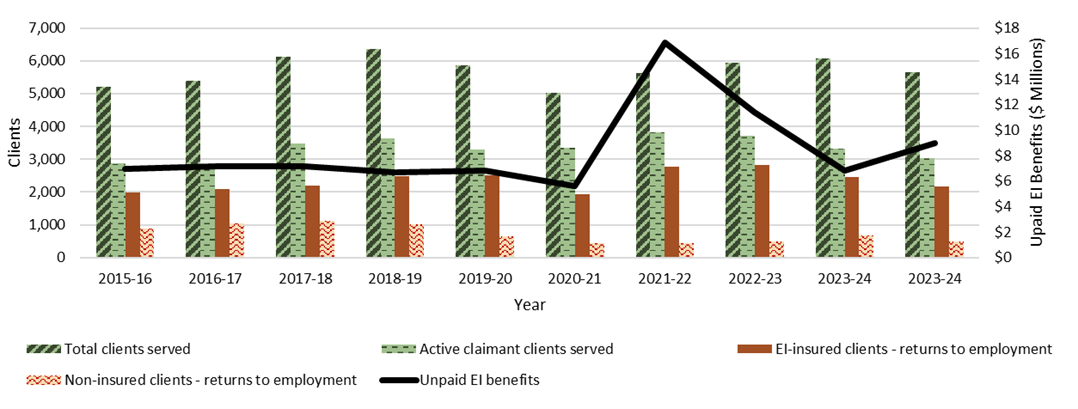
Text description
| Year | Unpaid EI benefits | EI-insured clients - returns to employment3 | Non-insured clients - returns to employment | Active claimantclients served | Total clients served4 |
|---|---|---|---|---|---|
| 2015-16 | $6,986,476 | 1,997 | 872 | 2,876 | 5,214 |
| 2016-17 | $7,144,450 | 2,081 | 1,048 | 2,798 | 5,400 |
| 2017-18 | $7,125,047 | 2,202 | 1,109 | 3,487 | 6,123 |
| 2018-19 | $6,662,407 | 2,470 | 1,023 | 3,624 | 6,369 |
| 2019-20 | $6,816,141 | 2,508 | 660 | 3,293 | 5,861 |
| 2020-21 | $5,594,866 | 1,920 | 446 | 3,354 | 5,013 |
| 2021-22 | $16,837,056 | 2,782 | 430 | 3,807 | 5,633 |
| 2022-23 | $11,399,293 | 2,815 | 489 | 3,717 | 5,932 |
| 2023-24 | $6,823,130 | 2,463 | 671 | 3,316 | 6,078 |
| 2024-25 | $8,978,024 | 2,179 | 498 | 3,030 | 5,653 |
- Notes:
- 1 This chart excludes Indigenous pan-Canadian data.
- 2 Volatility in the Unpaid EI Benefits from 2021‑22 to 2022‑23 correlates with the speed of recovery of the labour market that allowed many Canadians to return to work before exhausting their EI benefits.
- 3 The EI-insured return to employment returns includes active claimants, former claimants, and PPE clients
- 4 "Total Clients Served" refers to the count of EI-insured clients served (active claimant clients, former claimant clients, and PPE clients) and non-insured clients.
- 5 Historical data has been adjusted to enhance accuracy.
Labour market context
In 2024-25, Prince Edward Island's economy continued to show strength, supported by solid growth in employment and wages, a rebound in construction and housing activity, and sustained momentum in manufacturing, exports, and tourism.
The province's population continued to grow, reaching approximately 179,000 as of July 1, 2024. While Prince Edward Island's population is aging, the arrival of younger immigrants and non-permanent residents has helped offset demographic pressure and contributed to a more diverse and active workforce.
Employment continued to grow in 2024, up 3.6 percent to reach 92,500 people. This was the fastest growth among the provinces. The labour force also continued to grow, up 4.4 percent, averaging 100,400 people in 2024, a new all-time high. Nationally, employment grew by 1.9 percent.Footnote 55
The unemployment rate in Prince Edward Island was 8.0% in 2024, up from 7.2% in the previous year.Footnote 56 In comparison, Canada's unemployment rate in 2024 was 6.3%, slightly higher than 5.4% in 2023.Footnote 57
To support sustainable growth, the province launched a Population Framework in early 2024, identifying key priorities such as infrastructure expansion, workforce retention, and long-term planning. Labour market programming remained focused on ensuring that Islanders, including those affected by economic shifts such as U.S tariffs, have access to supports they need to remain attached to the workforce and avoid layoffs where possible.
Canada-Prince Edward Island Labour Market Development Agreement
In 2024-25, Prince Edward Island received approximately $25.0 millionFootnote 58 though the LMDA. The funding served approximately 5,600 clients, including 3,000 being active claimant clients. Within 6 months of receiving training and employment supports, 48.5% of active claimant clients were employed, contributing to an estimated $8.9 million in savings from unpaid EI benefits.
The Canada-Prince Edward Island LMDA supports the following provincial priorities:
- developing a skilled workforce
- preparing the future workforce
- enhancing services for job seekers
Programs delivered under the Canada-Prince Edward Island LMDA in 2024-25 include:
- Employment Assistance Services
- Labour Market Partnerships
- Skills Development
- Employer supported programs
- Work experience
- Entrepreneurship
- Skills Development and Employment Supports - Accessibility supports
SkillsPEI continued to invest in the Skills Development program, which supported adult education, post-secondary training, apprenticeship, and industry-specific initiatives. Individuals were referred by employment counsellors to develop marketable skills aligned with current and emerging labour market needs. In 2024-25, the program expanded its focus on short-term, group-based training and upskilling initiatives in priority sectors such as healthcare, construction, and early childhood education. In 2024-25, 444 individuals participated in these training programs, enhancing their employment prospects.
In Prince Edward Island, Employer Supported Programs (which includes Employ PEI & Graduate Mentorship Program) help employers hire unemployed individuals and recent graduates. These programs provided participants with valuable mentorship and on-the-job work experience, helping them transition into full-time employment. The programs also supported experiential learning opportunities aligned with participants' fields of study and contributed to workforce retention, particularly among youth and newcomers. In 2024-25, 455 individuals participated in the program.
Designated and under-represented groups
Prince Edward Island continued to prioritize inclusive workforce development in 2024-25, with a strong focus on supporting designated and underrepresented groups. The province worked closely with stakeholders such as the Supported Employment Network, the Access Ability Supports Advisory Council, and Indigenous partners to ensure programs were responsive to the unique needs of these populations.
Through the Etl-lukwey agreement signed with the Mi'kmaq Confederacy of PEI, Indigenous participants received mentorship from skilled tradespeople and industry experts, along with classroom-based programming focused on career planning and personal development. These efforts contributed to capacity building and improved access to employment pathways in sectors such as construction, aquaculture, and tourism.
In addition, the Department of Workforce, Advanced Learning and Population and the Department of Social Development and Seniors, established a Workforce Integration Committee to explore opportunities for innovative programming to support vulnerable populations transition to the workforce.
The Workforce Integration Committee continues to advance a modernized system focused on improving client access to employment supports including comprehensive case management, connections to pre-employment services, training and skills development, job creation placements, and job matching. Through this process, the Committee will continue work with provincial partners to support individuals accessing social programming overcome barriers to employment and achieve greater independence.
Stakeholder consultations
Prince Edward Island continued to engage stakeholders across the province to align labour market programming with workforce needs. The Department of Workforce, Advance Learning and Population held roundtable discussions with industry associations, sector councils, post-secondary institutions, employment services providers, and representatives from Indigenous and official language minority communities.
Key themes emerging from consultations included:
- persistent labour shortages in sectors such as construction, healthcare, bioscience, and early childhood education
- the need for mentorship and workplace training programs to support workforce development
- the impact of federal immigration policy changes on labour availability
- the importance of flexible, responsive programming to meet the needs of seasonal industries and rural communities
The province also hosted targeted engagement sessions with the trucking sector as part of Prince Edward Island's commitment to introduce mandatory entry-level training (MELT) requirements for individuals seeking a commercial Class 1 driver's license for the first time.
Respite Care Professional: Working with Children and Adults with Complex Learning Needs (Microcredential)
The demand for respite care continues to grow as more family members leave the workforce to become full-time caregivers for their loved ones. Respite care offers unpaid caregivers short-term and time-limited breaks to support and maintain the primary caregiving relationship. These breaks also provide a positive experience for individuals with complex needs. It promotes inclusion, encourages community participation and nourishes social health and connectivity.
In Prince Edward Island, there is a shortage of respite care workers. To meet this demand, Holland College Customized Training (CT) in partnership with Your Life Design (YLD) Inc. and a provincial advisory committee of industry experts designed and developed a blended 140-hour Respite Care Professional: Working with Children and Adults with Complex Needs Microcredential.
The 140-hour microcredential prepares individuals with the essential skills needed to have the expertise and confidence to provide respite care. The microcredential is offered in a blended approach (in-person 40% and online 60%) with various learning techniques, including lectures, discussions, case studies, simulations, role-plays, videos, guest speakers, and a work-integrated-learning (WIL) component. Throughout the course, participants receive continuous practice on course materials. Mid and end-course evaluations measure participants' growth and understanding of core learning targets. Upon completion of the credential, participants will have gained several competencies required of a Resident Care Professional to work in the field.
In 2024-25, 2 cohorts were offered in a blended format to a total of 43 participants across Prince Edward Island with 42 participants successfully completing the program. Participants were engaged following program completion to ensure curriculum recommendations were considered in advance of future program offerings. Based on the success of the program and the demonstrated need for certified workers in this field, additional cohorts will be offered in the 2025-26 fiscal year.
Program delivery and participant supports
This section provides an overview of the specific programs and financial supports available under the LMDA. It includes specific details on the programs and initiatives available, their duration of associated funding, and additional supports provided to clients. This aims to demonstrate how these programs and initiatives align with federal and provincial priorities, and support labour market integration.
Program: Employment Assistance Services (EAS)
Expenditures: $3,982,170 (17.8%)
Description: Employment Assistance Service Centers offer an integrated bundle of employment services to help clients understand, prepare for, and meet the needs of the provincial labour market. EAS centers also support job seekers with services such as job search, job matching, and career counselling.
Target client groups: The Department of Workforce, Advanced Learning and Population funds 11 Employment Assistance Services providers across the province to assist Islanders in preparing for, obtaining and maintaining employment. The Employment Assistance Services program provides individuals access to various services, including employment counseling, career planning, personal and professional development and job search training with labour connections.
EAS providers offer services for unemployed and underemployed Islanders at 26 locations across the province. The network of 11 service providers are a part of a service delivery approach that provides a full range of responsive, accessible and client-centered labour market programming. Approximately 70 case managers work for the network across the province providing employment services.
The case managers are responsible for developing customized action plans with clients and are responsible for monitoring and reporting through the performance measurement framework. All clients accessing public funding must develop a plan and be monitored through the national performance measurement framework.
Benefits and expected results:
- to equip Islanders to prepare for employment, to obtain employment, and to maintain employment
- expand access to client services across the province
- evolve delivery model to include access to services via digital and non-standard work week
- standardized monitoring and reporting for all clients
Program: Labour Market Partnership: Workforce Development Projects for Labour Force Adjustments
Expenditures: $782,341 (3.5%)
Description: Short-term funding to encourage groups to work in partnership to develop activities or strategies that assist individuals or employers who are impacted by labour market challenges in a community or an industry
Target client groups: Unemployed and underemployed individuals and underrepresented groups
Benefits and expected results:
- to support industry sectors with planning and strategies to address labour market priorities
- to provide human resource support to small businesses that need HR expertise
- the continued focus will be on sector councils and partnerships to address labour market trends, providing human resource expertise to small business owners to support workforce development growth and further identification of industry training needs
- upskilling and reskilling workers to address industry training needs/gaps, build business competitiveness, and to ensure labour market clients have the required skills and credentials to fill labour market gaps/opportunities
Program: Skills Development
Expenditures: $12,393,812 (55.5%)
Description: Skills development programs such as adult education, postsecondary, apprenticeship, group-based training and industry-specific initiatives to assist unemployed, employed and underemployed individuals, and access to skills training to meet emerging requirements to succeed in the workforce now and into the future
Target client groups: Adult students, unemployed and underemployed individuals, employed workers, apprentices and underrepresented groups
Benefits and expected results:
- to provide case-managed individuals with access to appropriate training and educational opportunities related to current and emerging employment opportunities
- to increase the number of individuals who find sustainable employment as a result of receiving financial assistance in support of a training intervention
- to invest in short-term group-based training initiatives enhancing job readiness skills, essential skills and provide a valuable work experience to assist unemployed individuals in making a successful transition to the labour market
- to collaborate with industry partners to identify possible solutions to address current and emerging skills shortages in priority areas such as apprenticeships, healthcare and early childhood education to ensure future sustainability
- to support labour force development by providing financial assistance to employers to train employed and underemployed workers to meet workforce needs and increase skill levels to meet job-specific and incremental industry requirements
Program: Employer Supported Programs (EmployPEI & Graduate Mentorship Program)
Expenditures: $3,594,593 (16.1%)
Description: Employment programs to assist Island employers to hire unemployed individuals and recent graduates and provide them with an on-the-job work experience and mentorship to enhance the individual's skills and employability ideally leading to a full-time job. Focus will be on experiential learning opportunities that align with field of study.
Target client groups: Job seekers - Unemployed and underemployed individuals including unemployed recent graduates
Benefits and expected results:
- to link recent post-secondary graduates with a valuable work experience in their field of study through a mentored work experience
- to connect employers to a skilled and job ready workforce to meet their needs
- to create experiential learning and mentorship opportunities to retain newcomers and create employment pathways for youth and underrepresented groups
Program: Work Experience: Labour Force Development
Expenditures: $326,700 (1.5%)
Description: An employment program that provides financial support to non-profit organizations for short-term projects while providing insured individuals with a work experience to enhance their employability skills.
Target client groups: Unemployed and underemployed individuals and underrepresented groups
Benefits and expected results:
- to provide an individual with upskilling or reskilling so they have a viable skillset that meets labour market needs, resulting in the potential for long-term employment
- to create linkages between businesses and unemployed/under-represented populations by establishing work experiences
- to support non-profit organizations to cover the wages of an unemployed Islander to assist with a community project
Program: Self Employ: Entrepreneurship
Expenditures: $1,252,495 (5.6%)
Description: The Self Employ program provides unemployed individuals with financial and entrepreneurial assistance to launch a business
Target client groups: Unemployed individuals
Benefits and expected results:
- to support economic growth on Prince Edward Island
- increase labour market participation by supporting individuals with self-employed job creation
- to create further employment opportunities through the development of new enterprises
3.2.3 Nova Scotia
In this section
- Employment Benefits and Support Measures key facts
- Labour market context
- Canada-Newfoundland and Labrador Labour Market Development Agreement
- Designated and under-represented groups
- Stakeholder consultations
- Program delivery and participant supports
Employment Benefits and Support Measures key facts
| Indicator | Active claimant clients | Former claimant clients | PPE clients | Non-insured clients | Total |
|---|---|---|---|---|---|
| Clients served | 4,781 | 2,228 | 703 | 4,133 | 11,845 |
| Share of total | 40.4% | 18.8% | 5.9% | 34.9% | 100.0% |
- Notes:
- 1 This table reflects all clients served between April 1, 2024 and March 31, 2025.
- 2 This table excludes Indigenous pan-Canadian data.

Text description
| Year | Active claimant clients | Former claimant clients | PPE clients | Non-insured clients |
|---|---|---|---|---|
| 2015-16 | 9,575 | 2,134 | n/a | 4,620 |
| 2016-17 | 9,651 | 2,141 | n/a | 4,717 |
| 2017-18 | 9,152 | 2,397 | n/a | 4,337 |
| 2018-19 | 9,466 | 1,901 | 1,041 | 3,040 |
| 2019-20 | 6,536 | 2,119 | 1,045 | 2,858 |
| 2020-21 | 5,151 | 1,550 | 586 | 1,777 |
| 2021-22 | 5,496 | 1,963 | 670 | 1,972 |
| 2022-23 | 4,459 | 2,346 | 752 | 2,985 |
| 2023-24 | 4,402 | 2,203 | 744 | 3,755 |
| 2024-25 | 4,781 | 2,228 | 703 | 4,133 |
- Notes:
- 1 This chart reflects all clients served between April 1, 2024 and March 31, 2025.
- 2 This chart excludes Indigenous pan-Canadian data.
| Year | Active claimant clients | Former claimant clients | PPE clients | Non-insured clients |
|---|---|---|---|---|
| 2015-16 | 58.6% | 13.1% | n/a | 28.3% |
| 2016-17 | 58.5% | 13.0% | n/a | 28.6% |
| 2017-18 | 57.6% | 15.1% | n/a | 27.3% |
| 2018-19 | 61.3% | 12.3% | 6.7% | 19.7% |
| 2019-20 | 52.0% | 16.9% | 8.3% | 22.8% |
| 2020-21 | 56.8% | 17.1% | 6.5% | 19.6% |
| 2021-22 | 54.4% | 19.4% | 6.6% | 19.5% |
| 2022-23 | 42.3% | 22.3% | 7.1% | 28.3% |
| 2023-24 | 39.6% | 19.8% | 6.7% | 33.8% |
| 2024-25 | 40.4% | 18.8% | 5.9% | 34.9% |
- Notes:
- 1 This table reflects all clients served between April 1, 2024 and March 31, 2025.
- 2 This table excludes Indigenous pan-Canadian data.

Text description
| Year | Youth (15-24 years old) | Core-age (25-54 years old) | Workers aged 55+ | Age undisclosed2 |
|---|---|---|---|---|
| 2015-16 | 2,590 | 8,792 | 1,589 | 3,358 |
| 2016-17 | 2,422 | 8,991 | 1,735 | 3,361 |
| 2017-18 | 2,288 | 8,699 | 1,855 | 3,044 |
| 2018-19 | 3,506 | 8,145 | 1,618 | 2,179 |
| 2019-20 | 1,972 | 7,557 | 1,615 | 1,414 |
| 2020-21 | 1,432 | 5,655 | 939 | 1,038 |
| 2021-22 | 1,581 | 6,249 | 1,191 | 1,080 |
| 2022-23 | 1,653 | 6,304 | 1,297 | 1,288 |
| 2023-24 | 1,766 | 6,554 | 1,358 | 1,426 |
| 2024-25 | 1,809 | 7,064 | 1,267 | 1,705 |
- Notes:
- 1 This chart reflects all clients served between April 1, 2024 and March 31, 2025.
- 2 Clients for whom valid date of births were not provided are included in the 'Age undisclosed' category.
- 3 This chart excludes Indigenous pan-Canadian data.
- 4 Apprentice clients were excluded from the age breakout prior to 2024-25. Starting 2024-25 they are reported under a "known" age unless their date of birth was invalid or missing.
| Year | Youth (15-24 years old) | Core-age (25-54 years old) | Workers aged 55+ | Age undisclosed2 |
|---|---|---|---|---|
| 2015-16 | 15.9% | 53.8% | 9.7% | 20.6% |
| 2016-17 | 14.7% | 54.5% | 10.5% | 20.4% |
| 2017-18 | 14.4% | 54.8% | 11.7% | 19.2% |
| 2018-19 | 22.7% | 52.7% | 10.5% | 14.1% |
| 2019-20 | 15.7% | 60.2% | 12.9% | 11.3% |
| 2020-21 | 15.8% | 62.4% | 10.4% | 11.5% |
| 2021-22 | 15.7% | 61.9% | 11.8% | 10.7% |
| 2022-23 | 15.7% | 59.8% | 12.3% | 12.2% |
| 2023-24 | 15.9% | 59.0% | 12.2% | 12.8% |
| 2024-25 | 15.3% | 59.6% | 10.7% | 14.4% |
- Notes:
- 1 This table reflects all clients served between April 1, 2024 and March 31, 2025.
- 2 Clients for whom valid date of births were not provided are included in the 'Age undisclosed' category.
- 3 This table excludes Indigenous pan-Canadian data.
- 4 Apprentice clients were excluded from the age breakout prior to 2024-25. Starting 2024-25 most are reported under a "unknown" because Nova Scotia has not provided the expected data file containing date of birth for many of its apprentice clients. Apprentice client data has instead been sourced from a cut of EI Part I data that lacks date of birth.
| Service type | Services delivered | Year-over-year change | Share of total | Year-over-year change (p.p.) |
|---|---|---|---|---|
| Employment Benefits | 3,810 | +2.9% | 16.6% | -0.7 |
| Support Measures | 19,174 | +8.6% | 83.4% | +0.7 |
| Total services | 22,984 | +7.6% | 100.0% | n/a |
- Notes:
- 1 This table reflects all new services started between April 1, 2024 and March 31, 2025.
- 2 This table excludes Indigenous pan-Canadian data.
| Service type | Services | Year-over-year change | Expenditures | Year-over-year change |
|---|---|---|---|---|
| Targeted Wage Subsidies | 219 | -20.1% | $1,568,329 | -24.0% |
| Self-Employment | 136 | +11.5% | $3,039,996 | -12.4% |
| Job Creation Partnerships | 21 | -32.3% | $334,435 | -35.6% |
| Skills Development-Regular | 1,286 | -12.6% | $22,849,042 | -35.7% |
| Skills Development-Apprentices | 2,148 | +19.1% | Included above | Included above |
| Targeted Earning Supplements | n/a | n/a | n/a | n/a |
| Totals Employment Benefits | 3,810 | +2.9% | $27,791,802 | -33.2% |
| Employment Services | 18,337 | +9.6% | $41,190,938 | +4.1% |
| Individual Counselling | 837 | -9.6% | Included above | Included above |
| Labour Market Partnerships | n/a | n/a | $5,435,759 | -17.3% |
| Research & Innovation | n/a | n/a | $320,207 | -89.1% |
| Total Support Measure | 19,174 | +8.6% | $46,946,904 | -4.3% |
| Total EBSMs | 22,984 | +7.6% | $74,738,706 | -17.6% |
- Notes:
- 1 This table reflects all new services started between April 1, 2024 and March 31, 2025.
- 2 This table excludes Indigenous pan-Canadian data.

Text description
| Year | Unpaid EI benefits | EI-insured clients - returns to employment3 | Non-insured clients - returns to employment | Active claimantclients served | Total clients served4 |
|---|---|---|---|---|---|
| 2015-16 | $23,386,628 | 5,100 | 1,690 | 9,575 | 16,329 |
| 2016-17 | $24,021,668 | 5,153 | 1,799 | 9,651 | 16,509 |
| 2017-18 | $23,910,837 | 5,624 | 1,965 | 9,152 | 15,886 |
| 2018-19 | $26,429,016 | 5,075 | 890 | 9,466 | 15,448 |
| 2019-20 | $22,951,106 | 3,834 | 278 | 6,536 | 12,558 |
| 2020-21 | $17,272,179 | 2,781 | 425 | 5,151 | 9,064 |
| 2021-22 | $38,284,467 | 4,539 | 387 | 5,496 | 10,101 |
| 2022-23 | $24,585,983 | 5,022 | 1,340 | 4,459 | 10,542 |
| 2023-24 | $23,030,581 | 4,469 | 1,771 | 4,402 | 11,104 |
| 2024-25 | $29,085,640 | 4,501 | 1,811 | 4,781 | 11,845 |
- Notes:
- 1 This chart excludes Indigenous pan-Canadian data.
- 2 Volatility in the Unpaid EI Benefits from 2021‑22 to 2022‑23 correlates with the speed of recovery of the labour market that allowed many Canadians to return to work before exhausting their EI benefits.
- 3 The EI-insured return to employment returns includes active claimants, former claimants, and PPE clients
- 4 "Total Clients Served" refers to the count of EI-insured clients served (active claimant clients, former claimant clients, and PPE clients) and non-insured clients
- 5 Historical data has been adjusted to enhance accuracy.
Labour market context
In 2024-25, Nova Scotia's labour market remained relatively strong, with continued employment growth and near-historically low unemployment. Full-time employment drove these gains, while employers raised wages in an effort to attract talent. Despite these efforts, labour shortages persisted, and many sectors continued to face long-term vacancies such as health care and social assistance, accommodation and food services, construction and manufacturing.
The unemployment rate increased slightly to 6.5% in 2024, up from 6.4% in 2023 reflecting a modest recovery in the province's labour market. In comparison, Canada's unemployment rate in 2024 was 6.3% and in 2023 was 5.4%.Footnote 59
By March 2025, Nova Scotia had about 12,500 job vacancies,Footnote 60 while approximately 34,000 people were unemployed, had recently looked for work in the past 4 weeks, and were available for work.Footnote 61
Nova Scotia maintained its focus on population in-migration to support employment, address demographic challenges, and meet evolving labour market needs. Regional development also remained a priority, with continued efforts to ensure that both urban and rural communities had the skills and workforce required to support local economic activity. At the same time, global trade uncertainty and inflationary pressures affected business confidence, particularly in export-oriented sectors such as fisheries, manufacturing, and natural resources.
Canada-Nova Scotia Labour Market Development Agreement
In 2024-25, Nova Scotia received approximately $85 million through the Labour Market Development Agreement (LMDA), supporting programs and services that address the province's labour market challenges. Approximately 11,800 clients were served. Within 6 months of receiving training and employment supports, approximately 64.3% of active claimant clients were employed which contributed to an overall savings of approximately $29 million in unpaid EI benefits.
Nova Scotia offered a number of Employment Benefits and Support Measures (EBSM) through the LMDA. In 2024-25, the province offered the following programs and services:
- Employment Assistance Services
- Skills Development
- Nova Scotia School of Adult Learning
- Labour Market Partnership
- START - Nova Scotia's version of the Targeted Wage Subsidy
- Job Creation Partnership
- Self-Employment
- Research and Innovation
- Work Activity Centre
- Works For You
For example, in 2024-25, the Employment Assistance Services (EAS) program supported approximately 13,083 Nova Scotians. This program is provided through 16 external service providers across 50 locations throughout the province. All Nova Scotians can access EAS's Nova Scotia Works (NSW) self-directed resources. Additionally, unemployed Nova Scotians who are Canadian citizens or permanent residents are eligible for additional services, including individualized case management. These services may include employment needs assessment, career planning, employment counselling, job placement services, and follow-up support.
In 2024-25, almost 2,300 clients benefited from Skills Development (SD) training programs including SD-Regular, SD-Fast Forward, and SD-Apprenticeship.
- SD (Regular) program is an employment program that provides support to LMDA-eligible clients to help them obtain the skills training they need to find employment. It is designed for those who need to learn additional basic-to-advanced skills to help them find sustainable employment. Eligible clients are those who are unable to find and secure employment with their existing skills and who lack marketable skills but who are otherwise job-ready. Clients attend training full-time, and training may be provided through public or private providers
- SD Fast Forward is Nova Scotia's version of the Feepayer Program. This program provides an opportunity for individuals who are in receipt of regular Employment Insurance (EI) benefits to attend approved training, at their own expense, to improve their skills and enhance their employability for the duration of their claim
- SD Apprenticeship: this program provides skills development services including wrap-around support for apprentices who require assistance with costs such as travel, childcare, accommodations, assistive technology, and books
Designated and under-represented groups
As Nova Scotia continued to face the demographic pressures of an aging population, the focus in 2024-25 remained on increasing the labour market participation rate of all available workers, particularly those from under-represented groups such as:
- Indigenous peoples
- racialized people
- persons with disabilities
- women
- youth
- older workers
- Francophones and Acadians
Having a diverse and inclusive workforce remained essential to the province's economic development and prosperity. Nova Scotia continued to implement policies and programs that help address labour market challenges to improve the equity, diversity and inclusion of its workforce. These efforts also supported a broader objective of expanding the labour pool to respond to the province's aging population and persistent labour shortages.
For example, in 2024-25, Employment Development Specialists (EDSs) continued their engagement with community representatives and representative from community-serving organizations within First Nations, African Nova Scotian, Africadian (people of African Canadian descent), Acadian, and newcomer communities. These discussions informed how Employment Nova Scotia (ENS) could improve its programming and service delivery, including through tailored initiatives such as Work For You, Job Creation Partnership, and other targeted training opportunities.
Stakeholder consultations
In 2024-25, Nova Scotia conducted consultations with a wide range of stakeholders, including employers, service providers, program administrators, program clients, sector councils, and other organizations representing LMDA stakeholders. These consultations, both formal and informal were integral to program planning and evaluation.
For example, the Nova Scotia School of Adult Learning (NSSAL) coordinated and administered by the Adult Education Division of the Department of Labour, Skills, and Immigration, provided adult education services across the province. NSSAL continued to work closely with service providers, educators and community organizations to ensure the needs of adult learners are met. In 2024-25, NSSAL facilitated 4 regional planning meetings per region and collaborated with a diverse group of stakeholders, including NS Works, the Black Educator's Association, and Deaf Literacy NS, to enhance learning opportunities and address emerging needs.
SkillsOnlineNS
In 2024-25, the Canada-Nova Scotia LMDA continued to strengthen the province's workforce through its investment in SkillsOnlineNS, a free online learning platform delivered in partnership with the Nova Scotia Association of Community Business Development Corporations (NSACBDCs). This online learning platform enables businesses, organizations and individuals from across the province to access a wide range on-line training programs, offering over 750 in areas such as leadership, digital skills and workplace safety. Through this platform employees can quickly complete free courses, small and large companies can assign, track and manage training for employees, and each account has a unique QR code to easily view all training records.
During this period, 14,140 learners participated in training through the SkillsOnlineNS. By removing cost and location barriers, SkillsOnlineNS continues to promote lifelong learning and support for a skilled, adaptable workforce ready to meet Nova Scotia's labour market needs.
Program delivery and participant supports
This section provides an overview of the specific programs and financial supports available under the LMDA. It includes specific details on the programs and initiatives available, their duration of associated funding, and additional supports provided to clients. This aims to demonstrate how these programs and initiatives align with federal and provincial priorities, and support labour market integration.
Program: Work Activity Centre (WAC)
Expenditures: $2,330,000 (3.4%)
Description: The WAC program is an employment initiative that, through partner organizations, provides support to Nova Scotians with employment barriers to engage in entry level work or education and skills training.
Target client groups: EI-Insured clients
Benefits and expected results: Number of clients employed within 6 months of finishing the program, where known: 248/742 (33.4%)
Program: Employment Assistance Services: NS Works Centres and more
Expenditures: $38,147,900 (55.4%)
Description: EAS consists of 16 external service providers in over 50 locations province-wide under a common brand of Nova Scotia Works. Nova Scotians can access EAS in-person or virtually via Nova Scotia Works Online, a digital service channel that has self-directed resources, and all unemployed Nova Scotians who are Canadian citizens or permanent residents can access additional services, including individualized case management. These services may also include employment needs assessment, career planning, employment counselling, job placement services, and follow-up support.
Target client groups: Residents of Nova-Scotia
Benefits and expected results: Number of clients employed within 6 months of finishing the program, where known: 4,849/6,486 (74.8%)
Program: Skills Development: Regular
Expenditures: $12,951,100 (18.8%)
Description: The SD (Regular) program is an employment program that provides support to LMDA-eligible clients to help them obtain the skills training they need to find employment. It is designed for those who need to learn additional basic-to-advanced skills to help them find sustainable employment. Eligible clients are those who are do not have a high school completion, or post-secondary education, or those who are unable to find and secure employment with their existing skills and who lack marketable skills but who are otherwise job-ready. Clients attend training full-time, and training may be provided through public or private providers.
Target client groups: EI-Insured clients
Benefits and expected results: Number of clients employed within 6 months of finishing the program, where known: 377/450 (83.8%)
Program: Self-Employment (including Self Employment Training and Assistance Program (SETA))
Expenditures: $3,040,000 (4.4%)
Description: The Self-Employment program provides entrepreneurial support and financial assistance to eligible, unemployed clients starting their own business. Entrepreneurial support may include information sessions, orientation sessions, workshops, coaching, mentoring, and access to specific business implementation training to enable clients to develop and implement their business plans.
Target client groups: EI-Insured clients
Benefits and expected results: Number of clients employed within 6 months of finishing the program, where known: 118/126 (93.7%)
Program: Nova Scotia School of Adult Learning (NSSAL)
Expenditures: $2,500,000 (3.6%)
Description: NSSAL offers tuition-free programming, in both English and French, to help individuals improve their essential skills in reading, math, and digital literacy, upgrade secondary credits to further educational and/or employment goals, and/or earn credits toward obtaining a High School Graduation Diploma for Adults, or the Canadian Adult Education Credential (CAEC). These programs are offered through third-party partner organizations which include Community Learning Organizations (CLOs) and credit issuing institutions. The system also includes organizations focused on the support of learners in the Mi'kmaq/Indigenous, African Nova Scotian, Deaf or Hard of Hearing and Francophone communities. From adult basic education to a high school credential, NSSAL supports adult learners to adapt to a changing labour market.
Target client groups: EI-Insured clients
Benefits and expected results: Number of clients who obtained credentials (educational or technical), or certificates of completion: 460
Program: Labour Market Partnerships (Sector Councils)
Expenditures: $5,435,800 (7.9%)
Description: The Sector Council Program (SCP) supports an industry-led approach to workforce planning and development by providing funding and direct support to 14 industry sector councils. In particular, the program ensures that small and medium sized businesses in Nova Scotia have increased access to expertise, resources and support in human resource and workforce planning.
Target client groups: EI-Insured clients
Benefits and expected results: The Labour Market Partnership program, for example, enabled key workforce initiatives that strengthened employer-employee connections, supported workforce retention, and enhanced skills development across Nova Scotia.
In 2024-25, this included the efforts of the Association of Industry Sector Councils (AISC) and its members, who organized 177 career fairs and events reaching nearly 26,662 clients, provided training for 17,443 individuals, developed strategic workforce planning tools for employers, and supported immigration strategies to address labour market needs. These initiatives contributed to a more resilient and adaptable workforce, benefiting both job seekers and employers.
Program: START Program
Expenditures: $1,568,300 (2.3%)
Description: The START program is Nova Scotia's version of the Targeted Wage Subsidy, and it encourages employers to hire unemployed Nova Scotians requiring work experience, resulting in good jobs for Nova Scotians and good employees for employers. The program is intended to benefit small and medium-sized businesses but is available to all businesses and organizations (not-for-profit and social enterprises) that have a physical location in the province.
Target client groups: EI-Insured clients
Benefits and expected results: Number of clients employed within 6 months of finishing the program, where known: 161/185 (87.0%)
Program: Skills Development: Apprenticeship
Expenditures: $1,310,800 (1.9%)
Description: In addition to Employment Nova Scotia (ENS) undertaking the administrative process with Service Canada to authorize registered apprentices to access EI while attending apprenticeship technical training, ENS also provides wrap-around support, using LMDA funding, to help apprentices cover costs such as travel, childcare, accommodations, assistive technology, and books.
Target client groups: EI-Insured clients
Benefits and expected results: Apprentices are already employed, and they take time off from their work to attend this training and then return to their previous employment. Therefore, the "clients employed" indicator is not applied to this program.
In 2024-25, there were 1,279 apprentices who participated in the Skills Development :Apprenticeship program.
Program: Research and Innovation
Expenditures: $320,200 (0.5%)
Description: Research and Innovation (R&I) funding supports projects that will identify better ways of helping persons prepare for return to or keep employment and to be productive clients in the labour force.
SETA: GO-3D
Self Employment Training and Assistance Program (SETA): SETA provides entrepreneurial support and financial assistance to eligible persons with disabilities interested in self-employment as a career option. It offers a flexible pathway to self-employment with wrap-around supports and funding to address unique barriers to employment. Clients are engaged in a variety of activities, to enable them to implement their business plan. These include orientation, business development, business operations, mentorship, and coaching. The current project being funded through this program is called the GO-3D Program (which stands for Growth, Opportunities, Determination, Drive and Disability).
GO-3D is administered by Team Work Cooperative. The current GO-3D project started in March 2025 with an assessment phase, and the project will run through April 2026.
Target client groups: Research institutions
Benefits and expected results: The program is expected to support business start-up for a total of 9 individuals over the life of the project.
Program: Job Creation Partnership (JCP)
Expenditures: $334,400 (0.5%)
Description: The JCP program supports projects that provide LMDA-eligible individuals with work experience that will benefit them by improving their employment prospects. Although funded projects are intended to benefit the individual and the community, the program's focus is aiding participants with work that will strengthen their long-term and full-time employment prospects.
Target client groups: EI Insured participants
Benefits and expected results: Number of clients employed within 6 months of finishing the program, where known: 19/25 (76.0%)
Program: Works For You (W4U)
Expenditures: $908,400 (1.3%)
Description: Supports projects that help people prepare for job opportunities and build the skills they need to participate in their local labour market. In turn, it will help address the needs of employers and labour demands in the province. Clients explore careers, develop foundational skills, and have access to wrap-around employment supports and funding to address employment barriers.
Target client groups: EI-Insured clients
Benefits and expected results: Number of clients employed within 6 months of finishing the program, where known: 35/40 (87.5%)
3.2.4 New Brunswick
In this section
- Employment Benefits and Support Measures key facts
- Labour market context
- Canada-Newfoundland and Labrador Labour Market Development Agreement
- Designated and under-represented groups
- Stakeholder consultations
- Program delivery and participant supports
Employment Benefits and Support Measures key facts
| Indicator | Active claimant clients | Former claimant clients | PPE clients | Non-insured clients | Total |
|---|---|---|---|---|---|
| Clients served | 5,120 | 2,671 | 885 | 6,518 | 15,194 |
| Share of total | 33.7% | 17.6% | 5.8% | 42.9% | 100.0% |
- Notes:
- 1 This table reflects all clients served between April 1, 2024 and March 31, 2025.
- 2 This table excludes Indigenous pan-Canadian data.

Text description
| Year | Active claimant clients | Former claimant clients | PPE clients | Non-insured clients |
|---|---|---|---|---|
| 2015-16 | 10,411 | 2,885 | n/a | 6,365 |
| 2016-17 | 11,386 | 2,859 | n/a | 8,347 |
| 2017-18 | 11,302 | 3,116 | n/a | 8,410 |
| 2018-19 | 10,387 | 2,263 | 1,327 | 7,550 |
| 2019-20 | 10,716 | 2,595 | 1,400 | 7,286 |
| 2020-21 | 9,909 | 1,524 | 739 | 3,578 |
| 2021-22 | 12,324 | 2,227 | 841 | 3,978 |
| 2022-23 | 5,087 | 2,576 | 809 | 4,662 |
| 2023-24 | 4,581 | 2,654 | 802 | 5,719 |
| 2024-25 | 5,120 | 2,671 | 885 | 6,518 |
- Notes:
- 1 This chart reflects all clients served between April 1, 2024 and March 31, 2025.
- 2 This chart excludes Indigenous pan-Canadian data.
| Year | Active claimant clients | Former claimant clients | PPE clients | Non-insured clients |
|---|---|---|---|---|
| 2015-16 | 53.0% | 14.7% | n/a | 32.4% |
| 2016-17 | 50.4% | 12.7% | n/a | 36.9% |
| 2017-18 | 49.5% | 13.6% | n/a | 36.8% |
| 2018-19 | 48.3% | 10.5% | 6.2% | 35.1% |
| 2019-20 | 48.7% | 11.8% | 6.4% | 33.1% |
| 2020-21 | 62.9% | 9.7% | 4.7% | 22.7% |
| 2021-22 | 63.6% | 11.5% | 4.3% | 20.5% |
| 2022-23 | 38.7% | 19.6% | 6.2% | 35.5% |
| 2023-24 | 33.3% | 19.3% | 5.8% | 41.6% |
| 2024-25 | 33.7% | 17.6% | 5.8% | 42.9% |
- Notes:
- 1 This table reflects all clients served between April 1, 2024 and March 31, 2025.
- 2 This table excludes Indigenous pan-Canadian data.
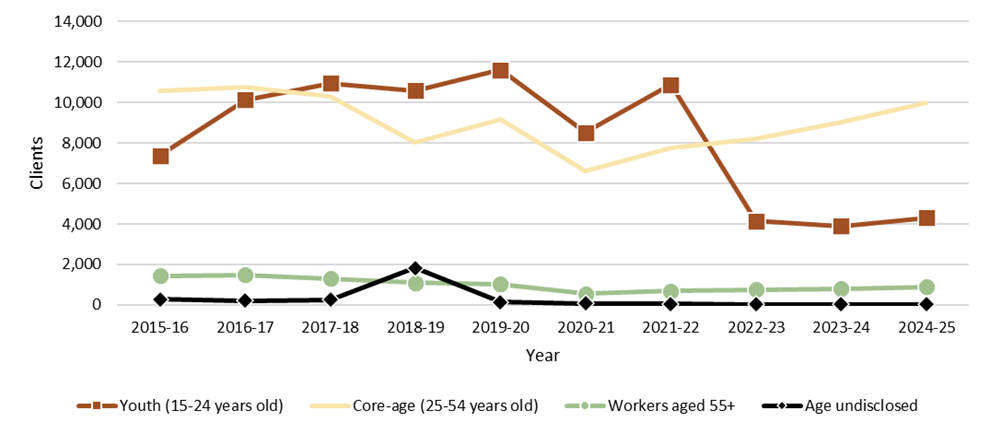
Text description
| Year | Youth (15-24 years old) | Core-age (25-54 years old) | Workers aged 55+ | Age undisclosed2 |
|---|---|---|---|---|
| 2015-16 | 7,383 | 10,583 | 1,427 | 268 |
| 2016-17 | 10,132 | 10,781 | 1,475 | 204 |
| 2017-18 | 10,961 | 10,314 | 1,304 | 249 |
| 2018-19 | 10,584 | 8,029 | 1,094 | 1,820 |
| 2019-20 | 11,626 | 9,184 | 1,038 | 149 |
| 2020-21 | 8,510 | 6,628 | 543 | 69 |
| 2021-22 | 10,884 | 7,759 | 676 | 51 |
| 2022-23 | 4,142 | 8,213 | 764 | 15 |
| 2023-24 | 3,894 | 9,040 | 798 | 24 |
| 2024-25 | 4,301 | 9,971 | 900 | 22 |
- Notes:
- 1 This chart reflects all clients served between April 1, 2024 and March 31, 2025.
- 2 Clients for whom valid dates of birth were not provided are included in the 'Age undisclosed' category.
- 3 This chart excludes Indigenous pan-Canadian data.
- 4 Apprentice clients were excluded from the age breakout prior to 2024-25. Starting 2024-25 they are reported under a "known" age unless their date of birth was invalid or missing.
| Year | Youth (15-24 years old) | Core-age (25-54 years old) | Workers aged 55+ | Age undisclosed2 |
|---|---|---|---|---|
| 2015-16 | 37.6% | 53.8% | 7.3% | 1.4% |
| 2016-17 | 44.8% | 47.7% | 6.5% | 0.9% |
| 2017-18 | 48.0% | 45.2% | 5.7% | 1.1% |
| 2018-19 | 49.2% | 37.3% | 5.1% | 8.5% |
| 2019-20 | 52.9% | 41.8% | 4.7% | 0.7% |
| 2020-21 | 54.0% | 42.1% | 3.4% | 0.4% |
| 2021-22 | 56.2% | 40.1% | 3.5% | 0.3% |
| 2022-23 | 31.5% | 62.5% | 5.8% | 0.1% |
| 2023-24 | 28.3% | 65.7% | 5.8% | 0.2% |
| 2024-25 | 28.3% | 65.6% | 5.9% | 0.1% |
- Notes:
- 1 This table reflects all clients served between April 1, 2024 and March 31, 2025.
- 2 Clients for whom valid dates of birth were not provided are included in the 'Age undisclosed' category.
- 3 This table excludes Indigenous pan-Canadian data.
- 4 Apprentice clients were excluded from the age breakout prior to 2024-25. Starting 2024-25 they are reported under a "known" age unless their date of birth was invalid or missing.
| Service type | Services delivered | Year-over-year change | Share of total | Year-over-year change (p.p.) |
|---|---|---|---|---|
| Employment Benefits | 5,941 | +0.3% | 19.5% | -2.4 |
| Support Measure | 24,492 | +16.1% | 80.5% | +2.4 |
| Total services | 30,433 | +12.6% | 100.0% | n/a |
- Notes:
- 1 This table reflects all new services started between April 1, 2024 and March 31, 2025.
- 2 This table excludes Indigenous pan-Canadian data.
| Service type | Services | Year-over-year change | Expenditures | Year-over-year change |
|---|---|---|---|---|
| Targeted Wage Subsidies | 332 | -22.2% | $1,366 | n/a |
| Self-Employment | 259 | +27.6% | $3,543,103 | -9.9% |
| Job Creation Partnerships | 0 | n/a | n/a | n/a |
| Skills Development-Regular | 2,855 | -8.0% | $49,615,802 | -9.1% |
| Skills Development-Apprentices | 2,495 | +13.9% | Included above | Included above |
| Targeted Earning Supplements | n/a | n/a | n/a | n/a |
| Totals Employment Benefits | 5,941 | +0.3% | $53,160,272 | -9.1% |
| Employment Services | 5,960 | +22.5% | $8,322,971 | +6.9% |
| Individual Counselling | 18,532 | +14.1% | Included above | Included above |
| Labour Market Partnerships | n/a | n/a | $24,415,808 | -30.9% |
| Research & Innovation | n/a | n/a | n/a | -100.0% |
| Total Support Measure | 24,492 | +16.1% | $32,738,779 | -24.1% |
| Total EBSMs | 30,433 | +12.6% | $85,899,050 | -15.5% |
- Notes:
- 1 This table reflects all new services started between April 1, 2024 and March 31, 2025.
- 2 This table excludes Indigenous pan-Canadian data.

Text description
| Year | Unpaid EI benefits | EI-insured clients - returns to employment3 | Non-insured clients - returns to employment | Active claimantclients served | Total clients served4 |
|---|---|---|---|---|---|
| 2015-16 | $31,018,474 | 8,179 | 2,832 | 10,411 | 19,661 |
| 2016-17 | $30,008,146 | 8,300 | 3,913 | 11,386 | 22,592 |
| 2017-18 | $29,137,706 | 8,800 | 3,735 | 11,302 | 22,828 |
| 2018-19 | $25,004,412 | 8,031 | 3,244 | 10,387 | 21,527 |
| 2019-20 | $26,374,579 | 8,848 | 3,638 | 10,716 | 21,997 |
| 2020-21 | $22,265,921 | 6,803 | 2,128 | 9,909 | 15,750 |
| 2021-22 | $56,832,095 | 8,571 | 1,879 | 12,324 | 19,370 |
| 2022-23 | $42,506,427 | 11,993 | 3,691 | 5,087 | 13,134 |
| 2023-24 | $23,794,702 | 5,640 | 3,530 | 4,581 | 13,756 |
| 2024-25 | $29,477,968 | 6,113 | 4,669 | 5,120 | 15,194 |
- Notes:
- 1 This chart excludes Indigenous pan-Canadian data..
- 2 Volatility in the Unpaid EI Benefits from 2021‑22 to 2022‑23 correlates with the speed of recovery of the labour market that allowed many Canadians to return to work before exhausting their EI benefits.
- 3 The EI-insured return to employment returns includes active claimants, former claimants, and PPE clients
- 4 "Total Clients Served" refers to the count of EI-insured clients served (active claimant clients, former claimant clients, and PPE clients) and non-insured clients.
- 5 Historical data has been adjusted to enhance accuracy.
Labour market context
In 2024-25, New Brunswick continued to face labour market pressure linked to demographic trends and, particularly, the province's aging population. Between 2004 and 2024, the number of annual retirements more than doubled, placing additional pressure on the province's remaining labour force. These pressures are expected to continue, as close to 100,000 New Brunswickers are projected to retire over the next decade, representing over 20% of New Brunswick's current labour force.Footnote 62 Despite this turnover, New Brunswick's labour force is projected to grow by 7.9% by 2034.Footnote 63
The unemployment rate for New Brunswickers was 7.0% in 2024, up from 6.6% the previous year.Footnote 64 These rates are higher than Canada's overall unemployment rate, which was 6.3% in 2024 and 5.4% in 2023.Footnote 65
In March 2024, New Brunswick reported nearly 10,000 job vacanciesFootnote 66 despite 33,800 people in the province identifying as unemployed, actively seeking employment,Footnote 67 and available for work.Footnote 68
Despite the overall drop in vacancy levels, labour shortages persisted in several key sectors, including healthcare, construction, and education.
Moving forward, the province remains focused on helping employers attract and retain workers, while maintaining a focus on equity, diversity, and inclusion. Addressing labour shortages, reducing skills mismatches, and increasing participation among under-represented groups, such as newcomers, youth, and older workers, remain key to building a resilient labour market. New Brunswick will also continue to rely on international immigration and interprovincial recruitment to support their labour force growth.
Canada-New Brunswick Labour Market Development Agreement
In 2024-25, New Brunswick received approximately $95 million though the LMDA, funding programs and services used by approximately 15,200 clients. Within 6 months of receiving training and employment supports, approximately 69.3% of active claimant clients were employed, resulting in an overall savings of approximately $29.4 million in unpaid EI benefits.
These programs and services include the Human Resources Support Services (HRSS), which helps employers in New Brunswick address workforce needs through ongoing consultations with WorkingNB. The program offers recruitment support, including financial assistance for work placements, job postings, and job fairs, as well as training funding for employees and supervisors. HRSS also provides expertise in human resources management, such as human resource planning, policy development, and succession planning. In 2024-25, the program invested approximately $32.2 million and served 2,228 clients, enhancing employers' capacity and addressing labour market challenges.
Programs and services funded under the LMDA are reviewed regularly by the province to ensure they effectively address evolving labour market opportunities and challenges.
Designated and under-represented groups
In 2024-25, the Government of New Brunswick, through its WorkingNB division, provided programs and services specifically tailored to help employers recruit and retain newcomers. They also offered newcomers employment counseling and worked closely with organizations who supported them and their communities.
These programs and services included:
- language services: partnering with community organizations, settlement agencies, and educational institutions to deliver language training programs that are integrated into the services offered to newcomers
- experiential learning and work experiences: providing short-term job placements, workshops, 1-on-1 coaching, and mentorship opportunities to help under-represented groups gain hands-on job experience
- job maintenance support: providing job retainment support to employers and employees that help individuals from under-represented groups retain their jobs. This support may involve troubleshooting workplace challenges or offering conflict resolution services
- work culture competencies: helps newcomers understand the work culture in New Brunswick. This can include training on workplace expectations, etiquette, communication and team dynamics
- foreign credential recognition support: WorkingNB provides foreign credential recognition support to help newcomers, with professional qualifications from other countries, navigate the process of having their qualifications recognized in New Brunswick. This may involve connecting individuals with organizations that assess foreign credentials or providing guidance on how to apply for equivalency assessments. The development of a new virtual employment counselling services unit in 2024 has built additional FQR capacity and expertise within WorkingNB. The unit specializes in helping FQR clients navigate credential recognition processes and providing employment counselling services
Stakeholder consultations
To ensure their workforce programs are effective and responsive to the needs of its workers, New Brunswick actively engages with a diverse range of stakeholders, including employers, employees, communities (including official language communities) and organizations. WorkingNB also collaborates with key economic sectors like health care and social assistance, education, construction, manufacturing, IT, agriculture, forestry, fisheries and tourism to address labour market challenges and help employers implement sector-specific workforce strategies.
Specific examples of stakeholder consultations/collaboration:
- The Restigouche Regional Labour Market Partnership Forum: This forum collaborated with various stakeholders, including education institutions (school and postsecondary institutions), community partners, economic development agencies, employers, and municipalities to develop a 5-year attraction and retention strategy for the region. Three strategic pillars were identified, and a comprehensive action plan was developed to implement the strategy
- Belledune Port Authority (BPA): WorkingNB helped BPA create a Community and Workforce Development Committee. This committee collaborates with local stakeholders and community on recommendations that support Northern New Brunswick's clean-energy industrial transition. The community provides a forum for information sharing and feedback, enabling collaborative efforts to pursue opportunities in community education, workforce development, training and recruitment. It also fosters broader stakeholder engagement on goals and opportunities at the Port. Focusing on projects and development opportunities identified by the BPA, the committee is tasked with identifying economic impacts and opportunities for the region while planning for jobs, training and community outreach initiatives
Regional Service Commissions (RSCs) in New Brunswick plays a crucial role driving economic development across the province. They foster collaboration between municipalities, local governments, and stakeholders on initiatives that address economic challenges and promote growth.
Following are examples of RSC contributions to economic development:
- promoting regional economic cooperation: encouraging collaboration between communities to tackle shared economic issues, attract investments, and leverage regional strengths for coordinated growth
- attracting investment and supporting business growth: identifying regional economic opportunities and aligning resources to create attractive environments for investors and entrepreneurs, supporting business development and expansion
- optimizing service delivery for growth: by streamlining services and coordinating regional efforts, RSCs improve the efficiency of service delivery and contribute to a more competitive and sustainable economy
Through these efforts, RSCs enhances regional competitiveness, support infrastructure development, and help create a thriving, resilient economy for businesses and communities in New Brunswick.
New Brunswick: Personal Support Worker (PSW) Workforce Development
To address persistent labour shortages in healthcare, the New Brunswick Department of Post-Secondary Education, Training and Labour (PETL) actively collaborated with industry stakeholders, employer associations, the Department of Social Development, and the Department of Health. These joint efforts prioritized targeted recruitment and retention strategies for Personal Support Workers (PSWs), an essential role in delivering care to vulnerable individuals across long-term care facilities, home support services, and community-based programs.
PETL supports PSW training through dedicated funding streams: the Training and Skills Development (TSD) program for individual participants and the Labour Force Training (LFT) program for employers. In parallel, Skilled Trades NB oversees a Voluntary Certification initiative for PSWs, with WorkingNB covering certification fees until July 1, 2025, to promote accessibility and elevate professional standards.
Key achievements:
- Skilled Trades NB Certification Program: Issued 87 certifications to PSWs, fostering skill recognition and career progression in the sector
- Labour Force Training (LFT): Delivered through 73 contracts with employers in the healthcare sector, enabling 220 individuals to upgrade their PSW skills while staying employed. Total provincial investment: $136,015
- Training and Skills Development (TSD): Supported 130 case-managed individuals in developing employment action plans and accessing targeted training to join the PSW workforce. Total investment: $1,249,889
These initiatives reflect New Brunswick's strategic alignment with Employment and Social Development Canada goals, emphasizing skill-building and sustainable job placement to strengthen critical healthcare services. Central to this success is the emphasis on robust stakeholder engagement, including collaborative consultations with industry leaders, employers, and associations. This inclusive approach ensures that strategies are informed by real-time insights, adaptable to emerging challenges, and collectively driven toward building a resilient, high-quality workforce that meets the province's evolving needs.
Program delivery and participant supports
This section provides an overview of specific programs and financial supports funded under the LMDA. It includes specific details on the programs and initiatives, their duration, their associated funding, and any additional supports provided to clients. The intent is to demonstrate how programs and initiatives align with federal and provincial priorities and support labour market integration.
Program: Human Resources Support Services (HRSS)
Expenditures: $32.2M (20.4%)
Description: Human Resources Support Services (HRSS) is a service delivery approach for employers. Through HRSS, workforce consultants in regional WorkingNB offices engage in ongoing dialogues with employers. Through these dialogues, Workforce Consultants help employers identify their Human Resource needs and recommend flexible and innovative interventions to address those needs. Ongoing support is provided to employers during their participation in the areas of recruitment, training, and other areas of Human Resource management.
- Recruitment supports: provides financial support for work placements; assist with job postings, organizing local, provincial, and national job fairs; refer employers to partnering departments to address international recruitment needs; and provides experiential education (FutureNB). Some of the supports offered are funded through Adjustment Services
- Training supports: provides funding for various types of training for both employees and supervisors or managers, customized training programs for employees, as well as cultural/diversity awareness training. Training interventions may be funded through other appropriate programs, including the Labour Force Training (LFT) program and Workplace Essential Skills (WES) training
- Human resource management supports: provides funding to employers for external Human Resource expertise in areas such as Human Resource (HR) planning, the development of policies and procedures for various Human Resource practices, job analysis, compensation and benefits planning, succession planning, coaching on cultural diversity and workplace culture, etc. Many of these supports are funded through Adjustment Services
Target client groups:
- New Brunswick employers
- associations
- non-profit organizations
Benefits and expected results: More strategic investments ensure employers' Human Resource needs are met through Working NB supports; reducing the number of unemployed persons and unfilled job vacancies.
Program: Employment Services program
Expenditures: $43.1M (27.3%)
Description: The Employment Services Program has 4 components:
- Labour Force Adjustment (LFA) provides support to eligible businesses and organizations in addressing significant changes impacting human resources (HR) at their workplace. The program's objective is to support the steps necessary for labour and management to make critical labour force changes in the workplace by investing time, energy, and/or resources in a concerted manner. Labour Force Adjustment Committee's (LFAC) coordinate responses to workforce disruptions, assess HR needs, create transition plans, and connect stakeholders to employment services and training, aiming to support workers and employers during changes. Committees include employers, workers, government, and community stakeholders, formed as needed for single or multiple employers across industries
- Labour Market Supports (LMS) provides support to the labour market in dealing with human resource requirements (i.e. labour force imbalances) through means such as, but not limited to, human resource planning and research. LMS focuses on supporting sector groups/associations and not-for-profit organizations to improve the capacity to deal with human resource requirements. requirements. The program's objective is to identify new and better tools and approaches that help individuals prepare for, return to, or keep employment and become productive clients in the labour force
- Labour Force Training (LFT) provides funds to eligible businesses and organizations which may assist in the training of existing employees so that they may develop the necessary skills to increase, improve and/or maintain labour market attachment. Given the current labour market context in New Brunswick, leveraging strategic training to a workforce allows for better retention of employees and improved morale, leading to overall success in the organization
- Employment Assistance Service (EAS) provides a variety of employment services to targeted clients. EAS is typically delivered through external contracts in partnership with non-profit, private and/or public organizations, where direct measurable employment results (placements) are achieved. The program's objective is to provide specialized employment services to individuals facing barriers to employment
Target client groups:
- New Brunswick employers
- associations
- non-profit organizations
- individuals seeking employment and or upskilling
Benefits and expected results: More strategic investments ensure employers' Human Resource needs are met through WorkingNB supports; reducing the number of unemployed persons and unfilled job vacancies.
Program: Training and Skills Development (TSD)
Expenditures: $65.3M (41.3%)
Description: This program provides support to case-managed clients whose employment action plan identifies skills development as necessary to prepare them for employment opportunities and access the appropriate training and education programs necessary for their return to work. The focus of the program is to help clients receive training or educational programs which will allow them to quickly return to work.
The program has 2 objectives:
- provide case-managed individuals with access to appropriate training and educational opportunities related to current and emerging employment opportunities
- increase the number of individuals who find sustainable employment as a result of receiving financial assistance through a training intervention
For the 2024-25 year, this will consist of 2 programs: literacy upgrading and support for post-secondary training interventions.
Target client groups: Unemployed individuals who have identified skills training, through a developed Employment Action Plan (EAP), as being necessary to access long-term employment opportunities.
Benefits and expected results:
- percentage of clients employed after the completion of an intervention - 84.0%
- percentage of clients who obtained employment in a related field of study - 88.0%
Program: Future New Brunswick Co-op Program and Future New Brunswick Program
Expenditures: $3.0M (1.9%)
Description: The co-op placement component (Future NB Co-op) encourages placements in the private or not-for-profit sector for students who are enrolled in a recognized college or university co-operative education program. These programs formally integrate a student's academic studies with work experience. The usual plan is for the student to alternate periods of experience in a field related to their program of study. Co-op placements occur throughout the fiscal year through 3 intakes (1 in the summer, 1 in the fall and 1 in the winter).
Future New Brunswick provides information, resources, and experiential learning opportunities to students at the high school and post-secondary levels.
Objectives: To provide students with meaningful, experiential learning opportunities/work experience related to their skills and education.
Target client groups: New Brunswick University and College students attending publicly funded institutions
Benefits and expected results:
- ensuring students are better prepared to attain employment in NB post-graduation
- creating connections between students/employers earlier on
- fostering these connections and ensuring labour market demands are addressed through placements/training of NB students
- encouraging connections with students/employers to encourage retention of NB graduates for available NB jobs
Program: Community Adult Learning (CAL) training
Expenditures: $2.5M (1.6%)
Description: Through a service delivery funding partnership between government and communities, Adult Learning Services (Community Adult Learning Program (CALP)) give adult New Brunswickers access to learning services in, or near, their communities. Two options are available for them: the Academic and the Digital Literacy (DL) services. Each is designed to meet the needs of adult learners and improve their skills, whether for personal, employment, or further training reasons.
Academic Services
Academic Services offers free academic training in both official languages throughout the province.
Adults who wish to attend academic training can access academic upgrading up to the General Educational Diploma (GED) or Canadian Adult Education Credential (CAEC) Preparation level. The schedules are flexible to meet the needs of adults who can choose to attend full or part-time training.
Academic training offers quality teaching and guidance to each participating learner.
Digital Literacy Services
The rapid development and adoption of digital technologies has changed the way we work, learn, and communicate. From social networking, to commerce, to the workplace, digital skills have become increasingly important in today's labour market.
In response to this new reality, WorkingNB established Digital Literacy Services, focusing on teaching basic digital skills needed to thrive in today's digital-rich society.
These services are designed to provide, throughout New Brunswick, an adult-friendly learning environment and encourage learners to be actively involved in the planning of their Individualized Learning Plan and in setting and reaching their goals. An adult education approach is used to maximize the learner's success, encouraging them to become self-directed learners, guiding them in their learning objectives, and valuing prior learning and experiences.
Target client groups: EI eligible adults without a high school diploma and/or adults requiring validation of their skills
Benefits and expected results:
- serve approximately 2,000 learners
- increased literacy skills of adult learners
- learners gain GED/CAEC certification
- learner progression to further education or skills training
- increase in employment (or employment retention) after training
Program: Workplace Connections (WPC)
Expenditures: $7.3 (4.6%)
Description: Workplace Connections is a service available through WorkingNB for individuals who require work experience as identified through their employment action plan (EAP).
The objective of WPC is to increase the labour market attachment of individuals by providing workplace opportunities that help overcome employment barriers or acquire experience and/or skills required for an occupation.
While WPC includes a range of supports available to individuals, it indirectly benefits the participating employers who accommodates a WPC placement.
An individual's WPC stream is determined based on their needs and goals as identified by their Employment Action Plan (EAP), developed either through WorkingNB, Social Development or another authorized referral agent (i.e., Indigenous organization, Employment Assistance Services).
- Barriers to Employment: for individuals who have a barrier(s) that needs to be overcome to be able to contribute successfully to the workplace (e.g., gaps in employment). Includes career choice/career exploration subcomponent
- Skills Development: for individuals who need to acquire and/or develop skills that will enable them to succeed in a specific position/job (e.g., lack of experience in a field)
- Group-Based Initiatives: provides individuals with an experiential placement that is part of a group-based initiative aimed at meeting the needs of individuals and the labour market. This stream is for regional and provincial initiatives combining WPC with another intervention (e.g., WES)
Target client groups: Unemployed or underemployed New Brunswick residents (18 years of age and over) who are legally entitled to work in Canada
Benefits and expected results: The service increases the labour market attachment of individuals by providing them with workplace opportunities to address employment barriers or acquire experience/skills required for an occupation.
Program: Self-Employment Benefit (SEB) program
Expenditures: $4.6M (2.9%)
Description: Self-Employment Benefit (SEB) helps unemployed individuals create a job for themselves by starting a new business. SEB provides various types of support during the initial development phase of the business, including financial assistance, coaching and ongoing technical advice. Coaching is tailored to meet individual needs and can include subjects such as business plan development, accounting, and marketing.
Objectives of SEB:
- to assist unemployed individuals in securing sustainable self-employment
- to stimulate the creation of long-term employment opportunities in the private sector
Target client groups: Unemployed individuals seeking self-employment opportunities who need assistance with various elements to be successful
Benefits and expected results: To continue to exceed targets for program inquiries, to serve over 250 individuals with the program
3.2.5 Quebec
In this section
- Employment Benefits and Support Measures key facts
- Labour market context
- Canada-Newfoundland and Labrador Labour Market Development Agreement
- Designated and under-represented groups
- Stakeholder consultations
- Program delivery and participant supports
Employment Benefits and Support Measures key facts
| Indicator | Active claimant clients | Former claimant clients | PPE clients | Non-insured clients | Total |
|---|---|---|---|---|---|
| Clients served | 53,040 | 23,994 | 8,986 | 43,817 | 129,837 |
| Share of total | 40.9% | 18.5% | 6.9% | 33.7% | 100.0% |
- Notes:
- 1 This table reflects all clients served between April 1, 2024 and March 31, 2025.
- 2 This table excludes Indigenous pan-Canadian data.
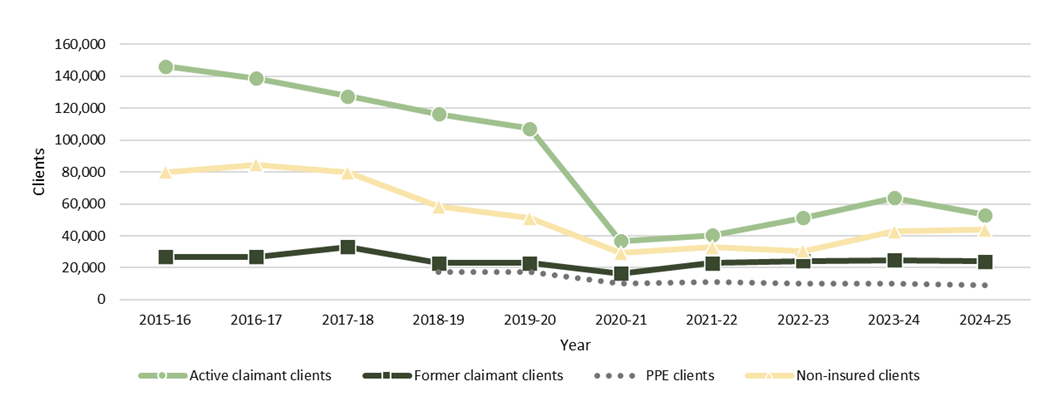
Text description
| Year | Active claimant clients | Former claimant clients | PPE clients | Non-insured clients |
|---|---|---|---|---|
| 2015-16 | 146,359 | 26,946 | n/a | 79,814 |
| 2016-17 | 138,682 | 26,945 | n/a | 84,716 |
| 2017-18 | 127,614 | 32,965 | n/a | 79,764 |
| 2018-19 | 116,261 | 23,005 | 17,248 | 58,228 |
| 2019-20 | 107,330 | 22,990 | 17,524 | 51,110 |
| 2020-21 | 36,742 | 16,328 | 10,023 | 29,197 |
| 2021-22 | 40,257 | 22,821 | 11,231 | 32,807 |
| 2022-23 | 51,331 | 24,283 | 9,961 | 30,575 |
| 2023-24 | 63,751 | 24,851 | 10,026 | 42,607 |
| 2024-25 | 53,040 | 23,994 | 8,986 | 43,817 |
- Notes:
- 1 This chart reflects all clients served between April 1, 2024 and March 31, 2025.
- 2 This chart excludes Indigenous pan-Canadian data.
| Year | Active claimant clients | Former claimant clients | PPE clients | Non-insured clients |
|---|---|---|---|---|
| 2015-16 | 57.8% | 10.6% | n/a | 31.5% |
| 2016-17 | 55.4% | 10.8% | n/a | 33.8% |
| 2017-18 | 53.1% | 13.7% | n/a | 33.2% |
| 2018-19 | 54.1% | 10.7% | 8.0% | 27.1% |
| 2019-20 | 53.9% | 11.6% | 8.8% | 25.7% |
| 2020-21 | 39.8% | 17.7% | 10.9% | 31.6% |
| 2021-22 | 37.6% | 21.3% | 10.5% | 30.6% |
| 2022-23 | 44.2% | 20.9% | 8.6% | 26.3% |
| 2023-24 | 45.1% | 17.6% | 7.1% | 30.2% |
| 2024-25 | 40.9% | 18.5% | 6.9% | 33.7% |
- Notes:
- 1 This table reflects all clients served between April 1, 2024 and March 31, 2025.
- 2 This table excludes Indigenous pan-Canadian data.

Text description
| Year | Youth (15-24 years old) | Core-age (25-54 years old) | Workers aged 55+ | Age undisclosed2 |
|---|---|---|---|---|
| 2015-16 | 45,785 | 146,872 | 32,370 | 28,092 |
| 2016-17 | 45,401 | 150,680 | 35,539 | 18,723 |
| 2017-18 | 41,586 | 145,805 | 36,706 | 16,246 |
| 2018-19 | 36,203 | 129,383 | 37,886 | 11,270 |
| 2019-20 | 32,443 | 121,304 | 37,259 | 7,948 |
| 2020-21 | 19,633 | 61,719 | 10,874 | 64 |
| 2021-22 | 22,303 | 71,371 | 13,386 | 56 |
| 2022-23 | 20,605 | 73,902 | 21,617 | 26 |
| 2023-24 | 23,575 | 88,920 | 28,705 | 35 |
| 2024-25 | 22,576 | 83,325 | 23,909 | 27 |
- 1 This chart reflects all clients served between April 1, 2024 and March 31, 2025.
- 2 Clients for whom valid dates of birth were not provided are included in the 'Age undisclosed' category.
- 3 This chart excludes Indigenous pan-Canadian data.
- 4 Apprentice clients were excluded from the age breakout prior to 2024-25. Starting 2024-25 they are reported under a "known" age unless their date of birth was invalid or missing.
| Year | Youth (15-24 years old) | Core-age (25-54 years old) | Workers aged 55+ | Age undisclosed2 |
|---|---|---|---|---|
| 2015-16 | 18.1% | 58.0% | 12.8% | 11.1% |
| 2016-17 | 18.1% | 60.2% | 14.2% | 7.5% |
| 2017-18 | 17.3% | 60.7% | 15.3% | 6.8% |
| 2018-19 | 16.9% | 60.3% | 17.6% | 5.2% |
| 2019-20 | 16.3% | 61.0% | 18.7% | 4.0% |
| 2020-21 | 21.3% | 66.9% | 11.8% | 0.1% |
| 2021-22 | 20.8% | 66.6% | 12.5% | 0.1% |
| 2022-23 | 17.7% | 63.6% | 18.6% | 0.0% |
| 2023-24 | 16.7% | 63.0% | 20.3% | 0.0% |
| 2024-25 | 17.4% | 64.2% | 18.4% | 0.0% |
- Notes:
- 1 This table reflects all clients served between April 1, 2024 and March 31, 2025.
- 2 Clients for whom valid dates of birth were not provided are included in the 'Age undisclosed' category.
- 3 This table excludes Indigenous pan-Canadian data.
- 4 Apprentice clients were excluded from the age breakout prior to 2024-25. Starting 2024-25 they are reported under a "known" age unless their date of birth was invalid or missing.
| Service type | Services delivered | Year-over-year change | Share of total | Year-over-year change (p.p.) |
|---|---|---|---|---|
| Employment Benefits | 16,977 | +1.1% | 11.2% | +1.3 |
| Support Measure | 134,488 | -11.5% | 88.8% | -1.3 |
| Total services | 151,465 | -10.2% | 100.0% | n/a |
- Notes:
- 1 This table reflects all new services started between April 1, 2024 and March 31, 2025.
- 2 This table excludes Indigenous pan-Canadian data.
| Service type | Services | Year-over-year change | Expenditures | Year-over-year change |
|---|---|---|---|---|
| Targeted Wage Subsidies | 4,861 | -0.9% | $124,990,000 | +2.2% |
| Self-Employment | 136 | -72.9% | $4,588,000 | -70.6% |
| Job Creation Partnerships | 0 | n/a | $43,845,000 | n/a |
| Skills Development-Regular | 11,980 | +5.2% | $183,519,000 | -33.6% |
| Skills Development-Apprentices | n/a | n/a | Included above | Included above |
| Targeted Earning Supplements | n/a | n/a | n/a | n/a |
| Totals Employment Benefits | 16,977 | +1.1% | $356,942,000 | -13.8% |
| Employment Services | 132,661 | -11.8% | $146,404,000 | +0.0% |
| Individual Counselling | 1,827 | +25.0% | Included above | Included above |
| Labour Market Partnerships | n/a | n/a | $27,675,000 | -62.3% |
| Research & Innovation | n/a | n/a | $3,523,000 | -47.9% |
| Total Support Measure | 134,488 | -11.5% | $177,602,000 | -21.6% |
| Total EBSMs | 151,465 | -10.2% | $534,544,000 | -16.6% |
- Notes:
- 1 This table reflects all new services started between April 1, 2024 and March 31, 2025.
- 2 This table excludes Indigenous pan-Canadian data.
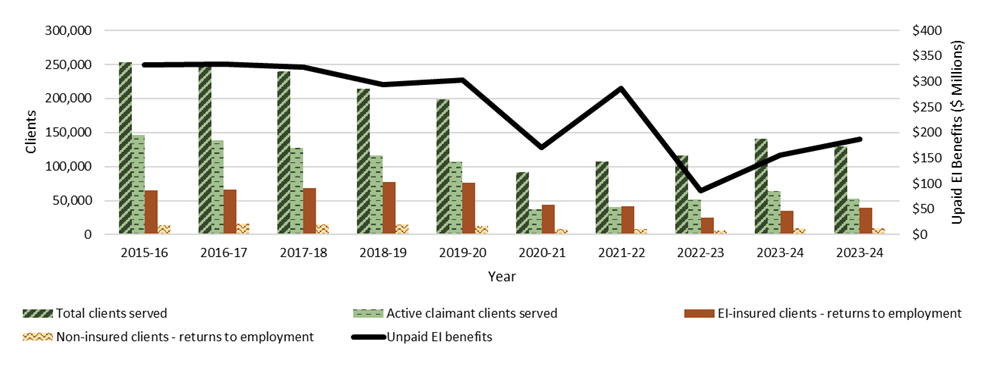
Text description
| Year | Unpaid EI benefits | EI-insured clients - returns to employment3 | Non-insured clients - returns to employment | Active claimantclients served | Total clients served4 |
|---|---|---|---|---|---|
| 2015-16 | $332,312,524 | 64,697 | 13,458 | 146,359 | 253,119 |
| 2016-17 | $334,050,331 | 66,468 | 15,769 | 138,682 | 250,343 |
| 2017-18 | $327,619,996 | 68,794 | 14,880 | 127,614 | 240,343 |
| 2018-19 | $293,919,267 | 77,535 | 15,460 | 116,261 | 214,742 |
| 2019-20 | $302,813,344 | 75,735 | 13,204 | 107,330 | 198,954 |
| 2020-21 | $171,442,339 | 43,761 | 8,647 | 36,742 | 92,290 |
| 2021-22 | $286,041,048 | 41,409 | 8,600 | 40,257 | 107,116 |
| 2022-23 | $85,763,636 | 24,629 | 6,246 | 51,331 | 116,150 |
| 2023-24 | $156,384,552 | 35,046 | 9,047 | 63,751 | 141,235 |
| 2024-25 | $186,775,955 | 39,335 | 9,353 | 53,040 | 129,837 |
- Notes:
- 1 This chart excludes Indigenous pan-Canadian data.
- 2 Volatility in the Unpaid EI Benefits from 2021‑22 to 2022‑23 correlates with the speed of recovery of the labour market that allowed many Canadians to return to work before exhausting their EI benefits.
- 3 The EI-insured return to employment returns includes active claimants, former claimants, and PPE clients.
- 4 "Total Clients Served" refers to the count of EI-insured clients served (active claimant clients, former claimant clients, and PPE clients) and non-insured clients.
- 5 Historical data has been adjusted to enhance accuracy.
Labour market context
In 2024-25, Quebec's labour market experienced a moderate recovery after a period of stagnation between the end of 2023 and the summer of 2024. This stagnation was accompanied by strong growth in the working-age population, mainly attributable to temporary immigration and the influx of refugee claimants into Quebec. Unemployment rose, despite a still-high employment rate.
At the end of 2024, Quebec had just over 2 unemployed workers per job vacancy, compared to less than 1 between the end of 2021 and the throughout of 2022. Despite this increase, the ratio remained below the national average. The employment rate for people aged 15 to 64 reached 77.3%,Footnote 69 the highest among Canadian provinces and among the highest in OECD countries. The unemployment rate, at 5.3%,Footnote 70 remained one of the lowest in the past 50 years. In comparison, the unemployment rate in Canada was 6.3% in 2024, up slightly from the 5.4% rate recorded in 2023.
The labour supply continues to be constrained by population aging as baby boomers gradually leave the labour market. This trend is expected to continue over the coming decades, exacerbating challenges of recruiting and retaining staff.
Canada-Quebec Labour Market Development Agreement
In 2024-25, Quebec received approximately $593 million under the LMDA. Approximately 130,000 participants received public employment services. Quebec reported that nearly 56.8% of active claimant clients had found a job within 6 months of receiving training and employment support measures, which contributed to savings of approximately $186.7M in unpaid EI benefits to active claimants.
The ministère de l'Emploi et de la Solidarité sociale (Ministry of Employment and Social Solidarity) (MESS) continued its efforts to address the labour shortage challenge. The Opération main-d'œuvre (Operation Workforce) government initiative, which the MESS coordinates and prioritizes training for individuals in certain industries (health and social services, education, educational childcare services, information technology, engineering and construction). In 2024-25, 52.2% of those who had completed training in a sector targeted by Operation Workforce found a job. In 2024-25, the allowance of $475 per week for unemployed people in qualifying training also continued, which helped enhance the appeal of training programs.
Designated and under-represented groups
Public employment services continued to pay particular attention to groups underrepresented in the labour market, including people with disabilities and young people. In 2024-25, thousands of people from these groups found employment after participating in an employability measure.
For example, as part of the Plan d'action pour le secteur de la construction (Action plan for the construction sector), wage subsidies were used to facilitate job placement, particularly for women in this traditionally male-dominated sector.
It is worth noting that the Commission des partenaires du marché du travail (CPMT) (CPMT) plays a central role in identifying the specific needs and barriers of clients. It relies on a network of advisory committees dedicated to these underrepresented groups, which actively contribute to the development of the ministry's strategies and action plans. These committees provide a better understanding of the realities experienced by these populations and enable public employment services to be adapted as a result with a view on inclusion and equity.
Stakeholder consultations
The Government of Quebec continued to work closely with the CPMT to ensure that public employment services are aligned with labour market needs. The CPMT, which brings together representatives from employers, workers, the educational community, and organizations that specialize in employability, plays a key role in developing the annual action plan and monitoring strategies.
In February 2025, an employment forum enabled national, regional, and sectoral partners to discuss the economic impact of U.S. trade policies and adapt their responses accordingly. This collaboration strengthened the network's ability to respond quickly to emerging challenges.
Operation Workforce
Quebec continued its efforts to address the labour shortage challenge. The Operation Workforce government initiative prioritizes assistance to businesses in certain sectors (health, education, childcare, information technology, engineering, and construction) as well as businesses in the industrial and scientific sectors and the life sciences. In 2024-25, 47.5% of businesses that had received assistance from public employment services were in sectors that were prioritized by the government.
Moreover, in support of the initiative launched in the fall of 2023 to train 4,000 to 5,000 people in the construction sector, the Government of Quebec, through the MESS, is providing $750 per week in financial support from the Ministry of Education to eligible learners during their training.
In addition to coordinating this, the government aims to meet labour market needs in certain economic sectors, Quebec has taken action to support the labour market. Therefore, it supported skills development among employed individuals, particularly to increase productivity. It has also helped businesses through activities aimed at adapting human resources management practices to promote the professional integration and retention of a diverse workforce.
Program delivery and participant supports
This section provides an overview of the specific programs and financial supports offered through the LMDA. It includes details on the available programs and initiatives, their duration, associated funding, as well as additional supports provided to participants, for example:
Program: Concertation pour l’emploi (Consultation and Collaboration for Employment)
Expenditures: $27,675,000 (6.6%)
Description: Fosters collaboration between employers, employee associations, professional associations, and clients facing common employment issues by supporting them in developing and implementing strategies to respond to changes in the labour market. The solutions aim to meet human resources needs, address issues of access to employment, and remove barriers to job creation, while supporting and facilitating active employment measures.
Target client groups: Businesses and their workers
Benefits and expected results: Support for consultation and implementation of sectoral or regional employment strategies. Expected results: concerted solutions to meet labour needs, improved access to employment, and reduced barriers to job creation.
Program: Contrat d’intégration au travail (Work Integration contract)
Expenditure: $38,895,000 (9.3%)
Description: Encourages the hiring and continued employment of people with disabilities in regular workplaces by offering appropriate accommodations and financial compensation to employers. This ensures equal access to work and equal opportunities for people with disabilities in their labour market integration.
Target client groups: Persons with disabilities
Benefits and expected results: Accommodations and financial support to promote hiring and job retention. Expected results: sustainable integration of persons with disabilities into the workforce and increased participation in the labour market.
Program: Formation de la main-d’œuvre (Workforce training)
Expenditure: $47,111,000 (11.2%)
Description: Enables targeted client groups to acquire general or specialized skills tailored to their needs for entering or remaining in employment. The aim is to reduce unemployment by offering skills training that is transferable and takes into account the needs of the labour market.
Target client groups: Unemployed individuals and businesses
Benefits and expected results: Access to training activities tailored to the needs of participants and the labour market. Expected outcomes: acquisition of transferable skills, integration or retention in employment, and reduction in unemployment
Program: Initiative ciblée pour les travailleurs expérimentés (Initiatives targeting experienced workers)
Expenditure: $3,796,000 (0.9%)
Description: Helps experienced workers aged 50 and over re-enter the labour market by providing them with services designed to enhance their employability and extend their working lives
Target client groups: Workers aged 50 and over
Benefits and expected results: Services aimed at enhancing employability and providing support for returning to work. Expected results: reintegration into the labour market and extension of working life for workers aged 50 and over.
Program: Programme de formations de courte durée privilégiant les stages dans les professions priorisées par la Commission des partenaires du marché du travail (CPMT) (Short-term training program, which focuses on internships in occupations that are prioritized by the CPMT (Labour Market Partners Commission))
Expenditure: $10,002,000 (2.4%)
Description: This measure aims to meet the need for skilled labour in targeted economic sectors by enabling newly hired, retrained, or promoted individuals to acquire the necessary skills through tailored training programs, including workplace internships, which are developed in partnership with educational institutions and businesses
Target client groups: Newly hired workers who need to develop their skills
Benefits and expected results: Short-term training, including workplace internships, in occupations prioritized by the CPMT. Expected results: rapid acquisition of applied skills, job integration/retention, and contribution to skilled labour needs.
Program: Projet de préparation à l’emploi (Employment Preparation project)
Expenditure: $43,663,000 (10.4%)
Description: This measure is aimed at people who are disadvantaged in terms of employment, enabling them to develop personal and labour market integration skills through integrated preparation and integration activities.
Target client groups: Employment-disadvantaged individuals
Benefits and expected results: Preparation and integration activities that enable the development of personal and employability skills. Expected results: progress toward employment, improved self-sufficiency, and reduced barriers to labour market integration.
Program: Programme de subventions aux entreprises adaptées (PSEA) (Adapted Business Grant Program (ABGP))
Expenditure: $70,258,000 (16.7%)
Description: Aims to create adapted jobs for persons with disabilities, while supporting their employability development and their transition to sustainable employment. It supports adapted businesses in integrating the required accommodation measures.
Target client groups: Adapted businesses and people with disabilities
Benefits and expected results: Support for adapted businesses to offer jobs and workplace accommodations. Expected results: development of the employability of persons with disabilities and support with their transition to sustainable employment.
Program: Service d’aide à l’emploi (Employment Assistance Service)
Expenditure: $146,398,000 (34.8%)
Description: Help job seekers identify their needs and access peripheral services, such as career guidance and job search assistance, to facilitate their integration into the labour market
Target client groups: Unemployed individuals
Benefits and expected results: Guidance services, job search assistance, and support for the integration process. Expected results: improved employability, return to work, and job retention.
Program: Soutien au travail autonome (Self-employment support)
Expenditure: $15,598,000 (3.7%)
Description: The objective is to support individuals who wish to become self-employed or start their own business by offering them advice and support for the development of promising entrepreneurial projects
Target client groups: Unemployed individuals with a self-employment project
Benefits and expected results: Advice and support for the development of entrepreneurial and self-employment projects. Expected results: implementation of viable projects, creation of economic activity, and sustainable integration into the workforce through self-employment.
Program: Subventions salariales (Wage subsidies)
Expenditure: $10,321,000 (2.5%)
Description: Encourages the hiring of unemployed individuals through financial support for businesses, enabling integration into sustainable employment, the acquisition of meaningful initial experience, or specific support for groups such as immigrants or visible minorities
Target client groups: Unemployed individuals, immigrants, visible minorities
Benefits and expected results: Financial support for employers to facilitate the hiring of unemployed individuals, including certain underrepresented groups. Expected results: acquisition of work experience, integration into sustainable employment, and reduction of barriers to hiring.
Program: Research and Innovation
Expenditure: $6,765,000 (1.6%)
Description: This measure supports the implementation of experimental and research projects aimed at testing new intervention approaches to improve employment policies, measures, and services.
Target client groups: Since these are innovative projects, each project may target unique clients.
Benefits and expected results: Support for experimental and research projects on new intervention approaches. Expected results: knowledge production, improvement of practices, and contribution to the evolution of employment measures and services.
3.2.6 Ontario
In this section
- Employment Benefits and Support Measures key facts
- Labour market context
- Canada-Newfoundland and Labrador Labour Market Development Agreement
- Designated and under-represented groups
- Stakeholder consultations
- Program delivery and participant supports
Employment Benefits and Support Measures key facts
| Indicator | Active claimant clients | Former claimant clients | PPE clients | Non-insured clients | Total |
|---|---|---|---|---|---|
| Clients served | 36,818 | 46,200 | 17,078 | 46,800 | 146,896 |
| Share of total | 25.1% | 31.5% | 11.6% | 31.9% | 100.0% |
- Notes:
- 1 This table reflects all new services started between April 1, 2024 and March 31, 2025.
- 2 This table excludes Indigenous pan-Canadian data.

Text description
| Year | Active claimant clients | Former claimant clients | PPE clients | Non-insured clients |
|---|---|---|---|---|
| 2015-16 | 60,489 | 18,611 | n/a | 82,458 |
| 2016-17 | 62,339 | 24,796 | n/a | 103,402 |
| 2017-18 | 56,484 | 29,702 | n/a | 106,483 |
| 2018-19 | 53,221 | 26,626 | 25,228 | 100,631 |
| 2019-20 | 51,739 | 27,360 | 24,302 | 94,111 |
| 2020-21 | 41,545 | 21,023 | 15,325 | 61,254 |
| 2021-22 | 29,780 | 25,828 | 14,027 | 55,578 |
| 2022-23 | 26,667 | 38,406 | 18,311 | 68,801 |
| 2023-24 | 33,812 | 39,929 | 17,948 | 62,048 |
| 2024-25 | 36,818 | 46,200 | 17,078 | 46,800 |
- Notes:
- 1 This table reflects all new services started between April 1, 2024 and March 31, 2025.
- 2 This table excludes Indigenous pan-Canadian data.
| Year | Active claimant clients | Former claimant clients | PPE clients | Non-insured clients |
|---|---|---|---|---|
| 2015-16 | 37.4% | 11.5% | n/a | 51.0% |
| 2016-17 | 32.7% | 13.0% | n/a | 54.3% |
| 2017-18 | 29.3% | 15.4% | n/a | 55.3% |
| 2018-19 | 25.9% | 12.9% | 12.3% | 48.9% |
| 2019-20 | 26.2% | 13.9% | 12.3% | 47.6% |
| 2020-21 | 29.9% | 15.1% | 11.0% | 44.0% |
| 2021-22 | 23.8% | 20.6% | 11.2% | 44.4% |
| 2022-23 | 17.5% | 25.2% | 12.0% | 45.2% |
| 2023-24 | 22.0% | 26.0% | 11.7% | 40.4% |
| 2024-25 | 25.1% | 31.5% | 11.6% | 31.9% |
- Notes:
- 1 This table reflects all new services started between April 1, 2024 and March 31, 2025.
- 2 This table excludes Indigenous pan-Canadian data.

Text description
| Year | Youth (15-24 years old) | Core-age (25-54 years old) | Workers aged 55+ | Age undisclosed2 |
|---|---|---|---|---|
| 2015-16 | 33,271 | 95,902 | 16,775 | 15,610 |
| 2016-17 | 37,909 | 116,420 | 20,205 | 16,003 |
| 2017-18 | 42,131 | 114,077 | 21,344 | 15,117 |
| 2018-19 | 52,061 | 124,276 | 22,681 | 6,688 |
| 2019-20 | 42,134 | 126,548 | 23,123 | 5,707 |
| 2020-21 | 33,840 | 91,969 | 13,016 | 322 |
| 2021-22 | 30,973 | 81,817 | 12,056 | 367 |
| 2022-23 | 36,464 | 98,625 | 16,766 | 330 |
| 2023-24 | 31,951 | 105,197 | 16,252 | 337 |
| 2024-25 | 29,842 | 100,955 | 15,862 | 840 |
- Notes:
- 1 This chart reflects all clients served between April 1, 2024 and March 31, 2025.
- 2 Clients for whom valid dates of birth were not provided are included in the 'Age undisclosed' category.
- 3 This chart excludes Indigenous pan-Canadian data.
- 4 Apprentice clients were excluded from the age breakout prior to 2024-25. Starting 2024-25 they are reported under a "known" age unless their date of birth was invalid or missing.
| Year | Youth (15-24 years old) | Core-age (25-54 years old) | Workers aged 55+ | Age undisclosed2 |
|---|---|---|---|---|
| 2015-16 | 20.6% | 59.4% | 10.4% | 9.7% |
| 2016-17 | 19.9% | 61.1% | 10.6% | 8.4% |
| 2017-18 | 21.9% | 59.2% | 11.1% | 7.8% |
| 2018-19 | 25.3% | 60.4% | 11.0% | 3.3% |
| 2019-20 | 21.3% | 64.1% | 11.7% | 2.9% |
| 2020-21 | 24.3% | 66.1% | 9.4% | 0.2% |
| 2021-22 | 24.7% | 65.3% | 9.6% | 0.3% |
| 2022-23 | 24.0% | 64.8% | 11.0% | 0.2% |
| 2023-24 | 20.8% | 68.4% | 10.6% | 0.2% |
| 2024-25 | 19.9% | 68.7% | 10.8% | 0.6% |
- Notes:
- 1 This table reflects all clients served between April 1, 2024 and March 31, 2025.
- 2 Clients for whom valid dates of birth were not provided are included in the 'Age undisclosed' category.
- 3 This chart excludes Indigenous pan-Canadian data.
- 4 Apprentice clients were excluded from the age breakout prior to 2024-25. Starting 2024-25 they are reported under a "known" age unless their date of birth was invalid or missing.
| Service type | Services delivered | Year-over-year change | Share of total | Year-over-year change (p.p.) |
|---|---|---|---|---|
| Employment Benefits | 38,492 | -3.9% | 19.1% | -0.3 |
| Support Measure | 163,052 | -2.3% | 80.9% | +0.3 |
| Total services | 201,544 | -2.6% | 100.0% | n/a |
- Notes:
- 1 This table reflects all new services started between April 1, 2024 and March 31, 2025.
- 2 This table excludes Indigenous pan-Canadian data.
| Service type | Services | Year-over-year change | Expenditures | Year-over-year change |
|---|---|---|---|---|
| Targeted Wage Subsidies | n/a | n/a | n/a | n/a |
| Self-Employment | n/a | n/a | n/a | n/a |
| Job Creation Partnerships | 67 | -10.7% | $1,243,458 | -1.9% |
| Skills Development-Regular | 8,643 | +8.7% | $204,480,923 | -2.7% |
| Skills Development-Apprentices | 29,782 | -7.0% | Included above | Included above |
| Targeted Earning Supplements | n/a | n/a | n/a | n/a |
| Totals Employment Benefits | 38,492 | -3.9% | $205,724,381 | -2.7% |
| Employment Services | 155,865 | -3.0% | $271,685,504 | -22.9% |
| Individual Counselling | 7,187 | +13.7% | Included above | Included above |
| Labour Market Partnerships | n/a | n/a | $41,536,048 | -14.1% |
| Research & Innovation | n/a | n/a | $64,804,868 | -47.0% |
| Total Support Measure | 163,052 | -2.3% | $378,026,420 | -27.7% |
| Total EBSMs | 201,544 | -2.6% | $583,750,801 | -20.5% |
- Notes:
- 1 This table reflects all new services started between April 1, 2024 and March 31, 2025.
- 2 This table excludes Indigenous pan-Canadian data.

Text description
| Year | Unpaid EI benefits | EI-insured clients - returns to employment3 | Non-insured clients - returns to employment | Active claimantclients served | Total clients served4 |
|---|---|---|---|---|---|
| 2015-16 | $236,037,611 | 35,625 | 17,789 | 60,489 | 161,558 |
| 2016-17 | $262,656,120 | 37,044 | 19,127 | 62,339 | 190,537 |
| 2017-18 | $233,152,537 | 39,678 | 28,423 | 56,484 | 192,669 |
| 2018-19 | $265,220,824 | 47,400 | 32,270 | 53,221 | 205,706 |
| 2019-20 | $250,508,356 | 46,864 | 28,418 | 51,739 | 197,512 |
| 2020-21 | $222,913,962 | 51,561 | 42,785 | 41,545 | 139,147 |
| 2021-22 | $443,437,968 | 64,607 | 39,426 | 29,780 | 125,213 |
| 2022-23 | $242,171,435 | 58,173 | 42,291 | 26,667 | 152,185 |
| 2023-24 | $250,122,741 | 54,918 | 28,824 | 33,812 | 153,737 |
| 2024-25 | $296,515,048 | 53,752 | 31,131 | 36,818 | 146,896 |
- Notes:
- 1 This chart excludes Indigenous pan-Canadian data.
- 2 Volatility in the Unpaid EI Benefits from 2021‑22 to 2022‑23 correlates with the speed of recovery of the labour market that allowed many Canadians to return to work before exhausting their EI benefits.
- 3 The EI-insured return to employment returns includes active claimants, former claimants, and PPE clients
- 4 "Total Clients Served" refers to the count of EI-insured clients served (active claimant clients, former claimant clients, and PPE clients) and non-insured clients.
- 5 Historical data has been adjusted to enhance accuracy.
Labour market context
In 2024-25, Ontario continued to experience moderating labour market conditions. While employment gains were recorded throughout the year, employers in key sectors such as healthcare, skilled trades, and manufacturing continued to face challenges in recruiting and retaining workers with the skills needed to meet current demands. Demographic shifts, such as the aging population and slower immigration growth, continued to shape the labour market and are expected to have long-term implications.
Labour market tightness indicators such as job vacancies and employer concerns about skilled labour shortages, began returning to historic norms. However, economic uncertainty grew following the United States' imposition of tariffs targeting Ontario's auto, steel, and aluminum sectors. These developments introduced new risks to employment in related industries and added pressure on Ontario's export-dependent economy.
To address these challenges, Ontario continued to invest in workforce development and training initiatives to support economic resilience. With projected job openings of over 500,000 in skilled trades-related occupations and more than 460,000 in the healthcare and social assistance sector by 2032, targeted employment and training supports through the LMDA remain essential to equipping workers with the skills needed to succeed in a changing economy.
The unemployment rate increased from 5.6% in 2023 to 7.0% in 2024 reflecting a slowdown in employment growth and rising labour market pressures. In comparison, Canada's unemployment rate rose from 5.4% in 2023 to 6.3% in 2024.Footnote 71
In March 2025, the province had approximately 180,000 job vacanciesFootnote 72 compared to approximately 667,000 persons who were unemployed, actively seeking employment within the last 4 weeks, and available for work.Footnote 73
Canada-Ontario Labour Market Development Agreement
In 2024-25, Ontario received approximately $641 million though the LMDA, which served approximately 153,700 clients. Within 6 months of receiving training and employment supports, approximately 74% of active claimant clients were employed,Footnote 74 resulting in an overall savings of approximately $250 million in unpaid EI benefits.
In 2024-25, Ontario used funding from the LMDA to:
- support training and upskilling initiatives in sectors facing persistent labour shortages, such as healthcare and skilled trades
- help transition people from social assistance programs to meaningful jobs
- grow the skilled trades to modernize the skilled trades and apprenticeship system
Ontario has fully implemented their Integrated Employment Services (IES) through Service System Managers, offering clients a range of employment and training supports and services to find and keep employment. These services included employment counselling, employment-related skills workshops and activities, engaging with employers and communities to build the highly skilled and educated workforce Ontario needs to be competitive. The system remained focused and committed to connecting job seekers with employers to help build a skilled and adaptable workforce.
The IES system is designed to support a diverse client base, including persons with disabilities, newcomers and racialized individuals. These clients received supports that had a real effect on their employment outcomes. In 2024-25, 85.0% of those who completed a survey upon completion of service reported being employed.
Moreover, the In-Class Enhancement Fund (IEF) supported apprenticeship training by funding Ontario-approved Training Delivery Agents, including colleges and non-colleges such as union-affiliated or employer-sponsored training providers. By subsidizing in-class training costs, the IEF ensures apprentices receive high-quality instruction, facilitating their progression and completion. In 2024-25, with support from LMDA, WDA and provincial contributions, the program served over 41,287 apprentices.
Designated and under-represented groups
In 2024-25 Ontario's LMDA programming continued to serve a diverse client base, with a strong focus on inclusive training and employment initiatives. These efforts aimed to increase the labour market participation of under-represented groups and respond to ongoing challenges in key sectors such as healthcare, skilled trades, and manufacturing.
The Integrated Employment Services (IES) program continued to support the creation of a more efficient employment assistance system that is responsive to local conditions. This program breaks down barriers to employment and delivers better outcomes for job seekers, including individuals on social assistance and people with disabilities. In 2024-25, with supports from LMDA, the program served over 78,000 clients, which included:
- 43.0% women
- 35.0% newcomers
- 37.0% persons with disabilities
- 40.0% racialized people
- 4.0% Indigenous peoples
- 13.0% youth (15-24)
- 14.0% older workers (55+)
Stakeholder consultations
Ontario engaged with several stakeholders and partners in 2024-25, including official language minority community stakeholders, organizations representing employers, organizations representing employees, persons with disabilities stakeholders and Indigenous community organizations. These consultations helped inform the province's employment and training strategies and ensured that programs remained responsive to local and sectoral needs.
Key themes emerging from stakeholder engagement included:
- the need to continue investing in training for healthcare workers and skilled trades
- challenges in attracting and retaining staff in sectors such as health, construction, agriculture, and manufacturing
- the importance of supporting the settlement and economic success of immigrants and asylum seekers
- addressing employment barriers faced by under-represented groups
- ensuring equitable access to employment and training programs and encouraging employer participation in upskilling and reskilling initiatives
Ontario also continued its engagement with urban Indigenous partners through the Urban Indigenous Engagement Table (UIET), which includes representatives from Tungasuvvingat Inuit, Métis Nation of Ontario, Ontario Native Women's Association, and Ontario Federation of Indigenous Friendship Centres. The table provided input and recommendations to improve employment outcomes for urban Indigenous clients within the Integrated Employment Services model.
In parallel, Ontario maintains its partnership with the Chiefs of Ontario to co-develop a First Nations model for employment services delivery. The Employment Table Working Group (ETWG), a First Nations-led initiative continued to provide recommendations to guide the province's approach to engagement and service design.
Integrated Employment Service (IES) Implementation Completion
After over 6 years, March 3rd, 2025 marked the completion of the Integrated Employment Services (IES) rollout across Ontario. This means that the province now has 9 Service System Managers (SSMs) that oversee the delivery of employment services in 15 respective geographical "catchment" areas.
Ontario transformed its employment services to be more efficient, streamlined, and outcomes focused. As part of Integrated Employment Services, a local service delivery model was implemented and social assistance employment services was integrated into Employment Ontario (EO). Transforming the system allows service providers to be more responsive to the needs of job seekers, businesses and local communities.
Program delivery and participant supports
This section provides an overview of the specific programs and financial supports available under the LMDA. It includes specific details on the programs and initiatives available, their duration associated funding, and additional supports provided to clients. This aims to demonstrate how these programs and initiatives align with federal and provincial priorities, and support labour market integration.
Employment Ontario Network
The province's employment and training programs and services are primarily delivered through the Employment Ontario (EO) network, composed of Ontario's community-based network including employment service providers, literacy providers, public colleges, direct delivery apprenticeship offices, and training delivery agents. EO helps people prepare for, find and keep full-time jobs. It connects employers, communities, incumbent workers and job seekers to meet the demands of evolving economic changes, addressing local labour market needs.
Financial supports for individuals and employers
Unemployed individuals in Ontario can apply for financial support that covers their skills training and living expenses. Financial support is also provided to employers to purchase skills training for new hires and current employees or when apprentices meet specific training and certification milestones.
Ontario supports people with disabilities by providing job placement and retention services, along with funding for basic work-related costs, helping them successfully transition to employment, secure and keep employment and advance economic self-sufficiency. In addition to LMDA funded programs and services, Ontario provided additional funding to support employers for retention and capacity building, to enhance employment pathways for workers and job seekers facing higher employment barriers, to encourage partnerships across the economy and support training solutions and encourage people with disabilities to find and maintain employment.
Research and innovation programs offset through Labour Market Development Agreement in 2024-25Footnote 75
The following programs and initiatives are also supported by the provincial funding and by the federally-funded Workforce Development Agreement. The program expenditures and results included in the table below only reflect the portion of program activities supported by Labour Market Development Agreement in 2024-25.
Program: Pre-Apprenticeship Training Program
Expenditures: $24,576,200 (38.5%)
Description: Provides people with technical and employability training needed to enter an apprenticeship program. The program is designed to support potential apprentices who may need job readiness skills and trade readiness experience to gain employment as apprentices.
Target client groups: Unemployed youth
Benefits and expected results: Pre-Apprenticeship projects are expected to:
- help individuals to gain employment as apprentices by bridging the gap between the skills people have and the skills employers are seeking
- address a skills shortage in high-demand trades
- increase exposure to the trades
In 2024-25, 62 projects were approved, intending to serve approximately 1,600 clients.
Program: Achievement Incentive program
Expenditures: $37,350,200 (58.5%)
Description: Supports employers, including those in group sponsor arrangements, by providing a financial incentive when apprentices meet specific training and certification milestones. It is a systems-based grant program that helps employers (in all trades prescribed under the Ontario College of Trades and Apprenticeship Act, 2019) train apprentices by reducing some of the cost associated with training
Target client groups: Employed
Benefits and expected results: The program aims to address the anticipated labour gaps and barriers faced by both employers and apprentices by:
- helping sponsors address skills shortages, increase apprenticeship training progression and completion, offset hiring, on-boarding, and training costs
- increasing the number of apprentice registrations, including those from underrepresented groups
- providing a financial incentive to facilitate apprenticeship progression and increase completion/certification rate
In 2024-25, 4,208 unique sponsors received payments for 26,446 milestones achieved by 20,471 unique clients. In total, 26,446 payments were made.
Program: Skills Ontario
Expenditures: $1,897,979 (3.0%)
Description: Works with schools, colleges, industry, and governments to provide opportunities for youth to explore and develop skills for successful careers in the skilled trades and technologies. Funded activities include in-school presentations, Canada's largest skills competition, summer camps for skills development and in-school competitions.
Target client groups: Youth
Benefits and expected results: In 2024, there were approximately 47,000 visitors to Skills Ontario programming.
3.2.7 Manitoba
In this section
- Employment Benefits and Support Measures key facts
- Labour market context
- Canada-Newfoundland and Labrador Labour Market Development Agreement
- Designated and under-represented groups
- Stakeholder consultations
- Program delivery and participant supports
Employment Benefits and Support Measures key facts
| Indicator | Active claimant clients | Former claimant clients | PPE clients | Non-insured clients | Total |
|---|---|---|---|---|---|
| Clients served | 6,470 | 4,096 | 2,474 | 12,575 | 25,615 |
| Share of total | 25.3% | 16.0% | 9.7% | 49.1% | 100.0% |
- Notes:
- 1 This table reflects all new services started between April 1, 2024 and March 31, 2025.
- 2 This table excludes Indigenous pan-Canadian data.

Text description
| Year | Active claimant clients | Former claimant clients | PPE clients | Non-insured clients |
|---|---|---|---|---|
| 2015-16 | 10,132 | 3,292 | n/a | 14,056 |
| 2016-17 | 9,941 | 3,011 | n/a | 12,963 |
| 2017-18 | 8,792 | 3,729 | n/a | 12,279 |
| 2018-19 | 8,453 | 3,085 | 2,518 | 10,022 |
| 2019-20 | 7,801 | 3,352 | 3,013 | 10,990 |
| 2020-21 | 6,854 | 2,460 | 1,949 | 6,639 |
| 2021-22 | 6,944 | 3,444 | 2,519 | 8,668 |
| 2022-23 | 5,856 | 4,416 | 2,591 | 11,490 |
| 2023-24 | 5,822 | 4,138 | 2,905 | 12,687 |
| 2024-25 | 6,470 | 4,096 | 2,474 | 12,575 |
- Notes:
- 1 This table reflects all new services started between April 1, 2024 and March 31, 2025.
- 2 This table excludes Indigenous pan-Canadian data.
| Year | Active claimant clients | Former claimant clients | PPE clients | Non-insured clients |
|---|---|---|---|---|
| 2015-16 | 36.9% | 12.0% | n/a | 51.1% |
| 2016-17 | 38.4% | 11.6% | n/a | 50.0% |
| 2017-18 | 35.5% | 15.0% | n/a | 49.5% |
| 2018-19 | 35.1% | 12.8% | 10.5% | 41.6% |
| 2019-20 | 31.0% | 13.3% | 12.0% | 43.7% |
| 2020-21 | 38.3% | 13.7% | 10.9% | 37.1% |
| 2021-22 | 32.2% | 16.0% | 11.7% | 40.2% |
| 2022-23 | 24.0% | 18.1% | 10.6% | 47.2% |
| 2023-24 | 22.8% | 16.2% | 11.4% | 49.7% |
| 2024-25 | 25.3% | 16.0% | 9.7% | 49.1% |
- Notes:
- 1 This table reflects all new services started between April 1, 2024 and March 31, 2025.
- 2 This table excludes Indigenous pan-Canadian data.

Text description
| Year | Youth (15-24 years old) | Core-age (25-54 years old) | Workers aged 55+ | Age undisclosed2 |
|---|---|---|---|---|
| 2015-16 | 5,217 | 15,885 | 1,798 | 4,580 |
| 2016-17 | 4,851 | 14,901 | 1,726 | 4,437 |
| 2017-18 | 4,541 | 14,314 | 1,803 | 4,142 |
| 2018-19 | 4,454 | 14,634 | 1,798 | 3,192 |
| 2019-20 | 6,347 | 16,738 | 2,016 | 55 |
| 2020-21 | 4,940 | 11,610 | 1,319 | 33 |
| 2021-22 | 5,502 | 14,484 | 1,565 | 24 |
| 2022-23 | 5,986 | 16,627 | 1,731 | 9 |
| 2023-24 | 6,150 | 17,584 | 1,768 | 50 |
| 2024-25 | 6,075 | 17,717 | 1,701 | 122 |
- Notes:
- 1 This chart reflects all clients served between April 1, 2024 and March 31, 2025.
- 2 Clients for whom valid dates of birth were not provided are included in the 'Age undisclosed' category.
- 3 This chart excludes Indigenous pan-Canadian data.
- 4 Apprentice clients were excluded from the age breakout prior to 2024-25. Starting 2024-25 they are reported under a "known" age unless their date of birth was invalid or missing.
| Year | Youth (15-24 years old) | Core-age (25-54 years old) | Workers aged 55+ | Age undisclosed2 |
|---|---|---|---|---|
| 2015-16 | 19.0% | 57.8% | 6.5% | 16.7% |
| 2016-17 | 18.7% | 57.5% | 6.7% | 17.1% |
| 2017-18 | 18.3% | 57.7% | 7.3% | 16.7% |
| 2018-19 | 18.5% | 60.8% | 7.5% | 13.3% |
| 2019-20 | 25.2% | 66.5% | 8.0% | 0.2% |
| 2020-21 | 27.6% | 64.9% | 7.4% | 0.2% |
| 2021-22 | 25.5% | 67.1% | 7.3% | 0.1% |
| 2022-23 | 24.6% | 68.3% | 7.1% | 0.0% |
| 2023-24 | 24.1% | 68.8% | 6.9% | 0.2% |
| 2024-25 | 23.7% | 69.2% | 6.6% | 0.5% |
- Notes:
- 1 This table reflects all clients served between April 1, 2024 and March 31, 2025.
- 2 Clients for whom valid dates of birth were not provided are included in the 'Age undisclosed' category.
- 3 This table excludes Indigenous pan-Canadian data.
- 4 Apprentice clients were excluded from the age breakout prior to 2024-25. Starting 2024-25 they are reported under a "known" age unless their date of birth was invalid or missing.
| Service type | Services delivered | Year-over-year change | Share of total | Year-over-year change (p.p.) |
|---|---|---|---|---|
| Employment Benefits | 10,822 | -54.2% | 9.5% | -11.8 |
| Support Measure | 103,217 | +18.1% | 90.5% | +11.8 |
| Total services | 114,039 | +2.7% | 100.0% | n/a |
- Notes:
- 1 This table reflects all new services started between April 1, 2024 and March 31, 2025.
- 2 This table excludes Indigenous pan-Canadian data.
- 3 The decrease in EB is due to coding correction, where some workshops previously counted as EB instead of SM. Prior to this coding correction, EB counts were stable between 2023-24 and 2024-25.
| Service type | Services | Year-over-year change | Expenditures | Year-over-year change |
|---|---|---|---|---|
| Targeted Wage Subsidies | 32 | -64.0% | $63,293 | -27.3% |
| Self-Employment | 18 | -51.4% | $89,423 | -68.1% |
| Job Creation Partnerships | 889 | +50.9% | $3,806,151 | +8.0% |
| Skills Development-Regular | 5,928 | -69.9% | $22,890,410 | -25.5% |
| Skills Development-Apprentices | 3,955 | +21.9% | Included above | Included above |
| Targeted Earning Supplements | n/a | n/a | n/a | n/a |
| Totals Employment Benefits | 10,822 | -54.2% | $26,849,277 | -22.5% |
| Employment Services | 48,687 | +54.6% | $11,944,779 | -7.3% |
| Individual Counselling | 54,530 | -2.4% | Included above | Included above |
| Labour Market Partnerships | n/a | n/a | $4,814,306 | -41.8% |
| Research & Innovation | n/a | n/a | $842,133 | +370.5% |
| Total Support Measure | 103,217 | +18.1% | $17,601,219 | -17.5% |
| Total EBSMs | 114,039 | +2.7% | $44,450,496 | -20.6% |
- Notes:
- 1 This table reflects all new services started between April 1, 2024 and March 31, 2025.
- 2 This table excludes Indigenous pan-Canadian data.
- 3 The decrease in SD-R is due to coding correction, where some workshops previously counted as SD-R instead of EAS. Prior to this coding correction, SD-R counts were stable between 2023-24 and 2024-25.
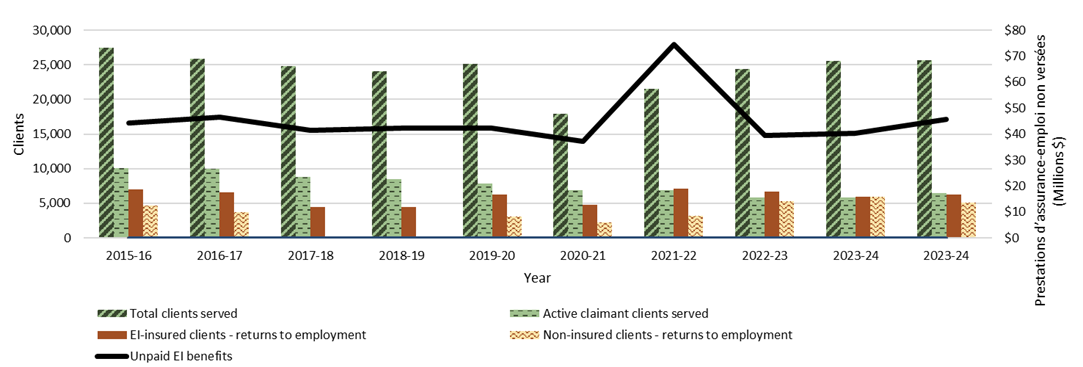
Text description
| Year | Unpaid EI benefits | EI-insured clients - returns to employment3 | Non-insured clients - returns to employment | Active claimantclients served | Total clients served4 |
|---|---|---|---|---|---|
| 2015-16 | $44,139,791 | 6,957 | 4,644 | 10,132 | 27,480 |
| 2016-17 | $46,591,343 | 6,565 | 3,668 | 9,941 | 25,915 |
| 2017-18 | $41,310,812 | 4,505 | 25 | 8,792 | 24,800 |
| 2018-19 | $42,169,989 | 4,470 | 9 | 8,453 | 24,078 |
| 2019-20 | $42,246,459 | 6,279 | 3,042 | 7,801 | 25,156 |
| 2020-21 | $37,080,692 | 4,751 | 2,206 | 6,854 | 17,902 |
| 2021-22 | $74,444,682 | 7,093 | 3,167 | 6,944 | 21,575 |
| 2022-23 | $39,556,692 | 6,685 | 5,299 | 5,856 | 24,353 |
| 2023-24 | $40,291,094 | 5,965 | 5,929 | 5,822 | 25,552 |
| 2024-25 | $45,755,267 | 6,308 | 5,050 | 6,470 | 25,615 |
- Notes:
- 1 This chart excludes Indigenous pan-Canadian data.
- 2 Volatility in the Unpaid EI Benefits from 2021‑22 to 2022‑23 correlates with the speed of recovery of the labour market that allowed many Canadians to return to work before exhausting their EI benefits.
- 3 The EI-insured return to employment returns includes active claimants, former claimants, and PPE clients
- 4 "Total Clients Served" refers to the count of EI-insured clients served (active claimant clients, former claimant clients, and PPE clients) and non-insured clients.
- 5 Historical data has been adjusted to enhance accuracy.
Labour market context
From March 2024 to March 2025, employment in Manitoba increased by 19,100 workers, or 2.7%, from 707,400 to 726,500. In that same timeframe, Manitoba's service-producing industries experienced an employment increase of 16,000 people, or 2.9%, while its goods-producing industries experienced an increase of 3,000 people, or 2.0%.Footnote 76
Manitoba's 2024 unemployment rate was 5.4%; an increase from 4.9% in 2023, but still lower than the Canadian average of 6.3%.Footnote 77
The province had a monthly average of 20,578 job vacancies in 2024-25, a 13.7% decrease from the monthly average of 23,844 in 2023-24. The average job vacancy rate in 2024-25 was 3.3%, down from 3.8% in 2023-24.Footnote 78
High-quality, accessible education is essential to maintaining Manitoba's labour force, as nearly 70.0% of all job openings in the next 5 years are expected to require some form of post-secondary education or apprenticeship training.
Canada-Manitoba Labour Market Development Agreement
In 2024-25, Manitoba received approximately $50.5 million through its LMDA to support programs and services that address the province's labour market challenges, with approximately 25,600 clients served. Within 6 months of receiving training and employment supports, approximately 59.9% of active claimant clients were employed, which contributed to an overall savings of approximately $45.7 million in unpaid EI benefits.
Manitoba's LMDA programming provides Manitobans with a range of labour market supports including skills development, training, and work experience, in addition to helping employers attract skilled workers. In 2024-25, the LMDA programming included:
- Employment Assistance Services
- Employment Partnerships
- Labour Market Partnership
- Research and Innovation
- Skills Development
- Targeted Wage Subsidies
- Self-Employment Assistance
For example, the Skills Development program offers support for individuals seeking employment-related training, including skills development, academic upgrading, and apprenticeship programs. Targeting unemployed or low-skilled workers, it provides also assistance with tuition, childcare, transportation, and other costs. In 2024-25, the program served 3,969 clients.
Designated and under-represented groups
To address labour shortages and improve workforce inclusion and diversity, Manitoba has continued to focus on increasing participation from designated and/or under-represented groups, and particularly Indigenous Peoples, who represent approximately 18.0% of the province's population. Initiatives include:
- targeting immigration using a multifaceted approach aligned to occupation, industry and regional needs
- investing in skills development and demand-led training programs for under-represented groups
- streamlining credential recognition for newcomers
Stakeholders have highlighted the need for more culturally appropriate training and education resources that would support longer-term employment for Indigenous Peoples - especially those in rural and remote areas.
Stakeholder consultations
In 2024-25, Manitoba regularly engaged with stakeholders to identify emerging labour market issues, develop responsive solutions, and inform government strategies, initiatives, and funding priorities. Stakeholders consulted included economic and industry partners, post-secondary institutions, Indigenous organizations, Sector Councils, employment and training organizations, and settlement organizations. Engagement activities took place through both formal and informal processes, including in-person and virtual consultations, roundtables, public events, and ongoing dialogue through standing boards, councils, and committees.
Manitoba maintained strong relationships with its network of contracted third-party service providers, that deliver frontline employment services to diverse clients including newcomers, youth, Indigenous Peoples, persons with disabilities, and individuals receiving employment insurance or income assistance. Informal consultations with these providers occurred throughout the year and played a key role in identifying client needs and emerging service delivery opportunities.
Engagements revealed that continued collaboration, removing barriers to accessing services, and supporting workers and employers in the face of trade tariffs are the most pressing issues for stakeholders.
Key themes emerging from 2024-25 consultations included:
- the need to continue to modernize the apprenticeship and certification system to expand access to training across the province and improve equity for underrepresented groups
- leveraging the expertise of Sector Councils to inform programming, address skills gaps, and support work integrated learning opportunities
- improving client experiences and outcomes with service providers through streamlined processes, holistic support through community connections, individualized program reviews, provision of training on reporting processes, and collaborative efforts with service providers to ensure accessible, labour market-aligned services
- addressing the unique social and employment challenges faced by underrepresented groups-such as Manitobans with disabilities and newcomers-by increasing program visibility, enhancing service provider collaboration, and expanding comprehensive supports to improve their access to the labour market
- the importance of a unified national response that mitigates major economic harm from U.S. tariffs-including market diversification, technology investment, removal of interprovincial trade barriers, and targeted government support-to protect affected sectors and jobs
Manitoba Jobs and Skills Development Centres
Manitoba provides a range of employment and training services to individuals through 12 LMDA-funded Manitoba Jobs and Skills Development Centres (MJSDs) located across the province. Supports include:
- personalized guidance from career practitioners on career exploration, occupational choices, and long-term planning
- assistance with all aspects of job search
- advocacy and coaching to ensure individuals are connected with the right opportunities and resources
- funding and/or referrals to post-secondary education, vocational training, and upgrading opportunities
- ongoing support to overcome barriers to employment, including referrals to specialized programs
In 2024-25, Manitoba served 11,731 clients through the MJSDs. Programming had an 85.0% success rate, which is defined as clients being employed, self-employed, continuing with another service provider, or in further education/training after receiving services.
MJSDs serve a diverse client base. In 2024-25:
- 17.0% self-identified as Indigenous
- 22.0% were People with Disabilities
- 18.0% were newcomers to Canada within the last 5 years
- 46.0% were youth (under 30)
Program delivery and participant supports
This section provides an overview of the specific programs and financial supports available under the LMDA. It includes specific details on the programs and initiatives available, their associated funding, and additional supports provided to clients.
Program: Employment Assistance Services
Expenditures: $15,439,000 (37.0%)
Description: Community organizations offer a variety of short-term employment-related services to help individuals conduct a successful job search, find and keep a job, and improve their employability.
Areas of focus: Employment preparation
Target client groups:
- individuals with a current or previous EI claim
- individuals who paid employee's premiums in at least 5 of the previous 10 calendar years
- unemployed individuals
- job loss threatened individuals
- employed individuals working less than an average of 20 hours per week
Benefits and expected results:
- activities and services include employment plan development and counselling, assessment, labour market and education information provision, resume assistance and job referral/placement
- expected results include improvement in clients' general employability, reduced unemployment (increased employment), and direct savings to the Employment Insurance account through reduced dependency on government funded income support programs
Program: Employment Partnerships
Expenditures: $4,919,000 (11.8%)
Description: Assists communities, sector associations, and employers to address labour force development needs while assisting eligible individuals to gain sustainable employment.
Areas of focus: Employment preparation, training, employment partnerships
Target client groups:
- individuals with a current or previous EI claim
- individuals who paid employee's premiums in at least 5 of the previous 10 calendar years
- unemployed individuals
- low skilled existing workers
- job loss threatened individuals
Benefits and expected results:
- activities and services include pre-employment preparation, job-specific skills training, and on-site hands-on training
- expected results include an increase in individuals' employability skills, reduced unemployment (increased employment), and direct savings to the Employment Insurance account through reduced dependency on government funded income support programs
Program: Labour Market Partnerships
Expenditures: $6,222,000 (14.9%)
Description: Provides private, public, and community sector organizations with financial support to undertake activities that address labour market development, labour force development, and workforce adjustment issues. Supports companies that are locating to or expanding within Manitoba with funding to train new and existing employees, develop training curriculum/learning materials, and lease or purchase equipment/materials required for training. Assists companies to assess human resource management needs and develop/implement human resource and workforce training and development plans.
Areas of focus: Training, supports, employment partnerships
Target client groups:
- communities, sectoral associations, and individual employers
- private, for-profit companies with a Canadian business number licensed to carry on business in Manitoba and are locating new operations in Manitoba or expanding existing Manitoba operations
- small and medium-sized enterprises
- large companies, particularly those operating in highly competitive markets
Benefits and expected results:
- activities and services include workforce development and adjustment activities to assist employers, employee associations, and workers to deal with workforce changes, improve their capacity to implement workforce expansion, identify and create employment opportunities to address labour market supply and demand needs and support labour force development activities that help identify and address human resource and training needs in specific sectors
- assistance to companies with little or no capacity to develop HR management plans to maximize the contribution of their workforce to achieve business goals
- assistance to companies to develop and implement workforce training and development to achieve business goals
- assistance may include direct service delivery and brokering relevant internal/external resources
- expected results include an increase in companies' investments in their employees' skill level, new hires, and creation of net new jobs, and the economic benefit to Manitoba resulting from these employment opportunities
Program: Research and Innovation
Expenditures: $1,088,000 (2.6%)
Description: Provides financial support to organizations who research and/or design practical projects that identify innovative ways of helping individuals prepare for, find, return to, or maintain sustainable employment and/or strengthen and promote province-wide or regional labour force development
Areas of focus: Building knowledge
Target client groups: Eligible organizations
Benefits and expected results:
- activities and services include research studies, information and/or data development, program/project evaluations and demonstration projects
- expected results include products that address the objectives and priorities of the R&I program, such as addressing policy and program issues, research and/or design projects that are practical and help identify innovative ways of helping individuals prepare for, find, return to or maintain sustainable employment, and strengthen and promote province-wide or regional labour market development
Program: Self Employment
Expenditures: $115,600 (0.3%)
Description: Contracts with local service providers to assist eligible individuals to create jobs for themselves by starting a business
Areas of focus: employment preparation, supports, training
Target client groups:
- individuals with a current or previous EI claim
- individuals who paid employee's premiums in at least 5 of the previous 10 calendar years
- employed individuals who are low skilled
- employment and Income Assistance recipients
- unemployed individuals
- job loss threatened individuals
Benefits and expected results:
- activities and services include training and supports to develop business plans and entrepreneurial skills, and individual coaching/consulting on implementing plans
- expected results include reduced unemployment (increased employment), direct savings to the Employment Insurance account through reduced dependency on government funded income support programs, and reduced EIA costs
Program: Skills Development
Expenditures: $13,818,000 (33.1%)
Description: Assists eligible individuals who need training to find employment, including occupational and/or skills training, academic upgrading, literacy or English as an Additional Language training required for skills training or employment, apprenticeship training, and co-operative education programs
Areas of focus: Training, supports
Target client groups:
- individuals with a current or previous EI claim
- individuals who paid employee's premiums in at least 5 of the previous 10 calendar years
- unemployed individuals
- employed individuals who are low skilled
- employment and Income Assistance recipients
- job loss threatened individuals
Benefits and expected results:
- activities and services include direct financial assistance to attend employment related skills training including tuition, certification/licensing allowance, daycare costs, lodging and transportation
- expected results include increased employability skills, reduced unemployment (increased employment), direct savings to the Employment Insurance account through reduced dependency on government funded income support programs, and reduced EIA costs
Program: Wage subsidy
Expenditures: $81,800 (0.2%)
Description: Partners with employers to offset the cost of hiring and training new workers to assist eligible individuals in gaining full time employment
Areas of focus: training, employment partnerships
Target client groups:
- individuals with a current or previous EI claim
- individuals who paid employee's premiums in at least 5 of the previous 10 calendar years
- employment and Income Assistance recipients
- unemployed or underemployed individuals
- job loss threatened individuals
Benefits and expected results:
- activities and services include work experience and/or job specific skills development
- expected results include increased employability skills, reduced unemployment (increased employment), direct savings to the Employment Insurance account through reduced dependency on government funded income support programs, and reduced EIA costs
3.2.8 Saskatchewan
In this section
- Employment Benefits and Support Measures key facts
- Labour market context
- Canada-Newfoundland and Labrador Labour Market Development Agreement
- Designated and under-represented groups
- Stakeholder consultations
- Program delivery and participant supports
Employment Benefits and Support Measures key facts
| Indicator | Active claimant clients | Former claimant clients | PPE clients | Non-insured clients | Total |
|---|---|---|---|---|---|
| Clients served | 5,712 | 4,763 | 3,648 | 794 | 14,917 |
| Share of total | 38.3% | 31.9% | 24.5% | 5.3% | 100.0% |
- Notes:
- 1 This table reflects all new services started between April 1, 2024 and March 31, 2025.
- 2 This table excludes Indigenous pan-Canadian data.

Text description
| Year | Active claimant clients | Former claimant clients | PPE clients | Non-insured clients |
|---|---|---|---|---|
| 2015-16 | 11,362 | 2,667 | n/a | 799 |
| 2016-17 | 11,542 | 2,742 | n/a | 1,040 |
| 2017-18 | 9,442 | 4,156 | n/a | 5,035 |
| 2018-19 | 8,850 | 6,058 | 7,772 | 2,527 |
| 2019-20 | 7,799 | 6,187 | 6,600 | 1,423 |
| 2020-21 | 6,882 | 4,924 | 4,511 | 858 |
| 2021-22 | 7,242 | 5,927 | 5,094 | 839 |
| 2022-23 | 5,412 | 5,843 | 4,876 | 798 |
| 2023-24 | 5,299 | 4,969 | 3,788 | 718 |
| 2024-25 | 5,712 | 4,763 | 3,648 | 794 |
- Notes:
- 1 This chart reflects all new services started between April 1, 2024 and March 31, 2025.
- 2 This chart excludes Indigenous pan-Canadian data.
| Year | Active claimant clients | Former claimant clients | PPE clients | Non-insured clients |
|---|---|---|---|---|
| 2015-16 | 76.6% | 18.0% | n/a | 5.4% |
| 2016-17 | 75.3% | 17.9% | n/a | 6.8% |
| 2017-18 | 50.7% | 22.3% | n/a | 27.0% |
| 2018-19 | 35.1% | 24.0% | 30.8% | 10.0% |
| 2019-20 | 35.4% | 28.1% | 30.0% | 6.5% |
| 2020-21 | 40.1% | 28.7% | 26.3% | 5.0% |
| 2021-22 | 37.9% | 31.0% | 26.7% | 4.4% |
| 2022-23 | 32.0% | 34.5% | 28.8% | 4.7% |
| 2023-24 | 35.9% | 33.6% | 25.6% | 4.9% |
| 2024-25 | 38.3% | 31.9% | 24.5% | 5.3% |
- Notes:
- 1 This table reflects all new services started between April 1, 2024 and March 31, 2025.
- 2 This table excludes Indigenous pan-Canadian data.

Text description
| Year | Youth (15-24 years old) | Core-age (25-54 years old) | Workers aged 55+ | Age undisclosed2 |
|---|---|---|---|---|
| 2015-16 | 1,124 | 6,755 | 772 | 6,177 |
| 2016-17 | 1,085 | 6,890 | 775 | 6,574 |
| 2017-18 | 3,044 | 8,758 | 782 | 6,049 |
| 2018-19 | 7,902 | 15,957 | 1,034 | 314 |
| 2019-20 | 3,953 | 15,796 | 2,159 | 101 |
| 2020-21 | 3,195 | 12,450 | 1,504 | 26 |
| 2021-22 | 2,627 | 13,891 | 1,837 | 747 |
| 2022-23 | 2,928 | 12,307 | 1,669 | 25 |
| 2023-24 | 2,575 | 10,434 | 1,326 | 439 |
| 2024-25 | 2,416 | 10,416 | 1,454 | 631 |
- Notes:
- 1 This chart reflects all clients served between April 1, 2024 and March 31, 2025.
- 2 Clients for whom valid dates of birth were not provided are included in the 'Age undisclosed' category.
- 3 This chart excludes Indigenous pan-Canadian data.
- 4 Apprentice clients were excluded from the age breakout prior to 2024-25. Starting 2024-25 they are reported under a "known" age unless their date of birth was invalid or missing.
| Year | Youth (15-24 years old) | Core-age (25-54 years old) | Workers aged 55+ | Age undisclosed2 |
|---|---|---|---|---|
| 2015-16 | 7.6% | 45.6% | 5.2% | 41.7% |
| 2016-17 | 7.1% | 45.0% | 5.1% | 42.9% |
| 2017-18 | 16.3% | 47.0% | 4.2% | 32.5% |
| 2018-19 | 31.3% | 63.3% | 4.1% | 1.2% |
| 2019-20 | 18.0% | 71.8% | 9.8% | 0.5% |
| 2020-21 | 18.6% | 72.5% | 8.8% | 0.2% |
| 2021-22 | 13.8% | 72.7% | 9.6% | 3.9% |
| 2022-23 | 17.3% | 72.7% | 9.9% | 0.1% |
| 2023-24 | 17.4% | 70.6% | 9.0% | 3.0% |
| 2024-25 | 16.2% | 69.8% | 9.7% | 4.2% |
- Notes:
- 1 This table reflects all clients served between April 1, 2024 and March 31, 2025.
- 2 Clients for whom valid dates of birth were not provided are included in the 'Age undisclosed' category.
- 3 This table excludes Indigenous pan-Canadian data.
- 4 Apprentice clients were excluded from the age breakout prior to 2024-25. Starting 2024-25 they are reported under a "known" age unless their date of birth was invalid or missing.
| Service type | Services delivered | Year-over-year change | Share of total | Year-over-year change (p.p.) |
|---|---|---|---|---|
| Employment Benefits | 11,020 | +3.6% | 56.4% | -1.3 |
| Support Measure | 8,503 | +9.0% | 43.6% | +1.3 |
| Total services | 19,523 | +5.9% | 100.0% | n/a |
- Notes:
- 1 This table reflects all new services started between April 1, 2024 and March 31, 2025.
- 2 This table excludes Indigenous pan-Canadian data.
| Service type | Services | Year-over-year change | Expenditures | Year-over-year change |
|---|---|---|---|---|
| Targeted Wage Subsidies | n/a | n/a | n/a | n/a |
| Self-Employment | 14 | -58.5% | $0 | -100.0% |
| Job Creation Partnerships | n/a | n/a | n/a | n/a |
| Skills Development-Regular | 7,552 | +11.6% | $28,716,515 | +6.3% |
| Skills Development-Apprentices | 3,454 | -10.0% | Included above | Included above |
| Targeted Earning Supplements | n/a | n/a | n/a | n/a |
| Totals Employment Benefits | 11,020 | +3.6% | $28,716,515 | +4.7% |
| Employment Services | 1,518 | +14.6% | $8,971,895 | -25.6% |
| Individual Counselling | 6,985 | +7.9% | Included above | Included above |
| Labour Market Partnerships | n/a | n/a | n/a | -100.0% |
| Research & Innovation | n/a | n/a | $518,405 | +728.1% |
| Total Support Measure | 8,503 | +9.0% | $9,490,300 | -56.7% |
| Total EBSMs | 19,523 | +5.9% | $38,206,815 | -22.6% |
- Notes:
- 1 This table reflects all new services started between April 1, 2024 and March 31, 2025.
- 2 This table excludes Indigenous pan-Canadian data.
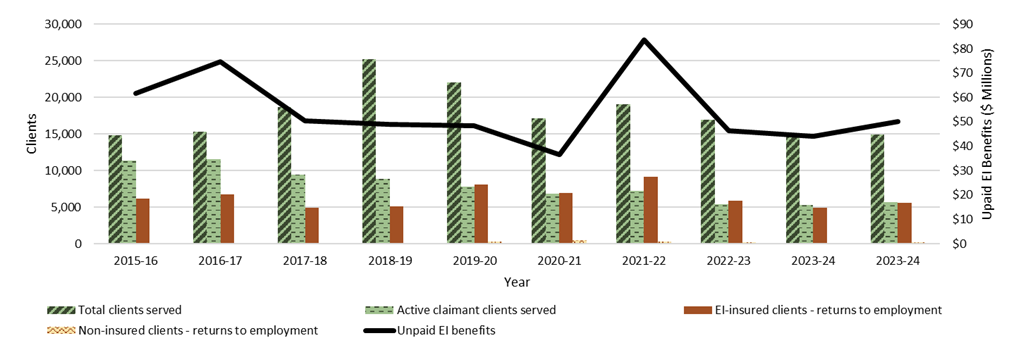
Text description
| Year | Unpaid EI benefits | EI-insured clients - returns to employment3 | Non-insured clients - returns to employment | Active claimantclients served | Total clients served4 |
|---|---|---|---|---|---|
| 2015-16 | $61,550,486 | 6,204 | 3 | 11,362 | 14,828 |
| 2016-17 | $74,734,297 | 6,716 | 27 | 11,542 | 15,324 |
| 2017-18 | $50,378,925 | 4,879 | 4 | 9,442 | 18,633 |
| 2018-19 | $49,071,838 | 5,148 | 37 | 8,850 | 25,207 |
| 2019-20 | $48,249,012 | 8,127 | 272 | 7,799 | 22,009 |
| 2020-21 | $36,529,501 | 6,940 | 443 | 6,882 | 17,175 |
| 2021-22 | $83,581,517 | 9,182 | 259 | 7,242 | 19,102 |
| 2022-23 | $46,389,772 | 5,870 | 195 | 5,412 | 16,929 |
| 2023-24 | $44,013,787 | 4,938 | 125 | 5,299 | 14,774 |
| 2024-25 | $49,979,109 | 5,557 | 209 | 5,712 | 14,917 |
- Notes:
- 1 This chart excludes Indigenous pan-Canadian data.
- 2 Volatility in the Unpaid EI Benefits from 2021‑22 to 2022‑23 correlates with the speed of recovery of the labour market that allowed many Canadians to return to work before exhausting their EI benefits.
- 3 The EI-insured return to employment returns includes active claimants, former claimants, and PPE clients
- 4 "Total Clients Served" refers to the count of EI-insured clients served (active claimant clients, former claimant clients, and PPE clients) and non-insured clients.
- 5 Historical data has been adjusted to enhance accuracy.
Labour market context
In 2024-25, Saskatchewan's economy and labour market continued to show strong growth and resilience amid global economic challenges. In 2024, the province added 15,200 jobs (year-over-year) reaching record-high employment for several groups, including women and off-reserve Indigenous adults and youth. Saskatchewan's unemployment rate was 5.4 per cent in 2024, the second lowest among provinces and below the national rate of 6.3 per cent.Footnote 79
Despite this momentum, Saskatchewan continued to face labour-related challenges. Like other advanced economies, the population is aging with workers aged 55 and over accounting for approximately 21 per cent of Saskatchewan's labour force in 2024, compared to 16 per cent in 1976.
In addition to the demographic impact, reduced immigration is expected to worsen existing labour challenges. Saskatchewan continues to have one of the tightest labour markets in the country. In October 2025 (most recent data as of December 2025), there were 2.5 unemployed people for every vacant job, below the national average of 3.3.
These labour challenges are expected to persist, fueled by over $41 billion in private-sector investment in recent years, which is expected to continue creating jobs in communities across Saskatchewan. The province currently anticipates over 119,000 net job openings between 2025 and 2029.
Labour market programming continues to focus on addressing these shortages by delivering a broad suite of upskilling and training initiatives, as well as career and employment services. The Saskatchewan Labour Market Strategy continues to serve as the province's blueprint to build an engaged, agile and productive workforce to ensure long-term economic resilience.
Canada-Saskatchewan Labour Market Development Agreement
In 2024-25, Saskatchewan received approximately $44 million through the LMDA and approximately 14,900 unique EI clients were served. Within 6 months of receiving training and employment supports, 63.6% of active EI claimant clients were already employed which contributed to an overall savings of approximately $50 million in unpaid EI benefits.
Saskatchewan's labour market programs are funded through a combination of funding sources including the LMDA, WDA and provincial budget. Saskatchewan's programming supports training, recruitment and retention of a skilled workforce that fosters investment and economic growth in Saskatchewan. LMDA funding supports the development, delivery, and evaluation of programs and services designed to meet labour market needs in the province.
In 2024-25, Saskatchewan provided career and employment services through offices across the province and through partnerships with third-party service providers. Services target specialized needs such as career counseling, vocational assessments, employment supports, newcomer and settlement supports and work placement opportunities. Additionally, Saskatchewan provided financial and program support to training institutions, agencies, and industries that deliver skills development services throughout the province.
In 2024-25, Saskatchewan continued to deliver key LMDA-supported programming such as the Essential Skills (ES) programming, Skills Training (ST) programming, Apprenticeship training programs, and the Workforce Development Program (WFD).
- ES programming helped adults build foundational skills such as literacy, numeracy, and employability skills. Key components of ES programming include Adult Basic Education (ABE) and Essential Skills for the Workplace (ESWP), and the Canadian Adult Education Credential (CAEC). These programs supported adults in entering or re-entering the workforce, pursuing further training, or advancing in their careers
- The ST programs addressed the training needs of businesses and industries in areas of high demand. These programs included accredited and certificate diploma programs, as well as short-term and entry-level training through the Trades and Skills Centres, and targeted supports for Northern Saskatchewan residents through the Northern Skills Training program
- Apprenticeship training addressed the demand for skilled tradespeople in Saskatchewan. Apprenticeship and trade certification are important in fostering economic growth, developing a skilled workforce, and ensuring the ongoing competitiveness of the labour market as the demand for apprentices and skilled tradespeople is on the rise
- Under the WFD program, clients received numerous services such as vocational assessments, career counselling, job readiness, life skills, entry-level skills, digital literacy skills, job development, basic skills training, job coaching, and individualized employment-related supports
Designated and under-represented groups
In Saskatchewan, approximately 20 per cent of unemployed workers are not eligible for EI. Saskatchewan does not restrict access to employment services based on an individual's EI status. Clients who are ineligible under the LMDA would be assisted through provincially funded or WDA-funded programming. This applies to supports targeting under-represented groups, such as Indigenous peoples, persons with disabilities, racialized people, and/or women. The Saskatchewan Labour Market Strategy, launched in March 2024, focuses on training, upskilling, and prioritizing engagement of under-represented groups in the labour force. For example, in 2024-25 the province:
- continued to offer the Northern Skills Training program to address academic and skills barriers for residents living in Northern Saskatchewan
- supported the establishment of an additional cohort of the Mental Health and Wellness diploma program at the Saskatchewan Indian Institute of Technologies to meet demand in this program/occupation. The skills learned in the program enable frontline workers to provide care to Indigenous individuals
- provided funding to the Saskatchewan Apprenticeship and Trade Certification Commission's Indigenous Apprenticeship Initiative to increase the recruitment of Indigenous peoples into apprenticeship and skilled trades careers. Projects include apprenticeship and pre-employment trades training with First Nation and Métis communities. In 2024-25, 17.2 per cent of registered apprentices self-declared as Indigenous peoples
- partnered with industry representatives to deliver projects to increase Indigenous representation and address the critical labour shortage in potash mining and mining construction
- provided funding to support women in trades or to become self-employed through the WFD program
- funded the Employability Assistance for Persons with Disabilities (EAPD) program which provides services and supports to Saskatchewan residents experiencing disability as they prepare for, obtain and maintain employment, or pursue further education and training
- partnered with Francophone community-based organizations to enhance Francophone participation in the workplace
Stakeholder consultations
In 2024-25, Saskatchewan engaged and consulted with a broad range of stakeholder organizations including business and industry associations, individual employers, community leaders, community-based organizations, organizations providing employment services for people from under-represented groups, Francophone organizations, post-secondary education and training institutions, labour groups and partner ministries, agencies, and commissions. Stakeholder engagement offered an opportunity to discuss and receive advice on labour market programs and services and to identify key labour market barriers, emerging needs, and opportunities.
Stakeholder engagements were conducted through consultations, information sessions, employer outreach, roundtables, conference calls, presentations and in-person or virtual meetings. Through these engagements, several key themes emerged that align with:
1. sector pressures
Across sectors, employers expressed difficulties in finding suitable candidates due to:
- skills mismatch
- competition for talent
- geographic constraints (e.g., recruitment challenges in rural, remote and northern communities)
- lack of housing availability
- technological advancements requiring new skills and training programs
Specific sector challenges included:
- the healthcare sector saw an increased need for professionals such as continuing care assistants, nurses and paramedics, particularly in rural communities
- the mining industry is undergoing significant growth, resulting in rising demand for mining-related occupations. Concurrently, there is a growing need for modernized flexible training approaches to ensure local residents can benefit from good paying jobs in the sector
- the emergence of the nuclear sector introduces new workforce considerations, particularly in skilled trades, while resource-based industries such as quarrying, oil and gas continue to face labour market challenges
- additionally, the agricultural sector is undergoing transformation, further influencing workforce development priorities
- stakeholders reported a shortage of skilled tradespersons to support infrastructure investments/projects attributed to:
- high overall demand for tradespeople and cross competition for skilled tradespeople across several sectors in the province including construction, mining and agriculture
- need for modernized and flexible pre-trades and apprenticeship programs
- strong demand for roles like industrial mechanics, electricians, welders and more
- difficulties in attracting manufacturing workers to rural areas
2. Indigenous Workforce Development
Stakeholders expressed the need to grow Indigenous participation in the workforce to meet labour force needs and build long-term capacity and sustainability. This was conveyed through:
- recommendations for enhanced partnerships with Indigenous communities and businesses
- a proposed focus on training delivery in northern regions and for Indigenous participants
- recommendations for sector-specific training in mining, energy, agriculture, construction, health and tourism
- concern over labour market issues in rural and northern communities, for example, attracting healthcare workers to rural and northern
Kimberly Dennett, Graduate of the Mental Health & Wellness Program - Meadow Lake
Dumont Technical Institute
Kimberly is an extraordinary individual whose strength, determination, and passion for learning make her a deserving recipient for the Order of Gabriel Dumont (OGD) Bronze Award. The OGD Bronze Award is a distinction awarded by the Gabriel Dumont Institute (GDI) to recognize outstanding Métis students and alumni. It recognizes GDI students and alumni who have shown exceptional leadership, active community involvement, cultural engagement, and strong academic performance.
Throughout her journey, Kimberly has excelled academically while balancing the responsibilities of being a supportive mother and grandmother, always putting her family first. Despite facing numerous challenges, she has remained focused on her education and personal growth, proving that it's never too late to make a change.
When Kimberly began her program, she was at a pivotal moment in her life, having endured difficult times. Instead of allowing these struggles to define her, she made a conscious decision to rewrite her story. Committed to improving her life for her own well-being, as well as for the sake of her family and community, Kimberly's transformation has been remarkable. She doesn't just learn; she fully embraces every opportunity for growth, applying her newfound knowledge in meaningful ways.
What sets Kimberly apart is her deep connection to her Métis identity. She has embarked on a journey of cultural reclamation, integrating traditional teachings into her life and actively participating in cultural events. Not only is she embracing and sharing these values, but she is also passing them on to her family, ensuring that these traditions live on for future generations.
Kimberly has a powerful vision for the future, one focused on advocacy, mental health, and community-building in her home community of Beauval. What makes her truly inspiring is that she is already living her vision through her actions. She leads with kindness, empathy, and resilience, showing others the power of perseverance and healing.
Kimberly's story is one of transformation, cultural pride, and unwavering dedication. She is more than deserving of the OGD Bronze Award, as she embodies the qualities of a true leader and role model.
Program delivery and participant supports
Saskatchewan's programs and initiatives align with the Saskatchewan Labour Market Strategy, federal and provincial priorities, and support labour market integration. Saskatchewan's labour market programs are funded through a combination of funding sources such as LMDA, WDA and their provincial budget. In 2024-25, Saskatchewan invested a total of $129 million in labour market programming. The tables below provide further information on Saskatchewan's usage of the LMDA portion of funding.
Program: Essential Skills (ES)
Expenditures: $6.5M (17.0%)
Description: Through ES programming, participants acquire the knowledge, skills and attitudes needed to enter or re-enter the labour force, move on to further training or advance in a chosen career. ES programming helps adults improve their literacy level and develop essential and employability skills. Learners who successfully complete Level 3 (also known as Adult 10) receive a certificate of completion and those who complete Level 4 (or Adult 12) achieve a Grade 12 standing. The ES program includes Adult Basic Education (ABE) and the Essential Skills for the Workplace (ESWP) and the CAEC testing.
Target client groups: ES programs are available to all adults at least 18 years of age and out of school for at least 1 year; who wish to enter or re-enter the labour force; who need further training; or who wish to advance in a chosen career.
Benefits and expected results: 1,000 interventions for ES clients were funded through the LMDA. Through this program, participants developed the skills and competencies needed to acquire and/or retain employment, resulting in increased earnings, decreased use of social support(s), and improved learner wellness and well-being.
Below are the outcomes for ES participants who completed programming in 2024-25, including learners funded through the LMDA and other sources of funding:
- completion rate: 64.0%
- employment rate: 19.0%
- further education rate: 69.0%
Program: Skills Training Allocation (STA)
Expenditures: $6.0M (15.5%)
Description: The STA program is designated to address the training needs of Saskatchewan businesses and industry in the areas of greatest labour market demand and promote equity participation in training delivery. Credit training programs for occupations in demand are delivered through publicly funded post-secondary training institutions.
Target client groups: The STA programs are open to all adults seeking opportunities to improve skills development. The STA program has a strong emphasis on improving the employability of under-represented groups (e.g., Indigenous people, social assistance recipients, persons with disabilities, women in under-represented occupations, immigrants, racialized people and youth) leading to long-term sustainable employment.
Benefits and expected results: 350 interventions for STA Program clients were funded through the LMDA in 2024-25.
- completion rate: 82.0%
- employment rate: 62.0%
- further education rate: 23.0%
Program: Northern Skills Training (NST)
Expenditures: $0.4M (1.1%)
Description: The NST Program addresses unique academic and skills barriers that adults in the north face when seeking employment. Successful program participants acquire the occupational skills that address employer needs and that help transition participants to employment. Learners acquire occupational/technical skills and consequently increase their employability. As well, funding allows training institutions to deliver accredited programs that meet employer needs. In 2024-25, notable programs offerings offered included: Early Childhood Education, Indigenous Practical Nursing, Heavy Equipment Operator, Mineral Exploration Techniques, Radiation and Environmental Monitoring, Mental Health and Wellness, Harvester Training, Scaffolding and Continuing Care Assistant.
Target client groups: NST Program focuses on learners in Northern Saskatchewan communities. 14 NST programs were offered in Air Ronge, Black Lake, Buffalo Narrows, Cumberland House, Fond-du-Lac and Stony Rapids.
Benefits and expected results: 40 interventions for NST clients were funded through the LMDA in 2024-25.
Program: Trades and Skills Centres (TSCs)
Expenditures: $0.6M (1.4%)
Description: The TSCs deliver trades and skills programs that lead to entry-level jobs in industries where workers are in high demand. They deliver training in many different occupations such as plumbing, health care, culinary arts, commercial construction, scaffolding, painting, roofing, electrical and more. The TSCs serve under-skilled adults and youth in Regina and Saskatoon. Trainees are engaged in work experience training that mimics an employment experience while receiving wage-based income support.
Target client groups: Under-skilled and under-employed adults, who want to enter one of the designated skilled trades
Benefits and expected results: 100 interventions for TSCs clients were funded through the LMDA in 2024-25, with a completion rate of 93.4%.
The employment rate (of those who completed programming) was approximately 80 per cent for the total clients served by the program.
Program: Workforce Development (WFD)
Expenditures: $9.4M (24.7%)
Description: WFD programs help to train, recruit, and retain skilled Saskatchewan workers. Saskatchewan contracts third-party service providers to deliver programs and services based on client and industry needs, that target specific under-represented groups as well as more generalized supports for a wide range of job seekers to address employment barriers, such as low literacy (reading, numeracy, and computer skills), little or no work experience, disability, social barriers, addictions, etc. Programs and services include but are not limited to vocational assessments, career counselling, job readiness, life skills, entry level skills, digital literacy skills, work experience, job development, basic skills training, job coaching, job search assistance, occupational skills training, interview preparation and individualized training and employment related supports.
Target client groups: Unemployed and under-employed Saskatchewan residents who face barriers to employment including specific demographic groups such as Indigenous persons, youth, women, newcomers and persons with disabilities, and older workers. Programming was also available to support individuals pursuing self-employment.
Benefits and expected results: 8,000 interventions for WFD clients were funded through the LMDA in 2024-25. Approximately 40.0% of EI eligible program participants found employment and 5.0% went on to further education/training after completion.
Program: Employability Assistance for Persons with Disabilities (EAPD)
Expenditures: $0.1M (0.1%)
Description: EAPD provides funding to pay for supports to help Saskatchewan residents overcome barriers to education or employment as a result of experiencing a disability. Programs and services include specialized assessments to determine the impact of an individual's disability on their ability to participate in, and to identify supports required for education or employment; job search supports, such as, resume building, interview skills, workplace and vocational assessments; workplace supports such as job coaching, job or worksite modification, or assistive technology; and education supports, such as interpreting, tutoring, note taking, tutors, and assistive technology.
Target client groups: Individuals who, as a result of experiencing disability, require specialized supports to prepare for, obtain and/or maintain employment
Benefits and expected results: 1,600 interventions for EAPD clients who were EI eligible job seekers were funded through a combination of the WDA and LMDA to participate in EAPD programming in 2024-25.
Program: Saskatchewan Apprenticeship and Trade Certification Commission (SATCC)
Expenditures: $13.7M (35.8%)
Description: The SATCC arranges apprenticeship training to meet the direct needs of employers in Saskatchewan's labour market. The SATCC is also responsible for the certification of qualified tradespeople who have developed the necessary skills and obtained the necessary work experience in non-compulsory trades.
Target client groups: Adults wanting to enter one of the designated skilled trades while in a training system combining on-the-job experiential learning with time spent in a classroom setting
Benefits and expected results: 4,649 interventions for SATCC clients occurred in 2024-25, 66% of these seats were funded through the LMDA, with a completion rate of 82% for EI eligible clients.
Program: Apprenticeship Training Allowance (ATA)
Expenditures: $1.3M (3.4%)
Description: The ATA is available to eligible apprentices while they attend technical training. The funding helps apprentices maintain a second residence while attending technical training.
Target client groups: EI eligible apprentices attending apprenticeship technical training
Benefits and expected results: 1,756 interventions for ATA clients occurred in 2024-25, 50% of these interventions were funded through the LMDA to participate in apprenticeship technical training in 2024-25.
Program: Newcomer and settlement
Expenditures: $0.3M (0.9%)
Description: Newcomer and settlement funding is the main source of support for newcomers with a purpose of retaining newcomers by providing orientation to community resources, conducting needs assessments, providing settlement planning, access to language programs and referrals to employment services and other skills training. A comprehensive range of programs and services are delivered by third-party organizations.
Target client groups: Newcomers to Saskatchewan including temporary workers, permanent residents and refugees, and international students seeking supports to address barriers to settlement and employability
Benefits and expected results: 400 interventions for Newcomer and Settlement clients were funded through the LMDA in 2024-25.
The Ministry has 91 agreements with third-party service providers for Newcomer and Settlement supports to provide specialized services for newcomers experiencing cultural, language or other barriers to employment.
3.2.9 Alberta
In this section
- Employment Benefits and Support Measures key facts
- Labour market context
- Canada-Newfoundland and Labrador Labour Market Development Agreement
- Designated and under-represented groups
- Stakeholder consultations
- Program delivery and participant supports
Employment Benefits and Support Measures key facts
| Indicator | Active claimant clients | Former claimant clients | PPE clients | Non-insured clients | Total |
|---|---|---|---|---|---|
| Clients served | 23,463 | 9,768 | 3,118 | 22,085 | 58,434 |
| Share of total | 40.2% | 16.7% | 5.3% | 37.8% | 100.0% |
- Notes:
- 1 This table reflects all new services started between April 1, 2024 and March 31, 2025.
- 2 This table excludes Indigenous pan-Canadian data.

Text description
| Year | Active claimant clients | Former claimant clients | PPE clients | Non-insured clients |
|---|---|---|---|---|
| 2015-16 | 51,694 | 16,213 | n/a | 60,191 |
| 2016-17 | 49,720 | 14,087 | n/a | 54,258 |
| 2017-18 | 35,101 | 15,856 | n/a | 38,909 |
| 2018-19 | 30,363 | 13,036 | 8,388 | 31,484 |
| 2019-20 | 27,561 | 13,704 | 7,759 | 27,886 |
| 2020-21 | 22,094 | 7,577 | 3,796 | 17,506 |
| 2021-22 | 22,074 | 8,962 | 3,675 | 17,642 |
| 2022-23 | 19,654 | 10,756 | 3,886 | 17,455 |
| 2023-24 | 21,697 | 10,501 | 3,674 | 20,539 |
| 2024-25 | 23,463 | 9,768 | 3,118 | 22,085 |
- Notes:
- 1 This chart reflects all new services started between April 1, 2024 and March 31, 2025.
- 2 This chart excludes Indigenous pan-Canadian data.
| Year | Active claimant clients | Former claimant clients | PPE clients | Non-insured clients |
|---|---|---|---|---|
| 2015-16 | 40.4% | 12.7% | n/a | 47.0% |
| 2016-17 | 42.1% | 11.9% | n/a | 46.0% |
| 2017-18 | 39.1% | 17.6% | n/a | 43.3% |
| 2018-19 | 36.5% | 15.7% | 10.1% | 37.8% |
| 2019-20 | 35.8% | 17.8% | 10.1% | 36.3% |
| 2020-21 | 43.3% | 14.9% | 7.4% | 34.3% |
| 2021-22 | 42.2% | 17.1% | 7.0% | 33.7% |
| 2022-23 | 38.0% | 20.8% | 7.5% | 33.7% |
| 2023-24 | 38.5% | 18.6% | 6.5% | 36.4% |
| 2024-25 | 40.2% | 16.7% | 5.3% | 37.8% |
- Notes:
- 1 This table reflects all new services started between April 1, 2024 and March 31, 2025.
- 2 This table excludes Indigenous pan-Canadian data.
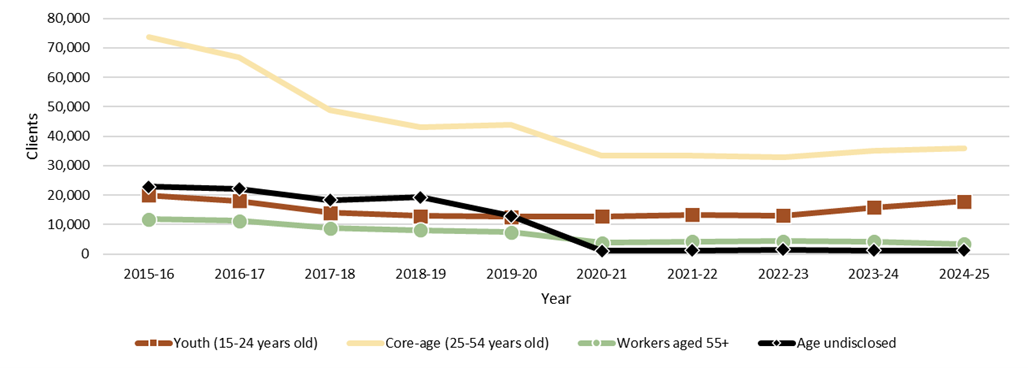
Text description
| Year | Youth (15-24 years old) | Core-age (25-54 years old) | Workers aged 55+ | Age undisclosed2 |
|---|---|---|---|---|
| 2015-16 | 19,931 | 73,572 | 11,755 | 22,840 |
| 2016-17 | 18,010 | 66,665 | 11,212 | 22,178 |
| 2017-18 | 14,010 | 48,749 | 8,766 | 18,341 |
| 2018-19 | 12,940 | 42,996 | 8,036 | 19,299 |
| 2019-20 | 12,695 | 44,008 | 7,339 | 12,868 |
| 2020-21 | 12,794 | 33,311 | 3,800 | 1,068 |
| 2021-22 | 13,391 | 33,495 | 4,218 | 1,249 |
| 2022-23 | 13,060 | 32,840 | 4,415 | 1,436 |
| 2023-24 | 15,800 | 35,115 | 4,284 | 1,212 |
| 2024-25 | 17,888 | 36,010 | 3,375 | 1,161 |
- Notes:
- 1 This chart reflects all clients served between April 1, 2024 and March 31, 2025.
- 2 Clients for whom valid dates of birth were not provided are included in the 'Age undisclosed' category.
- 3 This chart excludes Indigenous pan-Canadian data.
- 4 Apprentice clients were excluded from the age breakout prior to 2024-25. Starting 2024-25 they are reported under a "known" age unless their date of birth was invalid or missing.
| Year | Youth (15-24 years old) | Core-age (25-54 years old) | Workers aged 55+ | Age undisclosed2 |
|---|---|---|---|---|
| 2015-16 | 15.6% | 57.4% | 9.2% | 17.8% |
| 2016-17 | 15.3% | 56.5% | 9.5% | 18.8% |
| 2017-18 | 15.6% | 54.2% | 9.8% | 20.4% |
| 2018-19 | 15.5% | 51.6% | 9.7% | 23.2% |
| 2019-20 | 16.5% | 57.2% | 9.5% | 16.7% |
| 2020-21 | 25.1% | 65.4% | 7.5% | 2.1% |
| 2021-22 | 25.6% | 64.0% | 8.1% | 2.4% |
| 2022-23 | 25.2% | 63.5% | 8.5% | 2.8% |
| 2023-24 | 28.0% | 62.2% | 7.6% | 2.1% |
| 2024-25 | 30.6% | 61.6% | 5.8% | 2.0% |
- Notes:
- 1 This table reflects all clients served between April 1, 2024 and March 31, 2025.
- 2 Clients for whom valid dates of birth were not provided are included in the 'Age undisclosed' category.
- 3 This table excludes Indigenous pan-Canadian data.
- 4 Apprentice clients were excluded from the age breakout prior to 2024-25. Starting 2024-25 they are reported under a "known" age unless their date of birth was invalid or missing.
| Service type | Services delivered | Year-over-year change | Share of total | Year-over-year change (p.p.) |
|---|---|---|---|---|
| Employment Benefits | 24,265 | +10.5% | 26.5% | +4.9 |
| Support Measure | 67,430 | -15.7% | 73.5% | -4.9 |
| Total services | 91,695 | -10.1% | 100.0% | n/a |
- Notes:
- 1 This table reflects all new services started between April 1, 2024 and March 31, 2025.
- 2 This table excludes Indigenous pan-Canadian data.
| Service type | Services | Year-over-year change | Expenditures | Year-over-year change |
|---|---|---|---|---|
| Targeted Wage Subsidies | 210 | +54.4% | $1,953,612 | +60.6% |
| Self-Employment | 214 | -1.8% | $1,588,972 | +1.2% |
| Job Creation Partnerships | n/a | n/a | n/a | n/a |
| Skills Development-Regular | 2,058 | -24.7% | $85,385,803 | -29.1% |
| Skills Development-Apprentices | 21,783 | +15.4% | Included above | Included above |
| Targeted Earning Supplements | n/a | n/a | n/a | n/a |
| Totals Employment Benefits | 24,265 | +10.5% | $88,928,387 | -27.8% |
| Employment Services | 10,027 | -15.1% | $64,400,902 | -9.6% |
| Individual Counselling | 57,403 | -15.8% | Included above | Included above |
| Labour Market Partnerships | n/a | n/a | $4,285,430 | -59.8% |
| Research & Innovation | n/a | n/a | n/a | n/a |
| Total Support Measure | 67,430 | -15.7% | $68,686,332 | -16.2% |
| Total EBSMs | 91,695 | -10.1% | $157,614,719 | -23.2% |
- Notes:
- 1 This table reflects all new services started between April 1, 2024 and March 31, 2025.
- 2 This table excludes Indigenous pan-Canadian data.

Text description
| Year | Unpaid EI benefits | EI-insured clients - returns to employment3 | Non-insured clients - returns to employment | Active claimantclients served | Total clients served4 |
|---|---|---|---|---|---|
| 2015-16 | $267,881,263 | 26,525 | 11 | 51,694 | 128,098 |
| 2016-17 | $384,909,915 | 29,671 | 5 | 49,720 | 118,065 |
| 2017-18 | $233,417,003 | 18,726 | 0 | 35,101 | 89,866 |
| 2018-19 | $205,883,273 | 18,669 | 12 | 30,363 | 83,271 |
| 2019-20 | $195,730,747 | 18,094 | 2 | 27,561 | 76,910 |
| 2020-21 | $139,176,642 | 17,867 | 8,041 | 22,094 | 50,973 |
| 2021-22 | $303,807,613 | 26,311 | 8,795 | 22,074 | 52,353 |
| 2022-23 | $197,849,296 | 21,405 | 6,647 | 19,654 | 51,751 |
| 2023-24 | $198,920,239 | 22,861 | 9,834 | 21,697 | 56,411 |
| 2024-25 | $238,191,177 | 17,176 | 685 | 23,463 | 58,434 |
- Notes:
- 1 This chart excludes Indigenous pan-Canadian data..
- 2 Volatility in the Unpaid EI Benefits from 2021‑22 to 2022‑23 correlates with the speed of recovery of the labour market that allowed many Canadians to return to work before exhausting their EI benefits.
- 3 The EI-insured return to employment returns includes active claimants, former claimants, and PPE clients
- 4 "Total Clients Served" refers to the count of EI-insured clients served (active claimant clients, former claimant clients, and PPE clients) and non-insured clients.
- 5 AB does not use an action plan concept. As a result, many services were reported as "client started another measure" and were incorrectly categorized as "clients employed" in years 2020-21 to 2023-24.
- 6 Historical data has been adjusted to enhance accuracy.
Labour market context
In 2024-25, Alberta continued to face labour market pressures despite strong population growth and employment gains in 2024. While seasonally adjusted job vacancies declined for the 11th consecutive quarter since Q3 2022, they remained above pre-pandemic levels. Despite robust population growth, Alberta's labour market remained marked by sector-specific labour supply challenges, particularly in healthcare, skilled trades, transportation, and equipment operations.
The unemployment rate in Alberta was 7.0% in 2024, higher than 5.9% in 2023.Footnote 80 By comparison, Canada's unemployment rate in 2024 was 6.3% up from 5.4% in 2023.Footnote 81
In March 2025, the province reported over 68,400 job vacanciesFootnote 82 compared to approximately 202,700 individuals who were unemployed, actively looking for work within the last 4 weeks, and available for work.Footnote 83
Similar to other provinces, Alberta continued to experience challenges related to the integration of a fast-growing and increasingly diverse population into its labour market. While the province continues to attract newcomers and has a growing share of younger, prime-aged workers, many new labour market entrants lack the work experience required to compete in an increasingly competitive environment.
Canada-Alberta Labour Market Development Agreement
In 2024-25, Alberta received approximately $167 million through the LMDA, which served approximately 58,400 clients. Within 6 months of receiving training and employment supports, approximately 70.1% of active claimant clients were employed, resulting in an estimated $238 million in savings from unpaid EI benefits.
The LMDA funding supported initiatives to connect employers with job seekers and provide training for jobs in growth sectors such as energy, agriculture, forestry, tourism, culture, technology, aviation and aerospace, logistics, and finance.
For example, in 2024-25, Alberta provided a technical training program for apprentices, covering the cost of training delivered by approved training providers to individuals registered in an apprenticeship program in Alberta. In 2024-25, the program served approximately 18,500 clients.
Designated and under-represented groups
Alberta's LMDA programming serves a diverse client base, with a continued focus on supporting designated and under-represented groups, including Indigenous peoples, older workers, newcomers, persons with disabilities, women and youth. In 2024-25, funding helped address labour shortages, unemployment, and removing barriers to employment for under-represented groups, through skills training, improved access to education, and employment support.
The Employment Partnerships program focused on labour market participation and fostering inclusion for Indigenous Albertans. In 2024-25, it served approximately 2,450 clients.
Additionally, in Alberta's efforts to serve under-represented groups, 2 Labour Market Partnerships were supported that were designed to target youth, in general, and newcomer youth, in particular, as described below:
- Careers in Energy - Energy in Motion educated youth (aged 18 to 24) about energy careers at 2 awareness/education symposiums that provide youth with hands-on experience at Safety and Training Organization's on-site training facility and at the Global Energy show
- Canadian Apprenticeship Forum's Facilitating Pathways to Apprenticeship and Careers in the Skilled Trades for Racialized Youth and Newcomers provided education sessions to over 100 participants across Alberta
Post-intervention results indicate that over 90 per cent of participants surveyed demonstrated an increased understanding of apprenticeship and 60 per cent reported an increased commitment to pursuing apprenticeship in the future.
Stakeholder consultations
In 2024-25, Alberta continued to engage regularly with stakeholders through formal and informal interactions to better understand labour market conditions and inform the development and delivery of LMDA-funded programming. These efforts focused on identifying in-demand occupations, addressing emerging workforce challenges, and aligning supports with employer needs. Stakeholders included community organizations, training providers, employers, industry associations, indigenous partners, reginal business networks, and other government organizations.
At the regional level, Workforce Consultants across Alberta maintained close relationships with employers, Chambers of Commerce, municipalities, and community groups. Through project planning committees, local working groups, and regional events, stakeholders helped identify region-specific labour needs and contributed to the development of Labour Market Partnerships proposals under the Workforce Partnerships Program. In 2024-25, these initiatives addressed labour shortages in priority sectors such as construction, technology, and aviation, and explored practical strategies to help employers both retain workers and support.
Alberta also maintained strong ties with Indigenous stakeholders through the work of the Employment Partnerships Program to learn about stakeholders' priorities and needs. Stakeholders have the agency to guide their own priorities by indicating the labour market demand they are seeking to meet. This information helps to confirm for Alberta which labour gaps are being addressed in each community.
Finally, Alberta continued to consult with industry through roundtables, advisory committees, and workforce development forums. Funded projects under the Workforce Partnerships Program addressed a range of issues, including diversity and inclusion, human resources planning, and youth career awareness. Engagement with these stakeholders helped ensure that labour market programming remained responsive and aligned with Alberta's broader workforce development goals.
City of Calgary Youth Employment Centre (YEC)
YEC assists youth up to age 24, by providing services that connect them with pathways to promising employment and careers. These services include career exploration/planning, work search strategies, resume development, skills identification, interviewing, job development and labour market information. Clients benefit from assistance to access and connect with employers, educational institutions and training programs.
In 2024-25, YEC reported that 590 youth were helped into employment through job search assistance activities.
Program delivery and participant supports
This section provides an overview of the specific programs and financial supports available under the LMDA. It includes specific details on the programs and initiatives available, their duration, associated funding, and additional supports provided to clients. This aims to demonstrate how these programs and initiatives align with federal and provincial priorities, and support labour market integration.
Program: Job search assistance
Expenditures: Please note that the information related to associated funding is not available at that time.
Description:
- transition to employment services: customized work-directed services to help individuals acquire workplace and occupational skills to facilitate their rapid (re-) attachment to the labour market
- job search assistance (exposure course): provides job ready individuals with skills needed to quickly obtain employment
- job placement: connects individuals seeking work with employers seeking to fill job openings
Target client groups: Any individual who is legally entitled to work in Canada can participate in Employment Assistance Services. Not required to be insured participants.
Benefits and expected results: 10,027 services provided
Program: Counselling and case management
Expenditures: Please note that the information related to associated funding is not available at that time.
Description:
- Career and Employment Assistance Services: services include career counselling, career planning and job search, job placement and employment support services
- case management: provides support to individuals during the implementation and progression through their individual Service Plan
- WORP post intervention survey (Evaluation and Analysis): a component of case management to support an individual's progression through their service plan and includes follow-up to confirm completion of the plan and obtain outcome information
Target client groups: Any individual who is legally entitled to work in Canada can participate in Employment Assistance Services. Not required to be insured participants.
Benefits and expected results: 57,403 services provided
Program: Unassisted services
Expenditures: Please note that the information related to associated funding is not available at that time.
Description:
- resource centre: access to informational resources, tools and technical equipment on topics such as career planning, education, job search and labour market information
- career and job fair: fairs showcase a variety of career and employment options, employer options, industry information, postsecondary choices and labour market facilitation
- group information sessions (e.g. workshops): address a variety of career and employment needs
- CEIS grants: employment related events such as job/career fairs, employer connections, conferences, and speaking events
- workplace and career planning (ALIS Website): career planning, job search and labour market information available through print and online service
- labour market information product (evaluation and analysis): development of labour market information (wage and salary) to assist job seekers, career planners, etc. to support informed evidence-based decisions
Target client groups: Unemployed or employed Albertans who are legally entitled to work
Benefits and expected results:
- Alis website (site visits): 4,100,000
- community presentations: 20,907
- employer connections (including hiring events): 2,607
- Employer Partnership Program no touch / light touch: 2,499
- information services by contracted service provider (including resource centres): 10,139
Program: Short-term training
Expenditures: Please note that the information related to associated funding is not available at that time
Description:
- Integrated training program costs: skills-based training that combines academic and general employability skills with occupation-related
- Integrated foundational pathways program costs: a unique blend of essential skills, academics and applied skills development designed to build upon foundational skills
- Integrated training program costs: skills-based training that combines academic and general employability skills with occupation-related skills.
- Training for work (Integrated, Immigrant Bridging and Self-Employment) financial assistance costs: needs-based financial assistance for eligible clients attending full-time approved training
- Pre-apprenticeship training program costs: skills-based training that combines academic and general employability skills with occupation-related skill
- Short-term training financial assistance costs: needs-based financial assistance for eligible clients attending full-time approved Integrated Skills Training, Pre-Apprenticeship Training, and Integrated foundational pathways
- Immigrant bridging program costs: integrated training programs that focus on training skilled immigrants with prior education and/or experience in a specific occupation, so that they can bridge gaps in knowledge skills in order to gain employment in that occupation or a related occupation
Target client groups: EI-Insured clients
Benefits and expected results: 788 services provided
Program: Occupational skills training
Expenditures: Please note that the information related to associated funding is not available at that time.
Description: Training programs are competency-based occupation-related training programs intended to provide students with a unique blend of occupation-related skills, work experience placement(s), employability and/or essential skills, and applied academics and/or English as an Additional Language.
Target client groups: EI-Insured clients
Benefits and expected results: 9 services provided
Program: Literacy, Essential Skills, Language training and Adult Basic Education
Expenditures: Please note that the information related to associated funding is not available at that time.
Description:
- Foundational learning (Academic upgrading and Adult Basic Education) program costs: training in literacy and numeracy ranging from basic skills to adult academic subjects needed to meet post-secondary entry requirements
- Foundational learning (English as an Additional Language) program costs: training to improve English language competencies for individuals whose first language is other than English
- Financial assistance costs/foundational Learning: needs-based financial assistance for eligible clients attending full-time approved Academic upgrading, Adult Basic Education and English as an Additional Language
Target client groups: EI-Insured clients
Benefits and expected results: 1,261 services provided
Program: Apprenticeship
Expenditures: Please note that the information related to associated funding is not available at that time.
Description:
- Apprentice training program costs: technical training, delivered by an Alberta approved training provider, to individuals registered in the Alberta apprenticeship program
Target client groups: EI-Insured clients
Benefits and expected results: 19,891 apprenticeships were provided
Program: Targeted Wage Subsidies
Expenditures: Please note that the information related to associated funding is not available at that time.
Description:
- Workplace training program costs: individually-focused worksite training provided by an employer. The employer receives a subsidy to offer on-the-job training, or a short term paid work experience to individuals with barriers to employment
Target client groups: EI-Insured clients
Benefits and expected results: 210 services provided
Program: Self-employment assistance
Expenditures: Please note that the information related to associated funding is not available at that time.
Description:
- Self Employment program costs: Training on business plan development, business counselling, coaching and guidance to facilitate entry into self-employment for clients who have a viable business idea.
Target client groups: EI-Insured clients
Benefits and expected results: 214 services provided
Program: Labour Market Partnerships
Expenditures: Please note that the information related to associated funding is not available at that time.
Description:
- Labour Market Partnerships: identify, develop and support projects with industry, organizations and community groups to enhance human resource development and labour market adjustment strategies
- Agriculture, Forestry and Rural Economic Development project: identify, develop and support projects with industry, organizations and community groups to enhance human resource development and labour market adjustment strategies
- Employment Partnership program: identify, develop and support projects with industry, organizations and community groups to enhance human resource development and labour market adjustment strategies
- Employer sponsored training: training for workers to help them upgrade or acquire new skills to maintain employment
Target Groups: Industry, communities and Indigenous organizations
Benefits and expected results: In Alberta, Labour Market Partnerships provide support to:
- take action to address a labour market need to enhance workforce development and labour market adjustments
- implement workforce development and labour market adjustment strategies
- form stronger partnerships between the Government of Alberta and communities and/or industry sectors relating to labour market planning and development
- increase labour market intelligence and its dissemination
3.2.10 British Columbia
In this section
- Employment Benefits and Support Measures key facts
- Labour market context
- Canada-Newfoundland and Labrador Labour Market Development Agreement
- Designated and under-represented groups
- Stakeholder consultations
- Program delivery and participant supports
Employment Benefits and Support Measures key facts
| Indicator | Active claimant clients | Former claimant clients | PPE clients | Non-insured clients | Total |
|---|---|---|---|---|---|
| Clients served | 21,477 | 9,558 | 3,982 | 23,664 | 58,681 |
| Share of total | 36.6% | 16.3% | 6.8% | 40.3% | 100.0% |
- Notes:
- 1 This table reflects all new services started between April 1, 2024 and March 31, 2025.
- 2 This table excludes Indigenous pan-Canadian data.

Text description
| Year | Active claimant clients | Former claimant clients | PPE clients | Non-insured clients |
|---|---|---|---|---|
| 2015-16 | 35,891 | 9,007 | n/a | 31,706 |
| 2016-17 | 35,272 | 8,733 | n/a | 31,073 |
| 2017-18 | 32,881 | 10,209 | n/a | 25,883 |
| 2018-19 | 28,399 | 7,055 | 2,904 | 23,332 |
| 2019-20 | 25,584 | 8,607 | 4,794 | 19,677 |
| 2020-21 | 23,215 | 4,511 | 2,393 | 8,876 |
| 2021-22 | 20,839 | 6,132 | 2,952 | 10,878 |
| 2022-23 | 18,577 | 9,296 | 3,706 | 19,541 |
| 2023-24 | 20,977 | 10,505 | 4,179 | 25,422 |
| 2024-25 | 21,477 | 9,558 | 3,982 | 23,664 |
- Notes:
- 1 This chart reflects all new services started between April 1, 2024 and March 31, 2025.
- 2 This chart excludes Indigenous pan-Canadian data.
| Year | Active claimant clients | Former claimant clients | PPE clients | Non-insured clients |
|---|---|---|---|---|
| 2015-16 | 46.9% | 11.8% | n/a | 41.4% |
| 2016-17 | 47.0% | 11.6% | n/a | 41.4% |
| 2017-18 | 47.7% | 14.8% | n/a | 37.5% |
| 2018-19 | 46.0% | 11.4% | 4.7% | 37.8% |
| 2019-20 | 43.6% | 14.7% | 8.2% | 33.5% |
| 2020-21 | 59.5% | 11.6% | 6.1% | 22.8% |
| 2021-22 | 51.1% | 15.0% | 7.2% | 26.7% |
| 2022-23 | 36.3% | 18.2% | 7.2% | 38.2% |
| 2023-24 | 34.3% | 17.2% | 6.8% | 41.6% |
| 2024-25 | 36.6% | 16.3% | 6.8% | 40.3% |
- Notes:
- 1 This table reflects all new services started between April 1, 2024 and March 31, 2025.
- 2 This table excludes Indigenous pan-Canadian data.
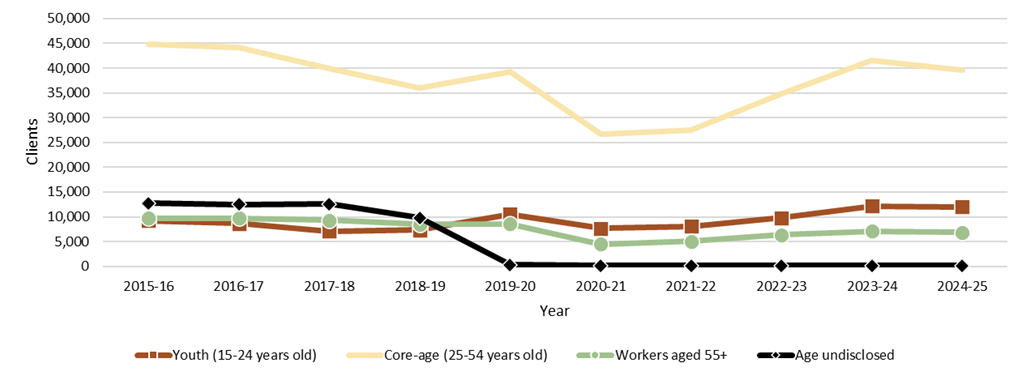
Text description
| Year | Youth (15-24 years old) | Core-age (25-54 years old) | Workers aged 55+ | Age undisclosed2 |
|---|---|---|---|---|
| 2015-16 | 9,232 | 44,893 | 9,733 | 12,746 |
| 2016-17 | 8,687 | 44,197 | 9,701 | 12,493 |
| 2017-18 | 7,126 | 39,939 | 9,302 | 12,606 |
| 2018-19 | 7,337 | 36,047 | 8,527 | 9,779 |
| 2019-20 | 10,532 | 39,283 | 8,536 | 311 |
| 2020-21 | 7,661 | 26,705 | 4,507 | 122 |
| 2021-22 | 8,052 | 27,473 | 5,093 | 183 |
| 2022-23 | 9,802 | 34,785 | 6,384 | 149 |
| 2023-24 | 12,172 | 41,626 | 7,140 | 145 |
| 2024-25 | 12,030 | 39,609 | 6,870 | 172 |
- Notes:
- 1 This chart reflects all clients served between April 1, 2024 and March 31, 2025.
- 2 Clients for whom valid dates of birth were not provided are included in the 'Age undisclosed' category.
- 3 This chart excludes Indigenous pan-Canadian data.
- 4 Apprentice clients were excluded from the age breakout prior to 2024-25. Starting 2024-25 they are reported under a "known" age unless their date of birth was invalid or missing.
| Year | Youth (15-24 years old) | Core-age (25-54 years old) | Workers aged 55+ | Age undisclosed2 |
|---|---|---|---|---|
| 2015-16 | 12.1% | 58.6% | 12.7% | 16.6% |
| 2016-17 | 11.6% | 58.9% | 12.9% | 16.6% |
| 2017-18 | 10.3% | 57.9% | 13.5% | 18.3% |
| 2018-19 | 11.9% | 58.4% | 13.8% | 15.9% |
| 2019-20 | 18.0% | 67.0% | 14.6% | 0.5% |
| 2020-21 | 19.6% | 68.5% | 11.6% | 0.3% |
| 2021-22 | 19.7% | 67.3% | 12.5% | 0.4% |
| 2022-23 | 19.2% | 68.0% | 12.5% | 0.3% |
| 2023-24 | 19.9% | 68.1% | 11.7% | 0.2% |
| 2024-25 | 20.5% | 67.5% | 11.7% | 0.3% |
- Notes:
- 1 This table reflects all clients served between April 1, 2024 and March 31, 2025.
- 2 Clients for whom valid dates of birth were not provided are included in the 'Age undisclosed' category.
- 3 This table excludes Indigenous pan-Canadian data.
- 4 Apprentice clients were excluded from the age breakout prior to 2024-25. Starting 2024-25 they are reported under a "known" age unless their date of birth was invalid or missing.
| Service type | Services delivered | Year-over-year change | Share of total | Year-over-year change (p.p.) |
|---|---|---|---|---|
| Employment Benefits | 33,166 | -42.7% | 25.5% | -18.9 |
| Support Measure | 97,049 | +33.7% | 74.5% | +18.9 |
| Total services | 130,215 | -0.2% | 100.0% | n/a |
- Notes:
- 1 This table reflects all new services started between April 1, 2024 and March 31, 2025.
- 2 This table excludes Indigenous pan-Canadian data.
- 3 The decrease in EB is due to coding correction, where some workshops previously counted as EB instead of SM. Prior to this coding correction, EB counts were stable between 2023-24 and 2024-25.
| Service type | Services | Year-over-year change | Expenditures | Year-over-year change |
|---|---|---|---|---|
| Targeted Wage Subsidies | 2,453 | -40.0% | $33,896,593 | -13.1% |
| Self-Employment | 544 | -26.3% | $23,745,580 | +1.1% |
| Job Creation Partnerships | 0 | -100.0% | $104,605 | -94.5% |
| Skills Development-Regular | 15,635 | -60.1% | $129,262,823 | -21.7% |
| Skills Development-Apprentices | 14,534 | +5.1% | Included above | Included above |
| Targeted Earning Supplements | n/a | n/a | n/a | n/a |
| Totals Employment Benefits | 33,166 | -42.7% | $187,009,601 | -18.5% |
| Employment Services | 61,195 | +79.9% | $51,232,634 | +3.8% |
| Individual Counselling | 35,854 | -6.9% | Included above | Included above |
| Labour Market Partnerships | n/a | n/a | $11,805,133 | -7.0% |
| Research & Innovation | n/a | n/a | $24,978,012 | -8.9% |
| Total Support Measure | 97,049 | +33.7% | $88,015,779 | -1.6% |
| Total EBSMs | 130,215 | -0.2% | $275,025,380 | -13.8% |
- Notes:
- 1 This table reflects all new services started between April 1, 2024 and March 31, 2025.
- 2 This table excludes Indigenous pan-Canadian data.
- 3 The decrease in Skills Development-Regular (SD-R) is due to a coding correction, where some workshops previously were coded by BC as SD-R instead of EAS. Prior to this coding correction, the SD-R counts were stable between 2023-24 and 2024-25.

Text description
| Year | Unpaid EI benefits | EI-insured clients - returns to employment3 | Non-insured clients - returns to employment | Active claimantclients served | Total clients served4 |
|---|---|---|---|---|---|
| 2015-16 | $125,294,701 | 19,552 | 8,597 | 35,891 | 76,604 |
| 2016-17 | $152,689,817 | 21,050 | 9,644 | 35,272 | 75,078 |
| 2017-18 | $136,556,392 | 20,997 | 9,168 | 32,881 | 68,973 |
| 2018-19 | $136,811,084 | 21,515 | 9,772 | 28,399 | 61,690 |
| 2019-20 | $138,735,969 | 20,491 | 6,106 | 25,584 | 58,662 |
| 2020-21 | $135,929,742 | 17,002 | 3,544 | 23,215 | 38,995 |
| 2021-22 | $258,134,870 | 23,086 | 4,623 | 20,839 | 40,801 |
| 2022-23 | $148,383,657 | 18,924 | 6,330 | 18,577 | 51,120 |
| 2023-24 | $149,023,590 | 19,160 | 7,972 | 20,977 | 61,083 |
| 2024-25 | $168,653,828 | 19,941 | 7,209 | 21,477 | 58,681 |
- Notes:
- 1 This chart excludes Indigenous pan-Canadian data..
- 2 Volatility in the Unpaid EI Benefits from 2021‑22 to 2022‑23 correlates with the speed of recovery of the labour market that allowed many Canadians to return to work before exhausting their EI benefits.
- 3 The EI-insured return to employment returns includes active claimants, former claimants, and PPE clients
- 4 "Total Clients Served" refers to the count of EI-insured clients served (active claimant clients, former claimant clients, and PPE clients) and non-insured clients.
- 5 Historical data has been adjusted to enhance accuracy.
Labour market context
Between 2023-24 and 2024-25, British Columbia's labour market has continued to stabilize, following the easing of the extremely tight conditions in 2020-22. This balance is largely attributed to a combination of factors, including a strong influx of younger workers and immigrants, as well as ongoing economic expansion. However, the effects of this stabilization are not evenly distributed across all sectors and regions.
British Columbia's unemployment rate rose slightly to 5.6% in 2024 up from 5.2% in 2023.Footnote 84 Job vacancies continued to decline, with the job vacancy rate dropping to 3.9% in March 2024, down from its peak of 7.2% in December 2021 and down from the average of 5.8% in 2022-23.Footnote 85 In March 2024, there were approximately 97,200 job vacancies in the province,Footnote 86 compared to approximately 167,200Footnote 87 persons who were without work, looked for work in the last 4 weeks, and were available for work.
Despite a general improvement in labour market balance, British Columbia still faces persistent recruitment in key sectors such as health care and social assistance, construction, professional, scientific and technical services, retail trade, and educational services. These sectors continue to experience job vacancy rates above 2019 levels, particularly in regions outside of the Lower Mainland-Southwest, where the demographic pressures and slower population growth exacerbate hiring difficulties.
In 2024-25, British Columbia's economic labour market priorities continue to focus on addressing the challenges of an aging workforce, adapting to evolving immigration policies, and ensuring the workforce is equipped with the skills for both emerging and established industries. The increasing demand for post-secondary education and training, including micro-credentials and green economy skills, reflects the province's commitment to building a resilient and inclusive workforce.
Canada-British Columbia Labour Market Development Agreement
In 2024-25, British Columbia received over $296 million though the LMDA, serving approximately 58,700 clients. Within 6 months of receiving training and employment supports, 69.1% of active claimant clients had secured employment, resulting in approximately $168 million in saving from unpaid EI benefits.
The LMDA funding in British Columbia contributed to addressing the following priorities:
- ensuring job seekers have access to high quality services and supports they need to find and keep meaningful employment
- supporting programs, services and initiatives that create equity for underrepresented groups in the labour market, with program and policy design aligned with the Declaration on the Rights of Indigenous Peoples Act
- building an efficient labour market that support all communities
- evolving employment and labour market services to meet the needs of a modern and inclusive economy
In Fiscal year 2024-25, over 58,700 people started a new employment service through WorkBC. This includes over 35,000 Active, Former and Premium Paid Employment Insurance (EI) claimants, and close to 24,000 non-insured individuals.
In 2022-23 WorkBC began to see a post-pandemic increase in new clients seeking services at the same time as the labour market experienced a strong recovery. As a result, the program saw a higher proportion of people with more complex employment barriers requiring higher levels of support to find and keep stable employment. 2023-24 saw a strong increase in non-insured clients accessing WorkBC services, driven by the increase in immigration and youth unemployment, populations which traditionally have lower eligibility for EI benefits. In 2024-25 the number of new uninsured clients declined due to the federal immigration policy shift.
Of the Active EI, Former EI, and past premium contributing clients who received WorkBC services in 2024-25, over 57.0% achieved employment, an increase from 54.0% in the previous fiscal year. More than 27,300 clients achieved employment through WorkBC in 2024-25, slightly higher than in the previous fiscal year.
Designated and under-represented groups
British Columbia prioritizes an inclusive labour market that values diversity and enables employers to draw from a wide talent pool and benefit from a variety of skills, perspectives, and experiences. In 2024-25, recent immigration made up 44.0% of WorkBC's case-managed client base, the largest group served by inclusion-focused programming. With recent immigrants expected to play a key role in meeting future labour market needs, WorkBC achieved positive outcomes for 46.0% of its recent immigrant clients, who secured employment after receiving case management services.
WorkBC also supported more than 15,700 clients with disabilities in 2024-25, with 37.0% of them securing employment or a community attachment (volunteer opportunity) after receiving case management.
Recognizing reconciliation as an ongoing commitment, British Columbia continues to work with partners in ways that honor Indigenous rights and advance reconciliation efforts. In 2024-25, British Columbia engaged with nearly 7,000 Indigenous clients through WorkBC services. Additionally, the province invested over $2.1 million through Community and Employer Partnerships to support 2 Indigenous-focused projects, creating opportunities for up to 72 clients across the province.
Stakeholder consultations
In British Columbia, partnerships and collaboration with community organizations remain central in the development of employment programming. In 2024-25, the province maintained its commitment to inclusive and responsive labour market strategies by engaging a broad range of stakeholders, including sectors and employers, communities, Indigenous communities and organizations, employees, provincial ministries, persons with disabilities, inclusive employers, community-based service providers, and Francophone service providers.
Consultations conducted during this period helped identify key priorities and informed actions aligned with the StrongerBC Economic Plan, with a focus on supporting unemployed and underemployed individuals. These engagements emphasized the importance of tailoring employment services to meet the diverse needs of British Columbians, particularly those facing systemic barriers to labour market participation.
British Columbia continues to work closely with the Fédération des Francophones de la Colombie-Britannique (FFCB) to address the needs of Francophone job seekers and communities in the province. The collaboration supports the planning and integrated implementation of the Official Language Minority Community (OLMC) Employment Assistance Services network, funded by the Government of Canada, ensuring Francophone communities receive tailored employment assistance.
In recent years, British Columbia has also provided funding grants to community organizations to pilot innovative program models aimed at supporting vulnerable populations, fostering inclusive workplaces, and informing future program design. These initiatives, administered by the Ministry of Social Development and Poverty Reduction, reflect the province's ongoing commitment to equity, innovation, and collaboration in employment service delivery.
Empowering men to heal, learn, and thrive
After years of battling chronic unemployment, addiction, and unhealthy relationships, Bert was ready for change. He joined the Purpose Project through a WorkBC Wellness Navigator at his transitional housing program. Coordinated by Kinghaven Peardonville House Society, Purpose Project is a program for male survivors of violence, funded through Project-Based Labour Market Training (PBLMT).
The Purpose Project offered more than just job training - it offered hope. Bert gained hands-on construction training and earned industry-recognized certificates. He also participated in trauma counselling sessions, which supported his healing journey and helped him address the lasting impacts of addiction and abuse. He took part in employability skills training, where he developed essential life skills such as goal setting, boundary building, and mindfulness - tools that empowered him to move forward with confidence. These skills helped Bert gain full-time employment as a Hoist Operator with the same employer he trained with. He was recently named Employee of the Month - a testament to his hard work and transformation.
"I would like to express my deepest gratitude on giving me such a wonderful gift that is going to allow me to move forward after a life of addiction that did its damage on my life," Bert shared. "Programs like this are an amazing opportunity for men."
Bert's story is a powerful example of how the Purpose Project helps male survivors of violence and abuse reclaim their lives through meaningful employment and healing support.
Program delivery and participant supports
This section provides an overview of specific programs and financial supports funded under the LMDA. It includes specific details on the programs and initiatives, their duration, their associated funding, and any additional supports provided to clients.
Program: WorkBC Employment Services: General Employment Support
Expenditures: In 2024-25, over $111.3 million of LMDA funding was attributed to skills-training programs for unemployed and underemployed British Columbians, providing about 27,000 skills training services to clients.
An additional $34 million was invested to support British Columbians gain paid work experience to improve their search for employment.
To help prepare for an expected shortfall of skilled trades people, British Columbia. invested an additional $18.2 million in programs supporting apprentices.
Description: To achieve sustainable and meaningful employment, British Columbia's programs provide customized services to help clients find good, stable jobs in key in-demand sectors like construction, social services, technology, tourism, natural resources, and healthcare
Target client groups: EI-Insured clients are funded via the LMDA. WDA and provincial funding support equitable access to the suite of case-managed services.
Benefits and expected results:
In 2024-25, almost 100,000 clients actively receiving services, with 82,000 case managed.
Of these clients close to 36,000 were supported through their first year of employment. In 2024-25, the WorkBC employment outcome rate was 45%. The outcome rate was higher for Active EI, Former EI, and past premium contributing clients who received WorkBC services, with over 49% achieving employment.
Among individuals who completed Occupational Skills Training, 69% secured employment.
For those participating in Wage Subsidy, 77% achieved employment.
This year, over 15,300 apprentices have participated in the WorkBC Apprentice Services program, with 12,400 completing a level of apprentice training this year.
In 2016, British Columbia launched the Targeting, Referral and Feedback (TRF) initiative to assist EI applicants return to employment more quickly by identifying and connecting these individuals with their local WorkBC Centre. In 2024-25, while conducting behavioural insights trials, over 45,000 EI applicants were referred and about 2,800 began working with a WorkBC Case Manager.
LMDA funding helps British Columbians seeking employment adapt to changing labour market conditions and to meet the needs of employers seeking a skilled workforce. Close to 13,000 employers ranging from small businesses to multi-national corporations hired over 12,700 current and former EI recipients through WorkBC in 2024-25. The top occupations and employers of over 15,000 of these jobs were reported to WorkBC employment counsellors.
Program: WorkBC Employment Services: Inclusive Employment Support
Expenditures: Please note that the information related to associated funding is not available at that time.
Description: A diverse and inclusive labour market creates a wider pool for employers to draw on. Providing a broader choice of job applicants and bringing into workplaces a wealth of diverse skills, knowledge, and fresh viewpoints. WorkBC provides individualized services and support to all case-managed clients to support them in achieving their employment goals.
Target client groups: EI-Insured clients are funded by the LMDA. WDA and Provincial funding support equitable access to needed services to support people toward meaningful employment.
Benefits and expected results: In 2024-25, 44% of WorkBC Case Managed clients identified as an immigrant. Immigrants represent the largest inclusion group and one of the groups expected to help meet future labour market demands.
- 46% of WorkBC immigrant clients achieved an employment outcome after receiving case management services
- WorkBC also served almost 15,800 people with disabilities in 2024-25
- Of these, 37% achieved an employment outcome or secured community attachment (volunteer opportunity) after receiving case management services
- Provincial funding supports single parents receiving income assistance who have not established
Additionally, British Columbia provides secretariat support to the Presidents' Advisory Committee and supports ongoing collaboration to promote awareness of, and the business case for, recruitment and retention of persons with disabilities.
Program: WorkBC Employment Services: Indigenous Employment Support
Expenditures: Please note that the information related to associated funding is not available at that time.
Description: British Columbia recognizes that reconciliation is an ongoing commitment and will continue to engage with partners in ways that respect the rights of Indigenous Peoples and advance reconciliation.
Target client groups: EI-Insured clients are funded by the LMDA. WDA and Provincial funding support equitable access to needed services to support people toward meaningful employment.
Benefits and expected results: In 2024-25, nearly 7,000 clients who identify as Indigenous participated in WorkBC services.
Program: Single Parent Employment Initiative
Expenditures: Please note that the information related to associated funding is not available at that time.
Description: In 2015, British Columbia introduced the Single Parent Employment Initiative to support single parents on income and disability assistance who want to pursue employment and move towards financial independence.
Target client groups: EI-Insured clients funded through the LMDA. Provincial funding supports single parents receiving income assistance who have not established EI eligibility.
Benefits and expected results: As of March 2025, 2,771 single parents have participated in the Single Parent Employment Initiative through WorkBC. Of those, 1,959 have found employment.
Program: WorkBC Employment Services: Francophone Client Support
Expenditures: Please note that the information related to associated funding is not available at that time.
Description: The volume of new WorkBC clients who self-identified as Francophone grew 11% year-over-year in 2024-25.
Target client groups: EI-Insured clients are funded via the LMDA. WDA and Provincial funding support equitable access to needed services to support people toward meaningful employment
Benefits and expected results: Over 2,400 Francophone clients were provided employment services or supported through the first year of employment. Of these clients, about 40% also identified as immigrants, this ratio has increased steadily over the last 2 fiscal years. Francophone clients participated in over 5,600 WorkBC services.
In March of 2022, British Columbia. introduced automated surveys to collect WorkBC clients' feedback on their overall satisfaction with the services they received. In 2024-25 close to 480 Francophone clients completed the surveys with an average satisfaction score of 72 and British Columbia expects increased satisfaction as program improves over time.
Program: Community and Employer Partnership (CEP) program: Project Based Labour Market Training projects
Expenditures: $2.8M was invested in PBLMT projects which includes $0.73M in Indigenous focused projects. An additional $2.5M was provided to PBLMT participants in financial supports.
Description: British Columbia's investments in innovative PBLMT projects offer unique skills training and work experience opportunities to support people in gaining good jobs. CEP projects support innovative initiatives to help to make life better for people and their families. British Columbia continued to leverage funding from the Community and Employer Partnerships fund to learn about and address unique local labour market issues, as well as help support communities and contribute to economic growth.
In 2024-25, British Columbia focused on labour market recovery and prioritized funding CEP projects that:
- supported people to ensure they have all the employment supports needed to be able to participate fully in the labour market and gain the skills needed for good, in-demand jobs
- provided individual and community tailored training and work experience opportunities with industry recognized certifications in priority sectors
- had the greatest and most immediate impact on employment outcomes
- ensured that funding was accessible and equitably distributed across the province
British Columbia supported 15 Project Based Labour Market Training projects, such as:
- Community Support Workers in Northern British Columbia provided participants with employability, essential skills, occupational skills training and on-the-job work experience with local employers to prepare participants for employment as Community Support Workers and Community Mental Health Workers
- The Purpose Project with Kinghaven Peardonville House Society for male survivors of violence prepared participants for employment in the construction industry. Participants receive occupational and employability skills training, individual trauma counselling and 1 on 1 supports
- Wildfire and Integrated Natural Resources Training provided participants with employability, essential skills, occupational skills training, and on the job work experience opportunities with local employers to prepare for employment in the natural resources sector
British Columbia supported 2 Indigenous-focused projects for up to 72 participants across the province:
- Key to Employment supported 48 participants in 4 communities with essential and employability skills training, as well as work experience to prepare them for employment in construction, transportation, general labour, and security
- Class 1 Professional Driving supported 24 participants in 3 communities with essential and employability skills training, as well as work experience to prepare them for employment in the truck driving industry
Target client groups: EI-Insured clients are funded via the LMDA. WDA and Provincial funding support equitable access to needed services to support people toward meaningful employment.
Benefits and expected results: 360 people were served on these projects, 309 completed, and 190 of them are still employed today. Participants received valuable cohort-based skills training and work experiences in a variety of occupations such as construction, community support workers and in the natural resources sector.
Program: Job Creation Partnership projects
Expenditures: $0.11M invested in 1 JCP project for project and participant costs
Description: British Columbia's investments in innovative CEP projects offer unique skills training and work experience opportunities to support people into good jobs. CEP projects support innovative initiatives to help to make life better for people and their families. British Columbia continued to leverage funding from the Community and Employer Partnerships fund to learn about and address unique local labour market issues, as well as help support communities and contribute to economic growth.
British Columbia invested in 1 Job Creation Partnership project, including:
The Regenerative Agriculture Project provided clients with work experience and skill enhancement in the agriculture sector. Training included general farm practices, composting skills, regenerative agriculture, and food security techniques. The project enhanced the clients' employment prospects as harvesting labourers or general farm workers, as well as knowledge of regenerative agriculture that gave clients' advantage in the labour market
Target client groups: EI-Insured clients funded via the LMDA
Benefits and expected results: 5 people were served on this project and gained valuable work experience in the area of regenerative agriculture.
Program: Research and Innovation Projects: Inclusive Employment Supports
Expenditures: Please note that the information related to associated funding is not available at that time.
Description: British Columbia invests in projects that support initiatives focusing on employment supports and programming for youth, Indigenous Peoples, people with disabilities, and underrepresented populations. On-going, multi-year projects included:
- Foundry Work and Education program which provides integrated and personal wraparound assistance to youth ages 15 to 24, including health, mentoring, education, skills development, and job-placement services
- Victoria L.E.A.P. (Life Skills, Employment Skills, and Awareness Program) which supports the development of pre-employment training and employment readiness for people who have formerly experienced homelessness and who are contemplating employment
Target client groups: Research institutions and project-based research approaches that test new and innovative service delivery approaches to inform and continue to enhance services, including informing future services
Benefits and expected results: Victoria LEAP helped over 120 formerly homeless people with practical support, hands-on learning and personalized development to increase their employability and access to opportunities. 4 participants reported obtaining employment in 2024-25.
The Foundry Work and Education Program (FWEP) expanded to 16 communities across British Columbia, improving access to employment services for at-risk youth in the province.
Program: Research and Innovation projects: Care Economy
Expenditures: Please note that the information related to associated funding is not available at that time.
Description: The care economy encompasses the full life cycle of human services. The care economy includes contracted social service providers, who provide government-funded services dedicated to enhancing economic and social well-being by helping individuals lead more stable and self-sufficient lives.
Contracted social service providers employers across British Columbia are struggling to recruit and retain the thousands of workers needed to maintain important social services.
In 2024-25, British Columbia managed 2 ongoing multi-year grants:
- Online Training for Newcomers in the Care Economy, jointly funded with British Columbia, provides online training to support newcomers entering the human services sector. This will improve newcomer employment outcomes and retention rates and remove barriers by providing training free of cost to participants
- Supervisor Training in the Community Social Services Sector provides supervisory training and education for leaders in the social service sector, improving outcomes and retention rates for supervisors and their staff
Target client groups: Research institutions and project-based research approaches that test new and innovative service delivery approaches to inform and continue to enhance services, including informing future services
Benefits and expected results: 25 participants are expected to take part in the first cohort of Online Training for Newcomers in the Care Economy, which will be held in 2025-26. Multiple social services organizations in remote, rural, and urban locations across the province will receive training grants as part of the Supervisor Training project.
Program: Community based Employment Services
Expenditures: $3,810,00
Description: In 2024-25, British Columbia. launched Community-based Employment Services (CBES) as a 3-year pilot in 6 communities across the province.
Community-based Employment Services addresses known community needs by funding outreach-based pre-employment and employment services for people with complex needs - such as substance use, homelessness, and mental health challenges - who are often underserved by traditional employment programs.
Delivered in safe, accessible community spaces, CBES meets people where they are with trauma-informed, culturally safe supports, helping people build stability, confidence and community connection as they move towards employment readiness.
Target client groups: Community organizations test new and innovative service delivery approaches for unemployed adults who are facing multiple, complex barriers to employment in order to continue to enhance current services and inform future services
Benefits and expected results: As of March 2025, 376 people were supported by meeting them where they are along their employment journey and supporting meaningful steps for them to obtain a job. Project obtained employment in-demand occupations including construction, scientific and administrative occupations.
3.2.11 Yukon
In this section
- Employment Benefits and Support Measures key facts
- Labour market context
- Canada-Newfoundland and Labrador Labour Market Development Agreement
- Designated and under-represented groups
- Stakeholder consultations
- Program delivery and participant supports
Employment Benefits and Support Measures key facts
| Indicator | Active claimant clients | Former claimant clients | PPE clients | Non-insured clients | Client type unspecified2 | Total |
|---|---|---|---|---|---|---|
| Clients served | 205 | 107 | 92 | 255 | n/a | 659 |
| Share of total | 31.1% | 16.2% | 14.0% | 38.7% | n/a | 100.0% |
- Notes:
- 1 This table reflects all clients served between April 1, 2024 and March 31, 2025.
- 2 Clients for whom necessary information (Social Insurance Number) was not provided are included in the 'Client type unspecified' category.
- 3 This table excludes Indigenous pan-Canadian data.

Text description
| Year | Active claimant clients | Former claimant clients | PPE clients | Non-insured clients | Client type unspecified2 |
|---|---|---|---|---|---|
| 2015-16 | 211 | 41 | n/a | 65 | n/a |
| 2016-17 | 201 | 34 | n/a | 85 | n/a |
| 2017-18 | 208 | 44 | n/a | 108 | n/a |
| 2018-19 | 189 | 35 | 39 | 75 | n/a |
| 2019-20 | 155 | 23 | 29 | 24 | n/a |
| 2020-21 | 115 | 22 | 27 | 23 | n/a |
| 2021-22 | 177 | 77 | 49 | 54 | n/a |
| 2022-23 | 212 | 0 | 0 | 0 | 238 |
| 2023-24 | 212 | 0 | 0 | 0 | 238 |
| 2024-25 | 205 | 107 | 92 | 255 | n/a |
- Notes:
- 1 This chart reflects all clients served between April 1, 2024 and March 31, 2025.
- 2 Clients for whom necessary information (Social Insurance Number) was not provided are included in the 'Client type unspecified' category.
- 3 This chart excludes Indigenous pan-Canadian data.
| Year | Active claimant clients | Former claimant clients | PPE clients | Non-insured clients | Client type unspecified2 |
|---|---|---|---|---|---|
| 2015-16 | 66.6% | 12.9% | n/a | 20.5% | n/a |
| 2016-17 | 62.8% | 10.6% | n/a | 26.6% | n/a |
| 2017-18 | 57.8% | 12.2% | n/a | 30.0% | n/a |
| 2018-19 | 55.9% | 10.4% | 11.5% | 22.2% | n/a |
| 2019-20 | 67.1% | 10.0% | 12.6% | 10.4% | n/a |
| 2020-21 | 61.5% | 11.8% | 14.4% | 12.3% | n/a |
| 2021-22 | 49.6% | 21.6% | 13.7% | 15.1% | n/a |
| 2022-23 | 47.1% | 0.0% | 0.0% | 0.0% | 52.9% |
| 2023-24 | 47.1% | 0.0% | 0.0% | 0.0% | 52.9% |
| 2024-25 | 31.1% | 16.2% | 14.0% | 38.7% | n/a |
- Notes:
- 1 This table reflects all clients served between April 1, 2024 and March 31, 2025.
- 2 Clients for whom necessary information (Social Insurance Number) was not provided are included in the "Unknown" category.
- 3 This table excludes Indigenous pan-Canadian data.

Text description
| Year | Youth (15-24 years old) | Core-age (25-54 years old) | Workers aged 55+ | Age undisclosed2 |
|---|---|---|---|---|
| 2015-16 | 28 | 131 | 28 | 130 |
| 2016-17 | 35 | 134 | 24 | 127 |
| 2017-18 | 34 | 167 | 29 | 130 |
| 2018-19 | 27 | 176 | 25 | 110 |
| 2019-20 | 37 | 138 | 16 | 40 |
| 2020-21 | 47 | 123 | 4 | 13 |
| 2021-22 | 40 | n/a | n/a | 317 |
| 2022-23 | n/a | n/a | n/a | 450 |
| 2023-24 | n/a | n/a | n/a | 450 |
| 2024-25 | 137 | 420 | 71 | 31 |
- Notes:
- 1 This chart reflects all clients served between April 1, 2024 and March 31, 2025.
- 2 Clients for whom valid dates of birth were not provided are included in the 'Age undisclosed' category.
- 3 This chart excludes Indigenous pan-Canadian data.
- 4 Apprentice clients were excluded from the age breakout prior to 2024-25. Starting 2024-25 they are reported under a "known" age unless their date of birth was invalid or missing.
| Year | Youth (15-24 years old) | Core-age (25-54 years old) | Workers aged 55+ | Age undisclosed2 |
| 2015-16 | 8.8% | 41.3% | 8.8% | 41.0% |
| 2016-17 | 10.9% | 41.9% | 7.5% | 39.7% |
| 2017-18 | 9.4% | 46.4% | 8.1% | 36.1% |
| 2018-19 | 8.0% | 52.1% | 7.4% | 32.5% |
| 2019-20 | 16.0% | 59.7% | 6.9% | 17.3% |
| 2020-21 | 25.1% | 65.8% | 2.1% | 7.0% |
| 2021-22 | 11.2% | n/a | n/a | 88.8% |
| 2022-23 | n/a | n/a | n/a | 100.0% |
| 2023-24 | n/a | n/a | n/a | 100.0% |
| 2024-25 | 20.8% | 63.7% | 10.8% | 4.7% |
- Notes:
- 1 This table reflects all clients served between April 1, 2024 and March 31, 2025.
- 2 Clients for whom valid dates of birth were not provided are included in the 'Age undisclosed' category.
- 3 This table excludes Indigenous pan-Canadian data.
- 4 Apprentice clients were excluded from the age breakout prior to 2024-25. Starting 2024-25 they are reported under a "known" age unless their date of birth was invalid or missing.
| Service type | Services delivered | Year-over-year change | Share of total | Year-over-year change (p.p.) |
|---|---|---|---|---|
| Employment Benefits | 348 | +7.4% | 41.5% | -1.8 |
| Support Measure | 491 | +15.5% | 58.5% | +1.8 |
| Total services | 839 | +12.0% | 100.0% | n/a |
- Notes:
- 1 This table reflects all new services started between April 1, 2024 and March 31, 2025.
- 2 This table excludes Indigenous pan-Canadian data.
| Service type | Services | Year-over-year change | Expenditures | Year-over-year change |
|---|---|---|---|---|
| Targeted Wage Subsidies | 0 | n/a | $6,000 | -93.8% |
| Self-Employment | 1 | -75.0% | n/a | n/a |
| Job Creation Partnerships | n/a | n/a | n/a | n/a |
| Skills Development-Regular | 24 | -77.8% | $1,538,339 | -10.9% |
| Skills Development-Apprentices | 323 | +52.4% | Included above | Included above |
| Targeted Earning Supplements | n/a | n/a | n/a | n/a |
| Totals Employment Benefits | 348 | +7.4% | $1,544,339 | -15.4% |
| Employment Services | 458 | +35.5% | $1,009,944 | -53.9% |
| Individual Counselling | 33 | -62.1% | Included above | Included above |
| Labour Market Partnerships | n/a | n/a | n/a | n/a |
| Research & Innovation | n/a | n/a | $612,073 | +90.9% |
| Total Support Measure | 491 | +15.5% | $1,622,017 | -35.4% |
| Total EBSMs | 839 | +12.0% | $3,166,356 | -26.9% |
- Notes:
- 1 This table reflects all new services started between April 1, 2024 and March 31, 2025.
- 2 This table excludes Indigenous pan-Canadian data.
- 3 The financial totals in the MAR are based on finalized reports provided by PTs. At the time of publication, final audited financial statements for YT had not been received. As such, expenditures for these jurisdictions are based on draft reports or previous-year financial statements.
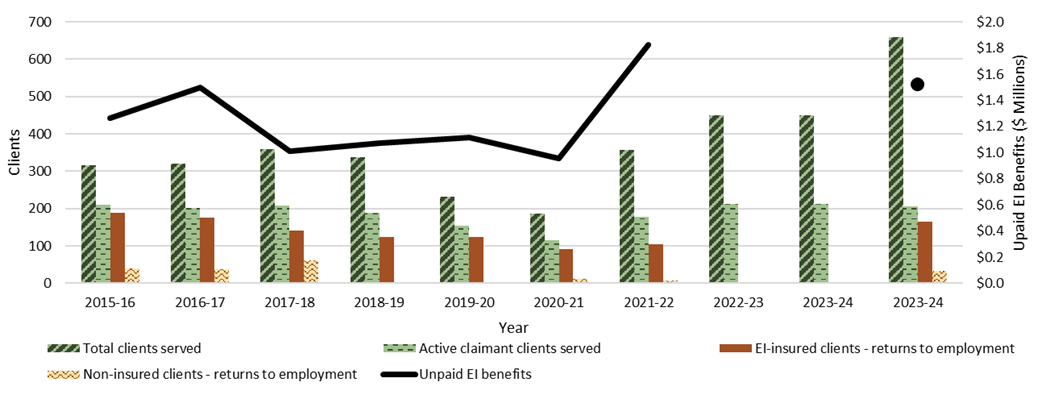
Text description
| Year | Unpaid EI benefits | EI-insured clients - returns to employment3 | Non-insured clients - returns to employment | Active claimantclients served | Total clients served4 |
|---|---|---|---|---|---|
| 2015-16 | $1,266,470 | 188 | 40 | 211 | 317 |
| 2016-17 | $1,498,718 | 176 | 37 | 201 | 320 |
| 2017-18 | $1,011,003 | 141 | 61 | 208 | 360 |
| 2018-19 | $1,069,493 | 123 | 3 | 189 | 338 |
| 2019-20 | $1,117,099 | 123 | 2 | 155 | 231 |
| 2020-21 | $957,323 | 92 | 12 | 115 | 187 |
| 2021-22 | $1,821,872 | 105 | 8 | 177 | 357 |
| 2022-23 | n/a | 4 | 0 | 212 | 450 |
| 2023-24 | n/a | 4 | 0 | 212 | 450 |
| 2024-25 | $1,524,517 | 165 | 33 | 205 | 659 |
- Notes:
- 1 This chart excludes Indigenous pan-Canadian data.
- 2 Volatility in the Unpaid EI Benefits from 2021‑22 to 2022‑23 correlates with the speed of recovery of the labour market that allowed many Canadians to return to work before exhausting their EI benefits.
- 3 The EI-insured return to employment returns includes active claimants, former claimants, and PPE clients
- 4 "Total Clients Served" refers to the count of EI-insured clients served (active claimant clients, former claimant clients, and PPE clients) and non-insured clients.
- 5 Historical data has been adjusted to enhance accuracy.
Labour market context
Yukon's labour market in 2024-25 continued to evolve in response to demographic shifts, sectoral demands, and broader economic transformations. While the territory maintained a relatively strong employment landscape, employers across multiple sectors faced persistent challenges in recruiting and retaining workers.
Labour shortages were particularly evident in key sectors such as tourism, healthcare, food and retail, and construction. These industries experienced increased demand due to new projects, population growth, and ongoing investments. At the same time, economic fluctuations, such as disruptions in the mining sector, influenced employment patterns and prompting a need for workforce adaptability.
The unemployment rate in Yukon was approximately 4.2%.Footnote 88 In comparison, Canada's unemployment rate in 2024 was 6.3% and in 2023 was 5.4%.Footnote 89
In March 2025, the territory had approximately 685 job vacancies,Footnote 90 while in 2023, there were, on average, around 900 unemployed individuals each month.Footnote 91 For the same period we were estimating an average of 1,148 vacancies per quarter.
Yukon's growth prospects remained positive, driven by sectors such as tourism, non-residential investment projects, and an expected population increase. However, there are concerns about a slowdown in the mining sector. To address these challenges, Yukon remains focused on evolving demographic and ensuring a skilled and inclusive workforce to support future growth.Footnote 92
Canada-Yukon Labour Market Development Agreement
In 2024-25, Yukon received approximately $3.5 million though the LMDA, serving approximately 660 clients. Within 6 months of receiving training and employment supports, approximately 65.9% of active claimant clients had secured employment, resulting in approximately $1.5 million in saving from unpaid EI benefits.
In 2024-25, LMDA funding was directed towards the following priorities:
- establishing meaningful, government-to-government labour market engagement with Yukon First Nations to support the Truth and Reconciliation Calls to Action #7 under the Education theme
- improving engagement with employers and employer organizations to drive positive change in recruitment and employer-driven workforce development
- leveraging the current labour market situation and recent work in Skills for Success to develop stronger solutions reengaging working-age Yukoners in the labour market
- determining the most effective means to support the shift from demand-driven to supply-driven thinking and maintaining flexibility as the labour market continues to evolve
In 2024-25, Yukon funded the Staffing UP: Employer Funding Support program, which helped employers hire, retain, and train employees while enhancing workplace supports for employees and employers human resource knowledge and practice. This program served 13 employers, out of which, 1 was funded through the LMDA and 11 employers were funded through WDA. This program resulted in positive labour market outcomes for 29 individuals, 3 of which were funded through LMDA and 23 were funded through WDA.
Designated and under-represented groups
The program helped to strengthen the labour market by providing support to individuals and employers, coordinating community and sector training funds, and helping to connect employers with job seekers. It specifically targeted members of under-represented groups, such as:
- Yukon First Nation citizens
- youth
- older workers
- persons with disabilities
- women in trades and technology
- newcomers in professional sectors
For example, in 2024-25, Yukon collaborated with stakeholders to improve labour market outcomes for persons with disabilities by developing consistent job coaching and work placement opportunities. Labour market participants from under-represented groups can assist Yukon in helping to fill the job vacancies.
In 2024-25, the territory funded the Building Up: Organizational Funding Support program. Below is a summary of the individuals serviced:
- 6 organizations reported 3,516 units of service, representing tracked interactions with Yukon job seekers and employers
- These interactions include repeat use by unique individuals for many services, such as accessing labour market information, using computers for job searches, receiving job assistance applications, and resume support. Historically, a unique individual is estimated to access these services 4 times a year, translating into 879 unique individuals being served in 2024-25. Among these:
- 5 funded organizations/institutions provided support to 189 Yukon First Nation citizens
- 596 individuals received ongoing case-management support to return to or gain employment
Stakeholder consultations
Yukon actively engaged several stakeholders, including in 1-on-1 engagement. In 2024-25, stakeholders included:
- First Nations
- official language minority communities
- organizations representing employers
- organizations representing workers
- persons with disabilities
- Government of Yukon departments
Tr'ondek Hwech'in First Nation Workforce Capacity Initiative
Yukon has contributed to funding an innovative First Nation project located in Dawson City. It was developed by the Tr'ondek Hwech'in First Nation (THFN) who are funding 70.0% of the project costs. The 3 year project aims to increase the First Nation's Social Services, Education and Human Resources capacity thereby improving outcomes for those citizens seeking to progress towards their employment goals and improving the First Nation's ability to staff government vacancies. What makes this project innovative is the expected creation of 12 positions within the THFN government tailored to participants' strengths, skills, and experiences. The project provides wrap around services including case management for 24 citizens who are coming from high school and university. 50.0% of participants will obtain positions within THFN government and 50.0% will be supported to seek other employment or further training opportunities. At the end of the project the THFN will develop a 'best practices' report that will inform other First Nations' capacity development and support Yukon First Nation participation in workforce development.
Program delivery and participant supports
This section provides an overview of the specific programs and financial supports available under the LMDA. It includes specific details on the programs and initiatives available, their duration associated funding, and additional supports provided to participants. This aims to demonstrate how these programs and initiatives align with federal and provincial priorities, and support labour market integration.
Program: Building UP: Organizational Funding Support
Expenditures: $2,797,373 (88.1%)
Description: Funding support for organizations that strengthen the labour market by providing:
- support to individuals
- support to employers
- projects that connect employers to job seekers
- coordination of community and sector training funds
Programs:
- Employment Assistance Services (EAS) (Building UP)
- Labour Market Partnerships (LMP) (Building UP)
- Skills For Success Projects (Building UP: participants are 'insured participants'
- Research and Innovation (R&I) (Building UP: Projects)
Target client groups:
- organizations providing services and supports to employers and individuals
- organizations providing information and expertise to strengthen the labour market
Benefits and expected results: Maintain services and supports provided to employers and individuals to attain benefits and expected results for equity-seeking groups in the Yukon's labour market (for example: Yukon First Nations people, youth, older workers, people with disabilities, women in trades and technology and newcomers in professional sectors).
Of the 596 individuals who participated in Employment Assistance Services, 271 were successful in obtaining employment within the fiscal year.
Program: Staffing UP: Employer Funding Support
Expenditures: $6,129 (0.2%)
Description: Strengthening the labour market with funding for employers to:
- find, hire, and keep workers that are a good fit for employers
- train new or existing workers to meet the employers' needs
- develop workplace supports to accommodate staff
- enhance employer human resource knowledge and practice
- get and effectively use labour market information
- connect with other employers to find and keep workers
Programs:
- Targeted Wage Subsidies (TWS) (Staffing UP)
- Employer Sponsored Training (Staffing UP: trainees are 'insured participants')
Target client groups: Yukon employers, and employers who are training, hiring and retaining individuals, with additional incentives for those employers targeting equity-seeking groups in the Yukon.
Priority sectors: Health services, food and retail services, construction trades and tourism
Benefits and expected results:
- increased employer engagement in training, hiring and retaining employees
- increased or sustained employment in the food and retail services, tourism and hospitality sectors, and a demonstrable strengthening of participant workplace skills. 29 individuals completed either on the job training and/or obtained work experience with 15 employers
- of the 29 individuals, 6 obtained new employment, 11 retained employment they otherwise would have lost, and 12 obtained skills and experience to advance, progress or move to different and better employment
Program: Working UP: Individual Funding Support (delivered by the Department of Education)
Expenditures: $370,401 (11.7%)
Description: Funding for individuals to help them:
- take the next steps toward their work or learning goals
- improve literacy and essential skills
- increase participants' workplace skills and experience, including apprenticeship
- get workplace or learning support
- explore options for self-employment
Programs:
- Skills Development Regular (SD-R)
- Skills Development Apprentice (SD-A)
Target client groups: Individuals who require assistance and support in moving towards their labour market goals
Benefits and expected results: 218 individuals successfully completed directly funded activities, increased foundational and vocational skills, and demonstrated movement towards their labour market goals.
3.2.12 Northwest Territories
In this section
- Employment Benefits and Support Measures key facts
- Labour market context
- Canada-Newfoundland and Labrador Labour Market Development Agreement
- Designated and under-represented groups
- Stakeholder consultations
- Program delivery and participant supports
Employment Benefits and Support Measures key facts
| Indicator | Active claimant clients | Former claimant clients | PPE clients | Non-insured clients | Total |
|---|---|---|---|---|---|
| Clients served | 87 | 88 | 64 | 27 | 266 |
| Share of total | 32.7% | 33.1% | 24.1% | 10.2% | 100.0% |
- Notes:
- 1 This table reflects all new services started between April 1, 2024 and March 31, 2025.
- 2 This table excludes Indigenous pan-Canadian data.

Text description
| Year | Active claimant clients | Former claimant clients | PPE clients | Non-insured clients |
|---|---|---|---|---|
| 2015-16 | 325 | 195 | n/a | 849 |
| 2016-17 | 306 | 156 | n/a | 573 |
| 2017-18 | 333 | 343 | n/a | 793 |
| 2018-19 | 266 | 205 | 229 | 355 |
| 2019-20 | 134 | 61 | 85 | 19 |
| 2020-21 | 110 | 70 | 48 | 20 |
| 2021-22 | 124 | 137 | 106 | 27 |
| 2022-23 | 121 | 157 | 141 | 31 |
| 2023-24 | 102 | 126 | 96 | 23 |
| 2024-25 | 87 | 88 | 64 | 27 |
- Notes:
- 1 This chart reflects all new services started between April 1, 2024 and March 31, 2025.
- 2 This chart excludes Indigenous pan-Canadian data.
| Year | Active claimant clients | Former claimant clients | PPE clients | Non-insured clients |
|---|---|---|---|---|
| 2015-16 | 23.7% | 14.2% | n/a | 62.0% |
| 2016-17 | 29.6% | 15.1% | n/a | 54.0% |
| 2017-18 | 22.7% | 23.3% | n/a | 54.0% |
| 2018-19 | 25.2% | 19.4% | 21.7% | 33.6% |
| 2019-20 | 44.8% | 28.2% | 19.4% | 6.4% |
| 2020-21 | 44.4% | 20.4% | 28.4% | 8.1% |
| 2021-22 | 31.5% | 34.8% | 26.9% | 6.9% |
| 2022-23 | 26.9% | 34.9% | 31.3% | 6.9% |
| 2023-24 | 29.4% | 36.3% | 27.7% | 6.6% |
| 2024-25 | 32.7% | 33.1% | 24.1% | 10.2% |
- Notes:
- 1 This table reflects all new services started between April 1, 2024 and March 31, 2025.
- 2 This table excludes Indigenous pan-Canadian data.
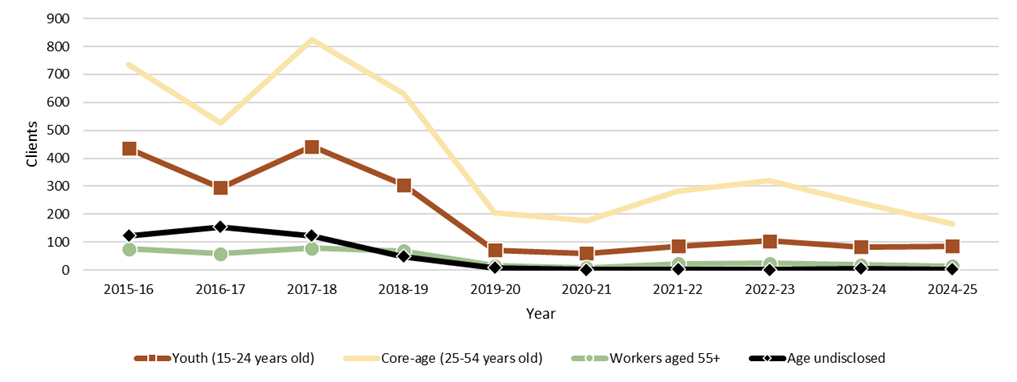
Text description
| Year | Youth (15-24 years old) | Core-age (25-54 years old) | Workers aged 55+ | Age undisclosed2 |
|---|---|---|---|---|
| 2015-16 | 435 | 735 | 76 | 123 |
| 2016-17 | 295 | 526 | 59 | 155 |
| 2017-18 | 443 | 825 | 78 | 123 |
| 2018-19 | 305 | 632 | 69 | 49 |
| 2019-20 | 72 | 204 | 15 | 8 |
| 2020-21 | 60 | 178 | 9 | 1 |
| 2021-22 | 86 | 283 | 23 | 2 |
| 2022-23 | 105 | 320 | 24 | 1 |
| 2023-24 | 83 | 239 | 19 | 6 |
| 2024-25 | 85 | 164 | 14 | 3 |
- Notes:
- 1 This chart reflects all clients served between April 1, 2024 and March 31, 2025.
- 2 Clients for whom valid dates of birth were not provided are included in the 'Age undisclosed' category.
- 3 This chart excludes Indigenous pan-Canadian data.
- 4 Apprentice clients were excluded from the age breakout prior to 2024-25. Starting 2024-25 they are reported under a "known" age unless their date of birth was invalid or missing.
| Year | Youth (15-24 years old) | Core-age (25-54 years old) | Workers aged 55+ | Age undisclosed2 |
|---|---|---|---|---|
| 2015-16 | 31.8% | 53.7% | 5.6% | 9.0% |
| 2016-17 | 28.5% | 50.8% | 5.7% | 15.0% |
| 2017-18 | 30.2% | 56.2% | 5.3% | 8.4% |
| 2018-19 | 28.9% | 59.9% | 6.5% | 4.6% |
| 2019-20 | 24.1% | 68.2% | 5.0% | 2.7% |
| 2020-21 | 24.2% | 71.8% | 3.6% | 0.4% |
| 2021-22 | 21.8% | 71.8% | 5.8% | 0.5% |
| 2022-23 | 23.3% | 71.1% | 5.3% | 0.2% |
| 2023-24 | 23.9% | 68.9% | 5.5% | 1.7% |
| 2024-25 | 32.0% | 61.7% | 5.3% | 1.1% |
- Notes:
- 1 This table reflects all clients served between April 1, 2024 and March 31, 2025.
- 2 Clients for whom valid dates of birth were not provided are included in the 'Age undisclosed' category.
- 3 This table excludes Indigenous pan-Canadian data.
- 4 Apprentice clients were excluded from the age breakout prior to 2024-25. Starting 2024-25 they are reported under a "known" age unless their date of birth was invalid or missing.
| Service type | Services delivered | Year-over-year change | Share of total | Year-over-year change (p.p.) |
|---|---|---|---|---|
| Employment Benefits | 183 | -17.2% | 42.5% | +1.3 |
| Support Measure | 248 | -21.5% | 57.5% | -1.3 |
| Total services | 431 | -19.7% | 100.0% | n/a |
- Notes:
- 1 This table reflects all new services started between April 1, 2024 and March 31, 2025.
- 2 This table excludes Indigenous pan-Canadian data.
| Service type | Services | Year-over-year change | Expenditures | Year-over-year change |
|---|---|---|---|---|
| Targeted Wage Subsidies | 4 | -85.7% | $467,804 | -63.3% |
| Self-Employment | 7 | -22.7% | $306,723 | -12.4% |
| Job Creation Partnerships | n/a | n/a | $145,000 | n/a |
| Skills Development-Regular | 79 | -12.2% | $773,529 | +72.7% |
| Skills Development-Apprentices | 93 | -1.1% | Included above | Included above |
| Targeted Earning Supplements | n/a | n/a | n/a | n/a |
| Totals Employment Benefits | 183 | -17.2% | $1,693,056 | -18.3% |
| Employment Services | 0 | -100.0% | $1,276,473 | +42.5% |
| Individual Counselling | 248 | -21.0% | Included above | Included above |
| Labour Market Partnerships | n/a | n/a | $98,375 | -54.0% |
| Research & Innovation | n/a | n/a | n/a | n/a |
| Total Support Measure | 248 | -21.5% | $1,374,848 | +23.9% |
| Total EBSMs | 431 | -19.7% | $3,067,904 | -3.6% |
- Notes:
- 1 This table reflects all new services started between April 1, 2024 and March 31, 2025.
- 2 This table excludes Indigenous pan-Canadian data.
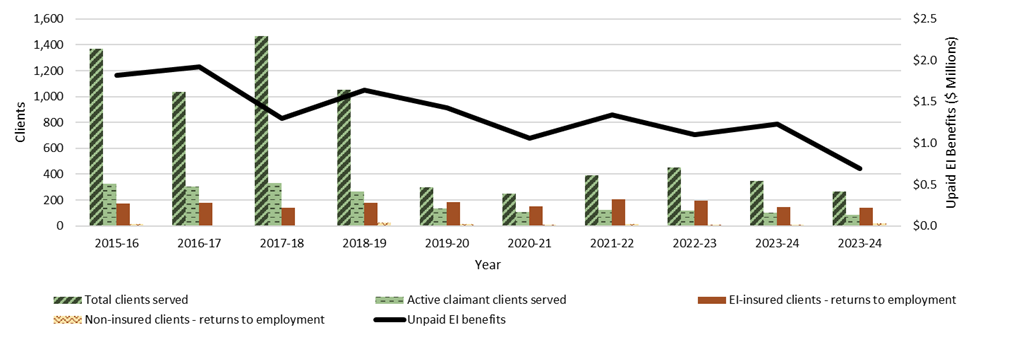
Text description
| Year | Unpaid EI benefits | EI-insured clients - returns to employment3 | Non-insured clients - returns to employment | Active claimantclients served | Total clients served4 |
|---|---|---|---|---|---|
| 2015-16 | $1,820,141 | 173 | 15 | 325 | 1,369 |
| 2016-17 | $1,924,873 | 177 | 6 | 306 | 1,035 |
| 2017-18 | $1,298,865 | 142 | 2 | 333 | 1,469 |
| 2018-19 | $1,640,575 | 181 | 24 | 266 | 1,055 |
| 2019-20 | $1,430,328 | 185 | 14 | 134 | 299 |
| 2020-21 | $1,063,755 | 152 | 11 | 110 | 248 |
| 2021-22 | $1,345,869 | 207 | 12 | 124 | 394 |
| 2022-23 | $1,101,443 | 197 | 8 | 121 | 450 |
| 2023-24 | $1,230,066 | 147 | 7 | 102 | 347 |
| 2024-25 | $695,384 | 140 | 19 | 87 | 266 |
- Notes:
- 1 This chart excludes Indigenous pan-Canadian data.
- 2 Volatility in the Unpaid EI Benefits from 2021‑22 to 2022‑23 correlates with the speed of recovery of the labour market that allowed many Canadians to return to work before exhausting their EI benefits.
- 3 The EI-insured return to employment returns includes active claimants, former claimants, and PPE clients
- 4 "Total Clients Served" refers to the count of EI-insured clients served (active claimant clients, former claimant clients, and PPE clients) and non-insured clients.
- 5 Historical data has been adjusted to enhance accuracy.
Labour market context
In 2024-25, the Northwest Territories labour market showed significant disparities between smaller communities and larger regional centres or the capital city. While Yellowknife and the capital region experienced low unemployment due to higher employment levels, smaller communities struggled with higher unemployment rates, driven by limited local employment opportunities. Employment decreased most significantly in industries such as information, culture & recreation, education, and construction,Footnote 93 highlighting the need for the continuation of workforce development and targeted recruitment strategies.
The unemployment rate for those aged 15 and over in the Northwest Territories was 5.8% in 2024, compared to 6.0% in 2023. By comparison, Canada's unemployment rate was 6.3% in 2024 and 5.4% in 2023.Footnote 94 In fiscal 2025 (April 1, 2024 to March 31, 2025) the territory had, on average, approximately 1,300 unemployed individuals Footnote 95,Footnote 96
The labour market needs in the Northwest Territories range from essential skills to advanced technical and trades skills development. Many job seekers face significant barriers to employment, such as the lack of high school diplomas or equivalency credentials. Projections show that over the next 20 years, a majority of jobs will require some kind of post-secondary education. To address these challenges, the Northwest Territories is leveraging LMDA funding to deliver targeted programs and services aimed at increasing labour force participation, particularly among individuals not currently in the workforce or those considering re-entry.
Canada-Northwest Territories Labour Market Development Agreement
In 2024-25, Northwest Territories received approximately $4.5 million though the LMDA, serving approximately 260 clients. Within 6 months of receiving training and employment supports, approximately 64.4% of active claimant clients secured employed, resulting in approximately $695k savings in unpaid EI benefits.
For example, the territory funded Employment Assistance Services, which provided career and employment assistance targeted to particular local needs and extending the delivery of services throughout their region. Eligible activities included education and training programs that led towards preparing individuals for the workforce and to find and maintain work. Approximately 10,675 clients benefited from this program in 2024-25. However, some regional offices were unable to obtain reliable data from their community partners
Designated and under-represented groups
The Northwest Territories delivered LMDA programming designed to encourage greater employer involvement in training, ensuring that skills were better aligned with job opportunities. These programs and services specifically target under-represented groups. For example, Strategic Workforce Initiatives funding supported the Conseil de development économique des Territoires du Nord-Ouest (CDÉTNO) to hire client navigators/pathfinders. The client navigators would work from Yellowknife but would travel to the South Slave and Inuvik regions to meet with clients (individuals and employers) to support newcomers.
Stakeholder consultations
In 2024-25, the Northwest Territories continued to engage stakeholders through its Regional Service Centres. Engagement sessions on LMDA-supported labour market programs and included stakeholders such as other government departments, local employers, community and non-governmental organizations, and Indigenous Governments and Organizations.
Consultations processes were tailored to address the unique circumstances of each region. Key themes that emerged from consultations include:
- focusing on regional projects and local training needs
- forecasting of labour training
- highlighting other funding programs available to individuals, employers, and communities
- addressing challenges faced by individuals in the community needing to travel far from home for training and skills development
- providing targeted supports, such as financial assistance
Returning to the workforce while helping those in need
Inuvik Works, a local initiative in Inuvik, a Beaufort-Delta town in the NWT, was designed to assist people who aren't in the local workforce to find their way back to employment, with assistance where needed. The program had been inactive for a number of years and, along with an associated thrift store, was relaunched. It 'meets a need that's been around the town for a long time' said a town councillor. 'It provides the opportunity for hope and an alternative source of employment for many different populations within [the] community, whether they're unemployed or lacking some of the requirements to be employed in other areas' said an area resident.
Program delivery and participant supports
This section provides an overview of the specific programs and financial supports available under the LMDA. It includes specific details on the programs and initiatives available, their duration associated funding, and additional supports provided to clients.
Program: Skills Development Program (SDP)
Expenditures: $911,000 (28.3%)
Description: Provides support for eligible recipients to participate in training opportunities to upgrade skills and knowledge and/or develop essential employability skills.
Eligible activities include education and training programs that lead to labour market attachment. This may include academic upgrading, life skills, employment readiness programs, pre-employment training courses, skill-specific training programs and post-secondary programs.
SDP interventions may be supported under the LMDA or WDA.
- Dehcho: technical training, Heavy Equipment Operator, pre-trades training, academic upgrading, Driver training, safety certification, final year of diploma and degree programs
- North Slave: technical training for apprentices, Driver training (Class 3), Occupational Health and Safety and Environmental training
- South Slave: apprenticeship technical training, business administration, Heavy Equipment Operator (HEO), chainsaw training, driver training, service industry training
- Beaufort-Delta: apprenticeship technical training, different levels of driver training, infrastructure, pre-apprenticeship training, continued education courses, and selected diploma and certificate studies schools
- Sahtu: apprentice technical training
Target client groups:
- Dehcho: apprentices, unemployed, persons with disabilities, pre-apprentices, SNAP apprentices, women
- North Slave: apprentices, employers, jobseekers, workers affected by mine closures
- South Slave: apprentices, EI Eligible, Active Claim, Unemployed, Persons with Disabilities
- Beaufort-Delta: Schools North Apprenticeship Program (SNAP) students, active apprentices, driver training, post-secondary students; youth and school graduates, Income Assistance Clients, person with disabilities
- Sahtu: Schools North Apprentice Program students and apprentices
Benefits and expected results: 143 individuals are expected to benefit from the program.
Program: Self-Employment Program (SEP)
Expenditures: $307,000 (9.5%)
Description: Provides support to eligible clients with the opportunity to start a small business.
This program provides supports for clients in assessing their business idea, their personal suitability, family issues, financial risks, and the resources available or required to be successful.
SEP interventions are administered by the Career Development Officers in the Regional ECE Service Centres.
SEP interventions may be supported under the LMDA or WDA.
- Dehcho: trades, arts and crafts, tourism, transportation, hospitality
- North Slave: journeypersons starting their own businesses related to their trades. Other businesses related to automotive services, transport, real estate, communications, and bookkeeping
- South Slave: food services, lawn care services, bookkeeping, hair cutting services, etc.
- Beaufort-Delta: childcare, small engine repair, hospitality, construction, arts and crafts, food businesses, journeypersons starting a new business, and retail businesses
- Sahtu: helping potential entrepreneurs realize their potential
Target client groups:
- Dehcho: unemployed, EI eligible, PPE, Active Claim, self-employed
- North Slave: unemployed, EI eligible, PPE, Active Claim, self-employed, journeypersons, retired clients
- South Slave: unemployed, EI eligible, PPE, Active Claim, self-employed, post-secondary graduates, journeypersons with or without Red Seal IPS Certification
- Beaufort-Delta: unemployed, EI Eligible, PPE, Active Claim, self-employed, post-secondary graduates
- Sahtu: unemployed, EI eligible, PPE, Active Claim, self-employed
Benefits and expected results: 21 individuals are expected to benefit from this program.
Program: Wage Subsidy Program (WSP)
Expenditures: $467,000 (14.5%)
Description: Provides support to an employer to hire and train NWT residents.
This program is intended to provide work experience and training that will better enable clients to obtain meaningful long-term employment.
WSP projects may be supported under the LMDA or WDA.
- Dehcho: small businesses, retail, community government trainees
- North Slave: small employers, cannabis production employers, travel agencies, entertainment sector, security, non-profits, beauty salons, communications, and coffee houses and Aircraft Maintenance Engineer Schools North Apprenticeship Program students
- South Slave: trades industry, small business start ups, day cares, Indigenous Governments, non-profit organizations
- Beaufort-Delta: community government, Indigenous organizations, small business, retail business, Industry, non-profits
- Sahtu: construction, transportation, administration, customer service
Target client groups:
- small employers, communications industry, tourism industry, construction, accounting
- existing & new entrants of labour force
- EI eligible, PPE, Active Claim, self-employed
- Indigenous governments, NGOs, non-profit organizations, community governments
Benefits and expected results: 29 employers are expected to benefit from the program.
Program: Employee Training Program
Expenditures: $15,400 (0.5%)
Description: Helps employers, who have proactively hired employees in anticipation of their workforce needs, to offset the cost of training for employees. The ETP can assist employers who require employee up-skilling due to economic, technological or organizational change, and may be used to support individuals who are under-employed or employed and in need of training to maintain their current job and/or advance, progress or move to a different and/or better job.
The ETP may also be used in conjunction with the Wage Subsidy Program (WSP) to offset the costs of training employees.
Requests for ETP are primarily supported under the WDA. If used in conjunction with the WSP, then support may also be provided under LMDA.
- Dehcho: construction, book-keeping/accounting, driver training, management training, office administration, business administration
- North Slave: cannabis industry, train the trainer education, computer training for seniors
- South Slave: band offices, First Nations, small employers, communication industry, tourism industry, construction, pre-trades, tourism, mining, bookkeeping/accounting
- Beaufort-Delta: community government, Indigenous organizations, small businesses, retail business, industry, non-profits
- Sahtu: K'asho Got'ine Charter Community - one; Deline Got'ine Government - one: Hamlet of Tulita - one
Target client groups:
- small employers, communications industry, tourism industry, construction, accounting
- existing & new entrants of labour force
- EI eligible, PPE, Active Claim, self-employed
- community governments, Indigenous organizations, non-profit organizations (South Slave)
Benefits and expected results: 2 employers are expected to benefit from the program.
Program: Employee Assistance Services
Expenditures: $1,277,000 (39.6%)
Description: Enables Regional ECE Service Centres to provide career and employment assistance targeted to particular local needs and to extend the delivery of services throughout their region. EAS is used to fill gaps in service and is intended to help individuals prepare for the workforce, find work and/or to maintain work through third party organizations.
EAS may be supported under the LMDA or WDA.
- Dehcho: career development representatives in employment offices or band offices to assist with resumes, job applications, complete funding applications, etc.
- North Slave: non-profit organizations, business expert services for self-employment clients and Indigenous organizations
- South Slave: Community Employment Coordinators, persons with disabilities, French Employment services and non-profit organizations
- Beaufort-Delta: Indigenous governments, municipal governments, non-profit organizations
- Sahtu: providing career development counselling services to community residents
Target client groups:
- unemployed
- existing and new entrants of labour force
- EI eligible, PPE, Active Claim, self-employed
- individuals needing assistance with résumés, job hunting, anything employment and career-related
Benefits and expected results: Approximately 10,300 individuals are expected to benefit from the program.
Program: Strategic Workforce Initiatives (SWI)
Expenditures: $98,300 (3.1%)
Description: Supports community partners in undertaking labour market activities that promote labour force development, workforce adjustments and effective human resources planning. Activities must address a community labour market need, and may include identifying economic trends, creating strategies, and initiating projects to develop a responsive local labour force. SWI projects may be supported under the LMDA or WDA.
Providing financial support to assist DCAs with the development of Community Labour Market Development Plans, Indigenous Governments and Organizations with labour market research, and supporting other regional workforce initiatives, including the North Slave Regional Training Partnership and Hub, and supports to the NWT Mine Training Society.
Target client groups:
- Dehcho: Designated Community Authorities
- North Slave: North Slave communities to develop 5 year strategic plans for the Small Communities Employment Supports program
- South Slave: Designated Community Authorities
- Beaufort-Delta: Regional Training Partnerships, Indigenous governments, and Designated Community Authorities
- Sahtu: no anticipated SWI projects
- Headquarters: Immigration Settlement Service Providers in support of federal Francophone Immigration Settlement Program (FISP) project. Northwest Territories Nominee Program (NTNP) engagements to inform renewed program for 2026 and beyond
Benefits and expected results: 9 Designated Community Authorities will receive financial assistance to develop community labour market development plans and 1 committee will receive funding to engage in a strategic planning initiative.
Program: Job Creation Partnerships
Expenditures: $145,000 (4.5%)
Description: An initiative that provides work experience opportunities to improve the subsequent employment prospects of the clients. The program provides support for third party organizations to deliver community and regional activities that either include a work experience component or have a guarantee of employment at the end of the project. Work experience projects may also include a skills development component.
The program is intended to assist unemployed individuals who need work experience (and training if applicable) to be better able obtain meaningful long-term employment.
JCP projects may be supported under the LMDA or WDA.
Areas of focus:
- Dehcho: construction/trades, infrastructure projects, community fire protection
- North Slave: no anticipated JCP projects
- South Slave: non-profit organizations that have a focus on skills development and certifications for employability
- Beaufort-Delta: Gwich'in and Inuvialuit Governments at a regional level or community level, Industry, Non-Government Organizations/Non-Profit Organizations will provide additional financial support to a project (Inuvik Works & Next to New Project)
- Sahtu: no anticipated JCP projects
Target client groups:
- existing and new entrants to the labour force
- EI eligible, PPE, Active Claim
Benefits and expected results:(Number of individuals/clients supported and number of organizations receiving a contribution agreements)
- Dehcho: 20 individuals
- North Slave: unable to forecast how many individuals will be assisted
- South Slave: 6 potential clients. Anticipating requests for training and support to existing and new entrants to Great Slave commercial fishery, and Heavy Equipment Operators.
- Beaufort-Delta: 3 possible organizations for this fiscal year.
- Sahtu: 2 organizations receiving contribution agreements.
3.2.13 Nunavut
In this section
- Employment Benefits and Support Measures key facts
- Labour market context
- Canada-Newfoundland and Labrador Labour Market Development Agreement
- Designated and under-represented groups
- Stakeholder consultations
- Program delivery and participant supports
Employment Benefits and Support Measures key facts
| Indicator | Active claimant clients | Former claimant clients | PPE clients | Non-insured clients | Client type unspecified2 | Total |
|---|---|---|---|---|---|---|
| Clients served | 12 | 1 | 0 | 0 | 1,167 | 1,180 |
| Share of total | 1.0% | 0.1% | 0.0% | 0.0% | 98.9% | 100.0% |
- Notes:
- 1 This table reflects all clients served between April 1, 2024 and March 31, 2025.
- 2 Clients for whom necessary information (Social Insurance Number) was not provided are included in the 'Client type unspecified' category.
- 3 This table excludes Indigenous pan-Canadian data.

Text description
| Year | Active claimant clients | Former claimant clients | PPE clients | Non-insured clients | Client type unspecified2 |
|---|---|---|---|---|---|
| 2015-16 | 126 | 154 | n/a | 706 | n/a |
| 2016-17 | 116 | 95 | n/a | 628 | n/a |
| 2017-18 | 153 | 168 | n/a | 773 | n/a |
| 2018-19 | 142 | 177 | 234 | 694 | n/a |
| 2019-20 | 74 | 113 | 135 | 305 | n/a |
| 2020-21 | 11 | 4 | 202 | 511 | n/a |
| 2021-22 | 29 | 37 | 52 | 40 | n/a |
| 2022-23 | 37 | 0 | 0 | 0 | 1,155 |
| 2023-24 | 12 | 1 | 0 | 0 | 1,167 |
| 2024-25 | 12 | 1 | 0 | 0 | 1,167 |
- Notes:
- 1 This chart reflects all clients served between April 1, 2024 and March 31, 2025.
- 2 Clients for whom necessary information (Social Insurance Number) was not provided are included in the 'Client type unspecified' category.
- 3 This chart excludes Indigenous pan-Canadian data.
| Year | Active claimant clients | Former claimant clients | PPE clients | Non-insured clients | Client type unspecified2 |
|---|---|---|---|---|---|
| 2015-16 | 12.8% | 15.6% | n/a | 71.6% | n/a |
| 2016-17 | 13.8% | 11.3% | n/a | 74.9% | n/a |
| 2017-18 | 14.0% | 15.4% | n/a | 70.7% | n/a |
| 2018-19 | 11.4% | 14.2% | 18.8% | 55.7% | n/a |
| 2019-20 | 11.8% | 18.0% | 21.5% | 48.6% | n/a |
| 2020-21 | 1.5% | 0.5% | 27.7% | 70.2% | n/a |
| 2021-22 | 18.4% | 23.4% | 32.9% | 25.3% | n/a |
| 2022-23 | 3.1% | 0.0% | 0.0% | 0.0% | 96.9% |
| 2023-24 | 1.0% | 0.1% | 0.0% | 0.0% | 98.9% |
| 2024-25 | 1.0% | 0.1% | 0.0% | 0.0% | 98.9% |
- Notes:
- 1 This table reflects all clients served between April 1, 2024 and March 31, 2025.
- 2 Clients for whom necessary information (Social Insurance Number) was not provided are included in the 'Client type unspecified' category.
- 3 This table excludes Indigenous pan-Canadian data.
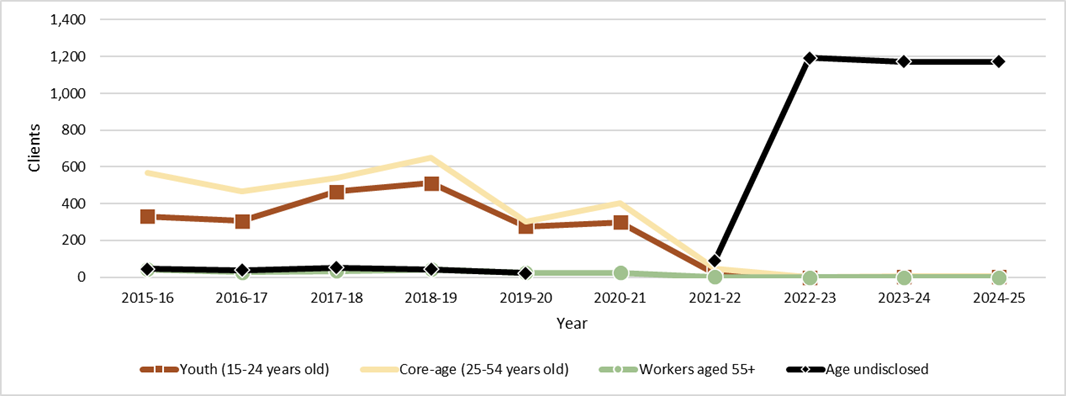
Text description
| Year | Youth (15-24 years old) | Core-age (25-54 years old) | Workers aged 55+ | Age undisclosed2 |
|---|---|---|---|---|
| 2015-16 | 332 | 567 | 42 | 45 |
| 2016-17 | 307 | 466 | 28 | 38 |
| 2017-18 | 467 | 540 | 34 | 53 |
| 2018-19 | 511 | 652 | 42 | 42 |
| 2019-20 | 276 | 304 | 24 | 23 |
| 2020-21 | 300 | 404 | 24 | n/a |
| 2021-22 | 20 | 47 | 1 | 90 |
| 2022-23 | 0 | 0 | 0 | 1,192 |
| 2023-24 | 1 | 6 | 0 | 1,173 |
| 2024-25 | 1 | 6 | 0 | 1,173 |
- Notes:
- 1 This chart reflects all clients served between April 1, 2024 and March 31, 2025.
- 2 Clients for whom valid dates of birth were not provided are included in the 'Age undisclosed' category.
- 3 This chart excludes Indigenous pan-Canadian data.
- 4 Apprentice clients were excluded from the age breakout prior to 2024-25. Starting 2024-25 they are reported under a "known" age unless their date of birth was invalid or missing.
| Year | Youth (15-24 years old) | Core-age (25-54 years old) | Workers aged 55+ | Age undisclosed2 |
|---|---|---|---|---|
| 2015-16 | 33.7% | 57.5% | 4.3% | 4.6% |
| 2016-17 | 36.6% | 55.5% | 3.3% | 4.5% |
| 2017-18 | 42.7% | 49.4% | 3.1% | 4.8% |
| 2018-19 | 41.0% | 52.3% | 3.4% | 3.4% |
| 2019-20 | 44.0% | 48.5% | 3.8% | 3.7% |
| 2020-21 | 41.2% | 55.5% | 3.3% | n/a |
| 2021-22 | 12.7% | 29.7% | 0.6% | 57.0% |
| 2022-23 | 0.0% | 0.0% | 0.0% | 100.0% |
| 2023-24 | 0.1% | 0.5% | 0.0% | 99.4% |
| 2024-25 | 0.1% | 0.5% | 0.0% | 99.4% |
- Notes:
- 1 This table reflects all clients served between April 1, 2024 and March 31, 2025.
- 2 Clients for whom valid dates of birth were not provided are included in the 'Age undisclosed' category.
- 3 This table excludes Indigenous pan-Canadian data.
- 4 Apprentice clients were excluded from the age breakout prior to 2024-25. Starting 2024-25 they are reported under a "known" age unless their date of birth was invalid or missing.
| Service type | Services delivered | Year-over-year change | Share of total | Year-over-year change (p.p.) |
|---|---|---|---|---|
| Employment Benefits | 1,478 | 0.0% | 54.9% | 0.0 |
| Support Measure | 1,214 | 0.0% | 45.1% | 0.0 |
| Total services | 2,692 | 0.0% | 100.0% | n/a |
- Notes:
- 1 This table reflects all new services started between April 1, 2024 and March 31, 2025.
- 2 This table excludes Indigenous pan-Canadian data.
- 3 NU estimates from 2023-24 were re-used for 2024-25.
| Service type | Services | Year-over-year change | Expenditures | Year-over-year change |
|---|---|---|---|---|
| Targeted Wage Subsidies | 28 | 0.0% | $272,333 | n/a |
| Self-Employment | 0 | n/a | $0 | n/a |
| Job Creation Partnerships | 0 | n/a | $0 | n/a |
| Skills Development-Regular | 1,422 | 0.0% | $1,322,586 | n/a |
| Skills Development-Apprentices | 28 | 0.0% | Included above | Included above |
| Targeted Earning Supplements | 0 | n/a | n/a | n/a |
| Totals Employment Benefits | 1,478 | 0.0% | $1,594,918 | n/a |
| Employment Services | 1,214 | 0.0% | $128,493 | n/a |
| Individual Counselling | 0 | 0.0% | Included above | Included above |
| Labour Market Partnerships | n/a | n/a | $1,279,732 | n/a |
| Research & Innovation | n/a | n/a | n/a | n/a |
| Total Support Measure | 1,214 | 0.0% | $1,408,226 | n/a |
| Total EBSMs | 2,692 | 0.0% | $3,003,144 | n/a |
- Notes:
- 1 This table reflects all new services started between April 1, 2024 and March 31, 2025.
- 2 This table excludes Indigenous pan-Canadian data.
- 3 NU estimates from 2023-24 were re-used for 2024-25.
- 4 The financial totals in the MAR are based on finalized reports provided by PTs. At the time of publication, final audited financial statements for YT and NU had not been received. As such, expenditures for these jurisdictions are based on draft reports or previous-year financial statements.
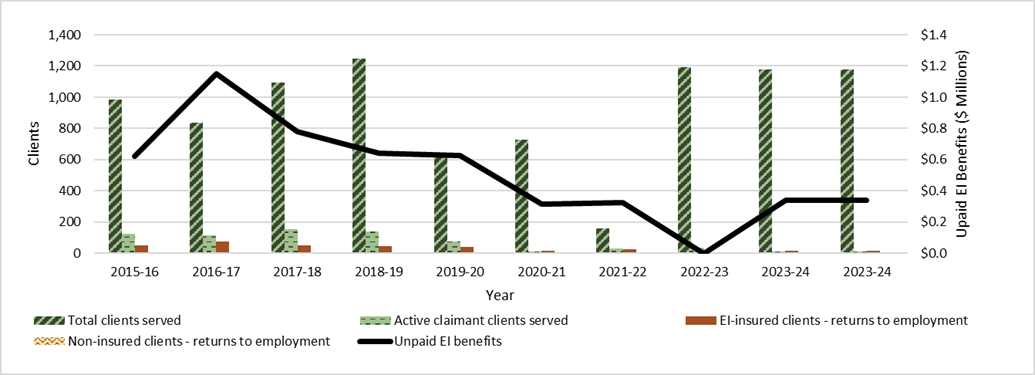
Text description
| Year | Unpaid EI benefits | EI-insured clients - returns to employment3 | Non-insured clients - returns to employment | Active claimantclients served | Total clients served4 |
|---|---|---|---|---|---|
| 2015-16 | $624,023 | 53 | 0 | 126 | 986 |
| 2016-17 | $1,149,451 | 75 | 2 | 116 | 839 |
| 2017-18 | $780,375 | 52 | 2 | 153 | 1,094 |
| 2018-19 | $640,855 | 48 | 1 | 142 | 1,247 |
| 2019-20 | $626,866 | 42 | 0 | 74 | 627 |
| 2020-21 | $314,051 | 17 | 0 | 11 | 728 |
| 2021-22 | $323,897 | 25 | 4 | 29 | 158 |
| 2022-23 | $0 | 7 | 0 | 37 | 1,192 |
| 2023-24 | $337,868 | 17 | 0 | 12 | 1,180 |
| 2024-25 | $337,868 | 17 | 0 | 12 | 1,180 |
- Notes:
- 1 This chart excludes Indigenous pan-Canadian data.
- 2 Volatility in the Unpaid EI Benefits from 2021‑22 to 2022‑23 correlates with the speed of recovery of the labour market that allowed many Canadians to return to work before exhausting their EI benefits.
- 3 The EI-insured return to employment returns includes active claimants, former claimants, and PPE clients
- 4 "Total Clients Served" refers to the count of EI-insured clients served (active claimant clients, former claimant clients, and PPE clients) and non-insured clients.
- 5 Historical data has been adjusted to enhance accuracy.
Labour market context
In 2024-25, Nunavut's unemployment rate remained one of the highest in Canada, recorded at 8.5%,Footnote 97 reflecting a 4.4% decrease from the previous year.Footnote 98 Although significantly higher than the national average of 6.3%,Footnote 99 this decrease could indicate the continuation of a more stabilized labour market.
Through the Canada-Nunavut LMDA, the territory has enhanced its training and employment programs for job seekers and employers, focusing on increasing labour force participation and addressing skills gaps. These initiatives aim to better align the local workforce with industry needs and contribute to better employment outcomes in the coming years.
Nunavut's labour market outlook is expected to improve further, supported by increased funding from all levels of government for infrastructure projects and other economic development initiatives, which will help create more jobs for residents.Footnote 100
Canada-Nunavut Labour Market Development Agreement
In 2024-25, Nunavut received approximately $3.8 million though the LMDA, serving approximately 1,200 clients,Footnote 101 resulting in approximately $338k in savings from unpaid EI benefits.
In 2024-25, LMDA funding supported the delivery of programs and services, including:
- training
- upskilling
- employment supports
- career counselling
- job search assistance
For example, the Training Assistance Program (TAP) provided work experience, training, and skills development to job seekers. TAP offered wage subsidies to employers, covering up to 16.0% of the hourly wage (maximum $15/hour) for eligible clients in the public, private, and not-for-profit sectors, helping them secure potential permanent employment. For persons with disabilities, TAP subsidies covered 90.0% of the wage, up to 40 hours per week. In total, 16 clients benefited from this program, receiving job training, mentorship, and hands-on experience to enhance their employability.
Designated and under-represented groups
Nunavut continued to deliver LMDA-programming aimed at supporting under-represented groups in 2024-25. The Targeted Labour Market Programs provided funding to employers, institutions, training providers, community organizations and Inuit organizations to offer training for in-demand occupations and skills. The program served 1,180 clients, with priority given to Nunavut based organizations that target under-represented groups such as:
- persons with disabilities
- at-risk youth
- persons who face multiple barriers to employment
- persons who are unemployed, underemployed or persistently unemployed
Additionally, in 2024-25, Nunavut supported youth aged 18-30 through Hamlets Employing Youth (HEY) program, which offered valuable work experience, job training, and mentoring over a 6-month period. The program targeted youth who were out of school, not planning to return, and either unemployed or underemployed. Youth clients in the HEY program earned a livable wage while receiving job training and mentorship. In 2024-25, 6 clients benefited from this program.
The program subsidized 75.0% of wages for up to 40 hours per week, with increased subsidies of up to 90.0% for persons with disabilities. It also aimed to secure full-time employment for youth at the end of the 6-month period, ensuring meaningful job opportunities for clients.
Stakeholder consultations
In 2024-25, Nunavut conducted a series of consultations with a wide range of stakeholders, including industry representatives, employers, journeypersons, apprentices, Inuit organizations, economic development officers, hamlets, Nunavut Arctic College officials, and Nunavut Housing Corporation officials.
During these community consultations, discussions focused on several key topics, such as:
- programming and community needs assessments
- Nunavut Housing 3000 initiatives
- trades and occupations certification options
- apprenticeship by attestation (Compulsory certification and governance of the apprenticeship system)
- technical training and tutoring supports
- the Trades Entrance Exam
- pay rates for apprentices
- on-the-job training and support
- employer engagement and inclusive hiring practices
- high school involvement in trade programs
Career Development Programming 2024-25
Building pathways, empowering futures
In 2024-25, career development programming continued to make meaningful impact across Nunavut, helping residents strengthen their skills, explore opportunities, and build confidence. Through community partnerships, dedicated staff and targeted initiatives, the programs supported over two thousand Nunavummiut in pursuing training and sustainable employment.
Over the year, Career Development Officers provided personal guidance to more than 2,800 clients, marking a 5.0% increase in participation. This growth reflects both the expanding awareness of services within communities. Officers delivered career counselling, resume and interview workshops, and labour market information sessions, helping clients align their skills with emerging employment needs across the territory.
A major accomplishment this year was the expansion of youth engagement and mentorship activities, which connected high school and post-secondary students with government departments and local employers. These initiative support Inuit employment priorities and encourage young people to consider long-term careers within Government and broader public sectors.
Collaboration remained a cornerstone of success. By working with industry, Nunavut Arctic College, Inuit organizations and community organizations, career development teams coordinated training opportunities tailored to local labour demands - from trades and administration to government and management.
As a result, many clients transitioned from training to full-time employment, contributing to community growth and supporting Article 23 objectives of increasing Inuit representation in the workforce. The year demonstrated the ongoing strength and adaptability of career development programming - where each conversation, workshop and partnership moved Nunavut closer to a skilled, confident, and resilient labour force.
Program delivery and participant supports
This section provides an overview of the specific programs and financial supports available under the LMDA. It includes specific details on the programs and initiatives available, their duration associated funding, and additional supports provided to clients. This aims to demonstrate how these programs and initiatives align with federal and provincial priorities, and support labour market integration.
Program: Adult Learning and Training Supports (ALTS)
Expenditures: $1,982,190 (39.9%)
Description: Provides students with supports to attend training or upgrading that is under 1 year in duration. Clients include apprentices attending technical training, clients upgrading their skills, and clients in shorter term programs providing program and occupational skills required to participate in the labour market. This includes supporting programming for persons with disabilities by providing supports through the Piqataugitsi program.
Nunavut's ALTS program provides $500/week to clients as a training allowance. The new policy shows an increase in current ALTS allowances and introducing new targeted supports that will make the program more relevant to Nunavut's current socio-economic conditions.
ALTS clients are also eligible to receive the cost of tuition, books, special equipment, tutoring, travel, accommodations, and childcare.
Target client groups:
- clients aged 18 and older
- clients who are unemployed or underemployed
- residents of Nunavut
Benefits and expected results:
The ALTS program reduces the financial barriers faced by Nunavut clients seeking training opportunities. Training funded under this program contributes to positive employment outcomes.
254 Clients received ALTS funding and attended programming. Programming includes Office Administration, College Foundations, Skilled Trades Worker, and Trades Pre-Employment. In accordance with Article 32, the Department is undergoing the Policy review process for updates to the ALTS Policy as well as the ALTS travel Policy. This includes an increase in allowances and benefits to better support clients.
Program: Grant for Nunavut Employers (GNE)
Expenditures: $226,667 (4.6%)
Description: Formerly Nunavut Employers Grant, the Grant for Nunavut Employers program provides eligible employers with a maximum grant of up to $10,000,00 per employee to support the employee in professional development opportunities. The opportunities should lead to a promotion, higher level position, or an increase in salary within the organization.
Target client groups: Eligible trainees are individuals employed with an eligible employer and who require additional training to improve their job advancement opportunities. Trainees will continue to be employed with the GNE funded employer at the conclusion of training. As a result of the training, trainees are expected to be hired into a new position, receive an increase in salary, and/or receive a promotion.
Eligible employers must be in the private sector, or municipal sector, be in Nunavut, have a position available for the designated trainee to advance into after training, and must be able to contribute 1/3rd of the total eligible training costs.
Benefits and expected results: Increasing professional development of the trainee. Employers can upskill their employees to advance their positions in their organization consistent with organizational needs.
In 2024-25, 6 applications for training 34 Nunavummiut was approved. Of those 34 trainees, 32 are now newly employed. Training took place in 5 different communities across the territory.
Program: Training Assistance Program (TAP)
Expenditures: $284,330 (5.7%)
Description: Formerly Training on the Job (TOJ), this program provides wage subsidies to employers who wish to invest in an individual by providing on-the-job training, thereby strengthening the participant's employability skills. Upon completion of the subsidy, employers are expected to offer the participant a job, which has a reasonable chance to become a permanent position. TAP is intended to subsidize training during full-time, part time or seasonal employment. TAP offers subsidies of up to $15.00/hour (or to a maximum of 50 per cent of the hourly wage, whichever is less) to cover the wage costs of eligible clients.
Target client groups:
- trainees must be 16 years of age or older
- trainees must be a resident of Nunavut
- trainees should be unemployed and require skill upgrading
- trainees must be training in a full-time, part-time (minimum 20 hours per week) or seasonal position
Benefits and expected results:
Employers hire Nunavummiut who require additional experience, skill building and workplace training. This makes them better qualified for existing positions and allows them to pursue other positions. Wage subsidies for employing apprentices (Apprenticeship Training on the Job - ATOJ) are also under this program.
The ATOJ program supported the training of 11 Nunavut Apprentices. The TAP program supported 5 Nunavummiut.
Program: Employment Assistance Services (EAS)
Expenditures: $433,675 (8.7%)
Description: The EAS Program provides individuals with a variety of employment services with the overall goal of increasing their labour market participation. Career Development delivers EAS through both Career Development Officers (CDOs), as well as through community organizations who deliver EAS on behalf of Family Services.
Employment Assistance Services include: job interview preparation, resume writing assistance, labour market information, computer and internet access and training program referrals.
Target client groups:
- residents of Nunavut
- underemployed
- unemployed
Benefits and expected results:
The Employment Assistance Services Program provides individuals with a variety of employment services with the overall goal of increasing their labour market participation. Typically, individuals accessing this program face barriers to finding and maintaining employment. The program supports unemployment and underemployed Nunavummiut with employment counselling, job preparation, job search, employment placement, and related services. The Department is pursuing more partnerships to expand our programming and services and to rely on the expertise and contacts of these partner organizations.
There will be an increase in labour market participation following an EAS intervention.
1,088 clients were supported through Employment Assistance Servies in 2024-25.
Program: Targeted Labour Market Programs (TLMP)
Expenditures: $1,165,165 (23.4%)
Description: Provides employers, institutions, training providers, community organizations, and Inuit organizations with funding to provide education or training for occupations or skills that are in demand in the territory. Applicants must clearly demonstrate that there is a labour market demand for the training or programming they are undertaking and must be able to report on employment outcomes.
Target client groups: Priority will be given to Nunavut based organizations that target marginalized groups, such as persons with disabilities, youth at risk (ages 15-30) and not attending school, persons who face multiple barriers to employment, and persons who are unemployed, underemployed or persistently unemployed.
Nunavut faces unique challenges in terms of geographical isolation, limited infrastructure, high cost of training, and high cost of living.
Benefits and expected results: TLMP provides training programs to enhance their employability skills.
In 2024-25, Targeted Labour Market Programming was delivered to 2,131 participants. 18 programs were approved under TLMP. Some key programs include:
The Kisarvik Program through Nunavut Fisheries and Marine Training Consortium is a training program that aims to train youth to participate in the marine industry through attaining the essential technical knowledge specific to this sector and by teaching life skills that are required for employment in the industry. This training will not only increase employability skills, but it will also increase self-confidence and will give them the tools to pursue employment in the fishing and marine industry.
Skills Canada Nunavut is a youth focused program to promote and increase exposure of the Skilled Trades and Technology sector through Programs to students across Nunavut as first choice career options. Skills Canada Nunavut has achieved remarkable success, equipping our youth with valuable skills, and fostering innovation.
Nunavummi Disabilities Makinnasuaqtiit Society:NDMS offered a full-time pre-employment program in Iqaluit to help participants develop employability skills through 1-on-1 sessions and classroom-based coursework. Participants were connected with co-op opportunities where applicable.
NDMS also provided drop-in support for those not enrolled in the program. To increase outreach, NDMS hosted 4 information booths to attract new participants and held 3 employer engagement events across the territory, focusing on inclusive hiring practices, duty to accommodate, and the business case for hiring people with disabilities.
The goal is to equip Nunavummiut with the transferable skills and credentials that are nationally recognized and in demand here in the territory.
Program: Piqataugitsi
Expenditures: $589,577 (11.9%)
Description: This program provides various supports to persons with disabilities and those who face barriers to employment by accommodating them within the workplace. Employment for Nunavummiut with disabilities is a Government of Nunavut priority. The program assists individuals with disabilities to obtain and maintain employment by offering funding supports related to their disability. The program also assists with job coaching for the individual and training employers on how to be more inclusive.
Target client groups:
- clients must be 16 years of age or older
- clients must self-identify as having a disability
- clients must be unemployed or employed with non-governmental organizations, including non-profit organizations, municipal governments, private sector employers, Inuit organizations, or industry associations
Benefits and expected results:
- promoted equity, access, and inclusion in the workplace
- provided greater supports to persons with disabilities to increase their labour market participation
Through employer engagements, the Department learned that employers needed more information on hiring persons with disabilities. An inclusive employer handbook was created to provide this framework for helping organizations embrace equity, access, inclusion and celebrate diversity in the Territory.
Amendments were made to some of the existing labour market programs to include disability support components to better support clients with disabilities.
Adult Learning and Training Supports (ALTS) will provide Persons with Disabilities the ability to receive additional training supports while they attend training opportunities.
Wage-Subsidy programs (SENS, HEY, TAP) include an additional wage subsidy if employers hire and train persons with disabilities under these programs.
In 2024-25, 178 clients with disabilities were supported.
Program: Hamlets Employing Youth (HEY)
Expenditures: $224,000 (4.5%)
Description: The Hamlets Employing Youth program provides youth with an opportunity to gain valuable work experience with community Hamlets in Nunavut over a 6-month period. The expectation is that Hamlets will guarantee full-time employment for youth at the end of the 6-month period. HEY subsidizes 75.0% of the wages up to 40 hours per week. For persons with disabilities, HEY rates are 90.0% of the wages up to 40 hours per week.
Target client groups:
- clients are out of school youth ages 18-30
- clients not returning to school, unemployed or underemployed
- clients must be residents of Nunavut
Benefits and expected results:
HEY provides on the job training and mentorship to youth over a 6-month period to enhance employability skills. Youth earn a livable wage while training on the job.
The Hamlets Employing Youth wage subsidy offered 6 youth employment in 2024-25.
Program: Summer Employment for Nunavut Students (SENS)
Expenditures: $64,897 (1.3%)
Description: SENS provides wage subsidy funding to eligible private sector and non-governmental sector employers, as well as municipal level government (Hamlets) to hire and train summer students (16-30) who will be returning to school. SENS provides 50.0% of the student wage to a maximum if 40 hours per week. For persons with disabilities, SENS rates are 65.0% of the student wage to a maximum of 40 hours per week.
Target client groups: Eligible students must be 16 years of age or older, returning to school in the fall and normally a resident in Nunavut. Eligible employers include non-profit organizations, municipal governments, private sector employers, Inuit organizations and industry associations. Clients must not be employed with the Government of Nunavut.
Benefits and expected results: Nunavut students receive valuable work experience as well as earn money to support them over their next school year. Employers receive a wage subsidy to hire and train students in their organization.
Summer Employment for Nunavut Students wage subsidies lead to the support of 48 students throughout the territory who were employed prior to returning to school in the fall of 2024-25.
3.3 Evaluation of Employment Benefits and Support Measures
The Evaluation Directorate of ESDC completed the third LMDA evaluation cycle (Cycle III) of the LMDAs between 2018 and 2023. Studies conducted as part of the second and third evaluation cycles examined all programs and services funded under the LMDAs.
The Horizontal Evaluation of the LMDAs was approved for publication by the Federal-Provincial-Territorial Evaluation Steering Committee and the Deputy Minister in 2022.Footnote 102 In addition, 12 provincial and territorial-level LMDA evaluation reports were approved through bilateral joint evaluation committees, and received Deputy Minister approval for publication in 2023.Footnote 103 Both the national and provincial/territorial-level evaluation reports are available at Evaluation Reports.
Summary of findings
Overall, incremental impacts demonstrate that participating in most EBSMs improves labour market attachment. It also reduces reliance on both federal and provincial/territorial government income supports compared to similar individuals who did not participate. These findings are consistent with results from earlier participant cohorts in previous evaluation cycles. A subgroup analysis reveals that, with some exceptions, Skills Development and Targeted Wage Subsidies benefit most clients' subgroups. Employment Assistance services alone were found to improve labour market attachment for female and Indigenous clients, and recent immigrants. These services also helped decrease their use of EI. In addition, for most interventions, the benefits accrued by clients and governments from EBSMs exceeded the initial investment costs over time.
Fourth evaluation cycle of the LMDAs
The fourth evaluation cycle of the LMDAs was launched in fall 2025. It will build on findings from previous evaluation cycles, reflect federal and provincial/territorial priorities, and rely on in-depth data assessment. Like previous LMDA-evaluation cycles, the fourth cycle is being designed and implemented under the guidance of a federal-provincial/territorial LMDA Evaluation Steering Committee. This steering committee is composed of ESDC nominees and representatives of each province and territory.
Supplementary study: The Evolution and Impacts of EI Part II Spending (1996-25)
For this year a supplementary report was produced to examine how Employment Insurance (EI) Part II's Labour Market Development Agreements (LMDAs) have evolved since their introduction in 1996. The examination focuses specifically on how changes made to EI eligibility criteria, client uptake, service delivery, funding and expenditures have helped programming to evolve over time.
For more information, please see Annex 6.
3.4 Pan-Canadian Activities and the National Employment Service
In this section
- 3.4.1 Indigenous programming
- 3.4.2 Investments in workplace skills
- 3.4.3 Labour market information
- 3.4.4 The National Essential Skills Initiative
- 3.4.5 Fostering sustainable jobs
- 3.4.6 Work Integration Social Enterprises research
While LMDAs receive the majority of EI Part II funding and are responsible for the delivery of the majority EI Part II programming, EI Part II also makes a critical contribution in the form of pan-Canadian programs and services. Through pan-Canadian activities under EI Part II, the Government of Canada plays a leadership role in addressing challenges that extend beyond local and regional labour markets. These activities are guided by 4 primary objectives:
- promote an efficient and integrated national labour market
- preserve and enhance Canadian economic unity
- help address common labour market challenges and priorities of national and/or international scope that surpass provincial and territorial borders
- promote equality of opportunity for all Canadians, with a focus on helping designated and/or underrepresented groups reach their full potential in the Canadian labour market
In 2024-25, over $181 million in EI part II funding, including just over $150 million in program funding (Chart 3.4.1), was invested in pan-Canadian activities to support these objectives through the following funding streams:
- Improving Access to Skills Training and Employment Supports in a Changing Labour Market
- Indigenous Skills and Employment Training Program
- Skilled Trades and Apprenticeship and Red Seal Program
- Giving Canadian Workers and Employers the information they need to succeed
- Sectoral Workforce Solutions Program
- Education and Labour Market Longitudinal Linkage PlatformFootnote 104
- Labour Market Information
- Exploring New Opportunities to Improve Labour Market Participation and Outcomes
- National Essential Skills Initiative
- Work Integration Social Enterprises research

Text description
| Program | Expenditure |
|---|---|
| The National Essential Skills Initiative | $6,184,079 |
| Sectoral Workforce Solutions program | $9,389,848 |
| Work Integration Social Entreprises Research | $1,301,107 |
| Indigenous Skills and Employment Training | $134,065,697 |
| Total | $150,941,729 |
3.4.1 Indigenous programmingFootnote 105
Programming delivered by the Indigenous Skills and Employment Training (ISET) program with EI Part II funding aims to enhance the skills of Indigenous people and support their participation in the Canadian labour market. The ISET program ensures that First Nations, Inuit, Métis, and Urban/Non-affiliated Indigenous people have access to skills development training and employment supports to help them achieve their long-term career goals and secure employment.
In 2024-25, the ISET program received approximately $125 million from EI Part II to support training and related services for Indigenous clients. This funding supports a network of over 115 Indigenous contribution recipients operating through more than 650 service points across Canada. ISET Program results for 2024-25 were funded through EI Part II and the Consolidated Revenue Fund (CRF). Additionally, $23,744,883 in ISET program funds were transferred to Crown-Indigenous Relations and Northern Affairs Canada (CIRNAC) for self-governing Indigenous governments, delivered through their Fiscal Financing Agreements or related self-governing grants.
The ISET program aims to reduce the skills and employment gaps between Indigenous and non-Indigenous people. Co-developed with Indigenous partners, the program includes 4 distinct labour market strategies, each with its own funding envelope for: First Nations, Inuit, Métis, and Urban and Non-affiliated Indigenous peoples.
Offering new investments and long-term, flexible agreements to Indigenous service delivery organizations supports Canada's efforts to advance reconciliation and promote self-determination. Systemic inequities between Indigenous and non-Indigenous people in Canada are addressed by creating more job training opportunities for Indigenous people. This approach aligns with the United Nations Declaration on the Rights of Indigenous Peoples Act Action Plan, to which Canada is committed in full.
The ISET program offers a broad range of labour market activities tailored to each group's unique needs. Indigenous service delivery organizations design and deliver locally relevant programs, including:
- employment-related and career development assistance
- financial assistance to support individuals in obtaining skills for employment
- tuition support
- business coaching and mentorship
- disability-related support
- ancillary supports such as living expenses
Indigenous service delivery organizations receive funding from both the CRF and the EI Part II pan-Canadian funding envelope to support their clients. EI Part II funding enables the Indigenous service delivery organizations to support clients who meet the EI Part II employment support measures eligibility criteria. In 2024-25, the ISET program served over 54,000 Indigenous clients, including both new and ongoing clients (see Chart 3.4.1.1). Of these, more than 48,500 were new clients, with nearly 21,000 funded through EI Part II. Out of the total 54,000 Indigenous clients, over 18,000 secured employment within 6 months of completing their participation in training and employment programs, including over 10,000 EI-funded clients. Additionally, over 7,200 clients returned to school for further training.
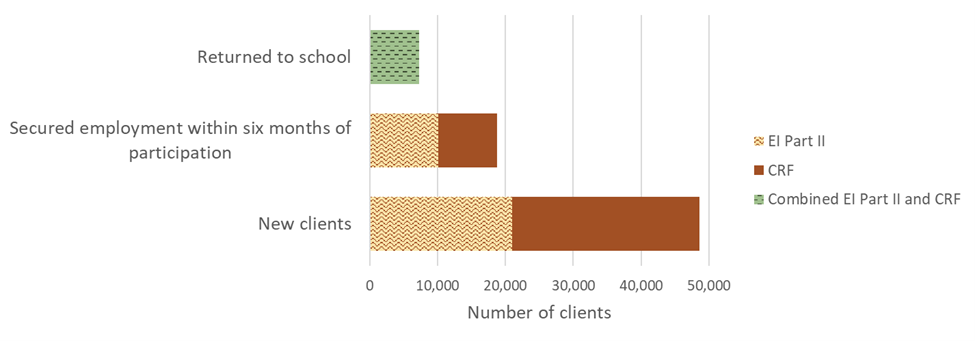
Text description
| Type of client | Total number of clients | Clients funded through EI Part II | CRF-funded clients |
|---|---|---|---|
| New clients | 48,570 | 20,927 | 27,643 |
| Secured employment within 6 months of participation | 18,717 | 10,078 | 8,639 |
| Returned to school | 7,285 | 0 | 7,285 |
- Notes:
- 1 EI Part II and CRF combined, representing the total number of clients served under the Indigenous Skills and Employment Training program.
- 2 The number of clients who returned to school is available only for the combined EI Part II and CRF total.
An evaluation of the ISET Program is underway and expected to be completed by March 2026. The evaluation is co-developed with First Nations, Métis, Inuit, and Urban/Non-Affiliated organizations to reflect their perspectives and realities in support of reconciliation. This approach prioritizes ongoing engagement, the use of culturally responsive evaluation practices, and a strength-based approach.
3.4.2 Investments in workplace skills
Pan-Canadian funding also serves to invest the in the development of workplace skills that benefit Canadian workers and employers across the country. 2024-25 investment areas included:
- Skilled Trades and Apprenticeship and Red Seal Programs
- Registered Apprenticeship Information and Information System (RAIS)
- Sectoral Workforce Solutions Program (SWSP)
The skilled trades and apprenticeship and Red Seal Programs
The Red Seal Program develops common interprovincial standards and examinations for the designated Red Seal trades, based on which tradespeople can be trained and assessed. These standards and examinations are used to harmonize apprenticeship training among PTs, provide the public with updated descriptions of trades. They serve as the foundation for assessment that leads to interprovincially endorsed certification in 54 skilled trades. The Red Seal endorsement is a nationally recognized credential for skilled trades workers in Canada. It promotes excellence to employers, instills pride in skilled workers, and facilitates labour mobility across jurisdictions. Apprentices who complete their training and experienced tradespeople can challenge (i.e., contest) the interprovincial Red Seal examination. Those who pass receive a Red Seal endorsement on their provincial or territorial certificate of qualification, indicating they have demonstrated the knowledge required for the national standard in that trade.
In most PTs, the Red Seal examination serves as the final examination prior to Red-Seal trade certification. The collaborative process of developing interprovincial Red Seal standards and examinations also results in cost-savings for governments.
The Canadian Council of Directors of Apprenticeship (CCDA) oversees the Red Seal Program. The Government of Canada and all PTs - where each PT is responsible for apprenticeship training and trade certification in their jurisdictions - are members of the CCDA. ESDC sponsors a Red Seal Secretariat, which provides strategic and secretariat support to the CCDA.
Red Seal Program
The Red Seal Program currently covers 54 skilled trades, accounting for: 77% of registered apprentices, 86% of new registrations, and 84% of completing apprentices.
The top 5 Red Seal trades by number of endorsements issued in 2024 were:
- construction electrician
- automotive service technician
- plumber
- truck and transport mechanic
- industrial mechanic (millwright)
Red Seal Program Highlights:
- In 2024:
- 49,631 Red Seal examinations were written
- 22,220 Red Seal endorsements were issued.
- In 2024-25:
- 8 new Red Seal Occupational Standards were completed
- 11 examinations were published for 3 trades
- 31 workshops were held for standards and exam development
The Red Seal Program regularly updates its products to reflect the evolving needs of the labour market. The most recent standards have added new content to improve skills related to healthy and respectful workplaces; it is expected that this content will support workplaces that are more welcoming for all tradespeople.
The Government of Canada continues to work with provinces, territories, and industries to reduce barriers to certification in the skilled trades and expand opportunities for apprentices across the country. The federal government and the CCDA continue to lead efforts to harmonize apprenticeship training requirements in Red Seal trades. Harmonization promotes greater labour mobility across Canada and helps apprentices in completing their training when relocating to another jurisdiction during their apprenticeship. The CCDA is also working to support improved foreign credential recognition in the skilled trades.
The Registered Apprenticeship Information System (RAIS)
The Registered Apprenticeship Information System (RAIS) is an annual administrative database produced by Statistics Canada. The database compiles data from PTs on the number of registered apprentices participating in in-class and on-the-job training in trades that are either Red Seal or non-Red Seal. It also compiles data on the number of certificates granted to apprentices or trade qualifiers (challengers).
RAIS is part of the Education and Labour Market Longitudinal Platform, announced in Budget 2018 with an investment of $5.5 million per year, ongoing since 2018-19. The Platform provides Canadians with up-to-date labour market information to help them make informed career decisions. It integrates data from foundational systems, including the RAIS, the Post-Secondary Information System, and Canada Revenue Agency's T1 Family File. Annually published RAIS longitudinal indicators provide insights on a number of key topics, including apprenticeship pathways, labour market outcomes, and interprovincial mobility.
The latest 2023 RAIS results revealed that there were over 385,000 continuing apprentices, with 77% enrolled in Red Seal trades. Of the more than 95,000 new registrations recorded, 86% were in Red Seal trades. Over 37,000 apprentices received certification, with 84% earning their certification in Red Seal trades.
Sectoral Workforce Solutions Program (SWSP)
In 2024-25, the Department continued to implement the Sectoral Workforce Solutions Program (SWSP) announced in Budget 2021. The SWSP sought to close the remaining projects funded under Budget 2021; projects supporting tourism and persons with disabilities, and some legacy projects under the Sectoral Initiatives Program (SIP). The SWSP relied on 2 sources of funds, $19.4 million under EI Part II and $29.4 million in Consolidated Revenue Fund (CRF) funding. The breakdown of spending is outlined below.
The SWSP offers a number of supports for training workers and helping employers develop practical and effective solutions for their workforce needs. These supports include helping sectors and employers address current and future skills shortages by funding the development and distribution of sector-specific labour market intelligence, national occupational standards, and skills certification and accreditation systems.
The SWSP also places a priority on supporting equity-seeking groups by promoting a diverse and inclusive workforce. This helps employers find skilled workers and connect Canadians with the training they need to access good jobs in key sectors.
While the Program helps both employers and workers, its EI Part II funding is primarily focused on solutions to support employers-and particularly small and medium-sized businesses-in attracting and retain a skilled and innovative workforce. The key stakeholders are primarily partnership-based organizations engaged in skills and workforce development in their respective economic sectors or employment groups across Canada. Eligible organizations include not-for-profit organizations, for-profit organizations, municipal governments, Indigenous organizations, as well as provincial and territorial governments, institutions, agencies, and Crown Corporations.
In 2024-25, the SWSP invested $0.1 million in CRF funding to support 2 legacy projects originally launched under the SIP. Additionally, $11.9 million in EI Part II funding and $13.6 million in CRF funding were provided to support 21 tourism projects and 9 projects targeting persons with disabilities. A further $200,000 in CRF funding was invested in 1 SWSP project.
- Specifically, $11.9 million in EI Part II funding was invested in the following 15 projects as per the following: $4.5 million for 6 of the 21 tourism projects, to help one of the sectors hardest hit by the pandemic develop labour market information and workforce tools to attract and retain skilled workers, conduct training activities, and remove barriers for designated and/or equity-seeking groups
- $7.4 million for all 9 projects focusing on persons with disabilities to remove barriers and facilitate participation in the labour market, provide training tools, and support employment and career-building opportunities across multiple sectors, including information and communications technology and transportation
Overall, in 2024-25, the SWSP supported 33 projects (15 projects funded through EI Part II and 18 projects funded through the CRF). Cumulatively this resulted in:
- 13,982 individual clients in training activities
- 37 labour market intelligence reports and forecasting systems
- 4 national occupational standards
- 3 sectoral systems for LMI, certification and/or accreditation
- 281 onboarding and retention tools
- 5,597 employers and other end users participating in and/or accessing the above solutions and tools.
SWSP Supported projects
Below are the SWSP projects that were funded through EI Part II. $19.4 million was allocated to 15 projects.
Tourism projects
- Cape Breton University - Cape Breton Island's Tourism Training Network
- Conseil de la Nation Huronne-Wendat - Tous ensemble pour notre avenir
- Gros Morne Institute for Sustainable Tourism Inc. - Leadership and Innovation for the Future of Tourism in Atlantic Canada
- Refiner's House of Prayer - Placement Aid and Skills Development Project
- The Further Education Society of Alberta - Pathways Creating Opportunities for Indigenous Youth Employment in Tourism and Government
- Wheatland Express Inc. - East-Central Saskatchewan Tourism and Learning Centre
Persons with Disabilities projects
- Abilities to Work Employment Support - Employability Health Support Services Project
- Canadian Association for Supported Employment - Case Innovations Lab Initiative
- Canadian Cultural Society of the Deaf - Building Capacity for Sign Languages Employment
- Canadian National Institute of the Blind - Apprenticeship Training for New Guide Dog Trainers and Guide Dog Mobility Instructors
- Disabled Workers Foundation of Canada - Towards Excellence in Return to Work
- Gateway Association for Community Living - GEDI-Hub
- Real wheels Society - Customized Actor Training for Persons with Disabilities
- Rick Hansen Foundation - Building National Capacity for Accessibility Training and Credentials
- The Canadian Council on Rehabilitation and Work - Accessibility First West Coast
3.4.3 Labour market information
Labour Market Information (LMI) is an integral component of the Government of Canada's economic agenda, providing Canadians with employment-related information to make informed decisions regarding the labour market. LMI includes both qualitative and quantitative information, offering insights into job supply and demand, job location, and required qualifications. It also includes information on wages and other forms of compensation, as well as skills needs and gaps at both detailed and aggregate levels.
ESDC invests in a number of foundational LMI frameworks and programs to streamline data collection and measurement of occupational and competency-based information across Canada. These foundational frameworks - such as classifications, taxonomies, and information systems - create a common lens and terminology to improve the capture and interpretation of LMI data, notably on the Job Bank platform.
National Occupational Classification (NOC)
ESDC's LMI portfolio includes administration of the National Occupational Classification (NOC), the national framework for collecting, analyzing, and disseminating occupational data. For many occupational groups, the NOC describes job titles, functions, tasks and duties, employment requirements, responsibilities, and qualifications.
The current version of the NOC organizes information for over 40,000 job titles classified into 516 unit groups - occupations with similar duties and employment requirements. These groups are classified into broad occupational categories within the labour market.
Labour market surveys, research, analysis, and reports commonly rely on the NOC. It also supports employment-based programming, such as EI and the Temporary Foreign Worker Program, along with initiatives supporting the integration of injured workers and persons with disabilities. NOC-based information is used for policy development, program design, and service delivery.
ESDC, in collaboration with Statistics Canada, revises the NOCs every 5 years to maintain its accuracy and relevance. These revisions are informed by research and stakeholders' feedback gathered through extensive consultations.
On September 21, 2021, ESDC and Statistics Canada released the NOC 2021 V1.0 redesigned classification. This version replaced the former NOC "Skill Level" categories with a Training, Education, Experience and Responsibilities (TEER) categorization system. The TEER system offers a clearer distinction between occupations based on formal training and education requirements, while also capturing work experience, managerial duties, and significant safety responsibilities.
Since the release of NOC 2021 V1.0, ESDC has moved to an ongoing consultation process to provide stakeholders more opportunities to offer feedback. Research for the NOC 2026 revision is completed, and NOC 2026 V1.0 is expected to be to be published by the end of 2026.
The Skills and Competency Taxonomy (SCT), and the Occupational and Skills Information System (OASIS)
As a natural extension to the NOC, ESDC has developed and maintains skills frameworks and systems that outline the competency requirements of Canadian occupations.
ESDC developed the Skills and Competencies Taxonomy (SCT). The SCT is a dictionary of over 300 descriptors and definitions designed to standardize terminology across skills, competencies, and occupational domains. This streamlined terminology improves the comparability of skills and competencies taxonomy across sectors and over time.Footnote 106 The SCT serves as the foundation for the development of a Canadian system similar to the American O*NET system, which is recognized as an effective model for providing detailed skill information for all occupations. Using the SCT and the NOC, ESDC launched a new system called Occupational and Skills Information System (OASIS). The OASIS 2023 V1.0 maps skills and competency requirements for 900 occupational profiles, allowing users to understand how skills, competencies, and occupational work activities from the SCT apply to specific occupations. It also enables users to compare occupations based on skills, abilities, and personal attributes, while exploring career options that share similar skill sets.
In today's economic context, including digitalization of jobs, more granular information about skills is needed to support Canadians navigate labour market transitions. Comprehensive and well-structured skills information is important as job searches, match processes, and training advice are increasingly delivered online through modern digital formats.
Canada is adopting common international practices and leading development of algorithms tailored to Canadian labour markets. These algorithms leverage artificial intelligence (AI), natural language processing, and text mining technologies.
Labour market information products and services
ESDC also delivers the National Employment Service on behalf of the Canada Employment Insurance Commission (CEIC), supported by regional and labour market analysts. These analysts produce regular LMI products based on the NOC and other LMI classifications. These products and services include data on wages, wage analyses, job market snapshots, employment outlooks, and economic forecasts, all of which are accessible to Canadians via the Job Bank website. LMI products help to match current and future job seekers, including students and immigrants, with available and potential job opportunities. They also facilitate exploration of educational and training options, helping Canadians make informed career decisions.
Job Bank is a free and bilingual platform co-delivered with PTs governments, offering a comprehensive listing of job opportunities across Canada. Employers use Job Bank to post their job vacancies and connect with qualified candidates. Job Bank supports other ESDC employment programs, as well, and collaborates with private job boards to enhance the diversity of jobs opportunities available and offered.
In 2024-25, Job Bank introduced several online service enhancements aimed at supporting Canadians in succeeding in the labour market, with a focus on sustainable employment, inclusive services, and addressing skill mismatches.
Since February 2025, Canadian citizens and permanent residents with a Plus account can help Job Bank build more inclusive services by completing our new survey on employment barriers. This new survey aims to collect data on user demographics. The results will help Job Bank identify potential employment barriers and guide the development of better products for underrepresented groups.
- Support for employment groups: as part of the ongoing effort to help temporary residents integrate the Canadian labour market, a new pop-up with optional self-declaration options appears when temporary residents create or sign into their Plus account
- Recognition of Red Seal occupations: to highlight the importance of tradespeople in the Canadian economy and to offer valuable information to people who are planning their careers, Job Bank added a Red Seal disclaimer under the "Requirements" tab of job profiles where endorsements are available
- Green jobs pages: Job Bank introduced a dedicated search page for workers looking for jobs in the green economy. Since 2023-24, employers aiming to create a positive environmental impact can access resources to advertise green jobs and establish eco-friendly workplaces
Key highlights of 2024-25: Job seekers
- Over the past several years, the Job Bank website has become a primary source of job matching services and quality labour market and career information for Canadians and newcomers to Canada, serving about 10% of the Canadian workforce in any given month
- 1.7 million job seekers created a user account on Job Bank, up from 1.99 million in 2023-24
- Job alerts users enrolled via AppliWeb accounted for 88% of the new Job Alerts users
- Top occupations of Job Alerts users included construction, elementary and secondary teacher assistants, carpenters, and truck drivers, which remained largely consistent with previous year
Website content enhancements
Job Bank launched a dedicated content page for workers about green jobs, titled Find a Green Job in Canada. The Green jobs search page offers new opportunities for workers to help the environment, play an active role in Canada's goals of reducing greenhouse emissions by 2030 and reaching net-zero emissions by 2050.
In 2024-25, Job Bank expanded the data coverage of the Job Transition Tool. As a result, the top 1,000 most popular jobs searched on Job Bank's Job Profiles are now available as searchable job titles in the Job Transition Tool.
The Job Bank mobile application underwent several updates to align with website changes. Additionally, back-end changes were made to maintain the application's performance and provide job seekers with a seamless experience.
Job Bank also continued to expand its job listings by integrating job feeds from 19 "external" contributors, including provinces, private job boards, and federal government agencies or departments. In 2024-25, these contributors added a total of 821,168 jobs to the Job Bank platform.
Increased integrity, efficiency and interoperability
Job Bank continued to enhance interoperability and collaboration with stakeholders within ESDC to improve its services and functionality.
- For the seventh consecutive year, Job Bank leveraged its job posting capabilities to publish Canada Summer Jobs opportunities on its website and Mobile App
- Interoperability with stakeholders continues to be improved with the integration of the new LMI Outlooks & Wages APIs, making it easier for Job Bank users to access to the most current data on Outlooks & Wages across Canada
Key highlights of 2024-25: Web analytics and job postings
- The Job Bank website received 78.8 million visits, down from 96.7 million in the previous year, averaging 216,000 site sessions and 1.4 million page views per day
- 53% of visitors viewed job postings, down from 57%, resulting in over 142 million job posting views, compared to 176 million views in the previous fiscal year
- The Labour Market Information section received approximately 35,000 site visits per day, up from 33,000, generating over 77,000 job profiles daily, up from 66,000 last year
- The Career Planning section attracted nearly 1.6 million site visits during the year
- The Mobile App recorded over 2.9 million sessions, an increase from 2.5 million, resulting in over 6.7 million job posting views, up from 5.8 million in the previous year
- Over 1.2 million job postings were available on Job Bank from all sources in 2024-25, a decrease from 1.3 million last year
- Over 95,500 employers posted 373,000 job postings, down from 101,000 employers and 425,000 job postings in the previous fiscal year. These postings represented over 778,000 job vacancies, down from 937,000 the year before
- Approximately 55,000 job postings directly advertised on Job Bank were associated with the Temporary Foreign Worker (TFW) Program down from 79,000 last year
- TFW job postings accounted for 15% of all direct employer postings, a decrease from 19% in the previous fiscal year, and 5% of postings displayed across all sources, reflecting a 1-percentage-point decrease from the prior year
- Over 56,000 job postings (covering over 76,000 distinct vacancies) were available on the Canada Summer Jobs feature, down from 61,000 job postings (90,000 vacancies) in the previous fiscal year. These postings were received by 26,103 employers, compared to 26,462 employers in the prior year
- 45% of jobs for which employers who completed a closeout survey and reported hiring someone indicated that they filled a job vacancy as a result of posting on Job Bank
3.4.4 The National Essential Skills Initiative
The National Essential Skills Initiative (NESI), funded through EI Part II, is one of two Grants and Contributions programs under the Skills for Success (SFS) program; the other is the Adult Learning, Literacy and Essential Skills Program, funded through the CRF. The SFS program supports Canadians to improve their foundational and transferable skills, enabling them to prepare for, secure, and retain jobs while adapting and succeeding in the workforce. This aligns with the Government of Canada's commitment to helping Canadians develop the skills necessary for good quality jobs.
Past evaluations of the SFS Program's predecessor, including NESI-funded activities, have shown positive results. The 2016-21 evaluation report, detailed in the 2022 Literacy and Essential Skills Program Evaluation, highlights the effectiveness of these initiatives in addressing skills gaps.
NESI focusses on research projects that anticipate and help predict emerging foundational and transferable skills needs, particularly for designated and/or under-represented groups in the labour market. More than 15% of current NESI funding supports Indigenous people, more than 14% supports persons with disabilities, and approximately 5% supports racialized Canadians. These research projects allow the SFS program to:
- understand evolving foundational and transferable skills gaps across Canada, with a focus on a changing labour market, informed by an intersectional lens
- target future project intake processes to anticipate and respond to emerging priorities and labour market trends
In 2024-25, NESI funded 9 projects, focusing on enhancing foundational and transferable skills for persons with disabilities, Indigenous peoples including those working in the trades, young adults (18-30), racialized youth, underrepresented groups living in rural areas, and community service workers. Notably, it funded the development of free online tools to support SFS assessment and curriculum design with its NESI funding, and the Business and Higher Education Roundtable developed a disability-centred skills assessment designed for youth with disabilities. Some of these NESI projects are also focused on preparing young workers for the demands of a rapidly changing labour market, including the growing needs for digital skills. For instance, Imagine Canada's "Futureproofing the Community Service Frontline Workforce" NESI-funded project collaborates with Blueprint, the Dais (a think tank at the Toronto Metropolitan University) and the Digital Governance Council to develop learning resources based on the Skills for Success Model, focusing on upskilling the non-profit sector. This initiative has prototyped learning resources for digital skills and is implementing a Digital Skills Implementation Toolkit.
3.4.5 Fostering sustainable jobs
The Government of Canada is committed to reducing greenhouse gas emissions while strengthening the economy through the creation of sustainable jobs. Transitioning to a low‑carbon economy will transform Canadian industries and the labour market, creating new opportunities while changing skill requirements. Ensuring workers are prepared to succeed in this transition is essential to meeting Canada's climate objectives.
Further to this, on February 17, 2023, the Government released the Interim Sustainable Jobs Plan (2023-25), which provides the foundation for Sustainable Jobs Action Plans to be released every 5 years starting in 2025. The interim plan outlined federal actions across 10 key areas to help coordinate efforts and support workers as Canada transitions to a low‑carbon economy.Footnote 107 Alongside the release of the interim Sustainable Action Plan, ESDC implemented several key investments in 2023-24, partially funded through EI Part II, to drive progress towards sustainable jobs and support Canada's transition to a low-carbon economy. Key areas of investment included:
- supporting training and employment initiatives for individuals and employers, with programming tailored to regional priorities and the specific needs of local labour markets, including initiatives that contribute directly to the net‑zero transition
- advancing Indigenous‑led training and employment supports, designed by First Nations, Inuit, Métis, and Urban/Non‑affiliated organizations to reflect the unique needs of their people and communities, including initiatives that support Indigenous participation in the net‑zero transition
- updating skilled trades training to address key topics, such as reducing emissions and pollution, integrating emerging technologies that support net‑zero climate goals, and reducing the environmental footprint of the trades
- supporting workforce planning and skills training to enable worker transitions from declining to growing industries, including in communities affected by economic disruption
- developing and delivering training for apprentices and journeypersons that supports emissions reductions
LMDA support for sustainable jobs
The table below provides illustrative examples of how PTs are using EI Part II-funded LMDA programs and services to support the development of sustainable jobs, including skills development, workforce transitions, and inclusive participation in a low‑carbon economy.
Newfoundland and Labrador
Programs:
- Skills Development program
- Apprenticeship Wage Subsidies
- Labour Market Partnerships
How the programs support sustainable jobs: supports training and apprenticeships in construction, energy, and skilled trades; pilots micro‑credentials and employer‑led projects to support workforce adaptation and inclusion in transitioning sectors.
Prince Edward Island
Programs:
- Skills Development
- Employer‑Supported training
- Labour Market Partnerships
- Etl‑lukwey Indigenous programming
How the programs support sustainable jobs: provides apprenticeship and short‑term training aligned with infrastructure and clean growth sectors; supports Indigenous and employer‑led pathways into construction, aquaculture, and tourism.
Nova Scotia
Programs:
- Skills Development and Apprenticeship programs
- SkillsOnlineNS
- Labour Market Partnerships
How the programs support sustainable jobs: builds trades, digital, and essential skills needed for a modernized economy; supports sector councils and workforce planning linked to long‑term economic sustainability.
New Brunswick
Programs:
- Training and Skills Development
- Wage Subsidies
- Community Adult Learning
How the programs support sustainable jobs: supports reskilling and employer adaptation in priority sectors through case‑managed training, foundational and digital skills development, and workforce retention supports.
Quebec
Programs:
- Opération main‑d'œuvre
- Training Allowances
- Wage Subsidy programs
How the programs support sustainable jobs: accelerates training in construction, engineering, information technology, and education; supports workforce readiness and increased participation of under‑represented groups in key transition sectors.
Ontario
Programs:
- Apprenticeship and Pre‑Apprenticeship training
- Integrated Employment Services
How the programs support sustainable jobs: expands pathways into skilled trades and technical occupations supporting infrastructure renewal and clean growth, while improving inclusive access to employment services.
Manitoba
Programs:
- Skills Development
- Apprenticeship training
- Labour Market Partnerships
How the programs support sustainable jobs: Aligns employer‑led training and apprenticeship supports with regional labour market needs, supporting sustainable workforce participation for Indigenous Peoples and other equity‑seeking groups.
Saskatchewan
Programs:
- Skills Training allocation
- Apprenticeship supports
- Northern Skills training
How the programs support sustainable jobs: Supports community‑based and Indigenous‑led training in trades and resource‑related industries, strengthening workforce resilience and regional sustainability.
British Columbia
Programs:
- WorkBC Skills training
- Apprenticeships
- Community and Employer Partnership projects
How the programs support sustainable jobs: Provides skills training and work‑integrated learning in construction, natural resource stewardship, and community‑based projects aligned with environmental sustainability.
Yukon and Northwest Territories
Programs:
- Skills Development
- Wage Subsidies
- Apprenticeship and Strategic Workforce Initiatives
How the programs support sustainable jobs: Strengthen local and Indigenous workforce capacity through training, work experience, and employer partnerships aligned with long‑term regional economic development.
Pan-Canadian programs supporting sustainable jobs
Complementing provincial and territorial delivery, the table below highlights pan‑Canadian programs that support sustainable jobs by preparing workers for a changing, low‑carbon economy.
Program: Indigenous Skills and Employment Training (ISET)
What the program does:
Supports Indigenous‑led organizations to design and deliver training and employment services tailored to community needs.
Contribution to sustainable jobs:
Enables Indigenous governments and organizations to prepare workers for opportunities arising from the net‑zero transition, supporting participation in clean growth and sustainable economic development.
Program: Red Seal Program
What the program does:
Maintains and updates national occupational standards for skilled trades to reflect evolving labour market requirements.
Contribution to sustainable jobs:
Integrates green learning objectives into trades training, including skills related to emissions reduction, emerging clean technologies, and environmentally sustainable practices (e.g., heat pump installation and maintenance).
Program: Community Workforce Development Program (CWDP)
What the program does:
Provides project-based funding for workforce planning and targeted skills training in communities affected by economic disruption or mass layoffs.
Contribution to sustainable jobs:
Supports worker transitions from declining industries to growing sectors, helping communities adapt to economic and environmental change while maintaining local employment.
Program: Union Training and Innovation Program (UTIP)
What the program does:
Funds union led projects to develop and deliver training for journeypersons and apprentices in Red Seal trades.
Contribution to sustainable jobs:
Through the Sustainable Jobs stream, supports the development of green training focused on reducing emissions and modernizing skills in key trades.
Program: Labour Market Information (LMI)
What the program does:
Invests in tools and data (including surveys and analytical products) that improve understanding of labour market trends and workforce demand.
Contribution to sustainable jobs:
Enhances insight into skills needed in a net zero economy, supporting informed decisions by workers, employers, governments, and training providers.
Program: Job Bank: Green Jobs Features
What the program does:
Enhances Job Bank to identify and promote jobs linked to environmental sustainability and clean growth.
Contribution to sustainable jobs:
Connects job seekers with employers contributing to positive environmental outcomes and supports the development of specialized skills needed in green economy sectors.
3.4.6 Work Integration Social Enterprises research
The Work Integration Social Enterprises (WISE) research program is designed to provide evidence that support the achievement of the Government of Canada's and ESDC's objective of creating a skilled, adaptable, and inclusive workforce while fostering an efficient labour market. The findings of this research will inform policy and program-funding decisions, ensuring federal investments align with labour market needs. WISE emphasizes collaboration with the not-for-profit sector and private business in implementing innovative ideas, social partnerships, and social finance approaches. The research program itself is an example of this collaborative approach.
This strategy aligns well with the Government's Social Innovation and Social Finance Strategy and supports longstanding initiatives by various governments to recognize social enterprise as a key business model. WISEs serve as a primary example of community organizations developing solutions for society's most challenging problems. They consistently look for innovative financing and new revenue sources to enhance their sustainability and achieve greater impact.
WISEs have the capacity to (re)integrate vulnerable populations into existing labour markets, creating long-term new jobs, and increasing the overall employability of disadvantaged populations. However, a lack of empirical data on the direct labour market and broader relevant social outcomes of WISEs for different vulnerable populations in Canada remains a significant barrier to evidence-based policy and program development.
WISE phase I
ESDC launched the WISE Research program in 2017, as a 5-year longitudinal study composed of 6 main projects. The goal was to measure the impact of social enterprises on labour market outcomes for vulnerable populations including persons with disabilities, youth, recent immigrants, homeless or those at risk of homelessness, and Indigenous peoples. Funding was strictly for research purposes and did not cover the WISE organizations on their interventions directly.
These 6 longitudinal research projects included 1 project based on a quasi-experimental design and 5 projects based on multi-site extended case studies, with projects located in Ontario (4), Quebec (1), and British Columbia (1).
The 6 research teams completed their projects in 2022, marking the completion of the WISE Phase I Research Program. Each team publicly published a final report highlighting the key results from their research.
The results demonstrated that WISE interventions generally led to improvements in employment and financial outcomes for clients, including enhanced ability to secure and maintain employment and achieve higher income levels. Notably, 1 project provided evidence that funding WISE programs can have a positive return on investment.
Further details on WISE Phase I Research Program can be found in the Synthesis report: Work Integration Social Enterprises (WISE) Research Program - Synthesis - 2017 to 2022.
WISE phase II
Building on WISE Phase I Research Program, ESDC launched a Phase II in 2022-23 as a multi-project longitudinal study spanning over 5 fiscal years, until 2026-27. Phase II focussed on the role of the broader social enterprise sector in supporting the work and social integration of Black and racialized groups in Canada. The program consists of 11 longitudinal research projects, some of which span multiple provinces. These projects are located in British Columbia (4), Alberta (2), Saskatchewan (1), Manitoba (1), Ontario (7), Quebec (2), and Nova Scotia (2).
The research aims to address key questions:
- what are the characteristics of social enterprises serving Black and racialized groups
- what are the characteristics of the clients of these social enterprises
- how and to what extent do these social enterprises help promote the social and labour market integration of Black and racialized persons in Canada (e.g., improvement in employment, mental health, wellbeing, and other socio-economic outcomes)
This research program aligns with the Canada's goal of fostering equality, equity, and fairness, as well as the Research and Innovation (R&I) objectives of EI Part II. It responds directly to the growing need to improve labour market outcomes for equity-deserving groups and racialized workers. This research program is timely, given the specific challenges these populations face with regards to the Canadian labour market and the GC's objective to build an economy that works for everyone.
Achievements in 2024-25 include:
- knowledge sharing with PTs: Information on the WISE Phase II program was shared with all PTs in April 2024
- touchbase with research teams: ESDC held bilateral virtual meetings with each of the 11 research teams in September and October 2024, to discuss progress to date and preparations for the second annual workshop
- research progress: All research teams completed or almost completed the recruitment of social enterprises and individuals to be included in their studies. By the end of the fiscal year, all teams had started data collection, and some teams had conducted preliminary data analyses
- publication of the 2023-24 Status Report: A progress report on the research program, based on presentations from the 11 research teams at the virtual kickoff workshop held in October 2023, was produced and made public
- annual workshop: A second workshop (hybrid) was held in February 2025, where the 11 research teams presented their results to date and discussed their respective projects with each other and ESDC representatives. An overall status report has been produced and will be made public
ESDC organized the third workshop in February 2025. This event brought together the 11 research teams and selected ESDC stakeholders to discuss the progress of the research projects.