
Chapter 4: Program administration and delivery
Official title: Employment Insurance Monitoring and Assessment Report for the fiscal year beginning April 1, 2024 and ending March 31, 2025: Chapter 4: Program administration and delivery
On this page
- List of abbreviations
- List of figures
- List of tables
- Information note
- Overview
- 4.1 Service standards at a glance
- 4.2 Transformations to improve the future of EI service delivery
- 4.3 EI service delivery and the client experience
- 4.4 Application intake and claim processing
- 4.5 Service quality and integrity
- 4.6 Recourse
- 4.7 Conclusion
- Footnotes
List of abbreviations
This is the complete list of abbreviations for the Employment Insurance Monitoring and Assessment Report for the fiscal year beginning April 1, 2024 and ending March 31, 2025.
- ACG
- Apprenticeship Completion Grants
- ADR
- Alternative Dispute Resolution
- AI
- Artificial Intelligence
- AIG
- Apprenticeship Incentive Grants
- B/C
- Benefits-to-Contributions
- B/U
- Beneficiary-to-Unemployed (rate)
- B/UC
- Beneficiary-to-Unemployed Contributor (rate)
- BDM
- Benefits Delivery Modernization
- CAL
- Canada Apprenticeship Loans
- CEEDD
- Canadian Employer-Employee Dynamics Database
- CCB
- Compassionate Care Benefits
- CCDA
- Canadian Council of Directors of Apprenticeship
- CEIC
- Canada Employment Insurance Commission
- CEIFB
- Canada Employment Insurance Financing Board
- CFP
- Call for Proposals
- CIRNAC
- Crown-Indigenous Relations and Northern Affairs Canada
- COLS
- Community Outreach and Liaison Service
- CPI
- Consumer Price Index
- CPP
- Canada Pension Plan
- CRA
- Canada Revenue Agency
- CRF
- Consolidated Revenue Fund
- CSO
- Citizen Service Officers
- CWDP
- Community Workforce Development Program
- CX
- Client Experience
- EAS
- Employment Assistance Services
- EB
- Employment Benefits
- EBSM
- Employment Benefits and Support Measures
- ECC
- Employer Contact Centre
- EDI
- Equity, Diversity and Inclusion
- EI
- Employment Insurance
- EI-A
- Employment Insurance Regular Benefits - Apprentices
- EIACC
- Employment Insurance Appeals Consultative Committee
- EICS
- Employment Insurance Coverage Survey
- ELMLP
- Education and Labour Market Longitudinal Platform
- eROE
- Electronic Record of Employment
- ES
- Employment Services
- ESDC
- Employment and Social Development Canada
- FS
- Family Supplement
- FTE
- Full-Time Equivalent
- FY
- Fiscal Year
- G7
- Group of 7
- GC
- Government of Canada
- GDP
- Gross Domestic Product
- HCCS
- Hosted Contact Centre Solution
- HR
- Human Resources
- IBD
- Integrity-by-Design
- IC
- Individual Counselling
- IQF
- Individual Quality Feedback
- ISET
- Indigenous Skills and Employment Training
- IVR
- Interactive Voice Response
- IWW
- Integrated Workload and Workforce
- JCP
- Job Creation Partnership
- KPI
- Key Performance Indicators
- LFS
- Labour Force Survey
- LMDA
- Labour Market Development Agreements
- LMI
- Labour Market Information
- LMIA
- Labour Market Impact Assessment
- LMP
- Labour Market Partnerships
- LTU
- Long-Term Unemployed
- MIE
- Maximum Insurable Earnings
- MSCA
- My Service Canada Account
- MUS
- Monetary Unit Sampling
- NEET
- Not in Employment, Education or Training
- NERE
- New Entrant and Re-Entrant
- NESI
- National Essential Skills Initiative
- NHQ
- National Headquarters
- NIS
- National Investigative Services
- NOC
- National Occupation Classification
- OAS
- Old Age Security
- OASIS
- Occupational and Skills Information System
- OECD
- Organisation for Economic Co-operation and Development
- p.p.
- Percentage point
- PAAR
- Payment Accuracy Review
- PCIC
- Parents of Critically Ill Children
- PCS
- Post Call Survey
- PEAQ
- Processing, Excellence, Accuracy and Quality
- PPE
- Premiums-paid Eligible Individuals
- PRAR
- Processing Accuracy Review
- PRP
- Premium Reduction Program
- PSPC
- Public Services and Procurement Canada
- PT
- Provinces and Territories
- QPIP
- Quebec Parental Insurance Plan
- R&I
- Research and Innovation
- RAIS
- Registered Apprenticeship Information System
- RN
- Registered Nurse
- ROE
- Record of Employment
- RPA
- Robotics Processing Automation
- SCC
- Service Canada Centre
- SCT
- Skills and Competency Taxonomy
- SD
- Skills Development
- SD-A
- Skills Development - Apprentices
- SD-R
- Skills Development - Regular
- SE
- Self-Employment
- SEAQ
- Service, Excellence, Accuracy and Quality
- SEPH
- Survey of Employment, Payrolls and Hours
- SFS
- Skills for Success
- SIN
- Social Insurance Number
- SIP
- Sectoral Initiatives Program
- SIR
- Social Insurance Register
- SM
- Support Measures
- SME
- Small and medium enterprise
- SRI
- Service Referral Initiative
- SRS
- Simple Random Sampling
- SST
- Social Security Tribunal
- STDP
- Short-Term Disability Plan
- SUB
- Supplemental Unemployment Benefit
- SWSP
- Sectoral Workforce Solutions Program
- TES
- Targeted Earning Supplements
- TFW
- Temporary Foreign Worker
- TIS
- Telephone Interpretation Service
- TRF
- Targeting, Referral and Feedback
- TTY
- Teletypewriter
- TWS
- Targeted Wage Subsidies
- UTIP
- Union Training and Innovation Program
- VBW
- Variable Best Weeks
- VER
- Variable Entrance Requirement
- VET
- Vocational Education and Training
- VRI
- Video Remote Interpretation
- VRS
- Video Relay Service
- WCAG
- Web Content Accessibility Guidelines
- WISE
- Work Integration Social Enterprises
- WWC
- Working While on Claim
List of figures
- Image 1: EI Call Centre call volumes
- Image 2: Applications submitted using AppliWeb
- Image 3: Documents accepted for electronic submission
- Image 4: SST divisions
- Chart 1: EI service requests via different in-person service channels in 2024-25*
- Chart 2: Preferred methods for completing EI reports
- Chart 3: Applications received and claims processed
- Chart 4: Number of processing officers and EI experience
- Chart 5: Error rates (Claimant, Employer, Service Canada)
- Chart 6: Total net savings identified ($M) due to integrity activities
- Chart 7: 2024-25 EI issues most frequently requested for reconsideration
- Chart 8: Percentage of initial decisions reversed or changed following reconsideration
- Chart 9: 2024-25 adherence to the 45-day service standard for decisions following an appeal at the General Division, EI section (excluding groups)
- Chart 10: 2024-25 adherence to the 15-day service standard for decisions following a hearing at the General Division, EI section (excluding groups)
- Chart 11: Most common issues in appeals concluded at the General Division, EI Section in 2024-25
- Chart 12: 2024-25 outcomes of appeals to the General Division, EI section
- Chart 13: 2024-25 adherence to the 45-day service standard for leave to appeal decisions at the Appeal Division, EI section (excluding groups)
- Chart 14: 2024-25 adherence to the 150-day service standard for final decisions following permission to appeal at the Appeal Division, EI section (excluding groups)
- Chart 15: 2024-25 adherence to the 60-day service standard for final decisions following hearing at the Appeal Division, EI section
- Chart 16: 2024-25 outcomes of Appeal Division, EI section
- Chart 17: 2023-24 distribution of appellant representation types, as identified by the representatives
List of tables
- Table 1: Breakdown of the types of EI service requests provided to clients in SCCs (excluding Scheduled Outreach)
- Table 2: Types of EI service requests provided to clients in scheduled outreach sites
- Table 3: Number of times each EI service request reason was selected in the eServiceCanada portal in 2024-25
- Table 4: EI-related COLS activities delivered to various client groups in 2024-25
- Table 5: Number of claimants using Document Upload
- Table 6: Volume of documents uploaded to AppliWeb and MSCA
- Table 7: Percent of ROE comments processed by artificial intelligence
- Table 8: Percentage of claims processed within a given number of days
- Table 9: Overview of results: Multi-year inventory reduction strategy
- Table 10: Number of calls answered and work items completed through the IWW model
- Table 11: EI payment accuracy rate
- Table 12: Estimated financial impact of errors and estimated error rate, by sources (based on PAAR sample)
- Table 13: Request for reconsideration service standard results
Information notes
This chapter refers to both claimants and clients. Claimants include individuals who are submitting or have submitted an Employment Insurance (EI) or an EI Emergency Response Benefit (EI ERB) claim, as well as those currently receiving benefits. Clients include claimants, employers, and other interested parties.
In the EI program, the fiscal year runs from April 1 to March 31. This chapter uses the four digits of the first calendar year and the last two digits of the second calendar year to indicate the fiscal year reporting period. For instance, “2024-25” refers to the period starting on April 1, 2024, and ending on March 31, 2025.
The Canada Employment Insurance Commission (CEIC) has 4 members representing the interests of:
- government
- workers
- employers
The CEIC has a legislated mandate to monitor and assess the EI program. It has delegated EI administration and day-to-day operational responsibilities to:
- Employment and Social Development Canada (ESDC)
- Service Canada, which is part of ESDC
The CEIC retains a key role in overseeing the EI program, including reviewing and approving policies.
Overview
Chapter 4 of this Monitoring and Assessment Report reviews Service Canada's administration of the Employment Insurance (EI) program during the 2024-25 fiscal year. This chapter presents essential data on service delivery, client experience, application intake, claims processing, accuracy reviews, appeals, and recourse, along with updates on modernization initiatives and outreach efforts.
In 2024-25, Service Canada made notable advancements in improving the efficiency of its services and optimizing program operations. The Department increased call centre responsiveness, integrated new technologies such as Robotics Process Automation and artificial intelligence, and focused on improving processing times for EI claims. Initiatives such as cross-training staff to manage fluctuating workloads have further supported the goal of delivering timely and accurate service.
Additionally, Service Canada prioritized outreach to marginalized and underrepresented populations, ensuring greater accessibility to EI benefits through tailored support services and multilingual resources. Over 3.2 million EI applications were processed, with the vast majority of EI payments issued within the 28-day standard.
In response to the ongoing challenge of fraudulent application attempts, Service Canada effectively balanced client accessibility with program integrity by implementing advanced data analytics and fraud detection strategies. The program also streamlined the appeals process to ensure more timely and efficient resolutions for clients, improving their overall experience while navigating the EI system. Enhanced quality assurance initiatives have solidified the EI program's commitment to maintaining high standards of service delivery.
4.1 Service standards at a glance
In this section
4.1.1 Outreach Support Centre
- Standard: To answer calls within 5 minutes
- Target: ESDC aims to meet this standard 90% of the time
- Performance in 2024-25:The Service Canada Outreach Support Centre met this target by answering 98% of calls within 5 minutes, compared to 97% last year
- For more on the Outreach Support Centre, consult section 4.3.1
4.1.2 Employment Insurance Call Centre
- Standard: To answer calls within 10 minutes (once a caller is in the queue to speak to a representative)
- Target: ESDC aims to meet this standard 80% of the time
- Performance in 2024-25: The EI Call Centre answered 87.5% of calls within 10 minutes, compared to 84.5% last year
- For more on the EI Call Centre, consult section 4.3.2
4.1.3 Employer Contact Centre
- Standard: To answer Employer Contact Centre (ECC) calls within 10 minutes (once a caller is in the queue to speak to a representative)
- Target: ESDC aims to meet this standard 80% of the time
Performance in 2024-25: The ECC answered 92.1% of calls within 10 minutes, compared to 85.6% last year
- For more on the Employer Contact Centre, consult section 4.3.2
4.1.4 Payment of Employment Insurance
- Standard: To issue EI benefit payments or non-benefit notifications within 28 calendar days of filing an application for benefits
- Target: ESDC aims to meet this standard 80% of the time
- Performance in 2024-25: ESDC met this standard 87.4% of the time, compared to 86.4% last fiscal year
- For more on EI claims processing and 2024-25 results, consult section 4.4.2
4.1.5 Employment Insurance requests for reconsideration
- Standard: To finalize EI requests for reconsideration decisions within 30 days of the request being received
- Target: ESDC aims to meet this standard 80% of the time
- Performance in 2024-25: ESDC met this standard 25.3% of the time, compared to 53.1% last fiscal year
- For more on EI requests for reconsideration and 2024-25 results, consult section 4.6.1
4.1.6 Social Security Tribunal
Employment Insurance General Division
From the date that the appeal is filed
- Standard: To make decisions within 45 days
- Target: The Social Security Tribunal (SST) aims to meet this standard 80% of the time
- Performance in 2024-25: SST met this standard 47.6% of the time (compared to 14.1% in 2023-24), with an average processing time of 55 days (compared to 108 in 2023-24)
- When including group appeals, the SST met this goal 46% of the time, with an average processing time of 65.4 days
Following a hearing
- Standard: To make decisions within 15 days after a hearing
- Target: SST aims to meet this standard 80% of the time
- Performance in 2024-25: SST met this goal 75.6% of the time (up from 66.6% in 2023-24), averaging 12.2 days to issue a decision after the hearing compared with 17.9 days in 2023-24
- When including group appeals, the SST met this goal 75.2% of the time, averaging 12.8 days to issue a decision after the hearing
- For more information, consult section 4.6.2
Employment Insurance Appeal Division
Leave to appeal decisions
- Standard: To make decisions within 45 days
- Target: SST aims to meet this standard 80% of the time
- Performance in 2024-25: SST met this goal 92% of the time (compared with 23.5% in 2023-24), with an average processing time of 21.1 days (compared to 67.2 days in 2023-24)
Final decisions
- Standard: To make decisions within 150 days of the leave to appeal decision
- Target: SST aims to meet this standard 80% of the time
- Performance in 2024-25: the SST met this goal 90.2% of the time (compared to 81.1% in 2023-24), with an average processing time of 91.6 days (compared to 113.3 days in 2023-24)
- Including group appeals, the SST met this goal 42.6% of the time, with an average processing time of 149.4 days
- Standard: To send final decisions within 60 days of the hearing
- Target: SST aims to meet this standard 80% of the time
- Performance in 2024-25: the SST met this goal 88.5% of the time, with an average processing time of 29.6 days
- For more information, consult section 4.6.2
4.2 Transformations to improve the future of EI service delivery
In this section
4.2.1 Service transformation and the Benefits Delivery Modernization programme
A key element of service transformation is the Benefits Delivery Modernization (BDM) programme, ESDC's multi-year approach to improve client service experience and address aging IT infrastructure.
The BDM Programme will improve how the Department delivers services by updating its business practices, better managing the workforce and workloads, enhancing knowledge management, and upgrading its technology.
In 2024-25, the BDM Programme completed the planning phase for bringing the EI program onto the new technology platform. This phase involved designing EI products and creating examples based on feedback from users and clients. It also included developing and launching an Employment Insurance Benefits Estimator.
The EI Benefits Estimator is a new digital tool that enables clients to obtain an estimate of the EI benefits to which they may be entitled when applying.
- This tool gives EI seekers access to simplified information about various EI benefits, the calculation of an estimated benefits amount, and eligibility criteria, all without having to call or visit a service centre in person
In January 2025, the BDM Programme launched the next phase of work, the build and implement phase of the EI on BDM project, with plans to launch its first EI benefit on the new platform in the Fall of 2025.
4.2.2 Call Centre improvement strategy
In 2024-25, the following initiatives were taken to improve and modernize the call centres:
- enhanced the 6 Robotics Processing Automation (RPA)Footnote 1 bots, improving stabilization and increasing the speed of the bots
- These bots assist representatives with manual tasks while on a call (for example copying and pasting information and completing checklists)
- rolled out a dedicated toll-free number for callers using a Video Relay Service (VRS) provider to reach the EI call centre, offering a prioritized service and improved accessibility for clients with speech and hearing impairments using VRS
- replaced outdated teletypewriter (TTY) machines with a new TTY platform to improve accessibility for those with hearing and speech impairments
- The platform has been successfully receiving calls in real time since its launch, improving the previous service which allowed clients to leave a message and be called back by a representative within 48 hours
- introduced a voluntary post-call survey to gather the clients’ experience with the call centre
- implemented the ability to allow clients to go on hold virtually during periods of high call demand and receive a call back from a representative rather than waiting in the queue
4.3 EI service delivery and the client experience
In this section
4.3.1 In person
The employees of the In-Person channel provide services to EI clients via close to 600 in-person points of service across the country (consult Annex 4.3.1b for a regional breakdown of the points of service delivering the EI program).
In 2024-25, out of a total of 12.3 million requests across all programs, Service Canada staff completed over 1.5 million EI-related service requests in person and via eServiceCanada (consult Chart 1, below). In addition, there were nearly 450,000 cases where EI Clients self-served using Citizen Access Workstation Services located in Service Canada Centres (SCC).

Text description
| Service Channel | Number of EI service requests |
|---|---|
| Service Canada Centre | 1,317,452 |
| eServiceCanada | 191,220 |
| Scheduled Outreach | 15,904 |
| Outreach Support Centre | 9,709 |
| Total | 1,534,895 |
- * Data in chart 1, above, represent number of service requests and does not represent the number of clients. A client can have more than one service request.
- ** Note: When referring to ‘In-Person services’ it includes services considered as extensions of those available at Service Canada Centres. These include eServiceCanada, Outreach Support Centres, and Scheduled Outreach Sites. Some services are provided by Citizen Service Officers (CSOs) (e.g., those at SCCs and eServiceCanada) and COLS services are provided by Citizen Service Specialists (CSSs).
Service Canada Centres
Service Canada Centres (SCCs) provide clients with an in-person point of access to ESDC programs and services, including EI.
The SCCs are open up to 5 days a week, are managed and staffed by Service Canada employees, and offer general information and transactional services. SCCs may be stand-alone, consolidated with passport services.
Although SCC employees do not process EI claims, they can support EI claimants by helping them to complete their applications. They also provide general program information and intake support to clients, including:
- authenticating identity
- validating supporting documents
- verifying information for completeness
- completing non-complex transactions: change of address, direct deposit (consult Annex 4.3.1a)
- issuing temporary access codes, updating tax codes, and extending sickness benefits
- assisting with completing claimant reports
- assisting with completing EI applications
- assisting with converting an EI claim from regular to sickness benefits (or vice versa)
In January 2025, Service Canada began publishing estimated wait times for in-person services at all SCCs on Canada.ca. Before leaving home, walk-in clients can now check wait times for all offices in their area and select the most appropriate location based on their needs.
As of March 31, 2025, Canadians have access to 138 bilingual SCCs offering EI services in both French and English. Additional bilingual locations will be added to existing SCCs already providing this service in the coming years.
French and English service is also available through the Telephone Interpretation Service (TIS) in designated unilingual SCCs. The TIS allows employees to serve clients in over 100 other languages in all SCCs and outreach locations across the country. To find a bilingual Service Canada Centre near you, visit the Service Canada Office Locator.
Video Remote Interpretation (VRI) is available at all SCCs to support Deaf and hard of hearing clients. This service improves accessibility by connecting clients and staff with a sign language interpreter via video.
| Type of EI service offering | Number of service requests | % of total* |
|---|---|---|
| Follow-up | 689,433 | 52% |
| Information | 420,318 | 32% |
| Application | 68,246 | 5% |
| Other (including first point of contact, processing support, and T4E inquiries) | 139,455 | 11% |
| Total EI service requests | 1,317,452 | 100% |
- * +/- due to rounding %
For more on the volume of EI service requests at SCCs, Scheduled Outreach Sites, and Citizen Access Workstation Services, consult Annex 4.3.1c.
Scheduled outreach sites
Scheduled outreach sites provide services in host sites within communities on a scheduled basis. To accomplish this, staff travel to pre-determined locations, typically in rural or remote areas, and conduct business using space within the community. These points of service offer the same services as SCCs and act as an extension to the physical in-person SCC network.Footnote 2
In 2024-25, scheduled outreach sites completed a total of 185,136 service requests, 15,904 of which were related to the EI Program.
| Type of EI service offering | Number of service requests | % of total* |
|---|---|---|
| Follow-up | 8,388 | 53% |
| Information | 3,815 | 24% |
| Application | 2,529 | 16% |
| Other (including first point of contact, processing support, and T4E inquiries) | 1,172 | 7% |
| Total EI service requests | 15,904 | 100% |
- * +/- due to rounding %
eServiceCanada
eServiceCanada is an online platform where clients can submit an online request to receive a telephone callback from a Citizen Services Officer (CSO) about a Service Canada program, service or benefit. eServiceCanada is intended to deliver a level of service equivalent to that provided at In-Person Service Canada locations. Typically, the service involves tasks such as answering general questions, assisting the completion of applications, updating personal information and processing supporting documents. Clients may use the online eservice form to request a callback within two business days regarding several services including EI. In 2024-25, 94% of eServiceCanada requests received a response within 2 business days.
In 2024-25, over 191,000 EI requests were completed via eServiceCanada requests (representing 47% of all eServiceCanada program requests completed). Consult Annex 4.3.1d for more on EI requests and eServiceCanada.
| EI service request selections* | Number of times selected | % of total** |
|---|---|---|
| Update direct deposit/address | 50,416 | 21% |
| Help applying for EI | 55,669 | 23% |
| General EI information | 65,593 | 27% |
| Submit additional information and/or supporting documents (medical notes, records of employment) | 30,465 | 13% |
| Help with claimant reports | 25,370 | 11% |
| Record of employment Web—Primary officer identity validation | 8,281 | 3% |
| Obtain overpayment information on the Canada Emergency Response Benefit initial $2,000 payment | 3,332 | 1% |
| Total | 239,126 | 100% |
- * Clients can identify multiple reasons for one single eService request
- ** +/- due to rounding
Reaching at-risk and remote populations
In 2024-25, the Department continued to implement strategies that assist marginalized, underrepresentedFootnote 3, and at-risk clients. These are clients who can sometimes face difficulties and barriers in accessing and obtaining services.
Service Canada does this through services such as:
- Community Outreach and Liaison Service (COLS)
- Outreach Support Centre (OSC)
- the Service Referral Initiative (SRI)
Similar to in-person services, Service Canada also offers specialized assistance or translation services to those who need it through COLS, the OSC, and the SRI. These services include TIS, Video Remote Interpretation services, and VOCALLS, a service that provides TTY services to callers.
Community Outreach and Liaison Service
Community Outreach and Liaison Service (COLS) expands the reach of Service Canada by connecting with communities, particularly those with limited access to traditional service delivery. Direct support to at-risk populations, Indigenous communities, those impacted by hazardous weather events, and employers and employees facing labour market challenges will find support via COLS. COLS thrives on building relationships with community partners and organizations to increase awareness of and access to programs and services such as EI. COLS staff may travel to various communities to offer support and information, or host events to connect with people in their own environments.
The COLS program supports:
- northern, remote, and on-reserve Indigenous communities and urban Indigenous populations
- underserved populations—those who generally have more barriers to accessing government programs and services
- employers and workers facing labour market adjustments
- communities experiencing emergency situations
Outreach staff gather information about labour market events and the affected employers to establish points of contact to start developing a plan to provide services to all impacted workers. Through collaboration with provincial and territorial governments, COLS staff deliver information sessions and application assistance to support workers through the different steps and stages of applying for federal programs, including EI.
Through these outreach events, workers receive immediate access to essential programs and information enabling them to make informed decisions about their next steps, such as EI, job search support (Job Bank), and pension information. Employers are offered information on layoff mitigation options, including work-sharing and the workforce reduction program. They are also provided with support to host EI information sessions and application clinics for their employees.
In 2024-25, 1,210 EI-related information sessions were conducted through COLS, to over 20,700 participants.
| Client group | Number of EI information/application sessions | Number of mass layoff sessions | Number of work-sharing sessions | Number of attendees |
|---|---|---|---|---|
| Citizens | 359 | 265 | 281 | 18,962 |
| Employers | 37 | 15 | 108 | 666 |
| Other stakeholders | 124 | 7 | 14 | 1,096 |
For more on COLS information sessions in 2024-25, consult Annexes 4.3.1e–h.
Service Canada Outreach Support Centre
The Service Canada Outreach Support Centre (OSC) is a toll-free service that offers tailored information and support to individuals living in Indigenous and remote communities, as well as those who face barriers to accessing government services. These barriers may include limited access to technology, language differences, cultural considerations, disabilities, or other challenges that make in-person or online services difficult to use. The OSC provides tailored assistance with a range of Service Canada programs and benefits, including EI. Launched during the COVID-19 pandemic as a stopgap measure, it is now a permanent component of the COLS service delivery model.
In 2024-25, the OSC expanded Service Canada’s reach in communities by partnering with various national and community organizations, including 2-1-1, who can transfer clients directly to the OSC for assistance with Service Canada programs and services, including EI.
In 2024-25, the OSC received 20,512 calls and completed 24,635 service requests.
Of these service requests:
- 1,833 were for EI information
- 7,876 were for EI related service requests
In 2024-25, the OSC met its service standard (90% of calls answered within 5 minutes), with 98% of calls answered within 5 minutes, compared with 97% last fiscal year.
As of March 31, 2025, 382 unique Indigenous communities received services through the OSC. From these communities, 1,950 callers were assisted with 2,023 EI service requests, which include:
- 235 information requests
- 272 application assistance
- 1,516 follow up/first point of contact resolution
For the breakdown of the OSC EI requests by regions, consult Annex 4.3.1i.
Service Referral Initiative
The Service Referral Initiative (SRI) entails working with community organizations to help identify at-risk and vulnerable individuals who may be eligible for federal services and benefits and referring them directly to a Service Canada representative for personalized support. These clients are those who experience barriers to service and cannot access benefits through other service channels. COLS staff actively promote the SRI and collaborate with Service Delivery Partners (SDPs) to improve access to benefits. By offering a more targeted and accessible approach, the SRI helps ensure that underserved clients receive the support they need.
During 2024-25, Service Canada received 1,830 referrals from its partners, of which 293 were related to EI.
4.3.2 By telephone
Employment Insurance Call Centre
The EI Call Centre network is the main point of contact for EI clients. The EI Call Centre spreads calls across the national network based on next available resources, regardless from where in the country the calls originate.
EI Call Centre representatives respond to questions about the application process for EI, eligibility for EI benefits, and enquiries specific to claimants' EI files. Representatives resolve enquiries by:
- providing claim-specific information
- updating information on the claimant's file (for example, changing an address or direct deposit information)
- processing claimant reports for which a claimant requires intervention to access the payment to which they are entitled
- making decisions on a wide variety of non-contentious issues (such as claim calculation and reason for separation)
EI Call Centre staffing levels increased slightly in 2024-25, starting the year with 2,587 full-time representatives and an average of 2,511 full-time equivalent (FTE) representatives over the year compared to an annual average of 2,373 FTEs in 2023-24. The EI Call Centre experienced staff turnover of 29%, with approximately 32% of these individuals leaving permanently (including resignations and retirements) compared to 21% and 60% respectively in 2023-24.
Call volume
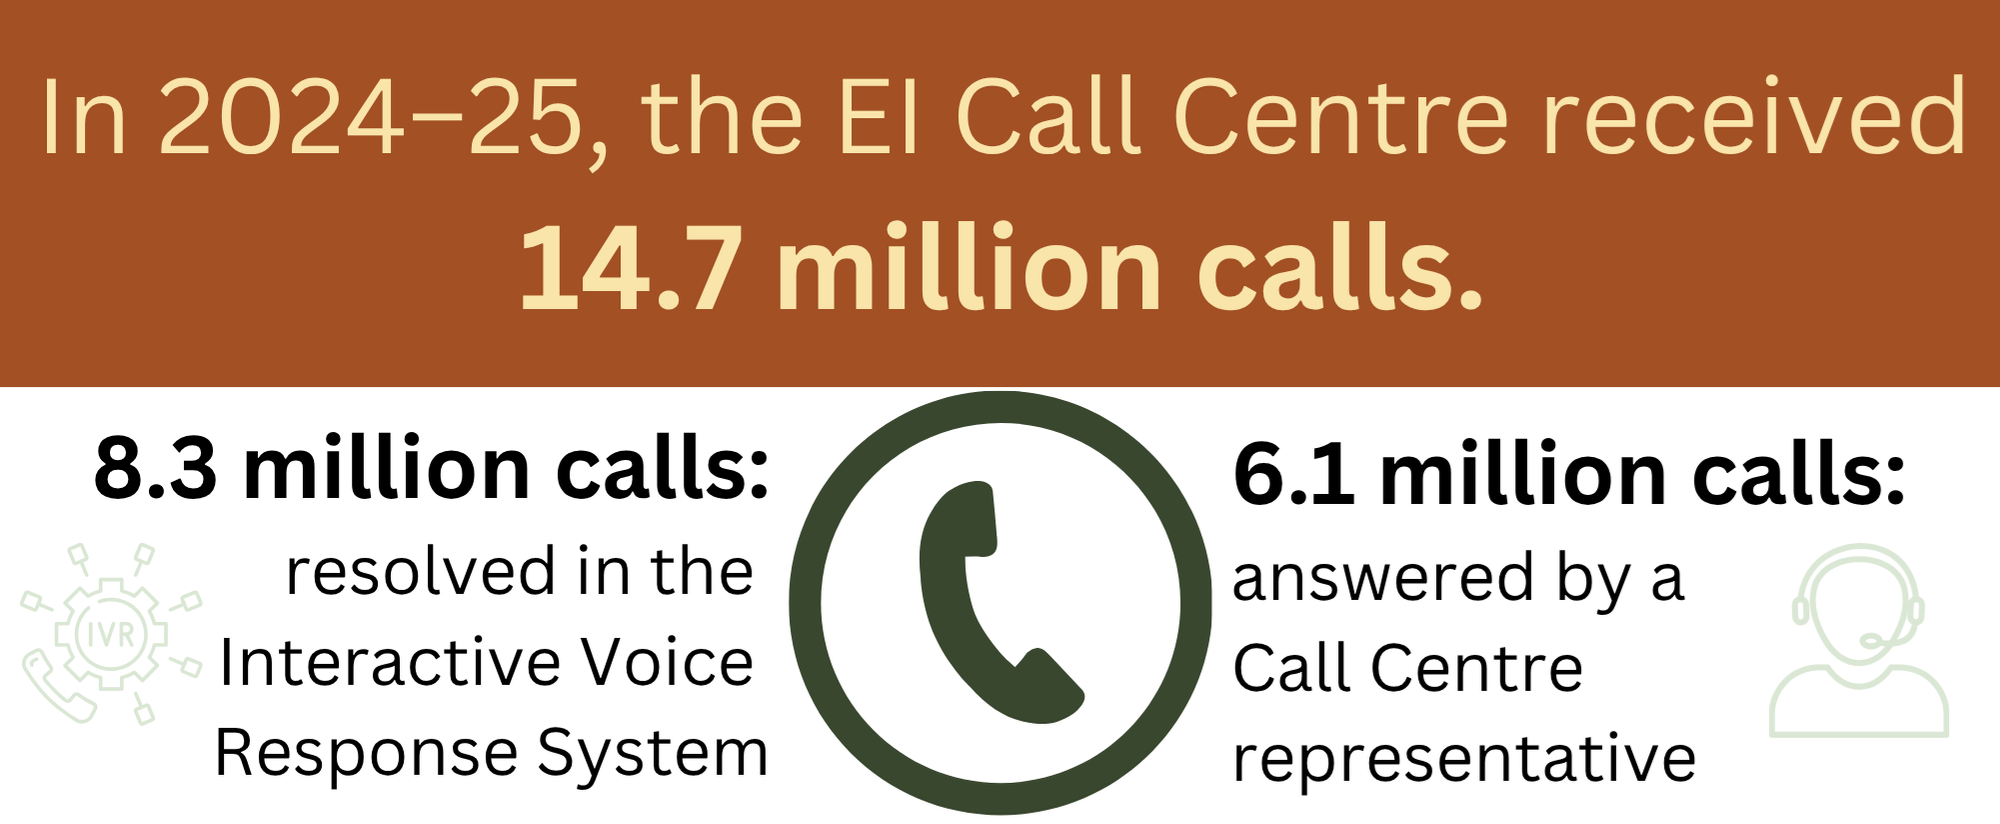
Text description
In 2024-25, the EI Call Centre Received 14.7 million calls. Of these, 8.3 million calls were resolved in the Interactive Voice Response System and 6.1 million calls were answered by a Call Centre Representative
The EI Call Centre received 14.7 million calls in 2024-25, slightly down from 15 million the previous year. This continued decline was due to improvements in the speed and efficiencies in EI claims processing, resulting in fewer claimants calling back for updates. Continued shorter wait times also helped reduce the number of calls because clients had their calls answered in a timely manner instead of hanging up and trying again later.
Interactive Voice Response system
The EI Call Centre is equipped with an Interactive Voice Response (IVR) system. This system allows claimants to self-serve by:
- authenticating themselves
- updating their access code
- checking their application status
- getting details about their file
- completing their biweekly claimant's reports
In 2024-25, 56.2% of calls (8.3 million) were resolvedFootnote 4 in the IVR system without the need to speak to a representative. This is a decrease in the percentage of calls resolved in the IVR, compared to 57.3% in 2023-24 (consult Annex 4.3.2a).
Representatives are available to guide claimants through issues not resolved by self-service. For 2024-25, the top 5 reasons claimants requested representative-assisted services were regarding:
- questions about the status of a claim/decision (21.4%)
- support to complete an electronic claimant's report started through a self-service option (7.5%)
- support to complete a claimant report (7%)
- questions about the status of an expected payment (5.9%)
- help on how to file an application (5.4%)
Calls answered
In 2024-25, calls answered by a call centre representative increased slightly to 6.1 million calls, compared to 6 million in 2023-24 (consult Annex 4.3.2b).
The call centre exceeded the service level for the second consecutive year, answering 87.5% of calls within 10 minutes of entering the queue to speak to a representative.
In 2024-25, the average call length, at about 16.8 minutes, was similar to 2023-24, at about 17 minutes. Call length is affected by the nature and complexity of the calls received. Call length is also affected by the proportion of new staff, who generally have longer calls than more experienced representatives. In 2024-25, the number of call centre representatives who had at least a year of experience remained high though it decreased to 84.5% (from 86.7% in 2023-24).
Representative availability and caller wait times are two important performance indicators for call centres:
- representative availability represents the percentage of call attempts that are successfully placed in queue to wait to speak to a representativeFootnote 5
- caller wait times represent the amount of time a caller is in queue waiting to speak to a call centre representative
In 2024-25, representative availability remained at virtually 100% for the second year in a row. Also, in 2024-25, the average annual wait time in the queue to speak to a representative was 3.4 minutes, creeping down slightly from 4 minutes in 2023-24. For information on the rate of callers who chose to hang-up, rather than wait to speak to a representative, consult Annex 4.3.2c.
The changes and improvements to representative availability and caller wait times are directly related to the following initiatives:
- the 2019-20 migration to the modernized call centre platform, the Hosted Contact Centre Solution (HCCS)
- upgrades to queue capacity
- maintaining a higher staffing level
Factors affecting Call Centre performance
There were fewer calls received from claimants waiting for EI claim decisions in 2024-25. Claim status enquiries are directly correlated with the volume of EI applications or claims pending review that are awaiting a decision.
Calls resolved at first point of contact
Once a client connects to a call centre representative, most of their telephone enquiries are resolved at that initial point of contact. However, there are occasionally cases where the call centre environment is not well suited to handle a request. When this occurs, the call centre representative sends the request to EI processing officers for appropriate follow-up actions.
The EI Call Centre tracks the volume of calls resolved at first point of contact. A call is considered resolved if the representative can address the client's enquiry during the telephone interaction.
During 2024-25, the percentage of calls that were resolved by a call centre representative with no additional follow-up required was 3.2% higher at 94.1% (consult Annex 4.3.2d). This increase is due to a continued high ratio of experienced call centre staff to newer staff. Having more experienced staff means that call centre representatives can make decisions in more cases, submit fewer callback requests and tend to contact advisors for help less frequently, leaving the assist line more available for new staff and more complicated enquiries. Call Centres also implemented initiatives for the upskilling of staff, which included new procedures allowing them additional authorities and refresher training to clarify and solidify knowledge for more complex activities that are part of existing work. Additionally, more easily-resolved calls—such as completing a claimant report or questions about the status of a payment—and significantly fewer calls related to the status of a claim/decision (21.4% compared to 27% in 2023-24) were received in 2024-25, contributing to the increased resolution rate.
Employer Contact Centre
Another critical component of the call centre network is the Employer Contact Centre (ECC). The ECC provides enhanced services to employers through an accessible, national, single point of contact. The ECC network is comprised of approximately 85 full-time representatives.
Employers contact the ECC to get information and help on a variety of service offerings, which may or may not be related to EI (including Temporary Foreign Worker Program, Work-Sharing, and Grants and Contributions Online Services).
Call volume
Clients made 568,248 calls to the ECC in 2024-25. This volume includes:
- calls answered by ECC representatives
- calls for which the self-serve option resolved the clients' needs
- calls for which the caller chose to abandon while waiting to speak to a representative
- calls prevented from accessing a representative
In 2024-25, 33% of calls (186,355) were resolvedFootnote 6 in the IVR system without the need to speak to a representative. This is similar to 2023-24 with 34% resolved in the IVR.
Calls answered
The ECC answered 371,094 calls in 2024-25, which is 22,086 additional calls compared to 2023-24.
In 2024-25, virtually 100% of clients who opted to speak to an ECC representative were placed in a queue, compared to 99.9% the previous year.
The ECC has the same service-level target as the EI Call Centre, which is to answer 80% of calls within 10 minutes. The ECC answered 92.1% of calls within 10 minutes, which is 6.5% higher than the previous fiscal year. The average length of time clients had to wait in the queue to speak to a representative decreased to 2.1 minutes from 3.7 minutes in 2023-24. The number of clients who chose to hang up after being placed in queue to speak to a representative decreased to 10,407 from 19,002 calls the previous year.
In 2024-25, the top service offering remained the same compared to the previous year. Temporary Foreign Worker Program (TFWP) is still ECC's main service offering, while record of employment on the Web (ROE Web) is the second. The number of ROEs issuedFootnote 7 remained stable for 2023-24 and 2024-25, with nearly 12 million ROEs issued. The following are the top 5 individual reasons employers called the ECC to speak to a representative for assistance:
- to request changes or updates to their Labour Market Impact Assessment (LMIA) application (14.1%)
- to enquire about ROE Web registration and login (13.54%)
- to order paper ROE forms (10.21%)
- to enquire about the status of an application for an LMIA through the TFWP (9.22%)
- to receive help about block-specific information on ROEs (7.97%)
To identify the specific reasons for which employers contact ECC, each main service offering is divided into call topic categories. As shown above, the 2 main call topics to ECC were related to TFWP (specifically, requests regarding LMIA applications) and enquiries about ROE Web registration and login. Nonetheless, in fiscal year 2024-25 calls related to TFWP enquiries increased while ROE enquiries remained stable.
Training for call centre representatives
The EI Call Centre and the ECC are committed to ensuring that clients receive consistent high-quality service. Representatives are supported in delivering on this commitment from the moment they are hired, beginning with an extensive training program.
The initial training for call centre representatives varies by program. EI Call Centre representatives receive a minimum of 10 weeks of onboarding training, whereas ECC representatives receive a minimum of 8 weeks. The training takes various forms, including computer-based learning, classroom instruction, practical exercises, and reading materials. A post-training monitoring program ensures that representatives are supported as they begin to answer calls. Even once representatives begin to work more independently, ongoing support is available through a dedicated help desk. Call centre representatives receive additional training as required when there are changes to programs or systems.
Coping skills and crisis intervention training for call centre employees
A suite of courses has been developed for employees in call centres, designed to help them with matters related to working in a call centre environment, such as coping skills. These training efforts have been implemented to ensure that call centre employees are supported and provided with the appropriate tools to help them maintain positive mental health.
All new call centre employees receive 2 full days of training relating to coping skills as part of their initial training curriculum. The intent is to prepare employees by helping them develop active listening skills, call de-escalation techniques, strategies to help manage and control their personal reactions, as well as provide them with resources and tools to help support their own wellness.
Additionally, every call centre employee benefits from the availability of a one-time training course relating to dealing with crisis in a call centre environment.
The objectives of this 1-day session are to:
- help employees improve their ability to recognize an emotional or mental crisis in themselves, their co-workers, or their clients
- identify and apply coping mechanisms to help them through a crisis
- identify and apply tools to de-escalate issues present because of a crisis
- identify available resources to support the call centre representative
The Department also ensures that ongoing support is available to employees as they progress in their call centre careers with the implementation of a 3-year training cycle. Two full-day training sessions are offered to employees each fiscal year. Training content reinforces the technical, interpersonal, and self-care skills that employees may need to foster a positive work environment and support their mental health and well-being.
Quality of call centre service delivery
Beyond supporting call centre employees through training, Service Canada continues to ensure the delivery of high-quality service to clients through its Service, Excellence, Accuracy, and Quality (SEAQ) Program.
The SEAQ Program is a streamlined approach to quality management. Through the program, evaluators monitor calls on an ongoing basis. Representatives receive regular constructive and reinforcing feedback to ensure that they provide accurate, complete information and high-quality client service. Supplemental support can include coaching or training plans tailored to individual needs. Extra monitoring can also be completed as part of these plans to ensure continued performance improvements. To ensure consistency across the network, evaluators must be certified. Evaluators must keep their certification through ongoing national calibration sessions to ensure that the same monitoring criteria is applied across all call centres.
Call centre interactions are evaluated using the 10 elements that make up the SEAQ Program, which are categorized into 4 sections: Analysis, Accuracy, Security, and Excellence. Each element is attributed a result of Yes, Observation, or No by the evaluator, based on whether the actions and behaviours observed throughout the interaction satisfy the definition of each of the elements. Interactions are considered Satisfactory when all applicable elements have been attributed a result of Yes or Observation, meaning that they are free of impactful errors.
In 2024-25, 17,059 interactions EI Call Centre were evaluated. Of the monitored interactions, 82% were Satisfactory. The specific element “Information Provided” is a key indicator of the result achieved for the client. For this element, 95.7% of monitored EI interactions adequately fulfilled the essential criteria.
For the ECC, 812 interactions were evaluated in 2024-25. 96% of interactions monitored were Satisfactory, and 99.5% of reviewed ECC interactions adequately fulfilled the essential criteria for the element “Information Provided.”
In addition to the Department's formal quality management program, clients can provide feedback about their service delivery experience either directly to a call centre representative or to the Office of Client Satisfaction. Call centre representatives have an ID number assigned to them. Clients can request this number during any call and reference it when providing feedback. Clients can also share general feedback about their experience by completing the post-call survey after their call.
4.3.3 Online
Canada.ca
In 2024-25, Canada.ca remains a reliable and authoritative source for information about Employment Insurance (EI). It provides accurate and comprehensive details about the EI program, including eligibility requirements, application procedures, and the types of benefits available. Additionally, clients can use the website to manage their claim, access tax information, and find contact information for further assistance with Service Canada.
The number of visitors seeking EI information and services increased by 4.7% in 2024-25 compared to 2023-24. There were 40 million visits across all EI web pages. Overall, 11% of all EI online clients went on to start an application for EI online. This is a marginal difference in the overall conversion rate compared to last year (an increase of 0.35%).
In 2024-25, the following EI pages were the most popular ESDC web pages visited in both official languages:
- EI reporting
- EI benefits
- EI regular benefits: Apply
- Access record of employment on the Web (ROE Web)
- EI contact information - Individuals
EI regular benefits pages
EI regular benefits pages had 7.8 million visits in 2024-25. There were 5.8% more visits than in 2023-24. Of those visitors, 41% went on to start applications using AppliWeb, identical to the rate seen in 2023-24.
Maternity and parental benefits pages
When applying for maternity and parental benefits, claimants can access the estimator tool, which provides an interactive calculator that potential claimants can use to estimate how much they could receive.
In 2024-25, the data shows that:
- 372,009 clients used the estimator tool, generating 774,773 estimates
- there were 2.7 million visits to the EI maternity and parental benefits information pages, a 4.1% increase from 2023-24
- 16.4% of visitors to the maternity and parental benefits pages went on to start applications for benefits
EI sickness benefits pages
EI sickness benefits pages had 2.5 million visits in 2024-25, which is the same as in the previous year. About 7.2% of those visitors went on to start applications.
Reaching out to Canadians
In a continued effort to connect with and engage Canadians, Service Canada is using alternate online channels, like social media, to reach EI clients faster. In 2024-25 the Department enhanced its social media management system's analytical and reporting functionalities. As a result, EI-related client traffic on social media platforms has been steadily increasing, reflecting a growing demand for timely, accessible information through these channels.
Online tools and services
Clients use ESDC's secure web applications to access information and make transactions. EI online tools are integral to service delivery as they enable secure self-service access, alleviate demand on in-person and call centre channels, and improve overall efficiency and accessibility.
AppliWeb
AppliWeb is the online tool EI claimants can use at any time to submit applications. Claimants can access AppliWeb from anywhere offering internet access, including in SCCs. Information shared by claimants is automatically transferred to their EI files and used to support claim processing automation.Footnote 8
In 2024-25, 98.2% of EI applications were submitted online using AppliWeb.
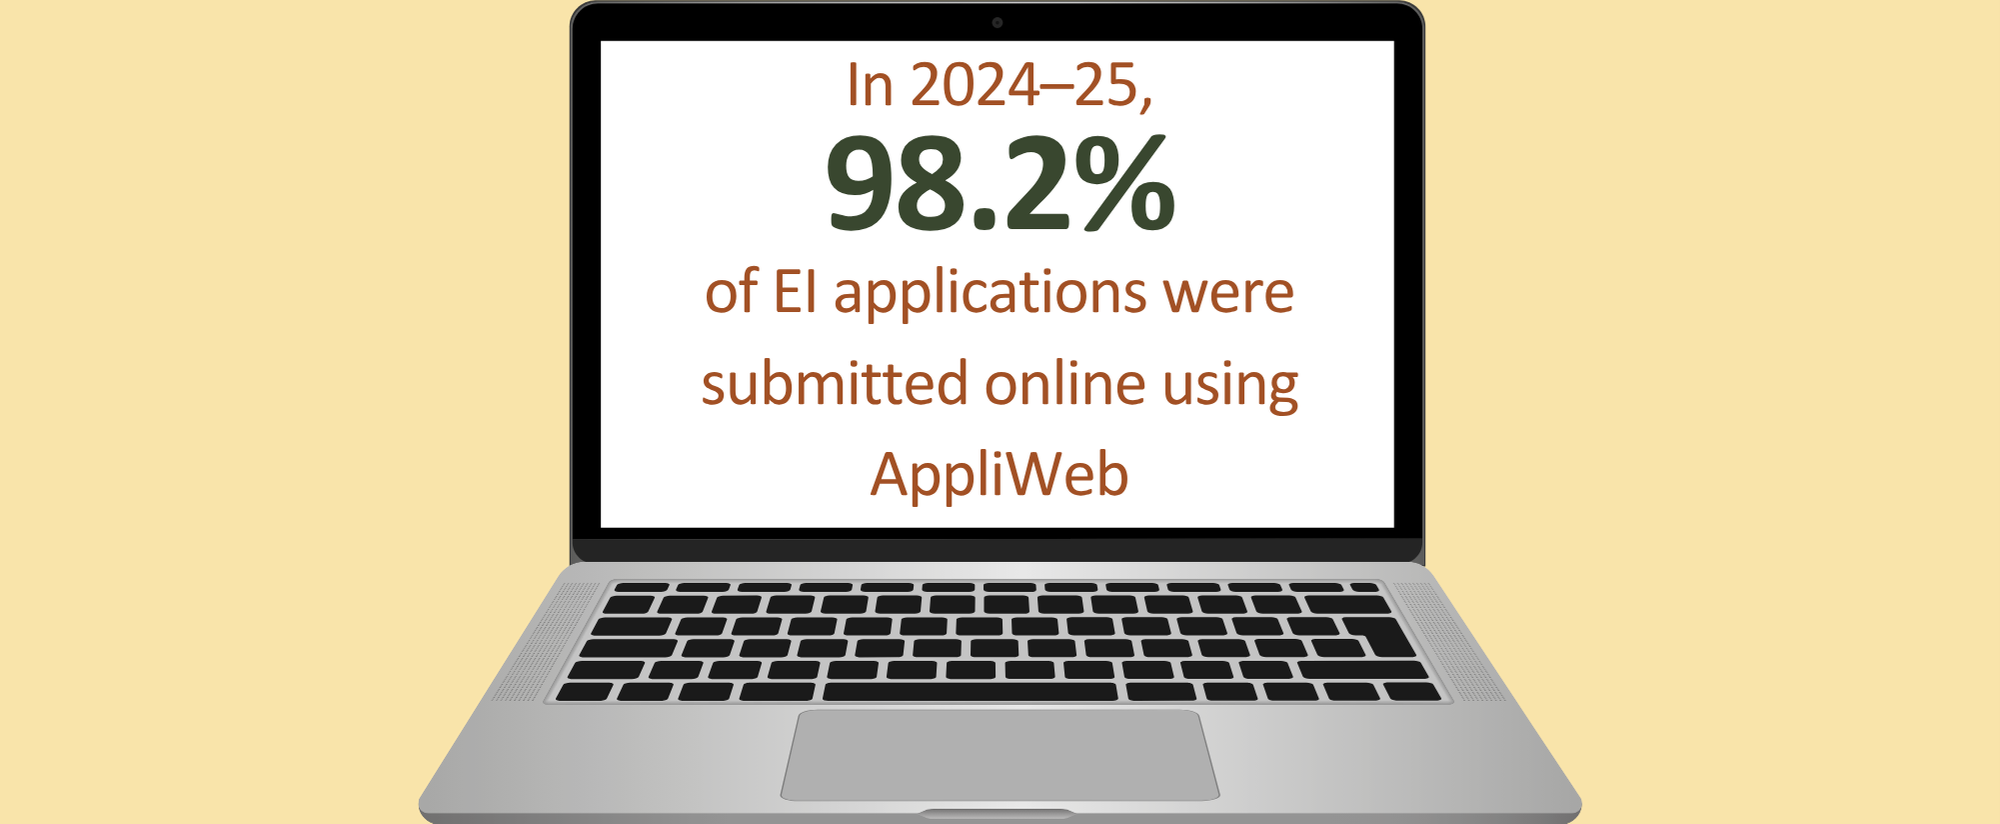
Text description
In 2024-25, 98.2% of EI applications were submitted online using AppliWeb
For more on AppliWeb, consult Annex 4.3.3a.
Electronic reporting
Every 2 weeks, claimants must complete EI reports and provide responses to a series of questions. Their answers confirm their ongoing entitlement to benefits.
Electronic reports can be completed using the telephone reporting service or the internet reporting service. While both services are simple, secure, and always available, the internet reporting service offers additional electronic questionnaires. Instead of having to contact the call centre, claimants are prompted to provide supplemental information directly in their online reports. The information is instantly transferred to their EI file and may result in faster payment processing for claimants.
In 2024-25, the internet reporting service remained the preferred reporting method for EI at 86.8%. The remaining 13.2% of reports were completed by telephone.

Text description
| Fiscal year | 2020-21 | 2021-22 | 2022-23 | 2023-24 | 2024-25 |
|---|---|---|---|---|---|
| Percentage of EI reports completed online | 90.7 | 86.6 | 84.7 | 85.9 | 86.8 |
| Percentage of EI reports completed on the phone | 9.3 | 13.4 | 15.3 | 14.1 | 13.2 |
My Service Canada Account
My Service Canada Account (MSCA) is a secure online portal that can be accessed through Canada.ca and is available 24 hours a day, 7 days a week. This portal contributes to Service Canada’s ability to deliver accessible, accurate, and timely services. MSCA allows users to view and update their information for EI as well as for other government programs.
Using MSCA, EI claimants can:
- check the status of their claims and transactions, including payment information
- receive information from Service Canada about their EI claim
- view previous EI claim information
- view and print their T4E tax slip and their electronic records of employment
- upload supporting documents for their EI claim and also view and print their uploaded documents
- view and print an electronic copy of many of the EI decision letters sent to them by mail
The EI services on MSCA are promoted through Canada.ca, on AppliWeb, via the EI Call Centre, and in communications sent to claimants.
For more information on MSCA, consult Annexes 4.3.3b–c.
Enhancement of document upload for EI claimants
Every year, the EI program receives millions of paper documents, by mail or in person, at Service Canada Centres. Staff must manually sort and enter these documents into EI files.
Since 2021, claimants can electronically submit supporting documents directly to their EI files using AppliWeb or MSCA. The document upload tool:
- is a simpler and faster alternative for claimants
- allows documents to be immediately viewable in the file without manual intervention from staff

Text description
Documents accepted electronically for EI
- Medical documentation
- Proof of employment
- Proof of authorization to work in Canada
- Proof of identity
- Documentation related to pregnancy, parental leave, and preventive withdrawal
- Teaching and self-employment documentation
- Third-party authorization
Claimants can upload supporting documents directly to AppliWeb when submitting an EI application online. They can also upload other documents requested at any time using MSCA.
| Fiscal year | 2022-23 | 2023-24 | 2024-25 |
|---|---|---|---|
| Number of claimants who have used Document Upload (AppliWeb, MSCA) * | 510,043 | 612,130 | 546,703 |
- * Erratum: The numbers of "claimants who have used Document Upload" and "documents uploaded" provided in the 2023-24 EI Monitoring and Assessment Report mistakenly included uploads made internally through another EI processing system.
On March 16, 2024, the AppliWeb instructions were updated to clarify when claimants need to provide supporting documents for their claim (such as medical certificates). This update aimed to reduce the number of unnecessary documents being uploaded which causes additional work. In 2024-25, the number of documents uploaded to AppliWeb decreased by over 30%.
| Fiscal year | 2022-23 | 2023-24 | 2024-25 |
|---|---|---|---|
| Number of documents uploaded to AppliWeb | 360,496 | 426,307 | 295,100 |
| Number of documents uploaded to MSCA | 610,811 | 798,808 | 917,119 |
Online Security
After its launch in 2020-21, multi-factor authentication was made mandatory for all MSCA users in 2021-22. This security measure remains in place in 2024-25 and continues to help to protect users’ personal information and prevent unauthorized access to MSCA.
Online accessibility
In 2024-25, ESDC continues to provide online standards using the Web Content Accessibility Guidelines (WCAG) 2.1 for Web accessibility, this includes:
- top-level AAA features for Accessibility Standards on the web
- continuous work with the blind and visually impaired community on improvements to the Job Bank mobile app
- voice-based services as an assistive technology
- publishing voice-ready content onto Canada.ca
- search engine optimization for voice content
4.3.4 Client Experience Survey 2024-25
The 2024-25 results from Service Canada’s Annual Client Experience Survey are unavailable, as the survey was deferred due to the government-wide suspension of all Public Opinion Research projects during the 2025 Federal Election (covering March 23 to May 13, 2025), as well as the implementation of additional security processes by Public Services and Procurement Canada (PSPC). The client experience data will be released in the subsequent report covering fiscal year 2025-26.
4.4 Application intake and claim processing
In this section
4.4.1 Employer intake
Records of employment
Records of employment (ROEs) are electronic or paper forms issued by employers to provide information on an employee's work history. ROEs are at the core of EI processing. When claimants submit EI applications, Service Canada uses the ROEs to:
- determine eligibility for benefits
- calculate the benefit rate
- calculate the number of weeks of entitlement to benefits
In 2024-25, over one-third of ROEs submitted were used to establish a claim for EI benefits.
Employers and payroll service providers play a crucial role in EI claim processing. To avoid delays in the payment of EI benefits, employers must complete ROEs in a timely and correct manner.
Missing, late, or incorrect ROEs require officers to take additional steps to obtain employment information through other means and to process claims. As a result, this can affect payments to eligible claimants.
Impact of delivery of records of employment on claim processing
A departmental study completed in 2025* investigated delays in the submission of records of employment (ROEs) by employers between 2017 and 2024. The study examined compliance with regulatory requirements** and the impact of non-compliance on the administration of the EI program.
The results showed that employers complied with prescribed submission deadlines, with 62.11% of ROEs submitted on time. Service Canada's service standard*** is to provide EI applicants with a decision within 28 calendar days of their application for benefits. If a required ROE is missing, the claimant is informed after this 28-day period that the EI claim cannot be established. The study noted that most ROEs were submitted before they caused significant complications in claims processing or difficulties for EI claimants because they were submitted within the 28-day period.
The study found that 2.38% of ROEs used on claims were late enough to significantly affect the regular claim process. Many existing EI procedures, such as the creation of an interim ROE when claimants can provide evidence of insurable hours and earnings, mitigated the consequences of the delay on claimants. On average, there were 68,500 cases per year requiring a Service Canada officer’s intervention relating to a missing or late ROE. Of these, 7.67% were escalated to the Integrity Services Branch (ISB) for further attention.
One of the main factors contributing to the late submission of ROEs was the circumstances surrounding the employee's termination, particularly when these circumstances were unclear to the employer. Among the reasons for separation that had an impact on the timeliness of ROE submission, strike or lockout, leave of absence, illness or injury, and voluntary leaving had the most significant influence.
The study also revealed that small firms were more likely to submit ROEs on time than large firms, with a compliance rate of 92.25%. In addition, industries where work is seasonal, such as agriculture, forestry, fishing and hunting, were also more likely to submit ROEs on time, meeting regulatory requirements at 97.76%.
- * ESDC, Impact of Delivery of Records of Employment on Claim Processing (Ottawa: ESDC, Integrated Workload Workforce Management Branch, Integrated Services Strategy and Operations [ISSO], 2025).
- ** For employers who pay their employees weekly, biweekly, or semi-monthly, the deadline for submitting an ROE electronically is 5 calendar days after the end of the pay period. For those with monthly pay periods or pay periods occurring every 4 weeks, the deadline is the earlier of: either 5 calendar days after the end of the pay period or 15 calendar days after the first day of an interruption of earnings. For more information, consult Employers: How to complete the record of employment (ROE) form - Canada.ca.
- *** Consult section 4.1.4.
In 2024-25, employers issued nearly 12 million records of employment. Of these, 98.2% were issued electronically (on par with the 98.1% issued electronically in 2023-24).
For more on electronic versus paper ROE distribution, consult Annex 4.4.1a.
Electronic records of employment
Service Canada encourages employers to issue electronic records of employment (eROEs) through the ROE Web application as it offers many advantages, including:
- no need for employers to order, fill, and send paper ROEs
- no need for employees to provide their paper ROEs to Service Canada
- instant transfer of information to EI files
- reduction of errors from the manual input of paper ROEs
In 2024-25, 42,450 employers registered for ROE Web, maintaining strong engagement comparable to 42,559 in 2023-24. By the end of 2024-25, total employer registrations reached 607,677, up from 577,532 the previous year. Since 2022-23, more than 98% of ROEs are issued electronically, demonstrating widespread adoption of ROE Web among employers and the ongoing shift toward efficient digital service delivery.
For more on eROEs, consult Annexes 4.4.1b–c.
Artificial intelligence to review records of employment
When issuing ROEs for their employees, many employers include text comments to provide additional information. When screening the ROEs, the claim automation process stops when these added comments are detected. Staff must then review and process the comments manually.
In 2020, Service Canada started using an AI model to process employer comments on ROEs. The AI model reduces the need for human intervention and supports claim processing automation.
| Fiscal year | 2020-21 | 2021-22 | 2022-23 | 2023-24 | 2024-25 |
|---|---|---|---|---|---|
| Number of ROEs with comments issued (rounded to the nearest ten thousand) | 1,250,000 | 1,300,000 | 910,000 | 670,000 | 920,000 |
| % processed by AI | 47.9% | 34.5% | 33.7% | 48.9% | 51.3% |
The AI model is updated periodically to ensure it operates effectively. Its most recent version was implemented in January 2024. In 2024-25, the use of the AI model led to a reduction of 30.7% in the number of work itemsFootnote 9 that otherwise would have required processing by EI officers. The AI model achieved an accuracy rate of 99.6%Footnote 10 in 2024-25.
4.4.2 Claimant application intake and processing
A national network of officers manages the intake and processing of EI claims,Footnote 11 reviewing and making decisions on applications with the support of EI processing systems. These systems streamline claim processing, automate routine tasks, and optimize workload management, enabling faster and more accurate service delivery to claimants.
EI applications received
In 2024-25, 3,199,282 EI applications were received, compared to 3,098,520 in 2023-24, an increase of over 3%.
Claims processed
In 2024-25, the Department processed 3,202,029 EI claims,Footnote 12 compared to 3,134,638 in 2023-24.

Text description
| Fiscal year | 2020-21 | 2021-22 | 2022-23 | 2023-24 | 2024-25 |
|---|---|---|---|---|---|
| EI applications received | 6,801,926 | 3,512,858 | 2,904,173 | 3,098,520 | 3,199,282 |
| EI applications processed | 7,958,457 | 3,387,201 | 2,975,644 | 3,134,638 | 3,202,029 |
ESDC aims to issue EI benefit payments or non-benefit notifications within 28 calendar days of filing an application for benefits 80% of the time. The COVID-19 pandemic caused a significant increase in EI applications. Amendments to the Employment Insurance Act and simplified temporary measures had increased claim automation, speeding up processing times. In 2022-23, after the simplified temporary measures ended, the automation of claims processing was reduced, and claim inventories increased. In 2023-24, effective workload management helped bring claim inventories down to sustainable levels, which significantly improved EI speed of payment. By building on this progress, the number of older claims continued to decrease in 2024-25, and the EI speed of payment improved even more.
| Fiscal year | 28 days | 29 to 35 days | 36 to 42 days | 43 to 49 days | 50+ days |
|---|---|---|---|---|---|
| 2021-22 | 85.4% | 4.8% | 2.7% | 2.0% | 5.1% |
| 2022-23 | 76.2% | 5.0% | 3.5% | 3.2% | 12.0% |
| 2023-24 | 86.4% | 5.7% | 2.8% | 1.9% | 3.2% |
| 2024-25 | 87.4% | 5.8% | 2.7% | 1.8% | 2.4% |
For more on claims processed, speed of payment and claims automated, consult Annexes 4.4.2a–c.
Inventory reduction strategies
Claims pending review
Service Canada regularly receives new information regarding EI claims that have already been processed. Officers then review the information and determine if the claims require any changes. Due to increased claim volumes during the COVID-19 pandemic, the Department focused on processing new claims to ensure claimants were receiving timely benefits. As a result, fewer officers had been assigned to the processing of claims pending review, significantly increasing inventories in 2021-22 and 2022-23.
Managing claims pending review is challenging. These claims are more complex to process, require fully trained and highly experienced staff, and offer few possibilities for automation.
In 2022-23, the Department implemented a multi-year strategy to reduce the inventory of claims pending review to a sustainable level and to improve its capacity to meet service standards. Building on the progress made on workforce productivity and efficient workload management during the first 2 years of the strategy, the Department achieved its goal of returning to targeted sustainable inventory levels in 2024-25.
| Year and key priority | Strategies | Results |
|---|---|---|
| Year 1 (2022-23): Rebuilding the workforce |
|
Increased productive capacity of the workforce |
| Year 2 (2023-24): Improving inventory levels |
|
The inventory of claims pending review reduced by half between March 31, 2023, and March 31, 2024 |
| Year 3 (2024-25): Stabilizing workload and workforce |
|
Sustainable claims inventory targets achieved as planned |
- * A work item is a task to be completed by an EI officer on a claim. There may be several work items associated with a single EI claim.
Now that the workload has returned to manageable levels and most officers are skilled and trained to handle most tasks related to EI claims, the Department is better prepared to respond quickly to client needs and meet service standards.
Hiring and training
After 2 years of hiring new officers for EI processing and providing intensive training as part of the multi-year strategy, 2024-25 was a year for stabilizing the workforce:
- no new officers were hired
- attrition and turnover rates continued to decline
- the proportion of experienced officers continued to increase

Text description
| Date | On March 31, 2021 | On March 31, 2022 | On March 31, 2023 | On March 31, 2024 | On March 31, 2025 |
|---|---|---|---|---|---|
| 0–12 months of EI experience | 887 (28.0%) | 1,414 (45.1%) | 2,160 (50.0%) | 1,015 (23.7%) | 511 (12.7%) |
| More than 12 months of EI experience | 2,281 (72.0%) | 1,728 (54.9%) | 2,160 (50.0%) | 3,266 (78.3%) | 3,507 (87.3%) |
The training program for EI processing officers is comprised of multiple modules staggered over time. The format is designed to:
- manage efficient onboarding and training of officers
- remain flexible in the face of legislative changes
- support managers’ plans for future hiring needs
New officers must go through extensive training, and it takes up to 2 years before they are able to perform all the duties of an EI processing officer. The number of EI officers trained to process complex claims pending review tripled within 2 years, from 681 on March 31, 2023, to 2,038 on March 31, 2025.
Integrated Workload and Workforce
ESDC continues to advance integrated workload strategies and initiatives that optimize the workforce and improve service delivery. In 2022-23, the Department implemented the Integrated Workload and Workforce (IWW) model. This model includes initiatives that integrate the work of call centre and processing officers to better plan and manage workload peaks.
Within the IWW model, officers are assigned where they are needed most: answering the phone during busy periods or processing EI claims. Officers are trained to provide both call-taking and processing activities, enabling them to complete more work on behalf of the claimant and increasing first-contact resolution. IWW initiatives lead to more efficient services for claimants.
| Fiscal year | 2023-24 | 2024-25 |
|---|---|---|
| Number of calls answered | 189,709 | 282,721 |
| Number of work items* completed | 209,745 | 543,305 |
- * A work item is a task to be completed by an EI officer on a claim. There may be several work items associated with a single EI claim.
In 2024-25, additional officers were trained and upskilled as part of the IWW model, increasing the workforce capable of handling both calls and processing related activities.
4.5 Service quality and integrity
In this section
- 4.5.1 Employment Insurance Payment Accuracy Program
- 4.5.2 Processing Excellence, Accuracy and Quality Program
- 4.5.3 Quality Assurance
- 4.5.4 Compliance investigations
- 4.5.5 Evolution of Integrity in the Department
Canadians rightly expect strong stewardship and accountability from the Employment Insurance (EI) program. To meet these expectations, Service Canada has implemented a robust framework of preventative measures and control activities designed to avoid, detect, and manage errors—both during the processing of claims and while clients are receiving benefits. These efforts ensure that payments are accurate and timely, while also enhancing the overall quality of EI services, reinforcing the integrity of ESDC programs, and demonstrating responsible and transparent use of public resources.
Examples of preventative activities completed by staff during the establishment of the claims include but are not limited to:
- correction of records of employment (ROEs) by processing staff to ensure that the entitlement amounts are accurate
- validation of reasons for separation to confirm claimant eligibility
- review of documents that have been submitted by the client to ensure all relevant information is considered
- communication with clients and/or employers to resolve any discrepancies and ensure accurate information is collected
- verifying procedures to ensure accuracy in the decisions made regarding claims
Similarly, as part of its commitment to service excellence, ESDC has a strong quality management framework to ensure EI claimants receive the benefits they’re entitled to. This framework includes:
- quality control programs including the EI Payment Accuracy Review (PAAR) program as well as the Processing, Excellence Accuracy and Quality (PEAQ) program that provide feedback to staff and help identify issues after claims are processed
- quality assurance activities developed in collaboration with the EI quality council that use insights from the quality control programs to prevent errors before they occur
4.5.1 Employment Insurance Payment Accuracy Program
The EI Payment Accuracy Review (PAAR) program aims to assess the accuracy of EI benefit payments by conducting quality reviews on statistically valid random samples of EI accounts. Through this process, the department provides estimates of annualized monetary errors and payment accuracy rates in the EI program.
EI Payment Accuracy Review sample
Throughout fiscal year 2024-25, the EI PAAR sample was drawn monthly using a stratified Simple Random Sampling (SRS) method. A total of 504 files were reviewed between April 2024 and March 2025, and the results were aggregated to generate statistically valid estimates.
EI Payment Accuracy Review results
The ESDC payment accuracy service standard for EI is set at 95%. Errors identified through the EI PAAR program are categorized by source and include errors made by claimants, employers, and Service Canada processing staff. In 2024-25, the EI PAAR accuracy rate was estimated at 93.3%, remaining below the 95% target, as has been the case for the past three fiscal years.
| Fiscal year | 2020-21 | 2021-22 | 2022-23 | 2023-24 | 2024-25 |
|---|---|---|---|---|---|
| Total EI benefit payout | 31.0B | 37.8B | 20.0B | 21.4B | 23.8B |
| EI payment accuracy rate | 96.1% | 94.0% | 94.5% | 93.8% | 93.3% |
Error rates

Text description
| Fiscal year | 2020-21 | 2021-22 | 2022-23 | 2023-24 | 2024-25 |
|---|---|---|---|---|---|
| Claimant error rate | 2.3% | 4.2% | 2.7% | 2.4% | 3.8% |
| Employer error rate | 0.9% | 0.6% | 1.0% | 1.2% | 0.6% |
| Service Canada error rate | 0.8% | 1.1% | 1.8% | 2.2% | 2.3% |
- Note: PAAR sampling methodology has undergone important changes in recent years. Prior to 2021-22, Monetary Unit Sampling (MUS) was used. In 2021-22, the methodology was combination of MUS and SRS due to a transitional period. From 2022-23 onward, the methodology fully transitioned to SRS. Therefore, caution is advised when conducting year-over-year comparisons or analyzing disaggregated results, due to changes in sampling approach and sample size
- Correction: Due to a data collection error, last year’s Report indicated that the 2023-24 Service Canada error rate was 2.2%. This has been corrected to reflect 2.6%.
| Errors by sources | Estimated financial impact ($M) 2023-24 | Estimated error rate 2023-24 | Estimated financial impact ($M) 2024-25 | Estimated error rate 2024-25 |
|---|---|---|---|---|
| Claimant | $512.3 | 2.4% | $915.4 | 3.8% |
| Employer | $259.9 | 1.2% | $134.1 | 0.6% |
| ESDC | $552.7 | 2.6% | $547.4 | 2.3% |
| Total | $1.32B | 6.2% | $1.6B | 6.7% |
- Correction: Due to a data collection error, last year’s Report included incorrect information for the 2023-24 ESDC and total financial impact and error rates. These figures have been corrected above.
Claimant error rate
This fiscal year, the monetary impact of claimant errors was estimated at 3.8% of total EI payout. While a small number of the errors identified were based on information available to the department when the claim was initially established, most claimant errors were identified through additional fact-finding completed by the Quality Services team and occurred while the claimant was in receipt of benefits.
These errors typically involve clients incorrectly reporting earnings while in receipt of benefits, or failing to declare the refusal of a job, quitting a job, or being dismissed from a job. Service Canada remains actively engaged in exploring strategies to identify ways to reduce the frequency of these issues.
Employer error rate
Employer errors were estimated to account for 0.6% of total EI payout in 2024-25. These errors typically result from incorrect information reported by the employer on the ROE, such as the number of hours worked, insured earnings, or dates of employment. Such inaccuracies can lead to incorrect claim start dates or miscalculations of entitlement weeks and benefit rates.
To identify employer errors, PAAR reviewers validate all ROEs used to establish claims of files included in the EI PAAR sample with the employers. Electronic ROEs reduce the occurrence of errors and represent approximately 98% of the ROEs validated through the PAAR process. The department continues to analyze employer errors to better understand their causes, assess their financial impact, and explore ways to prevent them.
Service Canada error rate
Errors attributed to Service Canada processing staff were estimated to account for 2.3% of total EI payout in 2024-25. While the types of Service Canada errors vary from year to year, two consistently recurring errors have been identified in the EI PAAR:
- failing to obtain additional information from the employer or the client when the information provided is missing or unclear
- non-compliance—these are situations where the decision does not comply with the EI Act, Regulations, and operational policies
The EI Quality Council is actively engaged with its EI partners, working to implement solutions that improve policies, procedures, and tools, with the goal of effectively mitigating the error rate.
4.5.2 Processing Excellence, Accuracy and Quality program
The EI Processing Excellence, Accuracy and Quality (PEAQ) program was launched in May 2022. Through the PEAQ program, ESDC provides meaningful feedback to employees and their management on the employee’s ability to accurately apply legislation, policies, and procedures in the processing of core program files. PEAQ was created by merging the Individual Quality Feedback (IQF) and the Processing Accuracy Review (PRAR) programs to improve efficiency and cost-effectiveness of quality monitoring activities, while contributing to ongoing commitment to refining processes and maintaining high standards in program file processing.
PEAQ results are shared quarterly with management and the EI Quality Council committee offering valuable business intelligence on issues affecting payment and processing accuracy and supporting the organization in its cycle of continuous improvement.
PEAQ review sample
PEAQ reviews for EI were initiated in May 2022. The files chosen for reviews are selected through a random sampling method. During the 2024-25 fiscal year, the organization committed to reviewing a certain number of assigned files per person for all processing staff. This resulted in a total of 43,641 files reviewed for the year. The PEAQ results provide metrics on both files containing errors that affect client outcomes (payment, entitlement, or eligibility) as well as metrics for issues that do not comply with operational processes, but which do not affect the client directly.
PEAQ review results
The processing accuracy target for Service Canada’s PEAQ program (set at 80% as an industry standard target) was met in 2024-25 with a result of 81%. Specifically, as PEAQ reporting on errors includes both confirmed and potential errors, a minimum of 80% of the files reviewed did not contain any issues that would affect client outcomes. PEAQ Quality Services collaborates closely with business experts to ensure consistency and accuracy. Additionally, PEAQ provides valuable insights into processing issues that, while not directly affecting clients, enable Service Canada to identify areas for improvement and enhance overall effectiveness and efficiency.
4.5.3 Quality assurance
In line with ESDC’s Enterprise Quality Framework—which promotes a consistent approach to quality across policy and service delivery—an EI Quality Council was established in late 2022-23. This council brings together executive leaders responsible for training, policy, procedures, tools, and quality.
The Council meets at least quarterly to review the latest data on payment and processing accuracy and to lead initiatives that address recurring errors.
In 2024-25, the Council endorsed a comprehensive quality management plan with 21 targeted activities to improve accuracy. Key initiatives include:
- specialized training for staff on fact-finding and identifying complex issues
- quarterly newsletters for processing staff highlighting common errors and how to avoid them
- a workshop for employers, developed with the Canadian Payroll Institute, to reduce employer-related errors
- collaboration with ESDC’s Client Experience team to improve claimant-facing materials and reduce client errors
It is expected that the effects of these activities on payment and processing accuracy results should become observable as early as the 2025-26 fiscal year.
4.5.4 Compliance investigations
Integrity activities at ESDC focus primarily on detection, with the most significant of these activities being directed towards compliance investigations. These are intended to confirm whether claimants meet eligibility requirements and to recover overpayments from ineligible claimants. The Department uses a variety of tools and processes to help identify and address instances of error, abuse, and fraud. During 2024-25 ESDC conducted over 162,000 compliance investigations relating to the EI program. This is a slight decrease compared to the 174,000 conducted in 2023-24. Typically, compliance investigations uncover instances of intentional errors by claimants related to undeclared work and earnings.
The most common types of intentional errors and abuses by claimants include:
- failing to report employment, earnings, or self-employment income
- not declaring periods of unavailability for work
- misrepresenting the reason for job separation
- failing to report absences from Canada
- receiving sickness benefits without having the required medical certificate
Compliance investigations generate significant savings for the EI Operating Account. In 2024-25, savings of $453.6 million were generated (consult chart 6, below), compared with $351.4 million in 2023-24.

Text description
| Fiscal year | 2020-21 | 2021-22 | 2022-23 | 2023-24 | 2024-25 |
|---|---|---|---|---|---|
| West | 18.3 | 26.7 | 42.7 | 108.3 | 163.4 |
| Quebec | 14.8 | 16.6 | 23.5 | 83.9 | 125.1 |
| Ontario | 13.2 | 18.2 | 59.9 | 93.1 | 93.3 |
| Atlantic | 9.1 | 13.3 | 15.9 | 47.0 | 51.4 |
| National Investigative Services | 0.6 | 5.9 | 9.6 | 19.2 | 20.4 |
- * NIS: National Investigative Services (NIS). Cases dealing with unreported absences from Canada while on EI and the Report on Hiring program are centrally managed through Integrity's NIS centre in Miramichi, New Brunswick.
- ** Note: The numbers ($M) have been rounded to the nearest hundred thousand. The national amounts were calculated using the raw data.
The savings amount reflects a combination of overpayments and penalties. These efforts benefit both employee and employer payers of EI premiums as the savings reduce the overall cost of the EI program when overpayments are recovered.
ESDC uses several methods to recover funds from EI claimants who have been overpaid, including:
- the automatic recovery of monies from active EI benefit claims (either the full amount or an agreed upon partial deduction)
- voluntary cash payments, or the collection of debts by the CRA through an agreed upon repayment schedule
- tax offsetsFootnote 13
Risk-based management
ESDC uses various risk-based strategies to improve the overall integrity of the EI program and to ensure resources are directed to higher-risk cases. These cases have an increased probability of payment errors, misrepresentation, abuse, or fraud. Detecting and flagging potential issues with higher-risk cases in the early stages of the benefit life cycle allows the Department to allocate integrity resources to high priority investigation activities.
Generally, the number of EI compliance investigations that are conducted annually is in line with the number of cases that are considered high-risk. However, in any given year, the volume might vary based on the changing nature and significance of identified risks.
ESDC also has a risk analysis function to assess program integrity risks and to understand better the root cause of “mispayments.” This function includes developing appropriate mitigation strategies, which may involve implementing more controls, to address any identified vulnerabilities.
4.5.5 Evolution of integrity in the Department
ESDC is undergoing a significant transformation in how it approaches program integrity. Central to this evolution is the adoption of Integrity-by-Design (IBD)—a proactive, prevention-focused framework that embeds integrity measures directly into the design and delivery of programs and services. This approach ensures that risks are mitigated before they materialize, reducing the need for costly investigations and improving the overall client experience.
Modernization initiatives such as Benefits Delivery Modernization (BDM) and the integration of advanced data analytics are enabling ESDC to shift from a reactive “post-payment verification” model to a prevention-based regime. This transformation supports the Department’s commitment to responsible stewardship of public funds and ensures that benefits are delivered accurately, securely, and consistently.
Integrity quality initiatives: Enhancing consistency and accountability
To support this evolution, ESDC has implemented a National Quality Management Program that ensures consistency and excellence across investigative activities. The program includes in-depth quality monitoring to assess performance and identify areas for improvement. Corrective measures stemming from these reviews include:
- updates to training materials
- national procedural changes
- policy and system enhancements
These initiatives contribute to a culture of continuous improvement and help align operational practices with evolving integrity standards.
Proactive fraud detection and prevention
Fraudulent attempts to access EI benefits, including identity theft, remain a persistent threat. ESDC has responded by strengthening its fraud management framework through the development of two distinct but complementary teams:
- the specialized fraud team, composed of data analysts, focuses on prevention
- Using advanced data analytics and intelligence tools, this team identifies anomalous patterns and potential vulnerabilities in real time
- Their work enables the Department to implement stop-pay measures before payments are issued, effectively preventing fraud from occurring
- In 2024-25, these preventative measures resulted in savings of $28.8 million, representing funds that were never disbursed due to early intervention
- the enforcement team, responsible for investigating suspected fraud cases where criminal or penal liability may be involved
- These investigations are conducted in collaboration with law enforcement agencies and may lead to prosecution
- Enforcement activities are reserved for the most serious cases and are supported by judicially authorized tools under the Criminal Code
Together, these teams form a robust fraud management strategy that balances proactive prevention with responsive enforcement.
ESDC maintains strong partnerships with the Canadian Anti-Fraud Centre, law enforcement agencies, and financial institutions to address fraud comprehensively. These collaborations enhance the Department’s ability to detect, investigate, and respond to fraudulent activity across the EI program.
Modernizing identity management to support integrity
Accurate identity verification is foundational to program integrity. The Social Insurance Register (SIR) plays a critical role in validating claimant identities during EI application and processing. The Social Insurance Number (SIN) program ensures the accuracy of SIR data through strict identity and quality management practices aligned with the updated ESDC Identity Management Policy Suite.
In 2024-25, approximately 11.1 million real-time identity validations were conducted, enabling secure and efficient online EI applications. These efforts reduce the risk of critical errors and ensure that benefits are issued to the correct individuals, reinforcing the Department’s preventative integrity framework.
Employment Insurance Emergency Response Benefit
During the COVID-19 pandemic, the Government of Canada pivoted quickly to provide access to income support to millions of individuals using an attestation-based approach to the EI Emergency Response Benefit (EI ERB). The attestation approach was balanced by a risk-based integrity framework focused on fraud detection, prevention measures, and post-payment verification of claimant's eligibility.
As per its multi-year operational plan (2021-22 to 2024-25), in 2024-25 the Department successfully fulfilled its commitment to complete 157,000 EI ERB post-payment verifications by March 31, 2025. These verifications were conducted to confirm that claimants met eligibility requirements and to identify and recover any ineligible payments.
During the 2024-25 fiscal year, 73,454 verifications were completed and approximately $166.6 million in savings were identified.
This marks the completion of ESDC’s 4-year EI ERB post-payment verification plan. Since the 2021-22 fiscal year, the Department has conducted over 164,000 verifications, resulting in estimated savings of $456.8 million. Recovery efforts for ineligible payments will continue into 2025-26 and beyond.
In addition, ESDC undertook reconciliation activities to recover the advance payment of $2,000 issued to EI ERB recipients immediately upon the establishment of their claim. Overpayments arose because of recipients becoming ineligible for EI ERB after establishing their claim but before their payments could be stopped or reconciled. In 2024-25, ESDC was able to recover $221 million.
This accomplishment highlights the Department’s dedication to program integrity, accountability, and sound financial stewardship.
4.6 Recourse
In this section
4.6.1 Employment Insurance requests for reconsideration
If claimants or employers disagree with an EI claim decision, they have the right to ask Service Canada to reconsider the decision. A request for reconsideration provides clients with the opportunity to submit new or additional information and to have the decision reviewed. Consult chart 7, below, for the EI issues most frequently requested for reconsideration.

Text description
| Issue | Percentage |
|---|---|
| Voluntary leaving | 22% |
| Availability to work | 13% |
| EI claims that were not established | 9% |
| EI Emergency Response Benefit (EI ERB) | 9% |
| Misconduct | 7% |
| Other issues | 40% |
A reconsideration is never done by the officer who made the first decision. A different officer considers all the information on file, as well as the legislation and policies that apply. Following the review, the first decision is either kept, reversed, or changed. Once the review is completed, Service Canada informs the client of the outcome.Footnote 14
In 2024-25, the percentage of reversed or changed decisions as a result of reconsideration was similar to that of the previous 3 years.

Text description
| Fiscal year | 2020-21 | 2021-22 | 2022-23 | 2023-24 | 2024-25 |
|---|---|---|---|---|---|
| Percentage of initial decisions reversed or changed | 52.5% | 47.8% | 45.3% | 45.7% | 47.9% |
ESDC aims to complete requests for reconsideration within 30 days of the request being received 80% of the time. Before the COVID-19 pandemic, Service Canada received an average of 50,000 requests for reconsideration each year. In 2022-23, this number more than doubled to 110,000 requests,Footnote 15 mainly related to decisions on the EI Emergency Response Benefit (EI ERB).Footnote 16 In 2023-24 and 2024-25, the number of requests received per year decreased to 70,000, however, the speed of service result has not met the target.
| Year | 2021-22 | 2022-23 | 2023-24 | 2024-25 |
|---|---|---|---|---|
| Results of the service standard Finalize EI requests for reconsideration decisions within 30 days of the request being received 80% of the time | 83.7% | 33.8% | 53.1% | 25.3% |
The performance decline between 2023-24 and 2024-25 is mainly due to a growing request for reconsideration inventory caused by:
- the existing inventory of overdue requests at the start of the year
- the additional requests received after processing more EI claims as part of the Multi-year Strategy to put claimants into payFootnote 17
- EI ERB-related requests for reconsideration that continued to come in, further impacting service delivery
The average time to complete a request for reconsideration increased from 61 to 119 days between 2023-24 and 2024-25, mainly because of the complexity of EI ERB-related requests, which often involve multiple issues. When considering only non-EI ERB-related requests, the average processing time drops to 52 days in 2024-25.
As Service Canada continues to prioritize service excellence and deliver timely, client-focussed service, training and workload management strategies are being developed to address the growing inventory of requests for reconsideration. Service levels are expected to improve as the volume of pending requests stabilizes.
4.6.2 Employment Insurance appeals and the Social Security Tribunal of Canada
The Social Security Tribunal (SST) is an independent administrative tribunal that makes decisions on appeals related to government benefits and programs, including EI. Members appointed by the Governor in Council decide these appeals.
The SST is separate and independent from the CEIC and ESDC. The SST’s activities are funded by the EI Operating Account, the CPP Operating Account, and the Consolidated Revenue Fund for OAS cases.
The SST is divided into:
- the General Division, Employment Insurance Section
- the General Division, Income Security Section
- the Appeal Division
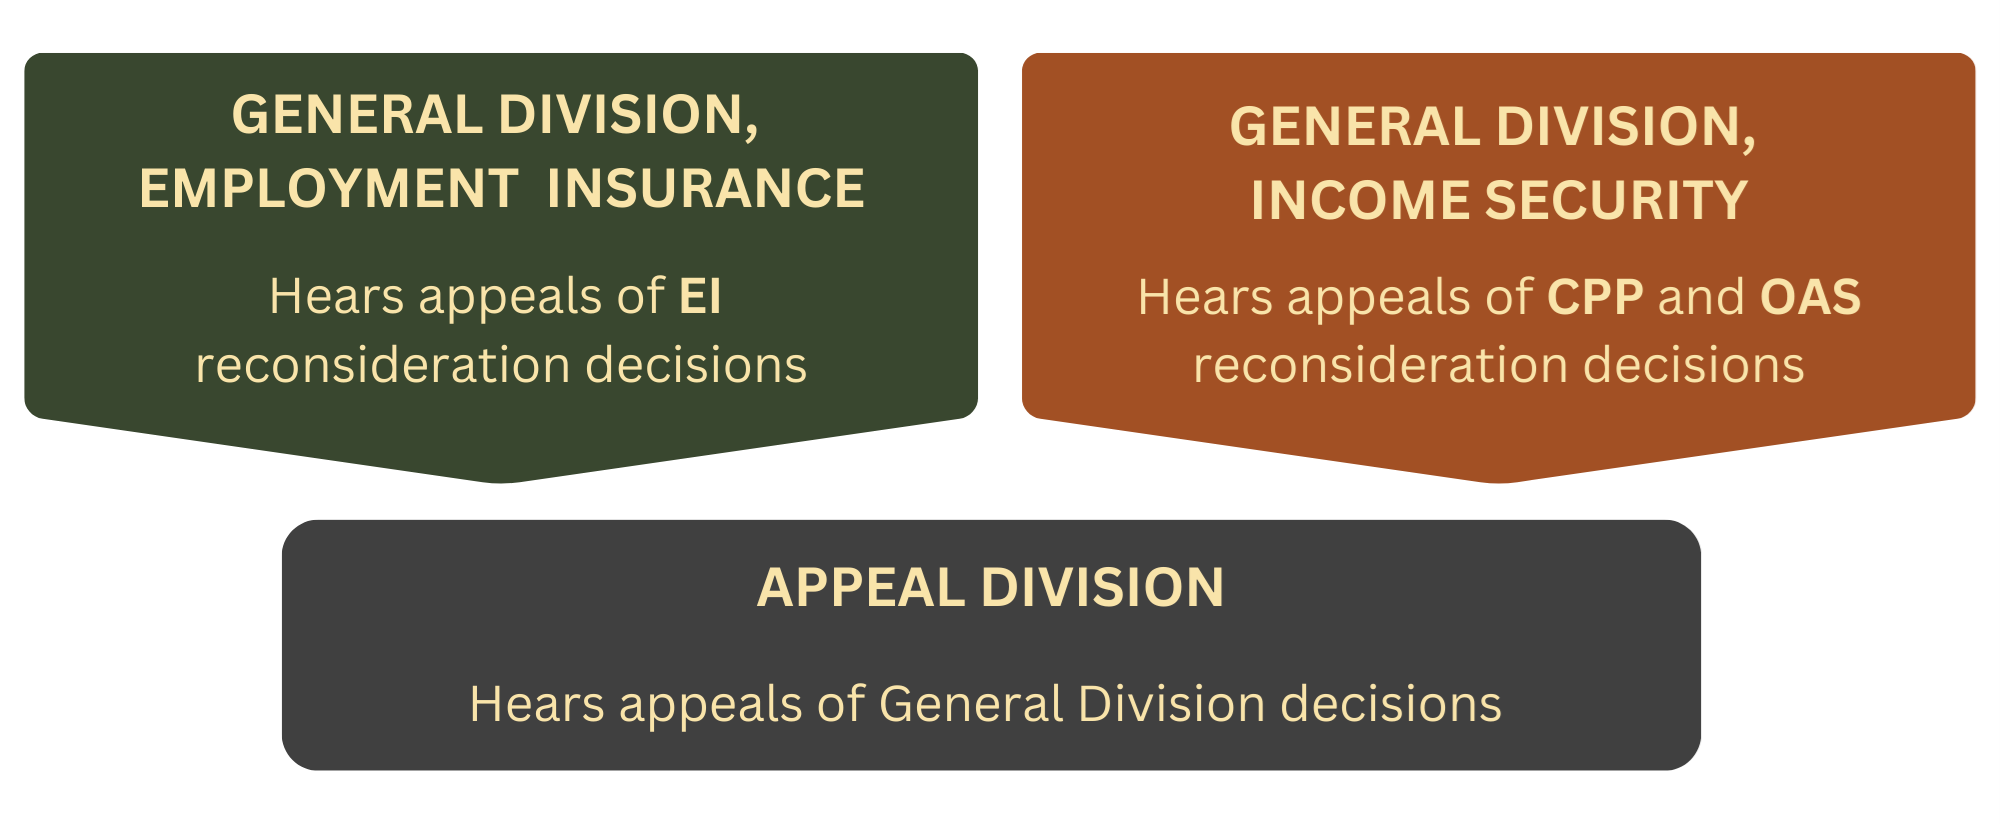
Text description
The General Division Employment Insurance hears appeals of EI reconsideration decisions. The General Division Income Security Hears appeals of CPP and OAS reconsideration decisions. The Appeal Division hears EI and Income Security appeals, based on restricted grounds, of General Division decisions.
The SST’s mandate is to provide the Canadian public with a user-centred appeal process that is simple, quick, and fair. As part of its efforts to continually improve its recourse process and access to justice, in 2024-25 the SST:
- developed a management response and action plan in response to the November 2023 End-User Interviews on the Navigator Service in the Appeal Division: final report. The action plan includes the launch of the Navigator Reinforcement Project. The Navigator Reinforcement Project reviews how the SST’s Navigator Service is adapting to claimant needs and the growing role of Navigators. Drawing on feedback from staff and stakeholders, it identifies strengths and gaps in service delivery and training, and informs improvements to make the service more responsive, accessible, and transparent
- created a new web page about finding decisions on similar cases. This page explains what each function in our online advanced search tool does, so parties can get the best results when looking for decisions to support their appeal
- created a new web page with information on how to use past decisions to help your appeal
- put in place a management response and action plan in response to the September 2023 Review of Decisions and Correspondence of the Social Security Tribunal (SST) for Accessible and Inclusive Language. Some of the steps that will be taken include:
- adopting alternative terminology
- updating our style guides and templates
- promoting inclusive writing internally
- improving guidance on the use of gender in French writing
- continued to gather data to better understand the people who use SST services. This data helps the SST to:
- expand interpretation services beyond hearings to navigator services for people who do not speak English or French
- explore ways to address digital barriers that make it harder for seniors, low-income individuals, and people in rural areas to participate fully in their appeal process
- identify more organizations that can help, recognizing that access to legal help and community services varies across provinces and territories, especially for newcomers and people who don’t speak an official language
- used stakeholder input from the Employment Insurance Appeals Consultative Committee and Income Security Appeals Consultative Committee to:
- design the process for Canada Disability Benefit appeals at the General Division and Appeal Division
- strengthen outreach efforts to better support appellants
At the beginning of 2024-25, the SST was still dealing with the effects of backlogs resulting from having had too few members to handle the volume of appeals in 2023-24. Over the course of the year, the SST continued to streamline processes for EI appeals and used new member capacity to eliminate the backlog. Due to these efforts, the SST was able to significantly reduce the inventory of EI files and make steady gains in meeting its service standards.
The SST’s Annual report for the 2024 to 2025 fiscal year: Putting people at the centre of our service includes more information on these initiatives, as well as statistics on the SST’s performance against service standards in the 2024-25 fiscal year.
SST: General Division, EI Section
After the CEIC makes a reconsideration decision, a claimant has 30 calendar days to appeal the decision to the SST’s General Division, EI Section.
On behalf of the CEIC, Service Canada provides the SST with the reconsideration file. The file includes all documents used in making the initial and reconsideration decisions. When requested, the CEIC will answer requests for more information from the SST. As a party to the appeal, the CEIC may attend appeal hearings.
Regular and group appeals
The SST manages and tracks EI appeals in 2 categories:
- regular appeals
- An appeal that is not a part of a group is considered a regular appeal
- group appeals
- Group appeals usually arise from a single employment situation that affects many people
- Group appeals are more complex and require more time to complete than regular appeals
Volume of appeals
In 2024-25, the General Division, EI section received 3,908 appeals (including 95 files that were part of group appeals) and concluded 4,272 appeals (including 135 files that were part of group appeals). This resulted in a decrease in inventory from 963 active appeals (including 134 files that were part of group appeals) in March 2024, to 599 active appeals (including 94 files that were part of group appeals) in March 2025. For more information, consult Annex 4.6.2a.
Service standards, performance, and appellant satisfaction
Experience surveys indicate that in 2024-25, overall satisfaction for EI appellants was at 91% (down from 96% in 2023-24), with a 22% response rate and a margin of error of ± 3.5%; 19 times out of 20.
The General Division, EI section has the following service standards:
- decisions are made within 45 days from when an appeal is filed with the SST, 80% of the time
- For 2024-25, the SST met this goal 47.6% of the time (up from 14.1% in 2023-24), with an average processing time of 55.4 days (down from 108.0 days in 2023-24)
- When including group appeals, the SST met this goal 46% of the time, with an average processing time of 65.4 days
- Through 2024-25, the SST steadily improved this standard, from 35.7% (59.4 days) in April 2024 to 80.2% (37.3 days) in March 2025 (excluding group appeals)

Text description
| Month of the 2024-25 fiscal year | Apr 2024 | May 2024 | Jun 2024 | Jul 2024 | Aug 2024 | Sep 2024 | Oct 2024 | Nov 2024 | Dec 2024 | Jan 2025 | Feb 2025 | Mar 2025 |
|---|---|---|---|---|---|---|---|---|---|---|---|---|
| Percentage of time decisions were made within 45 days | 35.7 | 30.7 | 29.9 | 38.2 | 38.6 | 39.4 | 44.6 | 47.7 | 60.0 | 60.2 | 73.7 | 80.2 |
For more information on decisions issued 45 days following an appeal, consult Annex 4.6.2b.
- Decisions are made within 15 days of the hearing, 80% of the time
- For 2024-25, the SST met this goal 75.6% of the time (up from 66.6% in 2023-24), averaging 12.2 days to issue a decision after the hearing compared with 17.9 days in 2023-24
- When including group appeals, the SST met this goal 75.2% of the time, averaging 12.8 days to issue a decision after the hearing
- Through 2024-25, the SST steadily improved this standard from 72.6% in April 2024 to 77.9% in March 2025 (excluding group appeals)
- For 2024-25, the SST met this goal 75.6% of the time (up from 66.6% in 2023-24), averaging 12.2 days to issue a decision after the hearing compared with 17.9 days in 2023-24

Text description
| Month of the 2024-25 fiscal year | Apr 2024 | May 2024 | Jun 2024 | Jul 2024 | Aug 2024 | Sep 2024 | Oct 2024 | Nov 2024 | Dec 2024 | Jan 2025 | Feb 2025 | Mar 2025 |
|---|---|---|---|---|---|---|---|---|---|---|---|---|
| Percentage of time decisions were made within 15 days of a hearing | 72.6 | 75.5 | 68.8 | 76.5 | 79.5 | 73.1 | 74.4 | 72.6 | 78.7 | 76.9 | 81.0 | 77.9 |
For more information on decisions issued within 15 days of a hearing, consult Annex 4.6.2c–d.
Appeal issues at the General Division, EI Section
In 2024-25, the General Division, EI section concluded appeals that examined a range of issues. The most common issues are indicated in chart 11, below:

Text description
| Most common issues in appeals concluded at the General Division, EI Section in 2024-25 | Percentage |
|---|---|
| Disqualification for misconduct or quit | 32.3 |
| Availability (disentitlement to benefits) | 19.9 |
| Benefit periods | 14.8 |
| Earnings, allocation, and deductions from benefits | 10.7 |
| Qualifying for benefits | 6.4 |
| Special benefits | 5.3 |
| Penalties and warnings | 4.8 |
| EI ERB Part VII.4 | 4.8 |
| Other disentitlements | 4.0 |
| Late reconsiderations | 3.0 |
| Payment of benefits | 2.2 |
Outcomes at the General Division, EI section
In 2024-25, at the General Division, EI section, 39.5% of appeals were allowed, 53.2% were dismissed, 4.4% were withdrawn, 1.9% were late appeals that were denied, and 1.0% were concluded for other reasons.

Text description
| Outcome | % Share |
|---|---|
| Merit dismissed | 53.2 |
| Allowed | 39.5 |
| Withdrawals | 4.4 |
| Late appeal denied | 1.9 |
| Appeals concluded for other reasons | 1 |
- Note:
Merit dismissed – decision not in the appellant’s favour
Allowed – decision is in the appellant’s favour
Withdrawal – appellant either withdraws or abandons the appeal
Late appeal denied – the Tribunal refuses the appeal filed beyond the 30-day deadline
Appeal concluded for other reason(s) – administrative closure
SST: Appeal Division, EI section
When a party to an appeal disagrees with a General Division decision, they can challenge it at the Appeal Division. The first step at the Appeal Division is to file an application for leave (permission) to appeal. The Appeal Division will grant permission to appeal if there is an arguable case. If leave to appeal is granted, the Appeal Division will then ask parties for their written arguments, hold a hearing, and decide whether the appeal should be allowed or dismissed. The grounds for appeal to the Appeal Division are limited to certain errors of fact, law, jurisdiction, or procedural fairness.
In 2024-25, the Appeal Division received 616 appeals. No EI group appeals were filed. The Appeal Division concluded 732 (including 36 group appeals that were withdrawn). This resulted in a decrease of inventory from 187 active appeals (including the 36 group appeals) in March 2024, to 71 in March 2025. There were no active group appeals at the end of 2024-25. For more information, consult Annex 4.6.2e.
Service standards and performance
The Appeal Division has the following service standards for EI files:
- leave to appeal decisions are made within 45 days of filing, 80% of the time
- For 2024-25, the SST met this goal 92.0% of the time, which is up from 23.5% in 2023-24, with an average processing time of 21.1 days (down from 67.2 days in 2023-24)
- Through 2024-25, the SST improved this standard from 69.6% in April 2024 to 100% in March 2025

Text description
| Month of the 2024-25 fiscal year | Apr 2024 | May 2024 | Jun 2024 | Jul 2024 | Aug 2024 | Sep 2024 | Oct 2024 | Nov 2024 | Dec 2024 | Jan 2025 | Feb 2025 | Mar 2025 |
|---|---|---|---|---|---|---|---|---|---|---|---|---|
| Percentage of time leave to appeal decisions are made within 45 days of filing | 70 | 77 | 93 | 89 | 91 | 100 | 98 | 100 | 98 | 100 | 98 | 100 |
For more information on leave to appeal decisions within 45 days of filing, consult Annex 4.6.2f.
- Final decisions are made within 150 days from the date that permission to appeal was given, 80% of the time
- For 2024-25, the SST met this goal 90.2% of the time (up from 81.1% in 2023-24), with an average processing time of 91.6 days (down from 113.3 days in 2023-24)

Text description
| Month of the 2024-25 fiscal year | Apr 2024 | May 2024 | Jun 2024 | Jul 2024 | Aug 2024 | Sep 2024 | Oct 2024 | Nov 2024 | Dec 2024 | Jan 2025 | Feb 2025 | Mar 2025 |
|---|---|---|---|---|---|---|---|---|---|---|---|---|
| Percentage of time final decision are made within 150 days from permission to appeal at the Appeal Division | 100 | 95 | 100 | 75 | 71 | 100 | 81 | 96 | 88 | 100 | 92 | 88 |
For more information on final decisions within 150 days of permission to appeal, consult Annex 4.6.2g.
- Final decisions are sent within 60 days of the hearing, 80% of the time
- For 2024-25, the SST met this goal 88.5% of the time, with an average processing time of 29.6 days. The SST introduced this service standard in April 2024

Text description
| Month of the 2024-25 fiscal year | Apr 2024 | May 2024 | Jun 2024 | Jul 2024 | Aug 2024 | Sep 2024 | Oct 2024 | Nov 2024 | Dec 2024 | Jan 2025 | Feb 2025 | Mar 2025 |
|---|---|---|---|---|---|---|---|---|---|---|---|---|
| Percentage of final decisions made within 60 days of a hearing at the Appeal Division | 92 | 86 | 100 | 74 | 77 | 91 | 100 | 94 | 70 | 100 | 80 | 93 |
Alternative dispute resolution at the Appeal Division
The Appeal Division may bring the parties together for alternative dispute resolution (ADR) when there is a reasonable expectation that the appeal can be resolved informally, without a hearing. For 2024-25, 5.6% (39) of concluded Appeal Division EI cases went through the ADR process. Of these cases, 61.5% (24) were resolved by ADR.
Outcomes at the Appeal Division
In 2024-25, at the Appeal Division, EI section, 17.6% of EI cases were allowed, 4.2% were agreements between parties accepted, 9.3% were dismissed, 9.6% were withdrawn, 54.6% were denied permission to appeal, 3.3% were denied late appeals, and 1.4% were concluded for other reasons.

Text description
| Outcome | % Share |
|---|---|
| Leave to appeal denied | 54.6 |
| Allowed | 2.9 |
| Merit dismissals | 9.3 |
| Withdrawals | 9.6 |
| Late appeal denied | 3.3 |
| Appeals concluded for other reasons | 1.4 |
- Note:
Merit dismissal – decision unfavourable to the appellant
Leave to appeal denied – the Appeal Division denies permission to appeal
Appeal allowed – decision is in the appellant’s favour
Withdrawal – appellant withdraws the appeal
Late appeal denied – the Appeal Division refuses the appeal filed beyond the 30-day deadline
Appeal concluded for other reason(s) – administrative closure
Representation at the SST
At each level of appeal, appellants can choose either to represent themselves or to have a representative assist them during the appeal process. A representative can be a friend, a family member, a lawyer, or another professional. The SST has compiled a list of organizations that can help free of charge across Canada to assist appellants.
Appeals with representation include files with any type of representative. Of EI files that were concluded in 2024-25, 17.3% (868 of 5,004) of appeals had a representative at the time of closing.

Text description
| Appellant representation types | Distribution |
|---|---|
| Personal representative | 384 (44%) |
| Lawyer | 269 (31%) |
| Advocacy group | 98 (11%) |
| Legal clinic | 41 (5%) |
| Union representative | 40 (5%) |
| Paralegal | 13 (2%) |
| Member of Parliament | 10 (1%) |
| Professional representative (non-legal) | 13 (1%) |
Keeping the SST accountable
The SST is responsible for handling appeals in a way that is simple, quick, and fair. It does so with the help of its stakeholders who have a good understanding of the issues that can affect a decision for the parties involved in an appeal. The SST’s EI stakeholders include:
- legal clinics
- lawyers
- paralegals
- unions
- advocacy groups
- the CEIC
Working with stakeholders is an important step to building a better administrative justice system. The SST meets with stakeholders regularly to share ideas and hear what they have to say. In 2024-25, fall and spring stakeholder consultations were held for the Employment Insurance Appeals Consultative Committee to discuss changes in policy and organizational updates.
4.7 Conclusion
Building on lessons learned from previous years, Service Canada continues to refine the administration of the EI program to better serve the needs of Canadian workers. In 2024-25, improvements in call centre responsiveness, cross-functional staffing, and the integration of technologies like Robotics Process Automation and AI have streamlined operations and elevated service delivery standards. Focused outreach efforts to underserved populations and a steadfast commitment to accessibility have further strengthened the program's responsiveness.
Looking ahead, Service Canada remains dedicated to ensuring timely service delivery, maintaining accuracy, and upholding the integrity of the EI program. These ongoing initiatives will ensure that the EI program remains robust, adaptable, and equipped to meet the evolving needs of Canadians in the future.