
Chapter 2: Impact and effectiveness of Employment Insurance benefits (Part I of the Employment Insurance Act)
Official title: Employment Insurance Monitoring and Assessment Report for the fiscal year beginning April 1, 2024 and ending March 31, 2025: Chapter 2: Impact and effectiveness of Employment Insurance benefits (Part Ⅰ of the Employment Insurance Act)
On this page
- List of abbreviations
- List of figures
- List of tables
- 2.1 Employment Insurance benefits
- 2.2 Employment Insurance regular benefits
- 2.3 Employment Insurance support while on training
- 2.4 Employment Insurance fishing benefits
- 2.5 Employment Insurance Work-Sharing benefits
- 2.6 Employment Insurance special benefits
- 2.7 Employment Insurance financial information
- Footnotes
List of abbreviations
This is the complete list of abbreviations for the Employment Insurance Monitoring and Assessment Report for the fiscal year beginning April 1, 2024 and ending March 31, 2025.
- ACG
- Apprenticeship Completion Grants
- ADR
- Alternative Dispute Resolution
- AI
- Artificial Intelligence
- AIG
- Apprenticeship Incentive Grants
- B/C
- Benefits-to-Contributions
- B/U
- Beneficiary-to-Unemployed (rate)
- B/UC
- Beneficiary-to-Unemployed Contributor (rate)
- BDM
- Benefits Delivery Modernization
- CAL
- Canada Apprenticeship Loans
- CEEDD
- Canadian Employer-Employee Dynamics Database
- CCB
- Compassionate Care Benefits
- CCDA
- Canadian Council of Directors of Apprenticeship
- CEIC
- Canada Employment Insurance Commission
- CEIFB
- Canada Employment Insurance Financing Board
- CFP
- Call for Proposals
- CIRNAC
- Crown-Indigenous Relations and Northern Affairs Canada
- COLS
- Community Outreach and Liaison Service
- CPI
- Consumer Price Index
- CPP
- Canada Pension Plan
- CRA
- Canada Revenue Agency
- CRF
- Consolidated Revenue Fund
- CSO
- Citizen Service Officers
- CWDP
- Community Workforce Development Program
- CX
- Client Experience
- EAS
- Employment Assistance Services
- EB
- Employment Benefits
- EBSM
- Employment Benefits and Support Measures
- ECC
- Employer Contact Centre
- EDI
- Equity, Diversity and Inclusion
- EI
- Employment Insurance
- EI-A
- Employment Insurance Regular Benefits - Apprentices
- EIACC
- Employment Insurance Appeals Consultative Committee
- EICS
- Employment Insurance Coverage Survey
- ELMLP
- Education and Labour Market Longitudinal Platform
- eROE
- Electronic Record of Employment
- ES
- Employment Services
- ESDC
- Employment and Social Development Canada
- FS
- Family Supplement
- FTE
- Full-Time Equivalent
- FY
- Fiscal Year
- G7
- Group of 7
- GC
- Government of Canada
- GDP
- Gross Domestic Product
- HCCS
- Hosted Contact Centre Solution
- HR
- Human Resources
- IBD
- Integrity-by-Design
- IC
- Individual Counselling
- IQF
- Individual Quality Feedback
- ISET
- Indigenous Skills and Employment Training
- IVR
- Interactive Voice Response
- IWW
- Integrated Workload and Workforce
- JCP
- Job Creation Partnership
- KPI
- Key Performance Indicators
- LFS
- Labour Force Survey
- LMDA
- Labour Market Development Agreements
- LMI
- Labour Market Information
- LMIA
- Labour Market Impact Assessment
- LMP
- Labour Market Partnerships
- LTU
- Long-Term Unemployed
- MIE
- Maximum Insurable Earnings
- MSCA
- My Service Canada Account
- MUS
- Monetary Unit Sampling
- NEET
- Not in Employment, Education or Training
- NERE
- New Entrant and Re-Entrant
- NESI
- National Essential Skills Initiative
- NHQ
- National Headquarters
- NIS
- National Investigative Services
- NOC
- National Occupation Classification
- OAS
- Old Age Security
- OASIS
- Occupational and Skills Information System
- OECD
- Organisation for Economic Co-operation and Development
- p.p.
- Percentage point
- PAAR
- Payment Accuracy Review
- PCIC
- Parents of Critically Ill Children
- PCS
- Post Call Survey
- PEAQ
- Processing, Excellence, Accuracy and Quality
- PPE
- Premiums-paid Eligible Individuals
- PRAR
- Processing Accuracy Review
- PRP
- Premium Reduction Program
- PSPC
- Public Services and Procurement Canada
- PT
- Provinces and Territories
- QPIP
- Quebec Parental Insurance Plan
- R&I
- Research and Innovation
- RAIS
- Registered Apprenticeship Information System
- RN
- Registered Nurse
- ROE
- Record of Employment
- RPA
- Robotics Processing Automation
- SCC
- Service Canada Centre
- SCT
- Skills and Competency Taxonomy
- SD
- Skills Development
- SD-A
- Skills Development - Apprentices
- SD-R
- Skills Development - Regular
- SE
- Self-Employment
- SEAQ
- Service, Excellence, Accuracy and Quality
- SEPH
- Survey of Employment, Payrolls and Hours
- SFS
- Skills for Success
- SIN
- Social Insurance Number
- SIP
- Sectoral Initiatives Program
- SIR
- Social Insurance Register
- SM
- Support Measures
- SME
- Small and medium enterprise
- SRI
- Service Referral Initiative
- SRS
- Simple Random Sampling
- SST
- Social Security Tribunal
- STDP
- Short-Term Disability Plan
- SUB
- Supplemental Unemployment Benefit
- SWSP
- Sectoral Workforce Solutions Program
- TES
- Targeted Earning Supplements
- TFW
- Temporary Foreign Worker
- TIS
- Telephone Interpretation Service
- TRF
- Targeting, Referral and Feedback
- TTY
- Teletypewriter
- TWS
- Targeted Wage Subsidies
- UTIP
- Union Training and Innovation Program
- VBW
- Variable Best Weeks
- VER
- Variable Entrance Requirement
- VET
- Vocational Education and Training
- VRI
- Video Remote Interpretation
- VRS
- Video Relay Service
- WCAG
- Web Content Accessibility Guidelines
- WISE
- Work Integration Social Enterprises
- WWC
- Working While on Claim
List of figures
- Chart 1: Employment Insurance claims established and amount paid, Canada, 2014-15 to 2024-25
- Chart 2: Amount paid in Employment Insurance benefits*, by benefit type, Canada, 2024-25
- Chart 3: Adjusted benefits-to-contributions (B/C) ratios and unemployment rate by province and territory*, Canada, 2023
- Chart 4: Adjusted regular benefits-to-contributions (B/C) ratios by industry, Canada, 2022 and 2023
- Chart 5: Employment Insurance regular claims established and amount paid, Canada, 2015-16 to 2024-25
- Chart 6: Shares of Employment Insurance regular claims and labour force by province*, Canada, 2024-25
- Chart 7: Share of Employment Insurance regular claims by hours of insurable employment and gender, Canada, 2024-25
- Chart 8: National unemployment rate and share of Employment Insurance regular claims by regional unemployment rate*, Canada, 2018-19, 2019-20 and 2022-23 to 2024-25**
- Chart 9: Distribution of the unemployed population in terms of eligibility for Employment Insurance regular benefits, Canada, 2024*
- Chart 10: Distribution of the unemployed population in terms of eligibility for Employment Insurance regular benefits, Canada, 2012 to 2024**
- Chart 11: Coverage rate of Employment Insurance regular benefits for the unemployed population, Canada, 2012 to 2024
- Chart 12: Eligibility rate for Employment Insurance regular benefits for the unemployed population by previous employment characteristics, Canada, 2012 to 2024
- Chart 13: Employment Insurance regular benefits access rates, Canada, 2012 to 2024
- Chart 14: Average weekly benefit rate for Employment Insurance regular claims established by gender and hours of insurable employment, Canada, 2024-25
- Chart 15: Average maximum entitlement and actual duration of completed claims for Employment Insurance regular benefits and unemployment rate, Canada, 2015-16 to 2024-25
- Chart 16: Employment Insurance regular benefits entitlement exhaustion rate and benefit period exhaustion rate, Canada, 2015-16 to 2024-25
- Chart 17: Number of Employment Insurance seasonal regular claims and share among total regular claims, Canada, 2015-16 to 2024-25
- Chart 18: Distribution of Employment Insurance seasonal regular claims by quarter and region, Canada, 2024-25
- Chart 19: Distribution of Employment Insurance regular claims by frequent and seasonal status, Canada, 2024-25
- Chart 20: Distribution of completed Employment Insurance seasonal regular claims* eligible for additional weeks of regular benefits and that used at least one additional week, by additional weeks of entitlement, Canada, 2024-25
- Chart 21: Share of Employment Insurance regular benefit claimants with an open claim working at least one week while on claim by industry, Canada, 2024-25
- Chart 22: Employment Insurance fishing claims established and amount paid, Canada, 2015-16 to 2024-25
- Chart 23: Total count of Work-Sharing agreements, Canada, 2013-14 to 2024-25
- Chart 24: Employment Insurance Work-Sharing claims and benefits paid, Canada, 2019-20 to 2024-25
- Chart 25: Average duration of completed Employment Insurance Work-Sharing claims, 2020-21 to 2024-25
- Chart 26: Share of Employment Insurance parental claims established by men, by parental benefit option*, Canada, 2015-16 to 2024-25
- Chart 27: Proportion of Employment Insurance sickness claims, amount paid and labour force, by age, Canada, 2024-25
- Chart 28: Average number of weeks of Employment Insurance sickness benefits for completed claims, Canada, 2015-16 to 2024-25
- Chart 29: Employment Insurance premium rates (rounded) per $100 of insurable earnings, Canada, 2016 to 2025
- Chart 30: Employment Insurance Operating Account financial position at the end of the fiscal year, Canada, 2015-16 to 2024-25
List of tables
- Table 1: Summary of Employment Insurance benefit types
- Table 2: Employment Insurance claims and amount paid by type of benefits, Canada, 2023-24 and 2024-25
- Table 3: Employment Insurance claims and amount paid by province or territory, gender and age, Canada, 2023-24 and 2024-25
- Table 4: Number of best weeks of insurable earnings by regional unemployment rate as per the Variable Best Weeks (VBW) provision
- Table 5: Completed pure and combined Employment Insurance claims by type of benefits, Canada, 2024-25
- Table 6: Adjusted benefits-to-contributions (B/C) ratios by gender and age, Canada, 2023
- Table 7: Employment Insurance regular claims and amount paid by province and territory, gender and age, Canada, 2023-24 and 2024-25
- Table 8: Employment Insurance regular claims and amount paid by industry, Canada, 2023-24 and 2024-25
- Table 9: Employment Insurance claimants who repaid benefits and amount repaid by province or territory, gender and age, Canada, 2023 tax year
- Table 10: Total number of firms and number of firms with at least one employee who received Employment Insurance regular benefits by firm size, Canada, 2022 and 2023
- Table 11: Distribution of workforce and of claimants who received Employment Insurance regular benefits by firm size, Canada, 2023
- Table 12: Employment Insurance regular claims and amount paid by claimant category, Canada, 2023-24 and 2024-25
- Table 13: Variable entrance requirement
- Table 14: Number and share of Employment Insurance regular claims by regional unemployment rate*, Canada, 2024-25
- Table 15: Number of Employment Insurance disqualifications and disentitlements due to selected reasons, Canada, 2018-19 to 2024-25*
- Table 16: Employment Insurance regular benefits coverage rates for the unemployed population by province, gender, age, and previous work patterns**, Canada, 2019 to 2024*
- Table 17: Employment Insurance regular benefits eligibility rates for the unemployed population by province, gender, age, and previous work patterns, Canada, 2017 to 2024*
- Table 18: Average weekly benefit rate for Employment Insurance regular claims established by province or territory, Canada, 2023-24 and 2024-25
- Table 19: Average weekly benefit rate for Employment Insurance regular claims established by age group and gender, Canada, 2024-25
- Table 20: Average weekly benefit rate for Employment Insurance regular claims established by claimant category, Canada, 2023-24 and 2024-25
- Table 21: Share of Employment Insurance regular claims established receiving the maximum weekly benefit rate by province or territory, gender, age and claimant category, Canada, 2023-24 and 2024-25
- Table 22: Share of Employment Insurance regular claims established by weekly benefit rate groups, Canada, 2024-25
- Table 23: Average maximum entitlement and average actual durations of completed claims for Employment Insurance regular benefits, by province or territory, gender, age and claimant category, Canada, 2023-24 and 2024-25
- Table 24: Proportion of Employment Insurance regular benefits' weeks used, by province or territory, gender, age and claimant category, Canada, 2023-24 and 2024-25
- Table 25: Proportion of Employment Insurance (EI) regular benefits' weeks used by weeks of entitlement, EI regional unemployment rate and working while on claim status, Canada, 2023-24 and 2024-25
- Table 26: Entitlement and benefit period exhaustion rates of completed claims for Employment Insurance regular benefits by province or territory, gender, age and claimant category, Canada, 2023-24 and 2024-25
- Table 27: Completed claims for Employment Insurance regular benefits by exhaustion type and characteristics, Canada, 2024-25
- Table 28: Employment Insurance seasonal regular claims by region, gender, age and industry, Canada, 2023-24 and 2024-25
- Table 29: Quarterly distribution of Employment Insurance seasonal regular claims by gender, age and industry, Canada, 2024-25
- Table 30: Characteristics of completed Employment Insurance regular claims by frequent and seasonal status, Canada, 2024-25
- Table 31: Number and proportion of completed Employment Insurance (EI) seasonal regular claims* eligible for additional weeks of regular benefits and that used at least one additional week, by the 13 targeted EI regions, gender, age and selected industries, Canada, 2024-25
- Table 32: Number of gappers and share among all Employment Insurance regular claims by region and seasonality, Canada, 2023-24 and 2024-25
- Table 33: Number and share of Employment Insurance (EI) regular benefit claimants with an open claim working at least one week while on claim, and of completed EI regular claims with at least one week worked while on claim, by region, gender, age and seasonality, Canada, 2024-25
- Table 34: Proportion of weeks worked while on claim among weeks for which claimants were entitled to receive Employment Insurance regular benefits, by region, gender, age and seasonality, Canada, 2023-24 and 2024-25
- Table 35: Average number of weeks worked while on claim for Employment Insurance regular claims completed with at least one week of work, by region, gender, age and seasonality, Canada, 2023-24 and 2024-25
- Table 36: Average weekly income associated with completed Employment Insurance regular claims by working while on claim status, Canada, 2024-25
- Table 37: Employment Insurance claims established by apprentices and amount paid by region, gender and age, Canada, 2023-24 and 2024-25
- Table 38: Employment Insurance claims established by apprentices and amount paid by sector and occupational grouping, Canada, 2023-24 and 2024-25
- Table 39: Employment Insurance claims for which claimants received permission from Service Canada to train and amount paid by region, gender, age and industry, Canada, 2023-24 and 2024-25
- Table 40: Minimum threshold of insurable earnings from self-employed fishing and earnings divisor for Employment Insurance fishing benefits by regional unemployment rate
- Table 41: Fixed start and end dates of benefit periods and fixed start dates of qualifying periods for Employment Insurance fishing benefits by fishing season
- Table 42: Employment Insurance fishing claims and amount paid by region, gender and age, Canada, 2023-24 and 2024-25
- Table 43: Average weekly benefit rate for Employment Insurance fishing benefits and share of fishing claims at the maximum weekly benefit rate by region, gender and age, Canada, 2023-24 and 2024-25
- Table 44: Number of fishers by season of establishment of claim, Canada, 2020-21 to 2024-25
- Table 45: Share of fishers who established multiple fishing claims per year, Canada, 2020-21 to 2024-25
- Table 46: Average duration of Employment Insurance fishing benefits by number of claims established per fiscal year, Canada, 2023-24 and 2024-25
- Table 47: Number of Work-Sharing agreements by region and industry, 2023-24 and 2024-25
- Table 48: Number of Employment Insurance Work-Sharing claims and amount paid, by region, gender, age and industry, Canada, 2023-24 and 2024-25
- Table 49: Employment Insurance Work-Sharing average weekly benefit rate, by region, gender, age and industry, 2022-23 to 2024-25
- Table 50: Employment Insurance special benefit claims and amount paid according to benefit type, Canada, 2023-24 and 2024-25
- Table 51: Firms, workforce and claimants who received Employment Insurance special benefit by firm size*, Canada, 2023
- Table 52: Employment Insurance maternity claims and amount paid by province or territory and age, Canada, 2023-24 and 2024-25
- Table 53: Employment Insurance parental claims and amount paid by benefit type, province or territory, gender and age, Canada, 2023-24 and 2024-25
- Table 54: Average number of weeks of Employment Insurance parental benefits for completed claims, Canada, 2023-24 and 2024-25
- Table 55: Employment Insurance sickness claims and amount paid by province or territory, gender and age, Canada, 2023-24 and 2024-25
- Table 56: Employment Insurance sickness claims and amount paid, and employment, by industry, Canada, 2024-25
- Table 57: Share of completed Employment Insurance sickness claims that used the maximum number of weeks of sickness benefits by age, Canada, 2020-21 to 2024-25
- Table 58: Share of completed Employment Insurance sickness claims by weeks of sickness benefits used, Canada, 2020-21 to 2024-25
- Table 59: Employment Insurance compassionate care claims and amount paid, by region, gender and age group, Canada, 2023-24 and 2024-25
- Table 60: Average duration and share of completed Employment Insurance compassionate care claims that used all 26 weeks of benefits, Canada, 2020-21 to 2024-25
- Table 61: Employment Insurance claims for the family caregiver benefit for adults and amount paid by region, gender and age, Canada, 2023-24 and 2024-25
- Table 62: Employment Insurance claims for the family caregiver benefit for children and amount paid by region, gender and age, Canada, 2023-24 and 2024-25
- Table 63: Number of self-employed persons registered in the Employment Insurance program, Canada, 2020-21 to 2024-25
- Table 64: Employment Insurance special benefit claims for self-employed persons and amount paid by benefit type, region, gender and age, Canada, 2023-24 and 2024-25
- Table 65: Employment Insurance maximum insurable earnings, premium rates* and annual maximum contributions for employees and employers in Canada, 2020 to 2025
- Table 66: Employment Insurance Operating Account revenues and expenditures, Canada, 2020-21 to 2024-25 ($ millions)
2.1 Employment Insurance benefits
In this section
- 2.1.1 Employment Insurance benefits overview
- 2.1.2 Combined Employment Insurance claims
- 2.1.3 Benefits-to-Contributions ratios
This chapter of the Employment Insurance Monitoring and Assessment Report assesses income support provided by Employment Insurance (EI) Part Ⅰ benefits: regular benefitsFootnote 1, fishing benefits, Work-Sharing benefits and special benefits. It covers the period beginning April 1, 2024, and ending March 31, 2025 (2024-25).
This chapter includes several key indicators, such as the number of new claims established, total amount of benefits paid, level of benefits, maximum entitlement and actual duration of benefits, as well as the exhaustion of benefits. Throughout the chapter, key EI program provisions and recent changes made to the EI program are discussed. Indicators related to the level of claims and the level of benefits are presented for claims established within the fiscal year for which at least $1 in EI benefits was paid. Indicators such as maximum entitlement and actual duration of benefits are based on claims completed during the fiscal year for which at least $1 in EI benefits was paid. Indicators related to the amount of EI benefits paid are presented on a cash basis, which means the expenses are accounted for during the fiscal year in which they are paid. More information on the definitions of the indicators presented throughout this chapter can be found in Annex 2.1 of this report.
This chapter relies on several sources of information to provide a comprehensive analysis of the EI program. EI administrative data underpins most of the analysis. Some sections of this chapter also make use of tax data provided by the Canada Revenue Agency related to T4 tax slips with employment income or T1 returns. Statistics Canada's Employment Insurance Coverage Survey provides the basis for analysis of coverage, eligibility and access to EI benefits for unemployed people. Throughout the chapter, results by sociodemographic characteristics are discussed and compared to previous years.
Annex 2 of the report presents additional statistical information on benefits analyzed in this chapter. Annex 5 breaks down financial information from the EI Operating Account. Annex 7 provides an overview of major legislative and regulatory changes to the EI program between April 1996 and December 2025.
2.1.1 Employment Insurance benefits overview
The EI program provides temporary income support to partially replace employment income for eligible claimants as they look for a new job and stay active in the labour force, or are temporarily absent from work due to specific life circumstances (such as illness, injury, pregnancy, providing care to a newborn or newly adopted child, providing care or support to a critically ill or injured person or someone needing end-of-life care).
In this chapter, EI benefits refer to regular benefits, special benefits, fishing benefits and Work-Sharing benefits (consult Table 1). Special benefits include maternity benefits, parental benefits, sickness benefits, family caregiver benefits for adults or children, and compassionate care benefits. Subsection 2.1.1 covers the number of new claims established in the fiscal year, total amount paid over the fiscal year, and benefit levels of claims established. Subsection 2.1.2 examines combined (or mixed) benefit claims. Subsection 2.1.3 provides an analysis of the usage of EI benefits relative to EI premiums contributed.
| Benefit type | Circumstance | Entrance requirement1 | Maximum entitlement |
|---|---|---|---|
| Regular | Unemployed with a valid reason for separation, available for work, and searching for suitable employment (or retraining in certain cases) | 420 to 700 hours of insurable employment, depending on the regional unemployment rate | 14 to 45 weeks, depending on the number of hours of insurable employment and regional unemployment rate |
| Fishing | Self-employed fishers actively searching for work and unable to qualify for regular benefits | $2,500 to $4,200 in insurable earnings from fishing, depending on the regional unemployment rate | 26 weeks per season (summer or winter) |
| Work-Sharing3 | Employed but working reduced hours as part of a Work-Sharing agreement with employer and Service Canada where employer facing slowdown in business activity for reasons beyond employer's control | 420 to 700 hours of insurable employment, depending on the regional unemployment rate and must be a year-round employee | 6 to 26 weeks with the possibility of an extension by 12 weeks if warranted |
| Special2 - Maternity | Unavailable to work because of pregnancy or having recently given birth | 600 hours of insurable employment | 15 weeks |
| Special2 - Parental | Unavailable to work to care for a newborn or a newly adopted child | 600 hours of insurable employment |
|
| Special2 - Sickness | Unavailable to work because of illness, injury or quarantine | 600 hours of insurable employment | 26 weeks |
| Special2 - Family caregiver for children | Unavailable to work because providing care or support to a critically ill or injured child under the age of 18 | 600 hours of insurable employment | 35 weeks4 |
| Special2 - Family caregiver for adults | Unavailable to work because providing care or support to a critically ill or injured person 18 years or older | 600 hours of insurable employment | 15 weeks4 |
| Special2 - Compassionate care | Unavailable to work because providing care to a person of any age who requires end-of-life care | 600 hours of insurable employment | 26 weeks4 |
- 1 In response to evacuations in the communities of Jasper, Alberta and Bunibonibee Cree Nation, Manitoba due to wildfires in 2024, EI pilot project No. 23 provided a one-time credit of 300 hours of insurable employment to eligible EI claimants in those communities who established a claim between July 21, 2024 and July 19, 2025.
- 2 Self-employed workers (other than fishers) who have opted into EI special benefits must meet an insurable earnings threshold for the calendar year preceding the claim. The threshold was $8,492 for claims established in 2024 and $8,826 for claims established in 2025. Self-employed fishers must meet an insurable earnings threshold from self-employment fishing of $3,760 during the qualifying period to qualify for special benefits.
- 3 Temporary Work-Sharing special measures supported businesses affected by the 2024 wildfires in Jasper, Alberta and Bunibonibee Cree Nation, Manotiba. These measures were in effect from December 1, 2024 to August 3, 2025. Temporary Work-sharing special measures were also put in place to support businesses affected by the threat or potential realization of tariffs. These measures were effective from March 7, 2025 to March 6, 2026. Consult Section 2.5 for more details
- 4 Benefits can be shared between eligible claimants (that is, family members or those considered to be like family).
Employment Insurance claims and amount paid
The total number of new EI claims established was 2.0 million in 2024-25, having increased by 2.2% compared to 2023-24. The total EI benefit payments increased by 10.2% to reach $23.1 billion in the reporting period compared to $21.0 billion in the previous fiscal year. This amount exceeds pre-pandemic levels and is the highest recorded in the past decade (consult Chart 1).

Text description
| Fiscal year | New claims established (millions) | Amount paid ($ billions) |
|---|---|---|
| 2014-15 | 1.8 | $15.8 |
| 2015-16 | 1.9 | $17.7 |
| 2016-17 | 1.8 | $18.5 |
| 2017-18 | 1.8 | $18.7 |
| 2018-19 | 1.8 | $16.7 |
| 2019-20 | 1.9 | $17.5 |
| 2020-21* | Not available | Not available |
| 2021-22** | 2.1 | $36.8 |
| 2022-23** | 1.9 | $19.7 |
| 2023-24 | 2.0 | $21.0 |
| 2024-25 | 2.0 | $23.1 |
- Note: Includes claims for which at least $1 of Employment Insurance benefits was paid.
- * Claims for EI regular and sickness benefits could not be established during the first half of 2020-21 due to the implementation of the Canada Emergency Response Benefits. Consequently, results for 2020-21 are not comparable with other fiscal years.
- ** Different EI temporary measures affecting the eligibility for EI benefits and the amount of EI benefits paid were in effect from September 27, 2020 to September 24, 2022.
- Source: Employment and Social Development Canada, Employment Insurance (EI) administrative data. Results are based on a 10% sample of data for 2014-15 to 2022-23 and 100% of data for 2023-24 and 2024-25.
According to Statistics Canada,Footnote 2 there were 809,000 beneficiaries receiving EI benefits on average each month during 2024-25. This is an increase of 7.3% compared to the previous year (754,100 in 2023-24) and an increase of 9.3% compared to pre-pandemic levels (740,200 in 2019-20). This increase was primarily driven by a higher number of beneficiaries receiving EI regular benefits in 2024-25.
| Types of Employment Insurance benefit | New claims established 2023-24 | New claims established 2024-25 | Change (%) in new claims established | Amount paid ($ million) 2023-24 | Amount paid ($ million) 2024-25 | Change (%) in amount paid |
|---|---|---|---|---|---|---|
| Regular | 1,374,813 | 1,402,387 | +2.0% | $12,812.1 | $14,290.9 | +11.5% |
| Fishing | 27,437 | 28,305 | +3.2% | $354.9 | $375.6 | +5.8% |
| Work-Sharing | 17,529 | 21,530 | +22.8% | $39.5 | $53.3 | +34.8% |
| Special | 675,757 | 691,580 | +2.3% | $7,778.3 | $8,395.1 | +7.9% |
| Maternity | 173,191 | 178,562 | +3.1% | $1,413.0 | $1,516.0 | +7.3% |
| Parental | 244,005 | 256,517 | +5.1% | $3,488.7 | $3,744.5 | +7.3% |
| Sickness | 429,798 | 432,146 | +0.5% | $2,725.3 | $2,969.7 | +9.0% |
| Family caregiver for children | 4,422 | 4,690 | +6.1% | $33.6 | $35.5 | +5.6% |
| Family caregiver for adults | 14,135 | 15,752 | +11.4% | $77.8 | $88.1 | +13.3% |
| Compassionate care | 6,417 | 6,300 | -1.8% | $39.9 | $41.4 | +3.5% |
| All benefit types | 2,003,560 | 2,048,515 | +2.2% | $20,972.7 | $23,102.1 | +10.2% |
- Notes: Data may not add up to the total due to rounding. Percentage change is based on unrounded numbers. Includes claims for which at least $1 of Employment Insurance benefits was paid. The sum of claims by benefit type does not add up as multiple benefit types can be combined in one single claim.
- Consult Annex 2.3 for more details.
- Source: Employment and Social Development Canada, Employment Insurance (EI) administrative data. Results are based on 100% of data.
New Employment Insurance claims established
The higher number of new EI claims observed during the reporting period relative to 2023-24 is largely attributed to an increase in claims for EI regular benefits (consult Table 2). The share of regular claims among all new claims established was 68.5% in 2024-25, whereas the share of claims for sickness benefits ─ which were the second most common benefit type claimed ─ was 21.1% over the same period.
All provinces and territories, except the Atlantic provinces, the Northwest Territories and Nunavut experienced slight increases in the number of new EI claims established in 2024-25 compared to 2023-24 (consult Table 3). The number of new claims also increased for both genders, with men continuing to account for just over half (54.5%) of all new claims in 2024-25. All age groups, except for those under 25 years-old, also registered increases in their number of new EI claims established during the reporting period relative to the previous fiscal year.
| Category | New claims established 2023-24 | New claims established 2024-25 | Change (%) in new claims established | Amount paid ($ millions) 2023-24 | Amount paid ($ millions) 2024-25 | Change (%) in amount paid |
|---|---|---|---|---|---|---|
| Newfoundland and Labrador | 79,013 | 78,706 | -0.4% | $1,089.0 | $1,129.5 | +3.7% |
| Prince Edward Island | 22,757 | 22,595 | -0.7% | $272.9 | $286.3 | +4.9% |
| Nova Scotia | 77,989 | 77,040 | -1.2% | $904.1 | $958.5 | +6.0% |
| New Brunswick | 81,299 | 81,133 | -0.2% | $981.6 | $1,029.3 | +4.9% |
| Quebec | 498,005 | 500,180 | +0.4% | $3,926.4 | $4,267.7 | +8.7% |
| Ontario | 663,134 | 691,786 | +4.3% | $7,233.1 | $8,339.7 | +15.3% |
| Manitoba | 70,247 | 73,098 | +4.1% | $739.5 | $793.5 | +7.3% |
| Saskatchewan | 54,582 | 55,847 | +2.3% | $650.4 | $683.6 | +5.1% |
| Alberta | 215,429 | 223,895 | +3.9% | $2,491.4 | $2,754.0 | +10.5% |
| British Columbia | 234,916 | 238,478 | +1.5% | $2,601.7 | $2,775.2 | +6.7% |
| Yukon | 2,398 | 2,439 | +1.7% | $30.7 | $32.9 | +7.1% |
| Northwest Territories | 2,418 | 2,031 | -16.0% | $29.5 | $30.3 | +2.5% |
| Nunavut | 1,373 | 1,287 | -6.3% | $22.5 | $21.6 | -3.7% |
| Male | 1,087,830 | 1,117,252 | +2.7% | $10,483.4 | $11,634.3 | +11.0% |
| Female | 915,730 | 931,263 | +1.7% | $10,489.3 | $11,467.8 | +9.3% |
| 24 years old and under | 182,520 | 181,883 | -0.3% | $1,488.7 | $1,591.4 | +6.9% |
| 25 to 44 years old | 1,027,472 | 1,059,580 | +3.1% | $11,829.6 | $13,043.6 | +10.3% |
| 45 to 54 years old | 339,581 | 346,082 | +1.9% | $3,164.0 | $3,497.5 | +10.5% |
| 55 years old and over | 453,987 | 460,970 | +1.5% | $4,490.4 | $4,969.6 | +10.7% |
| Canada | 2,003,560 | 2,048,515 | +2.2% | $20,972.7 | $23,102.1 | +10.2% |
- Notes: Data may not add up to the total due to rounding. Percentage change is based on unrounded numbers. Includes claims for which at least $1 of EI benefits was paid.
- Consult Annex 2.3 for more details.
- Source: Employment and Social Development Canada, Employment Insurance (EI) administrative data. Results are based on 100% of data.
Total amount paid in Employment Insurance benefits
In 2024-25, the total amount paid for all types of EI benefits combined reached $23.1 billion compared to $21.0 billion in the previous fiscal year. This 10.2% increase was mainly attributable to the rise in the amount paid in EI regular benefits over the same period (consult Table 2), driven primarily by a larger number of beneficiaries receiving these benefits in 2024-25, with additional contributions from increases in new claims established and in the average weekly benefit rate.
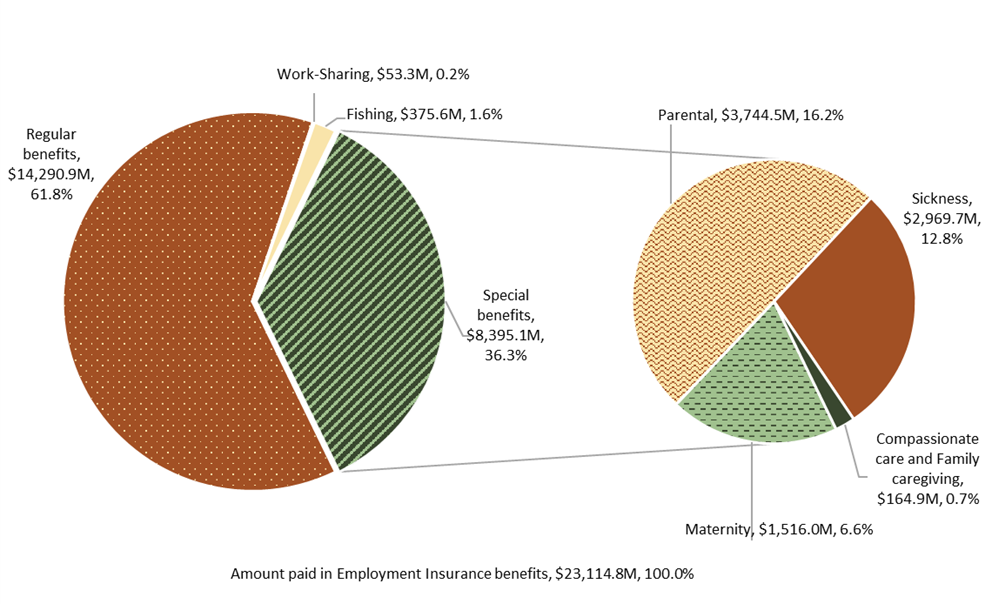
The share of EI regular benefits paid slightly increased from 61.1% in 2023-24 to 61.8% in 2024-25, while the share of EI special benefits paid decreased from 37.1% to 36.3% (consult Chart 2). The shares of the amount paid for the other benefit types in 2024-25 remained fairly stable compared to 2023-24. The breakdown of the amount paid by benefit type in 2024-25 was relatively similar to the shares of claims established by benefit type during the same period.
Text description
| Benefit type | Amount paid ($ millions) | Share in percentage (%) |
|---|---|---|
| Regular benefits | $14,290.9 | 61.8% |
| Work-Sharing benefits | $53.3 | 0.2% |
| Fishing benefits | $375.6 | 1.6% |
| Special benefits | $8,395.1 | 36.3% |
| Parental benefits | $3,744.5 | 16.2% |
| Sickness benefits | $2,969.7 | 12.8% |
| Maternity benefits | $1,516.0 | 6.6% |
| Compassionate care and family caregiving benefits | $164.9 | 0.7% |
| Amount paid in Employment Insurance benefits | $23,114.8 | 100.0% |
- * The total amount paid reported in Chart 2 does not correspond to the total reported in Tables 2 and 3 because of some incompatibility of administrative data sources for family caregiver benefits.
- Source: Employment and Social Development Canada, Employment Insurance (EI) administrative data. Results are based on 100% of data.
During the reporting period, Nunavut recorded a decline in EI benefits paid, while the remaining provinces and territories had an increase in EI benefits paid. Claimants in Ontario and Alberta had the biggest increases in their total amount paid in EI benefits in 2024-25 compared to 2023-24, with a growth of 15.3% and 10.5%, respectively.
In 2024-25, EI benefits paid to both genders and to each age group increased from the previous fiscal year. Women accounted for 49.6% of the EI benefits paid, 0.4 percentage points (p.p.) lower than in 2023-24 (50.0%), but similar to pre-pandemic levels (49.5% in 2019-20). The distribution of EI benefits paid across age groups remained relatively similar to the previous year.
Levels of benefits
The weekly benefit rate to which EI claimants are entitled is subject to the Variable Best Weeks (VBW) provision.Footnote 3 Under this provision, the weekly benefit rate is calculated based on an EI claimant's highest (best) weeks of insurable earnings during their qualifying period. The number of highest (best) weeks used under this provision ranges from 14 to 22, depending on the unemployment rate in the claimant's EI region at the time the claim is established (consult Table 4).
| Regional unemployment rate | Number of weeks |
|---|---|
| 6.0% and under | 22 |
| 6.1% to 7.0% | 21 |
| 7.1% to 8.0% | 20 |
| 8.1% to 9.0% | 19 |
| 9.1% to 10.0% | 18 |
| 10.1% to 11.0% | 17 |
| 11.1% to 12.0% | 16 |
| 12.1% to 13.0% | 15 |
| More than 13.0% | 14 |
Note: The monthly regional unemployment rates used for the EI program are a 3-month moving average of seasonally adjusted rates of unemployment produced by Statistics Canada, except for EI regions in the territories which use the higher of the 3-month or 12-month moving average, as per section 17 of the Employment Insurance Regulations.
Under the EI program, the weekly benefit rate is paid as 55%Footnote 4 of the average weekly insurable earnings, up to the maximum weekly benefit rate in a given year. The maximum weekly benefit rate was $668 in 2024 and $695 in 2025 (except for extended parental benefits).Footnote 5Claimants with children (under the age of 18 years) and low annual family income may also be eligible for the Family Supplement provision.Footnote 6
For all claims established in 2024-25, excluding those for extended parental benefits, the average weekly benefit rate increased by 3.9% nationally to $581. This rise was similar to the 4.0% growth in maximum insurable earnings from 2024 to 2025. All provinces and territories recorded increases. Yukon had the highest average weekly benefit rate ($634), while Manitoba had the lowest average weekly benefit rate ($550). On average, men were entitled to a higher weekly benefit rate than women ($608 and $549, respectively). Claimants between 25 to 44 years old had the highest average weekly benefit rate ($596) among the age groups (consult Annex 2.3.2).
About half of all claimants (50.7%) who established a claim in 2024-25 were entitled to the maximum weekly benefit rate. This proportion was the highest in Nunavut (73.9%) and the lowest in New-Brunswick (38.4%). Men were proportionally more likely to receive the maximum weekly benefit rate (60.7%) compared to women (38.3%). A higher proportion of claimants between 25 to 44 years old received the maximum weekly benefit rate (55.8%) than any other age group.
Family Supplement provision
The EI Family Supplement provision provides additional benefits to EI claimants with dependent children under the age of 18 who have an annual family net income equal to or less than $25,921, increasing support for low-income families. The claimant must also receive the Canada Child Benefit.Footnote 7 Under the Family Supplement provision, which is available to claims of all EI benefit types, the weekly amount of family supplement can increase a claimant's benefit rate from 55% to a maximum of 80% of their weekly insurable earnings, up to the maximum weekly benefit rate. The supplement provided to eligible claimants is determined by the claimant's family net income, the number of children in the claimant's family, and the age of the claimant's children.Footnote 8
In 2024-25, low-income families received a total of $50.9 million in additional EI benefits through the Family Supplement provision, compared to 48.6 million in 2023-24 (4.7% increase). The number of claims that received the family supplement decreased from almost 51,400 in 2023-24 to just under 49,100 in 2024-25 (4.4% decrease), which represents 2.4% of all claims established during the reporting period. The proportion of EI claims receiving the family supplement has decreased for the past 2 decades, from a high of 10.7% of all claims in 2000-01. This decrease can be explained by the fact that the eligibility threshold for this provision has not been indexed over time, as well as by changes in family composition and wage growth.
Women (80.9%) and claimants aged 25 to 44 (74.5%) continued to be the main demographic groups benefitting from the Family Supplement provision. The average family supplement to the weekly benefit rate was $46 in 2024-25 and has remained relatively unchanged over the years (consult Annex 2.23).
A departmental studyFootnote 9 examined claims that would have been eligible to additional benefits under the EI Family Supplement provision if the annual family net income thresholds were adjusted for inflation. The study found that the share of EI claims eligible for the family supplement would be 2.9 p.p. higher if the annual family net income thresholds were adjusted for inflation for claims that started in 2022, whereas the family supplement to the weekly benefit rate would be, on average, $3 higher. If both the family net income thresholds and the family supplement amounts were adjusted for inflation, the family supplement to the weekly benefit rate would be, on average, $25 higher.
Supplemental Unemployment Benefit plans
While EI benefits provide temporary income support for claimants, employers can use a Supplemental Unemployment Benefit (SUB) plan to increase their employees' weekly earnings when they are unemployed due to a temporary stoppage of work, training, illness, injury or quarantine.Footnote 10 These SUB plans need to be registered with Service Canada so that supplemental payments (or top-ups) are not considered as earnings and are not deducted from EI benefits. The combined weekly payments from the plan and EI weekly benefits cannot exceed 95% of the employee's normal weekly earnings.
Employers can also provide supplemental payments to maternity, parental (including adoption), compassionate care and family caregiver benefits.Footnote 11 These plans do not have to be registered with Service Canada. The top-up amounts are not deducted from EI benefits if the combined weekly payments do not exceed 100% of the employee's normal weekly earnings and the plan does not use the supplemental payments to reduce other accumulated employment benefits (such as banked sick leave, vacation leave credits or severance pay).
Results on average weekly benefit rates presented in this chapter do not include any supplemental payments made to EI claimants by their employers.
Study on Supplemental Unemployment Benefit plans
A departmental study* examined the characteristics of employers and employees with SUB plans**, and their utilization pattern of the EI program. From 2008 to 2017, the number of firms with an active registered SUB plan increased from 5,714 to 7,782, with an annual average of over 6,800 firms (0.5% of all firms in Canada). Around 63% of these plans were for illness, injury or quarantine, while plans for temporary stoppage of work or training and plans consisting of a combination of top-up plans accounted for around 10%, 7% and 20% respectively.
Firms offering SUB plans were generally larger in size compared to the general firms' profile in Canada. Firms having over 50 employees accounted for 5% of all firms in Canada during the 2008-2017 period, while they represented 40% of firms with SUB plans over the same period. In terms of the distribution of firms offering SUB plans across industries, about 52% were in the Services industry (excluding the governmental sector) and close to 14% in the Construction industry.
Overall, EI claims that receive top-up payments through SUB plans constituted between 40,000 and 60,000 claims per year during the study period (around 3% of all EI claims). The largest share of these claims (49%) were for EI regular benefits (temporary stoppage of work), followed by 27% for EI sickness benefits (illness, injury or quarantine), and 2% for training.
- * ESDC, Supplemental Unemployment Benefit plans (Ottawa: ESDC, Evaluation Directorate, 2021).
- ** Excluding SUB plans for maternity, parental (including adoption), compassionate care, and family caregiver benefits.
2.1.2 Combined Employment Insurance claims
Under certain provisions of the EI program, a claimant may receive multiple types of benefits as part of a single claim if they meet the requirements for each benefit type they intend to receive.Footnote 12,Footnote 13
A "pure" claim is one in which an EI claimant receives a single benefit type, while a "combined" claim is one in which the claimant receives more than one benefit type. The combination of EI benefit types in a single claim is examined using claims completed in 2024-25, regardless of the year in which the claim was established. Statistics for the reporting fiscal year are preliminary estimates and are subject to revision in the future. Combined claims represented 16.8% of all completed claims in 2024-25 (consult Table 5).
| Benefit type | Level of total claims ('000s)P | Level of pure claims ('000s)P | Share of pure claims (%)P | Level of combined claims ('000s)P | Share of combined claims (%)P | Benefit type most often combined with (share of combined claims)P |
|---|---|---|---|---|---|---|
| Regular | 1,468.8 | 1,299.0 | 88.4% | 169.8 | 11.6% | Sickness (87.4%) |
| Fishing | 28.1 | 24.4 | 86.9% | 3.7 | 13.1% | Sickness (90.9%) |
| Work-Sharing | 18.6 | 12.2 | 65.9% | 6.3 | 34.1% | Regular (79.5%) |
| Maternity | 174.0 | 2.8 | 1.6% | 171.2 | 98.4% | Parental (98.3%) |
| Parental* | 254.1 | 76.4 | 30.1% | 177.7 | 69.9% | Maternity (94.8%) |
| Sickness | 451.2 | 270.5 | 60.0% | 180.7 | 40.0% | Regular (82.1%) |
| Compassionate care | 6.6 | 4.2 | 64.2% | 2.4 | 35.8% | Sickness (64.3%) |
| Family caregiver for children | 3.2 | 2.4 | 75.0% | 0.8 | 25.0% | Regular (57.0%) |
| Family caregiver for adults | 14.8 | 10.2 | 68.7% | 4.6 | 31.3% | Regular (61.7%) |
| All claims** | 2,045.9 | 1,702.2 | 83.2% | 343.7 | 16.8% | n/a |
- Note: Data may not add up to the total due to rounding. Percentage shares are based on unrounded numbers. Includes completed claims for which at least $1 of EI benefits was paid. The sum of claims by benefit type for the "Level of total claims" and "Level of combined claims" columns does not add up to the total because more than one benefit type can be part of the same claim. This does not apply to pure claims that include only one benefit type.
- * Parental benefits include benefits for biological parents and adoptive parents.
- ** The total number of claims is based on claims completed during the fiscal year. This explains why the total number of claims here is different from the total numbers of claims in Tables 2 and 3 which are based on established claims.
- P Preliminary data.
- Consult Annex 2.27 for more details.
- Source: Employment and Social Development Canada, Employment Insurance (EI) administrative data. Results are based on 100% of data.
Over time, trends in the share of claims that combined more than one benefit type remained relatively stable. The share of combined claims was 16.6% in 2023-24 (consult Annex 2.27). Women were more likely to claim more than one type of EI benefit (26.4%) than men (8.9%), mostly due to their high probability of claiming both maternity and parental benefits.
While it is possible for fishers to combine fishing benefits with other benefit types (under some restrictions), only 13.1% of fishing claims were combined claims. Of those claims, 90.8% were combined with sickness benefits.
One third of all Work-Sharing claims were combined with other benefit types (34.1%), predominantly regular benefits (79.5%). This is attributable to the fact that both benefit types are typically used during a downturn in business activity, which increases the risk of layoffs (Work-Sharing benefits) and actual layoffs (regular benefits). Regular benefits are claimed following Work-Sharing benefits, reflecting a continued downturn in a participating firm's activity that eventually leads to a downsizing of the firm's labour force (consult Section 2.5 for more details).
Maternity benefits were the benefits most often combined with other types of benefits, usually parental benefits (98.3%). However, a significant proportion also claimed sickness benefits with maternity benefits (14.3%), which can be claimed 12 weeks prior to the child's expected date of birth. The combination of sickness, maternity and parental benefits was the most common among claims with 3 or more benefit types (23,100 claims, which represented 13.3% of completed claims for maternity benefits in 2024-25).
Claims for parental benefits were combined at a lower rate (69.9%) than maternity, as only 10.2% of men who claimed parental also received another benefit payment. Of those male claimants, 86.4% received regular benefits and 14.9% claimed sickness benefits. Among women, virtually all (99.4%) who combined parental benefits with other types of benefits combined them with maternity benefits.
Sickness benefits were the third most likely to be combined with other benefit types (40.0%), mostly with regular benefits (82.1%). Men combined their sickness benefits predominantly with regular benefits (94.5%), while sickness claims from women were most often combined with regular (70.2%), maternity (26.5%) and parental benefits (25.2%).
When combined, compassionate care benefits were shared with sickness benefits (64.3%) or regular benefits (44.8%). Men tended to combine compassionate care benefits with regular benefits (58.6%) more often than women (39.0%). Women were more likely to combine compassionate care benefits with sickness benefits (70.5%) compared to men (49.6%).
Similar to compassionate care benefits, family caregiver benefits for both children and adults were most often combined with regular benefits by men (75.1% and 72.4%, respectively). Women were more likely to combine family caregiver benefits for children with sickness benefits (60.1%), and family caregiver benefits for adults with regular benefits (56.4%).
2.1.3 Benefits-to-contributions ratios
The EI benefits paid to eligible claimants who qualify are financed solely by the mandatory contributions (EI premiums) made by employers, employees and the self-employed persons who have opted into the EI program (consult Section 2.7). The amount of EI benefits paid relative to the contributions made provides useful insights into the usage of the program, especially when claimants are analyzed by their socio-demographic characteristics. This subsection examines the usage of the program by looking at 2 different ratios: the total benefits-to-contributions ratio (total B/C ratio) and the regular benefits-to-contributions ratio (regular B/C ratio) for 2023.Footnote 14 The tax data for the calendar year 2023 are the latest data available on contributions levels to calculate these ratios. As EI contributions are not assigned to specific benefit types, reductions in EI contributions related to special benefits are taken into account in the calculation of the regular B/C ratio.Footnote 15
The total B/C ratios and the regular B/C ratios presented below are normalized, with the ratio for Canada set at 1.0. Consequently, the adjusted total and regular B/C ratios provide a quick interpretation on the net usage of the EI program by socio-demographic characteristics relative to the national level. An adjusted ratio higher than 1.0 means that the underlying sub-population (such as region or industry) received comparatively more benefits than contributions made relative to the Canadian average, and is a net beneficiary of the EI program. On the other hand, an adjusted ratio lower than 1.0 means that the representing sub-population received comparatively less benefits than contributions made relative to the national level, and is a net contributor.
In 2023, the Atlantic provinces had adjusted total B/C ratios significantly above the national average, meaning claimants from these jurisdictions received comparatively more in EI benefits than the contributions made to the EI program (consult Chart 3). This is in line with previous years, as regions with larger shares of seasonal claimants tend to record a greater use of EI regular benefits by claimants in these regions compared with other regions. On the other hand, Ontario, British Columbia and the Northwest Territories had adjusted total B/C ratios below the national average, as claimants in these regions received comparatively less in EI benefits than the contributions made to the EI program. The remaining provinces and territories had ratios relatively close to the national level.

Text description
| Province or territory | Adjusted total benefits-to contributions ratio (left scale) | Adjusted regular benefits-to contributions ratio (left scale) | Adjusted benefits-to contributions ratio for Canada (left scale) | Unemployment rate (right scale) |
|---|---|---|---|---|
| Newfoundland and Labrador | 3.93 | 5.11 | 1.00 | 10.0% |
| Prince Edward Island | 2.97 | 3.21 | 1.00 | 7.2% |
| Nova Scotia | 1.64 | 1.86 | 1.00 | 6.4% |
| New Brunswick | 2.28 | 2.87 | 1.00 | 6.6% |
| Quebec | 0.99 | 1.08 | 1.00 | 4.5% |
| Ontario | 0.84 | 0.76 | 1.00 | 5.6% |
| Manitoba | 1.02 | 0.98 | 1.00 | 4.9% |
| Saskatchewan | 1.03 | 1.03 | 1.00 | 4.7% |
| Alberta | 0.94 | 0.89 | 1.00 | 5.9% |
| British Columbia | 0.85 | 0.78 | 1.00 | 5.2% |
| Yukon | 0.94 | 0.94 | 1.00 | 3.6% |
| Northwest Territories | 0.85 | 0.88 | 1.00 | 5.7% |
| Nunavut | 1.03 | 1.08 | 1.00 | 13.1% |
- * Provincial and territorial B/C ratios are determined by the residence of employees for premiums paid and by the residence of claimants for benefits received.
- Consult Annex 2.30 for more details.
- Sources: Canada Revenue Agency (CRA), T4 slips with employment income (for data on contributions). Results are based on 100% of CRA data. Employment and Social Development Canada, Employment Insurance (EI) administrative data (for data on benefits). Results are based on 100% of EI administrative data. Statistics Canada, Labour Force Survey, Tables 14-10-0287-01 and 14-10-0292-01 (for data on unemployment rates).
When only considering EI regular benefits, the adjusted regular B/C ratios by province and territory were similar to their respective adjusted total B/C ratios. The Atlantic provinces still received comparatively more benefits than contributions made compared to the Canadian average, while Ontario, British Columbia, the Northwest Territories and Alberta remained below the Canadian average. The remaining provinces and territories had ratios that were close to the national level.
In 2023, the EI premium rate increased to $1.63 per $100 of insurable earnings, following 3 years at the 2020 rate of $1.58 per $100 of insurable earnings. This increase, along with the increase in the maximum insurable earnings, led to higher EI contributions compared to the previous year, while the amount of EI benefits paid continued to decline. As a result, both the adjusted total B/C ratio and the adjusted regular B/C ratio for most provinces and territories experienced a slight decrease compared to 2022.
In terms of gender, as in the past, women had a higher adjusted total B/C ratio (1.12) than men (0.90) in 2023. This is partly due to the fact that women aged 25 to 44 are more likely to receive EI maternity or parental benefits or both. Trends are generally reversed when only EI regular benefits are considered, as men represent a greater share of EI regular claimants. Men showed a higher adjusted regular B/C ratio (1.19) than women (0.77) in 2023 (consult Table 6). The gap between both genders increased compared to 2022 where ratios were 1.14 and 0.83, respectively.
| Age category | Adjusted total B/C ratio for men | Adjusted total B/C ratio for women | Adjusted total B/C ratio for both genders | Adjusted regular B/C ratio for men | Adjusted regular B/C ratio for women | Adjusted regular B/C ratio for both genders |
|---|---|---|---|---|---|---|
| 24 years old and under | 0.95 | 0.78 | 0.87 | 1.24 | 0.59 | 0.96 |
| 25 to 44 years old | 0.83 | 1.53 | 1.14 | 1.08 | 0.70 | 0.91 |
| 45 to 54 years old | 0.75 | 0.62 | 0.69 | 1.01 | 0.73 | 0.88 |
| 55 years old and over | 1.19 | 0.84 | 1.04 | 1.62 | 1.04 | 1.36 |
| Total | 0.90 | 1.12 | 1.00 | 1.19 | 0.77 | 1.00 |
Sources: Canada Revenue Agency (CRA), T4 slips with employment income (for data on contributions). Results are based on 100% of CRA data. Employment and Social Development Canada, Employment Insurance (EI) administrative data (for data on benefits). Results are based on 100% of EI administrative data.
Consistent with the previous year, in 2023, claimants aged 25 to 44 years had the highest adjusted total B/C ratio, while those aged 55 years and over had the highest adjusted regular B/C ratio. Claimants aged 24 and under shifted from being net beneficiaries of the EI program in 2022 to net contributors in 2023, both when considering all types of EI benefits and when looking solely at EI regular benefits, returning to their typical pre-pandemic status as net contributors.
Similar to the previous year, in 2023, claimants working in the goods-producing industries were net beneficiaries of the EI program, while those working in the services-producing industries were net contributors (consult Annex 2.30). This may be due to the larger proportion of seasonal employment in the goods-producing industries, notably the Agriculture, forestry, fishing and hunting industry and the Construction industry. As seasonal employment fluctuates during certain periods of the year, workers employed in these industries generally rely on EI benefits during the "off-seasons", leading to higher adjusted regular B/C ratios.
As shown in Chart 4, in 2023, the Construction industry received significantly more in EI regular benefits for each dollar they contributed in premiums than in 2022 (3.01 versus 2.72, respectively). In contrast, the Accommodation and food services industries received significantly less than the previous year (1.12 in 2023 compared to 1.49 in 2022). These shifts brought the ratios of these two industries closer to pre-pandemic levels, which were 3.28 and 1.14, respectively.

Text description
| Industry | Adjusted regular benefits-to contributions ratio for 2022 | Adjusted regular benefits-to contributions ratio for 2023 | Adjusted regular benefits-to contributions ratio for Canada |
|---|---|---|---|
| Goods-producing industries | 1.74 | 1.86 | 1.00 |
| Agriculture, forestry, fishing and hunting | 4.22 | 4.07 | 1.00 |
| Mining, quarrying, and oil and gas extraction | 1.15 | 1.34 | 1.00 |
| Utilities | 0.32 | 0.33 | 1.00 |
| Construction | 2.72 | 3.01 | 1.00 |
| Manufacturing | 0.93 | 0.94 | 1.00 |
| Services-producing industries | 0.78 | 0.74 | 1.00 |
| Wholesale trade and retail trade | 0.73 | 0.65 | 1.00 |
| Transportation and warehousing | 1.00 | 0.91 | 1.00 |
| Finance, insurance, real estate, rental and leasing | 0.41 | 0.42 | 1.00 |
| Professional, scientific and technical services | 0.63 | 0.90 | 1.00 |
| Business, building and other support services* | 1.36 | 1.41 | 1.00 |
| Educational services | 1.10 | 1.05 | 1.00 |
| Health care and social assistance | 0.47 | 0.36 | 1.00 |
| Information, culture and recreation** | 0.90 | 1.08 | 1.00 |
| Accommodation and food services | 1.49 | 1.12 | 1.00 |
| Other services (except public administration) | 1.05 | 0.93 | 1.00 |
| Public administration | 0.51 | 0.43 | 1.00 |
- * This industry sector comprises the industries with codes 55 (Management of companies and enterprises) and 56 (Administrative and support, waste management and remediation services).
- ** This industry sector comprises the industries with codes 51 (Information and cultural industries) and 71 (Arts, entertainment and recreation).
- Consult Annex 2.30 for more details on 2023.
- Sources: Canada Revenue Agency (CRA), T4 slips with employment income (for data on contributions). Results are based on 100% of CRA data. Employment and Social Development Canada, Employment Insurance (EI) administrative data (for data on benefits). Results are based on 100% of EI administrative data.
The difference between the goods-producing industries and the services-producing industries is less significant for the adjusted total B/C ratio (consult Annex 2.30). This may be due in part to the larger proportion of women working in certain services-producing industries, such as the Health care and social assistance industry and the Educational services industry. Women can claim EI maternity or parental or both benefits and thus increase the relative use of EI benefits in these industries.
2.2 Employment Insurance regular benefits
In this section
- 2.2.1 Employment Insurance regular claims and benefits paid
- 2.2.2 Coverage, eligibility and access to Employment Insurance regular benefits for the unemployed population
- 2.2.3 Level of Employment Insurance regular benefits
- 2.2.4 Employment Insurance regular benefit entitlement
- 2.2.5 Exhaustion of Employment Insurance regular benefits
- 2.2.6 Employment Insurance regular benefits and seasonal claimants
- 2.2.7 Working while on claim
Employment Insurance (EI) regular benefits are designed to provide temporary income support to partially replace lost employment income for eligible claimants, helping them as they look for a new job and remain active in the labour force.
To qualify for EI regular benefits, claimants must:
- be unemployed
- have worked a minimum number of hours of insurable employment during their qualifying period (defined as either the previous 52 weeks or since the establishment of their last claim, whichever is shorter), ranging from 420 to 700 hours, depending on the regional unemployment rate where the claimant lived at the time of the establishment of the claim, and
- have a valid reason for job separation under the Employment Insurance Act
While receiving regular benefits, claimants must also prove that they are capable of and available for work and unable to obtain suitable employment for each working day of their claim.Footnote 16
2.2.1 Employment Insurance regular claims and benefits paid
In 2024-25, a total of 1.40 million new claims for EI regular benefits were established, an increase of 2.0% compared to 1.37 million claims in 2023-24. The total amount paid in regular benefits reached $14.3 billion in 2024-25, up 11.5% from $12.3 billion in the previous fiscal year. This amount represents a historical high, excluding the pandemic years (consult Chart 5).

Text description
| Fiscal year | New claims established (millions) | Amount paid ($ billions) |
|---|---|---|
| 2015-16 | 1.43 | $12.1 |
| 2016-17 | 1.32 | $12.7 |
| 2017-18 | 1.30 | $12.6 |
| 2018-19 | 1.29 | $10.7 |
| 2019-20 | 1.37 | $11.1 |
| 2020-21* | Not available | Not available |
| 2021-22** | 1.46 | $28.6 |
| 2022-23** | 1.29 | $12.3 |
| 2023-24 | 1.37 | $12.8 |
| 2024-25 | 1.40 | $14.3 |
- Note: Includes claims for which at least $1 of EI regular benefits was paid.
- * Claims for EI regular benefits could not be established during the first half of 2020-21, due to the implementation of the Canada Emergency Response Benefits. Consequently, results for 2020-21 are not comparable with other fiscal years.
- ** Different EI temporary measures affecting the eligibility for EI regular benefits and the amount paid in EI benefits were in effect from September 27, 2020 to September 24, 2022.
- Source: Employment and Social Development Canada, Employment Insurance (EI) administrative data. Results are based on a 10% sample of data for 2015-16 to 2022-23 and 100% of data for 2023-24 and 2024-25.
In general, the number of new claims established for EI regular benefits during a given period tends to be influenced by labour market conditions and economic cycles. Fewer claims for EI regular benefits are expected during periods of economic growth and favourable labour market conditions, while more claims are expected during periods of economic stagnation and unfavourable labour market conditions.
As mentioned in Chapter 1, Canada experienced continued easing of labour market conditions in 2024-25. The labour force grew by 2.9% compared to the previous fiscal year, while employment rose by 1.8% during the same period. Consequently, the total number of unemployed individuals increased from 1.2 million in 2023-24 to 1.5 million in 2024-25 (+20.8%). This was reflected in the national unemployment rate, which increased from an average of 5.6% in 2023-24 to 6.6% in 2024-25, with a rate of 6.2% in April 2024 and of 6.7% in March 2025. Despite clear indicators of a looser labour market, the increase in new claims established for EI regular benefits was small, rising by 27,600 (+2.0%) compared to the previous fiscal year.
This divergence suggests there may be a growing disconnect between the number of unemployed individuals and utilization of EI regular benefits. A key factor driving the increase in unemployment between 2023-24 and 2024-25 appears to be the increase in individuals who were previously not active in the labour force, such as those who were attending school, staying at home or waiting to start new jobs. These individuals are less likely to meet EI eligibility requirements, which require recent insurable employment. In addition, demographic changes due to immigration patterns may be contributing to the emerging disconnect between unemployment and EI regular benefit utilization. A recent departmental study suggested that immigrants, particularly non-permanent residents, are less likely to qualify for EI due to limited work history or non-standard employment arrangements.Footnote 17
While the rise in the total amount paid in EI regular benefits between 2023-24 and 2024-25 (+11.5%) can be attributed in part to increases in the number of new claims established for EI regular benefits, in the average weekly regular benefit rate (consult Section 2.2.3) and in the average actual duration of regular claims (consult Section 2.2.4), it was primarily driven by a higher number of beneficiaries receiving these benefits in 2024-25. On average, just over 488,000 beneficiaries were receiving EI regular benefits each month in 2024-25, compared to 448,000 in 2023-24 (+9.0%) and 446,000 in 2022-23.Footnote 18
A key reason for the higher number of beneficiaries in 2024-25 was the 6.7% increase in new EI regular claims established in 2023-24, compared with only a 2.0% increase in 2024-25. Because the number of beneficiaries usually lags behind new claims established, it can remain elevated even after labour market conditions improve, as benefits continue to be paid for previously established claims until benefits are exhausted or claimants find employment. As a result, many of the claimants who established a claim in 2023-24 likely continued to receive benefits in 2024-25, contributing to the higher beneficiary count that year, and as a result, a higher total amount paid.
Employment Insurance regular claims and amount paid by province or territory, gender and age
Table 7 outlines the number of new claims established for EI regular benefits and the amount paid in benefits by province or territory, gender and age. Compared to the previous fiscal year, the number of new claims established increased in Quebec, Ontario, the Prairies and British Columbia, while it decreased in the Atlantic provinces and the territories. Ontario had the highest relative increase compared to 2023-24, with an increase of 5.5% (+23,400 claims).
| Category | New claims established 2023-24 | New claims established 2024-25 | Change (%) in new claims established | Amount paid ($ millions) 2023-24 | Amount paid ($ millions) 2024-25 | Change (%) in amount paid |
|---|---|---|---|---|---|---|
| Newfoundland and Labrador | 57,643 | 56,005 | -2.8% | $784.9 | $799.6 | +1.9% |
| Prince Edward Island | 14,985 | 14,862 | -0.8% | $177.9 | $187.9 | +5.6% |
| Nova Scotia | 53,649 | 52,611 | -1.9% | $573.7 | $608.2 | +6.0% |
| New Brunswick | 61,104 | 60,871 | -0.4% | $691.1 | $721.8 | +4.4% |
| Quebec | 395,053 | 396,116 | +0.3% | $3,075.7 | $3,332.4 | +8.3% |
| Ontario | 423,113 | 446,542 | +5.5% | $3,808.1 | $4,651.7 | +22.2% |
| Manitoba | 44,835 | 45,446 | +1.4% | $424.4 | $453.1 | +6.8% |
| Saskatchewan | 36,188 | 36,794 | +1.7% | $389.7 | $410.2 | +5.3% |
| Alberta | 140,200 | 144,457 | +3.0% | $1,433.5 | $1,605.6 | +12.0% |
| British Columbia | 143,956 | 145,030 | +0.7% | $1,403.7 | $1,470.6 | +4.8% |
| Yukon | 1,553 | 1,532 | -1.4% | $18.0 | $18.8 | +4.0% |
| Northwest Territories | 1,720 | 1,323 | -23.1% | $18.1 | $18.0 | -0.3% |
| Nunavut | 814 | 798 | -2.0% | $13.4 | $13.0 | -3.1% |
| Men | 829,115 | 847,962 | +2.3% | $8,421.9 | $9,401.0 | +11.6% |
| Women | 545,698 | 554,425 | +1.6% | $4,390.2 | $4,889.9 | +11.4% |
| 24 years old and under | 127,012 | 127,431 | +0.3% | $1,099.4 | $1,198.6 | +9.0% |
| 25 to 44 years old | 640,386 | 656,795 | +2.6% | $5,910.0 | $6,638.8 | +12.3% |
| 45 to 54 years old | 260,187 | 266,103 | +2.3% | $2,406.5 | $2,683.0 | +11.5% |
| 55 years old and over | 347,228 | 352,058 | +1.4% | $3,396.2 | $3,770.4 | +11.0% |
| Canada | 1,374,813 | 1,402,387 | +2.0% | $12,812.1 | $14,290.9 | +11.5% |
- Note: Data may not add up to the total due to rounding. Percentage change is based on unrounded numbers. Includes claims for which at least $1 of EI regular benefits was paid.
- Consult Annex 2.5 for more details.
- Source: Employment and Social Development Canada, Employment Insurance (EI) administrative data. Results are based on 100% of data.
Chart 6 illustrates the distribution of the labour force across provinces in comparison with the distribution of EI regular claims in 2024-25. The share of EI regular claims established in the Atlantic provinces and in Quebec was higher than their relative share of the labour force in 2024-25.

Text description
| Province | Share of labour force (%) | Share of regular claims established (%) |
|---|---|---|
| Newfoundland and Labrador | 1.2% | 4.0% |
| Prince Edward Island | 0.5% | 1.1% |
| Nova Scotia | 2.5% | 3.8% |
| New Brunswick | 1.9% | 4.3% |
| Quebec | 21.8% | 28.2% |
| Ontario | 39.6% | 31.8% |
| Manitoba | 3.5% | 3.2% |
| Saskatchewan | 2.9% | 2.6% |
| Alberta | 12.2% | 10.3% |
| British Columbia | 13.9% | 10.3% |
- Note: Data may not add up to the total due to rounding. Includes claims for which at least $1 of EI regular benefits was paid.
- * The territories are not included as they represent a small share of EI regular claims established.
- Source: Employment and Social Development Canada, Employment Insurance (EI) administrative data. Results are based on 100% of data. Statistics Canada, Labour Force Survey, Table 14-10-0287-01.
The amount paid in regular benefits in 2024-25 increased in all provinces and territories, except for the Northwest Territories (-$0.1 million) and Nunavut (-$0.4 million). Ontario had the highest relative increase in EI regular benefits paid compared the previous fiscal year, with an additional $843.6 million (+22.2%) paid to claimants from this province. This is consistent with Ontario having the highest increase in the number of new EI regular claims established among all regions this fiscal year.
Men established most EI regular claims (60.5%) and received most of the amount paid in EI regular benefits (65.8%) in 2024-25. These shares are similar to those recorded in 2023-24 and during the pre-pandemic years. Both men and women had comparable relative increases in EI regular claims established (+2.3% and +1.6% respectively) in 2024-25. Similarly, the amount paid in EI regular benefits increased by 11.6% for men and 11.4% for women.
The number of new EI regular claims established and regular benefits paid increased among all age groups in 2024-25. Claimants aged 25 to 44 years represented both the highest share of claims established (46.8%) and benefits paid (46.5%), while those aged 24 years old and under represented the lowest shares of claims established (9.1%) and the amount paid in regular benefits (8.4%). The distribution of claims established and regular benefits paid was similar across all age groups compared to the previous fiscal year.
Employment Insurance regular claims and amount paid by industry
The number of new EI regular claims increased by 23,800 (+2.9%) in services-producing industries in 2024-25, while it remained relatively stable in goods-producing industries, with a minor decrease of 1,700 claims (-0.3%) (consult Table 8). The number of new EI regular claims increased across all services-producing industries except for Information, culture and recreation (-5.8%), with the highest relative increase compared to 2023-24 recorded in Public administration (+9.7%).
| Industry | New claims established (% share) 2023-24 | New claims established (% share) 2024-25 | Change (%) in new claims established | Amount paid ($ millions) (% share) 2023-24 | Amount paid ($ millions) (% share) 2024-25 | Change (%) in amount paid |
|---|---|---|---|---|---|---|
| Goods-producing industries | 513,992 (37.4%) |
512,313 (36.5%) |
-0.3% | $5,189.5 (40.5%) |
$5,661.4 (39.6%) |
+9.1% |
| Agriculture, forestry, fishing and hunting | 48,672 (3.5%) |
46,646 (3.3%) |
-4.2% | $573.3 (4.5%) |
$575.6 (4.0%) |
+0.4% |
| Mining, quarrying, and oil and gas extraction | 23,064 (1.7%) |
22,202 (1.6%) |
-3.7% | $274.9 (2.1%) |
$280.8 (2.0%) |
+2.1% |
| Utilities | 3,467 (0.3%) |
4,058 (0.3%) |
+17.0% | $34.0 (0.3%) |
$42.6 (0.3%) |
+25.2% |
| Construction | 306,784 (22.3%) |
303,878 (21.7%) |
-0.9% | $3,056.9 (23.9%) |
$3,263.9 (22.8%) |
+6.8% |
| Manufacturing | 132,005 (9.6%) |
135,529 (9.7%) |
+2.7% | $1,250.4 (9.8%) |
$1,498.6 (10.5%) |
+19.8% |
| Services-producing industries | 831,039 (60.4%) |
854,888 (61.0%) |
+2.9% | $7,331.2 (57.2%) |
$8,247.1 (57.7%) |
+12.5% |
| Wholesale and retail trade | 108,873 (7.9%) |
113,120 (8.1%) |
+3.9% | $1,078.2 (8.4%) |
$1,270.3 (8.9%) |
+17.8% |
| Transportation and warehousing | 67,084 (4.9%) |
70,558 (5.0%) |
+5.2% | $570.1 (4.5%) |
$663.1 (4.6%) |
+16.3% |
| Finance, insurance, real estate, rental and leasing | 32,958 (2.4%) |
34,666 (2.5%) |
+5.2% | $360.8 (2.8%) |
$448.6 (3.1%) |
+24.3% |
| Professional, scientific and technical services | 74,932 (5.5%) |
78,164 (5.6%) |
+4.3% | $901.3 (7.0%) |
$963.3 (6.7%) |
+6.9% |
| Business, building and other support services* | 97,566 (7.1%) |
98,205 (7.0%) |
+0.7% | $964.8 (7.5%) |
$1,076.1 (7.5%) |
+11.5% |
| Educational services | 185,799 (13.5%) |
187,712 (13.4%) |
+1.0% | $963.3 (7.5%) |
$1,024.9 (7.2%) |
+6.4% |
| Health care and social assistance | 49,827 (3.6%) |
52,288 (3.7%) |
+4.9% | $438.2 (3.4%) |
$494.9 (3.5%) |
+12.9% |
| Information, culture and recreation** | 49,278 (3.6%) |
46,407 (3.3%) |
-5.8% | $472.5 (3.7%) |
$515.6 (3.6%) |
+9.1% |
| Accommodation and food services | 62,020 (4.5%) |
62,546 (4.5%) |
+0.8% | $531.9 (4.2%) |
$582.2 (4.1%) |
+9.5% |
| Other services (except public administration) | 37,219 (2.7%) |
39,389 (2.8%) |
+5.8% | $366.9 (2.9%) |
$430.3 (3.0%) |
+17.3% |
| Public administration | 65,483 (4.8%) |
71,833 (5.1%) |
+9.7% | $683.2 (5.3%) |
$777.7 (5.4%) |
+13.8% |
| Unclassified industries*** | 29,782 (2.2%) |
35,186 (2.5%) |
+18.1% | $291.4 (2.3%) |
$382.4 (2.7%) |
+31.2% |
| Canada | 1,374,813 (100.0%) |
1,402,387 (100.0%) |
+2.0% | $12,812.1 (100.0%) |
$14,290.9 (100.0%) |
+11.5% |
- Note: Data may not add up to the total due to rounding. Percentage shares and change are based on unrounded numbers. Includes claims for which at least $1 of EI regular benefits was paid.
- * This industry sector comprises the industries with codes 55 (Management of companies and enterprises) and 56 (Administrative and support, waste management and remediation services).
- ** This industry sector comprises the industries with codes 51 (Information and cultural industries) and 71 (Arts, entertainment and recreation).
- *** For some claims, this information was not available in the data.
- Consult Annex 2.6 for more details.
- Source: Employment and Social Development Canada, Employment Insurance (EI) administrative data. Results are based on 100% of data.
Overall, services-producing industries accounted for the majority (61.0%) of EI regular claims established in 2024-25, an increase of 0.6 percentage points (p.p.) from the previous fiscal year. The Construction industry continued to represent the highest share of new EI regular claims (21.7%) among all industries, despite a small decrease (-0.9%) compared to the previous fiscal year.
The amount paid in EI regular benefits increased in both services-producing industries (+12.5%) and goods-producing industries (+9.1%) in 2024-25. Compared to the previous fiscal year, the amount paid in EI regular benefits increased across all individual industries, with the Construction industry accounting for the highest share (22.8% of the total amount paid).
Employment Insurance benefit repayments
EI benefit payments are considered taxable income, regardless of the type of benefits received. Depending on their net income and whether they received EI regular benefits, including fishing benefits and Work-sharing benefits, individuals may be required to repay a portion of these benefits when filing their income tax return.
Under the Employment Insurance Act, claimants must repay a portion of EI benefits they received if their net incomeFootnote 19 for a year exceeds 1.25 times the maximum yearly insurable earnings.Footnote 20 In such cases, claimants are required to repay 30% of the lesser of:
- the amount of net income exceeding the threshold, or
- the total regular benefits, including fishing benefits and Work-sharing benefits, received during the taxation year
The threshold was $76,875 for the 2023 taxation year, which was the most recent data period available at the time this report was produced. Claimants who received EI special benefits are exempt from the benefit repayment requirement.Footnote 21 In addition, those who received less than one week of EI regular or fishing benefits in the previous 10 taxation years are also exempt from repaying benefits.
In the 2023 taxation year, approximately 171,000 claimants repaid a total of $278.6 million in EI benefits (consult Table 9). Compared to 2022, this represents a decrease of 3.9% in the number of claimants who repaid benefits and 3.7% in the amount repaid. On average, each claimant subject to the benefit repayment provision repaid $1,633, an amount similar to 2022, despite each claimant receiving, on average, slightly higher benefits in 2023 ($7,046) compared to 2022 ($6,871).
| Category* | EI claimants who repaid benefits | Amount repaid ($ millions) |
|---|---|---|
| Newfoundland and Labrador | 10,668 | $25.9 |
| Prince Edward Island | 1,312 | $4.4 |
| Nova Scotia | 6,480 | $17.8 |
| New Brunswick | 5,163 | $12.1 |
| Quebec | 49,610 | $60.7 |
| Ontario | 43,000 | $63.5 |
| Manitoba | 3,281 | $5.5 |
| Saskatchewan | 4,713 | $8.2 |
| Alberta | 27,223 | $48.5 |
| British Columbia | 18,521 | $30.9 |
| Yukon | 297 | $0.6 |
| Northwest Territories | 222 | $0.4 |
| Nunavut | 97 | $0.2 |
| Non-residents of Canada | n/a | n/a |
| Men | 148,045 | $244.2 |
| Women | 22,542 | $34.4 |
| 24 years old and under | 4,346 | $6.5 |
| 25 to 44 years old | 77,885 | $113.4 |
| 45 to 54 years old | 37,674 | $60.9 |
| 55 years old and over | 50,682 | $97.8 |
| Canada | 170,587 | $278.6 |
- Note: Data may not add up to the total due to rounding.
- * For confidentiality purposes, data for non-residents of Canada have been combined with those for Quebec.
- Consult Annex 2.28 for more details.
- Source: Employment and Social Development Canada, Employment Insurance (EI) administrative data. Results are based on 100% of data.
The majority of claimants who repaid benefits were men (86.8%) and were aged between 25 and 44 years (45.7%). These shares were similar to the ones observed in recent years.
Claimants who worked in goods-producing industries continued to account for the majority of individuals who repaid benefits (65.7%) and the amount repaid (64.3%) in 2023. Both shares increased in 2023 and are now similar to pre-pandemic levels, as a higher share of claimants from the services-producing industries repaid benefits in 2021 and 2022 following an increase in claimants from these industries during the COVID-19 pandemic. The Construction industry represented the largest share of claimants who repaid benefits (48.1%) and the amount repaid (44.6%) in 2023, with the share of claimants who repaid benefits from this industry reaching its highest level in over 8 years.
Employment Insurance regular benefits and firms
According to the 2023 tax data, the most recent data available at the time this report was produced, approximately 1.32 million firmsFootnote 22 operated in Canada in 2023, which is similar to the number reported in 2022 (consult Table 10). Of all Canadian firms that operated in 2023, about 307,000 firms (23.3%) employed at least one person who had received EI regular benefits during that year. This represented a decrease of approximately 34,600 firms compared to the previous taxation year, when 26.0% of firms employed at least one person who had received EI regular benefits during the same year (-2.7 p.p.).
| Firm size* | Number of firms 2022 | Number of firms 2023 | Number of firms with at least one employee who received EI regular benefits 2022 | Number of firms with at least one employee who received EI regular benefits 2023 |
|---|---|---|---|---|
| Small** | 1,193,372 | 1,194,575 | 245,476 | 216,266 |
| Small-medium | 101,110 | 102,995 | 75,967 | 70,444 |
| Medium-large | 17,434 | 17,933 | 16,675 | 16,671 |
| Large | 3,472 | 3,610 | 3,462 | 3,590 |
| Canada | 1,315,388 | 1,319,113 | 341,580 | 306,971 |
- Note: Data may not add up due to rounding.
- * Small firms are defined as those that employ 1 to 19 individuals. Small-to-medium firms employ 20 to 99 individuals. Medium-to-large firms employ 100 to 499 individuals. Large firms employ 500 individuals or more.
- ** This category also includes firms for which the firm's size could not be determined based on the tax records.
- Source: Employment and Social Development Canada, Employment Insurance (EI) administrative data. Results are based on 100% of EI administrative data. Canada Revenue Agency (CRA), CRA administrative data. Results are based on 100% of CRA data.
Consistent with past trends, the share of firms with at least one employee who received EI regular benefits increases with firm size. In 2023, 18.1% of small firms had at least one former employee who received EI regular benefits. That share increased to 68.4% for small-to-medium firms, 93.0% for medium-to-large firms and 99.4% for large firms. These shares were lower in 2023 than in 2022 across all firm sizes.
Employees from smaller firms remained overrepresented among claimants for EI regular benefits in 2023 when comparing the distribution of claimants by firm size to the distribution of the overall workforce by firm size (consult Table 11). Small firms accounted for 20.7% of the total workforce in 2023, while representing 27.4% of all claimants for EI regular benefits. Similarly, small-to-medium firms represented 19.5% of the workforce and 23.4% of claimants. On the other hand, large firms represented 43.5% of the workforce compared to only 32.1% of claimants. Certain industry-related characteristics, such as the greater prevalence of seasonal jobs in smaller firms may have an influence on this pattern, as employees from these firms are generally more likely to rely on EI benefits, relative to other industries.Footnote 23
| Firm size* | Distribution of workforce*** (% share) | Distribution of claimants who received EI regular benefits**** (% share) |
|---|---|---|
| Small** | 20.7% | 27.4% |
| Small-medium | 19.5% | 23.4% |
| Medium-large | 16.3% | 17.2% |
| Large | 43.5% | 32.1% |
| Canada | 100.0% | 100.0% |
- Note: Data may not add up due to rounding.
- * Small firms are defined as those that employ 1 to 19 individuals. Small-to-medium firms employ 20 to 99 individuals. Medium-to-large firms employ 100 to 499 individuals. Large firms employ 500 individuals or more.
- ** This category also includes firms for which the firm's size could not be determined based on the tax records.
- *** The number of workers in a firm is the number of individuals with employment income in that firm, as indicated on a T4 form. The number of workers is adjusted so that each individual in the labour force is only counted once and individuals who work for more than one firm are taken into account. For example, if an employee earned $25,000 in firm 1 and $25,000 in firm 2, that employee was recorded as 0.5 employees at the first firm and 0.5 employees at the second firm.
- **** These are based on the number of people who received EI regular benefits in 2023.
- Source: Employment and Social Development Canada, Employment Insurance (EI) administrative data. Results are based on 100% of EI administrative data. Canada Revenue Agency (CRA), CRA administrative data. Results are based on 100% of CRA data.
Employment Insurance regular claims and amount paid by claimant category
To analyze claimants' employment patterns, this report classifies EI regular claims into 3 categories based on EI premiums paid and benefits used in recent years. Prior to their most recent claim, long-tenured workers typically had strong labour market attachment and minimal EI usage. Frequent claimants had established multiple EI claims and received several weeks of benefits over the past few years. Occasional claimants represent all other patterns of claims established.Footnote 24
By age group, long-tenured workers are mostly found among claimants aged 35-44, 45-54 and 55 years and over. Frequent claimants are mostly found among men aged 55 years and over, primarily from the Atlantic provinces, and are employed in goods-producing industries.
Table 12 shows the number of claims established for EI regular benefits and the amount paid by claimant category. The number of new claims established in 2024-25 increased in all 3 categories, with a notable increase of 13,400 claims among long-tenured workers (+4.3%). Despite this increase, occasional claimants continued to account for more than half (56.8%) of the share of EI regular claims established in 2024-25. Similarly, the amount paid in EI regular benefits increased in all 3 categories, with long-tenured workers having the highest relative increase (+19.1%) from the previous fiscal year.
| Claimant category | New claims established 2023-24 | New claims established 2024-25 | Change (%) in new claims established | Amount paid ($ millions) 2023-24 | Amount paid ($ millions) 2024-25 | Change (%) in amount paid |
|---|---|---|---|---|---|---|
| Long-tenured workers | 312,990 | 326,422 | +4.3% | $2,627.1 | $3,128.1 | +19.1% |
| Occasional claimants | 783,196 | 796,220 | +1.7% | $7,044.7 | $7,891.9 | +12.0% |
| Frequent claimants | 278,627 | 279,745 | +0.4% | $3,140.3 | $3,270.9 | +4.2% |
| Canada | 1,374,813 | 1,402,387 | +2.0% | $12,812.1 | $14,290.9 | +11.5% |
- Note: Data may not add up to the total due to rounding. Percentage change is based on unrounded numbers. Includes claims for which at least $1 of EI regular benefits was paid.
- Consult Annex 2.5 for more details.
- Source: Employment and Social Development Canada, Employment Insurance (EI) administrative data. Results are based on 100% of data.
Employment Insurance regular claims by hours of insurable employment and unemployment rate in the EI region of establishment
To qualify for EI regular benefits, claimants must have worked a minimum number of insurable hours during their qualifying period, ranging from 420 to 700 hours. This requirement, known as the Variable Entrance Requirement (VER), depends on the unemployment rate in the EI region where the claimant resides at the time of submitting their application for EI benefits (consult Table 13). The higher the regional unemployment rate, the fewer hours of insurable employment required to qualify for EI regular benefits, and vice versa (consult Annex 2.2 for a full breakdown). A detailed discussion on the eligibility and access to EI regular benefits is provided in subsection 2.2.2.
| Regional unemployment rate | Variable entrance requirement |
|---|---|
| 6.0% and under | 700 hours |
| 6.1% to 7.0% | 665 hours |
| 7.1% to 8.0% | 630 hours |
| 8.1% to 9.0% | 595 hours |
| 9.1% to 10.0% | 560 hours |
| 10.1% to 11.0% | 525 hours |
| 11.1% to 12.0% | 490 hours |
| 12.1% to 13.0% | 455 hours |
| More than 13.0% | 420 hours |
Chart 7 shows the distribution of EI regular claims by the number of hours of insurable employment used to qualify, for both men and women. Overall, men tend to accumulate more hours than women before establishing a claim. In 2024-25, 31.3% of claims for EI regular benefits established by men had 1,820 or more hours of insurable employment, compared to 21.3% of claims established by women. Similarly, just under half of claims established by men (48.7%) had 1,540 hours or more, compared to 37.9% of women. On the other hand, claimants who accumulated between 420 and 699 hours of insurable employment represented the smallest share for both genders, with women at a slightly higher share (3.5%) than men (3.1%). Both of these shares were slightly higher than the previous fiscal year (+0.6 p.p. and +0.7 p.p., respectively).

Text description
| Hours of insurable employment | Share of claims (% of total) men | Share of claims (% of total) women |
|---|---|---|
| 420 to 699 hours | 3.1% | 3.5% |
| 700 to 979 hours | 15.2% | 17.0% |
| 980 to 1,259 hours | 16.5% | 19.2% |
| 1,260 to 1,539 hours | 16.4% | 22.4% |
| 1,540 to 1,819 hours | 17.5% | 16.7% |
| 1,820 hours and more | 31.3% | 21.3% |
- Note: Data may not add up to the total due to rounding. Includes claims for which at least $1 of EI regular benefits was paid.
- Consult Annex 2.7 for more details.
- Source: Employment and Social Development Canada, Employment Insurance (EI) administrative data. Results are based on 100% of data.
Table 14 presents the number and distribution of EI regular claims established in 2024-25, along with the labour force and unemployed population by regional unemployment rate. In 2024-25, EI regions with an unemployment rate of 6.0% or lower accounted for the highest share of EI regular claims established (35.0%) and the labour force (31.8%). However, these shares are significantly lower than in 2023-24, when these regions represented 61.6% of EI regular claims (-26.6 p.p.) and 62.6% of the labour force (-30.8 p.p.). The distribution of EI regular claims established in 2024-25 is more similar to the one observed during the pre-pandemic years than the one in recent years.
| Unemployment rate | Number of claims (thousands) (% share) 2024-25 |
Labour force (thousands) (% share) 2024-25 |
Number of unemployed (thousands) (% share) 2024-25 |
|---|---|---|---|
| 6.0% or lower | 490.6 (35.0%) |
7,091.5 (31.8%) |
362.9 (23.8%) |
| 6.1% to 7% | 366.3 (26.1%) |
6,615.6 (29.6%) |
429.7 (28.2%) |
| 7.1% to 8% | 222.2 (15.8%) |
4,271.5 (19.1%) |
327.0 (21.4%) |
| 8.1% to 9% | 166.1 (11.8%) |
3,439.3 (15.4%) |
289.8 (19.0%) |
| 9.1% to 10% | 56.8 (4.1%) |
354.9 (1.6%) |
33.5 (2.2%) |
| 10.1% to 11% | 22.1 (1.6%) |
136.7 (0.6%) |
14.1 (0.9%) |
| 11.1% to 12% | 19.7 (1.4%) |
126.1 (0.6%) |
14.1 (0.9%) |
| 12.1% to 13% | 8.5 (0.6%) |
24.4 (0.1%) |
3.1 (0.2%) |
| 13.1% to 14% | 27.9 (2.0%) |
71.7 (0.3%) |
9.8 (0.6%) |
| 14.1% to 15% | 8.7 (0.6%) |
75.8 (0.3%) |
11.1 (0.7%) |
| 15.1% to 16% | 5.8 (0.4%) |
63.6 (0.3%) |
9.7 (0.6%) |
| 16.1% or higher | 7.6 (0.5%) |
61.3 (0.3%) |
20.3 (1.3%) |
| Canada | 1,402.4 (100.0%) |
22,332.3 (100.0%) |
1,525.2 (100.0%) |
- Note: Data may not add up to the total due to rounding. Includes claims for which at least $1 of EI regular benefits was paid.
- * Unemployment rates used for the Employment Insurance program are a 3-month moving average of seasonally adjusted rates of unemployment produced by Statistics Canada, as per section 17 of the Employment Insurance Regulations.
- Consult Annex 2.7 for more details.
- Source: Employment and Social Development Canada, Employment Insurance (EI) administrative data. Results are based on 100% of data. Statistics Canada, special tabulations from the Labour Force Survey.
As previously mentioned, the share of EI regular claims in regions with an unemployment rate of 6.0% or lower decreased significantly in 2024-25 compared to recent fiscal years. Chart 8 shows this decrease was offset by a significant increase in the share of EI regular claims established in regions with unemployment rates between 6.1% and 8.0% (42.0%; +17.8 p.p.) and between 8.1% and 10.0% (15.9%; +9.8 p.p.) in 2024-25. This shift is consistent with the increase in the national unemployment rate, which went from an average of 5.6% in 2023-24 to 6.6% in 2024-25. However, regions with an unemployment rate above 10.0% only represented 7.2% of EI regular claims, which is slightly lower than recent years, and significantly lower than pre-pandemic levels.

Text description
| Category | Share of claims (%) 2018-19 | Share of claims (%) 2019-20 | Share of claims (%) 2022-23 | Share of claims (%) 2023-24 | Share of claims (%) 2024-25 |
|---|---|---|---|---|---|
| Regional unemployment rate: 6.0% or less | 31.8% | 50.1% | 64.9% | 61.6% | 35.0% |
| Regional unemployment rate: 6.1% to 8.0% | 47.1% | 30.6% | 21.1% | 24.2% | 42.0% |
| Regional unemployment rate: 8.1% to 10.0% | 4.2% | 3.3% | 2.5% | 5.7% | 15.9% |
| Regional unemployment rate: 10.1% to 13.0% | 7.0% | 6.4% | 5.9% | 4.7% | 3.6% |
| Regional unemployment rate: 13.1% or more | 9.9% | 9.6% | 5.7% | 3.8% | 3.6% |
| National unemployment rate | 5.8% | 5.9% | 5.1% | 5.6% | 6.6% |
- Note: Includes claims for which at least $1 of EI regular benefits was paid.
- * Unemployment rates used for the Employment Insurance program are a 3-month moving average of seasonally adjusted rates of unemployment produced by Statistics Canada, as per section 17 of the Employment Insurance Regulations.
- ** Results are not presented for 2020-21 and 2021-22 because a minimum unemployment rate of 13.1% was in effect between September 27, 2020 and September 25, 2021, due to the first set of EI temporary measures.
- Consult Annex 2.7 for more details.
- Source: Employment and Social Development Canada, Employment Insurance (EI) administrative data. Results are based on a 10% sample of data for 2018-19, 2019-20 and 2022-23 and 100% of data for 2023-24 and 2024-25. Statistics Canada, Labour Force Survey, Table 14-10-0287-01 (for unemployment rates).
Claimants' obligations to search for and accept suitable employment
Under the Employment Insurance Act, claimants for EI regular benefits must be capable of and available for work and be unable to obtain suitable employment. This requirement, which must be met in order to receive EI regular benefits, can be demonstrated through reasonable and customary efforts to obtain suitable employment.Footnote 25
Claimants may be disqualified or disentitled from receiving EI regular benefits if they fail to meet specific entitlement conditions. They may be disqualified if they refuse suitable work or fail to search for work, and may be disentitled if they are not capable of or available for work during each period of unemployment. Disqualification can also result from specific actions or inactions and may last indefinitely or for a specific number of weeks. Disentitlement applies on a day-to-day basis for as long as the claimant's situation remains unchanged.
Table 15 outlines the number of disqualifications and disentitlements over the past fiscal years for specific reasons related to the requirement for claimants to be capable and available for work and be unable to find suitable employment. These results cannot be compared to the number of EI claims, as multiple disqualifications and disentitlements can be imposed on a single claim. In 2024-25, 90 disqualifications were due to claimants refusing suitable work and 680 to claimants failing to search for work, while there were just under 376,000 disentitlements related to claimants not being capable or available for work. While disqualifications for refusal of work and failure to search for work remained below pre-pandemic levels, disentitlements for not being capable or available for work have now surpassed pre-pandemic levels. It is important to note that the results also do not take into consideration that benefits would generally have been reinstated after claimants who were disentitled demonstrated that they were once again fulfilling their responsibilities, or after claimants who were disqualified served their weeks of disqualification.
| Type of disqualifications or disentitlements | 2018-19 | 2019-20 | 2021-22 | 2022-23 | 2023-24 | 2024-25 |
|---|---|---|---|---|---|---|
| Disqualifications for refusal of suitable work | 170 | 180 | 50 | 50 | 80 | 90 |
| Disqualifications for failure to search for work | 1,430 | 1,190 | 220 | 240 | 450 | 680 |
| Disentitlements for not being capable or available for work | 320,520 | 279,430 | 184,430 | 274,210 | 333,150 | 375,850 |
| Disqualifications and disentitlements for other reasons** | 708,400 | 626,010 | 375,850 | 569,080 | 762,050 | 863,710 |
| Total disqualifications and disentitlements | 1,030,520 | 906,810 | 560,550 | 843,580 | 1,095,730 | 1,240,330 |
- * The total for 2019-20 is calculated using monthly estimates from April 2019 to February 2020 and excludes data for the month of March 2020. Additionally, 2020-21 is excluded from the table because no new claims for EI regular benefits could be established between March 15 and September 26, 2020, when the Canada Emergency Response Benefit (CERB) was introduced. As a result, the Employment Insurance Statistics program was suspended between the March and September 2020 reference months. Consequently, data on the number of EI disqualifications and disentitlements are not available for this period.
- ** Claimants may be disqualified or disentitled from benefits for reasons other than failing to meet the requirement of being capable and available for work and be unable to find suitable employment. Other reasons for disqualifications include claimants leaving employment without just cause, losing employment due to misconduct, or failing without good reason to follow directions from the Canada Employment Insurance Commission (CEIC), attend required interviews, or participate in referred training or activities. Other reasons for disentitlements include claimants working full-time, being involved in a labour dispute, being outside Canada or incarcerated during a claim, failing to provide required documentation, or taking a voluntarily leave without just cause.
- Source: Statistics Canada, monthly Employment Insurance disqualifications and disentitlements, Table 14-10-0004-01.
Trends in disqualifications and disentitlements
A recent departmental study* examined trends in disqualifications and disentitlements and the characteristics of claimants who had disqualifications and disentitlements imposed on their EI claim using 2 data sources: Statistics Canada public data tables and EI administrative data.
Based on Statistics Canada data, from the early 2000s up to 2019, the average monthly number of disqualifications and disentitlements generally followed a trend similar to the average monthly number of EI beneficiaries, except for the period of the COVID-19 pandemic when the trend reversed. The number of EI beneficiaries increased significantly in 2020 and 2021, while the number of disqualifications and disentitlement declined during those years. Table 15 of the 2024-25 EI MAR, using similar Statistics Canada data, also showed a decrease in the total number of disqualifications and disentitlements during this period.
Based on EI administrative data, a total of 7.6 million of disqualifications and disentitlements were imposed on 3.5 million of EI regular claims established between 2010 and 2023. This represented 17.1% of all regular claims established during this period. A significant decrease in disqualifications and disentitlements during the period of the COVID-19 pandemic was also found with this data source. Only 6.2% and 10.1% of EI regular claims established in 2020 and 2021, respectively, had disqualifications and disentitlements. The study also showed that for EI regular claims with disqualifications and disentitlements, there were, on average, 2.2 disqualifications and disentitlements per claim established over the period examined. In terms of the characteristics of claimants, from 2018 to 2023, the proportion of EI regular claims with disqualifications and disentitlements was higher than the national average for claimants living in Quebec and British Columbia, women, claimants aged 25 to 34 and occasional claimants.
* ESDC, Long-term trends in disqualifications and disentitlements (Ottawa: ESDC, Employment Insurance Policy Directorate, 2026).
2.2.2 Coverage, eligibility and access to Employment Insurance regular benefits for the unemployed population
As mentioned at the beginning of Section 2.2, there are 3 eligibility criteria to qualify for EI regular benefits. The claimant must have:
- had insurable employment and paid EI premiums during the qualifying period (defined as either the previous 52 weeks or since the start of their last claim, whichever is shorter)
- a valid reason for job separation according to the Employment Insurance Act
- worked a minimum number of hours of insurable employment during the qualifying period (ranging from 420 to 700 hours, depending on the regional unemployment rate where the claimant lived at the time of the establishment of the claim)
This subsection provides an overview of the unemployed population in Canada for 2024 relative to these 3 eligibility criteria and presents measures of coverage, eligibility, and access to EI regular benefits for the unemployed population. Results are based on the Employment Insurance Coverage Survey (EICS),Footnote 26 published annually by Statistics Canada. The survey provides statistics on the contributors and non-contributors to the EI program among the unemployed population in the calendar year, as well as on the eligible recipients and those who did not qualify for EI regular benefits. The survey also provides information on the take-up of EI maternity and parental benefits in Canada (consult subsection 2.6.3).
Chart 9 illustrates the distribution of the unemployed population in Canada in 2024 in terms of their eligibility for EI regular benefits. On average, there were 1,372,400 unemployed individuals per month in Canada in 2024. Of them, 486,800 (35.5%) individuals did not pay EI premiums during the year because they did not work in the previous 12 months or never worked, or because they were self-employed or unpaid family workers. The other 885,600 (64.5%) unemployed individuals in 2024 paid EI premiums in the 12 months prior to becoming unemployed and were covered by the EI program.

Text description
| (U) Total Unemployed: 1,372,400 (100%) | Description |
|---|---|
| (A) Unemployed individuals who did not pay premiums: 486,800 (35.5%) |
|
| (B) EI premium-paying unemployed individuals with an invalid reason for job separation: 74,100 (5.4%) |
|
| (C) Potentially eligible unemployed individuals but with insufficient hours of insurable employment: 137,000 (10.0%) | (C1) Individuals who did not have sufficient hours of insurable employment: 137,000 (10.0%) |
| (D) Unemployed individuals eligible for EI regular benefits with enough hours of insurable employment: 674,500 (49.1%) |
|
- Note: Data may not add up to the total due to rounding.
- * Estimates for the year are based on monthly averages.
- ** Use with caution as there are high levels of error in this estimate.
- Source: Statistics Canada, Employment Insurance Coverage Survey, 2024.
Of the total unemployed population, 74,100 (5.4%) individuals were ineligible for EI benefits as they had invalid reasons for job separation, although they had paid EI premiums. Of these individuals, some quit their jobs to go to school while others quit for other reasons. The remaining 811,500 unemployed individuals (59.1% of total unemployed) had paid EI premiums and had a valid reason for job separation. However, some of them (10.0% of total unemployed) did not accumulate enough hours of insurable employment during their qualifying period. The rest (49.1% of total unemployed) had enough hours of insurable employment during their qualifying period and were eligible for EI regular benefits, as they had met all 3 eligibility criteria of the EI program.
While almost half of the unemployed population eligible for EI regular benefits with enough hours of insurable employment were receiving EI regular benefits at the time they were surveyed in 2024, some were not receiving them even though they were eligible (consult Chart 9). Among the total unemployment population:
- 5.1% had their benefits temporarily interrupted, were waiting to receive benefits or were receiving another type of EI benefits than regular benefits
- 9.3% did not claim or receive benefits for unknown reasons, and
- 11.2% had received and had exhausted benefits in the past 12 months
Chart 10 shows the breakdown of the unemployed population according to their eligibility for EI regular benefits from 2012 to 2024. The breakdown in 2024 remained relatively comparable to 2023. The share of unemployed individuals who were eligible for EI regular benefits, as they had met all 3 eligibility criteria of the EI program, remained stable over the past 3 years, and was still higher than before the pandemic. However, among this category, the share of unemployed individuals who did not claim or received benefits for unknown reasons significantly increased, from 3.9% on average between 2017 to 2019, to 9.3% in 2024.Footnote 27 In addition, the share of unemployed individuals who did not pay premiums slightly increased by 1.5 p.p. and settled at 35.5% in 2024. This was mainly brought by an increase in the share of unemployed individuals who did not work in the previous 12 months or never worked (31.6% in 2024 up from 28.8% in 2023), which could be attributable to the easing of labour market conditions in 2024.

Text description
| Category | 2012 | 2013 | 2014 | 2015 | 2016 | 2017 | 2018 | 2019 | 2020* | 2021 | 2022 | 2023 | 2024 |
|---|---|---|---|---|---|---|---|---|---|---|---|---|---|
| (A) Unemployed individuals who did not pay premiums | 38.3% | 37.5% | 39.0% | 34.7% | 34.7% | 37.0% | 36.1% | 38.5% | Not available | 29.0% | 40.8% | 34.0% | 35.5% |
| (B) EI premium-paying unemployed individuals with an invalid reason for job separation | 13.7% | 14.9% | 14.9% | 12.4% | 11.9% | 12.0% | 15.8% | 14.2% | Not available | 1.6% | 4.1% | 6.4% | 5.4% |
| (C) Potentially eligible unemployed individuals but with insufficient hours of insurable employment | 8.7% | 6.7% | 7.8% | 9.1% | 7.8% | 8.0% | 6.1% | 8.3% | Not available | 2.9% | 5.8% | 10.1% | 10.0% |
| (D) Unemployed individuals eligible for EI regular benefits with enough hours of insurable employment | 39.3% | 40.8% | 38.3% | 43.8% | 45.6% | 43.0% | 42.1% | 39.0% | Not available | 66.6% | 49.4% | 49.6% | 49.1% |
- Note: Data may not add up to the total due to rounding.
- * Due to the COVID-19 pandemic, the data collection on EI regular benefits was suspended in the EICS 2020.
- ** Estimates for the year are based on monthly averages.
- Source: Statistics Canada, Employment Insurance Coverage Survey, 2012 to 2024.
Coverage of Employment Insurance regular benefits
The coverage rate of EI regular benefits shows the proportion of unemployed individuals who contributed to the EI program by paying EI premiums in the preceding 52 weeks prior to becoming unemployed. Thus, the coverage rate is calculated by dividing the number of unemployed individuals who had insurable employment and paid EI premiums within the previous 52 weeks by the number of total unemployed individuals in Canada. In 2024, the coverage rate was 64.5%, 1.5 p.p. lower than what was observed in 2023 (66.0%).
Higher coverage rates of EI regular benefits are usually observed during economic slowdowns, as slowing economic activities lead to layoffs that increase the share of unemployed EI contributors among all unemployed individuals. For example, the coverage rates were higher in 2015 and 2016, during the downturn in commodity prices, and in 2021 due to layoffs following the COVID-19 pandemic (consult Chart 11). The coverage rate slightly decreased in 2024 compared to 2023 (-1.5 p.p.). This contrasts with the usual trend but could be explained by the easing of labour market conditions driven in part by new entrants to the labour force searching for employment in 2024. This resulted in a relative lower share of unemployed individuals who had paid EI premiums among all unemployed individuals in 2024 compared to 2023.

Text description
| Year | 2012 | 2013 | 2014 | 2015 | 2016 | 2017 | 2018 | 2019 | 2020* | 2021 | 2022 | 2023 | 2024 |
|---|---|---|---|---|---|---|---|---|---|---|---|---|---|
| Coverage rate of Employment Insurance regular benefits | 61.7% | 62.5% | 61.0% | 65.3% | 65.3% | 63.0% | 63.9% | 61.5% | Not available | 71.0% | 59.2% | 66.0% | 64.5% |
- * Due to the COVID-19 pandemic, the data collection on EI regular benefits was suspended in the EICS 2020.
- Source: Statistics Canada, Employment Insurance Coverage Survey, 2012 to 2024.
Table 16 outlines the coverage rates of EI regular benefits in 2024 by province,Footnote 28 gender, age, and previous work patterns. Consistent with historical patterns, the Atlantic provinces generally have higher coverage rates than the rest of the country. This may be explained by the composition of unemployed individuals, such as the prevalence of the seasonal employment pattern in that region.Footnote 29 Saskatchewan and Ontario had the lowest coverage rates in 2024 (52.9% and 58.6%, respectively).
| Category | 2019 | 2021 | 2022 | 2023 | 2024 | Change (% points) 2023 to 2024 |
|---|---|---|---|---|---|---|
| Newfoundland and Labrador | 77.7% | 78.9% | 92.5% | 85.9% | 87.5% | +1.6 |
| Prince Edward Island | 81.8% | 94.2% | 100.0%E | 79.9%E | 79.6% | -0.3 |
| Nova Scotia | 73.7% | 83.9% | 77.6% | 77.8% | 78.4% | +0.6 |
| New Brunswick | 76.1% | 86.5% | 92.3% | 84.6% | 64.4% | -20.2 |
| Quebec | 63.9% | 76.5% | 67.2% | 73.4% | 71.9% | -1.5 |
| Ontario | 57.9% | 63.8% | 47.9% | 59.8% | 58.6% | -1.2 |
| Manitoba | 59.5% | 73.8% | 60.3%E | 60.7% | 73.4% | +12.7 |
| Saskatchewan | 58.0% | 76.6% | 69.9% | 62.0% | 52.9% | -9.1 |
| Alberta | 61.6% | 74.8% | 59.5% | 64.0% | 65.6% | +1.6 |
| British Columbia | 58.5% | 72.0% | 59.8% | 70.1% | 66.4% | -3.7 |
| Men | 62.8% | 71.6% | 65.0% | 67.7% | 68.0% | +0.3 |
| Women | 59.9% | 70.1% | 52.2% | 64.2% | 60.5% | -3.7 |
| 24 years old and under | 57.9% | 54.9% | 50.5% | 61.9% | 48.2% | -13.7 |
| 25 to 44 years old | 59.4% | 73.2% | 59.6% | 66.6% | 67.8% | +1.2 |
| 45 years old and over | 65.6% | 75.9% | 63.2% | 68.3% | 73.5% | +5.2 |
| Permanent | 67.6% | 82.1% | 63.5% | 73.3% | 75.8% | +2.5 |
| Full-time | 66.1% | 82.7% | 66.5% | 74.1% | 77.8% | +3.7 |
| Part-time | 72.7% | 82.6% | 55.9% | 72.4% | 63.3% | -9.1 |
| Non-permanent | 79.4% | 83.2% | 78.0% | 84.2% | 79.0% | -5.2 |
| Seasonal*** | 88.2% | 88.1% | 89.6% | 94.8% | 86.6% | -8.2 |
| Other non-standard**** | 72.8% | 80.3% | 71.0% | 76.0% | 75.9% | -0.1 |
| Canada | 61.5% | 71.0% | 59.2% | 66.0% | 64.5% | -1.5 |
- E As per the EICS release guidelines, this estimate should be used with caution.
- * Due to the COVID-19 pandemic, the data collection on EI regular benefits was suspended in the EICS 2020.
- ** The coverage rates of unemployed individuals for most of the work pattern categories are higher than the national average. This can be explained by the 0% coverage rate of unemployed individuals for whom a previous work pattern is not applicable because they never worked before. The national average is lower because these individuals are included.
- *** Seasonal employment is temporary work that is expected to last only until the end of a 'season'—the period for which services are in demand.
- **** Other non-standard refers to non-permanent paid jobs that were either temporary, term, contractual, casual or other non-permanent (but not seasonal) employment. This excludes unemployed individuals who were self-employed.
- Source: Statistics Canada, Employment Insurance Coverage Survey, 2019 to 2024.
Consistent with trends in previous years, the coverage rate for men was higher than that for women in 2024. The lower coverage rate for women can be explained by the fact that unemployed women are less likely to have recent insurable employment compared to unemployed men. The coverage rate of younger unemployed individuals was still the lowest and the coverage rate for those aged 45 years and older remained the highest in 2024.
When the unemployed population is categorized by their previous work patterns, results show that a higher share of unemployed individuals with previous non-permanent jobs paid EI premiums in the previous 52 weeks than those who had permanent jobs. This can be explained by the higher coverage rate of unemployed individuals who worked in non-permanent seasonal jobs. As these individuals work for a few weeks or months on a cyclical pattern over a year, they are more likely to have paid EI premiums in the previous 52 weeks than those who were in permanent jobs and might be unemployed for more than a year. Among unemployed individuals who previously held permanent jobs, the coverage rate in 2024 for those who had part-time jobs was lower than the one for those who had full-time jobs. Among unemployed individuals who previously were in non-permanent employment, those who had seasonal work had a higher coverage rate in 2024 compared to those who had non-seasonal non-standard work, consistent to historical trends.
Eligibility for Employment Insurance regular benefits
As mentioned at the beginning of this subsection, claimants for EI regular benefits must meet 3 criteria to be considered eligible (they must have paid EI premiums, have a valid reason for job separation, and have accumulated the required number of hours of insurable employment during their qualifying period). The eligibility rate is expressed as the share of unemployed individuals with sufficient hours of insurable employment among those who meet the other 2 eligibility criteria.
As illustrated by the "all unemployed individuals" line in Chart 12, the eligibility rate for EI regular benefits in Canada has ranged from 81.9% to 87.4% in the past decade (excluding 2022). The rate for 2024 stood at 83.1%, unchanged from 2023. When labour market conditions ease and unemployment rates increase, the entrance requirements for EI regular benefits are generally lower. This might translate in a higher share of unemployed individuals eligible for regular benefits as they need fewer hours of insurable employment to qualify. However, in 2024, this share stayed unchanged compared to 2023 despite the rise in the national unemployment rate (5.4% in 2023 versus 6.4% in 2024).Footnote 30 The eligibility rate for unemployed individuals who previously had permanent employment has historically been higher than the one of those who had non-permanent employment.

Text description
| Year | 2012 | 2013 | 2014 | 2015 | 2016 | 2017 | 2018 | 2019 | 2020* | 2021** | 2022*** | 2023 | 2024 |
|---|---|---|---|---|---|---|---|---|---|---|---|---|---|
| Eligibility rate for all unemployed individuals | 81.9% | 85.8% | 83.1% | 82.8% | 85.4% | 84.3% | 87.4% | 82.4% | Not available | Not available | 89.6% | 83.1% | 83.1% |
| Eligibility rate for unemployed individuals who were in permanent employment | 89.9% | 91.4% | 87.7% | 90.0% | 92.8% | 91.7% | 92.8% | 89.3% | Not available | Not available | Not available | 86.8% | 87.8% |
| Eligibility rate for unemployed individuals who were in non-permanent employment | 72.2% | 79.0% | 77.7% | 72.2% | 75.7% | 76.7% | 80.1%R | 74.4% | Not available | Not available | Not available | 78.2%R | 76.6% |
- * Due to the COVID-19 pandemic, the data collection on EI regular benefits was suspended in the EICS 2020.
- ** Due to the EI temporary measures related to the COVID-19 pandemic in place from September 2020 to September 2021, the eligibility rate for 2021 was not comparable to the other years and not released by Statistics Canada.
- *** The eligibility rate for 2022 was higher than the other years. Due to the EI temporary measures related to the COVID-19 pandemic in place from September 2021 to September 2022, such as the minimum 420 hours of insurable employment to be eligible for EI regular benefits and the simplified treatment of reasons for separation, the rate for 2022 should not be directly compared to the other years.
- R Revised data.
- Source: Statistics Canada, Employment Insurance Coverage Survey, 2012 to 2024.
The eligibility rates for EI regular benefits are sensitive to economic conditions and specific employment patterns during the qualifying period, such as the incidence of full-time versus part-time employment, and permanent versus temporary employment. Because of this, significant variations are found when unemployed individuals are classified based on regional, demographic and previous employment characteristics.
As outlined in Table 17, unemployed individuals in Saskatchewan and Manitoba had lower eligibility rates compared to the national average in 2024. In comparison, those in the Atlantic provinces had generally higher eligibility rates.
| Category | 2017 | 2018 | 2019 | 2023 | 2024 | Change (% points) 2023 to 2024 |
|---|---|---|---|---|---|---|
| Newfoundland and Labrador | 96.7% | 93.8% | 94.1% | 95.6% | 98.9% | +3.3 |
| Prince Edward Island | 94.3% | 98.2% | 97.0% | 96.1%E | 100.0%E | +3.9 |
| Nova Scotia | 86.0% | 93.8% | 95.2% | 91.7% | 85.3% | -6.4 |
| New Brunswick | 93.1% | 94.0% | 96.7% | 87.6% | 89.6% | +2.0 |
| Quebec | 85.1% | 85.5% | 87.8% | 87.3% | 83.4% | -3.9 |
| Ontario | 79.6% | 88.7% | 75.7% | 80.1% | 80.3% | +0.2 |
| Manitoba | 84.9% | 83.1% | 79.1%E | 87.3% | 74.4%E | -12.9 |
| Saskatchewan | 69.7% | 86.6% | 83.2% | 80.5% | 72.4%E | -8.1 |
| Alberta | 85.2% | 79.6% | 84.1% | 74.7% | 85.8% | +11.1 |
| British Columbia | 90.0% | 91.0% | 73.6% | 86.7% | 85.3% | -1.4 |
| Men | 85.8% | 88.3% | 84.7% | 88.6% | 86.6% | -2.0 |
| Women | 82.1% | 86.1% | 79.5% | 76.4% | 78.4% | +2.0 |
| 24 years old and under | 40.7% | 60.5% | 51.7% | 57.1% | 50.3% | -6.8 |
| 25 to 44 years old | 89.4% | 90.7% | 82.1% | 83.5% | 88.2% | +4.7 |
| 45 years old and over | 90.2% | 90.5% | 91.4% | 95.1% | 92.4% | -2.7 |
| Permanent | 91.7% | 92.8% | 89.3% | 86.8% | 87.8% | +1.0 |
| Full-time | 94.5% | 93.6% | 94.2% | 95.4% | 94.9% | -0.5 |
| Part-time | 69.3% | 86.0%E | 64.7% | 40.4%E | 39.1% | -1.3 |
| Non-permanent | 76.7% | 80.1% | 74.4% | 78.2% | 76.6% | -1.6 |
| Seasonal** | 86.7% | 82.0% | 83.5% | 80.7% | 81.5% | +0.8 |
| Other non-standard*** | 66.8% | 78.5% | 64.5% | 76.0% | 74.0% | -2.0 |
| Canada | 84.3% | 87.4% | 82.4% | 83.1% | 83.1% | 0.0 |
- E As per the EICS release guidelines, this estimate should be used with caution.
- * Due to the COVID-19 pandemic, the data collection on EI regular benefits was suspended in the EICS 2020. Due to the EI temporary measures related to the COVID-19 pandemic in place from September 2020 to September 2022, eligibility rates for 2021 and 2022 were not comparable to the other years.
- ** Seasonal employment is temporary work that is expected to last only until the end of a 'season'—the period for which services are in demand.
- *** Other non-standard refers to non-permanent paid jobs that were either temporary, term, contractual, casual or other non-permanent (but not seasonal) employment. This excludes unemployed individuals who were self-employed.
- Source: Statistics Canada, Employment Insurance Coverage Survey, 2017 to 2024.
Consistent with previous years, unemployed men registered higher eligibility rates than unemployed women in 2024, probably due to the fact that a higher proportion of men hold full-time jobs or permanent jobs or both, while a higher proportion of women work in part-time jobs or temporary jobs or both. This means that unemployed women are less likely to accumulate sufficient hours of insurable employment. By age, unemployed youth aged 24 years and under continued to have the lowest eligibility rate in 2024, compared to unemployed individuals aged between 25 and 44 years and those aged 45 years and over.
Additionally, unemployed individuals who had part-time or non-permanent employment were less likely to accumulate the required number of hours of insurable employment in 2024 due to their work pattern, resulting in lower eligibility rate compared to the national average.
Access to Employment Insurance regular benefits
Access to EI regular benefits is another way to measure how the EI program is providing financial support to Canada's unemployed individuals following a job loss and helping them transition to new employment. For the purpose of the EI Monitoring and Assessment Report, access to EI regular benefits is measured by 2 rates: the Beneficiary-to-Unemployed (B/U) rate and the Beneficiary-to-Unemployed Contributor (B/UC) rate.
The rates' numerator (B) and denominators (U and UC) are both obtained from the EICS. The number of unemployed individuals who received EI regular benefits (B) includes those who received EI regular benefits at the time they were surveyed (including those who had their benefits temporarily interrupted or waiting to receive benefits) as well as those who received but exhausted their EI regular benefits within 12 months of the time they were surveyed to incorporate all beneficiaries in the year.
The Beneficiary-to-Unemployed (B/U) rate is the share of unemployed individuals who received EI regular benefits among all unemployed individuals. As such, it includes a significant segment of the unemployed population who are ineligible for EI regular benefits (such as those who did not work in the previous year or never worked, who did not have a valid job separation, and those who were self-employed). As a result, the B/U rate is sensitive to changes in the composition of the unemployed population and the proportion of the unemployed individuals outside the scope of the EI program's coverage.
The Beneficiary-to-Unemployed Contributor (B/UC) rate is the share of unemployed individuals who received EI regular benefits among the unemployed individuals who contributed EI premiums in the previous 12 months. The B/UC rate measures accessibility among unemployed individuals for whom EI regular benefits are designed to provide coverage and excludes those who did not contribute EI premiums during their last employment period or did not have any labour force attachment. As a result, this rate provides a better assessment of accessibility to EI regular benefits.
Chart 13 illustrates the B/U and B/UC rates from 2012 to 2024. In 2024, the B/U rate was 39.2% and the B/UC rate was 60.8%, virtually unchanged from 2023 (39.9% and 60.4%, respectively). In 2024, the total number of unemployed individuals who received EI regular benefits (B), unemployed individuals (U) and unemployed individuals who contributed EI premiums (UC) all increased roughly at the same pace compared to the previous year. As a result, the B/U and B/UC rates in 2024 remained similar to those in 2023. With the exception of 2021 and 2022, when EI temporary measures related to the COVID-19 pandemic expanded access to EI benefits, both access rates remained relatively stable over the past decade.

Text description
| Year | 2012 | 2013 | 2014 | 2015 | 2016 | 2017 | 2018 | 2019 | 2020* | 2021 | 2022 | 2023 | 2024 |
|---|---|---|---|---|---|---|---|---|---|---|---|---|---|
| B/U rate | 34.7% | 37.2% | 33.9% | 40.0% | 41.7% | 37.9% | 37.1% | 34.7% | Not available | 62.3% | 42.2% | 39.9% | 39.2% |
| B/UC rate | 56.2% | 59.6% | 55.6% | 61.3% | 63.8% | 60.1% | 58.0% | 56.4% | Not available | 87.7% | 71.3% | 60.4% | 60.8% |
- * Due to the COVID-19 pandemic, the data collection on EI regular benefits was suspended in the EICS 2020.
- Source: Statistics Canada, Employment Insurance Coverage Survey, 2012 to 2024.
2.2.3 Level of Employment Insurance regular benefits
The weekly benefit rate to which EI claimants are entitled is subject to the Variable Best Weeks (VBW) provision. Under this provision, the weekly benefit rate that eligible claimants are entitled to receive is calculated as 55% of the average of their highest (best) weeks of insurable earnings during their qualifying period, up to the maximum weekly benefit rate.Footnote 31 The number of weeks of earnings used to calculate the weekly benefit rate ranges from 14 to 22, depending on the monthly regional unemployment rate of the claimant's EI region at the time their claim is established (consult subsection 2.1.1 for the VBW table).
Claimants with dependent children (under 18 years old) and low annual family income may be eligible to receive the Family Supplement. This provision can increase eligible claimants' benefit rate from 55% up to a maximum of 80% of their weekly insurable earnings, subject to the maximum weekly benefit rate (consult subsection 2.1.1 for additional details). The weekly benefit rates presented in this subsection include the Family Supplement amounts paid to eligible claimants, if applicable. While the amounts paid to claimants may be reduced for some claimants under the Working While on Claim provision, the benefit rates presented in this subsection reflect the benefit rate to which they were entitled, prior to any such reductions.
Table 18 presents the average weekly benefit rates for EI regular claims by province and territory for 2024-25. Across Canada, regular claims established during the reporting year had an average weekly benefit rate of $583, up from $561 in 2023-24 (+3.8%). As in previous years, regular claims established in the territories received, on average, the highest weekly benefit rate in 2024-25. Conversely, regular claims established from the Atlantic provinces and Manitoba had, on average, the lowest weekly benefit rate during the reporting period. Overall, the average weekly benefit rate increased in all jurisdictions in 2024-25 compared to 2023-24, with growth rates ranging from 2.2% in Alberta to 6.0% in the Northwest Territories. This trend was consistent with increases in both the maximum weekly benefit rate and the average nominal weekly earnings by jurisdiction over the same period (consult Table 8 in Chapter 1).
| Province or territory | 2023-24 | 2024-25 | Change (%) |
|---|---|---|---|
| Newfoundland and Labrador | $537 | $558 | +3.8% |
| Prince Edward Island | $524 | $545 | +3.9% |
| Nova Scotia | $519 | $544 | +4.7% |
| New Brunswick | $540 | $562 | +4.1% |
| Quebec | $567 | $588 | +3.7% |
| Ontario | $563 | $588 | +4.4% |
| Manitoba | $525 | $543 | +3.4% |
| Saskatchewan | $550 | $567 | +3.2% |
| Alberta | $577 | $590 | +2.2% |
| British Columbia | $576 | $596 | +3.5% |
| Yukon | $615 | $635 | +3.2% |
| Northwest Territories | $598 | $634 | +6.0% |
| Nunavut | $603 | $627 | +3.9% |
| Canada | $561 | $583 | +3.8% |
- Note: Percentage change is based on unrounded numbers. Includes claims for which at least $1 of EI regular benefits was paid.
- Consult Annex 2.5.3 for more details.
- Source: Employment and Social Development Canada, Employment Insurance (EI) administrative data. Results are based on 100% of data.
In terms of gender, men had a higher average weekly benefit rate for EI regular claims ($607) than women ($546) in 2024-25 (consult Annex 2.5.3). Historically, this has always been the case. Proportionally, the average weekly benefit rate for women represented 90.0% of the rate for men in 2024-25 compared to 88.8% in 2023-24, which was above the historical ratio of 87.6% in 2018-19. This increase may be attributable to the fact that the growth rate in the average weekly benefit rate for women outpaced that for men in 2024-25 compared to 2023-24 (+4.7% and +3.2%, respectively).
Moreover, men received a higher average weekly benefit rate than women across all categories of hours of insurable employment worked during their qualifying period. This gender gap was more pronounced at lower levels of labour market attachment, as categorized by the number of hours of insurable employment. As shown in Chart 14, the average weekly benefit rate for women who had 420 to 559 hours of insurable employment during their qualifying period was 80.4% of the average rate for men in 2024-25, while for those who had 1,820 or more hours of insurable employment, that ratio was 95.1%.
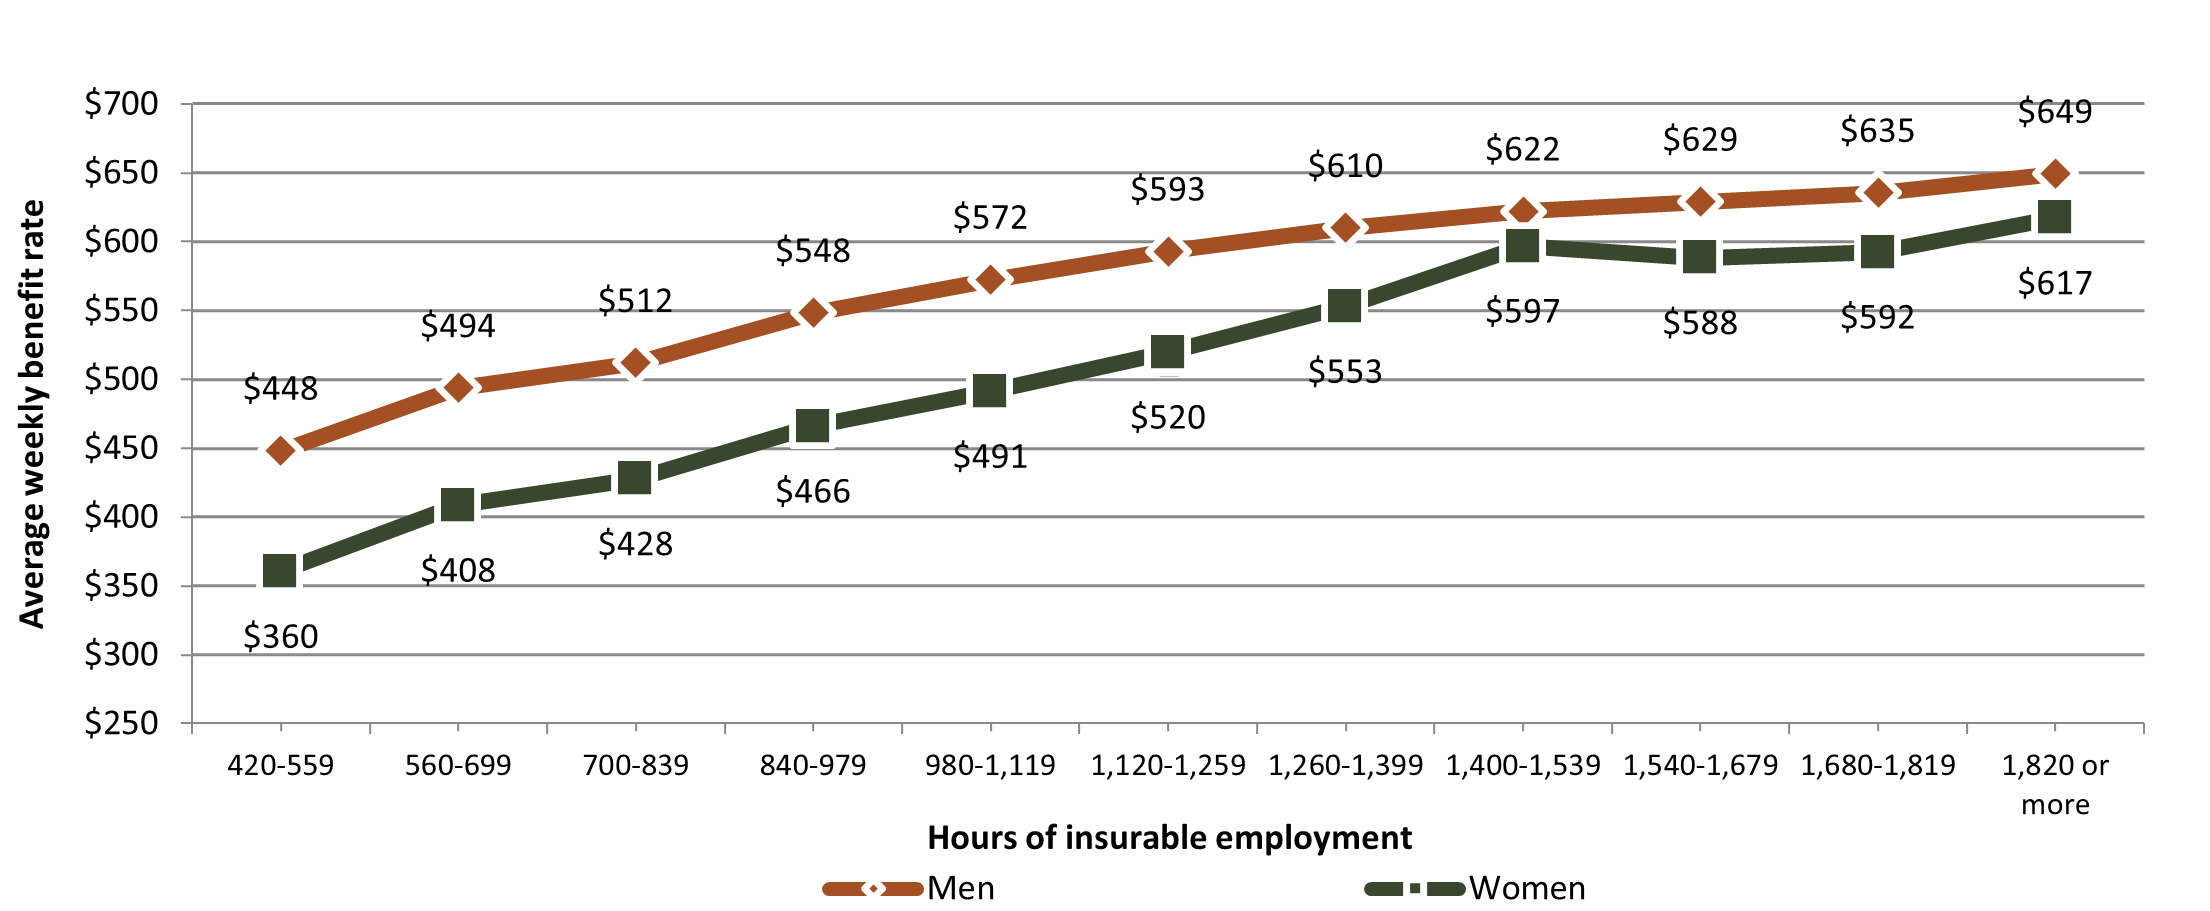
Text description
| Hours of insurable employment | Men's average weekly benefit rate | Women's average weekly benefit rate |
|---|---|---|
| 420 to 559 | $448 | $360 |
| 560 to 699 | $494 | $408 |
| 700 to 839 | $512 | $428 |
| 840 to 979 | $548 | $466 |
| 980 to 1,119 | $572 | $491 |
| 1,120 to 1,259 | $593 | $520 |
| 1,260 to 1,399 | $610 | $553 |
| 1,400 to 1,539 | $622 | $597 |
| 1,540 to 1,679 | $629 | $588 |
| 1,680 to 1,819 | $635 | $592 |
| 1,820 or more | $649 | $617 |
- Note: Includes claims for which at least $1 of EI regular benefits was paid.
- Source: Employment and Social Development Canada, Employment Insurance (EI) administrative data. Results are based on 100% of data.
Table 19 displays the average weekly benefit rate for EI regular claims by age group for men and women in 2024-25. Overall, among age groups, claimants aged 25 to 44 years had the highest average weekly benefit rate during the reporting period, while young claimants (those aged 24 years and under) had the lowest. When considering both age and gender, on average, men aged 45 to 54 years had the highest weekly benefit rate ($627), whereas for women, those aged 25 to 44 years had the highest ($563). Moreover, the gap between men and women was greatest among young claimants, as men had, on average, $75 more in weekly regular benefits than women.
| Age category | Men | Women | All claimants |
|---|---|---|---|
| 24 years old and under | $555 | $480 | $533 |
| 25 to 44 years old | $618 | $563 | $597 |
| 45 to 54 years old | $627 | $557 | $595 |
| 55 years old and over | $593 | $523 | $565 |
| Canada | $607 | $546 | $583 |
- Note: Includes claims for which at least $1 of EI regular benefits was paid.
- Source: Employment and Social Development Canada, Employment Insurance (EI) administrative data. Results are based on 100% of data.
Among claimant categories, long-tenured workers had the highest average weekly benefit rate for EI regular claims ($624) in 2024-25, while occasional claimants had the lowest ($564) (consult Table 20). Compared to the previous fiscal year, all claimant categories recorded increases in their average weekly benefit rate in 2024-25, with occasional claimants registering the largest growth rate (+6.0%).
| Claimant category | 2023-24 | 2024-25 | Change (%) |
|---|---|---|---|
| Long-tenured workers | $601 | $624 | +3.7% |
| Occasional claimants | $543 | $564 | +3.8% |
| Frequent claimants | $567 | $589 | +3.7% |
| Canada | $561 | $583 | +3.8% |
- Note: Percentage change is based on unrounded numbers. Includes claims for which at least $1 of EI regular benefits was paid.
- Consult Annex 2.5.3 for more details.
- Source: Employment and Social Development Canada, Employment Insurance (EI) administrative data. Results are based on 100% of data.
Table 21 presents the share of claims established for EI regular benefits that received the maximum weekly benefit rate. In 2024-25, 50.9% of claims received the maximum weekly benefit rate, a proportion higher than that recorded in 2023-24 (48.8%) and the historical share of 49.1% observed in 2018-19. The share of regular claims receiving the maximum weekly benefit rate in 2024-25 was higher in the territories, and lower in the Atlantic provinces and Manitoba. This aligns with the trend observed in the average weekly benefit rate for EI regular benefits by jurisdiction.
| Category | 2023-24 | 2024-25 |
|---|---|---|
| Newfoundland and Labrador | 44.8% | 45.7% |
| Prince Edward Island | 31.2% | 31.9% |
| Nova Scotia | 36.5% | 37.8% |
| New Brunswick | 34.7% | 36.7% |
| Quebec | 50.6% | 52.2% |
| Ontario | 48.3% | 53.5% |
| Manitoba | 36.7% | 36.4% |
| Saskatchewan | 47.5% | 47.0% |
| Alberta | 58.7% | 56.6% |
| British Columbia | 53.0% | 53.1% |
| Yukon | 72.4% | 73.4% |
| Northwest Territories | 67.6% | 73.2% |
| Nunavut | 72.2% | 70.6% |
| Men | 60.1% | 60.6% |
| Women | 31.5% | 36.1% |
| 24 years old and under | 31.5% | 31.7% |
| 25 to 44 years old | 54.3% | 55.5% |
| 45 to 54 years old | 51.4% | 55.4% |
| 55 years old and over | 43.0% | 45.8% |
| Long-tenured workers | 64.2% | 67.5% |
| Occasional claimants | 42.0% | 43.7% |
| Frequent claimants | 50.7% | 51.9% |
| Canada | 48.8% | 50.9% |
- Note: Includes claims for which at least $1 of EI regular benefits was paid.
- Source: Employment and Social Development Canada, Employment Insurance (EI) administrative data. Results are based on 100% of data.
Consistent with previous years, the share of regular claims established receiving the maximum weekly benefit rate was significantly higher for men (60.6%) than for women (36.1%) in 2024-25. This is largely attributable to a higher proportion of women working in part-time jobs compared to men, resulting in generally lower average weekly insurable earnings.
Among age groups, claimants aged 25 to 44 years and 45 to 54 years had the highest shares of regular claims obtaining the maximum weekly benefit rate (55.5% and 55.4%) in 2024-25, while youth claimants (aged 24 and under) had the lowest share (31.7%). Among claimant categories, long-tenured workers had the largest share of regular claims receiving the maximum weekly benefit rate (67.5%), while occasional claimants had the smallest (43.7%).
Table 22 outlines the share of EI regular claims established by different weekly benefit rate groups. Results show that the majority (53.7%) of regular claims established in 2024-25 had a weekly rate of $651 and over. This was consistent with the proportion of regular claims established at the maximum weekly benefit rate in Canada ($668 in 2024 and $695 in 2025). This was followed by 14.7% of claims with rates between $501 and $600, and 13.3% with rates between $401 and $500. On average, 11.4% of claims had a weekly rate of $400 and less, while only 6.8% had between $601 and $650.
| Category | 2024-25 |
|---|---|
| $400 and under | 11.4% |
| $401 to $500 | 13.3% |
| $501 to $600 | 14.7% |
| $601 to $650 | 6.8% |
| $651 and over | 53.7% |
| Canada | 100.0% |
- Note: Includes claims for which at least $1 of EI regular benefits was paid.
- Source: Employment and Social Development Canada, Employment Insurance (EI) administrative data. Results are based on 100% of data.
2.2.4 Employment Insurance regular benefit entitlement
This subsection presents detailed analysis on the duration of EI regular benefits, both maximum entitlement and actual weeks used. Statistics presented in this subsection are based on claims that were completedFootnote 32 during the fiscal year. Statistics for the reporting fiscal year are preliminary estimates and are subject to revision in the future.
Claimants who have successfully established a claim for EI regular benefits are entitled to a maximum number of weeks of regular benefits they may receive, known as their entitlement. This entitlement ranges between 14 and 45 weeks and is determined by the number of hours of insurable employment accumulated by claimants during their qualifying periodFootnote 33 and the unemployment rate in the EI region where they live at the time the claim is established (consult Annex 2.2 for the entitlement table).
The EI program is designed to respond automatically to changes in economic conditions that affect local labour markets. The number of hours of insurable employment needed to qualify for EI regular benefits (420 to 700 hours) and the maximum number of weeks payable (14 to 45 weeks) vary depending on the monthly unemployment rate in the EI region in which a claimant lives. When an EI region's unemployment rate changes, the entrance requirement and the maximum number of weeks of EI regular benefits claimants are entitled to receive adjust in response.Footnote 34
The number of weeks of benefits that an EI claimant actually receives during a claim (defined as the actual duration of a claim) is usually lower than the maximum entitlement. This is usually due to circumstances such as:
- the claimant has found work and is no longer unemployed
- the claimant has switched to EI special benefits, or
- the claimant was disentitled from receiving regular benefits because they were not available for work during their claimFootnote 35
Claimants receive different levels of entitlement. In order to compare the duration of EI regular benefits regardless of their entitlement, the proportion of weeks of EI regular benefits used by claimants is also examined. This proportion is defined as the number of weeks of EI regular benefits used by claimants as a share of their maximum entitlement.
Duration of Employment Insurance regular benefits
As illustrated in Chart 15, the average maximum entitlement of completed EI regular claims increased from 28.4 weeks in 2023-24 to 29.6 weeks in 2024-25 (+4.2% or +1.2 weeks). The average actual duration also increased from 16.9 weeks in 2023-24 to 17.6 weeks in 2024-25 (+4.0% or +0.7 weeks). The increase in both entitlement and duration is attributable in part to the higher unemployment rate observed in 2024-25 compared to 2023-24.

Text description
| Fiscal year | 2015-16* | 2016-17* | 2017-18* | 2018-19 | 2019-20 | 2020-21** | 2021-22*** | 2022-23**** | 2023-24R | 2024-25P |
|---|---|---|---|---|---|---|---|---|---|---|
| Average maximum entitlement | 32.1 | 33.7 | 32.6 | 30.3 | 29.7 | 31.1 | Not comparable | 28.0 | 28.4R | 29.6P |
| Average actual duration | 19.3 | 20.7 | 20.3 | 18.5 | 18.2 | 21.1 | Not comparable | 16.8 | 16.9R | 17.6P |
| Unemployment rate | 7.1% | 6.9% | 6.2% | 5.8% | 5.9% | 10.2% | 6.8% | 5.1% | 5.6% | 6.6% |
- Note: Includes completed claims for which at least $1 of EI regular benefits was paid.
- *A temporary measure extended the number of weeks of EI regular benefits for claimants in 15 EI regions that were hit the hardest by the downturn in commodity prices during this period.
- **Includes claims established before March 15, 2020 and completed in 2020-21.
- ***Most claims completed in 2021-22 were entitled 50 weeks of EI regular benefits, therefore their average actual duration is not comparable with the other fiscal years.
- ****Includes claims established on or after September 26, 2021 and completed in 2022-23.
- P Preliminary data.
- R Revised data.
- Sources: Employment and Social Development Canada, Employment Insurance (EI) administrative data. Results are based on a 10% sample of EI administrative data for 2015-16 to 2020-21 and 100% of EI administrative data for 2022-23 to 2024-25 (for average maximum entitlement and average actual duration). Statistics Canada, Labour Force Survey, Table 14-10-0287-01 (for data on unemployment rates).
The average proportion of EI regular benefit weeks used in completed claims slightly decreased from 62.7% in 2023-24 to 62.2% in 2024-25. This was also lower than the proportion recorded for completed claims in 2022-23 (64.1%).
Duration of Employment Insurance regular claims by province or territory, gender, age, claimant category and industry
The duration of EI regular claims completed in 2024-25 varied significantly across provinces and territories, reflecting differences in regional labour market and labour market characteristics in 2024-25, as outlined in Table 23. EI regular claims established in Newfoundland and Labrador and Nunavut had the highest average maximum entitlement (36.6 weeks for both). These significantly higher maximum entitlements compared to the national average (29.6 weeks) can be explained in part by the high unemployment rates observed in these jurisdictions (the unemployment rate was 10.1% in Newfoundland and Labrador and 8.3% in Nunavut in 2024-25).Footnote 36These 2 jurisdictions also had the highest average actual duration (25.9 weeks and 26.3 weeks, respectively) and, as a result, were among the highest average proportion of regular benefit weeks used (72.8% and 72.0%, respectively) (consult Table 24 for proportions of EI regular benefit weeks used). In comparison, EI regular claims established in British Columbia and Quebec had the lowest average maximum entitlement among provinces (27.9 weeks and 28.4 weeks, respectively) corresponding to the lower unemployment rates generally observed in these provinces. Claims established in Quebec (15.1 weeks) and British Columbia (16.9 weeks) also registered the lowest average actual duration among all provinces in 2024-25. This resulted in a relatively low average proportion of EI regular benefit weeks used in these provinces. The Northwest Territories went from the second lowest average actual duration in 2023-24 (15.4 weeks) to one of the highest in 2024-25 (22.1 weeks). This represents an increase of 43.3% (or +6.7 weeks) even though the unemployment rate was fairly low at 5.4% in 2024-25. This increase was also reflected in the average proportion of EI regular benefit weeks used that went from 55.6% to 73.9% (+18.3 p.p.).
| Category | Average maximum entitlement (weeks) 2023-24 | Average maximum entitlement (weeks) 2024-25P | Change (%) in average maximum entitlement | Average actual duration (weeks) 2023-24R | Average actual duration (weeks) 2024-25P | Change (%) in average actual duration |
|---|---|---|---|---|---|---|
| Newfoundland and Labrador | 36.7 | 36.6 | -0.2% | 26.3 | 25.9 | -1.4% |
| Prince Edward Island | 31.1R | 33.0 | +6.0% | 21.5 | 22.0 | +2.2% |
| Nova Scotia | 30.6 | 31.9 | +4.4% | 21.2 | 21.2 | -0.2% |
| New Brunswick | 30.9 | 32.1 | +3.7% | 21.8 | 21.7 | 0.0% |
| Quebec | 27.4R | 28.4 | +3.6% | 14.6 | 15.1 | +3.5% |
| Ontario | 27.4 | 29.3 | +6.9% | 16.0 | 17.5 | +9.0% |
| Manitoba | 28.6 | 29.3 | +2.3% | 17.6 | 17.9 | +1.5% |
| Saskatchewan | 30.6 | 31.1 | +1.7% | 19.2 | 19.2 | +0.3% |
| Alberta | 28.8R | 30.5 | +5.7% | 17.0 | 17.9 | +4.9% |
| British Columbia | 27.3 | 27.9 | +2.5% | 16.5 | 16.9 | +2.6% |
| Yukon | 27.5 | 27.6 | +0.4% | 18.2 | 18.1 | -0.8% |
| Northwest Territories | 30.4R | 31.0 | +2.0% | 15.4 | 22.1 | +43.3% |
| Nunavut | 37.6R | 36.6 | -2.6% | 26.7 | 26.3 | -1.3% |
| Men | 29.2 | 30.4 | +4.2% | 17.4 | 18.0 | +3.7% |
| Women | 27.3 | 28.4 | +4.2% | 16.2 | 16.9 | +4.3% |
| 24 years old and under | 26.8 | 27.8 | +3.7% | 15.3 | 15.6 | +2.3% |
| 25 to 44 years old | 28.7 | 29.9 | +4.3% | 16.1 | 16.8 | +4.8% |
| 45 to 54 years old | 29.1 | 30.3 | +4.2% | 16.9 | 17.6 | +4.1% |
| 55 years old and over | 28.0 | 29.2 | +4.5% | 19.1 | 19.8 | +3.4% |
| Long-tenured workers | 31.3R | 32.3 | +3.2% | 14.3 | 15.5 | +8.0% |
| Occasional claimants | 27.4 | 28.6 | +4.6% | 16.5 | 17.3 | +4.8% |
| Frequent claimants | 28.1R | 29.3 | +4.1% | 20.8 | 21.0 | +1.0% |
| Canada | 28.4R | 29.6 | +4.2% | 16.9 | 17.6 | +4.0% |
- Note: Percentage changes are based on unrounded numbers. Includes completed claims for which at least $1 of EI regular benefits was paid.
- P Preliminary data.
- R Revised data.
- Consult Annex 2.5 for more details on average actual duration.
- Source: Employment and Social Development Canada, Employment Insurance (EI) administrative data. Results are based on 100% of data.
| Category | 2023-24R | 2024-25P | Change (% points) |
|---|---|---|---|
| Newfoundland and Labrador | 73.6% | 72.8% | -0.8 |
| Prince Edward Island | 72.1% | 69.0% | -3.2 |
| Nova Scotia | 72.4% | 69.2% | -3.2 |
| New Brunswick | 73.7% | 70.8% | -2.8 |
| Quebec | 58.1% | 57.5% | -0.6 |
| Ontario | 61.6% | 62.2% | +0.5 |
| Manitoba | 64.0% | 63.2% | -0.8 |
| Saskatchewan | 65.5% | 64.4% | -1.2 |
| Alberta | 62.3% | 61.4% | -0.8 |
| British Columbia | 63.7% | 63.2% | -0.5 |
| Yukon | 70.2% | 69.1% | -1.1 |
| Northwest Territories | 55.6% | 73.9% | +18.3 |
| Nunavut | 71.8% | 72.0% | +0.2 |
| Men | 63.6% | 62.7% | -0.9 |
| Women | 61.5% | 61.3% | -0.2 |
| 24 years old and under | 60.7% | 59.5% | -1.1 |
| 25 to 44 years old | 59.2% | 59.1% | -0.1 |
| 45 to 54 years old | 60.8% | 60.4% | -0.4 |
| 55 years old and over | 71.3% | 70.2% | -1.1 |
| Long-tenured workers | 47.6% | 49.6% | +2.0 |
| Occasional claimants | 63.3% | 62.9% | -0.4 |
| Frequent claimants | 77.2% | 74.7% | -2.5 |
| Canada | 62.7% | 62.2% | -0.6 |
- Note: Changes in percentage points are based on unrounded numbers. Includes completed claims for which at least $1 of EI regular benefits was paid.
- P Preliminary data.
- R Revised data.
- Source: Employment and Social Development Canada, Employment Insurance (EI) administrative data. Results are based on 100% of data.
The average maximum entitlement of EI regular claims completed in 2024-25 was lower for women (28.4 weeks) than men (30.4 weeks) partly because they are more likely to work in part-time jobs and to accumulate less hours of insurable employment. Women also used on average fewer weeks of regular benefits compared to men in 2024-25 (16.9 weeks and 18.0 weeks, respectively). In terms of proportion, women used on average a slightly lower share of their regular benefits entitlement than men in 2024-25 (61.3% for women compared to 62.7% for men).
In terms of age groups, claimants aged 24 and under had the lowest average maximum entitlement (27.8 weeks) and the lowest average actual duration (15.6 weeks) of EI regular claims completed in 2024-25. Similar to women, this is partly because this age group is more likely to work in part-time jobs and to accumulate less hours of insurable employment. In comparison, claimants aged 55 and over used, on average, the highest number of weeks of regular benefits (19.8 weeks) and the highest proportion of their regular benefits entitlement (70.2%) in 2024-25.
With regard to claimant categories, long-tenured workers generally have higher maximum entitlements than occasional and frequent claimants, as they are more likely to accumulate hours of insurable employment well above the minimum requirements for EI regular benefits. This was true for completed claims in 2024-25 (32.3 weeks, 28.6 weeks and 29.3 weeks, respectively). On average, occasional and frequent claimants used more weeks of EI regular benefits than long-tenured workers. This was reflected in their average proportion of regular benefit weeks used, as frequent (74.7%) and occasional (62.9%) claimants used proportionally more weeks of regular benefits than long-tenured workers (49.6%) in 2024-25. This discrepancy between categories of claimants can be explained by the fact that long tenured workers generally have stronger labour market attachment, tend to have more weeks of regular benefits entitlement, and collect fewer weeks of benefits. As such, they use a lower proportion of their benefit weeks. However, the average actual duration of EI regular claims completed by long-tenured workers increased by 8.0% (+1.1 weeks) in 2024-25 compared to 2023-24.
In terms of industry breakdown, EI regular claims completed in 2024-25 with the highest average actual durations were from Finance, insurance, real estate, rental and leasing (21.1 weeks), Agriculture, forestry, fishing and hunting (20.8 weeks), and Wholesale and retail trade (20.4 weeks). These industries also used a higher share of their regular benefits entitlement on average than the national level (69.6%, 73.9% and 69.7%, respectively). Conversely, claims established by claimants from the Educational services industry had the lowest average actual duration (10.7 weeks) and the lowest average proportion of regular benefit weeks used (43.3%) due to the seasonal nature of this sector and the relatively short and well defined "off-season" over the summer months (consult Annex 2.6.2). The highest increase in average actual duration of EI regular claims completed in 2024-25 compared to 2023-24, was in the Information, culture and recreation industry (+1.5 weeks or +8.5%).
Proportion of Employment Insurance regular benefit weeks used by weeks of entitlement, EI regional unemployment rate and working while on claim status
As with the duration of EI regular benefits, a few factors may influence the proportion of entitlement used by claimants; for instance, the number of hours of insurable employment, the EI regional unemployment rates and working while on claim.
Claimants with a greater number of hours of insurable employment and those residing in EI regions with lower unemployment rates are more likely to find employment following a job separation before they exhaust their weeks of EI benefits. Therefore, they use a lower proportion of their maximum entitlement for EI regular benefits.
As shown in Table 25, on average for EI regular claims completed in 2024-25, claimants with the lowest number of entitlement weeks (between 14 and 19 weeks) used 81.5% of their entitlement compared to claimants with the highest number of weeks of entitlement (45 weeks) who only used 46.7% of their entitlement.
| Category | 2023-24R | 2024-25P | Change (% points) |
|---|---|---|---|
| Between 14 and 19 weeks of entitlement for EI regular benefits | 82.1% | 81.5% | -0.7 |
| Between 20 and 24 weeks of entitlement for EI regular benefits | 71.7% | 71.7% | 0.0 |
| Between 25 and 29 weeks of entitlement for EI regular benefits | 60.1% | 61.1% | +1.0 |
| Between 30 and 34 weeks of entitlement for EI regular benefits | 56.9% | 56.4% | -0.4 |
| Between 35 and 39 weeks of entitlement for EI regular benefits | 51.2% | 55.6% | +4.5 |
| Between 40 and 44 weeks of entitlement for EI regular benefits | 46.2% | 43.5% | -2.7 |
| 45 weeks of entitlement for EI regular benefits | 49.6% | 46.7% | -2.8 |
| Unemployment rate in the EI region: 6.0% or less | 61.5% | 62.2% | +0.6 |
| Unemployment rate in the EI region: Between 6.1% and 8.0% | 61.1% | 61.1% | 0.0 |
| Unemployment rate in the EI region: Between 8.1% and 10.0% | 61.9% | 57.4% | -4.5 |
| Unemployment rate in the EI region: Between 10.1% and 13.0% | 74.4% | 73.4% | -1.0 |
| Unemployment rate in the EI region: 13.1% or more | 71.8% | 66.7% | -5.0 |
| Not working while on claim | 67.4% | 66.3% | -1.1 |
| Working while on claim | 57.1% | 56.5% | -0.5 |
| Canada | 62.7% | 62.2% | -0.6 |
- Note: Changes in percentage points are based on unrounded numbers. Includes completed claims for which at least $1 of EI regular benefits was paid.
- P Preliminary data.
- R Revised data.
- Source: Employment and Social Development Canada, Employment Insurance (EI) administrative data. Results are based on 100% of data.
Conversely, higher proportions of entitlement used are generally associated with EI regions with higher unemployment rates. Although these EI regions typically provide higher entitlement, they are also often characterized by weaker labour market conditions. For claims completed in 2024-25, those in lower EI unemployment rate regions (6% or lower) used on average 62.2% of their entitlement, whereas claims in higher EI unemployment rate regions (13.1% and higher) used on average 66.7% of their entitlement.
Claimants working while on claim generally use a lower portion of their entitlement, as they may have a stronger labour market attachment and may also defer weeks of EI regular benefits. This leads to a lower proportion of their entitlement weeks used compared to claimants who did not work while on claim (on average 56.5% versus 66.3%, respectively, in 2024-25).Footnote 37
2.2.5 Exhaustion of Employment Insurance regular benefits
This subsection examines EI regular claims that end either when all the entitled weeks of benefits are paid to the claimant, or when the end of the benefit period is reached, before all the entitled weeks have been paid. Since a claim must be completed in order to determine whether the entitlement or benefit period is exhausted or not, the analysis in this subsection focuses on EI regular claims completed during the fiscal year. Statistics for the reporting fiscal year are preliminary estimates and are subject to revision in the future.
As mentioned in subsection 2.2.4, entitlement to EI regular benefits, ranging between 14 to 45 weeks, is determined based on 2 factors. The first is the unemployment rate in the EI region where claimants live at the time of establishing their claim and the second is the number of hours of insurable employment accumulated in the previous 52 weeks or since the start of their last claim, whichever is shorter. Claims also have a benefit period during which benefits can be paid. The benefit period is generally 52 weeks but may be extended under specific circumstances.Footnote 38
Claimants are considered to have exhausted their entitlement to EI regular benefits when the number of weeks of regular benefits paid (actual duration) equals the entitlement available over the course of the benefit period (the period during which an EI claimant can receive EI benefits). Measuring the entitlement exhaustion rate of EI regular benefits gives an indication of the support provided by EI regular benefits to those looking for suitable employment following a job separation.
Claimants are considered to have exhausted their benefit period when their benefit period ends before all weeks of entitlement have been paid. When this occurs, unless the claimant has stopped filing EI biweekly reports,Footnote 39 the claim is considered to have exhausted its benefit period.
Example: Entitlement exhaustion versus benefit period exhaustion
David works as a full-time chef at a restaurant in Toronto, Ontario. The restaurant closes permanently and he is laid off on October 13, 2023. Following the job separation, David applies for EI regular benefits. Service Canada determines that David is eligible for EI regular benefits and entitled to receive up to 19 weeks of EI regular benefits based on his accumulated hours of insurable employment during the qualifying period and the regional unemployment rate. Service Canada establishes David's benefit period (during which benefits may be paid) starting the week of October 22, 2023 for a length of 52 weeks. After serving the one week waiting period, David starts receiving EI regular benefits in the week starting October 29, 2023.
Scenario: Entitlement exhaustion
David is unable to find suitable employment during the full 19 weeks of his EI regular benefits. As of March 9, 2024, he has exhausted his regular benefit entitlement as the number of weeks of benefits received equals the entitlement. This is illustrated below.

Text description for scenario entitlement exhaustion
David's full entitlement equals the actual duration received (19 weeks). David loses his job on October 13, 2023. David starts to receive EI regular benefits on October 29, 2023. David reaches the end of his entitlement on March 9, 2024.
Scenario: Benefit period exhaustion
In this scenario, David starts receiving EI regular benefits the week starting October 29, 2023 and continues for the next 15 weeks, until February 10, 2024. At that point, David becomes ill and unable to work, so transitions to EI sickness benefits. As of August 10, 2024, he has received the full 26 weeks of sickness benefits. David's health condition improves and starting on October 6, 2024, he is capable of and available for work, but unable to find suitable employment. He claims EI regular benefits for 2 weeks before reaching the end of his benefit period on October 19, 2024. David's benefit period ended before he could collect all 19 weeks of EI regular benefits he was entitled to. Since the benefit period cannot be extended, he exhausted his benefit period. This is illustrated below.

Text description for scenario benefit period exhaustion
David loses his job on October 13, 2023. David's benefit period starts on October 22, 2023. David starts to receive EI regular benefits on October 29, 2023. David switches to EI sickness benefits on February 10, 2024. David claims EI regular benefits for 2 weeks on October 6, 2024. David's benefit period ends, he has 2 weeks of uncollected EI regular benefits on October 19, 2024.
Entitlement exhaustion of Employment Insurance regular benefits
Of the total EI regular claims completed in 2024-25, 34.4% exhausted their entitlement for EI regular benefits, a decrease of 0.6 p.p. compared to claims completed in 2023-24 (consult Chart 16). The entitlement exhaustion rates in 2023-24 and 2024-25 were lower than those recorded in 2020-21 (36.9%) and 2022-23 (36.4%) which were likely impacted by the economic slowdown due to the COVID-19 pandemic and the EI temporary measures introduced to facilitate access to the EI program, respectively. In comparison, entitlement exhaustion rates in 2023-24 and 2024-25 were higher than those observed before the pandemic (33.1% on average over the 2018-19 and 2019-20 period). This could be explained in part by an increase in the national unemployment rate during those 2 fiscal years‒rising from 5.1% in April 2023 to 6.7% in March 2025‒ which may have made it more difficult for unemployed individuals to find employment. In addition, the higher entitlement exhaustion rates could also be explained by the lower average maximum entitlement for claims completed in 2023-24 and 2024-25 than that of claims completed before the pandemic as illustrated in Chart 15 in subsection 2.2.4.

Text description
| Fiscal year | 2015-16* | 2016-17* | 2017-18* | 2018-19 | 2019-20 | 2020-21** | 2021-22*** | 2022-23**** | 2023-24 | 2024-25 |
|---|---|---|---|---|---|---|---|---|---|---|
| Entitlement exhaustion rate | 31.2% | 34.9% | 34.1% | 33.0% | 33.1% | 36.9% | Not comparable | 36.4% | 35.0%R | 34.4%P |
| Benefit period exhaustion rate | 22.7% | 17.8% | 18.2% | 18.2% | 20.4% | 26.9% | Not comparable | 16.7% | 20.8%R | 20.4%P |
- Note: Includes completed claims for which at least $1 of EI regular benefits was paid.
- *A temporary measure extended the number of weeks of EI regular benefits for claimants in 15 EI regions that were hit the hardest by the downturn in commodity prices during this period.
- **Includes claims established before March 15, 2020 and completed in 2020-21.
- ***Most claims completed in 2021-22 were entitled 50 weeks of EI regular benefits, therefore their exhaustion rates are not comparable with the other fiscal years.
- ****Includes claims established on or after September 26, 2021 and completed in 2022-23.
- P Preliminary data.
- R Revised data.
- Source: Employment and Social Development Canada, Employment Insurance (EI) administrative data. Results are based on a 10% sample of data for 2015-16 to 2020-21 and 100% of data for 2022-23 to 2024-25.
All provinces and territories had entitlement exhaustion rates above the national level for claims completed in 2024-25, except for Quebec. As illustrated in Table 26, despite a decrease at the national level, the entitlement exhaustion rate increased for 3 jurisdictions in 2024-25 compared to 2023-24: in Northwest Territories (+16.1 p.p.), Ontario (+1.4 p.p.) and Nunavut (+0.4 p.p.).
| Category | Entitlement exhaustion rate 2023-24R | Entitlement exhaustion rate 2024-25P | Change (% points) in entitlement exhaustion rate | Benefit period exhaustion rate 2023-24R | Benefit period exhaustion rate 2024-25P | Change (% points) in benefit period exhaustion rate |
|---|---|---|---|---|---|---|
| Newfoundland and Labrador | 40.9% | 39.6% | -1.3 | 36.7% | 36.6% | -0.2 |
| Prince Edward Island | 43.4% | 37.3% | -6.1 | 27.2% | 30.4% | +3.2 |
| Nova Scotia | 44.5% | 39.5% | -5.0 | 23.0% | 25.0% | +2.0 |
| New Brunswick | 42.0% | 36.3% | -5.6 | 30.8% | 34.6% | +3.8 |
| Quebec | 30.4% | 29.4% | -1.0 | 24.5% | 23.9% | -0.6 |
| Ontario | 34.5% | 35.9% | +1.4 | 16.5% | 15.0% | -1.5 |
| Manitoba | 35.7% | 35.2% | -0.5 | 19.6% | 19.8% | +0.2 |
| Saskatchewan | 37.1% | 35.7% | -1.4 | 19.5% | 19.5% | -0.1 |
| Alberta | 36.3% | 35.3% | -1.0 | 16.4% | 16.1% | -0.2 |
| British Columbia | 36.8% | 36.3% | -0.4 | 14.6% | 16.4% | +1.8 |
| Yukon | 44.3% | 42.1% | -2.3 | 16.5% | 14.0% | -2.5 |
| Northwest Territories | 36.2% | 52.3% | +16.1 | 7.0% | 12.9% | +6.0 |
| Nunavut | 47.8% | 48.2% | +0.4 | 11.1% | 12.5% | +1.4 |
| Men | 35.6% | 34.5% | -1.1 | 21.8% | 20.9% | -0.9 |
| Women | 34.0% | 34.0% | 0.0 | 19.3% | 19.5% | +0.3 |
| 24 years old and under | 36.7% | 35.3% | -1.4 | 14.7% | 14.1% | -0.6 |
| 25 to 44 years old | 31.8% | 31.9% | 0.0 | 18.6% | 17.9% | -0.8 |
| 45 to 54 years old | 31.7% | 31.3% | -0.4 | 23.6% | 23.3% | -0.4 |
| 55 years old and over | 42.6% | 40.9% | -1.6 | 24.6% | 25.2% | +0.6 |
| Long-tenured workers | 22.2% | 24.8% | +2.6 | 20.6% | 18.7% | -1.9 |
| Occasional claimants | 37.2% | 37.1% | -0.1 | 16.8% | 16.3% | -0.5 |
| Frequent claimants | 42.5% | 37.5% | -5.0 | 31.6% | 34.0% | +2.4 |
| Canada | 35.0% | 34.4% | -0.6 | 20.8% | 20.4% | -0.4 |
- Note: Changes in percentage points are based on unrounded numbers. Includes completed claims for which at least $1 of EI regular benefits was paid.
- P Preliminary data.
- R Revised data.
- Source: Employment and Social Development Canada, Employment Insurance (EI) administrative data. Results are based on 100% of data.
Historically, claims established by women tend to have a higher entitlement exhaustion rate compared to claims established by men. This may be due to the fact that, on average, women qualified for fewer weeks of EI regular benefit entitlement than men (28.4 weeks compared to 30.4 weeks, respectively, consult Table 23 in subsection 2.2.4). A higher proportion of women work in part-time or temporary jobs than men, and thus accumulate fewer hours of insurable employment on average, resulting in lower entitlement. However, this trend was reversed for claims completed in 2023-24, as women had a lower entitlement exhaustion rate than men. This was also the case for claims completed in 2024-25 where the entitlement exhaustion rate of EI regular claims established by women (34.0%) was slightly less than that by men (34.5%).
By age group, claimants aged 55 and over had the highest entitlement exhaustion rate (40.9%), followed by those aged 24 and under (35.3%). These claimants tend to exhaust their entitlement more often, which may reflect their lower entitlement on average, as well as the challenges they face in securing new employment following a job loss.
By EI claimant category, long-tenured workers had a lower entitlement exhaustion rate than occasional claimants and frequent claimants for claims completed in 2024-25. However, the entitlement exhaustion rate of claims established by long-tenured workers increased (+2.6 p.p.) compared to 2023-24, while it decreased for claims established by frequent claimants and occasional claimants (-5.0 p.p. and -0.1 p.p. respectively).
Benefit period exhaustion of Employment Insurance regular benefits
When a claimant's benefit period ends before all weeks of entitlement to EI regular benefits have been paid, unless the claimant has stopped filing EI biweekly reports, the benefit period is considered to have been exhausted. As shown in Chart 16, the benefit period exhaustion rate is generally lower than the entitlement exhaustion rate.
In 2024-25, 20.4% of all completed EI regular claims exhausted their benefit period (consult Table 26). This rate was 0.4 p.p. lower than that observed for claims completed in 2023-24 (20.8%) and the same as the pre-pandemic fiscal year 2019-20.
In general, claims established in the Atlantic provinces, by older claimants and frequent claimants have a higher benefit period exhaustion rate than the national level. This may be explained by the different factors presented below.
Entitlement exhaustion versus benefit period exhaustion
The circumstances that result in benefit period exhaustion are generally different from those associated with entitlement exhaustion. Many variables influence benefit period exhaustion, including regular benefit entitlement, weeks worked while on claim (potentially leading to deferred benefit weeks) and the use of special benefits (adding another type of benefits to the claim).
Table 27 outlines different characteristics of completed EI regular claims by exhaustion type in 2024-25. For instance, EI regular claims in EI regions with lower unemployment rates were generally less likely to exhaust their benefit period in 2024-25 compared to claims established in EI regions with higher unemployment rates.
| Category | Entitlement exhaustionP | Benefit period exhaustionP |
|---|---|---|
| Exhaustion rate - overall | 34.4% | 20.4% |
| Regional unemployment rate at the time of claim establishment: 6.0% or less | 33.6% | 23.1% |
| Regional unemployment rate at the time of claim establishment: 6.1% to 8.0% | 36.1% | 12.3% |
| Regional unemployment rate at the time of claim establishment: 8.1% to 10.0% | 29.0% | 22.1% |
| Regional unemployment rate at the time of claim establishment: 10.1% to 13.0% | 40.0% | 32.8% |
| Regional unemployment rate at the time of claim establishment: 13.1% or above | 33.6% | 36.8% |
| Proportion of exhausted claims involving at least one week worked while on claim | 26.6% | 67.1% |
| Average weeks worked while on claim* | 10.8 weeks | 14.5 weeks |
| Requalification rate for EI regular benefits** | 7.2% | 74.3% |
| Average weeks of EI regular benefits paid | 25.9 weeks | 16.6 weeks |
| Share of mixed claims (EI regular and special benefits) | 9.3% | 18.7% |
| Average proportion of regular benefit entitlement used | 100.0% of weeks | 53.2% of weeks |
- Note: Includes completed claims for which at least $1 of EI regular benefits was paid.
- * Includes only claims with at least one week worked while on claim.
- ** The requalification rate refers to the proportion of claimants who are able to requalify for a new claim within 4 weeks following the termination of their claim.
- P Preliminary data.
- Source: Employment and Social Development Canada, Employment Insurance (EI) administrative data. Results are based on 100% of data.
Furthermore, a much greater proportion of claims that exhausted the benefit period included at least one week worked while on claim (67.1%) compared with claims that exhausted their entitlement (26.6%). This is likely due to the Working While on Claim provision that allows claimants to defer weeks of entitlement to be used later in the benefit period. Claims that had at least one week worked while on claim and exhausted their benefit period had, on average, a greater number of weeks worked while on claim (14.5 weeks) compared with claims that exhausted their entitlement (10.8 weeks).
Because a larger share of claims that exhausted their benefit period also included at least one week worked while on claim, claimants were more likely to accumulate enough hours of insurable employment during their benefit period to meet the eligibility requirements to establish a new claim following the end of their claim. As a result, a much greater proportion of claims that exhausted the benefit period (74.3%) requalified for a new claim within 4 weeks following the termination of the claim compared with completed claims that exhausted their entitlement (7.2%).
In addition, completed claims that exhausted their benefit period received fewer weeks of EI regular benefits on average (16.6 weeks) compared with claims that exhausted their entitlement (25.9 weeks) in 2024-25. Completed EI regular claims that exhausted their benefit period used, on average, just over half (53.2%) of their entitlement. Among completed EI claims combining regular and special benefits, the share that exhausted their benefit period was greater than the share that exhausted their entitled weeks of regular benefits in 2024-25 (18.7% and 9.3%, respectively).
2.2.6 Employment Insurance regular benefits and seasonal claimants
Seasonal claimants are EI claimants who had at least 3 regular or fishing claims in the 5 years preceding the reference (current) claim, with at least 2 of these claims having started during the same time of year as the current claim.Footnote 40,Footnote 41 The definition of seasonal claimants is not exclusive of the definitions for other EI claimant categories.Footnote 42
As outlined in the definition, claims established by seasonal claimants can include both EI regular and fishing claims. In 2024-25, a total of 425,800 new claims were established by seasonal claimants. Of those, 403,100 claims (94.7%) were for EI regular benefits and 22,700 claims (5.3%) were for EI fishing benefits.Footnote 43 The analysis presented in this subsection focuses only on regular claims established by seasonal claimants.Footnote 44 For simplicity, in the rest of this subsection, these claims are referred to as EI seasonal regular claims.
The number of new EI seasonal regular claims increased by 3.9% in the reporting fiscal year, from 388,100 claims in 2023-24 to 403,100 claims in 2024-25. The seasonal regular claims' share of all regular claims established in 2024-25 was 28.7%. As illustrated in Chart 17, this was comparable to the shares recorded in the past 3 fiscal years and before the COVID-19 pandemic. The lower share (23.5%) observed in 2021-22 could be due in part to the significantly high number of non-seasonal regular claims established during the pandemic.

Text description
| Fiscal year | 2015-16 | 2016-17 | 2017-18 | 2018-19 | 2019-20 | 2020-21* | 2021-22 | 2022-23 | 2023-24 | 2024-25 |
|---|---|---|---|---|---|---|---|---|---|---|
| Number of seasonal regular claims established (in '000s) | 425.7 | 380.7 | 381.1 | 395.3 | 413.4 | Not comparable | 342.8 | 382.0 | 388.1 | 403.1 |
| Seasonal regular claims as share of all regular claims | 29.7% | 28.8% | 29.3% | 30.6% | 30.2% | Not comparable | 23.5% | 29.7% | 28.2% | 28.7% |
- Note: Includes claims for which at least $1 of EI regular benefits was paid.
- * Claims for EI regular benefits could not be established during the first half of 2020-21 due to the implementation of the Canada Emergency Response Benefits. Consequently, results for 2020-21 are not comparable with other fiscal years.
- Source: Employment and Social Development Canada, Employment Insurance (EI) administrative data. Results are based on a 10% sample of data for 2015-16 to 2022-23 and 100% of data for 2023-24 and 2024-25.
Similar to the national level, the number of EI seasonal regular claims increased in all jurisdictions in 2024-25 compared to the previous fiscal year, except for Newfoundland and Labrador (-1.0%), New Brunswick (-0.7%) and the territories (-0.6%) (consult Table 28). The number of EI seasonal regular claims increased across genders and age groups between 2023-24 and 2024-25.
| Category | New seasonal regular claims established 2023-24 | New seasonal regular claims established 2024-25 | Change (%) in new seasonal regular claims established | New seasonal regular claims as a share of total new regular claims (%) 2024-25 |
|---|---|---|---|---|
| Newfoundland and Labrador | 28,008 | 27,722 | -1.0% | 49.5% |
| Prince Edward Island | 7,058 | 7,138 | +1.1% | 48.0% |
| Nova Scotia | 20,297 | 20,524 | +1.1% | 39.0% |
| New Brunswick | 28,849 | 28,654 | -0.7% | 47.1% |
| Quebec | 137,181 | 140,158 | +2.2% | 35.4% |
| Ontario | 93,995 | 99,717 | +6.1% | 22.3% |
| Manitoba | 12,090 | 12,837 | +6.2% | 28.2% |
| Saskatchewan | 9,975 | 10,534 | +5.6% | 28.6% |
| Alberta | 24,377 | 26,803 | +10.0% | 18.6% |
| British Columbia | 25,601 | 28,355 | +10.8% | 19.6% |
| Territories | 664 | 660 | -0.6% | 18.1% |
| Men | 245,570 | 248,858 | +1.3% | 29.3% |
| women | 142,525 | 154,244 | +8.2% | 27.8% |
| 24 years old and under | 8,173 | 8,934 | +9.3% | 7.0% |
| 25 to 44 years old | 143,843 | 150,927 | +4.9% | 23.0% |
| 45 to 54 years old | 90,382 | 93,576 | +3.5% | 35.2% |
| 55 years old and over | 145,697 | 149,665 | +2.7% | 42.5% |
| Goods-producing industries | 177,813 | 174,618 | -1.8% | 34.1% |
| Services-producing industries | 205,414 | 222,400 | +8.3% | 26.0% |
| Unclassified industries* | 4,868 | 6,084 | +25.0% | 17.3% |
| Canada | 388,095 | 403,102 | +3.9% | 28.7% |
- Note: Includes claims for which at least $1 of EI regular benefits was paid.
- * For some claims, industry information was not available in the data.
- Consult Annex 2.9 for more details.
- Source: Employment and Social Development Canada, Employment Insurance (EI) administrative data. Results are based on 100% of data.
As in the past, the share of seasonal regular claims among total regular claims was higher in the Atlantic provinces and Quebec, compared to Ontario, the Western provinces and the territories. This may be attributed to the composition of industries in the Atlantic provinces and Quebec, which contain a large share of goods-producing industries. As shown in Table 28, goods-producing industries had a higher share of EI seasonal regular claims among all regular claims than services-producing industries (34.1% compared to 26.0% in 2024-25). This can be due to a larger proportion of seasonal employment in the goods-producing industries, notably in the Agriculture, forestry, fishing and hunting industry and the Construction industry.
The share of seasonal regular claims as a proportion of all regular claims for women was relatively close to the share for men in 2024-25. Claimants aged 55 and above continued to have the highest share (42.5%) of EI seasonal regular claims among all regular claims across all age groups in 2024-25. In comparison, the share of seasonal regular claims established by younger claimants (aged 24 and less) remained low (7.0% of all regular claims) in 2024-25. Although younger individuals are more likely to work in seasonal jobs (consult the text box 'Seasonal workers in the Labour Force Survey' below), a larger share of them tend to quit jobs and return to school, which is not a valid reason for job separation under the Employment Insurance Act. Consequently, they are disqualified from receiving EI benefits. In addition, younger claimants are less likely to have the historical claiming pattern to meet the condition to be defined as seasonal claimants.
Seasonal workers in the Labour Force Survey
Every month, Statistics Canada provides information on employment, unemployment and other key labour market indicators by a variety of demographic characteristics through the Labour Force Survey (LFS). According to the LFS, there were 362,500 seasonal workers in Canada* in 2024-25, down by 2.7% from the previous year. Though this figure is relatively similar to that of EI seasonal regular claims established in 2024-25 (403,100), the 2 measures are very different. The definition of seasonal claimants used by the EI program is based on the claimant's recent history of EI regular and fishing benefits usage, while the LFS defines seasonal workers as those who identify their employment as temporary due to being seasonal in nature.
Based on the LFS, seasonal workers represented 2.0% of total employment in 2024-25, similar to the previous fiscal year. Among the total temporary employment,** seasonal workers accounted for 17.7% in 2024-25, down from 18.3% in 2023-24. In the Atlantic provinces, seasonal workers accounted for 3.9% of total employment in 2024-25, slightly higher than the previous fiscal year (3.7%). In comparison, seasonal workers accounted for 2.0% of total employment in Quebec, 1.7% in Ontario and 1.9% in the Western provinces in 2024-25. Compared to 2023-24, 7 provinces registered an increase in seasonal employment in 2024-25, ranging from +16.9% in New Brunswick to +2.6% in Nova Scotia. Conversely, Quebec (-13.6%), Ontario (-5.2%) and British Columbia (-4.0%) registered a decrease in the number of seasonal workers over the 2 fiscal years.
Historically, younger individuals (aged between 15 and 24 years old) are more likely to work in seasonal jobs, attributed to summer employment patterns for students. This remained true in 2024-25, as young workers accounted for 48.4% of total seasonal workers. Men are also over-represented in seasonal employment. In 2024-25, they accounted for 59.6% of all seasonal employment.
Seasonal employment is largely concentrated in the services-producing industries. In 2024-25, 72.1% of all seasonal jobs were in the services-producing industries. The Information, culture and recreation industry (21.9% of all seasonal jobs) and the Wholesale and retail trade industry (10.2% of all seasonal jobs) accounted for almost a third of all seasonal jobs in Canada in 2024-25. On the other hand, the Construction industry in the goods-producing sector accounted for 14.7% of all seasonal jobs in 2024-25.
- * Statistics Canada, Labour Force Survey, Table 14-10-0071-01.
- ** In the Labour Force Survey questionnaire, respondents are first asked to identify if their job is permanent or not. Respondents whose employment is not permanent are asked to identify the way in which it is not permanent: seasonal jobs; temporary, term or contract jobs including work done through a temporary help agency; casual jobs; and other temporary work.
Generally, the number of EI seasonal regular claims established throughout the year varies by quarter. For instance, 55.9% of all seasonal regular claims established in 2024-25 were established in the third quarter (October to December) of the fiscal year (consult Chart 18). This can be attributed to the slowdown in many seasonal industries during that time of year. The dominance of seasonal regular claims in the third quarter was consistently observed in all parts of Canada.

Text description
| Region | Q1 (April to June) | Q2 (July to September) | Q3 (October to December) | Q4 (January to March) |
|---|---|---|---|---|
| Atlantic provinces | 8.8% | 15.2% | 60.2% | 15.9% |
| Quebec | 6.7% | 17.6% | 64.7% | 11.0% |
| Ontario | 6.7% | 31.7% | 48.4% | 13.2% |
| Western provinces | 8.5% | 35.8% | 45.3% | 10.3% |
| Territories | 13.5% | 14.4% | 61.4% | 10.8% |
| Canada | 7.5% | 24.1% | 55.9% | 12.5% |
- Note: Includes claims for which at least $1 of EI regular benefits was paid.
- Source: Employment and Social Development Canada, Employment Insurance (EI) administrative data. Results are based on 100% of data.
As outlined in Table 29, seasonal regular claims were more likely to be established in the third quarter of the fiscal year by men, claimants aged below 25 years old, and claimants in the goods-producing industries. Though claimants in the services-producing industries were also more likely to establish seasonal regular claims in the third quarter of the fiscal year, 47.2% of claims within these industries were established in the first 2 quarters. This is likely due to the summer "off-season" in the Educational services industry, reflecting school closures during that period of the year.
| Category | Share of claims established in Q1 (April to June) | Share of claims established in Q2 (July to September) | Share of claims established in Q3 (October to December) | Share of claims established in Q4 (January to March) |
|---|---|---|---|---|
| Men | 5.7% | 10.7% | 68.1% | 15.5% |
| Women | 10.4% | 45.9% | 36.3% | 7.5% |
| 24 years old and under | 4.0% | 14.8% | 66.1% | 15.1% |
| 25 to 44 years old | 5.8% | 22.8% | 58.8% | 12.6% |
| 45 to 54 years old | 7.8% | 30.3% | 50.7% | 11.3% |
| 55 years old and over | 9.1% | 22.3% | 55.8% | 12.9% |
| Goods-producing-industries | 3.9% | 8.4% | 72.1% | 15.6% |
| Services-producing industries | 10.4% | 36.8% | 42.9% | 9.9% |
| Unclassified industries* | 5.5% | 11.9% | 67.8% | 14.9% |
| Canada | 7.5% | 24.1% | 55.9% | 12.5% |
- Note: Includes claims for which at least $1 of EI regular benefits was paid.
- * For some claims, industry information was not available in the data.
- Source: Employment and Social Development Canada, Employment Insurance (EI) administrative data. Results are based on 100% of data.
Level of Employment Insurance regular benefits for seasonal claimants
The average weekly benefit rate for seasonal regular claims established in 2024-25 was $601, an increase of 3.7% from 2023-24 (consult Annex 2.9.3). This was higher than the average weekly benefit rate for non-seasonal regular claims ($575) established during the same period.
Duration and exhaustion of Employment Insurance regular benefits among seasonal claimants
The average maximum entitlement of seasonal regular claims completed in 2024-25 was 29.8 weeks, slightly higher than 28.7 weeks from the previous year (+1.1 weeks or +3.8%).Footnote 45 In comparison, the average maximum entitlement of non-seasonal regular claims completed in 2024-25 was 29.5 weeks.
The average actual duration of seasonal regular claims completed in 2024-25 was 16.6 weeks, unchanged from the previous fiscal year (consult Annex 2.9.2). It was 18.0 weeks on average for non-seasonal regular claims completed in 2024-25, just above their average duration in 2023-24 (17.1 weeks). In addition, seasonal regular claims completed in 2024-25 used, on average, a lower share of their regular benefit entitlement than non-seasonal regular claims (58.7% versus 63.5%, respectively).
The average maximum entitlement and the average actual duration of regular claims are usually shorter for seasonal claimants than for non-seasonal claimants. This reflects the fact that seasonal claimants typically accumulate fewer hours of insurable employment prior to establishing a claim than non-seasonal claimants. In 2024-25, the average maximum entitlement of seasonal regular claims was similar to that of non-seasonal claims in the same period. This was likely due to the additional weeks of EI regular benefits provided to eligible seasonal claimants in targeted EI regions under a temporary support measure (consult the subsection 'Temporary support measure providing additional weeks of EI regular benefits to seasonal claimants in 13 EI regions' below).
As mentioned in subsection 2.2.5, claims may end when the number of weeks of regular benefits paid equals the regular benefit entitlement over the course of the benefit period (referred to as entitlement exhaustion) or when the benefit period ends before all regular benefit weeks of entitlement have been paid (referred to as benefit period exhaustion). When EI regular claims completed in 2024-25 are categorized by their seasonality status, claims established by seasonal claimants had a lower entitlement exhaustion rate than those established by non-seasonal claimants (23.8% and 38.5%, respectively), but this result was reversed when benefit period exhaustion is considered (34.6% and 14.7%, respectively). This means that seasonal claimants were less likely to collect all their entitled weeks of EI regular benefits than non-seasonal claimants. This is most likely due to the timing of their work seasons.Footnote 46 Compared to the previous fiscal year, the entitlement exhaustion rate of seasonal claimants decreased from 27.4% in 2023-24 to 23.8% in 2024-25, while it remained constant for non-seasonal claimants (38.0% in 2023-24 and 38.5% in 2024-25).
Overlapping definitions of seasonal and frequent claimants
Frequent EI claimants are defined as those who, within the past 5 years, have had 3 or more regular or fishing claims and have collected benefits for more than 60 weeks in total. Seasonal claimants are not considered frequent if they collected less than 60 weeks of regular or fishing benefits or both over the previous 5 years. Frequent claimants are not considered seasonal if they do not have at least 2 prior regular or fishing claims established at around the same time of year as their reference claim. However, there is a significant overlap between frequent claimants and seasonal claimants.
In 2024-25, the total number of EI regular claims established by seasonal or frequent or both claimants was 454,000. Among them, 228,800 claims were established by claimants who were both seasonal and frequent, representing 50.4% of the total regular claims established by seasonal or frequent or both claimants in 2024-25 (consult Chart 19). Seasonal claimants who were non-frequent accounted for 38.4% of the total 454,000 regular claims established by seasonal or frequent or both claimants, whereas frequent non-seasonal claimants accounted for 11.2%.

Text description
| Category | Frequent, non-seasonal | Frequent and seasonal | Non-frequent, seasonal | Total frequent or seasonal |
|---|---|---|---|---|
| Number of regular claims | 50,900 | 228,800 | 174,300 | 454,000 |
| Share of total frequent or seasonal claims | 11.2% | 50.4% | 38.4% | 100.0% |
- Note: Includes claims for which at least $1 of EI regular benefits was paid.
- Source: Employment and Social Development Canada, Employment Insurance (EI) administrative data. Results are based on 100% of data.
Table 30 compares the average duration, proportion of weeks of EI regular benefits used and entitlement exhaustion rate of EI regular claims established by the 3 groups and completed in 2024-25. In general, frequent claimants use more EI support than non-frequent claimants. Among frequent claimants, non-seasonal claimants typically receive, on average, EI regular benefits for longer duration, use a greater proportion of their regular entitlement weeks and are more likely to exhaust their entitlement than seasonal claimants. This is likely due to seasonal claimants returning to their seasonal employment.
| Claimant type | Average duration of regular claims (in weeks)P | Proportion of weeks of regular benefits used (%)P | Entitlement exhaustion rate (%)P |
|---|---|---|---|
| Frequent, non-seasonal | 20.6 | 76.8% | 47.9% |
| Frequent and seasonal | 21.1 | 74.3% | 35.0% |
| Non-frequent, seasonal | 10.7 | 38.2% | 9.1% |
- Note: Includes completed claims for which at least $1 of EI regular benefits was paid.
- P Preliminary data.
- Source: Employment and Social Development Canada, Employment Insurance (EI) administrative data. Results are based on 100% of data.
Temporary support measure providing additional weeks of Employment Insurance regular benefits to seasonal claimants in 13 EI regionsFootnote 47
In August 2018, to better support seasonal workers, the government introduced a pilot project (Pilot Project No. 21) in 13 EI regionsFootnote 48 of the country. This pilot project provided up to 5 additional weeks of EI regular benefits—to a maximum of 45 weeks—to eligible seasonal claimants who started a benefit period between August 5, 2018 and September 25, 2021. The parameters of the pilot project, including eligible EI regions, were then temporarily replicated through amendments to the Employment Insurance Act. Budget 2024 extended this temporary legislated support for seasonal claimants until October 24, 2026. In addition, in 2022 a legislative fix was introduced to ensure that the timing of the temporary COVID-19 measures would not affect access to this temporary seasonal measure.Footnote 49
Moreover, to further support seasonal claimants in response to the steep declines in unemployment rates, the government introduced Pilot Project No. 22 in the same 13 targeted EI regions. This pilot project provided up to 4 additional weeks, on top of the 5 additional weeks available under the existing temporary seasonal measure, to seasonal claimants who started a benefit period between September 10, 2023, and September 7, 2024, and who met the criteria of the existing seasonal measure. The maximum entitlement to 45 weeks of regular benefits remained in place.
In the 13 targeted EI regions, there were about 141,800 regular claims completed in 2024-25 that were eligible for additional weeks of regular benefits under the temporary seasonal measure. Among them, 126,600 claims were established by seasonal claimants, and 15,200 claims were not eligible according to the original rules of the seasonal measure but became eligible under the legislative fix. For simplicity, for the rest of this subsection, they are referred to as the eligible claims completed in 2024-25. Among the 141,800 eligible claims completed in 2024-25, about 68,400 (48.2%) used at least one additional week of regular benefits. This included 7,200 claims (47.1% out of the 15,200 claims) that became eligible under the legislative fix and used at least one additional week of regular benefits.
Among all eligible claims completed in 2024-25, the proportion that used at least one additional week of benefits under the temporary seasonal measure ranged from 62.6% in the EI region of Newfoundland-Labrador to 30.1% in Chicoutimi-Jonquière (consult Table 31). In addition, more than half of eligible claims established by claimants aged 55 years and over used at least one additional week. A higher proportion of eligible claims established by women used at least one additional week than those established by men (52.9% and 46.1%, respectively). A smaller proportion of eligible claims established by claimants who had worked in the Construction industry used at least one additional week compared to claimants who had worked in the Accommodation and food services industry or the Agriculture, forestry, fishing and hunting industry.
| Category | Number of eligible claimsP | Number of claims that used additional weeksP | Proportion of claims that used additional weeks (%)P |
|---|---|---|---|
| Newfoundland-Labrador (excluding St. John's) | 22,238 | 13,927 | 62.6% |
| Charlottetown | 1,293 | 659 | 51.0% |
| Prince Edward Island (excluding Charlottetown) | 6,541 | 3,588 | 54.9% |
| Eastern Nova Scotia | 8,498 | 4,889 | 57.5% |
| Western Nova Scotia | 10,183 | 5,144 | 50.5% |
| Madawaska-Charlotte | 4,157 | 1,965 | 47.3% |
| Restigouche-Albert | 20,235 | 11,567 | 57.2% |
| Gaspésie-Îles-de-la-Madeleine | 12,540 | 6,758 | 53.9% |
| Central Quebec | 29,668 | 9,548 | 32.2% |
| North Western Quebec | 6,064 | 2,481 | 40.9% |
| Lower Saint Lawrence and North Shore | 16,409 | 6,568 | 40.0% |
| Chicoutimi-Jonquière | 3,710 | 1,115 | 30.1% |
| Yukon (excluding Whitehorse) | 280 | 171 | 61.1% |
| Men | 97,036 | 44,712 | 46.1% |
| Women | 44,780 | 23,668 | 52.9% |
| 24 years old and under | 3,188 | 1,437 | 45.1% |
| 25 to 44 years old | 45,693 | 17,584 | 38.5% |
| 45 to 54 years old | 29,351 | 12,617 | 43.0% |
| 55 years old and over | 63,584 | 36,742 | 57.8% |
| Agriculture, forestry, fishing and hunting | 15,615 | 10,308 | 66.0% |
| Construction | 39,709 | 13,439 | 33.8% |
| Accommodation and food services | 8,251 | 5,805 | 70.4% |
| 13 EI regions | 141,816 | 68,380 | 48.2% |
- Note: Includes completed claims for which at least $1 of EI regular benefits was paid.
- * Regular claims in this table include claims that were not eligible for the temporary seasonal measure according to the original rules, but became eligible under the legislative fix introduced in 2022.
- P Preliminary data.
- Source: Employment and Social Development Canada, Employment Insurance (EI) administrative data. Results are based on 100% of data.
As illustrated in Chart 20, among the 141,800 eligible claims completed in 2024-25, 22,500 were entitled up to 5 additional weeks of EI regular benefits. The remaining 119,300 eligible claims were established when Pilot Project No. 22 was in effect and were entitled to 6 to 9 additional weeks of EI regular benefits (up to 4 additional on top of the 5 additional weeks).

Text description
| Category | Number of seasonal regular claimsP |
|---|---|
| Eligible claims | 141,800 |
| Eligible claims entitled up to 5 additional weeks | 22,500 |
| Eligible claims entitled up to 5 additional weeks that used at least one additional week | 8,200 |
| Eligible claims entitled to 6 to 9 additional weeks | 119,300 |
| Eligible claims entitled to 6 to 9 additional weeks that used up to 5 additional weeks | 17,100 |
| Eligible claims entitled to 6 to 9 additional weeks that used between 6 to 9 additional weeks | 43,200 |
- Note: Data may not add up to the total due to rounding. Includes completed claims for which at least $1 of EI regular benefits was paid.
- * Regular claims in this chart include claims that were not eligible for the temporary seasonal measure according to the original rules, but became eligible under the legislative fix introduced in 2022.
- P Preliminary data.
- Source: Employment and Social Development Canada, Employment Insurance (EI) administrative data. Results are based on 100% of data.
Among the 22,500 eligible claims entitled up to 5 additional weeks of regular benefits, 6,200 were established during Pilot Project No. 22.Footnote 50 Of the total, 36.2% (8,200 out of 22,500) used at least one additional week of regular benefits. Among these 8,200 claims, almost all were entitled to have the full 5 extra weeks, and 75.5% used the full additional 5 weeks of regular benefits. On average, eligible claims entitled up to 5 additional weeks that used at least one additional week of benefits under the temporary seasonal measure received 4.4 additional weeks of EI regular benefits. The number of additional weeks used was, on average, almost identical for men and women, across different age groups, and for claimants who had worked in services-producing industries compared to those who had worked in goods-producing industries.
Furthermore, among the 141,800 eligible claims completed in 2024-25, the remaining 119,300 were entitled to 6 to 9 additional weeks of EI regular benefits during Pilot Project No. 22 (up to 4 additional on top of the 5 additional weeks). Half of these eligible claims (50.5%) (60,200 out of 119,300) used at least one additional week of regular benefits. Among these 60,200 claims, almost all were entitled to have the full 9 extra weeks, and 52.0% used the full additional 9 weeks of regular benefits.
Among the 60,200 eligible claims entitled to 6 to 9 additional weeks of regular benefits under Pilot Project No. 22 that used at least one additional week of benefits, about 17,100 used up to 5 additional weeks of benefits and received on average 3.1 additional weeks of regular benefits. The remaining 43,200 claims used between 6 and 9 additional weeks of benefits and received on average a total of 8.5 additional weeks of regular benefits, including 3.5 additional weeks under Pilot Project No. 22. Among all these 60,200 claims, the number of additional weeks used was, on average, slightly higher for women than men, and for claimants aged 55 years and over than any other age groups (7.1 weeks and 6.8 weeks, respectively for both comparisons). Claimants who had worked in services-producing industries also used, on average, slightly higher additional weeks of benefits than those who had worked in goods-producing industries (7.1 weeks versus 6.8 weeks).
As of March 31, 2025, 662,100 claims established by seasonal claimants on or after August 5, 2018 were eligible for additional weeks of regular benefits under the temporary seasonal measure (including 58,400 claims that were not eligible according to the original rules of the seasonal measure but became eligible under the legislative fix). Among the total, 294,000 (44.4%) used at least one additional week of regular benefits (including 25,900 under the legislative fix). For claims that used one to 5 additional weeks, they received on average 4.2 additional weeks of regular benefits since the start of the temporary seasonal measure. As of March 31, 2025, $635.6 million in additional benefits had been paid to eligible seasonal claimants who used additional weeks of EI regular benefits under either Pilot Project No. 21, the temporary legislative measure for seasonal workers, or Pilot Project No. 22 (including $59.4 million paid under the legislative fix) since Pilot Project No. 21 was first introduced on August 5, 2018.
Entitlement exhaustion of Employment Insurance regular benefits: seasonal and non-seasonal gappers
Claimants who have exhausted their regular benefit entitlement may go through a period without income from either employment or EI benefits before they find work or return to work at the start of the next employment season. These claimants, known as "gappers", have not accumulated sufficient hours of insurable employment during their qualifying period for their entitlement to cover the entire duration of their unemployment spell.
To be considered a gapper, a claimant must have established a regular claim during the reporting fiscal year, have completed their previous regular claim during the reporting fiscal year or the previous fiscal year and must have experienced a period without employment income or EI income immediately following the exhaustion of the preceding claim. The period with no income must be 15 weeks or less. While this is more common for seasonal claimants due to their work and EI claiming patterns, it can affect non-seasonal claimants as well.
Of the 1.40 million EI regular claims established in 2024-25, approximately 80,900 (5.8%) experienced a gap in income based on the gapper definition (consult Table 32). This is slightly lower than the proportion registered in 2023-24 (6.2%), but equal to that in 2022-23 (5.8%). The average length of the gap was 5.3 weeks in 2024-25, unchanged from 2023-24.
| Category | Number of gappers 2023-24 | Number of gappers 2024-25 | Share (%) of gappers among regular claims 2023-24 | Share (%) of gappers among regular claims 2024-25 |
|---|---|---|---|---|
| Newfoundland and Labrador | 4,797 | 4,922 | 8.3% | 8.8% |
| Prince Edward Island | 1,718 | 1,579 | 11.5% | 10.6% |
| Nova Scotia | 4,823 | 4,500 | 9.0% | 8.6% |
| New Brunswick | 5,604 | 4,613 | 9.2% | 7.6% |
| Quebec | 24,760 | 21,670 | 6.3% | 5.5% |
| Ontario | 21,124 | 21,247 | 5.0% | 4.8% |
| Manitoba | 3,343 | 3,094 | 7.5% | 6.8% |
| Saskatchewan | 2,612 | 2,562 | 7.2% | 7.0% |
| Alberta | 8,235 | 8,368 | 5.9% | 5.8% |
| British Columbia | 7,470 | 8,044 | 5.2% | 5.5% |
| Territories | 375 | 262 | 9.2% | 7.2% |
| Seasonal | 38,576 | 37,353 | 9.9% | 9.3% |
| Non-seasonal | 46,285 | 43,508 | 4.7% | 4.4% |
| Canada | 84,861 | 80,861 | 6.2% | 5.8% |
- Note: Includes claims for which at least $1 of EI regular benefits was paid.
- Source: Employment and Social Development Canada, Employment Insurance (EI) administrative data. Results are based 100% of data.
The incidence of gappers by region shows that all provinces and territories, except Ontario, Quebec and British Columbia, registered a share of gappers above or at the national average in 2024-25 (consult Table 32). This is mostly attributable to the composition of the local labour markets.
In 2024-25, 9.3% of claims established by seasonal claimants experienced an income gap compared to 4.4% for claims established by non-seasonal claimants. Except for the period of the COVID-19 pandemic, these proportions have not changed much in the past decade. In 2025-16, they were 8.2% and 4.0% for claims established by seasonal claimants and non-seasonal claimants, respectively.
Receiving additional weeks of EI regular benefits through the temporary support measure for seasonal claimants (consult the subsection above) helps reduce the length of the period without any income. As a result, among regular claims established in 2024-25, the proportion of seasonal gappers in the 13 EI regions participating in the temporary support measure (7.8%) was lower than the proportion of seasonal gappers in EI regions outside the scope of the temporary support measure (10.0%).
2.2.7 Working while on claim
In addition to providing temporary income support to eligible unemployed contributors, the EI program is also designed to encourage claimants to accept available jobs, maintain their skills and remain connected to the labour market while they receive EI regular benefits. The Working While on Claim (WWC) provision of the Employment Insurance Act allows claimants to earn employment income while on claim. The WWC provision applies to all types of EI benefits.
The WWC provision determines how EI benefits are adjusted to reflect employment income earned while on claim. It allows claimants to keep their employment earnings while continuing to receive a portion of their EI benefits, up to a limit after which benefits are reduced dollar-for-dollar. If benefits are reduced to zero, the week of entitlement is deferred and can be used later during the benefit period.Footnote 51
Under the WWC provision, claimants can keep 50 cents of their EI benefits for every dollar earned while on claim, up to a maximum of 90% of the average weekly insurable earnings used to calculate their weekly benefit rate, before benefits are reduced dollar-for-dollar.Footnote 52
Working while on claim example
Sophia used to work full-time at a construction company where she earned $600 per week before getting laid off due to a reduction in workload. Following the job loss, she applies for EI regular benefits and her weekly benefit rate is calculated to be $330 (55% of $600). However, after a few weeks she finds part-time employment at a local plumbing company where she can work 3 days per week and earn $350 per week.
When Sophia starts working part-time, she needs to declare her earnings on her bi-weekly EI report. In this case, her weekly EI regular benefits are reduced by $175 or 50 cents for every dollar she earns at her part-time job (50% of $350). This brings her total weekly EI regular benefits to $155 ($330-$175=$155).
In the end, under the Working While on Claim provision, Sophia takes home $505* in total weekly income ($155 in weekly EI regular benefits and $350 from her part-time work), compared to $330 from EI regular benefits if she does not work while on claim.
* Her total weekly income is under 90% of the average weekly insurable earnings used to calculate her weekly benefit rate (90% of $600 would be $540).
This subsection focuses on claims where claimants reported employment income from part-time or full-time work for at least one week while on claim, regardless of whether the EI benefits for those weeks were paid in full, paid partially or reduced to zero. To make the text easier to read, these claims and their beneficiaries are referred to in this subsection as having at least one week worked while on claim even if the week or weeks of work were partial (for example, 2 days of work).
Number of Employment Insurance regular claims and claimants working while on claim
The use of the WWC provision is reported using 2 different but complementary approaches. The first approach is based on EI claimants who had an open regular claim during the reporting fiscal year, regardless of when their claim was established. This focuses on the WWC activities in the fiscal year under review and therefore better reflects the labour market conditions during the reporting period. The second approach is based on regular claims completed in the reporting fiscal year. This provides a better estimate of the relative incidence of WWC as it takes into consideration the entire duration of the claim and not only a specific period (such as the reporting fiscal year as done under the first approach).
Of all EI regular benefit claimants who had an open claim in 2024-25, around 659,700 or 36.2% of total worked at least one week while on claim during the fiscal year (consult Table 33). This share was lower than the levels recorded in 2023-24 (37.6%), and before the COVID-19 pandemic (43.0% on average in 2018-19 and 2019-20). The decrease in the share of claimants who worked at least one week while on claim was observed in almost all industries in 2024-25. This may be attributed to the decline in job vacancies across all industries in 2024-25 compared to the previous fiscal year, which can indicate a decrease in labour market tightness in Canada.Footnote 53 In comparison, based on the second approach, 42.4% of all completed EI regular claims (around 599,000) included at least one week worked while on claim in 2024-25 which is also lower than the previous fiscal year (44.9%) (consult Annex 2.24.4).
| Category | Number of claimants with an open claim during the fiscal year who have worked at least one week while on claim in 2024-25 | Share (%) of claimants with an open claim during the fiscal year who have worked at least one week while on claim in 2024-25 | NumberP of completed claims with at least one week worked while on claim | ShareP (%) of completed claims with at least one week worked while on claim |
|---|---|---|---|---|
| Newfoundland and Labrador | 33,473 | 48.3% | 31,175 | 53.5% |
| Prince Edward Island | 7,159 | 39.8% | 6,790 | 44.1% |
| Nova Scotia | 27,751 | 41.5% | 25,352 | 46.7% |
| New Brunswick | 34,985 | 46.5% | 31,864 | 51.2% |
| Quebec | 216,540 | 43.1% | 196,548 | 48.8% |
| Ontario | 175,499 | 29.7% | 156,787 | 35.5% |
| Manitoba | 19,537 | 32.9% | 18,406 | 39.4% |
| Saskatchewan | 15,345 | 32.0% | 14,194 | 38.2% |
| Alberta | 61,446 | 31.8% | 56,363 | 39.3% |
| British Columbia | 66,710 | 34.6% | 60,303 | 41.2% |
| Territories | 1,235 | 24.4% | 1,237 | 30.9% |
| Men | 382,373 | 34.4% | 348,940 | 40.5% |
| Women | 277,307 | 39.0% | 250,079 | 45.4% |
| 24 years old and under | 56,355 | 33.3% | 53,517 | 40.6% |
| 25 to 44 years old | 323,175 | 37.6% | 295,342 | 44.7% |
| 45 to 54 years old | 148,329 | 43.5% | 135,120 | 50.8% |
| 55 years old and over | 131,821 | 29.1% | 115,040 | 32.6% |
| Seasonal | n/a* | n/a* | 210,517 | 52.4% |
| Non-seasonal | n/a* | n/a* | 388,502 | 38.4% |
| Canada | 659,680 | 36.2% | 599,019 | 42.4% |
- Note: Includes claimants (or completed claims) for which at least $1 of EI regular benefits was paid.
- * Claimants are not categorized according to seasonality given that the seasonal status is determined at the claims level. Therefore, no results for claimants are reported.
- P Preliminary data.
- Consult Annex 2.24 for more details.
- Source: Employment and Social Development Canada, Employment Insurance (EI) administrative data. Results are based on 100% of data.
Based on the first approach examining EI regular benefit claimants with an open claim in 2024-25 who worked at least one week while on claim, more than half (57.8%) had deferred at least one week of EI benefits. Men, claimants who were from the Atlantic provinces and Quebec, and older claimants (aged 55 years and over) were more likely to defer weeks of their EI benefits.
The proportion of regular benefit claimants with an open claim who worked at least one week while on claim varies by, among other things, region and industry which may be partly explained by local labour market conditions in the regions where the claimants resided. Generally, regions that have a higher proportion of seasonal claimants have greater shares of EI regular benefit claimants who worked at least one week while on claim. This may be due in part to seasonal claimants that tend to return to work before their benefit period is exhausted. For example, in 2024-25, the Atlantic provinces (45.1%) and Quebec (43.1%) had relatively higher share of claimants who worked at least one week while on claim compared to the national average (consult Table 33). In terms of industry, the Educational services industry (54.4%), as well as the Construction industry (43.1%) also had a higher share of claimants who worked at least one week while on claim (consult Chart 21). Furthermore, women (39.0%) and claimants aged 45 to 54 years (43.5%) had the highest share of claimants who work at least one week while on claim. Similar outcomes are found for completed claims when the second approach is used.

Text description
| Industry | Share of Employment Insurance regular benefit claimants with an open claim working at least one week while on claim |
|---|---|
| Goods-producing industries | 39.8% |
| Agriculture, forestry, fishing and hunting | 35.1% |
| Mining, quarrying, and oil and gas extraction | 37.3% |
| Utilities | 36.4% |
| Construction | 43.1% |
| Manufacturing | 34.9% |
| Services-producing industries | 34.4% |
| Wholesale and retail trade | 24.8% |
| Transportation and warehousing | 35.7% |
| Finance, insurance, real estate, rental and leasing | 22.8% |
| Professional, scientific and technical services | 28.6% |
| Business, building and other support services* | 28.5% |
| Educational services | 54.4% |
| Health care and social assistance | 36.3% |
| Information, culture and recreation** | 28.6% |
| Accommodation and food services | 34.2% |
| Other services (excluding public administration) | 29.7% |
| Public administration | 32.8% |
| All industries | 36.2% |
- Note: Includes claimants for which at least $1 of EI regular benefits was paid.
- * This industry sector comprises the industries with codes 55 (Management of companies and enterprises) and 56 (Administrative and support, waste management and remediation services) from the North American Industry Classification System.
- ** This industry sector comprises the industries with codes 51 (Information and cultural industries) and 71 (Arts, entertainment and recreation) from the North American Industry Classification System.
- Source: Employment and Social Development Canada, Employment Insurance (EI) administrative data. Results are based on 100% of data.
Weeks worked while on claim
This subsection analyzes the proportion and the average number of weeks worked while on claim. It examines whether employment income was reported during a week in which a claimant was entitled to receive EI regular benefits.
The first reported measure is the proportion of weeks worked while on claim among weeks for which claimants were entitled to receive EI regular benefits in the reporting fiscal year (regardless of the establishment date of the claim). It reflects the relative frequency of WWC usage among regular benefit claimants and can be indicative of local labour market conditions during the reporting period. The proportion of weeks worked while on claim was 19.9% nationally in 2024-25, lower than the levels observed in the previous fiscal year (21.3%) and in fiscal years before the pandemic (23.8% on average in 2018-19 and 2019-20) (consult Table 34).
| Category | Proportion of weeks of entitlement worked* in 2023-24 | Proportion of weeks of entitlement worked* in 2024-25 | Change in proportion of weeks of entitlement worked* (% points) |
|---|---|---|---|
| Newfoundland and Labrador | 27.0% | 26.0% | -1.1 |
| Prince Edward Island | 22.7% | 21.6% | -1.1 |
| Nova Scotia | 24.4% | 23.2% | -1.2 |
| New Brunswick | 29.4% | 28.3% | -1.1 |
| Quebec | 31.1% | 29.7% | -1.4 |
| Ontario | 14.2% | 12.7% | -1.5 |
| Manitoba | 11.2% | 11.2% | +0.1 |
| Saskatchewan | 11.9% | 11.9% | +0.1 |
| Alberta | 12.8% | 12.5% | -0.3 |
| British Columbia | 15.2% | 15.0% | -0.2 |
| Territories | 6.7% | 7.5% | +0.8 |
| Men | 21.2% | 19.8% | -1.4 |
| Women | 21.3% | 20.1% | -1.3 |
| 24 years old and under | 17.9% | 17.4% | -0.5 |
| 25 to 44 years old | 21.8% | 20.6% | -1.2 |
| 45 to 54 years old | 27.4% | 25.6% | -1.9 |
| 55 years old and over | 17.3% | 15.8% | -1.5 |
| Seasonal | 29.7% | 29.1% | -0.6 |
| Non-seasonal | 17.6% | 15.9% | -1.6 |
| Canada | 21.3% | 19.9% | -1.4 |
- Note: Changes in percentage points are based on unrounded numbers. Includes all claims for which at least $1 in EI regular benefit was paid.
- * Data are based on weeks worked while on claim during the reporting fiscal year, regardless of the year in which their claim was established.
- Source: Employment and Social Development Canada, Employment Insurance (EI) administrative data. Results are based on 100% of data.
An analysis by demographic characteristics shows that the proportion of weeks worked while on claim generally varied in similar ways as the proportion of claimants who worked at least one week while on claim. Seasonal claimants, claimants aged 45 to 54 years, and those in the Atlantic provinces and Quebec had higher proportions of weeks worked while on claim as well as proportions of claimants who worked at least one week while on claim than the national average in 2024-25 (consult Table 33 and Table 34). This trend has been generally consistent with previous years.
The second measure is the average number of weeks worked while on claim for EI regular claims completed during the fiscal year with at least one week of work during the entire claim period. This measure of WWC frequency is based on the entire duration of the claim, rather than a specific reference period. In 2024-25, the average number of weeks worked while on claim was 10.0 weeks, down from 10.4 weeks recorded in the previous fiscal year (consult Table 35). This average has shown a downward trend over the past 3 years (consult Annex 2.24.2). The average number of weeks worked while on claim generally varied the same way across demographic characteristics than the proportion of weeks worked while on claim.
| Category | Average number of weeks worked in 2023-24R | Average number of weeks worked in 2024-25P | Change in average number of weeks worked (# of weeks) |
|---|---|---|---|
| Newfoundland and Labrador | 17.2 | 16.8 | -0.5 |
| Prince Edward Island | 13.5 | 13.0 | -0.6 |
| Nova Scotia | 13.5 | 13.1 | -0.4 |
| New Brunswick | 16.3 | 16.0 | -0.3 |
| Quebec | 12.7 | 12.5 | -0.2 |
| Ontario | 7.3 | 6.9 | -0.4 |
| Manitoba | 5.6 | 5.4 | -0.2 |
| Saskatchewan | 6.8 | 6.6 | -0.2 |
| Alberta | 6.7 | 6.5 | -0.2 |
| British Columbia | 7.1 | 6.9 | -0.2 |
| Territories | 4.7 | 5.3 | +0.5 |
| Men | 11.6 | 10.9 | -0.7 |
| Women | 8.8 | 8.7 | -0.1 |
| 24 years old and under | 8.0 | 7.5 | -0.5 |
| 25 to 44 years old | 9.5 | 9.2 | -0.3 |
| 45 to 54 years old | 11.5 | 11.1 | -0.4 |
| 55 years old and over | 12.3 | 11.9 | -0.4 |
| Seasonal | 12.6 | 12.5 | -0.1 |
| Non-seasonal | 9.2 | 8.6 | -0.6 |
| Canada | 10.4 | 10.0 | -0.4 |
- Note: Changes are based on unrounded numbers. Includes completed claims for which at least $1 in EI regular benefit was paid.
- p Preliminary data.
- R Revised data.
- Consult Annex 2.24.2 for more details.
- Source: Employment and Social Development Canada, Employment Insurance (EI) administrative data. Results are based on 100% of data.
Weekly income associated with working while on claim
As outlined in Table 36, there is a difference between the average weekly income of claimants who worked while on claim and those who did not. For EI regular claims completed in 2024-25, claimants who worked while on claim had lower average weekly EI regular benefit amount ($406) for the entire claim period compared to the average weekly EI regular benefit amount of those who did not work while on claim ($547). However, claimants who worked while on claim had significantly higher average weekly total income ($792) compared to that of those who did not work while on claim ($547). When only the weeks worked were considered, claimants who worked while on claim received an average of $957 per week in 2024-25.
| Income type | Claims without working while on claim | Claims with working while on claim (all weeks*) | Claims with working while on claim (weeks worked only**) |
|---|---|---|---|
| Average weekly EI regular benefits | $547 | $406 | Not available |
| Average weekly employment earnings | Not applicable | $386 | $957 |
| Average weekly total income (EI regular benefits and employment earnings) | $547 | $792 | Not available |
- Note: Includes completed claims for which at least $1 of EI regular benefits was paid.
- * Includes deferred weeks of EI benefits (that have $0 of EI benefits paid due to high employment earnings). Average incomes for this category are the sum of all regular benefits paid and/or employment earnings divided by the number of weeks the claim was active.
- ** The average weekly employment earnings for this category are total employment earnings divided by the number of weeks worked while on claim.
- Consult Annex 2.24.3 for more details.
- Source: Employment and Social Development Canada, Employment Insurance (EI) administrative data. Results are based on 100% of data.
2.3 Employment Insurance support while on training
In this section
- 2.3.1 Employment Insurance support for apprentices
- 2.3.2 Training with permission from Service Canada to keep receiving Employment Insurance benefits (Skills Boost)
To be entitled to EI regular benefits, claimants must show that they are unemployed, able and willing to work and actively looking for suitable employment. However, EI program flexibilities allow unemployed EI claimants to pursue training and acquire skills they need to succeed in the labour market in specific scenarios.
An EI regular benefits claimant may be referred to training by a designated authority, such as a province, territory, Indigenous organizationFootnote 54, or Service Canada, under Section 25 of the Employment Insurance Act. With a Section 25 referral from a designated authority, claimants continue to receive EI regular benefits while they engage in training activities. Otherwise, the training could be considered to restrict a claimant's ability to meet program requirements on entitlement to regular benefits (that is, searching and being available for work).
Referred claimants may have their training funded through provincial and territorial Labour Market Development Agreements (LMDAs), or the training may be self-funded. For cases where the Section 25 referral is issued by a provincial or territorial government or an Indigenous organization, it must be determined that the training is a reasonable part of the claimant's return-to-work plan. Consult Chapter 3 for more information on LMDAs.
Additionally, under Skills Boost, EI regular claimants who are long-tenured workers and wish to self-fund full-time training at an approved institutionFootnote 55 may directly request permission from Service Canada to continue receiving EI regular benefits while taking training.Footnote 56
Without a Section 25 referral in place from a designated authority, EI regular benefits claimants who decide on their own to take training can continue to receive EI support, provided they declare the training to Service Canada and prove they are ready, willing and capable of working each day they are on training and that they are actively looking for work during this period. These claimants must be ready to work if they receive a job offer and must be willing to adjust or cancel their training plan if necessary. Service Canada assesses these situations on a case-by-case basis, considering each claimant's individual circumstances.
Overall, in 2024-25, 119,800 claims established received at least $1 of EI regular benefits while on training, an increase of 4.9% compared to the 114,200 claims reported in 2023-24.
Subsection 2.3.1 examines EI support for apprentices, while subsection 2.3.2 addresses the training permissions provided to claimants by Service Canada under Skills Boost.
2.3.1 Employment Insurance support for apprentices
For many skilled trades, apprenticeship provides the skills and experience necessary for certification and full participation in the labour market. In Canada, apprenticeship is industry-driven learning that combines on-the-job and technical training. Each province or territory manages its own apprenticeship system. As a result, program duration and delivery methods vary across trades and jurisdictions.
In Quebec, apprentices typically complete all technical training at a college (CEGEP) or training institution before starting on-the-job training. In the rest of Canada, most apprentices start with on-the-job training, which is combined with technical training through various approaches. Most often, technical training occurs in class at an approved training provider, such as a public college, polytechnic, or a union training centre. This is commonly known as block release training. Less commonly, technical training may be delivered through self-learning, distance learning, night classes, or day release programs.
In most jurisdictions and trades, prospective apprentices must be at least 16 years old and have completed Grade 12 or an equivalent to enter an apprenticeship program. Generally, an apprenticeship begins when an employer hires a prospective apprentice and agrees, through an apprenticeship agreement, to sponsor and train them under a qualified mentor.
To help EI contributors continue their apprenticeship and become certified journeypersons or tradespeople, the EI program provides temporary income support to those who are unemployed and attending full-time block release technical training. To qualify, individuals must meet the eligibility requirements for EI regular benefitsFootnote 57, and must have been referred to training by their respective province, territory or Indigenous organization under Section 25 of the Employment Insurance Act. Furthermore, they must be referred for each block of full-time technical training required as part of their apprenticeship. Employers may also offer Supplemental Unemployment Benefit (SUB) plans to increase apprentices' weekly income during technical training, up to 95% of an apprentice's normal weekly earnings.Footnote 58
The EI program has several flexibilities which support apprentices' access to benefits. For example, they can apply for EI benefits up to 7 days before their last workday and only need to serve a single waiting period for their entire apprenticeship, even if it includes multiple blocks of full-time technical training over several years, as long as they remain in the same program. Apprentices can also request to be exempt from submitting bi-weekly reports to Service Canada while receiving EI and attending full-time technical training. If they choose to be exempt from submitting reports and work or earn income, they must subsequently contact Service Canada to report the work and earnings.
To ensure timely reception EI benefits, provinces, territories and Indigenous organizations must provide their referred apprentices with a special reference code for each block of full-time technical training, enabling faster processing and payment of the benefits.
Apprentices may also be eligible to receive financial support under Part Ⅱ of the Employment Insurance Act.Footnote 59 This support, provided by the provinces and territories (under Labour Market Development Agreements) and Indigenous organizations (under the Indigenous Skills and Employment Training Program), help cover accommodation, childcare, transportation and other costs incurred while attending technical training. Additional federal support is also available through several initiatives, such as the Canada Apprentice Loan and various tax deductions and credits.
Apprenticeships, Employment Insurance support and long-term outcomes
A recent departmental study* examined the relationship between apprentices' use of Employment Insurance for Apprentices (EI-A), other federal financial supports, and their long-term labour market outcomes. Using the Education and Labour Market Longitudinal Platform (ELMLP), the study profiled apprentices, including those who completed their apprenticeship, assessed uptake of federal supports, and analyzed how EI aligns with completion rates, post-program income, and post-training occupational alignment.
Apprenticeship completers were more likely to have accessed federal financial supports than the average apprentice. Between 2015 and 2021, completers were 20 to 30 percentage points (p.p.) more likely to have received EI and 5 to 7 p.p. more likely to have accessed all available federal supports (EI-A, Apprenticeship Grants and Canada Apprenticeship Loans) compared to the average apprentice.
In addition, completers experienced stronger labour market outcomes. They were 31 to 44 p.p. more likely to be working in their field of training in the years after program completion, with nearly 70% employed in-field during the first year versus 38% for discontinuers. Completers also earned, on average, 20% more in income 2 years after program completion when compared to all apprentices.
Overall, from a correlational point of view, individuals who received EI-A were associated with higher apprenticeship completion rates, higher post-program incomes, and a higher likelihood of being employed in their trained occupation.
* ESDC, Apprenticeship, Employment Insurance support and long-term outcomes (Ottawa: ESDC, Labour Market Information Directorate, 2026).
The following subsection presents detailed statistics on EI claims established by apprentices, their weekly benefit rate and the duration of their benefits. EI claims from apprentices are those referred under Section 25 of the Employment Insurance Act that received at least $1 of EI regular benefits during a period of full-time apprenticeship training.
Employment Insurance claims from apprentices and amount paid
In 2024-25, approximately 56,300 new EI claims were established by apprentices, representing an increase of 7.5% (+3,900 claims) compared to the previous fiscal year (consult Table 37).
This aligns with new registrations in apprenticeship programs in 2024, which increased by 5.9% compared to 2023 to reach 101,500, marking a historical high.Footnote 60 In terms of certifications, just under 47,000 apprentices were certified in 2024, representing a minor increase of 1.0% from 2023. However, this remains 9.6% below the 2019 level, indicating that certification numbers have not yet returned to pre-pandemic levels.
| Category* | New claims established 2023-24 | New claims established 2024-25 | Change (%) in new claims established | Amount paid ($ millions) 2023-24 | Amount paid ($ millions) 2024-25 | Change (%) in amount paid |
|---|---|---|---|---|---|---|
| Newfoundland and Labrador | 957R | 957 | +0.0% | $8.9R | $9.0 | +1.0% |
| Prince Edward Island | 367R | 376 | +2.5% | $2.4R | $2.2 | -8.2% |
| Nova Scotia | 1,525R | 1,883 | +23.5% | $9.4R | $12.0 | +27.3% |
| New Brunswick | 1,550R | 1,747 | +12.7% | $9.8R | $12.0 | +22.0% |
| Quebec** | 187R | 193 | +3.2% | $1.3R | $1.6 | +20.3% |
| Ontario | 18,232R | 18,576 | +1.9% | $122.9R | $135.7 | +10.4% |
| Manitoba | 2,650R | 3,172 | +19.7% | $16.9R | $21.2 | +25.3% |
| Saskatchewan | 2,744R | 2,950 | +7.5% | $16.1R | $17.7 | +10.4% |
| Alberta | 13,568R | 15,430 | +13.7% | $89.2R | $104.5 | +17.1% |
| British Columbia | 10,422R | 10,836 | +4.0% | $64.7R | $73.2 | +13.0% |
| Territories | 230R | 219 | -4.8% | $1.5R | $1.5 | -0.3% |
| Men | 49,372 | 52,771 | +6.9% | $321.1 | $363.4 | +13.2% |
| Women | 3,060 | 3,568 | +16.6% | $22.1 | $27.1 | +22.6% |
| 24 years old and under | 22,952 | 25,440 | +10.8% | $135.0 | $159.7 | +18.3% |
| 25 to 44 years old | 27,802 | 29,082 | +4.6% | $194.9 | $216.1 | +10.9% |
| 45 years old and over | 1,678 | 1,817 | +8.3% | $13.3 | $14.7 | +10.5% |
| Canada | 52,432 | 56,339 | +7.5% | $343.2 | $390.5 | +13.8% |
- Note: Data may not add up to the total due to rounding. Percentage change is based on unrounded numbers. Includes claims established by apprentices referred under Section 25 of the Employment Insurance Act for which at least $1 of EI regular benefits was paid while the claimant was on training.
- * Due to methodological changes, the number of claims established and the amount paid by region have been revised for 2023-24.
- ** The small number of claims established by apprentices in Quebec is due to the province's unique program design, where apprentices complete all their technical training before starting on-the-job training.
- R Revised data.
- Consult Annex 2.25 for more details.
- Source: Employment and Social Development Canada, Employment Insurance (EI) administrative data. Results are based on 100% of data.
Consistent with historical trends, the majority of EI claims from apprentices were established by claimants from Ontario, Alberta and British Columbia, with these 3 provinces accounting for 80.5% of the total number of claims in 2024-25. Men also continued to represent the vast majority of claims established by apprentices (93.7%) during this fiscal year. This is reflected in the annual number of apprenticeship registrations, where women typically account for a low share of total registrations (12.5% in 2024, and an average share of 12.1% over the last 10 years).Footnote 61 However, the number of women establishing claims by apprentices increased by 16.6% in 2024-25, rising from 3,100 to 3,600.
Among age groups, claimants aged between 25 and 44 years accounted for the largest share of EI claims established by apprentices (51.6%), followed by those aged between 15 and 24 years (45.2%). Claimants aged 45 years and over only accounted for 3.2% of EI claims established by apprentices in 2024-25, while they accounted for 44.1% of all EI regular claims established.
The total amount of EI benefits paid to apprentices was $390.5 million in 2024-25, representing an increase of 13.8% from the $343.2 million paid in 2023-24. Almost all regions had an increase in the amount paid in benefits to apprentices compared to 2023-24 with the exception of Prince Edward Island (-8.2%), despite an increase of 2.5% in the number of claims established by apprentices from this province, and the territories, where the amount paid to claimants was almost unchanged from the previous fiscal year.
From an industry perspective, claimants from the Construction sector established the majority of new apprentice claims (62.8%) in 2024-25, similar to previous years (consult Table 38). Among occupational groupings, the majority of EI claims established by apprentices were associated with the Technical trades and transportation officers and controllers groupingFootnote 62 (91.2%).
| Category | New claims established 2023-24 | New claims established 2024-25 | Change (%) in new claims established | Amount paid ($ millions) 2023-24 | Amount paid ($ millions) 2024-25 | Change (%) in amount paid |
|---|---|---|---|---|---|---|
| Construction | 33,047 | 35,356 | +7.0% | $227.6 | $258.4 | +13.5% |
| Manufacturing | 3,702 | 4,026 | +8.8% | $23.6 | $26.6 | +12.6% |
| Wholesale and retail trade | 5,989 | 6,194 | +3.4% | $31.8 | $34.4 | +8.1% |
| Other services (excluding public administration) | 3,733 | 4,054 | +8.6% | $19.9 | $23.0 | +16.0% |
| Other sectors | 5,961 | 6,709 | +12.5% | $40.3 | $48.1 | +19.4% |
| Technical trades and transportation officers and controllers | 47,902 | 51,398 | +7.3% | $310.2 | $353.4 | +13.9% |
| Other occupations | 4,530 | 4,941 | +9.1% | $33.0 | $37.1 | +12.4% |
| Canada | 52,432 | 56,339 | +7.5% | $343.2 | $390.5 | +13.8% |
- Note: Data may not add up to the total due to rounding. Percentage change is based on unrounded numbers. Includes claims established by apprentices referred under Section 25 of the Employment Insurance Act for which at least $1 of EI regular benefits was paid while the claimant was on training.
- Source: Employment and Social Development Canada, Employment Insurance (EI) administrative data. Results are based on 100% of data.
Outside of periods of full-time training, while still within the benefit period of a claim, an apprentice may lose employment income due to circumstances requiring access to other types of EI benefits, such as regular benefits for lack of available work, or special benefits for the care of a newborn child or other life events. Apprentices may access these benefits if they meet the eligibility requirements for the relevant EI benefits. In 2024-25, 31.4% of all claims established by apprentices (approximately 17,700 claims) included at least one week of regular benefits paid outside of periods of full-time training, an increase of 2.7 percentage points (p.p.) from the previous fiscal year. Additionally, 1.7% of claims (approximately 940 claims) included at least one week of special benefits paid outside of periods of full-time training, including about 530 claims for sickness benefits.
Of the total $390.5 million paid in benefits to apprentices in 2024-25, $298.0 million (76.3%) were paid while apprentices were attending full-time technical training. EI regular benefits paid outside training periods accounted for most of the remaining benefits ($81.1 million, or 20.8%), while a small portion was paid as special benefits ($11.4 million, or 2.9%).
Level and duration of Employment Insurance benefits for apprentices
The average weekly benefit rate for claims established by apprentices was $617 in 2024-25, an increase of 3.2% from $598 in 2023-24. This was also higher than the average weekly benefit rate for EI regular claims established during the same period ($583). By province and territory, the highest average weekly benefit rate was among apprentice claimants from the Territories ($646), followed by those from Newfoundland and Labrador ($625), Alberta ($624) and Ontario ($622).
By gender, men received a higher average weekly benefit rate ($619) than women ($591). Among age groups, claimants aged 25 to 44 years and those 45 years and over received the same average weekly benefit rate ($631), which was higher than average weekly benefit rate of $598 received by claimants aged 15 to 24 years (consult Annex 2.25.3).
The average duration of EI regular claims completed in 2024-25 by claimants while on full-time technical training was 8.9 weeks, similar to the previous fiscal year. Claims established in Manitoba and the territories had the highest average duration (9.4 weeks), while those in New Brunswick had the lowest (8.3 weeks). There were no significant differences in the average duration across genders and age groups in 2024-25 (consult Annex 2.25.2).
2.3.2 Training with permission from Service Canada to keep receiving Employment Insurance benefits (Skills Boost)
Under Skills Boost, claimants who are long-tenured workersFootnote 63 and wish to self-fund full-time training at an approved institution may request permission from Service Canada to continue receiving EI regular benefits during training. Without this permission, training could limit the claimant's ability to meet program requirements, such as being available for and actively seeking work. Service Canada does not provide training-related services typically offered by provinces and territories, such as employment counselling, job search assistance, needs assessments, or return-to-work planning. Claimants must identify the full-time training program they intend to pursue before requesting permission from Service Canada to continue receiving EI regular benefits while attending training.
Employment Insurance claims under Skills Boost and amount paid
In 2024-25, Service Canada referred approximately 690 claimants to continue receiving EI benefits while training under Skills Boost (consult Table 39). This represents a decrease of 11.4% from 780 referrals in 2023-24 but remains higher than in the previous fiscal years (consult Annex 2.26.1).
| Category1 | New claims established 2023-24 | New claims established 2024-25 | Change (%) in new claims established | Amount paid ($ millions) 2023-24 | Amount paid ($ millions) 2024-25 | Change (%) in amount paid |
|---|---|---|---|---|---|---|
| Atlantic provinces | 66R | 47 | -28.8% | $0.9R | $0.7 | -26.8% |
| Quebec | 208R | 207 | -0.5% | $2.8R | $2.9 | +2.4% |
| Ontario | 205R | 177 | -13.7% | $2.8R | $2.7 | -6.1% |
| Manitoba | 33R | 38 | +15.2% | $0.4R | $0.6 | 49.5% |
| Saskatchewan | 31R | 18 | -41.9% | $0.4R | $0.3 | -26.6% |
| Alberta | 118R | 104 | -11.9% | $1.6R | $1.7 | +5.0% |
| British Columbia and Territories2 | 120R | 101 | -11.9% | $1.6R | $1.5 | -5.4% |
| Men | 412 | 373 | -9.5% | $5.6 | $5.5 | -1.5% |
| Women | 369 | 319 | -13.6% | $5.0 | $4.8 | -4.0% |
| 34 years old and under | 291 | 247 | -15.1% | $3.6 | $3.4 | -3.2% |
| 35 to 44 years old | 261 | 238 | -8.8% | $3.7 | $3.5 | -7.8% |
| 45 to 54 years old | 183 | 162 | -11.5% | $2.6 | $2.6 | -0.1% |
| 55 years old and over | 46 | 45 | -2.2% | $0.6 | $0.7 | 21.1% |
| Goods-producing industries | 228 | 188 | -17.5% | $3.0 | $2.8 | -8.6% |
| Agriculture, forestry, fishing, hunting, mining, quarrying, and oil and gas extraction | 33 | 21 | -36.4% | $0.4 | $0.3 | -25.5% |
| Construction | 105 | 89 | -15.2% | $1.3 | $1.2 | -10.5% |
| Manufacturing and Utilities3 | 90 | 78 | -13.3% | $1.3 | $1.3 | -1.1% |
| Services-producing industries | 541 | 486 | -10.2% | $7.3 | $7.2 | -1.8% |
| Wholesale and retail trade | 85 | 89 | +4.7% | $1.2 | $1.3 | +7.9% |
| Transportation and warehousing | 33 | 30 | -9.1% | $0.4 | $0.5 | +14.4% |
| Finance, insurance, real estate, rental and leasing | 38 | 36 | -5.3% | $0.6 | $0.5 | -4.9% |
| Professional, scientific and technical services | 53 | 51 | -3.8% | $0.9 | $0.8 | -3.2% |
| Business, building, and other support services4 | 47 | 51 | +8.5% | $0.6 | $0.7 | +28.2% |
| Educational services | 68 | 57 | -16.2% | $0.7 | $0.7 | -1.4% |
| Healthcare and social assistance | 66 | 49 | -25.8% | $0.9 | $0.8 | -12.9% |
| Information, culture and recreation5 | 39 | 30 | -23.1% | $0.6 | $0.5 | -19.4% |
| Accommodation and food services | 30 | 26 | -13.3% | $0.4 | $0.3 | -21.4% |
| Other services (excluding public administration) | 29 | 25 | -13.8% | $0.4 | $0.4 | -5.5% |
| Public administration | 53 | 42 | -20.8% | $0.8 | $0.7 | -8.4% |
| Unclassified industries6 | 12 | 18 | +50.0% | $0.2 | $0.3 | +69.2% |
| Canada | 781 | 692 | -11.4% | $10.5 | $10.2 | -2.6% |
- Note: Data may not add up to the total due to rounding. Percentage change is based on unrounded numbers. Includes claims for which claimants received permission from Service Canada to train.
- 1 Due to methodological changes, the number of claims established and the amount paid by region have been revised for 2023-24.
- 2 For confidentiality reasons, data for the territories have been combined with those for British Columbia.
- 3 For confidentiality reasons, data for the Utilities industry have combined with those for the Manufacturing industry.
- 4 This industry sector comprises the industries with codes 55 (Management of companies and enterprises) and 56 (Administration and support, waste management and remediation services).
- 5 This industry sector comprises the industries with codes 51 (Information and cultural industries) and 71 (Arts, entertainment and recreation).
- 6 For some claims, this information was not available in the data.
- Consult Annex 2.26 for more details.
- Source: Employment and Social Development Canada, Employment Insurance (EI) administrative data. Results are based on 100% of data.
Similar to previous years, Quebec had the highest share of referrals under Skills Boost (29.9%), followed by Ontario (25.6%) and Alberta (15.0%). Men accounted for slightly more than half of referrals (53.9%), compared to 60.5% of all EI regular claims established in 2024-25. By age, claimants aged 44 years and under accounted for 70.1% of all referrals in 2024-25, compared to 55.9% of EI regular claims established during the same period.
By industry, claimants from the Construction sector and the Wholesale and retail trade sector both accounted for the largest share of referrals in 2024-25, with 12.9% each, followed by those from the Manufacturing (11.5%) sector.
Of all claims established under Skills Boost in 2024-25, 640 claims (92.5% of the total) included at least one week of EI regular benefits paid during training, and approximately 510 claims (73.0% of the total) included at least one week of EI regular benefits paid outside of training periods.
A total of $10.2 million in EI regular benefits was paid to claimants referred under Skills Boost in 2024-25, a decrease of 2.6% compared to 2023-24. Of this amount, $6.4 million (62.2% of the total amount paid) were paid while claimants were on training, and $3.5 million (34.5% of the total amount) were paid outside of training periods. Compared to the previous fiscal year, this represents a higher amount paid outside training and a lower amount paid during training.
Level and duration of Employment Insurance benefits for Skills Boost claims
Claimants who requested and received a referral to training from Service Canada had an average weekly benefit rate of $587 in 2024-25, an increase of 4.2% from 2023-24. This is nearly identical to the average weekly benefit rate for EI regular benefits ($583), but lower than the one entitled to long-tenured workers ($624) during the same period.
Claimants from British Columbia and the territories received the highest average weekly benefit rate in 2024-25 ($602), while those from the Atlantic provinces received the lowest ($540). By gender, men had a higher average weekly benefit rate than women ($605 and $567, respectively). Differences across age groups were minimal, with claimants aged 34 years and under at the lowest level ($580), and claimants aged between 45 and 54 years at the highest ($594) (consult Annex 2.26.3).
Skills Boost claims that were completed in 2024-25 received an average of 17.6 weeks of EI benefits during training and 13.0 weeks of EI regular benefits outside of training periods (consult Annex 2.26.2). Claimants from the Atlantic provinces averaged the most weeks during training (20.7 weeks), while those from Saskatchewan received on average the most weeks outside of training periods (16.2 weeks). Women averaged more weeks than men during training (18.9 and 16.6 weeks, respectively), while men averaged slightly more weeks than women outside of training periods (13.2 and 12.8 weeks, respectively). By age, claimants aged between 45 and 54 years averaged the highest number of weeks during training periods (18.7 weeks), while those aged 55 years and over had the most weeks outside of training periods (16.6 weeks).
2.4 Employment Insurance fishing benefits
In this section
- 2.4.1 Employment Insurance fishing claims and benefits paid
- 2.4.2 Seasonal component of Employment Insurance fishing benefits
- 2.4.3 Duration of Employment Insurance fishing benefits
Employment Insurance provides fishing benefits to qualifying, self-employed fishers who are actively seeking work. Unlike EI regular benefits, eligibility for EI fishing benefits is not based on hours of insurable employment. Rather, it is based on insurable earnings from self-employment in fishing during the qualifying period.Footnote 64 In addition to fishing benefits, self-employed fishers may also be eligible to receive sickness, maternity, parental, compassionate care and family caregiver benefits.
Under the Employment Insurance (Fishing) Regulations, a fisher is defined as a self-employed person engaged in fishing and includes a person engaged, other than under a contract of service or for their own or another person's sport, in any of the following:
- making a catch
- doing any work incidental to making or handling a catchFootnote 65, or
- the construction of a fishing vessel for the person's own use or for the use of a crew of which the person is a member in making a catch
Self-employed fishers are eligible for EI fishing benefits if they do not qualify for EI regular benefits and have earned a minimum amount of insurable earnings from self-employment in fishing during their qualifying period. This amount varies between $2,500 and $4,200, depending on the unemployment rate in the claimant's EI region. Additionally, a fisher's weekly benefit rate is usually calculated by dividing their total insurable earnings from fishingFootnote 66 during the qualifying period by the divisor associated with the unemployment rate in the EI region (consult Table 40). The result is then multiplied by the replacement rate of 55% to determine the weekly benefit rate, which cannot exceed the maximum weekly benefit rate established for each year ($668 in 2024 and $695 in 2025).
| Regional unemployment rate | Required insurable earnings | Earnings divisor |
|---|---|---|
| 6.0% or less | $4,200 | 22 |
| 6.1% to 7.0% | $4,000 | 21 |
| 7.1% to 8.0% | $3,800 | 20 |
| 8.1% to 9.0% | $3,600 | 19 |
| 9.1% to 10.0% | $3,400 | 18 |
| 10.1% to 11.0% | $3,200 | 17 |
| 11.1% to 12.0% | $2,900 | 16 |
| 12.1% to 13.0% | $2,700 | 15 |
| 13.1% or more | $2,500 | 14 |
Note: The earnings divisor is applied to the insurable earnings during the qualifying period to determine the equivalent weekly earnings that will be subject to the 55% replacement rate.
When not engaged in fishing-related activities, fishing claimants must demonstrate that they are capable of and available for work but unable to find suitable employment for each working day that they claim EI fishing benefits.
EI fishing benefits are available for 2 fishing seasons per year: the winter fishing season and the summer fishing season. Self-employed fishers who have established a claim for EI fishing benefits are entitled to a maximum of 26 weeks of EI fishing benefits per claim, which may be received consecutively or intermittently, but only within a fixed benefit period defined by set start and end dates. Similarly, a self-employed fisher's qualifying period cannot start before a defined date depending on the fishing season for which they are establishing a claim (consult Table 41). The qualifying period is a maximum of 31-week period immediately preceding the commencement of a fishing benefit period.
| Fishing season | Start of benefit period | End of benefit period | Start of qualifying period |
|---|---|---|---|
| Winter fishing season | Week of April 1 | Week of December 15 | Week of September 1 |
| Summer fishing season | Week of October 1 | Week of June 15 | Week of March 1 |
As the 2 qualifying periods and benefit periods overlap and cover a full year, situations may arise where a claimant has sufficient insurable earnings to qualify for either winter or summer fishing benefits. The decision as to which fishing benefit period is claimed (summer or winter) rests with the claimant and the decision is not reversible. Additionally, there is no increase in the length of the benefit period for any reason except for the payment of special benefits.
2.4.1 Employment Insurance fishing claims and benefits paid
A total of 28,300 new EI fishing claims were established in 2024-25. This total represents an increase of 3.2% from the 27,400 EI fishing claims established in 2023-24, but remains below the historical average (consult Chart 22). The total amount paid in EI fishing benefits increased by 5.8% from the previous fiscal year, going from $354.9 million in 2023-24 to $375.6 million in 2024-25; however, the amount paid in 2024-25 was similar to 2022-23.

Text description
| Fiscal year | New claims established (thousands) | Amount paid ($ millions) |
|---|---|---|
| 2015-16 | 28.3 | $272.3 |
| 2016-17 | 28.9 | $282.9 |
| 2017-18 | 30.1 | $300.2 |
| 2018-19 | 30.4 | $297.7 |
| 2019-20 | 30.4 | $303.1 |
| 2020-21 | 28.3 | $323.6 |
| 2021-22 | 30.0 | $354.8 |
| 2022-23 | 30.4 | $372.5 |
| 2023-24 | 27.4 | $354.9 |
| 2024-25 | 28.3 | $375.6 |
- Note: Includes claims for which at least $1 of EI fishing benefits was paid.
- Source: Employment and Social Development Canada, Employment Insurance (EI) administrative data. Results for claims are based on 100% of data. Results for the amount paid are based on a 10% sample of data for 2015-16 to 2022-23 and 100% of data for 2023-24 and 2024-25.
In 2024-25, 96.4% of claims for EI fishing benefits established and 96.6% of EI fishing benefits paid were concentrated in 6 provinces: Newfoundland and Labrador, Prince Edward Island, Nova Scotia, New Brunswick, Quebec and British Columbia (consult Table 42).
| Category | New claims established 2023-24 | New claims established 2024-25 | Change (%) in new claims established | Amount paid ($ millions) 2023-24 | Amount paid ($ millions) 2024-25 | Change (%) in amount paid |
|---|---|---|---|---|---|---|
| Newfoundland and Labrador | 11,953 | 13,005 | +8.8% | $159.1 | $173.9 | +9.3% |
| Prince Edward Island | 3,150 | 3,142 | -0.3% | $40.3 | $42.0 | +4.3% |
| Nova Scotia | 5,400 | 5,338 | -1.1% | $68.8 | $70.8 | +3.0% |
| New Brunswick | 2,830 | 2,852 | +0.8% | $36.6 | $38.7 | +5.7% |
| Quebec | 1,089 | 1,097 | +0.7% | $14.0 | $14.1 | +1.2% |
| British Columbia | 1,920 | 1,839 | -4.2% | $23.2 | $23.3 | +0.4% |
| Other provinces and territories | 1,095 | 1,032 | -5.8% | $13.0 | $12.7 | -2.4% |
| Men | 21,746 | 22,236 | +2.3% | $279.7 | $293.0 | +4.7% |
| Women | 5,691 | 6,069 | +6.6% | $75.2 | $82.6 | +9.8% |
| 24 years old and under | 1,410 | 1,490 | +5.7% | $16.2 | $17.6 | +8.5% |
| 25 to 44 years old | 7,376 | 7,498 | +1.7% | $94.2 | $98.5 | +4.6% |
| 45 to 54 years old | 6,338 | 6,375 | +0.6% | $82.5 | $85.3 | +3.3% |
| 55 years old and over | 12,313 | 12,942 | +5.1% | $162.0 | $174.2 | +7.5% |
| Canada | 27,437 | 28,305 | +3.2% | $354.9 | $375.6 | +5.8% |
- Note: Data may not add up to the total due to rounding. Percentage change is based on unrounded numbers. Includes claims for which at least $1 of EI fishing benefits was paid.
- Consult Annex 2.10 for more details.
- Source: Employment and Social Development Canada, Employment Insurance (EI) administrative data. Results are based on 100% of data.
As outlined in Table 42, the increase in the total number of EI fishing claims established in 2024-25 was almost entirely driven by an increase in the number of claims established by self-employed fishers from Newfoundland and Labrador (+8.8%). The number of EI fishing claims established in all other regions either decreased or increased by less than 1.0% in 2024-25 compared to the previous fiscal year. Additionally, Newfoundland and Labrador continued to represent the largest share of fishing claims established (45.9%) and benefits paid (46.3%) in 2024-25.
Men continued to represent the largest share of both claims established (78.6%) and amount paid in EI fishing benefits (78.0%). Over the last 10 years, the share of men has been slightly trending down among EI fishing claims established, as men represented 81.8% of these claims in 2015-16.
Among age groups, claimants aged 55 years and over represented the largest share of claims established (45.7%) and amount paid (46.4%) in 2024-25. The share of fishing claims established by claimants from this age group increased by 9.0 percentage points (p.p.) between 2015-16 and 2024-25, with an increase reported every fiscal year during this period. The share of fishing benefits paid to claimants from this age group followed a similar trend, increasing by 9.4 p.p. over the same period.
The average weekly benefit rate for EI fishing benefits increased by 4.9% in 2024-25 to $630, up from $601 in 2023-24 (consult Table 43). As in previous years, this rate was higher than the average weekly benefit rate for EI regular benefits during the same reporting period ($583). Additionally, the average weekly benefit rate was higher in the Atlantic provinces and Quebec than in British Columbia and the other provinces without a significant fishing industry. A similar pattern is observed among the share of claims at the maximum weekly benefit rate.
| Category | Average weekly benefit rate 2023-24 | Average weekly benefit rate 2024-25 | Share of claims at the maximum weekly benefit rate 2023-24 | Share of claims at the maximum weekly benefit rate 2024-25 |
|---|---|---|---|---|
| Newfoundland and Labrador | $602 | $638 | 62.8% | 75.2% |
| Prince Edward Island | $625 | $649 | 80.7% | 84.9% |
| Nova Scotia | $610 | $634 | 75.9% | 78.0% |
| New Brunswick | $621 | $642 | 79.0% | 81.7% |
| Quebec | $622 | $643 | 81.5% | 80.4% |
| British Columbia | $529 | $562 | 40.2% | 42.3% |
| Other provinces and territories | $513 | $520 | 42.4% | 40.0% |
| Men | $605 | $633 | 70.8% | 76.8% |
| Women | $582 | $618 | 54.8% | 65.0% |
| 24 years old and under | $576 | $609 | 57.4% | 66.4% |
| 25 to 44 years old | $601 | $628 | 69.2% | 74.1% |
| 45 to 54 years old | $611 | $640 | 71.8% | 79.2% |
| 55 years old and over | $597 | $628 | 65.3% | 72.8% |
| Canada | $601 | $630 | 67.4% | 74.2% |
- Note: Includes claims for which at least $1 of EI fishing benefits was paid.
- Consult Annex 2.10.3 for more details.
- Source: Employment and Social Development Canada, Employment Insurance (EI) administrative data. Results are based on 100% of data.
2.4.2 Seasonal component of Employment Insurance fishing benefits
EI fishing benefits are available to self-employed fishers for 2 fishing seasons each year, winter and summer, allowing eligible claimants to establish a single claim or multiple claims in a year.Footnote 67 In 2024-25, approximately 19,800 self-employed fishers established at least 1 EI fishing claim, a number comparable to the 19,700 fishers reported in 2023-24 (consult Table 44), despite the increase in the overall number of EI fishing claims established in 2024-25.
| Season of establishment | 2020-21 | 2021-22 | 2022-23 | 2023-24 | 2024-25 |
|---|---|---|---|---|---|
| 1 season | 11,663 | 11,408 | 11,431 | 12,021 | 11,300 |
| Winter | 2,624 | 3,030 | 3,472 | 3,309 | 3,387 |
| Summer | 9,039 | 8,378 | 7,959 | 8,712 | 7,913 |
| Both seasons | 8,307 | 9,252 | 9,506 | 7,706 | 8,501 |
| Canada | 19,970 | 20,660 | 20,937 | 19,727 | 19,801 |
Source: Employment and Social Development Canada, Employment Insurance (EI) administrative data. Results are based on 100% of data.
Of the approximately 19,800 fishers who established at least 1 EI fishing claim in 2024-25, 57.1% claimed for only one fishing season (roughly 3,400 for the winter season and 7,900 for the summer season), and 42.9% (approximately 8,500 fishers) established claims for both seasons. Overall, the number of fishers who established a claim in only one season decreased by 6.0% in 2024-25, driven by a decrease in the number of fishers who only established a claim for the summer season (-9.2%), while the number of those establishing claims in both seasons increased by 10.3%.
In line with previous years, a significantly higher share of fishers from the Atlantic provinces and Quebec established multiple fishing claims in 2024-25 compared to the other provinces and territories. This share represented 58.4% of fishers from Quebec and 48.7% of those from the Atlantic provinces, compared to 2.1% of those from British Columbia and a combined average of 9.4% for all other provinces and territories (consult Table 45). A relatively equal share of men and women established multiple claims in 2024-25, while among age groups, fishers aged 24 years and under were less likely to establish multiple claims (28.7%) than the other age groups, with fishers aged between 45 and 54 years showing the highest share (48.0%).
| Category | 2020-21 | 2021-22 | 2022-23 | 2023-24 | 2024-25 |
|---|---|---|---|---|---|
| Atlantic provinces | 48.5% | 51.1% | 51.6% | 44.4% | 48.7% |
| Quebec | 63.2% | 62.2% | 64.2% | 54.2% | 58.4% |
| British Columbia | 2.9% | 3.3% | 1.6% | 2.3% | 2.1% |
| Other provinces and territories | 3.8% | 10.9% | 10.9% | 10.7% | 9.4% |
| Men | 42.7% | 45.2% | 45.6% | 39.4% | 43.1% |
| Women | 37.3% | 43.1% | 44.8% | 37.9% | 42.5% |
| 24 years old and under | 25.5% | 28.8% | 29.8% | 26.4% | 28.7% |
| 25 to 44 years old | 35.9% | 37.6% | 39.5% | 35.2% | 38.2% |
| 45 to 54 years old | 48.8% | 50.1% | 51.7% | 45.0% | 48.0% |
| 55 years old and over | 43.1% | 48.5% | 48.0% | 40.1% | 45.2% |
| Canada | 41.6% | 44.8% | 45.4% | 39.1% | 42.9% |
Source: Employment and Social Development Canada, Employment Insurance (EI) administrative data. Results are based on 100% of data.
Fishers who established one EI fishing claim in 2024-25 were paid an average total of $14,057 on their claim, an increase of 6.6% from the amount reported in 2023-24. Those who established 2 fishing claims received, on average, $14,181 for their first claim and $11,755 for their second claim, adding up to a total average of $25,936 received in EI fishing benefits in 2024-25. This represents an increase of 7.6% from the amount reported in 2023-24, mostly driven by an increase of 11.9% in the average amount received on the first claim established.
2.4.3 Duration of Employment Insurance fishing benefits
The maximum entitlement of a claim established for EI fishing benefits is 26 weeks, regardless of the unemployment rate in the claimant's EI region at the time the claim is established.
In 2024-25, the average duration of EI fishing claims was 21.5 weeks, slightly up from 21.2 weeks in 2023-24 (+1.7%). Among the 6 provinces and territories with a significant fishing industry, British Columbia had the highest average duration for these benefits in 2024-25 with 23.2 weeks, while Quebec had the lowest (20.4 weeks). This is consistent with the fact that regions with higher shares of claimants who establish multiple fishing claims in a single year, such as the Atlantic provinces and Quebec, usually have a lower average claim duration than the other regions.
Table 46 shows the average duration of claims established for EI fishing benefits. In 2024-25, fishers who established a single fishing claim received benefits for an average of 23.4 weeks, a duration similar to the one observed in recent years. Fishers who established multiple claims received benefits for an average of 40.6 weeks in total, an increase of 1.5 weeks (+3.7%) from the duration in the previous fiscal year. This increase was driven by an average increase of 1.6 weeks for the duration of the first claim established, from 20.6 weeks in 2023-24 to 22.2 weeks in 2024-25, while the duration of the second claim established remained nearly unchanged (from 18.5 weeks in 2023-24 to 18.4 weeks in 2024-25).
| Number of claims established during the fiscal year | 2023-24 | 2024-25 | Change (%) in duration |
|---|---|---|---|
| 1 claim | 23.2 | 23.4 | +0.8% |
| 2 claims | 39.1 | 40.6 | +3.7% |
| First claim | 20.6 | 22.2 | +7.8% |
| Second claim | 18.5 | 18.4 | -0.8% |
| Canada | 21.2 | 21.5 | +1.7% |
- Note: Percentage change is based on unrounded numbers.
- Source: Employment and Social Development Canada, Employment Insurance (EI) administrative data. Results are based on 100% of data.
2.5 Employment Insurance Work-Sharing benefits
In this section
- 2.5.1 Employment Insurance Work-Sharing agreements
- 2.5.2 Employment Insurance Work-Sharing claims and amount paid
- 2.5.3 Level and duration of Employment Insurance Work-Sharing benefits
- 2.5.4 Employment Insurance Work-Sharing agreements termination status
The EI Work-Sharing program is designed to help avoid layoffs of all or a number of a firm's employees when there is a temporary decrease in the normal level of business activities whether due to an economic downturn, a disaster event, or another shock that is beyond the control of the employer.
Layoffs are avoided by offering EI Work-Sharing benefits to eligible workers who accept to work a temporarily reduced workweek while their employer recovers. The goal of the program is for all participating employees to return to normal working hours by the end of the Work-Sharing agreement. The employer and the employees must agree to participate in a Work-Sharing agreement.
By participating in the Work-Sharing program, employers can retain skilled employees, thus avoiding the costly process of recruiting and training new employees once business activities return to normal level. At the same time, participating workers can maintain their employment and skills by supplementing the reduced wages with EI Work-Sharing benefits for the days they are not working. Also, within the period covered by a Work-Sharing agreement, employers are required to maintain all existing employee benefits. The receipt of EI Work-Sharing benefits has no impact on future eligibility for EI regular or EI special benefits.
Work-Sharing agreements must include a reduction in work activity ranging between 10% and 60% of participating employees' regular weekly hours of work over the life of the agreement. In any given week, the work reduction can vary depending on available work for as long as the reduction of hours remains within the prescribed threshold.
To illustrate how the program works, consider a business with 100 workers. The business is thinking about temporarily laying-off 60 workers during a temporary and unexpected economic downturn, due to supply chain constraints. If the 60 EI-eligible workers were laid off, they would collect EI regular benefits for every day they were unemployed, up to their maximum entitlement.
Work-Sharing allows all 100 of the business' employees to share the costs of the downturn. Rather than laying off the 60 workers, the business could reduce the workweek by up to 60% (for example, work a 2-day week) for all 100 workers. This would allow all 100 workers to stay connected to the labour market and their employer, and thus retain their employee benefits, while avoiding skill erosion.
To be eligible for a Work-Sharing agreement, an employer must meet the following criteria:
- have been in operation in Canada year-round for at least 2 years
- be a publicly-held company, private business or a certain type of not-for-profit organization
- be experiencing a decrease in overall work activities of at least 10% in the last 6 months, where the reduction in business activity is caused by factors beyond the employer's control (reductions due to cyclical shortages of work and recurring slowdowns are ineligible)
- employ at least 2 eligible employees in the affected work unit, and
- undertake recovery measures that will return employees to normal levels of employment upon the completion of the Work-Sharing agreement
Employees participating in a Work-Sharing agreement must:
- agree to a reduced schedule of work
- share the available work equally over the term of the agreement, and
- be year-round, permanent, full-time or part-time employees who are required to carry out the everyday functions of the business
However, to be eligible to receive EI Work-Sharing benefits for the hours per week that they are not working, participating employees in a Work-Sharing agreement must:
- be eligible to receive EI regular benefits, that is have worked the required minimum number of hours of insurable employment (ranging from 420 to 700 hours, depending on the regional unemployment rate where the claimant lived at the time of the establishment of the claim) in the previous 52 weeks or since the start of their last EI claim, whichever is shorter
An initial Work-Sharing agreement can last between a minimum of 6 and a maximum of 26 consecutive weeks. If needed, an extension may be requested of up to 12 weeks, bringing the initial agreement to a maximum total of 38 weeks. There is a mandatory cooling-off period between successive agreements equal to the number of weeks of the first Work-Sharing agreement (up to a maximum period of 38 weeks).
During participation in a Work-Sharing agreement, employer-initiated training activities may take place. Training costs may be funded by the employer or through other available supports, such as provincial or territorial programming.
Training can take place during the non-working hours for which the participating employees are in receipt of EI Work-Sharing benefits. The salary costs of employees taking part in training activities during normally scheduled working hours cannot be compensated through the Work-Sharing agreement.
As workers participating in a Work-Sharing agreement continue to receive some income from employment with their Work-Sharing employer, the program provides partial coverage of hours of insurable employment or insurable earnings. As a result, the data reported on Work-Sharing claims are not directly comparable to other types of EI benefits. This is particularly true of the weekly benefit rates paid to claimants, which are meant to only cover 10% to 60% of a regular work week for affected employees in a work unit subject to a Work-Sharing agreement, depending on the agreed upon decrease in work levels. Because of this, the weekly Work-Sharing benefit rates are lower on average than for other types of EI benefits. Because the weekly Work-Sharing benefit rate is determined by employees' wage and the degree of reductions in the hours worked (between 10% and 60%), significant variability is also observed across industries in the reported weekly benefit rates.
The Canada Employment Insurance Commission (CEIC) may introduce temporary special measures to provide additional support for affected employers and employees during a period of economic downturn, natural disaster, or emergency. Typically, temporary special measures have involved easing eligibility requirements for employers, extending the maximum duration of Work-Sharing and removing the requirement to serve a mandatory cooling-off period between successive applications.
Work-Sharing temporary special measures in effect from April 1, 2024 to March 31, 2025
In response to the impact of the severe wildfires in 2024 that affected Jasper, Alberta and Bunibonibee Cree Nation, Manitoba and to support employers who may have experienced a decline in business activity attributable to these wildfires, a suite of Work-Sharing temporary special measures were implemented for the period of December 1, 2024 to August 3, 2025. Employers were eligible for these Work-Sharing temporary special measures if they were located in the affected areas or located outside the zone of the evacuation order but still directly impacted.*
Tariffs
To support businesses affected by the threat or potential realization of tariffs, the CEIC put in place Work-Sharing temporary special measures. Employers that experienced a decline in business activity attributable to the threat or potential realization of tariffs may be eligible to access Work-Sharing temporary special measures if they are operating in Canada for a minimum of 1 year and have a minimum of 2 EI eligible employees who agree to a reduction in hours and to share any available work.
Effective March 7, 2025 to March 6, 2026, these temporary special measures included:
- extending a Work-Sharing agreement's maximum duration could be extended from 38 weeks to 76 weeks
- expanding eligibility requirements for employers and employees, including those in seasonal and cyclical industries and non-profit and charitable organizations
- removing the requirement to serve a mandatory cooling-off period between successive agreements, and
- focusing recovery measures on supporting the business' ability to maintain its viability
* Although this temporary measure was implemented, no claims related to that temporary measure were established in these regions for 2024-25.
For the purpose of this section, EI Work-Sharing claims refers to any claims for which at least $1 of EI Work-Sharing benefits was paid.
2.5.1 Employment Insurance Work-Sharing agreements
The number of Work-Sharing agreements established in a given fiscal year increases during periods of economic shocks and uncertainty and decreases during periods of economic growth and stability. This countercyclical pattern can be observed by looking at the number of Work-Sharing agreements established in Canada over the past few years, notably the high demand for the Work-Sharing program in 2020-21 during the economic downturn due to the COVID-19 pandemic.
The participation in the Work-Sharing program reached 805 agreements in 2024-25, an increase of 17.9% compared to 2023-24 (consult Chart 23). Of these, 33.1% were linked to the temporary measure related to tariffs. Through these agreements, it was estimated that there were 30,626 participating employees and a minimum of 10,848 layoffs averted in 2024-25.Footnote 68 The estimated number of participating employees is always higher than the number of EI Work-Sharing claims established as some employees may chose not to be part of a Work-Sharing agreement or may not be eligible for Employment Insurance benefits.Footnote 69

Text description
| Fiscal year | Agreements |
|---|---|
| 2013-14 | 649 |
| 2014-15 | 411 |
| 2015-16 | 917 |
| 2016-17 | 862 |
| 2017-18 | 198 |
| 2018-19 | 158 |
| 2019-20 | 370 |
| 2020-21 | 4,224 |
| 2021-22 | 886 |
| 2022-23 | 503 |
| 2023-24 | 683 |
| 2024-25 | 805 |
Source: Employment and Social Development Canada, Common System of Grants and Contributions.
Across the country, Ontario and Quebec had the most agreements in 2024-25 (consult Table 47). The number of agreements increased in all provinces, except for the Atlantic provinces and British Columbia. In addition, for the fourth consecutive year, there were no Work-Sharing agreements in the territories. In 2024-25, almost 75% of Work-Sharing agreements were in goods-producing industries, compared to just over 25% of agreements in the services-producing industries. The Manufacturing industry (67.0%) continued to account for the largest share of agreements in 2024-25.
| Category | 2023-24 | 2024-25 |
|---|---|---|
| Atlantic provinces | 14 | 12 |
| Quebec | 318 | 340 |
| Ontario | 226 | 340 |
| Manitoba | 29 | 30 |
| Saskatchewan | 7 | 11 |
| Alberta | 18 | 23 |
| British Columbia | 71 | 49 |
| Territories | 0 | 0 |
| Goods-producing industries | 504 | 588 |
| Construction | 29 | 37 |
| Manufacturing | 468 | 539 |
| Rest of goods-producing industries | 7 | 12 |
| Services-producing industries | 169 | 217 |
| Wholesale and retail trade | 51 | 58 |
| Professional, scientific and technical services | 49 | 64 |
| Rest of services-producing industries | 69 | 95 |
| Unclassified industries | 10 | 0 |
| Canada | 683 | 805 |
Source: Employment and Social Development Canada, Common System of Grants and Contributions.
When assessed by firm size, small enterprises (with fewer than 50 employees) comprised 74.0% of all Work-Sharing agreements in the fiscal year examined, up from 72.6% reported in the previous fiscal year. Small-to-medium enterprises (50 to 99 employees) represented 12.8% of all Work-Sharing agreements in 2024-25. Combined, small and medium enterprises (SMEs) with fewer than 500 employees accounted for almost all Work-Sharing agreements in 2024-25 and in previous fiscal years. This high representation of small and medium-sized businesses in the Work-Sharing program has been a consistent feature of the program since 2008-09. Work-Sharing agreements have been primarily initiated to assist SMEs in recovering from economic shocks to their normal levels of business activity.
2.5.2 Employment Insurance Work-Sharing claims and amount paid
As with the number of Work-Sharing agreements, the total number of Work-Sharing claims established and the total amount paid in Work-Sharing benefits also follow a countercyclical pattern: they increase during labour market contraction and economic uncertainties, and decrease during periods of economic expansion.
There were over 21,500 claims for Work-Sharing benefits established in 2024-25, an increase of 22.8% compared to 2023-24 (consult Chart 24). This increase is attributable, in part, to the economic uncertainties towards the end of the fiscal year and the introduction of the temporary special measure related to tariffs in March 2025. The amount of Work-Sharing benefits paid increased by 34.8% over the same period, reaching $53.3 million in 2024-25.

Text description
| Fiscal year | New claims established | Amount paid ($ millions) |
|---|---|---|
| 2019-20 | 11,046 | $16.5 |
| 2020-21* | 82,991 | $183.5 |
| 2021-22* | 15,078 | $88.8 |
| 2022-23* | 9,959 | $30.6 |
| 2023-24 | 17,529 | $39.5 |
| 2024-25 | 21,530 | $53.3 |
- Note: Includes claims for which at least $1 of Employment Insurance (EI) Work-Sharing benefits was paid.
- * The eligibility criteria for EI regular benefits varied over the fiscal years depending on when claims were established. Therefore, comparison between fiscal years should be done with caution.
- Source: Employment and Social Development Canada, Employment Insurance (EI) administrative data. Results are based on 100% of data.
Employment Insurance Work-Sharing claims and amount paid, by region, gender, age and industry
As outlined in Table 48, compared to 2023-24, the most notable increase in the number of Work-Sharing claims in 2024-25 was in Quebec (+1,870 claims), followed by Manitoba (+1,586 claims). Conversely, the number of claims established decreased in British Columbia (-579 claims) and 3 of the Atlantic provinces: Newfoundland and Labrador, Prince Edward Island and Nova Scotia (-110 claims in total). Claimants from Quebec established the largest share of total new claims (48.2%), followed by claimants from Ontario (29.0%) in 2024-25. The same trend can be observed in terms of amount paid, claims established in Quebec received the largest share of total amount paid in 2024-25 with 50.8%, followed by claims established in Ontario (31.7%). There were no claims established in the territories over the last 4 reporting periods.
| Category | New claims established 2023-24 | New claims established 2024-25 | Amount paid ($ thousands) 2023-24 | Amount paid ($ thousands) 2024-25 |
|---|---|---|---|---|
| Newfoundland and Labrador | 60 C | 0 | $37.0 | $5.5 |
| Prince Edward Island | 60 C | 24 | $139.5 | $85.0 |
| Nova Scotia | 89 | 15 | $324.7 | $77.7 |
| New Brunswick | 64 | 102 | $35.8 | $477.5 |
| Quebec | 8,515 | 10,385 | $19,045.6 | $27,097.3 |
| Ontario | 5,756 | 6,248 | $13,583.1 | $16,877.0 |
| Manitoba | 1,352 | 2,938 | $1,933.6 | $3,605.5 |
| Saskatchewan | 107 | 524 | $234.8 | $1,057.0 |
| Alberta | 308 | 595 | $831.0 | $1,261.7 |
| British Columbia | 1,278 | 699 | $3,371.9 | $2,758.8 |
| Territories | 0 | 0 | $0.0 | $0.0 |
| Men | 11,397 | 15,668 | $26,105.4 | $37,679.4 |
| Women | 6,132 | 5,862 | $13,431.6 | $15,623.6 |
| 24 years old and under | 1,025 | 1,167 | $1,798.1 | $2,859.6 |
| 25 to 44 years old | 6,694 | 8,709 | $13,824.6 | $20,282.1 |
| 45 to 54 years old | 4,240 | 5,192 | $9,999.6 | $13,372.1 |
| 55 years old and over | 5,570 | 6,462 | $13,914.7 | $16,789.2 |
| Goods-producing industries | 15,871 | 19,472 | $34,650.5 | $47,581.4 |
| Manufacturing | 15,522 | 19,015 | $33,488.9 | $46,010.1 |
| Rest of goods-producing industries | 349 | 457 | $1,161.5 | $1,571.2 |
| Services-producing industries | 1,623 | 1,967 | $4,776.8 | $5,554.3 |
| Wholesale and retail trade | 768 | 641 | $1,917.2 | $1,903.3 |
| Professional, scientific and technical services | 338 | 416 | $1,303.4 | $1,289.2 |
| Rest of services-producing industries | 517 | 910 | $1,556.2 | $2,361.8 |
| Unclassified industries* | 35 | 91 | $109.7 | $167.3 |
| Canada | 17,529 | 21,530 | $39,537.0 | $53,303.0 |
- Note: Data may not add up to the total due to rounding. Includes claims for which at least $1 of Employment Insurance (EI) Work-Sharing benefits was paid.
- * For some claims, this information was not available in the data.
- C For confidentiality purposes, data for some provinces have been combined.
- Consult Annex 2.21 for more details.
- Source: Employment and Social Development Canada, Employment Insurance (EI) administrative data. Results are based on 100% of data.
Men continued to be more likely to make use of the Work-Sharing program—a pattern that has been persistent over the years. In 2024-25, men accounted for 72.8% of new Work-Sharing claims and 70.7% of total benefits paid, higher than 2023-24 (65.0% and 66.0%, respectively). The age distribution of claimants in 2024-25 remained relatively unchanged compared to the previous year, apart from a slight increase in the proportion of new claims established by individuals aged 25 to 44 years old (from 38.2% to 40.5%). Youth remained under-represented among newly established Work-Sharing claims (5.4%), relative to their share of national employment (12.9% in 2024-25).Footnote 70
From an industry perspective, the Work-Sharing program was most frequently used by workers in the Manufacturing industry, which is consistent with historical patterns. They accounted for the largest share of new EI Work-Sharing claims established in 2024-25 (88.3%), down slightly from 88.6% in the previous fiscal year. These workers received the largest share of the total EI Work-Sharing benefits paid (86.3%). The amount of benefits paid they received increased by 37.4% compared to 2023-24.
Among the services-producing industries, workers in the Wholesale and retail trade and in the Professional, scientific and technical services industries accounted for 3.0% and 1.9% of Work-Sharing claims, respectively, in 2024-25. In terms of amount paid, workers in the Wholesale and retail trade industry received 3.6% of total Work-Sharing benefits paid in 2024-25, followed by workers in the Professional, scientific and technical services industry, who accounted for 2.4% of total Work-Sharing benefits paid.
2.5.3 Level and duration of Employment Insurance Work-Sharing benefits
The national average weekly Work-Sharing benefit rate increased by 5.8% to $147 in 2024-25, up from $138 in the previous fiscal year (consult Table 49).Footnote 71 The average weekly benefit rate increased in all regions, but there was a high degree of variability that could be observed between regions, similar to the previous years. For example, in 2024-25, the highest average weekly benefit rate was in the Atlantic provinces ($262), followed by Saskatchewan ($166), while the lowest was in Manitoba ($135). The average weekly Work-Sharing benefit rate for men increased by 4.9% to $152, while the rate for women increased by 4.2% to $132 in 2024-25. The average weekly benefit rate increased for all age groups and was relatively similar across all age groups. The highest average rate was observed for workers aged 25 to 44 years ($148) while the lowest was for workers aged 24 and under ($143). Workers aged 24 and under had the highest increase in their average weekly benefit rate compared to 2023-24 (+9.1%).
| Category | 2022-23 | 2023-24 | 2024-25 | Change (%) 2023-24 to 2024-25 |
|---|---|---|---|---|
| Atlantic provinces | $152 | $126 | $262 | +107.5% |
| Quebec | $139 | $139 | $146 | +5.4% |
| Ontario | $137 | $142 | $147 | +3.6% |
| Manitoba | $77 | $116 | $135 | +15.6% |
| Saskatchewan | $142 | $152 | $166 | +9.4% |
| Alberta | $138 | $111 | $153 | +37.8% |
| British Columbia | $152 | $153 | $156 | +2.2% |
| Territories | n/a | n/a | n/a | n/a |
| Men | $134 | $145 | $152 | +4.9% |
| Women | $123 | $126 | $132 | +4.2% |
| 24 years old and under | $119 | $131 | $143 | +9.1% |
| 25 to 44 years old | $132 | $140 | $148 | +6.2% |
| 45 to 54 years old | $129 | $140 | $147 | +4.9% |
| 55 years old and over | $132 | $137 | $144 | +5.4% |
| Goods-producing industries | $127 | $137 | $145 | +6.3% |
| Services-producing industries | $153 | $155 | $157 | +1.3% |
| Canada | $130 | $138 | $147 | +5.8% |
- Note: Percentage change is based on unrounded numbers. Includes claims for which at least $1 of Employment Insurance (EI) Work-Sharing benefits was paid.
- Consult Annex 2.21 for more details.
- Source: Employment and Social Development Canada, Employment Insurance (EI) administrative data. Results are based on 100% of data.
As in previous fiscal years, the average weekly Work-Sharing benefit rate varied across industries in 2024-25. The average weekly benefit rate in services-producing industries increased by 1.3% to $157 in 2024-25, while it increased by 6.3% to $145 in goods-producing industries. Consult Annex 2.21.3 for detailed information on average Work-Sharing weekly benefit rate by industry.
The average duration of Work-Sharing claims completed in 2024-25 was 16.4 weeks (consult Chart 25), similar to 2023-24 (16.5 weeks).

Text description
| Fiscal year | Average Work-Sharing weeks |
|---|---|
| 2020-21 | 11.8 |
| 2021-22 | 23.5 |
| 2022-23 | 25.6 |
| 2023-24 | 16.5R |
| 2024-25 | 16.4P |
- Note: Includes completed claims for which at least $1 of Employment Insurance (EI) Work-Sharing benefits was paid.
- P Preliminary data.
- R Revised data.
- Consult Annex 2.21 for more details.
- Source: Employment and Social Development Canada, Employment Insurance (EI) administrative data. Results are based on 100% of data.
2.5.4 Employment Insurance Work-Sharing agreements termination status
The share of Work-Sharing agreements in which firms returned to their normal level of employment was 53.8% in 2024-25, a decrease compared to previous fiscal years (69.0% in 2022-23 and 76.0% in 2023-24).
A Work-Sharing agreement may also end before the anticipated end date—this is referred to as early termination. In this case, a firm returns to normal levels of business activity ahead of recovery plan timelines, or withdraws from the Work-Sharing agreement for other reasons (for example, the firm is shutting down or deciding to go ahead with layoffs). In 2024-25, 39.3% of agreements were terminated earlier than their scheduled end date compared to 42.2% in 2023-24.
Effectiveness of the Work-Sharing Program: Post-agreement Dynamics and the Role of Special Measures
A recent departmental study* analyzed the effectiveness of the Work-Sharing temporary special measures introduced during the COVID-19 pandemic in preventing layoffs. The study examined the layoff rates during a Work-Sharing claim as well as after the end of a Work-Sharing claim (within 6 months and 1 year) by comparing Work-Sharing agreements established in 2020 from those established between 2015 and 2023, excluding 2020. Layoff rates during a Work-Sharing claim were consistently lower than layoff rates after a Work-Sharing claim, except for 2020. In 2020, layoff rate during a Work-Sharing claim reached 7.7%, which was higher compared to other years (4.9% on average from 2015 to 2023, excluding 2020). Conversely, layoff rates within 6 months and 1 year following the end of a Work-Sharing claim were 5.2% and 6.9% in 2020, respectively, compared to 10.7% and 14.7% on average from 2015 to 2023, excluding 2020.
A regression discontinuity approach showed that for Work-Sharing agreements established just before the end of the Work-Sharing temporary special measures, the likelihood of a layoff within 1 year after the end of a Work-Sharing claim was slightly lower (by 2.9 percentage points on average) compared to Work-Sharing agreements established after the end of the temporary special measures. In addition, agreements that were established before the end of the temporary special measures were found to be longer and more likely to be extended. Claims associated with those agreements also had a higher duration and amount paid, on average, compared to claims established after the end of the temporary special measures.
The study also found that, overall, Work-Sharing temporary special measures were generally useful and associated with positive experiences from employers, including perceived benefits and overall satisfaction.
* ESDC, Effectiveness of the Work-Sharing Program: Post-agreement Dynamics and the Role of Special Measures (Ottawa: ESDC, Evaluation Directorate, 2026).
2.6 Employment Insurance special benefits
In this section
- 2.6.1 Employment Insurance special benefit claims overview
- 2.6.2 Employment Insurance maternity benefits
- 2.6.3 Employment Insurance parental benefits
- 2.6.4 Employment Insurance sickness benefits
- 2.6.5 Employment Insurance compassionate care benefits
- 2.6.6 Employment Insurance family caregiver benefits for adults
- 2.6.7 Employment Insurance family caregiver benefits for children
- 2.6.8 Employment Insurance special benefits for self employed persons
EI special benefits provide temporary income support to workers in insurable employment, self-employed persons who participate in the program, and self-employed fishers who are eligible and unable to work due to specific life circumstances. These circumstances include illness or injury; pregnancy or giving birth; providing care to a newborn or newly adopted child, and providing care or support to a critically ill or injured person or someone needing end-of-life care.
To qualify for EI special benefits, workers in insurable employment must have accumulated a minimum of 600 hours of insurable employment during their qualifying period. They must also meet the eligibility criteria specific to the special benefit being claimed, and have their normal weekly earnings reduced by more than 40%.
Self-employed persons may qualify for special benefits if they have opted into the EI program and have paid EI premiums at least one full year prior to claiming temporary income support. They must also have self-employment income that meets the minimum self-employment eligibility threshold in the calendar year preceding their claim, and meet other eligibility criteria specific to the special benefit being claimed (consult subsection 2.6.8).
Subsection 2.6.1 provides a summary overview of EI special benefits, including the number of new claims established, amounts paid and the level of benefits. The following subsections examine the EI special benefits by type. Subsection 2.6.2 discusses maternity benefits and subsection 2.6.3 parental benefits. Sickness benefits are introduced in subsection 2.6.4. Subsections 2.6.5, 2.6.6 and 2.6.7 examine compassionate care benefits, the family caregiver benefits for adults and the family caregiver benefits for children, respectively. Finally, subsection 2.6.8 looks at the use of special benefits by self-employed persons who have opted into the EI program. For the purpose of the following section, EI special benefit claims refer to EI claims for which at least $1 of special benefits was paid.
It is important to note that the maternity and parental benefits offered under the EI program are available across Canada with the exception of Quebec. For parents who reside in Quebec, the Quebec Parental Insurance Plan (QPIP) has provided eligible workers in insurable employment and self-employed persons with comparable benefits since January 1, 2006.
2.6.1. Employment Insurance special benefit claims overview
The number of new EI special benefit claims increased from 675,800 in 2023-24 to 691,600 in 2024-25 (consult Table 50). Claims established for parental benefits increased the most (+12,512), followed by claims for maternity benefits (+5,371) and claims for sickness benefits (+2,348). These were followed closely by family caregiver benefits for adults (+1,617), which had the highest growth rate in claims established at 11.4%.
| Benefit type | New claims established 2023-24 | New claims established 2024-25 | Change (%) in new claims established | Amount paid ($ millions) 2023-24 | Amount paid ($ millions) 2024-25 | Change (%) in amount paid |
|---|---|---|---|---|---|---|
| Maternity | 173,191 | 178,562 | +3.1% | $1,413.0 | $1,516.0 | +7.3% |
| Parental | 244,005 | 256,517 | +5.1% | $3,488.7 | $3,744.5 | +7.3% |
| Sickness | 429,798 | 432,146 | +0.5% | $2,725.3 | $2,969.7 | +9.0% |
| Compassionate care | 6,417 | 6,300 | -1.8% | $39.9 | $41.4 | +3.5% |
| Family caregiver for adults | 14,135 | 15,752 | +11.4% | $77.8 | $88.1 | +13.3% |
| Family caregiver for children | 4,422 | 4,690 | +6.1% | $33.6 | $35.5 | +5.6% |
| Canada | 675,757 | 691,580 | +2.3% | $7,778.3 | $8,395.1 | +7.9% |
- Note: Data may not add up to the total due to rounding. Percentage change is based on unrounded numbers. Includes claims for which at least $1 in EI special benefit was paid. New claims established by benefit type may not sum as claimants can receive multiple benefit types on a single claim.
- Consult Annex 2.11 for more details.
- Source: Employment and Social Development Canada, Employment Insurance (EI) administrative data. Results are based on 100% of data.
Similar to previous years, sickness benefits continued to represent almost two-thirds (62.5%) of special benefit claims established in 2024-25. During the same period, 37.1% and 25.8% of special benefit claims included parental and maternity benefits, respectively. Approximately 2.3% of all special benefit claims included family caregiver benefits for adults, 0.9% included compassionate care benefits, and 0.7% included family caregiver benefits for children.Footnote 72
The total amount paid out in special benefits increased from $7.8 billion in 2023-24 to $8.4 billion in 2024-25, largely driven by an increase in the number of new claims established and a higher average weekly benefit rate. Amounts paid increased for each type of special benefit, with the amount paid in family caregiver benefits for adults experiencing its largest increase in recent years (13.3% increase in 2024-25 compared to 2023-24).
In 2024-25, women established a larger share (60.5%) of special benefit claims compared to men (39.5%). This breakdown of claims by gender is consistent with previous fiscal years. Women also continued to receive a greater share of the amounts paid in special benefits than men during 2024-25 (77.3% for women versus 22.7% for men). This is mainly because only women can receive maternity benefits, a higher share of women than men receive parental benefits, and on average, women receive a higher number of weeks of parental benefits than men.
By age, claimants under 45 years continued to account for two-thirds (66.7%) of new special benefit claims and receive the largest share of the total amount paid in special benefits (79.4%) in 2024-25.
Excluding extended parental benefits, which are paid at a lower benefit rate than other types of special benefits (consult subsection 2.6.3), the average weekly benefit rate for special benefit claims established during 2024-25 was $571, representing a 4.0% increase compared to 2023-24. Annex 2.11.2 presents the detailed breakdown of the average weekly benefit rate.
For all types of special benefits combined, the proportion of claims established in 2024-25 receiving the maximum weekly benefit rate was 48.6%, compared to 47.1% in the previous fiscal year. By gender, 60.1% of special benefit claims established by men received the maximum weekly benefit rate in 2024-25, compared to only 41.0% of claims established by women.
Employment Insurance special benefits and firms
According to 2023 tax data, which is the most recent data available at the time this report was produced, there were approximately 223,500 firms (16.9% of all firms in 2023) which were associated with the establishment of an EI special benefit claim as the claimant's current or most recent employer (consult Table 51).
| Firm size* | Number of firms | Number of firms with at least one employee who received EI special benefits | Workforce distribution** (% share) | Distribution of claimants who received EI special benefits*** (% share) | Distribution of claimants who received EI sickness benefits*** (% share) |
|---|---|---|---|---|---|
| Small | 1,194,575 | 130,013 | 20.7% | 18.7% | 21.1% |
| Small-medium | 102,995 | 72,689 | 19.5% | 20.8% | 26.0% |
| Medium-large | 17,933 | 17,190 | 16.3% | 18.1% | 20.6% |
| Large | 3,610 | 3,596 | 43.5% | 42.4% | 32.3% |
| Canada | 1,319,113 | 223,488 | 100.0% | 100.0% | 100.0% |
- Note: Data may not add up due to rounding.
- * Small firms are defined as those that employ 1 to 19 employees. This category also includes firms for which the firm's size could not be determined based on the tax records. Small-to-medium firms employ 20 to 99 employees. Medium-to-large firms employ 100 to 499 employees. Large firms employ 500 employees or more.
- ** The number of workers in a firm is the number of individuals with employment income in that firm, as indicated on a T4 form. The number of workers is adjusted so that each individual in the labour force is only counted once and individuals who work for more than one firm are taken into account. For example, if an employee earned $25,000 in firm 1 and $25,000 in firm 2, that employee was recorded as 0.5 employees at the first firm and 0.5 employees at the second firm.
- *** These figures are based on the number of people receiving EI special benefits or EI sickness benefits in 2023.
- Sources: Employment and Social Development Canada, Employment Insurance (EI) administrative data. Results are based on 100% of EI administrative data. Canada Revenue Agency (CRA), CRA administrative data. Results are based on 100% of CRA data.
The distribution of the workforce and of EI special benefit claimants is roughly similar by firm size, unlike EI regular benefits, where larger firms are typically under-represented (consult Section 2.2). For special benefits, the largest difference between employee and claimant distributions was observed in small-sized firms. These firms accounted for 20.7% of the total workforce, while they represented 18.7% of the claimants for EI special benefits in 2023. While certain industry characteristics, such as a higher concentration of seasonal jobs, may help explain the greater reliance on EI regular benefits among small firms, the use of EI special benefits is more likely related to the demographic profile of the workforce, individual circumstances, and the nature of the work in the industry.
However, when the distribution of the workforce is compared solely to the one of EI sickness benefit claimants, larger firms are under-represented. They accounted for 43.5% of the total workforce, while they represented 32.3% of the claimants for EI sickness benefits in 2023. This difference can be largely explained by the fact that large-sized firms are generally more likely to offer short-term disability plans to their employees. As a result, employees who are unable to work because of illness or injury and are covered by their employers' plans may not have to collect EI benefits, as benefits from the registered plans have to be paid before EI benefits are paid.
2.6.2 Employment Insurance maternity benefits
EI maternity benefits are available to eligible persons who cannot work because they are pregnant or have recently given birth. EI maternity claimants need to provide Service Canada with a signed statement attesting to their pregnancy and their expected or actual date of delivery. Qualified claimants may receive up to 15 weeks of maternity benefits. Benefits can begin to be paid as early as 12 weeks prior to the expected date of birth and can end as late as 17 weeks after the child's actual birth date. Subsection 2.6.3 discusses coverage and accessibility of EI maternity benefits.
Employment Insurance maternity claims, amount paid and level of benefits
In 2024-25, nearly 178,600 new maternity claims were established, up 3.1% from just under 173,200 the previous fiscal year. The breakdown of claims by province showed that Ontario continued to account for half of all maternity claims (consult Table 52).
| Category | New claims established 2023-24 | New claims established 2024-25 | Change (%) in new claims established | Amount paid ($ millions) 2023-24 | Amount paid ($ millions) 2024-25 | Change (%) in amount paid |
|---|---|---|---|---|---|---|
| Newfoundland and Labrador | 2,175 | 2,232 | +2.6% | $17.6 | $18.6 | +6.0% |
| Prince Edward Island | 1,005 | 983 | -2.2% | $7.9 | $8.2 | +3.0% |
| Nova Scotia | 5,225 | 5,231 | +0.1% | $41.9 | $43.2 | +3.0% |
| New Brunswick | 4,112 | 4,267 | +3.8% | $31.4 | $35.1 | +11.7% |
| Quebec | n/a | n/a | n/a | n/a | n/a | n/a |
| Ontario | 88,966 | 90,963 | +2.2% | $737.8 | $785.6 | +6.5% |
| Manitoba | 8,134 | 8,450 | +3.9% | $62.6 | $66.8 | +6.7% |
| Saskatchewan | 7,261 | 7,165 | -1.3% | $57.9 | $59.2 | +2.3% |
| Alberta | 28,518 | 29,692 | +4.1% | $227.2 | $243.9 | +7.3% |
| British Columbia | 27,029 | 28,784 | +6.5% | $221.8 | $248.0 | +11.8% |
| Yukon | 290 | 333 | +14.8% | $2.6 | $3.1 | +21.3% |
| Northwest Territories | 279 | 293 | +5.0% | $2.6 | $2.7 | +5.9% |
| Nunavut | 197 | 169 | -14.2% | $1.7 | $1.6 | -5.4% |
| 24 years old and under | 10,444 | 9,880 | -5.4% | $67.7 | $66.8 | -1.4% |
| 25 to 39 years old | 154,696 | 160,324 | +3.6% | $1,277.8 | $1,375.1 | +7.6% |
| 40 years old and over | 8,051 | 8,358 | +3.8% | $67.5 | $74.1 | +9.8% |
| Canada | 173,191 | 178,562 | +3.1% | $1,413.0 | $1,516.0 | +7.3% |
- Note: Data may not add up to the total due to rounding. Percentage change is based on unrounded numbers. Includes claims for which at least $1 of EI maternity benefits was paid.
- Consult Annex 2.14 for more details.
- Source: Employment and Social Development Canada, Employment Insurance (EI) administrative data. Results are based on 100% of data.
In 2024-25, the majority of new maternity claims (89.8%) were established by women between 25 and 39 years old, remaining virtually unchanged from the previous fiscal year (89.3%). The distribution of claims across age groups remained similar to the one observed in past years. Notably, the number of new maternity claims established by women aged 24 and under has continued its downward trend since 2020-21, decreasing by 5.4% in 2024-25 compared to 2023-24.
The total amount paid in maternity benefits increased by 7.3% compared to 2023-24 and reached $1.5 billion in 2024-25 (consult Table 52). Consistent with the number of claims, Ontario accounted for 51.8% of the total amount paid. In New Brunswick, the amount paid in maternity benefits increased by 11.7% compared to the previous fiscal year, marking the province's highest growth since 2020-21. Claimants aged 25 to 39 years received 90.7% of maternity benefit payments over the reporting period.
In 2024-25, the average weekly maternity benefit rate was $583, representing a 3.5% increase from the previous fiscal year (consult Annex 2.14.3). Overall, the average weekly maternity benefit rate was higher for claims established in Yukon ($639) and by mothers aged 40 years and over ($607). Of all claims established over the period, 55.1% received the maximum weekly benefit rate, compared to 54.5% in the previous fiscal year.
Maternity benefits are frequently combined in the same claim with other benefit types, particularly parental (98.3%) and sickness (14.3%) benefits; 98.4% of all EI maternity claims completed during 2024-25 included another type of EI benefit (consult subsection 2.1.2).
Duration of Employment Insurance maternity benefits
As observed during previous fiscal years, mothers typically use almost all of the EI maternity weeks to which they are entitled. In 2024-25, 92.2% of mothers received maternity benefits during the entire 15 weeks available to them, compared to 92.8% in 2023-24. During the reporting period, the average duration of completed maternity claims was 14.6 weeks, similar to the previous fiscal year (14.7 weeks). The average duration by jurisdiction and age group also remained relatively unchanged compared to 2023-24 (consult Annex 2.14.2).
2.6.3 Employment Insurance parental benefits
EI parental benefits are available to eligible parents who take a leave from work to care for a newborn or recently adopted child or children. Claimants must provide a declaration as to the newborn's date of birth or, for the purpose of an adoption, the date of the child's placement and the name and address of the adoption authority. Parents must choose between standard parental benefits or extended parental benefits, and the option cannot be changed once a week of parental benefits has been paid to the parent.
Standard parental benefits provide up to 40 weeks of benefits paid over a maximum of 12 months (this includes the additional 5 weeks of benefits available to parents who share parental benefits). A parent cannot receive more than 35 weeks of standard benefits. The benefit rate is 55% of weekly insurable earnings up to a maximum of $668 in 2024 and $695 in 2025.
Extended parental benefits provide up to 69 weeks of benefits paid over a maximum of 18 months (this includes the additional 8 weeks of benefits available to parents who share parental benefits). A parent cannot receive more than 61 weeks of extended benefits. The benefit rate is 33% of weekly insurable earnings up to a maximum of $401 in 2024 and $417 in 2025.
Parents can share and use parental benefits at the same time or different times within 12 months (standard parental benefits) or 18 months (extended parental benefits) of birth or placement for the purpose of adoption. When parental benefits are shared, only one parent needs to serve the one-week waiting period. Parents must choose the same parental benefits option (standard or extended) when they apply for benefits. The choice of the first parent who completes the application is binding on other parents. Once parental benefits have been paid out to any parent, they cannot change their option but may change how they share the weeks of benefits.
Employment Insurance maternity and parental benefits: Coverage and accessibility
The Employment Insurance Coverage Survey (EICS) provides a meaningful picture of who does or does not have access to EI benefits, notably EI maternity and parental benefits. This survey complements EI administrative data that only cover EI claimants. According to the 2024 EICS,Footnote 73 78.6% of parents with a child aged 18 months or younger living outside Quebec had insurable employment in 2024. Among these new parents with insurable employment, 90.7% reported having received maternity or parental benefits, which is similar to the previous year (91.3% in 2023).
According to EICS data, the proportion of spouses or partners living outside Quebec who received or intended to claim EI parental benefits increased from 39.3% in 2023 to 42.1% in 2024. This proportion continues to increase as it was only 11.9% in 2017 and 19.5% in 2020. The additional weeks of EI benefits that have been available to new parents sharing parental benefits since March 2019 may have contributed to this increase.
In 2024, 90.4% of parents with a child aged 18 months or younger living in Quebec had insurable employment. As in previous years, 2024 EICS data continues to show that the share of these new parents who received maternity or parental benefits under QPIP (99.0%) is greater than that of parents having received EI maternity or parental benefits in the rest of Canada (90.7%). This share increased by 4.0 percentage points (p.p.) in 2024 compared to 2023, following a decrease of 4.3 p.p. between 2022 and 2023. The higher share in Quebec can be explained by several factors, most notably the lower eligibility requirement based on earnings under QPIP ($2,000). In addition, a larger share of spouses or partners in Quebec received parental benefits or intended to receive them (85.5%) compared to the rest of Canada (42.1%). This share also saw an increase of 5.3 p.p. in 2024 compared to 2023, following a significant decrease of 12.7 p.p. between 2022 and 2023. Historically, this proportion has remained higher for Quebec, however, the gap has narrowed in recent years.
Employers may choose to offer their employees a supplement to EI maternity and parental benefits (consult subsection 2.1.1 for more details). According to the 2024 EICS data, the share of parents with a child aged 18 months or younger living outside Quebec who received top-ups to their EI benefits from their employer (50.2%) remained unchanged compared to the previous year.
Employment Insurance parental claims, amount paid and level of benefits
In 2024-25, the total number of new parental claims established increased by 5.1% compared to 2023-24 and reached just over 256,500 (consult Table 53). Extended parental benefits accounted for 18.8% of all parental claims established in 2024-25, and the number of new extended parental claims grew by 10.4% compared to the previous fiscal year.
| Category | New claims established 2023-24 | New claims established 2024-25 | Change (%) in new claims established | Amount paid ($ millions) 2023-24 | Amount paid ($ millions) 2024-25 | Change (%) in new claims established |
|---|---|---|---|---|---|---|
| Standard | 200,350 | 208,318 | +4.0% | $2,840.5 | $3,058.3 | +7.7% |
| Extended | 43,655 | 48,199 | +10.4% | $648.2 | $686.1 | +5.9% |
| Newfoundland and Labrador | 2,748 | 2,867 | +4.3% | $43.7 | $44.5 | +1.8% |
| Prince Edward Island | 1,355 | 1,383 | +2.1% | $18.7 | $20.4 | +9.1% |
| Nova Scotia | 7,662 | 7,745 | +1.1% | $102.7 | $110.6 | +7.7% |
| New Brunswick | 5,797 | 6,134 | +5.8% | $79.7 | $86.5 | +8.5% |
| Quebec | n/a | n/a | n/a | n/a | n/a | n/a |
| Ontario | 126,387 | 132,148 | +4.6% | $1,806.9 | $1,941.7 | +7.5% |
| Manitoba | 11,669 | 12,100 | +3.7% | $157.9 | $168.1 | +6.5% |
| Saskatchewan | 9,786 | 10,017 | +2.4% | $143.6 | $148.9 | +3.7% |
| Alberta | 38,471 | 40,915 | +6.4% | $562.4 | $605.0 | +7.6% |
| British Columbia | 39,017 | 42,040 | +7.7% | $556.1 | $600.8 | +8.0% |
| Yukon | 432 | 502 | +16.2% | $6.6 | $7.3 | +10.1% |
| Northwest Territories | 400 | 414 | +3.5% | $5.8 | $6.3 | +8.1% |
| Nunavut | 281 | 252 | -10.3% | $4.5 | $4.4 | -1.9% |
| Men | 74,540 | 81,989 | +10.0% | $464.7 | $512.8 | +10.4% |
| Women | 169,465 | 174,528 | +3.0% | $3,024.0 | $3,231.6 | +6.9% |
| 24 years old and under | 11,781 | 11,215 | -4.8% | $159.4 | $158.0 | -0.8% |
| 25 to 39 years old | 212,967 | 225,175 | +5.7% | $3,096.9 | $3,336.1 | +7.7% |
| 40 years old and over | 19,257 | 20,127 | +4.5% | $232.4 | $250.3 | +7.7% |
| Canada | 244,005 | 256,517 | +5.1% | $3,488.7 | $3,744.5 | +7.3% |
- Note: Data may not add up to the total due to rounding. Percentage change is based on unrounded numbers. Includes claims for which at least $1 of EI parental benefits was paid.
- Consult Annex 2.15 for more details.
- Source: Employment and Social Development Canada, Employment Insurance (EI) administrative data. Results are based on 100% of data.
Of all parental claims, those established by adoptive parents continued to account for less than 1.0% (just under 1,300). In 2024-25, 18.4% of parental claims established by adoptive parents were for extended parental benefits, compared to 15.7% in the previous fiscal year. A lower share of parental claims were established by women among adoptive parents (52.3%) compared to all parental claims (68.0%) in 2024-25. However, a higher share of parental claims by adoptive parents were established by claimants 40 years old and over (41.4%) compared to all parental claims (7.8%) in 2024-25.
The breakdown of parental claims by province and territory remained relatively stable in 2024-25 compared to 2023-24. Over the entire reporting period, the majority of new parental claims were established by women (68.0%). However, the share of claims established by men continued to increase and reached 32.0% in 2024-25, compared to 30.5% in the previous fiscal year. This share has almost doubled since 2017-18. The additional weeks of benefits available to parents of a child born or adopted on or after March 17, 2019 who share parental benefits may have contributed to the continued increase in claims by men. Chart 26 illustrates the share of men among parental claimants over the past 10 years.

Text description
| Share of EI parental claims established by men, by parental benefit option* | Standard parental benefits | Extended parental benefits |
|---|---|---|
| 2015-16 | 13.6% | Not available |
| 2016-17 | 15.0% | Not available |
| 2017-18 | 16.0% | 5.3% |
| 2018-19 | 17.9% | 11.2% |
| 2019-20 | 22.8% | 19.6% |
| 2020-21 | 24.1% | 21.0% |
| 2021-22 | 29.4% | 23.2% |
| 2022-23 | 29.8% | 27.2% |
| 2023-24 | 31.0% | 28.3% |
| 2024-25 | 32.6% | 29.3% |
- Note: Includes claims for which at least $1 of EI parental benefits was paid.
- * There are no results for extended parental benefits before 2017-18 because these benefits started to be available on December 3, 2017.
- Source: Employment and Social Development Canada, Employment Insurance (EI) administrative data. Results are based on a 10% sample of data for 2015-16 to 2022-23 and 100% of data for 2023-24 and 2024-25.
In 2024-25, the majority of new parental claims (87.8%) were established by claimants aged 25 to 39 years. The breakdown of parental claims by age remained similar to the previous year.
The amount paid in parental benefits increased by 7.3% from the previous fiscal year and reached $3.7 billion in 2024-25 (consult Table 53). Extended parental benefits paid represented 18.3% of total parental benefits paid in 2024-25, compared to 18.6% in 2023-24, which was similar to the proportion (18.8%) of these claims among all parental claims.
All provinces and territories recorded increases in parental benefits paid compared to the previous fiscal year, except for Nunavut. The amount paid to men accounted for 13.7% of the total amount paid in parental benefits in 2024-25, while claims established by men accounted for 32.0% of new parental claims in the same period. This may be explained, in part, by the smaller number of weeks of parental benefits typically received by men compared to women. The breakdown of the amount paid in parental benefits by age group for 2024-25 was roughly the same as for new claims established during the period.
As stated above, the benefit rate (55% or 33% of average weekly earnings) and the maximum weekly benefit rate are calculated differently depending on whether the claimant is receiving standard or extended benefits.
In 2024-25, the average weekly standard parental benefit rate was $602, a 3.4% increase from the previous fiscal year (consult Annex 2.15.5). On average, the weekly benefit rate was higher for standard parental claims established in the Yukon and Nunavut, by men, and by claimants aged 40 years and over. Over the fiscal year, 62.8% of claimants received the maximum weekly standard parental benefit rate. By gender, 77.9% of claims established by men received the maximum weekly benefit rate in 2024-25, compared to 55.5% of claims established by women.
In 2024-25, the average weekly extended parental benefit rate was $367, a 4.0% increase from the previous fiscal year (consult Annex 2.15.9). Overall, the average weekly benefit rate was higher for extended parental claims established in the territories, by men, and by claimants aged 40 and over. Over the fiscal year, 64.8% of claimants received the maximum weekly extended parental benefit rate. By gender, 86.2% of claims established by men received the maximum weekly benefit rate in 2024-25, compared to 56.0% of claims established by women.
Duration and sharing of Employment Insurance parental benefits
Standard parental benefits
Among claims for standard parental benefits completed in 2024-25, 41.6% had shared weeks of benefits. The proportion of parents sharing parental benefits increased compared to the previous fiscal year where 39.6% of claims were shared.
When weeks of benefits were shared, women and men received, on average, 31.5 and 8.3 weeks of standard parental benefits in 2024-25, respectively, compared to 30.7 and 7.0 weeks in 2023-24 (consult Table 54). The combined number of weeks of standard parental benefits used by families was, on average, 38.0 weeks in 2024-25.
| Category | Duration of claims not shared 2023-24R | Duration of claims not shared 2024-25P | Duration of shared claims 2023-24R | Duration of shared claims 2024-25P |
|---|---|---|---|---|
| Standard parental - Men | 17.6 | 16.8 | 7.0 | 8.3 |
| Standard parental - Women | 32.9 | 32.9 | 30.7 | 31.5 |
| Standard parental - Family | n/a | n/a | 37.8 | 38.0 |
| Extended parental - Men | 34.0 | 32.0 | 11.0 | Not available* |
| Extended parental - Women | 57.9 | 57.8 | 53.7 | Not available* |
| Extended parental - Family | n/a | n/a | 64.8 | Not available* |
- Note: Includes completed claims for which at least $1 of EI parental benefits was paid.
- * Since extended parental benefits can be paid over a maximum of 18 months, the average duration of shared extended parental benefits is reported with a one-year lag to ensure that both parents have completed their claim.
- P Preliminary data.
- R Revised data.
- Consult Annex 2.15 for more details.
- Source: Employment and Social Development Canada, Employment Insurance (EI) administrative data. Results are based on 100% of data.
In 2024-25, of all families sharing standard parental benefits, 89.4% used at least one of the extra 5 weeks available to them, and 58.1% used all 40 weeks of parental benefits to which they were entitled. Of the claims completed by men in 2024-25, 40.9% received 5 weeks of benefits and 37.1% received more than 5 weeks. In almost all families, parents used some weeks of maternity or parental benefits at the same time. On average, in 2024-25, there were 5.5 weeks of overlap between parents for families receiving standard parental benefits.
For standard parental benefit claims completed in 2024-25 for which benefit weeks were not shared, the average duration was 32.9 weeks for women and 16.8 weeks for men, compared to 32.9 and 17.6 weeks, respectively, in 2023-24 (consult Table 54). Among non-shared claims for standard parental benefits, 70.0% used the maximum 35 weeks of benefits available to them.
Extended parental benefits
Since extended parental benefits can be paid over a maximum of 18 months, the sharing and duration of shared extended parental benefits are reported with a one-year lag to ensure that both parents have completed their claim. This methodology allows for more accurate results. Therefore, results on duration of shared extended parental benefits for 2024-25 will be presented in next year's report.
Among claims for extended parental benefits completed in 2023-24, 47.4% had shared weeks of benefits. When benefits were shared, women and men received, on average, 53.7 and 11.0 weeks of extended parental benefits, respectively. The combined number of weeks of extended parental benefits used by families was, on average, 64.8 weeks in 2023-24, and 40.1% of families used the maximum 69 weeks of benefits available to them.
For extended parental benefit claims completed in 2024-25 for which benefit weeks were not shared, the average duration was 57.8 weeks for women and 32.0 weeks for men, versus 57.9 and 34.0 weeks, respectively, in 2023-24 (consult Table 54). Among non-shared claims for extended parental benefits, 71.8% used all 61 weeks of benefits to which they were entitled.
2.6.4 Employment Insurance sickness benefits
Employment Insurance (EI) sickness benefits provide financial support to eligible individuals who are unable to work because of illness, injury or quarantine, but would otherwise be available to work. As of December 18, 2022, the maximum number of weeks available for sickness benefit claimants increased from 15 to 26 weeks. The maximum duration of benefits to which a sickness claimant is entitled per claim depends on the recommendations provided by their physician or another approved medical practitioner. Additionally, with job protection through the Canada Labour Code and the provincial and territorial statutes under labour law, EI sickness benefits enable claimants to focus on recovery while maintaining their attachment to the labour market.
Premium Reduction Program
Employers who offer short-term disability plans to their employees that meet requirements stipulated in the Employment Insurance Act and Employment Insurance Regulations can register their plans with Service Canada to obtain a lower EI premium rate than the regular employer rate through the Premium Reduction Program (PRP).
More information on the effect on premiums and the number of firms affected can be found in Section 2.7.
Employment Insurance sickness claims, amount paid and level of benefits
In 2024-25, just over 432,100 new sickness claims were established (consult Table 55). This represents an increase of 0.5% compared to the previous fiscal year, where almost 429,800 new sickness claims were established.
| Category | New claims established 2023-24 | New claims established 2024-25 | Change (%) in new claims established | Amount paid ($ millions) 2023-24 | Amount paid ($ millions) 2024-25 | Change (%) in amount paid |
|---|---|---|---|---|---|---|
| Newfoundland and Labrador | 12,710 | 13,002 | +2.3% | $82.0 | $90.8 | +10.8% |
| Prince Edward Island | 5,438 | 5,305 | -2.4% | $27.0 | $27.0 | 0.0% |
| Nova Scotia | 20,042 | 19,721 | -1.6% | $112.5 | $121.4 | +7.9% |
| New Brunswick | 26,205 | 24,929 | -4.9% | $140.0 | $143.7 | +2.7% |
| Quebec | 133,653 | 134,495 | +0.6% | $790.7 | $865.8 | +9.5% |
| Ontario | 118,531 | 120,027 | +1.3% | $808.1 | $878.0 | +8.7% |
| Manitoba | 12,478 | 12,851 | +3.0% | $78.5 | $87.3 | +11.2% |
| Saskatchewan | 8,326 | 8,241 | -1.0% | $53.7 | $58.5 | +9.0% |
| Alberta | 37,376 | 38,197 | +2.2% | $250.6 | $280.0 | +11.7% |
| British Columbia | 54,136 | 54,526 | +0.7% | $374.7 | $409.1 | +9.2% |
| Yukon | 416 | 392 | -5.8% | $3.3 | $3.6 | +8.2% |
| Northwest Territories | 311 | 290 | -6.8% | $2.7 | $2.9 | +6.0% |
| Nunavut | 176 | 170 | -3.4% | $1.5 | $1.5 | +4.9% |
| Male | 185,017 | 184,335 | -0.4% | $1,240.8 | $1,334.1 | +7.5% |
| Female | 244,781 | 247,811 | +1.2% | $1,484.4 | $1,635.6 | +10.2% |
| 24 years old and under | 29,972 | 28,273 | -5.7% | $141.4 | $144.6 | +2.2% |
| 25 to 34 years old | 95,804 | 96,975 | +1.2% | $543.2 | $594.9 | +9.5% |
| 35 to 44 years old | 89,729 | 91,397 | +1.9% | $579.3 | $634.2 | +9.5% |
| 45 to 54 years old | 85,993 | 85,747 | -0.3% | $589.2 | $636.1 | +8.0% |
| 55 to 64 years old | 97,376 | 96,319 | -1.1% | $667.4 | $721.0 | +8.0% |
| 65 years old and over | 30,924 | 33,435 | +8.1% | $204.7 | $238.9 | +16.7% |
| Canada | 429,798 | 432,146 | +0.5% | $2,725.3 | $2,969.7 | +9.0% |
- Notes: Data may not add up to the total due to rounding. Percentage change is based on unrounded numbers. Includes claims for which at least $1 of EI sickness benefits was paid.
- Consult Annex 2.16 for more details.
- Source: Employment and Social Development Canada, Employment Insurance (EI) administrative data. Results are based on 100% of data.
The breakdown of sickness claims by province and territory remained fairly consistent with previous fiscal years. The largest increases in the number of sickness claims in 2024-25 compared to 2023-24 were recorded in Manitoba, Newfoundland and Labrador and Alberta. Conversely, the territories and New Brunswick had the largest decreases.
Consistent with previous fiscal years, a larger share of new EI sickness claims were established by women (57.3%) than men (42.7%). Men recorded a decrease of 0.4% in their number of sickness claims, while women had an increase of 1.2% compared to 2023-24.
Claimants aged 25 to 34 years old established the largest share of new sickness claims during the fiscal year (22.4%), followed closely by claimants aged 55 to 64 years old (22.3%). Claimants aged 65 years old and over experienced the largest increase in the number of sickness claims (+8.1%) in comparison to the previous period. Relative to their representation in the labour force, claimants aged 24 years and under, as well as those aged 25 to 34 years were the most under-represented in terms of sickness claims and amounts paid, while claimants aged 55 to 64 years were the most over-represented during the fiscal year (consult Chart 27).Footnote 74
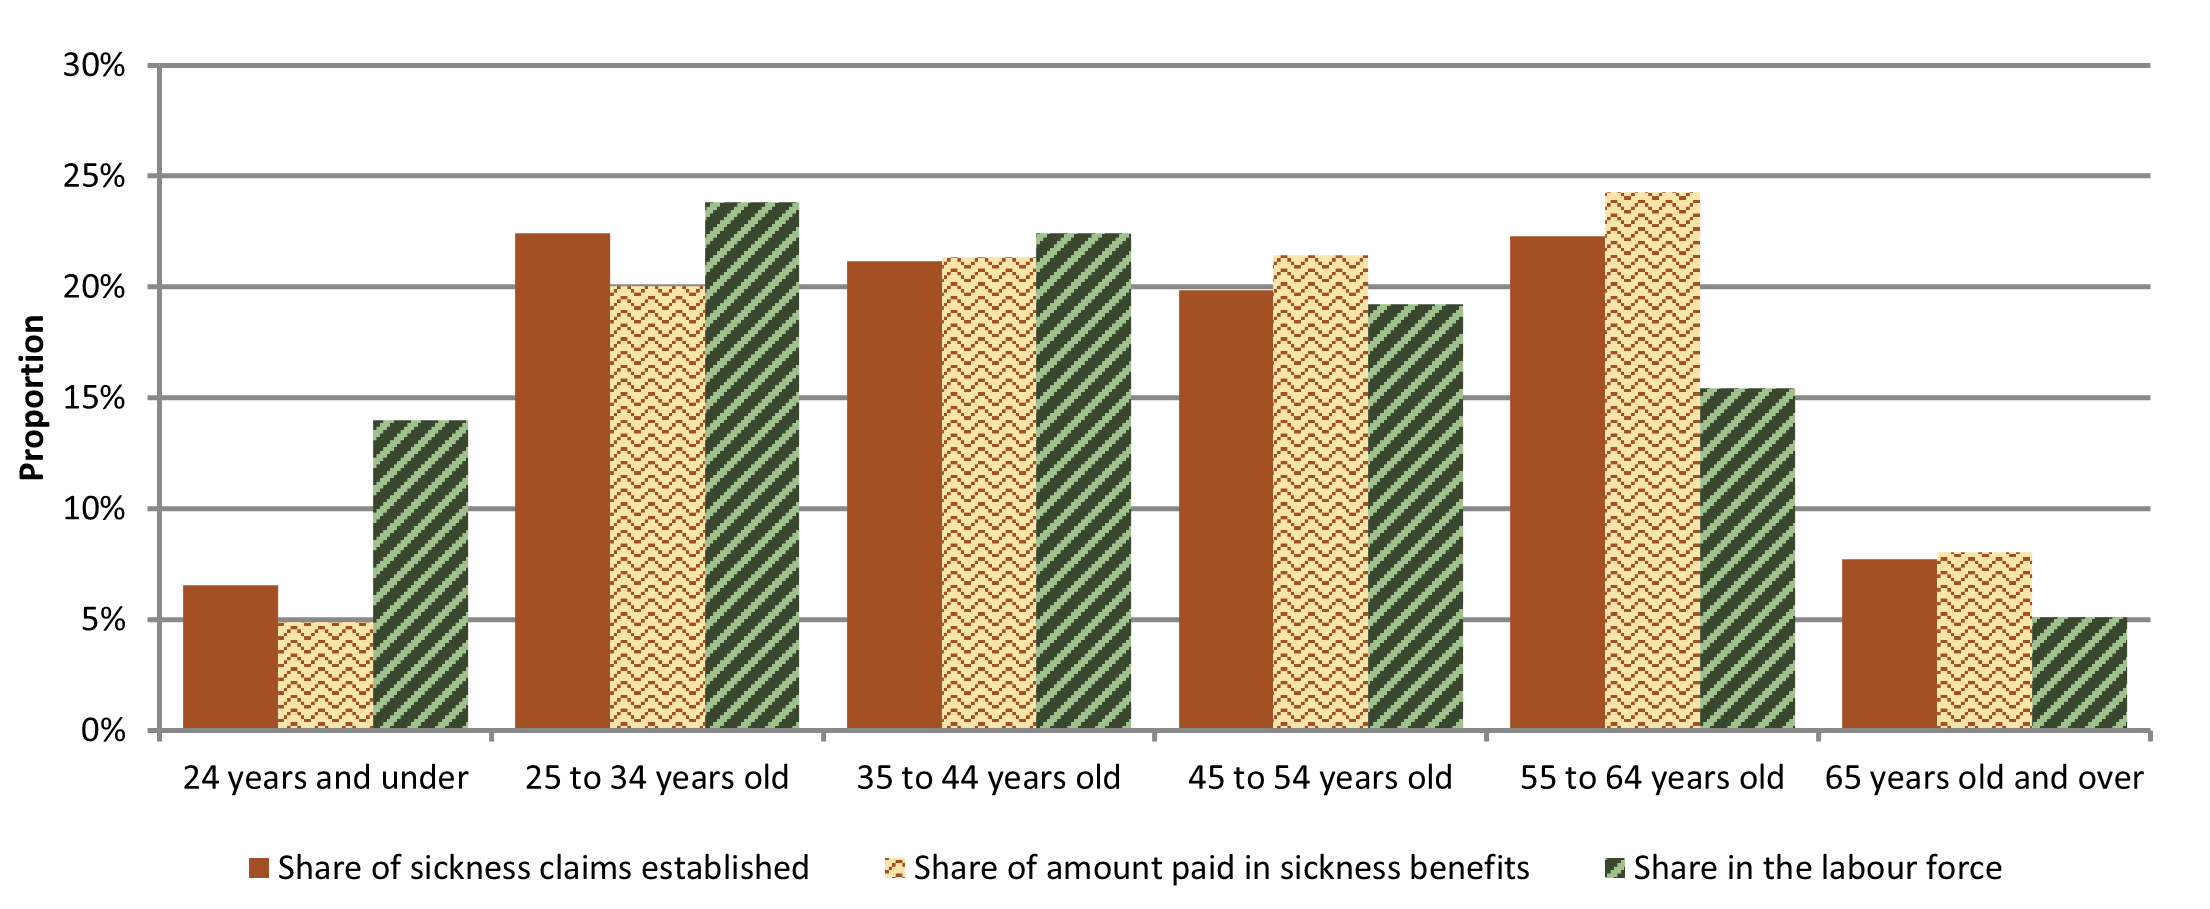
Text description
| Age category | Share of sickness claims established | Share of amount paid in sickness benefits | Share in the labour force |
|---|---|---|---|
| 24 years and under | 7% | 5% | 14% |
| 25 to 34 years old | 22% | 20% | 24% |
| 35 to 44 years old | 21% | 21% | 22% |
| 45 to 54 years old | 20% | 21% | 19% |
| 55 to 64 years old | 22% | 24% | 15% |
| 65 years old and over | 8% | 8% | 5% |
- Note: Includes claims for which at least $1 of EI sickness benefits was paid.
- Sources: Employment and Social Development Canada, Employment Insurance (EI) administrative data. Results are based on 100% of EI administrative data. Statistics Canada, Labour Force Survey, Table 14-10-0017-01.
The total amount paid in sickness benefits was $3.0 billion in 2024-25, an increase of 9.0% compared to 2023-24 (consult Table 55). This increase is attributable, in part, to the higher average duration of sickness claims in 2024-25 compared to 2023-24. The breakdown of total sickness benefits paid by province and territory remained fairly consistent with previous fiscal years.
As with new claims, women received a slightly larger share of the total amount paid in sickness benefits than men, at 55.1% and 44.9%, respectively. Consistent with previous fiscal years, claimants aged 45 and over received a larger share of the total amount of payments for sickness benefits than their share in the labour force, while claimants under the age of 45 received a smaller share (consult Chart 27).
By industry, the goods-producing industries continued to be overrepresented among EI sickness claims and total benefits paid. This sector accounted for 24.8% of new EI sickness claims and 25.4% of the total amount paid in 2024-25, despite representing only 20.2% of the workforce (consult Table 56).
| Industry | New claims established (thousands) (% share) | Amount paid ($ millions) (% share) | Employment (thousands) (% share) |
|---|---|---|---|
| Goods-producing industries | 107.1 (24.8%) |
$755.5 (25.4%) |
4,210.5 (20.2%) |
| Agriculture, forestry, fishing and hunting | 11.0 (2.5%) |
$58.1 (2.0%) |
289.5 (1.4%) |
| Mining, quarrying, and oil and gas extraction | 3.7 (0.8%) |
$30.5 (1.0%) |
295.1 (1.4%) |
| Utilities | 0.6 (0.1%) |
$5.0 (0.2%) |
151.5 (0.7%) |
| Construction | 42.5 (9.8%) |
$319.7 (10.8%) |
1,618.3 (7.8%) |
| Manufacturing | 49.3 (11.4%) |
$342.3 (11.5%) |
1,856.1 (8.9%) |
| Services-producing industries | 315.7 (73.1%) |
$2,155.6 (72.6%) |
16,617.5 (79.8%) |
| Wholesale and retail trade | 68.0 (15.7%) |
$429.8 (14.5%) |
2,943.6 (14.1%) |
| Transportation and warehousing | 24.3 (5.6%) |
$189.2 (6.4%) |
1,083.1 (5.2%) |
| Finance, insurance, real estate, rental and leasing | 12.1 (2.8%) |
$94.2 (3.2%) |
1,438.4 (6.9%) |
| Professional, scientific, and technical services | 14.5 (3.4%) |
$101.1 (3.4%) |
1,987.6 (9.5%) |
| Business, building, and other support services* | 28.2 (6.5%) |
$202.3 (6.8%) |
714.6 (3.4%) |
| Educational services | 14.9 (3.4%) |
$88.2 (3.0%) |
1,578.6 (7.6%) |
| Healthcare and social assistance | 66.2 (15.3%) |
$463.6 (15.6%) |
2,849.1 (13.7%) |
| Information, culture, and recreation** | 8.0 (1.9%) |
$52.8 (1.8%) |
844.6 (4.1%) |
| Accommodation and food services | 26.0 (6.0%) |
$145.0 (4.9%) |
1,154.3 (5.5%) |
| Other services (excluding public administration) | 18.3 (4.2%) |
$124.2 (4.2%) |
792.1 (3.8%) |
| Public administration | 35.2 (8.1%) |
$265.3 (8.9%) |
1,231.5 (5.9%) |
| Unclassified industries*** | 9.3 (2.2%) |
$58.6 (2.0%) |
n/a |
| Canada | 432.1 (100.0%) |
$2,969.7 (100.0%) |
20,827.9 (100.0%) |
- Note: Data may not add up to the total due to rounding. Percentage shares are based on unrounded numbers. Includes claims for which at least $1 of EI sickness benefits was paid.
- * This industry sector comprises the industries with codes 55 (Management of companies and enterprises) and 56 (Administrative and support, waste management and remediation services) from the North American Industry Classification System.
- ** This industry sector comprises the industries with codes 51 (Information and cultural industries) and 71 (Arts, entertainment and recreation) from the North American Industry Classification System.
- *** For some claims, this information was not available in the data.
- Consult Annex 2.17 for more details.
- Sources: Employment and Social Development Canada, Employment Insurance (EI) administrative data. Results are based on 100% of EI administrative data. Statistics Canada, Labour Force Survey, Table 14-10-0022-01 (for employment data).
In 2024-25, the average weekly sickness benefit rate was $552, an increase of 4.0% compared to 2023-24. On average, the highest weekly sickness benefit rate was paid for claims established in Nunavut, by men, and by claimants aged 35 to 44 years (consult Annex 2.15.3). Consistent with previous fiscal years, a little more than a third (38.9%) of all sickness claimants received the maximum weekly benefit rate (consult subsection 2.1.1 for more details).
Duration of Employment Insurance sickness benefits
All sickness claims completed in 2024-25 were entitled up to a maximum of 26 weeks of benefits. For sickness claims completed in 2023-24, claims established prior to December 18, 2022, were entitled up to a maximum of 15 weeks of benefits, while those established on or after December 18, 2022, were entitled up to a maximum of 26 weeks of benefits. The number of weeks of benefits to which a claimant is entitled depends on the claimant's medical practitioner's assessment.
As illustrated in Chart 28, sickness claims completed in 2024-25 used on average 12.7 weeks, an increase of 2.2% compared to claims completed in 2023-24 that were also entitled up to a maximum of 26 weeks of benefits.

Text description
| Fiscal year | Sickness claims entitled to a maximum of 15 weeks | Sickness claims entitled to a maximum of 26 weeks |
|---|---|---|
| 2015-16 | 9.8 | n/a |
| 2016-17 | 9.9 | n/a |
| 2017-18 | 9.8 | n/a |
| 2018-19 | 9.8 | n/a |
| 2019-20 | 10.0 | n/a |
| 2020-21 | 9.1 | n/a |
| 2021-22 | 9.1 | n/a |
| 2022-23 | 9.5 | n/a |
| 2023-24 | 9.0R | 12.5R |
| 2024-25 | n/a | 12.7P |
- Note: Includes completed claims for which at least $1 of EI sickness benefits was paid.
- P Preliminary data.
- R Revised data.
- Consult Annex 2.16 for more details.
- Source: Employment and Social Development Canada, Employment Insurance (EI) administrative data. Results are based on a 10% sample of data for 2015-16 to 2021-22 and 100% of data for 2022-23 to 2024-25.
In terms of gender, men and women used on average 12.3 and 13.1 weeks in 2024-25, respectively (consult Annex 2.16.2). Women also experienced a larger increase in the average number of weeks of sickness benefits paid (+2.6%) than men (+1.7%) compared to claims completed in 2023-24 that were also entitled up to a maximum of 26 weeks of benefits.
As in previous years, the average number of weeks of sickness benefits paid increased with the age of claimants. Claimants aged 24 years and under recorded, on average, the shortest duration (10.7 weeks), while those aged 55 years and over registered the longest duration (14.0 weeks) (consult Annex 2.16.2). However, claimants aged 24 years and under had the highest increase in the average number of weeks of sickness benefits paid (+4.6%), while those aged 55 years and over had the lowest increase (+1.0%).
Nearly one-fifth (17.9%) of all sickness claims completed in 2024-25 used the maximum of 26 weeks of benefits (consult Table 57). This represents an increase of 1.7 p.p. compared to completed claims in 2023-24 that were established on or after December 18, 2022 and were entitled up to a maximum of 26 weeks of benefits. The share of completed sickness claims that used the maximum number of weeks of sickness benefits was lower in 2024-25 than previous fiscal years, as claimants were now eligible for more weeks of sickness benefits since the extension on December 18, 2022.
| Age category | 2020-21 | 2021-22 | Claim established before December 18, 2022 and completed in 2022-23 | Claim established before December 18, 2022 and completed in 2023-24R | Claim established on or after December 18, 2022 and completed in 2023-24R | 2024-25P |
|---|---|---|---|---|---|---|
| 24 years old and under | 24.8% | 26.2% | 26.9% | 21.6% | 9.5% | 10.8% |
| 25 to 44 years old | 28.9% | 31.9% | 31.5% | 25.3% | 13.4% | 14.6% |
| 45 to 54 years old | 35.4% | 39.2% | 38.2% | 31.1% | 17.2% | 20.0% |
| 55 years old and over | 41.3% | 43.1% | 40.4% | 29.8% | 21.1% | 22.9% |
| Canada | 33.4% | 35.7% | 35.0% | 27.4% | 16.2% | 17.9% |
- Note: Includes completed claims for which at least $1 in EI sickness benefits was paid.
- p Preliminary data.
- R Revised data.
- Source: Employment and Social Development Canada, Employment Insurance (EI) administrative data. Results are based on a 10% sample of data for 2020-21 and 2021-22 and 100% of data for 2022-23 to 2024-25.
Women (18.5%) were slightly more likely than men (17.1%) to use the maximum 26 weeks of benefits in 2024-25. The share of claims using all 26 weeks of sickness benefits generally increased with the age of claimants (consult Table 57).
Among completed sickness claims in 2024-25, 64.0% used 15 weeks or less, while 36.0% used 16 to 26 weeks (consult Table 58). This latter share is similar to the share of completed claims that used the maximum number of weeks before the extension of sickness benefits (34.7% on average between 2020-21 to 2022-23). Nonetheless, nearly one-fifth (17.9%) of all sickness claims completed in 2024-25 used the maximum of 26 weeks of benefits while about a third of all sickness claims used the maximum 15 weeks before the extension on December 18, 2022.
| Weeks of sickness benefits used | 2020-21 | 2021-22 | 2022-23 | Claim established before December 18, 2022 and completed in 2023-24R | Claim established on or after December 18, 2022 and completed in 2023-24R | 2024-25P |
|---|---|---|---|---|---|---|
| 1 to 14 weeks | 66.6% | 64.3% | 65.0% | 72.6% | 60.9% | 60.8% |
| 15 weeks | 33.4% | 35.7% | 35.0% | 27.4% | 6.2% | 3.2% |
| 16 to 25 weeks | Not applicable | Not applicable | Not applicable | Not applicable | 16.6% | 18.1% |
| 26 weeks | Not applicable | Not applicable | Not applicable | Not applicable | 16.2% | 17.9% |
- Note: Data may not add up to the total due to rounding. Includes completed claims for which at least $1 in EI sickness benefits was paid.
- p Preliminary data.
- R Revised data.
- Source: Employment and Social Development Canada, Employment Insurance (EI) administrative data. Results are based on a 10% sample of data for 2020-21 and 2021-22 and 100% of data for 2022-23 to 2024-25.
Employment Insurance sickness benefits and short-term disability plans (STDP) offered by employers
An internal analysis examined the number of employers registered with the Premium Reduction Program (PRP) that offered STDPs to their employees between 2020 and 2022. This analysis followed 2 previous studies covering the 2000 to 2015 and the 2016 to 2019 periods. The latest findings show that the number and share of employers participating in the PRP continued to decline, reaching 22,139 employers (1.6% of the total) in 2022, compared to 25,621 employers (2.0%) in 2016. Additionally, an annual decrease was observed every year between 2016 and 2022. Small employers (defined as those with fewer than 100 employees) were significantly less likely to offer STDPs than large employers (defined as those with 500 employees or more), and accounted for the majority of the decrease over the study period. The decrease was relatively proportional across regions and industries.
Despite a decrease in the number and share of employers offering qualifying STDPs, the number of employees covered by a STDP increased during the 2020 to 2022 period. The share of employees covered by a STDP remained around one-third of the Canadian workforce. As in previous studies, coverage increased with annual employment income. Employees earning less than $20,000 had the lowest representation among employees covered by a STDP, while those earning $100,000 or more had the highest. Women were slightly more likely than men to be covered, while younger employees (24 years old and under) were significantly less likely to be covered compared to all other age groups.
The analysis also compared the characteristics of 2 groups of EI sickness claimants: those who were not covered by a plan registered with the PRP and turned directly to EI sickness benefits (EI as a first payer), and those with coverage under a PRP-registered plan who used those benefits before applying for EI sickness benefits (EI as a second payer), as required by EI regulations. The study found that the share of EI sickness claims where EI is the first payer appears to be trending slightly downwards, after reaching a higher level in 2020. Additionally, the share of EI sickness claims for which the claimant exhausted their benefits* decreased over the 3-year period. For claims where EI was the first payer, the share fell from 42.4% in 2020 to 37.1% in 2022, and for claims where EI was the second payer, it decreased from 45.7% to 41.8% over the same period.
* Results for 2022 include claims established between January 1 and December 17, which were entitled to 15 weeks of sickness benefits. Claims established between December 18 and December 31 are excluded, as they were entitled to 26 weeks of benefits.
2.6.5 Employment Insurance compassionate care benefits
EI compassionate care benefits offer temporary income support to any eligible person who needs to take a temporary leave from work to provide end-of-life care to family membersFootnote 75 with a serious medical condition that poses a significant risk of death within 26 weeks. The benefits may be received for up to 26 weeks and may be paid to a single caregiver or shared among multiple caregivers, with only one caregiver required to serve the waiting period. Claimants must provide Service Canada with a medical certificate issued by the family member's doctor or nurse practitioner that confirms certain details about the individual's medical condition.
Employment Insurance compassionate care claims, amount paid and level of benefits
In 2024-25, there were 6,300 new claims established for compassionate care benefits, a 1.8% decrease compared to 2023-24 (consult Table 59). The breakdown of the number of claims by region remained relatively stable in 2024-25 compared to the previous fiscal year, except for Prince Edward Island, where the number of claims decreased by 45.5%. Quebec and Ontario continued to represent more than half (57.8%) of claims established for compassionate care benefits in 2024-25.
| Category | New claims established 2023-24 | New claims established 2024-25 | Change (%) in new claims established | Amount paid ($ thousands) 2023-24 | Amount paid ($ thousands) 2024-25 | Change (%) in amount paid |
|---|---|---|---|---|---|---|
| Newfoundland and Labrador | 83 | 83 | 0.0% | $461.7 | $495.8 | +7.4% |
| Prince Edward Island | 44 | 24 | -45.5% | $300.1 | $191.3 | -36.2% |
| Nova Scotia | 227 | 219 | -3.5% | $1,488.1 | $1,519.4 | +2.1% |
| New Brunswick | 125 | 126 | +0.8% | $711.2 | $837.5 | +17.8% |
| Quebec | 1,039 | 918 | -11.6% | $5,360.6 | $4,820.9 | -10.1% |
| Ontario | 2,766 | 2,726 | -1.4% | $17,265.0 | $18,254.9 | +5.7% |
| Manitoba | 267 | 276 | +3.4% | $1,552.6 | $1,825.4 | +17.6% |
| Saskatchewan | 153 | 180 | +17.6% | $938.9 | $1,176.5 | +25.3% |
| Alberta | 723 | 733 | +1.4% | $5,241.6 | $5,611.1 | +7.0% |
| British Columbia | 976 | 999 | +2.4% | $6,514.6 | $6,467.2 | -0.7% |
| Territories | 14 | 16 | +14.3% | $112.3 | $155.1 | +38.1% |
| Men | 2,011 | 2,028 | +0.8% | $14,450.0 | $14,981.5 | +3.7% |
| Women | 4,406 | 4,272 | -3.0% | $25,496.8 | $26,373.5 | +3.4% |
| 24 years old and under | 125 | 130 | +4.0% | $699.4 | $713.9 | +2.1% |
| 25 to 44 years old | 2,210 | 2,215 | +0.2% | $13,446.5 | $14,663.5 | +9.1% |
| 45 to 54 years old | 1,847 | 1,866 | +1.0% | $11,386.5 | $11,874.2 | +4.3% |
| 55 years old and over | 2,235 | 2,089 | -6.5% | $14,414.3 | $14,103.4 | -2.2% |
| Canada | 6,417 | 6,300 | -1.8% | $39,946.8 | $41,355.0 | +3.5% |
- Note: Data may not add up to the total due to rounding. Percentage change is based on unrounded numbers. Includes claims for which at least $1 of EI compassionate care benefits was paid.
- Consult Annex 2.18 for more details.
- Source: Employment and Social Development Canada, Employment Insurance (EI) administrative data. Results are based on 100% of data.
In terms of gender, women continued to represent a larger share of compassionate care benefit claims than men, with just over two-thirds (67.8%) of claims established. Among age groups, the number of claims established was relatively similar for claimants in the 3 older age groups (25 to 44 years, 45 to 54 years, and 55 years and over). However, while claimants aged 45 years and over represented 62.8% of claims for compassionate care benefits, they only represented 39.8% of the Canadian labour force.Footnote 76
The total amount paid in compassionate care benefits was $41.4 million in 2024-25. The breakdown of compassionate care benefits by region remained relatively stable in 2024-25 compared to the previous fiscal year. Prince Edward Island (-36.2%), Saskatchewan (+25.3%) and the territories (+38.1%) experienced the biggest changes in their amounts paid in compassionate care benefits compared to 2023-24. Women received 63.8% of the total amount paid in compassionate care benefits, consistent with the previous fiscal year. In terms of age groups, claimants aged 55 years and over received 34.1% of the total amount paid in 2024-25, despite only accounting for 20.5% of the Canadian labour force. Conversely, claimants aged 24 years and under accounted for 1.7% of compassionate benefits paid in 2024-25, compared to their representation of 14.0% in the labour force.
In 2024-25, the average weekly benefit rate for compassionate care benefits increased by 4.8% compared to 2023-24, going from $564 to $591. Consistent with the previous fiscal year, the highest average weekly benefit rate was for claims established in the territories, by men and by claimants aged between 25 and 44 years (consult Annex 2.18.3). Just over half of claims for compassionate care benefits established in 2024-25 (53.5%) received the maximum weekly benefit rate, an increase of 3.6 p.p. from the previous fiscal year.
Duration of Employment Insurance compassionate care benefits
The average duration of EI compassionate claims completed in 2024-25 was 11.1 weeks, unchanged from the previous fiscal year (consult Table 60). A small proportion of claims completed in 2024-25 had weeks of benefits that were shared among multiple caregivers (6.0%). This proportion was slightly lower than the one reported in 2023-24 (6.6%).
| Category | 2020-21 | 2021-22 | 2022-23 | 2023-24R | 2024-25P |
|---|---|---|---|---|---|
| Average duration (weeks) | 11.8 | 11.6 | 11.5 | 11.1 | 11.1 |
| Share (%) of completed compassionate care claims using all 26 weeks of benefits | 21.5% | 19.3% | 19.1% | 16.9% | 17.5% |
- Note: Includes completed claims for which at least $1 of EI compassionate care benefits was paid.
- P Preliminary data.
- R Revised data.
- Consult Annex 2.18 for more details.
- Source: Employment and Social Development Canada, Employment Insurance (EI) administrative data. Results are based on 100% of data.
For compassionate care claims completed in 2024-25, the average duration was higher for men (11.9 weeks) than for women (10.7 weeks) (consult Annex 2.18.2). Over the same period, claimants aged 55 years and over had the highest duration (11.7 weeks) among all age groups. Claimants between the ages of 45 and 54 registered the biggest decrease in average duration, from 11.8 weeks in 2023-24 to 10.6 weeks in 2024-25.
In total, 17.5% of completed claims for compassionate care benefits received the maximum number of 26 weeks of benefits in 2024-25 (consult Table 60). This share was slightly higher than the one reported in the previous fiscal year (16.9%). Among all completed claims in 2024-25, a higher proportion of men used all 26 weeks of benefits (20.4%) compared to women (16.1%), with both shares increasing compared to the previous fiscal year (19.2% and 15.9%, respectively). Claimants aged 24 years and under (18.4%) and those aged 55 years and over (18.9%) were more likely to use all 26 weeks of compassionate care benefits compared to claimants aged 25 to 54 years (16.8%).
2.6.6 Employment Insurance family caregiver benefit for adults
Introduced on December 3, 2017, the EI family caregiver benefit for adults offers temporary income support to any eligible person needing to take temporary leave from work to provide care or support for a person aged 18 years or over who is critically ill or injured. Family caregivers can receive these benefits for up to 15 weeks, which may be taken consecutively or in separate intervals within the 52-week benefit period. These benefits can also be paid to a single caregiver or shared among eligible family members and other eligible individuals who are considered to be like family.
Claimants must provide Service Canada with a medical certificate issued by the medical doctor or nurse practitioner of the critically ill or injured family member. To be considered critically ill or injured, a person must have experienced a significant change in their baseline state of health because of illness or injury, placing the person's life at risk and necessitating the care or support of at least one caregiver. Caregivers are not eligible for benefits if the person is already living with a chronic medical condition unless the person experiences a significant health change due to a new and acute life-threatening event.
Employment Insurance claims for the family caregiver benefit for adults, amount paid and level of benefits
In 2024-25, approximately 15,800 claims for the family caregiver benefit for adults were established, an increase of 11.4% from the 14,100 claims established during the previous fiscal year (consult Table 61). Compared to 2023-24, the number of claims established increased in all regions, except Prince Edward Island and the territories.
| Category* | New claims established 2023-24 | New claims established 2024-25 | Change (%) in new claims established | Amount paid ($ thousands) 2023-24 | Amount paid ($ thousands) 2024-25 | Change (%) in amount paid |
|---|---|---|---|---|---|---|
| Newfoundland and Labrador | 178 | 221 | +24.2% | $1,054.6 | $1,298.9 | +23.2% |
| Prince Edward Island | 96 | 67 | -30.2% | $543.0 | $391.1 | -28.0% |
| Nova Scotia | 381 | 414 | +8.7% | $2,071.2 | $2,276.4 | +9.9% |
| New Brunswick | 286 | 308 | +7.7% | $1,629.3 | $1,713.9 | +5.2% |
| Quebec | 2,088 | 2,348 | +12.5% | $11,643.5 | $13,041.2 | +12.0% |
| Ontario | 6,970 | 7,837 | +12.4% | $37,190.4 | $42,992.3 | +15.6% |
| Manitoba | 482 | 544 | +12.9% | $2,785.9 | $2,975.2 | +6.8% |
| Saskatchewan | 355 | 362 | +2.0% | $2,031.1 | $2,202.3 | +8.4% |
| Alberta | 1,478 | 1,659 | +12.2% | $8,511.2 | $9,288.5 | +9.1% |
| British Columbia | 1,778 | 1,955 | +10.0% | $10,048.0 | $11,703.1 | +16.5% |
| Territories | 43 | 37 | -14.0% | $278.4 | $229.2 | -17.7% |
| Men | 4,978 | 5,776 | +16.0% | $29,630.1 | $34,040.8 | +14.9% |
| Women | 9,157 | 9,976 | +8.9% | $48,156.4 | $54,071.2 | +12.3% |
| 24 years old and under | 356 | 369 | +3.7% | $1,654.0 | $1,884.7 | +14.0% |
| 25 to 34 years old | 1,995 | 2,521 | +26.4% | $10,578.9 | $13,493.0 | +27.5% |
| 35 to 44 years old | 2,790 | 3,162 | +13.3% | $14,893.3 | $17,815.0 | +19.6% |
| 45 to 54 years old | 3,843 | 4,219 | +9.8% | $21,627.0 | $23,391.3 | +8.2% |
| 55 to 64 years old | 4,230 | 4,427 | +4.7% | $23,941.9 | $25,503.3 | +6.5% |
| 65 years old and over | 921 | 1,054 | +14.4% | $5,091.4 | $6,024.6 | +18.3% |
| Canada | 14,135 | 15,752 | +11.4% | $77,786.5 | $88,111.9 | +13.3% |
- Note: Data may not add up due to rounding. Percentage change is based on unrounded numbers. Includes claims for which at least $1 of EI family caregiver benefit for adults was paid.
- * Claims for which the region was unknown have been combined with Ontario for confidentiality purposes.
- Consult Annex 2.19 for more details.
- Source: Employment and Social Development Canada, Employment Insurance (EI) administrative data. Results are based on 100% of data.
Women continued to represent nearly two thirds (63.3%) of all claims established for the family caregiver benefit for adults in 2024-25, although men saw a larger relative increase (+16.0%) than women (+8.9%). By age category, claimants aged 55 to 64 years continued to represent the largest share (28.1%) of claims established this year, while the highest increase from 2023-24 was among the 25 to 34 years age group (+26.4%).
The total amount paid for the family caregiver benefit for adults was $88.1 million in 2024-25, up 13.3% from the $77.8 million paid in the previous fiscal year. While the majority of these benefits were paid to women in 2024-25 (61.4%), the share of benefits paid to men has gradually increased over the past fiscal years, going from 33.2% in 2021-22 to 38.6% in 2024-25. By age category, claimants aged 55 to 64 years continued to receive the highest share of benefits paid, followed by those aged 45 to 54 years.
The average weekly benefit rate for the family caregiver benefit for adults was $577 in 2024-25, up from $554 in 2023-24 (+4.2%). Claimants from the territories received the highest average weekly benefit rate ($622) among claimants from all regions. Men received a higher average weekly benefit rate ($610) than women ($559), similar to recent years. Among age groups, claimants in the core age groups had higher average weekly benefit rates than other age groups, with those aged 35 to 44 years receiving the highest ($601), followed by those aged 25 to 34 years ($593) and those aged 45 to 54 years ($590) (consult Annex 2.19.3).
Duration of claims for the Employment Insurance family caregiver benefit for adults
Claimants are eligible for up to 15 weeks of benefits for the EI family caregiver benefit for adults, which may be shared among eligible caregivers and divided into segments to be used within the 52-week benefit period.
The average duration of claims for the EI family caregiver benefit for adults that were completed in 2024-25 was 10.0 weeks, similar to the one for 2023-24 (10.2 weeks). Claimants from Prince Edward Island had the longest average duration (11.2 weeks), while those from Ontario had the shortest (9.7 weeks). There was no difference in the average claim duration between men and women, while among age groups, claimants aged 65 years and over had a higher average claim duration (11.7 weeks) than all other age groups, for which the average claim duration ranged between 9.4 and 10.5 weeks (consult Annex 2.19.2).
2.6.7 Employment Insurance family caregiver benefit for children
The EI family caregiver benefit for children offers temporary income support to any eligible person needing to take temporary leave from work to provide care or support for a child under 18 years of age who is critically ill or injured. Family caregivers can receive these benefits for up to 35 weeks, which may be taken consecutively or in separate intervals within the 52-week benefit period. These benefits may also be paid to a single caregiver or shared among eligible family members and other individuals who are considered to be members of the family.
Claimants must provide Service Canada with a medical certificate issued by the medical doctor or nurse practitioner of the critically ill or injured child. To be considered critically ill or injured, a child must have experienced a significant change in their baseline state of health because of illness or injury, placing the child's life at risk and necessitating the care or support of at least one caregiver. Caregivers are not eligible for benefits if the child is already living with a chronic medical condition, unless the child experiences a significant health change due to a new and acute life-threatening event.
Employment Insurance claims for the family caregiver benefit for children, amount paid and level of benefits
In 2024-25, just under 4,700 claims for the EI family caregiver benefit for children were established, an increase of 6.1% from 4,400 claims established in 2023-24 (consult Table 62). As in previous fiscal years, Ontario and Quebec accounted for the majority of these claims (60.5%). By gender, women represented 71.9% of claims established, while by age, the 25 to 44 years category continued to account for the vast majority of claims established (81.6%).
| Category* | New claims established 2023-24 | New claims established 2024-25 | Change (%) in new claims established | Amount paid ($ thousands) 2023-24 | Amount paid ($ thousands) 2024-25 | Change (%) in amount paid |
|---|---|---|---|---|---|---|
| Newfoundland and Labrador | 48 | 58 | +20.8% | $341.4 | $403.4 | +18.2% |
| Prince Edward Island | 23 | 36 | +56.5% | $147.0 | $198.6 | +35.1% |
| Nova Scotia | 115 | 117 | +1.7% | $958.5 | $688.3 | -28.2% |
| New Brunswick | 79 | 77 | -2.5% | $659.8 | $680.6 | +3.1% |
| Quebec | 1,068 | 1,036 | -3.0% | $7,699.9 | $7,557.6 | -1.8% |
| Ontario | 1,630 | 1,800 | +10.4% | $12,460.3 | $13,823.1 | +10.9% |
| Manitoba | 158 | 167 | +5.7% | $1,280.2 | $1,208.9 | -5.6% |
| Saskatchewan | 143 | 170 | +18.9% | $1,248.1 | $1,401.9 | +12.3% |
| Alberta | 611 | 628 | +2.8% | $4,771.4 | $4,922.7 | +3.2% |
| British Columbia | 533 | 582 | +9.2% | $3,908.8 | $4,430.3 | +13.3% |
| Territories | 14 | 19 | +35.7% | $125.6 | $164.0 | +30.6% |
| Men | 1,203 | 1,318 | +9.6% | $8,991.6 | $9,927.6 | +10.4% |
| Women | 3,219 | 3,372 | +4.8% | $24,609.2 | $25,551.8 | +3.8% |
| 24 years old and under | 151 | 143 | -5.3% | $844.8 | $798.4 | -5.5% |
| 25 to 44 years old** | 3,573 | 3,826 | +7.1% | $26,661.4 | $27,833.4 | +4.4% |
| 45 to 54 years old | 617 | 627 | +1.6% | $5,345.4 | $5,999.1 | +12.2% |
| 55 years old and over | 81 | 94 | +16.0% | $749.3 | $848.5 | +13.2% |
| Canada | 4,422 | 4,690 | +6.1% | $33,600.8 | $35,479.4 | +5.6% |
- Note: Data may not add up to the total due to rounding. Percentage change is based on unrounded numbers. Includes claims for which at least $1 of EI family caregiver benefit for children was paid.
- * For confidentiality purposes, claims for which the region was unknown have been combined with Ontario.
- ** For confidentiality purposes, claims for which the age category was unknown have been combined with the 25 to 44 years category.
- Consult Annex 2.20 for more details.
- Source: Employment and Social Development Canada, Employment Insurance (EI) administrative data. Results are based on 100% of data.
The total amount paid for the family caregiver benefit for children was $35.5 million in 2024-25, up from $33.6 million paid in 2023-24 (+5.6%). Regional variations from the amount paid during the previous fiscal year were relatively similar to those in the number of claims established, except in Nova Scotia, where the amount paid decreased by 28.2% in 2024-25 compared to the previous fiscal year, despite a similar number of claims established. By gender and age, women and claimants aged between 25 and 44 years represented the majority of the amount paid, with respective shares of 72.0% and 78.4%.
Claims for the EI family caregiver benefit for children established in 2024-25 had an average weekly benefit rate of $578, up 3.7% from $558 in 2023-24. On average, claimants from the territories received the highest weekly benefit rate ($643). By gender, men had a higher average weekly benefit ($621) than women ($557). By age, claimants aged 24 years and under had a lower average weekly benefit rate ($503) than the other age categories, which ranged between $571 and $581.
Duration of claims for the Employment Insurance family caregiver benefit for children
Claimants are eligible for up to 35 weeks of benefits for the EI family caregiver benefit for children, which may be shared among eligible caregivers and divided into segments to be used within the 52-week benefit period.
The average duration of claims for the EI family caregiver benefit for children that were completed in 2024-25 was 14.8 weeks, which was slightly lower than the average of 15.3 weeks for claims completed during the previous fiscal year (-3.4%). The average claim duration decreased in all regions compared to 2023-24, except in Alberta and the territories. On average, women used more weeks of benefits (15.8 weeks) than men (12.8 weeks), and claimants aged 45 to 54 years had the longest average claim duration (17.2 weeks) among all age groups.
2.6.8 Employment Insurance special benefits for self-employed persons
Self-employed persons may make a claim for EI special benefits after signing up for the EI program and meeting specific requirements. The special benefits available to self-employed persons are the same as those offered to salaried employees.
To be eligible for EI special benefits for self-employed persons, an individual must:
- register with Service Canada and enter into an agreement with the Canada EI Commission
- run their own business or control more than 40% of the corporation's voting shares
- pay EI premiums at the same rate as salaried employees for at least one year before they may claim benefits
- wait 12 months from the date of their confirmed registration before claiming EI special benefits
- have earned the minimum net amount of self-employed earnings during the calendar year preceding the year they apply for benefitsFootnote 77
- have reduced the amount of time devoted to their business by more than 40% for at least one week and
- meet the eligibility criteria specific to the special benefits being claimedFootnote 78
As soon as a self-employed person receives EI benefits, they would have to pay premiums on their self-employed earnings for the rest of their self-employment career. Those who also receive insurable earnings from an employer have the choice to apply for EI special benefits as self-employed persons or as insured claimants (if they have paid EI premiums through their paid employment). If they claim benefits under the former, their benefits would be calculated based on both self-employment and paid employment income, whereas for the latter, only earnings from paid employment would be taken into account. The choice between EI special benefits as self-employed persons or as insured claimants (including fishers) is final and binding.
In 2024-25, the number of participating self-employed persons who entered into a voluntary agreement with Service Canada increased by nearly 4,100, bringing the total number of participating self-employed persons to 61,433 (consult Table 63). Despite this increase, the number of new annual enrolments has been trending downwards since 2020-21, consistent with the decline in the number of self-employed persons over that period.
| Enrolment | 2020-21 | 2021-22 | 2022-23 | 2023-24 | 2024-25 |
|---|---|---|---|---|---|
| Net enrolments | 12,778 | 5,268 | 4,792 | 4,676 | 4,061 |
| New participants to the program (opted in) | 17,932 | 6,747 | 6,007 | 5,985 | 5,410 |
| Registrants who cancelled or terminated participation (opted out) | -5,154 | -1,479 | -1,215 | -1,309 | -1,349 |
| Cumulative total at the end of the fiscal year | 42,636 | 47,904 | 52,696 | 57,372 | 61,433 |
Source: Employment and Social Development Canada, Service Canada administrative data. Results are based on 100% of data.
Employment Insurance special benefits for self-employed persons, claims, amount paid and level of benefits
In 2024-25, a total of just under 1,500 special benefit claims were established by self-employed persons, which was 16.8% higher than the previous fiscal year, despite a decrease in the number of net enrolments during the same period. The benefit types most frequently received by self-employed EI claimants were maternity benefits and parental benefits (consult Table 64).
| Category | New claims established 2023-24 | New claims established 2024-25 | Change (%) in new claims established | Amount paid ($ thousands) 2023-24 | Amount paid ($ thousands) 2024-25 | Change (%) in amount paid |
|---|---|---|---|---|---|---|
| Maternity | 774 | 910 | +17.6% | $4,578.0 | $5,780.1 | +26.3% |
| Parental | 925 | 1,061 | +14.7% | $10,813.3 | $12,015.3 | +11.1% |
| Other special benefits | 399 | 468 | +17.3% | $1,466.5 | $2,017.7 | +37.6% |
| Atlantic | 107 | 116 | +8.4% | $1,084.8 | $1,656.6 | +52.7% |
| Quebec | 77 | 87 | +13.0% | $284.2 | $389.0 | +36.9% |
| Ontario | 513 | 590 | +15.0% | $6,692.8 | $8,377.1 | +25.2% |
| Prairies | 256 | 309 | +20.7% | $3,454.7 | $3,907.1 | +13.1% |
| British Columbia and territories | 319 | 383 | +20.1% | $5,341.2 | $5,483.4 | +2.7% |
| Men | 123 | 148 | +20.3% | $541.3 | $786.1 | +45.2% |
| Women | 1,149 | 1,338 | +16.4% | $16,316.4 | $19,027.1 | +16.6% |
| 29 years old and under | 171 | 206 | +20.5% | $2,342.5 | $2,976.4 | +27.1% |
| 30 to 39 years old | 843 | 1,004 | +19.1% | $12,441.0 | $14,658.7 | +17.8% |
| 40 to 54 years old | 195 | 228 | +16.9% | $1,759.3 | $1,854.1 | +5.4% |
| 55 years old and over | 63 | 48 | -23.8% | $314.9 | $324.1 | +2.9% |
| Canada | 1,272 | 1,486 | +16.8% | $16,857.7 | $19,813.2 | +17.5% |
- Note: Data may not add up to the total due to rounding. Percentage change is based on unrounded numbers. Includes claims to self-employed persons for which at least $1 in EI special benefits was paid. New claims established by benefit type may not sum as claimants can receive multiple benefit types on a single claim.
- Consult Annex 2.11 for more details.
- Source: Employment and Social Development Canada, Employment Insurance (EI) administrative data. Results are based on 100% of data.
In 2024-25, Ontario was the region that established the largest number of special claims for self-employed persons, with a share of 39.7% of total claims, while Quebec had the lowest number of claims. Quebec continued to be underrepresented in new claims established due to the fact that the province offers maternity, parental, adoption and paternity benefits under the Quebec Parental Insurance Plan, with mandatory participation of self-employed persons (consult subsections 2.6.2 and 2.6.3). The region of British Columbia and the territories had the largest increase in the number of claims established compared to the previous fiscal year (consult Table 64).
Consistent with past trends, women made up the vast majority (90.0%) of new claims established for self-employed persons. By age, claimants between 30 and 39 years old accounted for the largest share of new claims (67.6%). This is mainly attributable to the fact that most benefits received by self-employed EI claimants are maternity and parental benefits. Conversely, claimants aged 55 years and over represented the smallest share of new claims (3.2%) and were the only age group to experience a decline compared to the previous fiscal year, with a decrease of 23.8%.
In 2024-25, the total amount paid in EI special benefits to self-employed persons increased by 17.5% compared to 2023-24 and reached $19.8 million. Similar to the breakdown of claims by region, the largest share of special benefits was paid to Ontario (42.3%), while the smallest share was paid to Quebec (2.0%). The Atlantic region experienced the largest growth in the amount paid compared to 2023-24, with an increase of 52.7%, despite an increase of only 8.4% in the number of new claims established.
As observed with claims, women received the largest share of the total special benefits paid to self-employed persons in 2024-25 (96.0%). In terms of age group, claimants aged between 30 and 39 years old also continued to receive the largest share of special benefits paid to self-employed persons (74.0%).
In 2024-25, the average weekly benefit rate for self-employed- persons was $434.Footnote 79 On average, during the whole fiscal year, the highest weekly benefit rate was for claims established in British Columbia and the territories ($491), by women ($441) and by those between the ages of 30 and 39 ($457).
2.7 Employment Insurance financial information
In this section
- 2.7.1 Employment Insurance premium rate
- 2.7.2 Premium refund provision
- 2.7.3 Premium reduction program
- 2.7.4 Recent trends in revenues and expenditures
The Employment Insurance (EI) program is funded through mandatory premium contributions paid by employers and employees in Canada. These contributions are based on the employees' insurable earnings up to the annual Maximum Insurable Earnings (MIE) threshold for a given year.Footnote 80 Since January 2010, self-employed individuals who have opted into the EI program also pay EI premiums in order to be eligible for EI special benefits.
All EI premiums and other types of revenues (such as interest and penalties) related to the EI program under the authority of the Employment Insurance Act are first deposited into the Consolidated Revenue Fund (CRF) and then credited to the EI Operating Account (the Account).Footnote 81 All EI benefits paid and administrative costs provided for under the Employment Insurance Act are paid out of the CRF and debited from the Account.
The following section provides information on EI premium rates and recent trends in revenues and expenditures recorded for the Account.
2.7.1 Employment Insurance premium rate
As defined in the Employment Insurance Act, since April 1, 2016, the Canada Employment Insurance Commission (the Commission) has been responsible for setting the EI premium rate. According to the Employment Insurance Act, the premium rate is set according to a 7-year break-even rate (under which the projected balance for the Account is expected to be $0 in 7 years), as forecasted by the EI Senior Actuary. As such, EI program expenditures are matched by premium contributions to ensure that the Account is in cumulative balance by the end of a 7-year period. In addition, annual changes to the EI premium rate are legislatively limited to increases or decreases of no more than 5 cents per year.Footnote 82 The 7-year forecast break-even rate and the 5-cent limit on annual changes ensure stable and predictable premium rates for employees and employers.Footnote 83 Employers pay EI premiums that are 1.4 times the employee rate.
The EI premiums are paid by employers, employees and self-employed persons who have opted into the EI program, for every $100 of insurable earnings up to the MIE threshold. In 2025, the MIE was $65,700, an increase of $2,500 (+4.0%) from the previous year's MIE of $63,200.
The EI program grants a reduction in EI premiums to employees and employers who are covered by a provincial plan that reduces or eliminates EI special benefits payable in that province. Since January 1, 2006, Quebec is the only province in Canada that has been administering its own provincial plan, known as the Quebec Parental Insurance Plan (QPIP). The QPIP provides parental, adoption, maternity, and paternity benefits to eligible claimants and is financed by premiums paid by wage earners, self-employed workers, and employers in Quebec. These benefits replace maternity and parental benefits provided by the EI program and, as such, EI premiums in Quebec are lowered to reflect the savings that are generated for the EI program as a result of the existence of the QPIP.
In 2025, the EI premium rate for employees was $1.64 per $100 of insurable earnings. This was a decrease of 2 cents from $1.66 per $100 of insurable earnings in 2024, less than the maximum 5 cents allowed under the Employment Insurance Act. As a result, the maximum annual EI premiums paid by employees in 2025 was $1,077.48 in 2025, compared with $1,049.12 in 2024, representing an increase of 2.7%. As mentioned previously, employers pay EI premiums that are 1.4 times the employee rate such that employers contribute approximately 58% of the total EI premium revenues versus approximately 42% contributed by employees. This means that, in 2025, employers paid $2.30 ($2.296 unrounded) for every $100 of insurable earnings for each of their employees, up to a maximum of $1,508.47.
Self-employed persons who opted into the program to access special benefits pay the same EI premium rate as employees and also pay premiums up to the MIE.Footnote 84
Over the same period, the EI premium rate for employees in Quebec was $1.31 per $100, compared with $1.32 in the previous year. Their maximum contributions amounted to $860.67 in 2025, up from $834.24 in 2024, an increase of 3.2%. Employers paid $1.83 ($1.834 unrounded) per $100 of insurable earnings for each of their employees in 2025, up to a maximum of $1,204.94. Table 65 summarizes this information for the past 6 years.
| Category | 2020 | 2021 | 2022 | 2023 | 2024 | 2025 |
|---|---|---|---|---|---|---|
| Employee premium rates for residents of a province without a provincial parental insurance plan | $1.580 | $1.580 | $1.580 | $1.630 | $1.660 | $1.640 |
| Employer premium rates for residents of a province without a provincial parental insurance plan | $2.212 | $2.212 | $2.212 | $2.282 | $2.324 | $2.296 |
| Employee premium rates for residents of a province with a provincial parental insurance plan (Quebec) | $1.200 | $1.180 | $1.200 | $1.270 | $1.320 | $1.310 |
| Employer premium rates for residents of a province with a provincial parental insurance plan (Quebec) | $1.680 | $1.652 | $1.680 | $1.778 | $1.848 | $1.834 |
| Employees' maximum insurable earnings | $54,200 | $56,300 | $60,300 | $61,500 | $63,200 | $65,700 |
| Employee annual maximum contribution | $856.36 | $889.54 | $952.74 | $1,002.45 | $1,049.12 | $1,077.48 |
| Employer annual maximum contribution | $1,198.90 | $1,245.36 | $1,333.84 | $1,403.43 | $1,468.77 | $1,508.47 |
- * Per $100 of insurable earnings.
- Source: Employment Insurance Premium Rate for employees and employers: Summary of the 2026 Actuarial Report on the Employment Insurance Premium Rate.
Example: Employment Insurance premium contributions
Olivia is an employee working at a call centre in Halifax, Nova Scotia, and earns $45,000 per year.
Based on Olivia's income level and assuming she remained employed throughout the year; her annual contribution to the EI program in 2025 would be $738.00 at the premium rate of $1.64 for every $100 of insurable earnings. Her employer would contribute $1,033.20 in EI premiums on her insurable earnings. The combined contributions made by the employer and employee to the Account would total $1,771.20 in 2025.
However, if Olivia was working and living in Quebec, her annual EI contribution in 2025 would be reduced to $589.50, and her employer would have contributed $825.30 in EI premiums on her earnings, for a combined total of $1,414.80 in contributions made to the Account. As wage earners in Quebec paid a Quebec Parental Insurance Plan (QPIP) premium rate of $0.494 for every $100 of insurable earnings in 2025 and employers pay a premium rate of $0.692 for every $100 of insurable earnings, Olivia's contribution to the QPIP would be $222.30, while the employer's contribution would be $311.40. Note that QPIP premiums are set by the Quebec Parental Insurance Plan's Conseil de gestion and not by the Commission.
Chart 29 illustrates the EI premium rates for employees and employers over the past 10 years in Quebec and the rest of Canada.Footnote 85 The Government froze the 2014 premium rate for employees at the 2013 level of $1.88 per $100 of insurable earnings and legislated the 2015 and 2016 rates at that amount. The 2021 and 2022 rates were frozen at the 2020 premium rate level of $1.58 per $100 of insurable earnings, as part of the Government's economic response to COVID-19.

Text description
| Category | 2016 | 2017 | 2018 | 2019 | 2020 | 2021 | 2022 | 2023 | 2024 | 2025 |
|---|---|---|---|---|---|---|---|---|---|---|
| Employee contributions - Canada except Quebec | $1.88 | $1.63 | $1.66 | $1.62 | $1.58 | $1.58 | $1.58 | $1.63 | $1.66 | $1.64 |
| Employer contributions - Canada except Quebec | $2.63 | $2.28 | $2.32 | $2.27 | $2.21 | $2.21 | $2.21 | $2.28 | $2.32 | $2.29 |
| Employee contributions - Quebec | $1.52 | $1.27 | $1.30 | $1.25 | $1.20 | $1.18 | $1.20 | $1.27 | $1.32 | $1.31 |
| Employer contributions - Quebec | $2.13 | $1.78 | $1.82 | $1.75 | $1.68 | $1.65 | $1.68 | $1.78 | $1.85 | $1.83 |
Source: EI premium rates and maximums - Calculate payroll deductions and contributions.
2.7.2 Premium refund provision
Under certain circumstances, a share or all of EI premiums paid can be refunded to contributors if specific conditions are met.
The EI program includes a provision that grants EI premium refunds to employees with insurable earnings equal to or less than $2,000 in a given calendar year, as they are unlikely to qualify for EI benefits. In addition to this, some employees, such as those with multiple jobs or those who change jobs during the year, may pay EI premiums on earnings that exceed the MIE and the maximum annual contribution in a given taxation year. Under these circumstances, affected employees are entitled to receive a refund of all or a portion of their EI premiums paid in the year when filing their income tax returns. However, employers do not receive a corresponding refund.
According to Canada Revenue Agency (CRA) data on T4 slips from employers, there were 787,829 individuals in 2023 (the most recent taxation year for which data is available) that were eligible to receive full EI premium refunds under the Premium Refund Provision, representing a 5.9% decrease from previous year. Of these individuals who were eligible to receive full refunds on their EI premiums, 74.1% (583,583 individuals) had filed income taxes and 66.1% of those who were eligible (520,869 individuals) received a full premium refund based on CRA T1 tax filer data. A total of $7.7 million in premiums were refunded to the eligible individuals in 2023. On average, each eligible individuals received $14.90 in EI premiums refunded.
2.7.3 Premium reduction program
The Premium Reduction Program (PRP) was introduced in 1971 to encourage employers to provide short-term income protection coverage plans to their employees. The PRP recognized employer-based plans that already existed and encouraged employers to continue to offer them as EI sickness benefits became available.
Under the Employment Insurance Act, employers who provide qualified wage-loss plans, also known as short-term disability plans, to their employees that are at least equivalent to the protection provided by EI sickness benefits may be eligible to receive a reduction in the EI premiums payable through the PRP. The PRP puts less strain on the EI program as employees who are covered by such short-term disability plans may not have to collect EI benefits or may collect them for a shorter period of time, as benefits from the registered plans provided by employers have to be paid before EI benefits are paid.
There are 2 types of wage-loss replacement plans for which EI premium reductions may be granted: cumulative paid sick leave plans and weekly indemnity programs. These plans must also meet certain requirements established by the Commission.Footnote 86 The premium reduction reflects the average savings generated to the EI Account due to the existence of these plans, and is provided directly to employers. As EI premiums are paid by both employers and employees in a proportion of 7/12 and 5/12, respectively, employers are required to ensure that their employees benefit from the reduction of the employers' premium in an amount at least equal to 5/12 of the reduction.
In each calendar year, the rates of premium reduction are established based on 4 categories of qualified plans, with a distinct rate for each category, as explained below:
- category 1: cumulative paid sick leave plans that allow for a minimum monthly accumulation of 1 day and for a total accumulation of at least 75 days
- category 2: cumulative paid sick leave plans that allow for a minimum monthly accumulation of one and two-third days and for a total accumulation of at least 125 days
- category 3: weekly indemnity plans with a benefit period of at least 15 weeks
- category 4: weekly indemnity plans with a benefit period of at least 52 weeks (this reduction is available only to public and para-public employers of a province)
Rates of premium reduction are expressed as a percentage of the insurable earnings of employees. In 2025, the rates of reduction were 0.21%, 0.37%, 0.37% and 0.41% of insurable earnings for categories 1 through 4, respectively.Footnote 87 Premiums were reduced by an estimated $1,333.3 million due to wage-loss plans in 2023 (the most recent taxation year for which data is available), compared to $1,171.9 million in 2022 and $1,086.4 million in 2021.Footnote 88
An internal analysis on the PRP estimated that there were just over 22,000 employers receiving EI premium reductions through the PRP in 2022, representing approximately 1.6% of all employers in Canada. As a result, between 6.6 million and 7.3 million workers were covered by a short-term disability plan offered by their employers under the PRP in 2022, representing nearly one-third of the Canadian labour force. This analysis also shows that, during the period of 2020 to 2022, the majority of employers participating in the PRP (89.9%) offered a category 3 plan with weekly indemnity to their employees — a share similar to that of previous years. This proportion has remained stable over time, despite a general decline in employer participation in the program.
2.7.4 Recent trends in revenues and expenditures
As required by Section 64 of the Financial Administration Act, the Receiver General prepares the Public Accounts of Canada annually to report on the financial transactions of the Government for the fiscal year. According to the Public Accounts of Canada, EI revenues were $32.2 billion in 2024-25, up from $30.3 billion (+6.5%) from the previous year. Over the same period, EI expenditures increased from $26.3 billion in 2023-24 to $28.0 billion in 2024-25 (+6.7%) (consult Table 66). It is worth noting that these expenditures exceed the levels recorded prior to the COVID-19 pandemic.
As for the Account, it continued to show an annual surplus, which has steadily increased over the past 3 years, reaching $4.2 billion in 2024-25, an increase of 11.9% compared with the previous year (consult Table 66).
| Operating Account | 2020-21 | 2021-22 | 2022-23 | 2023-24 | 2024-25 |
|---|---|---|---|---|---|
| Revenues* | $22,896.5 | $24,333.7 | $27,472.9 | $30,273.1 | $32,241.7 |
| Premiums | 99.9% | 99.9% | 99.8% | 99.6% | 99.6% |
| Interest and penalties | 0.1% | 0.1% | 0.2% | 0.4% | 0.4% |
| Expenditures** | $61,838.3 | $41,504.9 | $24,194.9 | $26,307.2 | $28,033.9 |
| Employment Insurance benefits (Part Ⅰ) | 51.0% | 89.1% | 81.3% | 80.9% | 83.2% |
| Employment benefits and support measures (Part Ⅱ) | 4.0% | 6.1% | 10.3% | 9.6% | 7.5% |
| Benefit repayments | -0.4% | -1.2% | -1.1% | -1.1% | -1.2% |
| Employment Insurance Emergency Response Benefit*** | 39.9% | 0.0% | -0.3% | -1.5% | -0.7% |
| Administration costs | 4.1% | 6.4% | 11.2% | 11.0% | 10.2% |
| Bad debts | 1.5% | -0.1% | -1.4% | 1.1% | 1.1% |
| Funding from the Government of Canada - Employment Insurance Emergency Response Benefit**** | 27,331.4 | (94.7) | (483.4) | (225.8) | (21.2) |
| Annual surplus (deficit) | ($11,610.3) | ($17,265.9) | $2,794.7 | $3,740.0 | $4,186.5 |
- Note: Data may not add up to the total due to rounding.
- * Includes all revenues and funding from EI premiums, interest owed on accounts receivable, penalties applied to claimants for violations of terms and conditions of the EI program and additional funding measures introduced for Employment Insurance under the federal budget.
- ** Includes all expenses related to funding and operations of the EI program, including benefit payments under Part Ⅰ of the EI program, Employment Benefit and Support Measure (EBSM) expenditures under Part Ⅱ of the EI program, EI benefit repayments, administrative costs and outstanding debts counted as liabilities against the EI Operating Account.
- *** The Employment Insurance Emergency Response Benefit is the portion of the Canada Emergency Response Benefit that was administered by Employment and Social Development Canada. Expenses related to the EI Emergency Response Benefit were paid from the EI Operating Account and are included in this financial statement.
- **** Pursuant to section 153.111 of the Employment Insurance Act, the Account was credited the reported amount determined by the Minister of Finance that corresponds to the total cost of the EI Emergency Response Benefit (EI-ERB), including all costs related to the benefit and its administration. The funding from the Government of Canada is recognized in the period in which the transfer is authorized. Funding recognized is comprised of EI-ERB expenditures, incremental costs related to the administration of the EI-ERB, overpayments established and bad debts related expense.
- Source: Government of Canada, Public Accounts of Canada 2025, Volume I: Summary Report and Consolidated Financial Statements (Ottawa: Receiver General for Canada, 2025) and past year versions of the Public Accounts Report.
Chart 30 shows the financial position of the Account at the end of the fiscal year for the past 10 years. On March 31, 2025, the accumulated deficit was $14.3 billion, down from the $18.4 billion at the end of the previous fiscal year. The reduction in the accumulated deficit this year compared to last year is mainly attributable to the growth in revenues, due to the increased premium rate during the first 9 months of 2024-25 and the rise in the MIE, in relation to the expenses paid out.

Text description
| Fiscal year | 2015-16 | 2016-17 | 2017-18 | 2018-19 | 2019-20 | 2020-21 | 2021-22 | 2022-23 | 2023-24 | 2024-25 |
|---|---|---|---|---|---|---|---|---|---|---|
| Accumulated surplus/deficit at the end of the fiscal year ($ billion) | $2.91 | $3.00 | $2.95 | $4.92 | $3.90 | -$7.71 | -$24.97 | -$22.18 | -$18.44 | -$14.25 |
Source: Government of Canada, Public Accounts of Canada 2025, Volume I: Summary Report and Consolidated Financial Statements (Ottawa: Receiver General for Canada, 2025) and past year versions of the Public Accounts Report.