
Technical Report: Estimating the Net Impact of the Opportunities Fund for Persons with Disabilities Program
By: Andy Handouyahia, Leeroy Rikhi Tristan, Jamil Sayeed, Anna Yu
On this page
- Glossary
- Acknowledgement
- Abstract
- 1. Introduction
- 2. Program overview
- 3. Methodology
- 4. Socio-demographic profile of the participants
- 5. Net impact analysis results
- 6. Cost benefit analysis
- 7. Conclusion
- References
- Appendix A: Detailed results on socio-demographic characteristics
- Appendix B: Net impacts results
- Appendix C: Distribution of propensity score before and after matching
List of abbreviations
- APE
- Action Plan Equivalents
- CRA
- Canada Revenue Agency
- CSGC
- Common System for Grants and Contributions
- EI
- Employment Insurance
- ESDC
- Employment and Social Development Canada
- LMDA-EAS
- Labour Market Development Agreement - Employment Assistance Services
- OF
- Opportunities Fund for Persons with Disabilities
- OF-EEAS
- Enhanced Employment Assistance Services
- OF-SFE
- Skills for Employment
- OF-WE
- Work Experience
- OF-WS
- Wage Subsidy
- PIM
- Participant Intervention Module
List of tables
- Table 1: Mean standardized bias and pseudo R²
- Table 2: Overall net impact estimates for OF 2011 and 2012 cohort over post participation period until 2017
- Table 3: Costs accounting framework from the perspectives of participants, government, and society
- Table 4: Benefits accounting framework from the perspectives of participants, government, and society
- Table A1: Gender distribution of OF participants and their EAS-only comparison group
- Table A2: Age distribution of OF participants and their EAS-only comparison group
- Table A3: Disability types of OF participants and their EAS-only comparison group
- Table A4: Other socio demographics characteristics of OF participants and their EAS-only comparison group
- Table A5: Province/territory of OF participants and their EAS-only comparison group
- Table A6: Total employment Income 1-year before participation of OF participants and their EAS-only comparison group
- Table A7: Total employment Income 2-year before participation of OF participants and their EAS-only comparison group
- Table A8: Employment insurance and social assistance of OF participants and their EAS-only comparison group
- Table B1: Net impact estimates for OF-EEAS 2011 and 2012 cohort over post Participation Period until 2017
- Table B2: Net impact estimates for OF-SFE 2011 and 2012 cohort over post participation period until 2017
- Table B3: Net impact estimates for OF-WS 2011 and 2012 cohort over post participation period until 2017
- Table B4: Net impact estimates for OF-WE 2011 and 2012 cohort over post participation period until 2017
List of figures
- Figure 1: Illustration of matching
- Figure 2: Illustration of difference-in-difference method
- Figure 3: Distribution of propensity scores before and after matching (common support) for overall OF
- Figure 4: Cost-benefit analysis for the OF program over a 10-year period
- Figure 5: Comparison of social return among different intervention types
- Figure C 1: Distribution of propensity scores before and after matching (common support) for OF-EEAS
- Figure C 2: Distribution of propensity scores before and after matching (common support) for OF-SEF
- Figure C 3: Distribution of propensity scores before and after matching (common support) for OF-WS
- Figure C 4: Distribution of propensity scores before and after matching (common support) for OF-WE
Glossary
- Conditional independence assumption
- The conditional-independence assumption requires that the common variables that affect participation assignment and participation-specific outcomes be observable.
- Counterfactual
- The counterfactual refers to what would have happened to the participants in the absence of the program.
- Difference-in-differences
- The difference-in-differences (or "double difference") estimator is defined as the difference in average outcome in the participant group before and after participation minus the difference in average outcome in the control group before and after participation.
- Discount rate
- A discount rate is used to calculate the Net Present Value (NPV) which is the value of all future cash flows over the entire life of an investment discounted to the present.
- Inverse probability weighted
- IPW use weighted averages of the observed outcome variable to estimate the potential-outcome means. The weights are the reciprocals of the participation probabilities estimated by a participation model.
- Kernel matching
- Kernel matching is a non-parametric matching estimator that uses weighted averages of all individuals in the comparison group to construct the counterfactual outcome.
- Nearest neighbor matching
- Nearest-neighbor matching uses the distance between observed variables to find similar individuals.
- Propensity score matching
- The propensity score is the conditional probability of participating in the intervention given the pre-participation variables. Propensity score matching uses the distance between estimated propensity scores to find similar individuals.
- MSCPF
- The Marginal Social Cost of Public Funds (MSCPF) represents the loss incurred by society when raising additional revenues, such as taxes, to fund government spending.
- Social return
- Social rate of return is the ratio between the net benefit to society and the direct program costs to the government. In other words, it shows the dollar value of the net benefit to the society when the government spends $1 on a program.
Acknowledgement
We would like to express our appreciation to those who contributed to this technical report and provided valuable information on the operations of the Opportunities Fund for Persons with Disabilities program. We gratefully acknowledge the valuable inputs and comments received from Jérôme Mercier, Laura MacFadgen, Donna Smith-Moncrieffe and Richard R De Marco. We would also like to thank our colleagues Eppo Maertens and Khaddouj Souaid from the Skills and Employment Branch for their collaboration and assistance.
Abstract
This technical report presents the methods and techniques employed to measure the net impact analysis and the cost-benefit analysis of the Opportunities Fund (OF) for persons with disabilities in CanadaFootnote 1. The analysis uses rich longitudinal administrative data from Employment and Social Development Canada’s Labour Market Program Data Platform for individuals who participated in the OF program from January 2011 to December 2012. This report applies propensity score matching combined with the difference-in-differences methodology to estimate the net impact of the OF program on participants 5-years post participation until 2017. The report's main strength is its reliance on the rich administrative data, which allows for controlling numerous socio-demographic and labour market characteristics in the propensity score model. The techniques used to build the counterfactual comparison group effectively matched participants to similar non-participants for each intervention. In addition, this report uses rigorous statistical tests using other estimation methods to check the robustness of the results. A cost-benefit analysis assesses the cost effectiveness of the OF program by estimating the net social benefit from this program. These methods and techniques generated robust evaluation results, demonstrating that the OF program is effective in improving the labour market attachment of program participants. Overall, the OF program yields a positive social return on investment over the ten-year post participation.
1. Introduction
The Government of Canada invests in specific programs to facilitate the participation of persons with disabilities in the labour market. Over the past 2 decades, Employment and Social Development Canada (ESDC) has funded organizations known as Community Coordinators to provide labour market programming for persons with disabilities. This technical report presents the methods and findings from the net impact analysis and cost-benefit analysis employed in phase 2 of the 3rd summative evaluationFootnote 2 of the Opportunities Fund program for persons with disabilities.
Launched by ESDC in 1997, the Opportunities Fund for Persons with Disabilities (OF) Program is designed to fill a gap in federal supports for persons with disabilities who are not eligible for Employment Insurance program or training support under the Employment Insurance Act Part II. The program's objective is to assist these individuals in preparing for, obtaining and keeping employment or becoming self-employed, thereby increasing their economic participation and independence. This report examines the following interventions under the Opportunities Fund:
- Enhanced employment assistance services
- Skills for employment
- Wage subsidies
- Work experience
This technical report examines the effectiveness and efficiency of the OF program through an analysis of the employment-related outcomes of participants over a 10-year period from 2007 to 2017 (5 year pre-participation and 5 year post-participation) using non-experimental methods. This report presents the techniques used to estimate the net impacts of the program via propensity score kernel matchingFootnote 3 combined with the difference-in-differences method. The econometric model used in this report builds on rich information about an individual’s labour market experience, including socio-demographic characteristics as well as labour market history. The report uses data from the Labor Market Program Data Platform, which is an integrated, longitudinal administrative database. This analysis examines all individuals who participated in the OF program between January 2011 and December 2012. The comparison group contains of individuals who meet the same eligibility criteria and socio-demographic characteristics as OF participants, but had received only minor interventions via Employment Assistance Services as part of the Labour Market Development Agreements (LMDA) and self-declared as having a disability. This report also presents the results from the cost-benefit analysis, which addresses the economic costs and benefits arising from interventions delivered under the OF program.
The net impact analysis indicates that relative to the comparison groupFootnote 4, OF participants experienced higher earnings and incidence of employment, as well as a small decrease in their reliance on social assistance benefits. Cost-benefit analysis suggests that the OF program yields economic benefits that outweigh the government’s investment in the program. From a societal perspective, it takes less than 4 years to recover the cost of the program. Skills for Employment has the highest social return among all types of interventions.
This report is organized as follows. Section 2 presents a brief overview of the OF program. Section 3 describes the methodology used to analyze the effectiveness of the program, and Section 4 presents the socio-demographic profile of the participants. Section 5 and 6 present the net impact and cost-benefit analysis respectively. Section 7 provides concluding remarks.
2. Program overview
Launched in 1997, the OF program was designed to fill a gap in federal supports for persons with disabilities who are not eligible for the Employment Insurance (EI) program or training support under EI Part II. The OF program aims to assist participants integration in the labor market by providing different types of services including job search supports, pre-employability services, wage subsidies, work placements, and employer awareness initiatives to encourage employers to hire persons with disabilities. It delivers 7 types of interventions, namely:
- Enhanced Employment Assistance Services (OF-EAS)
- Skills for Employment (OF-SFE)
- Wage Subsidies (OF-WS)
- Work Experience (OF-WE)
- Self-Employment, Developmental and Services
However, Self-Employment, Developmental and Services interventions are not considered due to the insufficient number of participants to conduct the net impact analysis. A brief description of the 4 intervention types considered in this report are provided below.
Enhanced employment assistance services
This intervention supports a mixture of pre-employment activities tailored to meet the needs of persons with disabilities and facilitate their integration into employment. Broadly categorized, these activities include:
- counselling
- job placement services
- access to labour market information
- assistance in determining appropriate skills training
Skills for employment
This intervention enables participants to undertake short-duration training and develop skills, ranging from basic to advance. Such skills must relate to a specific job opportunity where there is a reasonable expectation of employment in a stable or expanding sector.
Wage subsidy
This intervention provides a financial incentive to encourage employers to hire persons with disabilities (whom they would not normally hire), in the form of a share of the wages paid to these participants. Such activities place participants in positions that are likely to lead to permanent jobs with the host employers, and to assist participants whose likelihood of finding employment will markedly improve through the creation of employer-employee relationships.
Work experience
This intervention provides the same training as for the Wage Subsidy intervention except that the positions occupied by participants in “Work Experience” activities are only formed for the purposes of the Program. Therefore, there was not the same expectation that the host employer would retain the participant after the subsidy ended. After April 2015, this intervention was no longer eligible for funding.
The OF program gives funding to support a range of projects. This is to ensure that eligible persons with disabilities can access the assistance needed to integrate or re-integrate into the labour market. The vast majority of funding for the OF activities is delivered through agreements between ESDC/Service Canada and contribution recipients who act as community coordinators for the programFootnote 5. Community Coordinators, also referred to as funding or contribution recipients, act as intermediaries between participants and employers.
Reforms introduced in budgets 2012, 2013 and 2014 resulted in the following operational changes:
- connect more Canadians with disabilities to work experience in small and medium-sized businesses
- provide demand-driven training solutions for persons with disabilities and make the program more responsive to labour market needs
- involve employers and community organizations in project design and delivery
- ensure employers are aware of the invaluable contribution of persons with disabilities
3. Methodology
3.1 Data and unit of analysis
The report uses data from the Labor Market Program Data Platform. It contains a rich longitudinal administrative database of EI part I data on EI claims, EI part II data for the Employment Assistance Services participants in Labour Market Development Agreements (LMDA-EAS), T1 and T4 tax files obtained from the Canada Revenue Agency, and OF program administrative data. This dataset contains rich information on the socio-demographic characteristics of participants and the comparison group, their labour market qualifications (for example, occupational group, skill levels related to the last job before opening their EI claim, industry codes) and their labour market history. The analysis covers all OF participants who began participating in Enhanced Employment Assistance Services, Skills for Employment, Wage Subsidy, and Work Experience interventions between January 2011 and December 2012. This report uses the socio demographic and labor market characteristics of 8,866 participants who participated in this program during the reference period.
Similar to the evaluation of LMDA, the unit of analysis for this report is the Action Plan Equivalent (APE). An APE groups all interventions taken by a participant within an interval of 6 months of each other (that is, gap of 6 months or less between the end of one intervention and the beginning of the following one). This report examines the APE compositions for all participants during the reference period, which shows that the majority (around 77%) of participants took only 1 intervention. If an APE contains multiple interventions then it is categorised based on the most intensive intervention. The net impact analysis measures the effects of participating in the program using the following 5 labor market indicators, namely:
- earnings
- incidence of employment
- EI benefits
- social assistance benefits, and
- dependence on income supportFootnote 6
One of the limitations of the data is the lack of information on severity of disability, multiple disabilities, and level of educational attainment. Of these, education level may not be as crucial because of available proxies such as previous earnings, sector of previous jobs, and skill type and level. Multiple disabilities and severity are perhaps more of a potential issue, especially if participants in one of the groups (treated or comparison) had disabilities which were more or less severe.
3.2 Estimating the net impact
The methodology of this report is built on the same framework as the evaluation of the Labour Market Development Agreements. The procedure for estimating net impacts is based on a non-experimental approach that measures the effectiveness of the program by comparing the actual outcomes for the participants in different interventions to their counterfactual outcomes (that is, the outcomes they would have experienced in the absence of an intervention). Because a given individual cannot be both a participant and a non-participant in an OF intervention during the reference period, an appropriate comparison group is needed to “stand in” as the counterfactual. Based on the available data, we built our comparison group using a subset of individuals who have the same characteristics as OF participants, but had received only low intensity service through minor Employment Assistance Services interventions as part of the Labour Market Development Agreements.
The following sections discuss the approaches for determining the counterfactual comparison group and implementing the propensity score matching combined with difference-in-differences methodology.
3.2.1 Selection of comparison group
This report uses a non-experimental method to determine the counterfactual comparison group. Non-experimental methods generate comparison groups that are akin to the group of program participants by using techniques, such as propensity score matching combined with difference in differences. This approach avoids ethical and political challenges of an experimental design that would require creating a comparison group of non-participants that are randomly denied access to a program.
The main challenge of assessing the net impact of participation in a program is selecting a comparison group that closely resembles the program participants. The comparison group for the OF program is composed of individuals who shared the same eligibility criteria and socio demographic characteristics as OF participants, but had received only minor interventions via LMDA-EAS and self-declared as having a disability. The comparison group chosen are from this low intensity group who started participation during the same reference period from January 2011 to December 2012. Using LMDA-EAS participants as the comparison group has several advantages:
- the universe of LMDA-EAS cases is very large so it is possible to obtain close matches to program participants both in terms of their observable characteristics and in terms of the timing of their participation
- numerous pieces of information on LMDA-EAS participants facilitate matching techniques needed to develop the counterfactual for OF participants (for example type of disability)
- EAS interventions are low-intensity and of short duration, representing a true “limited treatment” comparison group
3.2.2 Implementation of the matching estimator combined with difference-in-differences method
We used non-experimental propensity score based weighting approach to measure the program impacts. This approach aims to ensure that the participants and comparison group are balanced in terms of background factors (that is, sociodemographic and labour market history variables) prior to estimating the program impacts. We applied the kernel matching technique, which uses the entire control group and re-weights control group members each time they are compared with a new participant, based on propensity score differentials. We used Inverse Probability Weighting (IPW) and Nearest Neighbour matching as alternative methods to validate the results. Note that these methods were combined with Difference-in-Differences (DID) estimation of program impacts. The DID method allows for the participants and comparison groups to differ on time-invariant unobserved characteristics, by assuming common time trends in the pre- and post-participation period in these characteristics. Figure 1 and 2 provide illustrations of matching and DID method.
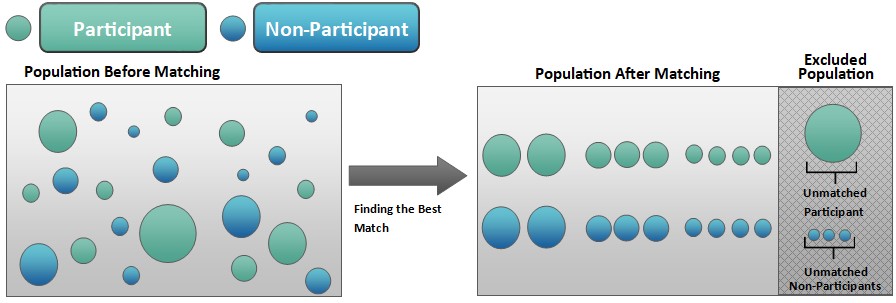
Text description of Figure 1
This figure illustrates a simple example of matching method. A non-experimental propensity-score based weighting approach is used to measure the program impacts. This approach aims to ensure that the participants and comparison group are balanced in terms of background factors (that is, sociodemographic and labour market history variables) prior to estimating the program impacts. We applied the kernel matching technique, which uses the entire control group and re-weights control group members each time they are compared with a new participant, based on propensity-score differentials.
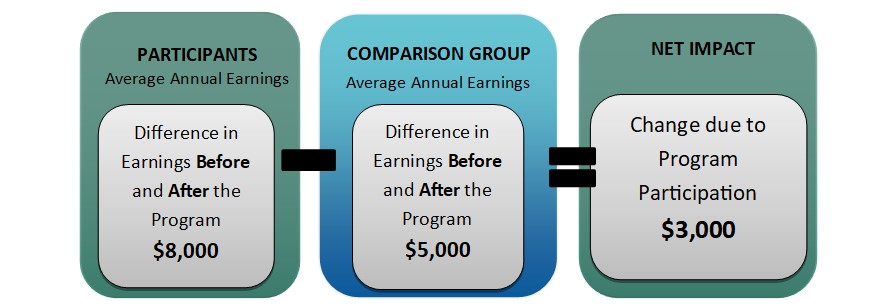
Text description of Figure 2
This figure illustrates a simple example of difference-in-difference method. Suppose, employment insurance claimants who participated in the program earn on average $8,000 more than they did at the start of the program, compared to an increase on average of $5,000 earned by similar individuals in the program. The net impact of the program would be an increase of $3,000 on average.
A brief description of propensity score model and difference-in-differences method is provided below.
Propensity score model
This report uses the logit regression model to estimate propensity scores. The propensity score is the conditional probability of participating in the program given the pre-participation variables. Propensity score matching uses the distance between estimated propensity scores to find similar individuals. The participants are pooled with potential comparison cases, and logistic models are estimated to predict the likelihood of participating in the OF program based on the background characteristics of the participants and the comparison group members. The data used for the model cover a large number of characteristics reflecting the labour market experiences and socio-demographic characteristics of participants and comparison cases. These characteristics include age, gender, marital status, and disability status. For both groups, the data have information on their economic region and province and qualifications (for example, occupational group, skill levels related to the last job before opening their EI claim, industry codes). Finally, the data also includes labour market history (including EI benefits, the incidence of employment, and employment earnings) in the 5 years preceding participation.
Difference-in-Differences (DID)
DID is one of the most popular methods to assess the causal effect on key outcome indicators of participating in an intervention or program. The DID method is used when outcome variables for participants and the comparison group are observed for 2 or more time periods (that is, before and after an intervention). The DID method requires that, in the absence of the intervention, the expected difference in outcome indicators between the participants and the comparison group is constant over time. This refers to a common trend assumption or constant bias assumption (Lechner, 2010). It is conventionally measured by comparing the observable trends in the pre-intervention period.
In order to use propensity score matching combined with difference-in-differences methods, this report applies following 3 identifying assumptions.
Conditional independence assumption
The conditional independence assumption requires that the common variables that affect participation assignment and intervention-specific outcomes be observable. An advantage of this analysis is that the available administrative data contains rich information about the type of disability for both participants and the comparison group. This allow for the inclusion of the most relevant variables influencing the decision to participate in the interventions and the labour market outcomes in the propensity score model. In this context, this report assumes that the Conditional Independence Assumption is satisfied.
Common support (overlap) assumption
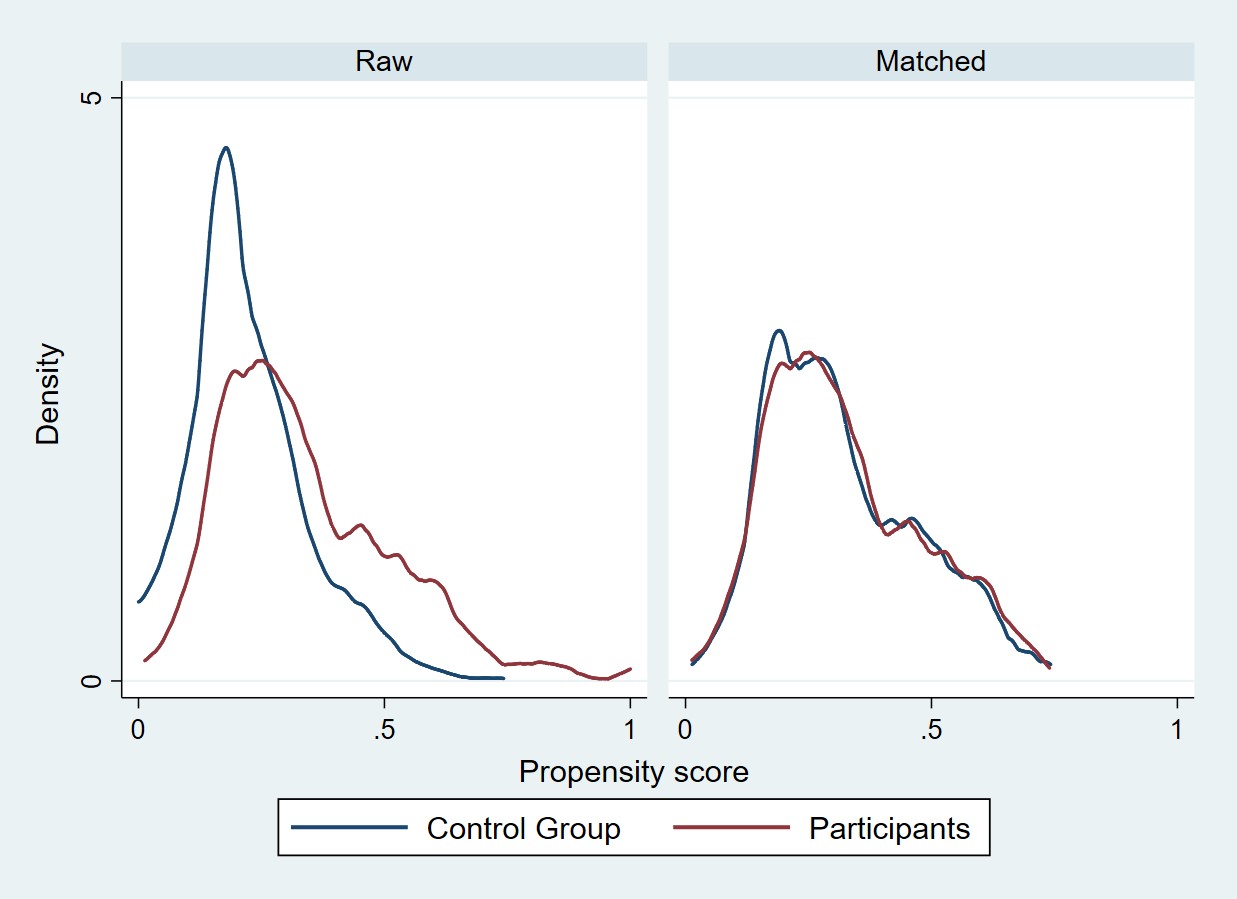
This assumption ensures that persons with the same covariate values have a positive probability of being both participants and non-participants (Heckman, LaLonde, and Smith, 1999). In other words, each participant has one or more “counterparts” in the comparison group with the same covariate profile, such that appropriate counterfactuals can be constructed. The common support assumption can be verified empirically. The most straightforward way to do this is through a visual inspection of the density distribution of the propensity score in both groups. Figure 3 presents the distribution of the propensity scores before and after the matching for overall OF program. After matching, we observe a large overlap between the participants and comparison cases, and therefore a correspondingly high capacity to find suitable matches. A visual inspection indicates that there are no issues with common support for each intervention type (Figure C1 to Figure C4 in appendix).
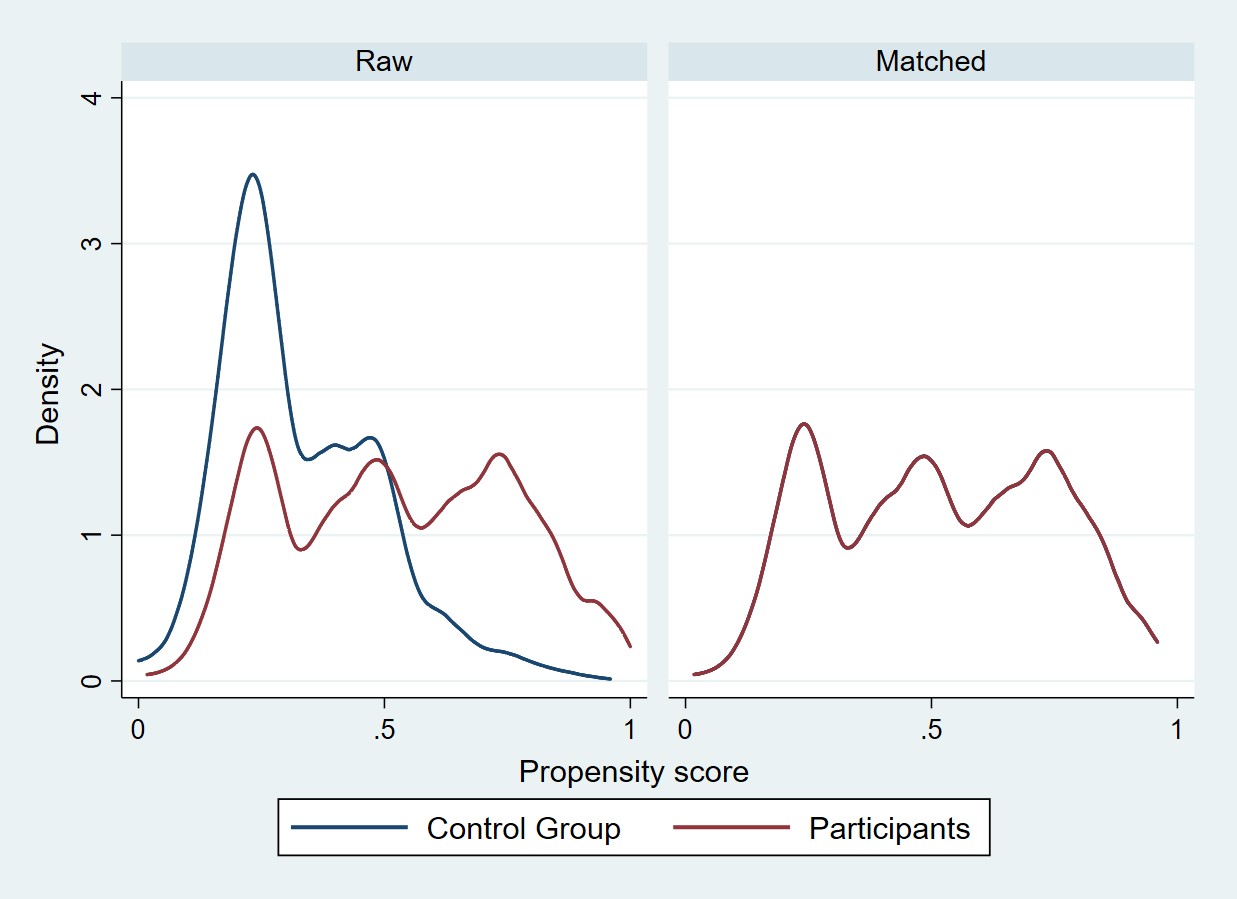
Text description of Figure 3
This figure demonstrates a visual inspection of the density distribution of the propensity score in participants and control group before and after the matching for overall OF program. The left panel denoted as ‘Raw’ represents density distribution before matching and the right panel denoted as ‘Matched’ represents density distribution after matching. After matching, we observe a large overlap between the participants and control group, and therefore a correspondingly high capacity to find suitable matches.
Conditional bias stability assumption
The motivation for the conditional bias stability assumption comes from the concern that some relatively stable unobserved characteristics, such as ability, motivation, and/or attractiveness, may persistently affect labour market outcomes, but not fully capture conditioning on the available pre-program data. To satisfy this property, this analysis includes the pre-participation variables in the propensity score model.
This report uses the kernel matching algorithm to match participants and the comparison group with respect to their propensity scores. Kernel matching is a non-parametric technique that uses weighted averages of the outcomes of all individuals in the comparison group to construct the counterfactual. A major advantage of this approach is that it reduces the variance of the estimated effects.
Quality of the matching
The richness of the available administrative data allows for the inclusion of the most relevant variables influencing the decision to participate in the interventions and the labour market outcomes in the propensity score model. The use of socio-economic characteristics, pre-participation outcomes, transitions between different labour market states, regional information and labour market history decreases the likelihood of biased estimators of the true participation effects. This report uses a rich set of variables (Set of variables used for net impact analysis is listed below), including socio-demographic variables, labour market history of individuals (including EI benefits, the incidence of employment, and employment earnings in the 5 years preceding program entry). Previous empirical studies (Lechner & Wunsch, 2013) have emphasized the importance of these variables in influencing participation decisions and outcomes.
Set of variables used for net impact analysis
Socio-demographics characteristics
- Gender
- Age (at Action Plan Equivalent start date)
- Disability Type (at the Action Plan Equivalent start date)
- Self-declared status as a member of a visible minority
- Self-declared status as a member of an Indigenous community
- Marital status
Labour market characteristics
- Occupation
- Skill LevelFootnote 7 and Type
- Reason for Separation
- Previous program participation up to 3 years preceding the participation
- Social Assistance benefits received in each year prior to the Action Plan Equivalent start date (up to 5 years before starting the program)
- Total reported earnings in each year before the Action Plan Equivalent start date (up to 5 years before starting the program)
- Social Assistance income in each year before the start of the Action Plan Equivalent period (up to 5 years before starting the program)
- Employment Insurance benefits received in each year before the start of the Action Plan Equivalent period (up to 5 years before starting the program)
- Spousal income (up to 5 years before starting the program)
- Average number of weeks of EI benefits used in the 5 years before starting the program
To illustrate the quality of the matching, Table 1 presents the summary results of covariate balancing tests before and after matching for each program intervention by using standardized mean differences between participants and non-participants. Propensity score matching substantially reduces the differences in the distribution of the covariates between participants and comparison groups. For example, for OF-SFE intervention the average cross-group standardized difference prior to matching was about 5.9, which decreases to 1.9 after matching. The reduction of differences in the covariate distributions between the participation and comparison groups is substantial, lending confidence to the results of the subsequent incremental impact analysis. A visual analysis of the density distribution of the propensity score in both groups (Caliendo and Kopeinig, 2005) was used to determine the common support region between participants and comparison cases. Further details on the full list of covariates used in the propensity score model, as well as the balancing scores, are available upon request.
| Program | # Participants before matching | # Participants after Matching* | Pseudo R2 before matching | Pseudo R2 after matching | Mean Bias before matching | Mean Bias after matching |
|---|---|---|---|---|---|---|
| Overall-OF | 8,866 | 8,804 | 0.184 | 0.024 | 6.1 | 2.7 |
| OF-EEAS | 5,609 | 5,567 | 0.219 | 0.017 | 6.5 | 2.1 |
| OF-SFE | 1,144 | 1,135 | 0.103 | 0.008 | 5.9 | 1.9 |
| OF-WS | 705 | 701 | 0.068 | 0.004 | 5.7 | 1.4 |
| OF-WE | 853 | 850 | 0.11 | 0.007 | 6 | 2 |
- Source: Labour Market Program Data Platform, Employment and Social Development Canada.
- Note: *Number of OF participants remaining ( that is, after removing the unmatched participants) after the common support restriction is applied. Standardised bias is defined as the difference of sample means in participant group and matched comparison case subsamples as a percentage of the square root of the average of sample variances in both group.
After assessing the matching quality, the net impact estimates were produced using the propensity score matching combined with the difference-in-differences method. The results revealed that the estimated effects were not sensitive to different matching algorithms. The DID method allows for the participants and comparison groups to differ on time-invariant unobserved characteristics, by assuming common time trends in the pre- and post-participation period in these characteristics. The difference-in-differences method removes biases from unmeasured fixed confounder variables that affect both the participant and comparison groups over time. The validity of the difference-in-differences method depends on the stability of the bias between participants and non-participants in the pre-program period. This requires a sufficiently long pre-program period to properly control for the similarity between participants and non-participants, and to identify and deal with the Ashenfelter dipFootnote 8. The current report uses a period of 5 years to observe pre-program behaviour. It also carries out a rigorous sensitivity analysis by applying Nearest NeighborFootnote 9 and Inverse Probability Weighting matchingFootnote 10 estimators. The findings from the sensitivity analysis suggests that the estimated effects are not sensitive to different matching estimators.
A potential limitation of this report is the possibility that there might have been pre-existing differences between the participants and comparison cases that were not measured during the matching process. These differences could have had an influence on the observed outcomes. For example, factors such as ability, health and motivation to seek employment were not directly measured except to the extent that they were captured in prior income and labour market attachment patterns. Although there is not data available for these variables, the pre-existing differences between participants and non-participants are well captured by the informative data on their respective labour market history (EI usage pattern and earnings’ profile) in the 5 years before participation and skills level related to their last occupation. Furthermore, the sensitivity analysis revealed that omitting unobserved characteristics in the propensity score model did not influences the sign of the estimated impact.
4. Socio-demographic profile of the participants
In this section, we discuss the sociodemographic profile of the OF participants overall. For details about the profile of participants by intervention types, please refer to table A1 in the appendix.
Most of the OF participants (n=5,567 or approximatively 63%) participated in the OF-EEAS intervention and approximately 13% of participants (n=1,135) were associated with interventions delivered under the OF-SFE. As shown in appendix A Table A1, participants were more likely to be male (52%) than female (46%). This trend applies to other OF intervention types except for SFE, which attracted a higher proportion of females (48% and 53% respectively) than males (44% for both). Overall, with respect to the type of disability, participants with mental health issues constituted the majority (24%), followed by those with physical disabilities (19%), developmental disabilities (13%), and learning disabilities (8%). The majority of participants were between 31 and 54 years of age constituting 51%, followed by those under 30 years (30%) and those 55 years or older (11%). The majority of the participants were non-Indigenous, non-visible minority and non-immigrant. The majority of the OF participants were single (65%), and resided in Ontario (40%) and British Columbia (15%). In the year preceding OF participation 58% of participants had no employment earnings, 54% received SA, and close to 0% received EI benefits.
5. Net impact analysis results
This section presents the results of the net impact analysis of the OF program on labour market outcomes. First, we discuss the overall results followed by detailed results for each intervention.
5.1 OF overall
The net impact findings demonstrate (Table 2) that the 5-year post-program earnings increased by an average of $1094 per year, with a total cumulative increase of $5469 over 5 years. The OF participants also experienced an average increase in the incidence of employment of 5.47 percentage points (pp) per year, with the most notable increase occurring in the first post-program year at 9.84pp. This is a substantial increase of 42 % relative to the net impact in-program incidence of employment of 6.93pp. Further, the OF participants’ usage of EI benefits increased slightly each year, with an average increase of $9.91 per year. The use of SA benefits increased during the in-program participation period by $255, but little evidence to suggest that this increase was sustained or reduced in subsequent years. Over the post-participation period, the level of dependence on income support generally decreased, but none of the results were statistically significant.
The net impact analysis shows that, on average, OF participants experienced a $342 gain in their employment earnings in the program start year. This result is counter to the typical negative lock-in effectsFootnote 11 observed during the in-program year, as participants spend most of their time in training, and therefore cannot fully participate in the labour market. However, a closer look at the results on a per intervention basis reveals that the interventions with a paid work experience component drive the average up.
| Indicators | Program start year | 1 yr post-program | 2 yr post-program | 3 yr post-program | 4 yr post-program | 5 yr post-program | Cumulative in & post-program (0-5) | Annual average post-program (1-5) |
|---|---|---|---|---|---|---|---|---|
| Employment earnings ($) | 341.94*** | 787.37*** | 1150.84*** | 1245.35*** | 1172.19*** | 1115.05*** | 5469.35*** | 1093.87*** |
| Incidence of employment (percentage point) | 6.93*** | 9.84*** | 6.28*** | 5.74*** | 2.49** | 3.08*** | N/A | 5.47*** |
| EI benefits ($) | -6.62 | 11.03 | 13.9* | 13.09* | 9.4 | 11.02* | 49.56* | 9.91* |
| SA benefits ($) | 254.78*** | -7.22 | -17.97 | 21.95 | -91.4 | -108.67 | -203.22 | -40.64 |
| Dependence on income support (percentage point)1 | -0.92 | -1.21 | 1.37 | -1.85 | -1.26 | -0.72 | N/A | -0.67 |
- Source Labour Market Program Data Platform, Employment and Social Development Canada.
- Note: Significance level: ***1%, **5%, *10%
- 1 Dependence on Income Support = (EI Benefits + Social Assistance)/(EI Benefits + Social Assistance + Total Earnings), where “Total Earnings” includes wages and salaries as well as income from self-employment.
5.2 Enhanced employment assistance services
The OF clients participating in OF-EEAS experienced an increase in their employment earnings in the 5-year post-participation period, as shown in the Apprendix, Table B 1. This increase was approximately $527 per year, accompanied by an increase in the incidence of employment of 3.05pp per year relative to the comparison group. Some evidence of lock-in effects occurred during the in-program year, with participants experiencing a small (but non-significant) decrease in earnings. Moreover, EI benefits usage decreased slightly during participation by about $11.50, with little evidence suggesting that there were any appreciable changes in usage following participation. The average amount of SA benefits collected increased during the program start year and the first 3 years in the post participation period, but decreased in the 4th and 5th years (although the results for the latter 2 years were not statistically significant). Relative to the comparison group, OF clients in OF-EEAS increased their dependence on income support slightly over the post-participation period, ranging from 2.57pp during participation to about 1.85pp per year in the following years; however, the results were not significant from the second year onwards.
5.3 Skills for employment
The OF clients participating in OF-SFE showed significant incremental gains (Appendix, Table B 2) in earnings over the 5-year, post-participation period ranging from $1,783 to $4,230 per year The average per year was $3,692, and the cumulative gain over 5 years was $18,460, with both results being significant. The gains in earnings were accompanied by significant increases in their employment incidence, averaging about 9.82pp per year increase following participation relative to the comparison group. EI benefit use increased slightly throughout the 5 years but was only statistically significant in the 4th and 5th year post-program. The use of SA increased significantly during participation, but there is significant and robust evidence that it declined over the post-participation period, with an average reduction of $395 per year. There was also evidence of a reduction in the dependence on income support during the post-participation period, averaging about 8.04pp decrease per year relative to the comparison group.
5.4 Wage subsidy
The OF clients participating in Wage Subsidy interventions experienced incremental increases in earnings and the incidence of employment (Appendix, Table B 3), in the 5 years post-participation. Employment income increased significantly by as much as $2,163 per year following participation, for a cumulative gain of $10,816 over 5 years. There is evidence to suggest that EI benefit usage increased slightly by about $49 per year; however, the actual amount and significance of the results varies by year. Participants reduced SA income usage conclusively up to 2 years after participation and continued to decrease usage throughout the post-program period, although the evidence is weaker ( that is, results were not statistically significant throughout all years). Dependence on income support also fell conclusively in the first 2 years following participation and varied year-after-year with an average reduction of 4.21pp per year.
5.5 Work experience
The OF clients in Work Experience experienced an incremental increase of $1,373 in their employment earnings (Table B 4) during the program start year and an increase of $1,456 in the first-year post-program. They had an average incremental increase in earnings of about $744 per year and an incremental increase in their incidence of employment of about 10.14pp per year. Their use of EI benefits increased slightly throughout all years; however, none of the results were statistically significant. There was strong evidence of a reduction in SA income in the first year following participation. However, there was a sizeable decrease in SA income in subsequent years; it was not statistically significant.
6. Cost-benefit analysis
The net impact analysis assesses program effectiveness using yearly impact estimates for the 5 year period after an OF program intervention (from 2011 and 2012 up to 2017). A robust cost-benefit analysis was conducted to estimate the costs and benefits of the OF program for the 10 year period post participation (5 years observed plus 5 years projected).
Cost-benefit analysis compares costs and benefits from the perspective of the individual (that is, the participant), the government, and when combined, the ultimate impact on society. Following the prevailing approach in the evaluation literature (see Heckman et al. (1999)), the net social benefit was measured by subtracting the costs of the program from their discounted social benefit streams. The cost-benefit analysis is based on quantifiable costs and benefits. The benefits from the individual and government perspectives are the following:
- employment earnings
- fringe benefits
- federal and provincial income taxes
- federal and provincial sales taxes
- employment insurance
- social assistance
- Canada Pension Plan (CPP) and Quebec Pension Plan (QPP) contribution
- employment insurance premiums
On the cost side, this analysis takes into account the direct costs of the interventions, which is the program costs. In addition, the indirect costs of the program are the marginal social cost of public fundsFootnote 12 (MSCPF; see for example Browning, 1987) and foregone earnings. To account for the MSCPF, the direct resource costs should be multiplied by a factor greater than 1, in order to capture the distortions arising from financing the program by raising tax revenue. Following the advice received from expert peer reviewers, the MSCPF is calculated as 20% of the program cost and subsequent impacts on sales taxes, income taxes as well as on EI and social assistance outlays.
Cost-benefit analysis estimates the following 4 indicators.
Net Present Value (NPV): Following the dominant approach in the literature [Heckman, al., (1997), Oddbjørn et al., (2002), and Skipper et al., (2007)], the analysis determines the NPV 5 years after the end of participation by subtracting the program cost from the discounted benefits.
Benefits-cost ratio: It shows whether the amount of benefit generated from the program outweigh the costs incurred in delivering the program.
Payback period: It estimates the amount of time required for benefits to equal costs.
Social return: Social rate of return is the ratio between the net benefit to society and the direct program costs to the government. In other words, it shows the dollar value of the net benefit to the society when the government spends $1 on a program.
The main objective of this analysis is to assess whether the economic benefits outweigh the government’s investment in the OF program. Specifically, it aims to address the following questions:
- Did the program result in net financial benefits or losses 10 years after program participation?
- When does investment in the program “break even” (where the benefits equal the costs) from government and societal perspectives?
- What is the rate of return on investment of an intervention for the society after 10 years?
This analysis examines the benefits and the costs of the OF program from 3 perspectives.
- Individual: This perspective accounts for the costs incurred by participants when taking part in the intervention (foregone earnings) and the benefits accrued by participants following the intervention (higher-earnings profile relative to non-participants)
- Government: This perspective accounts for: the direct costs of the intervention borne by governments, as well as the costs associated with tax distortion; and, the benefits associated with participants’ higher earnings profile in the form of additional tax revenues and lower spending on income support programs
- Society: This perspective combines the individual and government perspectives
An important aspect of the cost-benefit analysis is to determine who bears a particular cost or benefit. What is a benefit from one perspective is a cost from another perspective. For example, a decrease in EI use is a reduction in income for the participants but is a benefit from the government’s perspective. Table 3 and 4 provide the costs and benefits from the perspective of the individual, government, and society.
| Costs factors | Individual | Government | Society | Estimation Methods |
|---|---|---|---|---|
| Program cost | 0 | - | - | Cost estimates based on program expenditure data |
| Foregone earnings | - | 0 | - | In-program net impacts on earnings |
| Marginal Social Cost of Public Funds | 0 | - | - | 20% of program costs minus sales taxes minus income taxes minus EI minus social assistance |
| Benefits factors | Individual | Government | Society | Estimation Methods |
|---|---|---|---|---|
| Employment earnings | + | 0 | + | Net impacts |
| Fringe benefits | + | 0 | + | Estimates are measured by 15.09 % of employment earnings |
| Federal and provincial income taxes | - | + | 0 | Estimates based on earnings and federal and provincial income tax rate |
| Federal and provincial sale taxes | - | + | 0 | Net impacts on earnings multiplied by the propensity to consume (95.6%), the proportion of household spending on taxable goods and services (51%) and by the total average federal and provincial sales tax rate (12%) |
| EI | -/+ | +/- | 0 | Net impacts |
| Social Assistance | -/+ | +/- | 0 | Net impacts |
| CPP and QPP contribution | -/+ | +/- | 0 | Net impacts |
| EI premiums | -/+ | +/- | 0 | Net impacts |
The perspective from society combines both individual and government perspectives. For a given factor, a net gain to society occurs only when a gain to one group was not at the expense of another group. For example, increases in earnings represent a benefit for participants but neither a benefit nor a cost to the government. Thus, the net result is a gain for society. A cost to society occurs when a factor is a cost from one perspective and not a gain from the other perspective. For example, program costs represent a cost to the government, but not to participants; thus, they are considered a cost to society. Factors that constitute a net gain from one perspective but a net loss from the other perspective result in a zero impact from a societal perspective. For example, a reduction in EI benefits may represent a cost to participants and a benefit to the government and neither a cost nor a benefit from a societal perspective.
Figure 4 illustrates the costs and benefits of the overall OF program from the perpective of the government and the participant. The total net benefit for the participant is $7,803 and the total net cost for the government is $888 over a 10-year, post participation period. This translates into a social net benefit (combining government and participant perspectives) of $6,915 or a social rate of returnFootnote 13 of 170% (9.44% per annumFootnote 14).
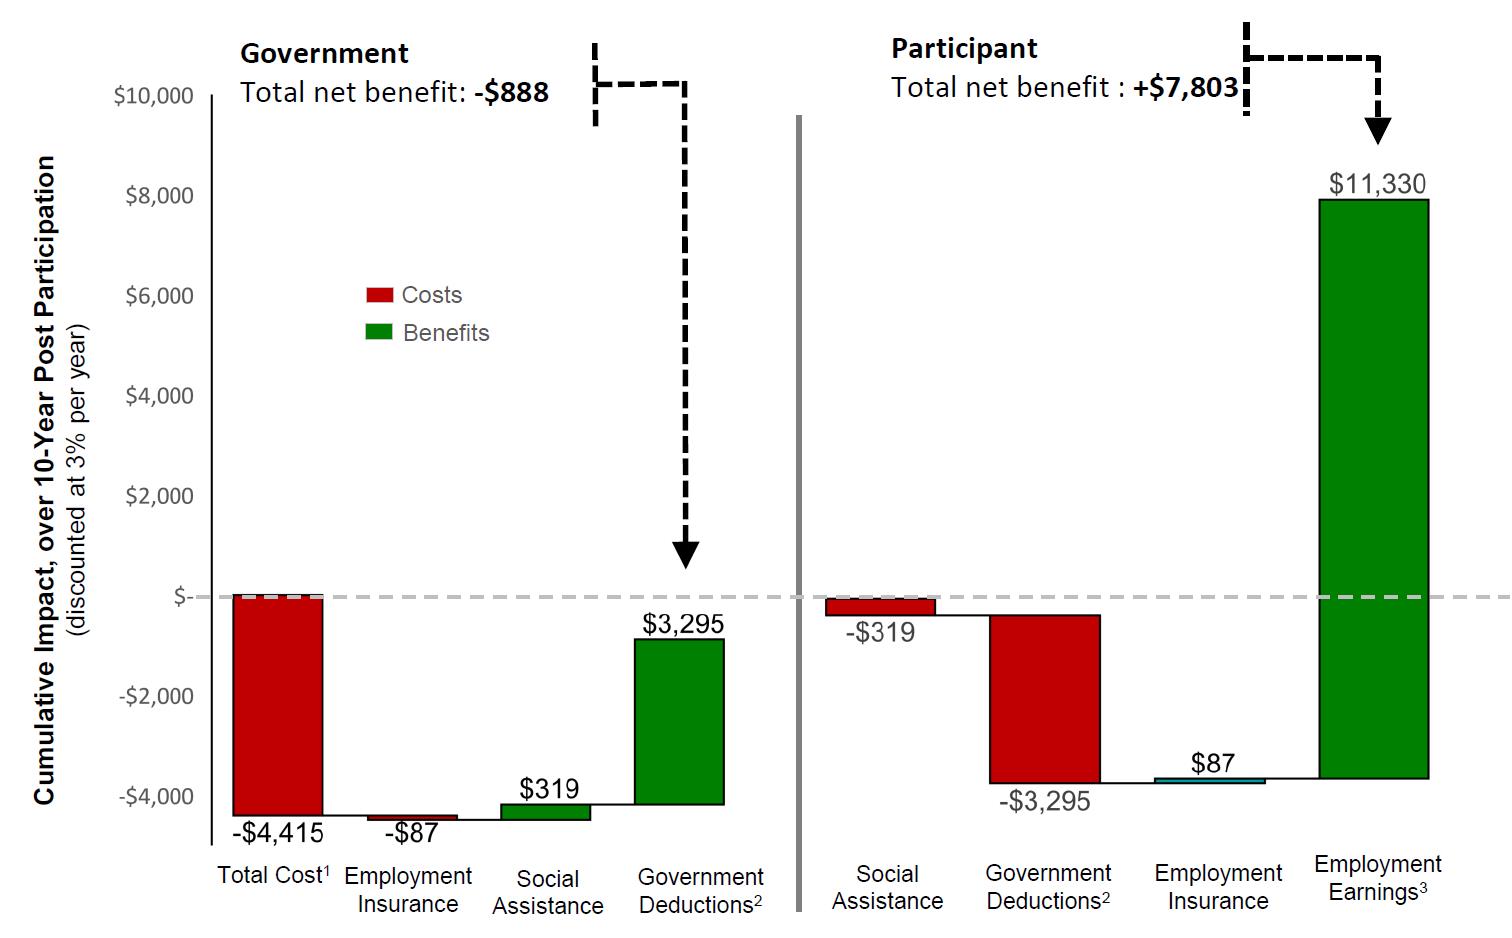
Text description of Figure 4
| Components analysis | Government |
|---|---|
| Total Cost ($) | -$ 4,415 |
| Employment Insurance ($) | -$ 87 |
| Social Assistance ($) | $ 319 |
| Government Deductions ($) | $ 3,295 |
| Net present value ($) | -$ 888 |
| Components analysis | Participant |
|---|---|
| Social Assistance ($) | -$ 319 |
| Government Deductions ($) | -$ 3,295 |
| Employment Insurance ($) | $ 87 |
| Employment Earnings ($) | $ 11,330 |
| Net present value ($) | $ 7,803 |
- Source: Labour Market Program Data Platform of Employment and Social Development Canada.
- Notes:
1. Total cost includes the direct program cost and the loss (indirect cost) incurred by society when raising additional revenues (defined as Marginal Social Cost of Public Fund which is 20% of the direct program cost), such as taxes to fund government spending. - 2. Government Deductions include EI premium, CPP/QPP contributions and income and sales tax
- 3. Employment Earnings include fringe benefits (for esample, employer paid health insurance, pension contributions) and earnings lost during time spent in the program.
Overall, $1 of investment in the OF program yields a return of $1.7 over the 10-year period following the intervention. From a societal perspective, the discounted benefits of the OF program exceeds the program costs in 3.8 years. All interventions had a positive social rate of return (Figure 5) and Skills for Employment intervention yielded the highest social return ($4.4) among all types of interventions.
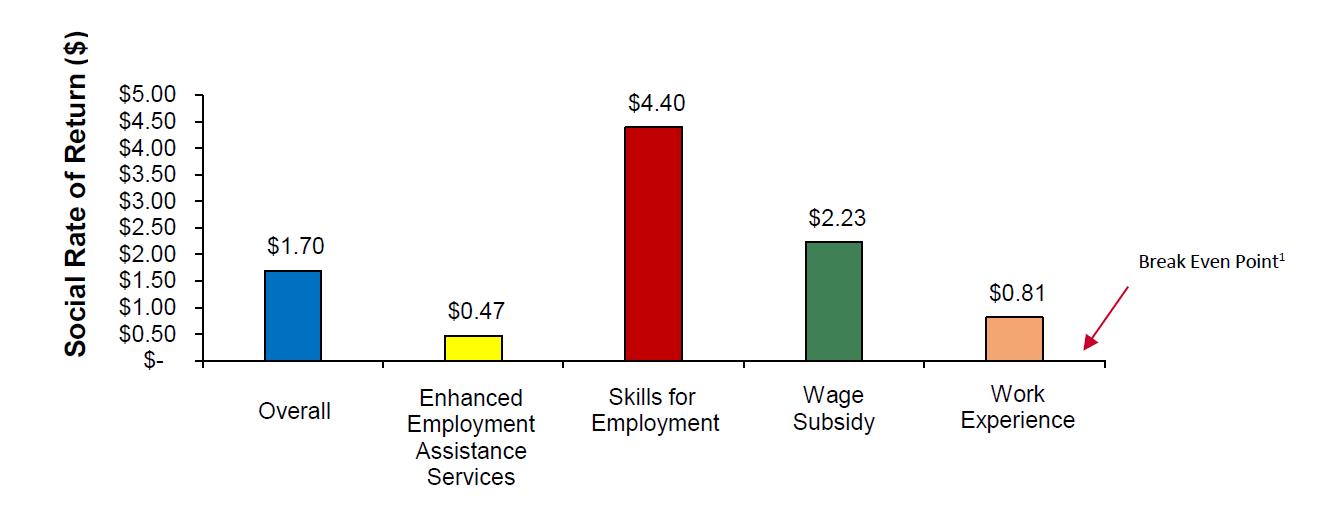
Text description of Figure 5
| Social return among different intervention types | Overall | Enhanced Employment Assistance Services | Skills for Employment | Targeted Work Subsidy | Work Experience |
|---|---|---|---|---|---|
| Social Return ($) | $ 1.70 | $ 0.47 | $ 4.40 | $ 2.23 | $ 0.81 |
- Source: Labour Market Program Data Platform of Employment and Social Development Canada.
- Note: Footnote 1The break even point occurs when the amount of investment made by the government generates an equal amount of benefits for society.
The cost-benefit analysis accounted for all quantifiable costs and benefits directly attributable to the program using the available data. The cost-benefit analysis is based on major quantifiable costs and benefits available in the administrative database. It does not include intangible benefits such as higher well-being for individuals related to better health outcomes.
In addition to producing improvements in labour market indicators, it is likely that active labour market programming such as the Opportunities Fund also has positive influences on additional social outcomes such as health. According to research evidence, labour market participation and higher income is associated with better health outcomes (for example, Canadian Institute for Health Information, 2015; Saunders & al. 2017). Therefore, expanding the cost-benefit framework to include potential savings resulting from improved health outcomes (in other words, reduced health system expenditures) could yield additional positive impacts for both individuals and the government beyond what is directly measured.
7 . Conclusion
The Opportunities Fund program led to a substantial gain in employment earnings, increased labor market attachment and reduced dependence on social assistance income of participants compared to the comparison group. The positive impacts observed are consistent across intervention types. The net impact analysis and cost-benefit analysis of the OF program generated robust evaluation results, deomonstrating that the program improves labour market attachment and yields a positive social return on investment.
The main estimation method used to determine the net impacts was propensity score kernel matching combined with the difference-in-differences technique. The econometric model was based on rich information about individuals’ labour market experience, including socio-demographic characteristics as well as labour market history. Other factors, such as severity of disability or education could also affect both participation and outcomes. However, these factors are not captured in the available data, and therefore may induce some bias in the results to the extent that they may not be equally distributed among participant and comparison groups.
Cost-benefit analysis shows that over the 10-year post participation period, the Opportunities Fund program yielded a significant net positive return on investment. From a societal perspective, benefits outweigh their associated costs in less than 4 years. Overall, $1 of investment in the Opportunities Fund program yields $1.7 in return over a 10-year period following the intervention.
The findings of the net impact analysis of the Opportunities Fund are consistent with the literature and previous evaluation studies of labour market programs employing similar techniques and methodologies. The Opportunities Fund facilitates the transition of persons with disabilities into the labour market, with associated positive long-term impacts.
References
CALIENDO, M., AND S. KOPEINIG (2005): “Some Practical Guidance for the Implementation of Propensity Score Matching,” Discussion Paper No. 1588, IZ
FREDRIKSSON, A. AND OLIVEIRA, G.M.D. (2019), "Impact evaluation using Difference-in-Differences", RAUSP Management Journal, Vol. 54 No. 4, pp. 519-532. https://doi.org/10.1108/RAUSP-05-2019-0112
EDGAR K. BROWNING (1987), “COMPARING MONOPOLY AND COMPETITION: THE INCREASING‐COST CASE,” Western Economic Association International, Volume 25, Issue 3, pp. 535-542.
HECKMAN, J. J. AND J. A. SMITH (1999): “The Pre-Program Earnings Dip and the Determinants of Participation in a Social Program: Implications for Simple Program Evaluation Strategies,” Economic Journal, 109(457), 313–348.
HERNÁN MA, ROBINS JM (2020). “Causal Inference: What If. Boca Raton: Chapman & Hall/CRC,” July 31, 2020
HÖFLER, M. (2005), “Causal inference based on counterfactuals,” BMC Med Res Methodol 5, 28. https:// doi.org/10.1186/1471-2288-5-28
KLUVE, J. Youth labor market interventions. IZA World of Labor 2014: 106 doi: 10.15185/izawol.106
KLUVE, J, PUERTO, S et al. 2016, Interventions to improve the labour market outcomes of youth: a systematic review of training, entrepreneurship promotion, employment services and subsidized employment interventions, Campbell systematic reviews, ILO, Geneva, viewed 27 Feb 2020, http://www.ilo.org/employment/Whatwedo/Publications/WCMS_508938/lang--en/index.htm .
LECHNER, M. (2010) "The Estimation of Causal Effects by Difference-in-Difference Methods," University of St. Gallen Department of Economics working paper series 2010 2010-28, Department of Economics, University of St. Gallen, revised Oct 2011.
LECHNER, M. and C. WUNSCH (2011) “Sensitivity of Matching-Based Program Evaluations of the Availability of Control Variables,” CESifo Working Paper No. 3381.
LEUNG, K. (2004): “Special Issue on Psychology of Severe Acute Respiratory Syndrome,” Asian Journal of Social Physiology, Volume 7, Issue 1, pp. 1-1.
LOCHNE, L. (2004): “Education, work and crime: Theory and evidence,” International Economic Review 45, 811-843.
ROSENBAUM, P. R. AND D. B. RUBIN (1983): “The Central Role of the Propensity Score in Observational Studies for Causal Effects,” Biometrika, 70(1), 41–50.
RYAN, A.M., KONTOPANTELIS, E., LINDEN, A. AND BURGESS, J.F. JR (2018): “Now trending: Coping with Non-Parallel Trends in Difference-in-Differences Analysis,” Statistical Methods in Medical Research, 3697-3711.
WING, C., SIMON, K. AND RICARDO A. BELLO-GOMEZ (2018): “Designing Difference in Difference Studies: Best Practices for Public Health Policy Research,” Annual Review of Public Health, 39(1), 453-469.
Appendix A: Detailed results on socio-demographic characteristics
| Gender | Overall (N=8804) | Comparison group (N=13017) | OF-EEAS (N=5567) | Comparison group (N=8272) | OF-SFE (N=1135) | Comparison group (N=3102) | OF-WS (N=701) | Comparison group (N=2518) | OF-WE (N=850) | Comparison group (N=2539) |
|---|---|---|---|---|---|---|---|---|---|---|
| Male | 52% | 50% | 53% | 52% | 44% | 44% | 55% | 53% | 52% | 52% |
| Female | 46% | 45% | 45% | 46% | 48% | 47% | 40% | 40% | 46% | 46% |
- Source: Labour Market Program Data Platform of Employment and Social Development Canada.
| Age Distribution | Overall (N=8804) | Comparison group (N=13017) | OF-EEAS (N=5567) | Comparison group (N=8272) | OF-SFE (N=1135) | Comparison group (N=3102) | OF-WS (N=701) | Comparison group (N=2518) | OF-WE (N=850) | Comparison group (N=2539) |
|---|---|---|---|---|---|---|---|---|---|---|
| Under 30 | 36% | 37% | 37% | 36% | 24% | 27% | 44% | 42% | 51% | 50% |
| 31-54 | 51% | 50% | 50% | 51% | 63% | 59% | 47% | 47% | 41% | 42% |
| 55 and Over | 11% | 11% | 11% | 11% | 12% | 12% | 7% | 10% | 6% | 6% |
- Source: Labour Market Program Data Platform of Employment and Social Development Canada.
| Disability Types* | Overall (N=8804) | Comparison group (N=13017) | OF-EEAS (N=5567) | Comparison group (N=8272) | OF-SFE (N=1135) | Comparison group (N=3102) | OF-WS (N=701) | Comparison group (N=2518) | OF-WE (N=850) | Comparison group (N=2539) |
|---|---|---|---|---|---|---|---|---|---|---|
| Developmental | 12% | 14% | 13% | 13% | 4% | 5% | 14% | 14% | 21% | 21% |
| Learning | 8% | 7% | 10% | 8% | 5% | 6% | 5% | 6% | 8% | 9% |
| Psychiatric | 24% | 22% | 25% | 26% | 24% | 23% | 11% | 11% | 26% | 25% |
| Physical** | 19% | 16% | 20% | 20% | 19% | 17% | 13% | 13% | 9% | 9% |
| Unspecified | 36% | 41% | 32% | 33% | 47% | 49% | 58% | 57% | 35% | 35% |
- Source: Labour Market Program Data Platform of Employment and Social Development Canada.
- Note: *Disability Type was categorized into 5 broad categories from the original 11. This was done mainly to align with the data in the comparison group file.
- **Physical includes hearing, speaking, motor skills, agility, and physical.
| Other socio demographics characteristics | Overall (N=8804) | Comparison group (N=13017) | OF-EEAS (N=5567) | Comparison group (N=8272) | OF-SFE (N=1135) | Comparison group (N=3102) | OF-WS (N=701) | Comparison group (N=2518) | OF-WE (N=850) | Comparison group (N=2539) |
|---|---|---|---|---|---|---|---|---|---|---|
| Aboriginal Status | 5% | 6% | 6% | 6% | 3% | 4% | 4% | 4% | 7% | 8% |
| Visible minority | 7% | 7% | 9% | 8% | 6% | 6% | 2% | 3% | 3% | 3% |
| Immigration Status | 0% | 0% | 0% | 0% | 0% | 0% | 0% | 0% | 0% | 0% |
- Source: Labour Market Program Data Platform of Employment and Social Development Canada.
| Province/Territory | Overall (N=8804) | Comparison group (N=13017) | OF-EEAS (N=5567) | Comparison group (N=8272) | OF-SFE (N=1135) | Comparison group (N=3102) | OF-WS (N=701) | Comparison group (N=2518) | OF-WE (N=850) | Comparison group (N=2539) |
|---|---|---|---|---|---|---|---|---|---|---|
| Newfoundland and Labrador | 2% | 0% | 2% | 0% | 2% | 0% | 9% | 1% | 2% | 1% |
| Prince Edward Island | 1% | 1% | 2% | 1% | 1% | 2% | 1% | 2% | 0% | 2% |
| Nova scotia | 4% | 10% | 0% | 7% | 10% | 12% | 6% | 13% | 19% | 21% |
| New Brunswick | 4% | 0% | 5% | 0% | 1% | 1% | 2% | 1% | 3% | 1% |
| Quebec | 10% | 10% | 3% | 4% | 0% | 1% | 40% | 37% | 44% | 41% |
| Ontario | 40% | 35% | 51% | 47% | 29% | 29% | 7% | 7% | 1% | 2% |
| Manitoba | 6% | 6% | 9% | 9% | 1% | 2% | 1% | 1% | 1% | 4% |
| Saskatchewan | 7% | 2% | 10% | 3% | 1% | 1% | 1% | 0% | 3% | 1% |
| Alberta | 10% | 16% | 12% | 21% | 7% | 7% | 3% | 5% | 13% | 13% |
| British Columbia | 15% | 19% | 5% | 8% | 47% | 45% | 29% | 31% | 11% | 13% |
| The North | 0% | 0% | 0% | 0% | 0% | 0% | 0% | 0% | 0% | 2% |
- Source: Labour Market Program Data Platform of Employment and Social Development Canada.
| Total Employment Income 1-year before participation | Overall (N=8804) | Comparison group (N=13017) | OF-EEAS (N=5567) | Comparison group (N=8272) | OF-SFE (N=1135) | Comparison group (N=3102) | OF-WS (N=701) | Comparison group (N=2518) | OF-WE (N=850) | Comparison group (N=2539) |
|---|---|---|---|---|---|---|---|---|---|---|
| No Earnings | 58% | 58% | 59% | 59% | 53% | 55% | 52% | 53% | 67% | 63% |
| Had Earnings | 41% | 41% | 40% | 40% | 46% | 44% | 48% | 47% | 33% | 36% |
| $1 to $5k | 61% | 53% | 60% | 54% | 58% | 59% | 66% | 56% | 71% | 72% |
| $5k to $10k | 18% | 19% | 18% | 18% | 21% | 17% | 19% | 25% | 19% | 16% |
| $10k to $15k | 9% | 12% | 9% | 12% | 10% | 10% | 7% | 10% | 7% | 7% |
| $15k to $20k | 4% | 6% | 5% | 6% | 5% | 6% | 4% | 4% | 2% | 3% |
| $20k to $25k | 2% | 3% | 3% | 3% | 3% | 3% | 2% | 2% | 0% | 2% |
| Over $25k | 5% | 6% | 6% | 6% | 3% | 5% | 3% | 3% | 1% | 1% |
- Source: Labour Market Program Data Platform of Employment and Social Development Canada.
| Total Employment Income 2-year before participation | Overall (N=8804) | Comparison group (N=13017) | OF-EEAS (N=5567) | Comparison group (N=8272) | OF-SFE (N=1135) | Comparison group (N=3102) | OF-WS (N=701) | Comparison group (N=2518) |
|---|---|---|---|---|---|---|---|---|
| No Earnings | 60% | 56% | 60% | 56% | 53% | 53% | 58% | 56% |
| Had Earnings | 39% | 43% | 39% | 43% | 46% | 46% | 42% | 43% |
| $1 to $5k | 56% | 51% | 56% | 52% | 52% | 53% | 62% | 54% |
| $5k to $10k | 18% | 19% | 18% | 17% | 21% | 19% | 16% | 21% |
| $10k to $15k | 9% | 11% | 8% | 11% | 10% | 10% | 10% | 9% |
| $15k to $20k | 5% | 7% | 5% | 7% | 6% | 7% | 4% | 6% |
| $20k to $25k | 3% | 4% | 4% | 4% | 4% | 5% | 2% | 4% |
| Over $25k | 8% | 8% | 9% | 8% | 7% | 7% | 6% | 6% |
- Source: Labour Market Program Data Platform of Employment and Social Development Canada.
| Employment Insurance (EA) and Social Assistance (SA) | Overall (N=8804) | Comparison group (N=13017) | OF-EEAS (N=5567) | Comparison group (N=8272) | OF-SFE (N=1135) | Comparison group (N=3102) | OF-WS (N=701) | Comparison group (N=2518) | OF-WE (N=850) | Comparison group (N=2539) |
|---|---|---|---|---|---|---|---|---|---|---|
| Received EI 1 year Prior | 0% | 0% | 0% | 0% | 0% | 0% | 0% | 0% | 0% | 0% |
| Received EI 2 year Prior | 0% | 0% | 0% | 0% | 0% | 1% | 0% | 0% | 0% | 0% |
| Received SA 1 year Prior | 54% | 50% | 54% | 53% | 54% | 54% | 51% | 51% | 58% | 58% |
| Received SA 2 year Prior | 49% | 46% | 49% | 49% | 50% | 49% | 46% | 46% | 51% | 51% |
- Source: Labour Market Program Data Platform of Employment and Social Development Canada.
Appendix B: Net impacts results
| Indicators | Program start year | 1 yr post-program | 2 yr post-program | 3 yr post-program | 4 yr post-program | 5 yr post-program | Cumulative in and post-program (0 to 5) | Annual average post-program (1 to 5) |
|---|---|---|---|---|---|---|---|---|
| Employment earnings ($) | -32.5 | 143.27 | 566.54** | 801.95*** | 790.65*** | 550.98* | 2836.11*** | 567.22*** |
| Incidence of employment (percentage point) | 2.88** | 6.79*** | 3.77** | 4.08** | 0.27 | 0.84 | N/A | 3.05** |
| EI benefits ($) | -11.5** | -18.04 | 8.27 | 16.72* | -3.02 | 3.89 | 16.02 | 3.2 |
| SA benefits ($) | 491.34*** | 285.37* | 235.42* | 306.02** | 80.8 | -1.99 | 910.93 | 182.19 |
| Dependence on income support (percentage point)1 | 2.57** | 2.98** | 1.86 | 1.87 | 1.26 | 1.46 | N/A | 1.85 |
- Source: Labour Market Program Data Platform of Employment and Social Development Canada.
- Note: Significance level: ***1%, **5%, *10%
| Indicators | Program start year | 1 yr post-program | 2 yr post-program | 3 yr post-program | 4 yr post-program | 5 yr post-program | Cumulative in and post-program (0 to 5) | Annual average post-program (1 to5) |
|---|---|---|---|---|---|---|---|---|
| Employment earnings ($) | 50.17 | 1782.78*** | 3977.15*** | 4489.25*** | 4011.71*** | 4230.4*** | 18459.97*** | 3691.99*** |
| Incidence of employment (percentage point) | -2.18 | 8.52*** | 11.36*** | 9.51*** | 9.12*** | 10.47*** | N/A | 9.82*** |
| EI benefits ($) | -9.15 | 15.98 | 16.15 | 10.4 | 60.12* | 51.34** | 135.92* | 27.18* |
| SA benefits ($) | 381.17** | -170.02 | -467.68*** | -455.67** | -467.45** | -356.07* | -1975.7*** | -395.14*** |
| Dependence on income support (percentage point)1 | 3.43 | -3.44 | -9.62** | -11.39** | -8.62* | -7.53* | N/A | -8.04* |
- Source: Labour Market Program Data Platform of Employment and Social Development Canada.
- Note: Significance level: ***1%, **5%, *10%
| Indicators | Program start year | 1 yr post-program | 2 yr post-program | 3 yr post-program | 4 yr post-program | 5 yr post-program | Cumulative in and post-program (0 to 5) | Annual average post-program (1 to 5) |
|---|---|---|---|---|---|---|---|---|
| Employment earnings ($) | 3260.51*** | 3041.31*** | 2405.31*** | 1956.62*** | 1839.79*** | 1550.38*** | 10816.42*** | 2163.28*** |
| Incidence of employment (percentage point) | 38.15*** | 26.33*** | 17.37*** | 13.68*** | 11.36*** | 13.46*** | N/A | 16.45*** |
| EI benefits ($) | 39.84 | 85.51* | 48.73 | 12.52 | 75.44* | 20.9 | 242.64** | 48.53** |
| SA benefits ($) | -351.82*** | -648.81*** | -423.44** | -237.78 | -280.94 | -75.57 | -1696* | -339.2* |
| Dependence on income support (percentage point)1 | -13.7*** | -8*** | -4.67*** | -2.91 | -4.17** | -1.17 | N/A | -4.21*** |
- Source: Labour Market Program Data Platform of Employment and Social Development Canada.
- Note: Significance level: ***1%, **5%, *10%
| Indicators | Program start year | 1 yr post-program | 2 yr post-program | 3 yr post-program | 4 yr post-program | 5 yr post-program | Cumulative in and post-program (0 to 5) | Annual average post-program (1 to 5) |
|---|---|---|---|---|---|---|---|---|
| Employment earnings ($) | 1373.11*** | 1455.78*** | 795.46** | 583.07* | 621.7* | 298.92 | 3721.64** | 744.33** |
| Incidence of employment (percentage point) | 27.46*** | 21*** | 12.91*** | 8.03*** | 4.91** | 4.27* | N/A | 10.14*** |
| EI benefits ($) | 25.56 | 14.52 | 12.7 | 26.7 | -3.93 | 32.64 | 83.32 | 16.66 |
| SA benefits ($) | -1.24 | -589.14*** | -184.69 | -245.93 | -191.81 | -217.78 | -1450.02 | -290 |
| Dependence on income support (percentage point)1 | -10.58*** | -10.53*** | -6.01** | -6.86** | -5.84** | -4.37 | N/A | -6.72*** |
- Source: Labour Market Program Data Platform of Employment and Social Development Canada.
- Note: Significance level: ***1%, **5%, *10%
Appendix C: Distribution of propensity score before and after matching
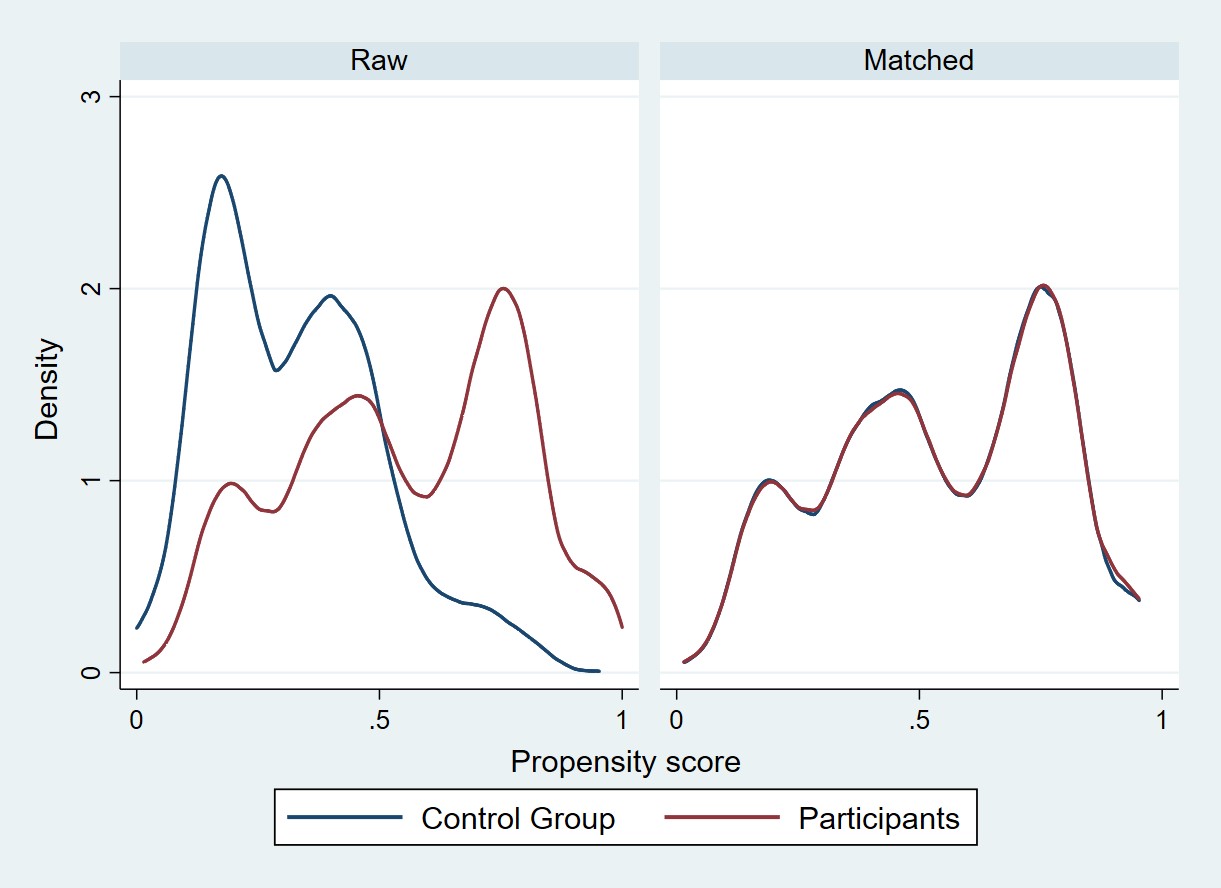
Text description of Figure C1
This figure demonstrates a visual inspection of the density distribution of the propensity score in participants and control group before and after the matching for OF-EEAS program. The left panel denoted as ‘Raw’ represents density distribution before matching and the right panel denoted as ‘Matched’ represents density distribution after matching. After matching, we observe a large overlap between the participants and control group, and therefore a correspondingly high capacity to find suitable matches.
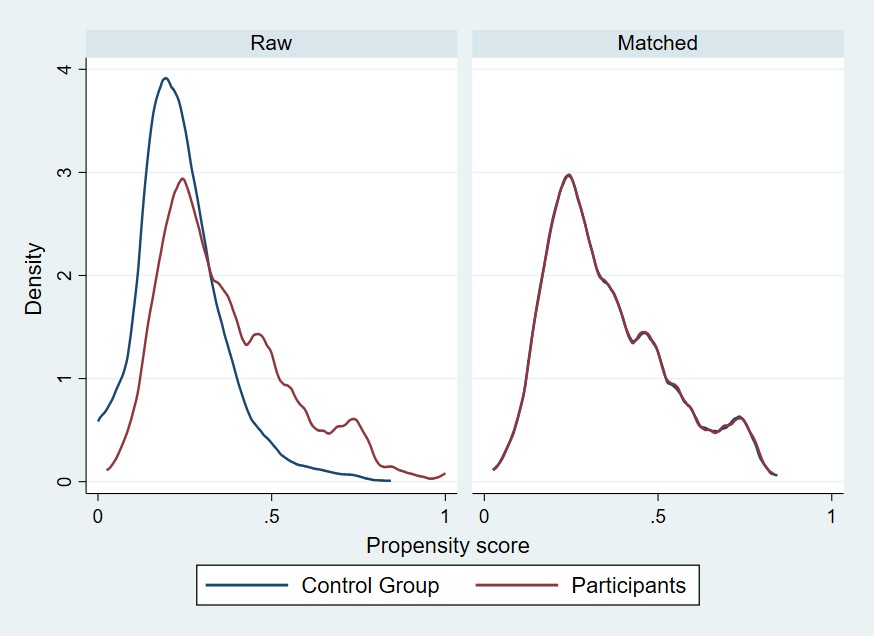
Text description of Figure C2
This figure demonstrates a visual inspection of the density distribution of the propensity score in participants and control group before and after the matching for OF-SEF program. The left panel denoted as ‘Raw’ represents density distribution before matching and the right panel denoted as ‘Matched’ represents density distribution after matching. After matching, we observe a large overlap between the participants and control group, and therefore a correspondingly high capacity to find suitable matches.
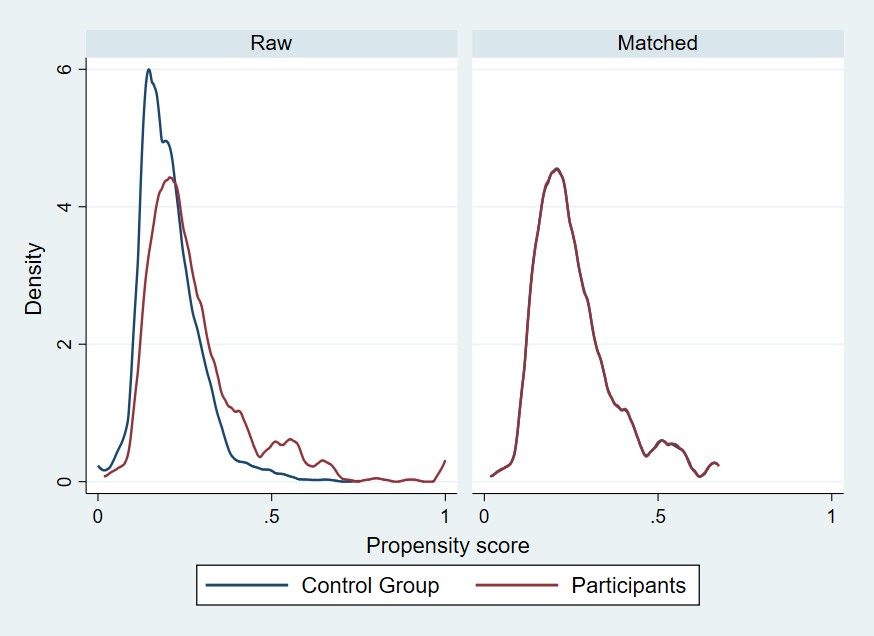
Text description of Figure C3
This figure demonstrates a visual inspection of the density distribution of the propensity score in participants and control group before and after the matching for OF-WS program. The left panel denoted as ‘Raw’ represents density distribution before matching and the right panel denoted as ‘Matched’ represents density distribution after matching. After matching, we observe a large overlap between the participants and control group, and therefore a correspondingly high capacity to find suitable matches.
Text description of Figure C4
This figure demonstrates a visual inspection of the density distribution of the propensity score in participants and control group before and after the matching for OF-WE program. The left panel denoted as ‘Raw’ represents density distribution before matching and the right panel denoted as ‘Matched’ represents density distribution after matching. After matching, we observe a large overlap between the participants and control group, and therefore a correspondingly high capacity to find suitable matches.