
Towards a Poverty Reduction Strategy – A backgrounder on poverty in Canada

Large print, braille, MP3 (audio), e-text and DAISY formats are available on demand by ordering online or calling 1 800 O-Canada (1-800-622-6232). If you use a teletypewriter (TTY), call 1-800-926-9105.
- Large print, braille, audio cassette, audio CD, e-text diskette, e-text CD and DAISY are available on demand.
On this page
- Measures of low income in Canada
- Situation of low income over time
- Canadians living in persistent poverty
- Characteristics of Canadians more likely to be living in low income
- The working poor
- Upward income mobility
- Poverty beyond income in everyday life
- Have your say
- Annex 1: Number and incidence of people below the Low Income Cut-offs, selected groups, 2014
Measures of low income in Canada
Overall low income in Canada – 2014
Low income cut-offs: 8.8% – 3.0 million Canadians
Market basket measure: 11.3% – 3.9 million Canadians
Low income measure: 13.0% – 4.5 million Canadians
The Government of Canada does not have an official definition of poverty. However, poverty is often assessed by measuring the number of Canadians with low incomes. There are several indicators used to measure low income:
Low income cut-offs
The Low Income Cut-offs are income thresholds below which a family will devote a larger share of its income on the necessities of food, shelter and clothing than the average family.Footnote 1
- A family is considered low income if it spends 20 percentage points more on these necessities than the average family. It is a relative measure of low income.
- Since data is available as far back as 1976, it is frequently used to examine low-income trends over several years.
- The Low Income Cut-offs are adjusted for seven family sizes and five different community sizes to capture differences in the cost of living.
Market basket measure
The Market Basket Measure defines low income based on a specific set of goods and services that represent a basic standard of living.
- A family is considered low income if it does not have enough money to buy these specific goods and services in its community. It is an absolute measure of low income.
- This indicator is available for 49 different communities across Canada and is more sensitive to differences in the cost of living.
- Data is available since 2002.
Low income measure
The Low Income Measure defines low income as being below a fixed percentage of income.
- A household is considered low income if its income is below 50% of median household incomes. It is, therefore, a relative measure of low income.
- Since many countries report low income on this basis, it is frequently used for international comparisons.
- This data is also available since 1976.
These indicators can generally be adjusted for household or family size and can be used to measure low income among specific categories of individuals. This document mostly uses Low Income Cut-offs calculated on the basis of after tax income because it is the most widely used measure of low income in Canada and allows for comparison over time. However, in the discussion on how Canada compares internationally, the Low Income Measure is used.
This document will focus on the groups of Canadians that are more likely to be living in poverty for long periods of time: single people aged 45–64, single parents, recent immigrants (those living in Canada for less than 10 years), people with disabilities and Indigenous people. Child poverty will also be discussed as the share of children living in poverty in Canada is higher than that of other industrialized countries such as Germany, the United Kingdom and France.Footnote 2 Annex 1 summarizes the number and incidence of low-income Canadians according to the Low Income Cut-offs for 2014.
Situation of low income over time
From an international perspective, Canada’s performance in terms of overall poverty rate is average – ranking 20th out of 31 industrialized countries in 2013 (Figure 1).
(Ratio of the number of people below the poverty line based on the Low Income Measure)
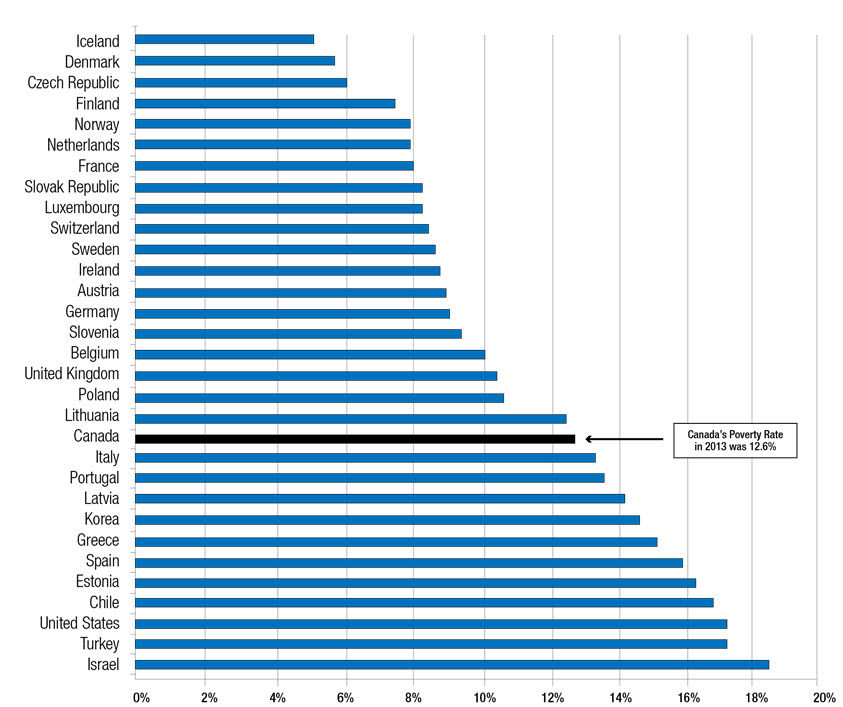
Figure 1 – Text description
| Country | Poverty Rate (%) |
| Iceland | 4.6 |
| Denmark | 5.4 |
| Czech Republic | 6.0 |
| Finland | 7.1 |
| Norway | 7.8 |
| Netherlands | 7.9 |
| France | 8.0 |
| Slovak Republic | 8.4 |
| Luxembourg | 8.4 |
| Switzerland | 8.6 |
| Sweden | 8.8 |
| Ireland | 8.9 |
| Austria | 9.0 |
| Germany | 9.1 |
| Slovenia | 9.5 |
| Belgium | 10.0 |
| United Kingdom | 10.4 |
| Poland | 10.5 |
| Lithuania | 12.4 |
| Canada | 12.6 |
| Italy | 13.3 |
| Portugal | 13.6 |
| Latvia | 14.1 |
| Korea | 14.6 |
| Greece | 15.1 |
| Spain | 15.9 |
| Estonia | 16.3 |
| Chile | 16.8 |
| United States | 17.2 |
| Turkey | 17.2 |
| Israel | 18.6 |
Source: OECD (2016), Poverty rate (indicator). doi: 10.1787/0fe1315d-en (Accessed on 20 September 2016).
The poverty rate is the ratio of the number of people whose income falls below the poverty line; taken as half the median household income of the total population. Two countries with the same poverty rates may differ in terms of the relative income-level of the poor.
In 2014, 8.8% of Canadians lived in low income based on the Low Income Cut-offs after tax. However, as Figure 2 shows, there has been a general downward trend in the percentage of Canadians living in low income since the mid-1990s. In the past, women were more likely to be living in low income than men, but today the percentage of women living in low income is about the same as that of men (Figure 2).
(Low income cut-offs – after tax, base year 1992)

Figure 2 – Text description
| Year | Low-Income Rate (%) for total population | Low-Income Rate (%) for males | Low-Income Rate (%) for females |
|---|---|---|---|
| 1976 | 13.0 | 11.1 | 14.8 |
| 1977 | 13.0 | 11.3 | 14.6 |
| 1978 | 12.2 | 10.6 | 13.7 |
| 1979 | 12.6 | 10.9 | 14.2 |
| 1980 | 11.6 | 9.7 | 13.4 |
| 1981 | 11.6 | 9.9 | 13.3 |
| 1982 | 12.4 | 10.9 | 13.9 |
| 1983 | 14.0 | 12.7 | 15.4 |
| 1984 | 13.7 | 12.3 | 15.1 |
| 1985 | 13.0 | 11.5 | 14.4 |
| 1986 | 12.1 | 10.9 | 13.2 |
| 1987 | 11.9 | 10.6 | 13.1 |
| 1988 | 10.8 | 9.3 | 12.3 |
| 1989 | 10.2 | 8.8 | 11.6 |
| 1990 | 11.8 | 10.4 | 13.2 |
| 1991 | 13.2 | 12.1 | 14.2 |
| 1992 | 13.3 | 12.2 | 14.3 |
| 1993 | 14.1 | 13.1 | 15.1 |
| 1994 | 14.0 | 12.9 | 15.1 |
| 1995 | 14.5 | 13.6 | 15.4 |
| 1996 | 15.2 | 14.2 | 16.2 |
| 1997 | 15.0 | 14.2 | 15.8 |
| 1998 | 13.7 | 12.9 | 14.5 |
| 1999 | 13.0 | 12.4 | 13.6 |
| 2000 | 12.5 | 11.4 | 13.6 |
| 2001 | 11.2 | 10.3 | 12.1 |
| 2002 | 11.6 | 10.7 | 12.4 |
| 2003 | 11.6 | 11.0 | 12.2 |
| 2004 | 11.4 | 10.8 | 11.9 |
| 2005 | 10.8 | 10.5 | 11.1 |
| 2006 | 11.5 | 11.2 | 11.8 |
| 2007 | 10.3 | 10.1 | 10.5 |
| 2008 | 9.7 | 9.2 | 10.2 |
| 2009 | 10.1 | 10.1 | 10.1 |
| 2010 | 9.6 | 9.3 | 9.8 |
| 2011 | 9.6 | 9.5 | 9.7 |
| 2012 | 10.0 | 9.7 | 10.3 |
| 2013 | 9.8 | 9.7 | 9.9 |
| 2014 | 8.8 | 8.8 | 8.7 |
Source: Statistics Canada, Canadian Income Survey, CANSIM table 206-0041.
Women have made significant gains in employment since 1976, but their employment rate (57%) continued to be below that of men (65%) in 2015.Footnote 3 Women are more likely than men to work in permanent part-time and temporary jobs (e.g. contract and casual jobs); they represent about 71% of permanent part-time workers and 51% of temporary workers. Generally, permanent part-time and temporary jobs pay less per hour and per week than full-time and permanent jobs.Footnote 4 In addition, women are more likely than men to work reduced hours or to miss work due to caregiving responsibilities.Footnote 5 Overall, women are also paid less than men, with women earning about 20% less. Women most affected by this earnings gap include immigrant and Indigenous women.Footnote 6
Over time, the share of seniors aged 65 and older living in low income has declined significantly (Figure 3). In 2014, 3.9% of seniors lived in low income, a rate that was significantly lower than that of children under the age of 18 (8.5%) and people aged 18–64 (10.0%).Footnote 7 However, some seniors still have higher rates of low income compared to the general population. As shown in Figure 3, in 2014, 11.3% of single seniors were living in low income, which was higher than the average for all seniors (3.9%) and for the total Canadian population (8.8%).
(Low income cut-offs – After tax, base year 1992)
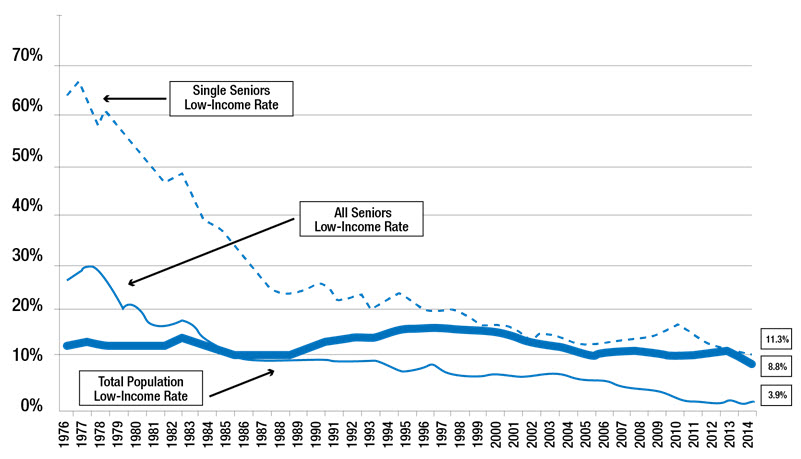
Figure 3 – Text description
| Year | Low-Income Rate (%) for total population | Low-Income Rate (%) for all seniors (aged 65 and older) | Low-Income Rate (%) for single seniors (aged 65 and older) |
|---|---|---|---|
| 1976 | 13.0 | 29.0 | 64.9 |
| 1977 | 13.0 | 30.4 | 66.0 |
| 1978 | 12.2 | 29.4 | 59.3 |
| 1979 | 12.6 | 26.1 | 60.9 |
| 1980 | 11.6 | 21.4 | 54.3 |
| 1981 | 11.6 | 21.0 | 49.7 |
| 1982 | 12.4 | 17.8 | 46.4 |
| 1983 | 14.0 | 19.4 | 48.7 |
| 1984 | 13.7 | 16.2 | 40.8 |
| 1985 | 13.0 | 14.7 | 39.0 |
| 1986 | 12.1 | 13.5 | 34.6 |
| 1987 | 11.9 | 12.6 | 32.3 |
| 1988 | 10.8 | 13.0 | 31.7 |
| 1989 | 10.2 | 11.3 | 28.8 |
| 1990 | 11.8 | 10.8 | 28.1 |
| 1991 | 13.2 | 11.1 | 29.1 |
| 1992 | 13.3 | 9.8 | 25.9 |
| 1993 | 14.1 | 10.7 | 27.4 |
| 1994 | 14.0 | 8.6 | 22.6 |
| 1995 | 14.5 | 8.7 | 24.1 |
| 1996 | 15.2 | 9.7 | 25.4 |
| 1997 | 15.0 | 9.0 | 22.4 |
| 1998 | 13.7 | 8.6 | 20.9 |
| 1999 | 13.0 | 7.9 | 21.1 |
| 2000 | 12.5 | 7.6 | 20.6 |
| 2001 | 11.2 | 6.7 | 18.1 |
| 2002 | 11.6 | 7.6 | 19.4 |
| 2003 | 11.6 | 6.8 | 17.7 |
| 2004 | 11.4 | 5.6 | 15.4 |
| 2005 | 10.8 | 6.2 | 18.5 |
| 2006 | 11.5 | 5.9 | 17.1 |
| 2007 | 10.3 | 5.6 | 16.1 |
| 2008 | 9.7 | 6.1 | 16.5 |
| 2009 | 10.1 | 5.8 | 15.9 |
| 2010 | 9.6 | 6.0 | 15.7 |
| 2011 | 9.6 | 6.5 | 18.0 |
| 2012 | 10.0 | 4.6 | 12.6 |
| 2013 | 9.8 | 3.7 | 10.7 |
| 2014 | 8.8 | 3.9 | 11.3 |
Source: Statistics Canada, Canadian Income Survey, CANSIM table 206-0041.
Canadians living in persistent poverty
Most low-income Canadians are poor for a short period of time, improving their incomes to exit low income within a year (Figure 4). For example, in the period between 2005 and 2010, only 1.5% of low-income Canadians lived in low income for up to 6 years based on the Low Income Cut-offs after tax.
(Low income cut-offs – after tax, base year 1992)
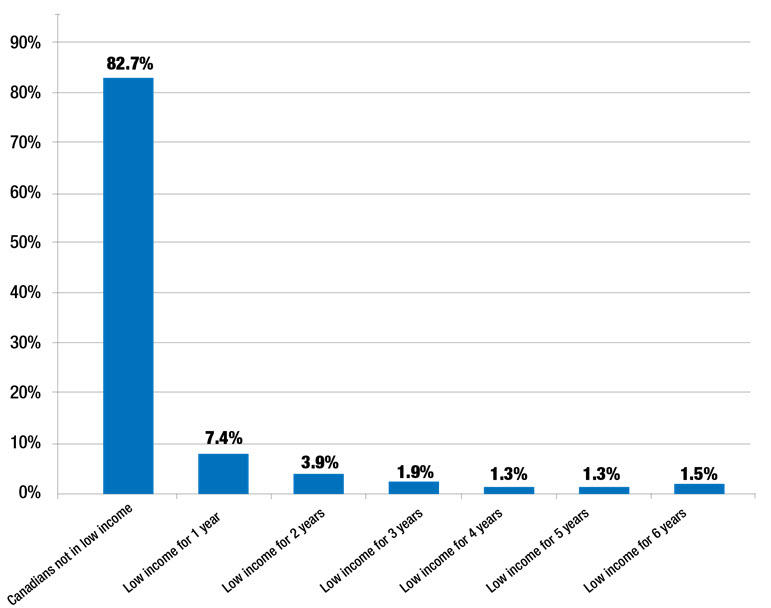
Figure 4 – Text description
| Number of years living in low income | Percentage (%) of Canadians |
|---|---|
| Canadians not in low income | 82.7 |
| In low income for 1 year | 7.4 |
| Low income for 2 years | 3.9 |
| Low income for 3 years | 1.9 |
| Low income for 4 years | 1.3 |
| Low income for 5 years | 1.3 |
| Low income for 6 years | 1.5 |
Source: Statistics Canada, Survey of Labour and Income Dynamics, CANSIM Table 202-0807. The Survey of Labour and Income Dynamics has been terminated. Effective with the 2012 reference year, only cross-sectional income estimates are available from the Canadian Income Survey.
The share of Canadians living in persistent poverty (i.e. low income for at least 3 years out of 6 years) has declined by almost half since the mid-1990s (Figure 5).
(Low income cut-offs – After tax, base year 1992)
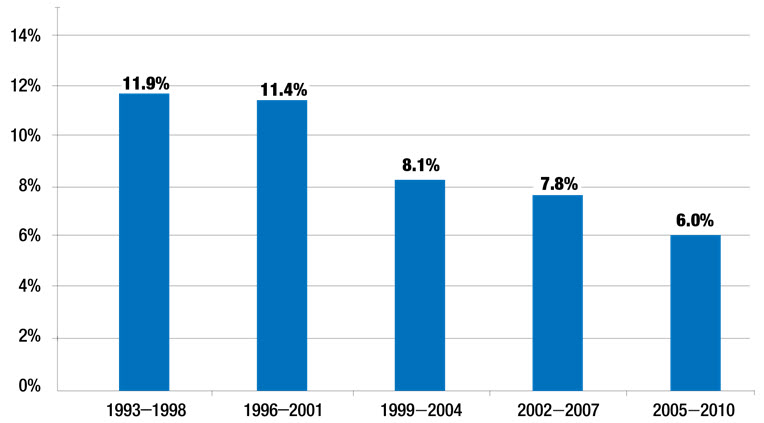
Figure 5 – Text description
| Time period | Percentage (%) of Canadians living in low income for at least 3 out of 6 years |
|---|---|
| 1993-1998 | 11.9 |
| 1996-2001 | 11.4 |
| 1999-2004 | 8.1 |
| 2002-2007 | 7.8 |
| 2005-2010 | 6.0 |
Source: Statistics Canada, Survey of Labour and Income Dynamics, CANSIM Table 202-0807. (The Survey of Labour and Income Dynamics has been terminated. Effective with the 2012 reference year, only cross-sectional income estimates are available from the Canadian Income Survey.)
Characteristics of Canadians more likely to be living in low income
Children
In 2014, over half a million children were living in low income, based on the Low Income Cut-offs after tax. However, as shown in Figure 6, the low-income rate of children has declined over time from 12.8% in 2006 (871,000) to 8.5% in 2014 (573,000). Figure 6 also shows that children under the age of 18 who live in families led by single women are also more likely to live in low income than children in families headed by a couple.
(Low income cut-offs – after tax, base year 1992)
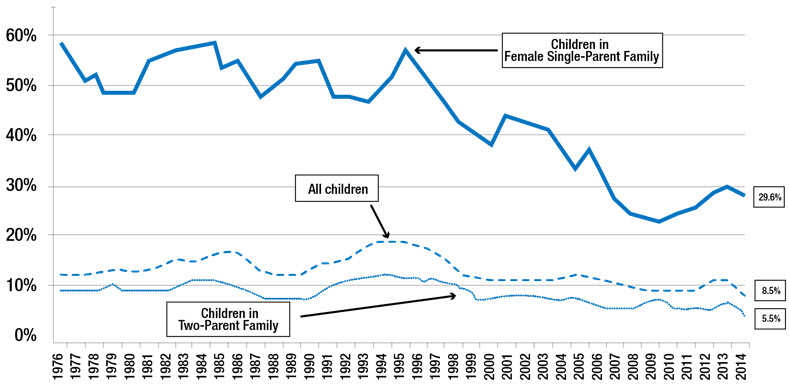
Figure 6 – Text description
| Year | Low-Income Rate (%) among all children | Low-Income Rate (%) among children living in a two-parent family | Low-Income Rate (%) among children living in a female-led single-parent family |
|---|---|---|---|
| 1976 | 13.4 | 9.3 | 58.7 |
| 1977 | 13.3 | 9.0 | 55.3 |
| 1978 | 12.5 | 8.1 | 50.4 |
| 1979 | 13.2 | 9.5 | 51.5 |
| 1980 | 12.1 | 8.0 | 48.6 |
| 1981 | 12.6 | 8.4 | 48.7 |
| 1982 | 14.2 | 9.5 | 53.9 |
| 1983 | 15.8 | 10.8 | 55.3 |
| 1984 | 16.2 | 10.7 | 56.3 |
| 1985 | 15.7 | 10.4 | 57.1 |
| 1986 | 13.9 | 9.3 | 52.5 |
| 1987 | 13.7 | 8.8 | 53.0 |
| 1988 | 12.2 | 7.3 | 49.4 |
| 1989 | 11.9 | 7.2 | 46.2 |
| 1990 | 14.0 | 8.4 | 51.2 |
| 1991 | 15.2 | 9.4 | 52.7 |
| 1992 | 15.1 | 9.1 | 48.8 |
| 1993 | 17.0 | 10.7 | 49.6 |
| 1994 | 16.3 | 10.6 | 48.2 |
| 1995 | 17.5 | 11.7 | 50.7 |
| 1996 | 18.4 | 11.6 | 56.0 |
| 1997 | 17.4 | 11.4 | 51.2 |
| 1998 | 15.7 | 10.0 | 46.2 |
| 1999 | 14.6 | 9.4 | 41.9 |
| 2000 | 13.9 | 9.5 | 40.1 |
| 2001 | 12.2 | 8.3 | 37.4 |
| 2002 | 12.4 | 7.4 | 43.0 |
| 2003 | 12.7 | 7.9 | 41.4 |
| 2004 | 13.0 | 8.4 | 40.4 |
| 2005 | 11.7 | 7.8 | 32.9 |
| 2006 | 12.8 | 9.0 | 36.6 |
| 2007 | 11.1 | 7.9 | 30.8 |
| 2008 | 9.4 | 6.9 | 25.2 |
| 2009 | 10.2 | 8.1 | 23.3 |
| 2010 | 8.7 | 6.3 | 23.6 |
| 2011 | 9.3 | 6.8 | 25.8 |
| 2012 | 10.7 | 8.2 | 30.1 |
| 2013 | 11.1 | 8.6 | 29.4 |
| 2014 | 8.5 | 5.5 | 29.6 |
Source: Statistics Canada, Canadian Income Survey, CANSIM Table 206-0041.
Vulnerable groups
While the low-income rate in Canada is about 8.8%, some groups of Canadians have significantly higher rates of low income. As shown in Figure 7, unattached people aged 45 to 64, single parents, recent immigrants, Indigenous people (First Nations, Métis and Inuit) living off reserve and people with disabilities are more likely to be poor.Footnote 8
(Low income cut-offs – after tax, base year 1992)
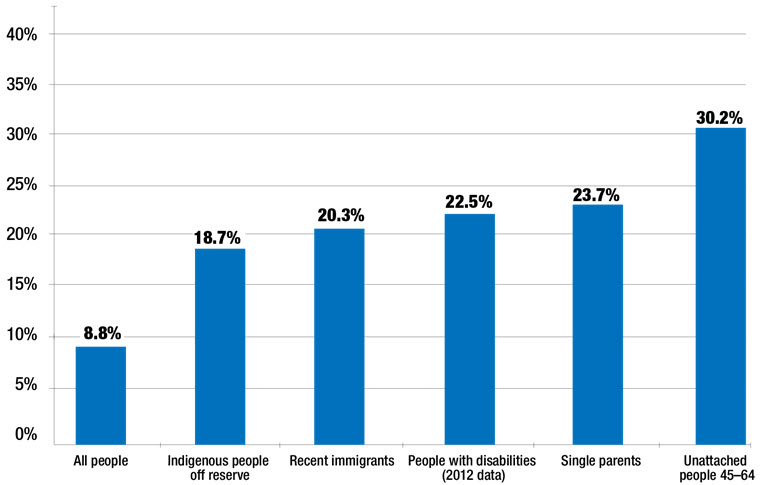
Figure 7 – Text description
| Population group | Low-Income Rates (%) |
|---|---|
| All people | 8.8 |
| Indigenous people off reserve | 18.7 |
| Recent immigrants | 20.3 |
| People with disabilities (2012 data) | 22.5 |
| Single parents | 23.7 |
| Unattached people 45-64 | 30.2 |
Source: Statistics Canada, custom tabulation based on Canadian Income Survey, 2014. Data for people with disabilities is only available for 2012.
Indigenous people
Low-income data for First Nations on reserve and people living in the territories, including the Inuit in Nunavut, is not published on an annual basis by Statistics Canada. Further, incomes on reserve and in the territories are affected by the use of in-kind transfers such as band housing, the use of products from hunting, trapping, fishing and harvesting, and the existence of bartering for goods and services. The spending patterns of First Nations on reserve and people living in the territories are also different from those of their peers living off reserve and in the provinces. First Nations on reserve have access to band housing and may not have to spend as much of their income on housing as their peers living off reserve. However, living conditions on reserve and statistics on educational and employment outcomes suggest that the poverty rate on reserve is higher than off reserve.
Today, having a higher level of education, such as a college or university degree, improves the possibility of finding a good-quality job and exiting poverty. As shown in Figure 8, while only 12% of the overall population does not hold a high school diploma, this proportion is significantly higher for Indigenous people, particularly First Nations on reserve (47%) and Inuit (49%).
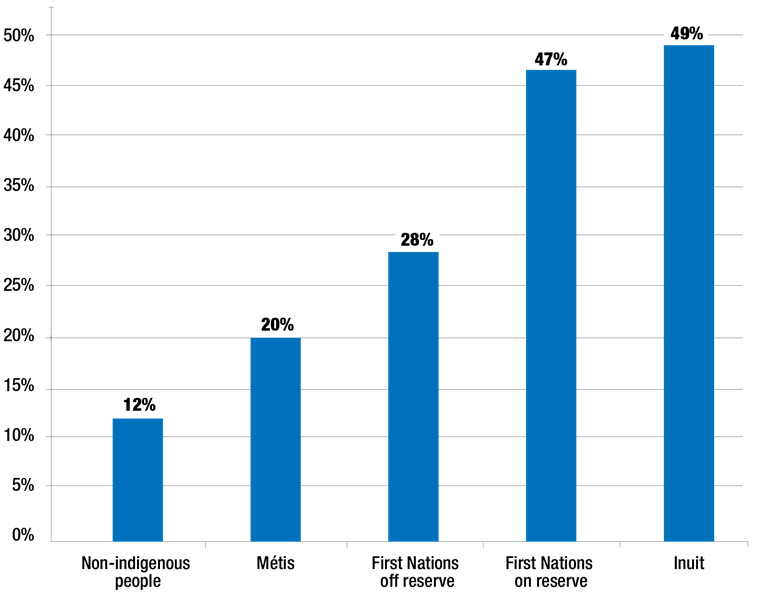
Figure 8 – Text description
| Population by indigenous identity | Percentage (%) of 25–64 year olds without a high school diploma |
|---|---|
| Non-Indigenous people | 12 |
| Métis | 20 |
| First Nations off reserve | 28 |
| First Nations on reserve | 47 |
| Inuit | 49 |
Source: Statistics Canada, National Household Survey, 2011. Data for First Nations includes only registered and treaty First nations.
In 2011, the unemployment rate for Indigenous people was much higher than that of the non Indigenous population (Figure 9). Among Indigenous people, Inuit and First Nations on reserve had the highest rates of unemployment. For instance, First Nations aged 15 and older living on reserve had an unemployment rate of 25.2% and the Inuit had an unemployment rate of 19.6%. However, unemployment decreases significantly as level of education increases (Figure 10).
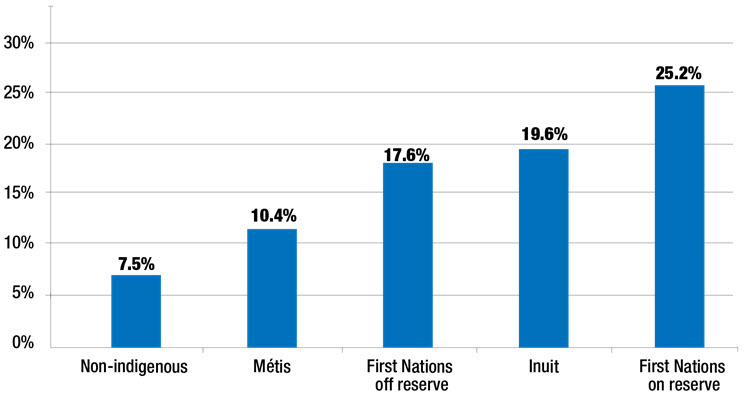
Figure 9 – Text description
| Population by indigenous identity | Unemployment rate (%) for population aged 15 and older |
|---|---|
| Non-Indigenous | 7.5 |
| Métis | 10.4 |
| First Nations off reserve | 17.6 |
| Inuit | 19.6 |
| First Nations on reserve | 25.2 |
Source: Statistics Canada, National Household Survey, 2011.
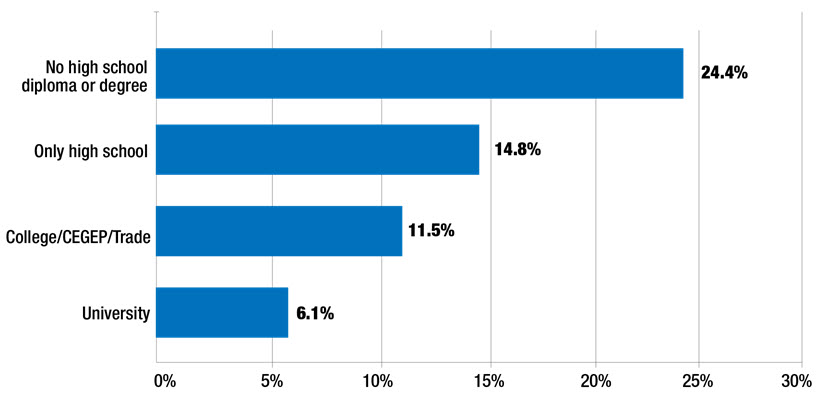
Figure 10 – Text description
| Level of education | Unemployment rate (%) among the indigenous population aged 15 and older |
|---|---|
| No high school diploma or degree | 24.4 |
| Only high school | 14.8 |
| College/CEGEP/Trade | 11.5 |
| University | 6.1 |
Source: Statistics Canada, National Household Survey, 2011.
In addition, as shown in Figure 11, Indigenous people who had a job earned an income that was on average about $9,000 lower than the average income of non-Indigenous workers. Among Indigenous people, First Nations on reserve had the lowest average income from employment.
(in 2010 constant dollars)
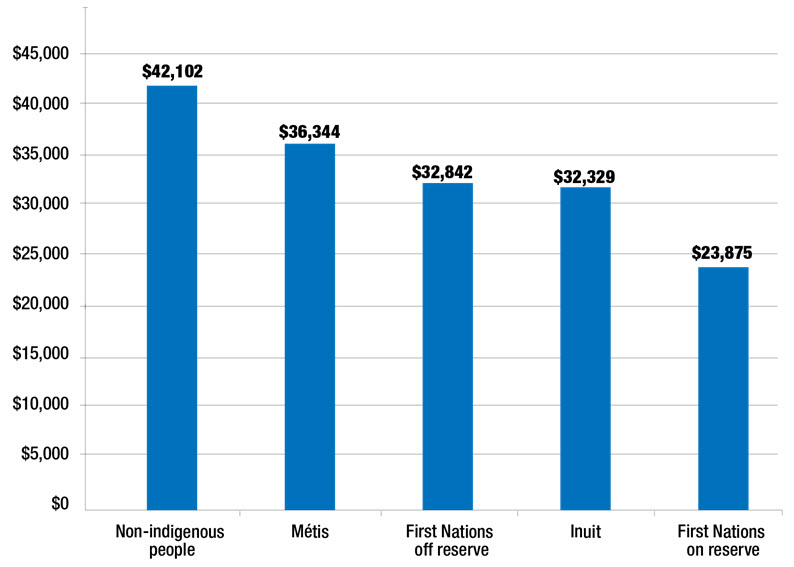
Figure 11 – Text description
| Population by indigenous identity | Average earnings ($) (in 2010 constant dollars) |
|---|---|
| Non-indigenous | 42,102 |
| Métis | 36,344 |
| First Nations off reserve | 32,842 |
| Inuit | 32,329 |
| First Nations on reserve | 23,875 |
Source: Statistics Canada, National Household Survey, 2011.
People with disabilities
In 2012, there were over 2.3 million Canadians aged 15 to 64 living with a disability. People with disabilities face barriers that increase their risk of living in poverty. Some people face disability-related barriers so severe that they cannot work. For instance, over 1 million Canadians aged 15 to 64 with a disability were not in the labour force in 2012. Among Canadians with a disability who were not in the labour force and would not look for work in the next year, 18% indicated that their disability prevented them from working and that no type of “workplace arrangement or modification would enable them to work at a paid job or business”. Among disabled Canadians who were prevented from working, 78% had either a very severe or severe disability. Within this group, about one-third (32%) received social assistance. In addition, over half (55%) of people with a disability, who were not in the labour force and who indicated that they would not look for work in the next year, were permanently retired. Three-quarters of these permanently retired workers said that part of the reason for retiring was due to their disability.Footnote 9
However, many people with disabilities who would like to work face employment challenges due to barriers in the workplace. These include workplaces that are inaccessible, a lack of workplace accommodations and discrimination in the labour market. As shown in Figure 12, people with a disability have lower employment rates than those without a disability, and employment rates vary by severity of the disability. For example, in 2011, the employment rate of people with a mild disability aged 25 to 64 was 68%, compared to 79% for those who did not have a disability. In general, people with disabilities have lower levels of education than those without a disability, which may also contribute to lower employment rates.Footnote 10
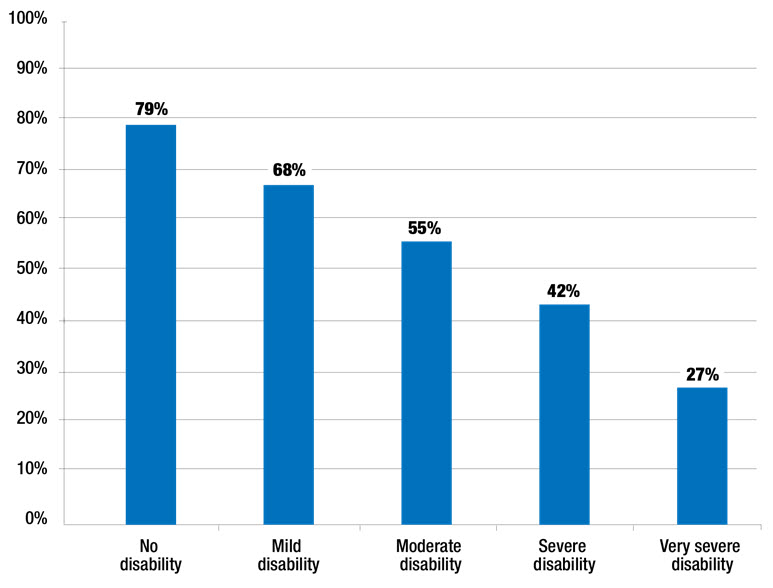
Figure 12 – Text description
| Population by severity of disability | Employment rate (%) for 25–64 year olds |
|---|---|
| No disability | 79 |
| Mild disability | 68 |
| Moderate disability | 55 |
| Severe disability | 42 |
| Very severe disability | 27 |
Source: Martin Turcotte, "Persons with disabilities and employment," Insights on Canadian Society. Statistics Canada, December 2014.
Further, people with disabilities who work full-time all year earn less than those without a disability (Figure 13). For example, men with a mild or moderate disability aged 25 to 64 earned, on average, $11,000 less than men without a disability. In general, women earned less than men. However, women with a mild or moderate disability earned about $4,000 less than women without a disability.Footnote 11
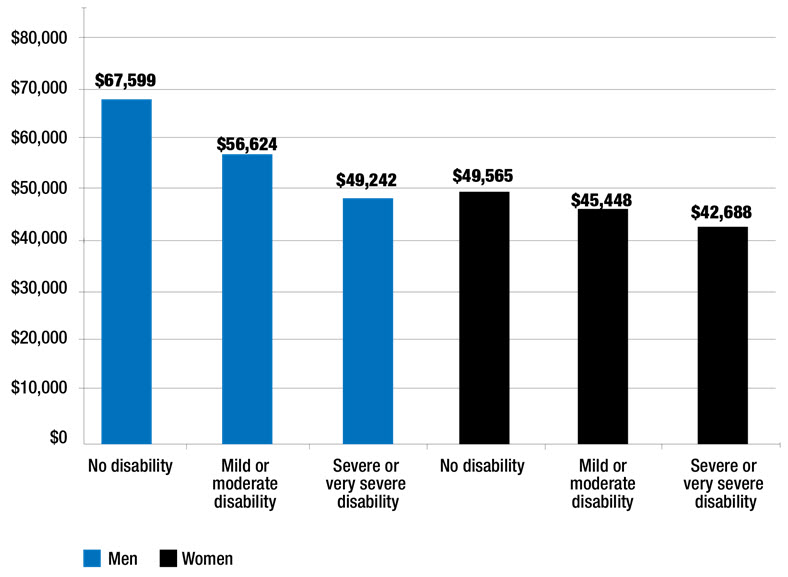
Figure 13 – Text description
| Population by severity of disability | Average employment income($) | |
|---|---|---|
| Men | Women | |
| No disability | 67,599 | 49,565 |
| Mild or moderate disability | 56,624 | 45,448 |
| Severe or very severe disability | 49,242 | 42,688 |
Source: Martin Turcotte, "Persons with disabilities and employment," Insights on Canadian Society. Statistics Canada, December 2014. Data is from the Canadian Disability Survey, 2012.
Employment status is based on those who were employed during the 2011 National Household Survey reference week.
Employment is based on individuals employed in full-time work, all year, with positive employment income.
Recent immigrants
Recent immigrants (i.e. those who have lived in Canada less than 10 years) may face language barriers, discrimination, difficulty having their educational and professional credentials recognized, a lack of Canadian work experience, and difficulty building social networks when they arrive in Canada. These barriers can lead to high levels of unemployment and poverty. For example, in 2015, recent immigrants had an unemployment rate of 10%, which was higher than the rate of 7% among Canadian-born workers.Footnote 12 Further, the low-income rate among recent immigrants (20.3%) was more than double that of the total Canadian population (8.8%) in 2014.
Visible minorities face additional challenges that make them more vulnerable to low income. For example, based on the National Household Survey, the average earnings for working-age (age 25–64) visible minorities in 2010 were $42,032 compared to $47,634 for those who are not visible minorities (Figure 14). Average earnings vary among visible minorities, with the lowest earnings for people from Latin America ($37,282) and Black people ($39,180), and the highest earnings for people from South Asia ($43,109).
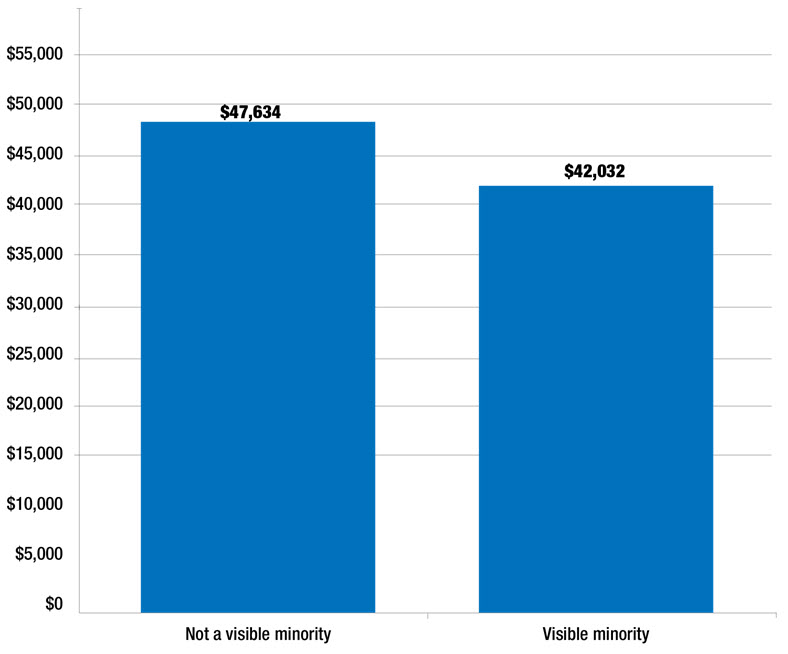
Figure 14 – Text description
| Visible minority status | Average earnings ($) (in 2010 constant dollars) |
|---|---|
| Visible minority | $42,032 |
| Not a visible minority | $47,634 |
Source: Statistics Canada, National Household Survey, 2011, data tables: 99-014-X2011041.
Single parents
The high rate of low income among persons in single-parent families is also a concern. About one-quarter (23.7%) of people in single-parent families lived in poverty in 2014 according to the Low Income Cut-offs after tax. Furthermore, families led by single women tend to be more likely to live in poverty than those led by single men. For instance, as shown in Figure 15, 26.0% of people in families led by single women lived in low income compared to 12.8% of those led by single men.
(Low income cut-offs – After tax, base year 1992)
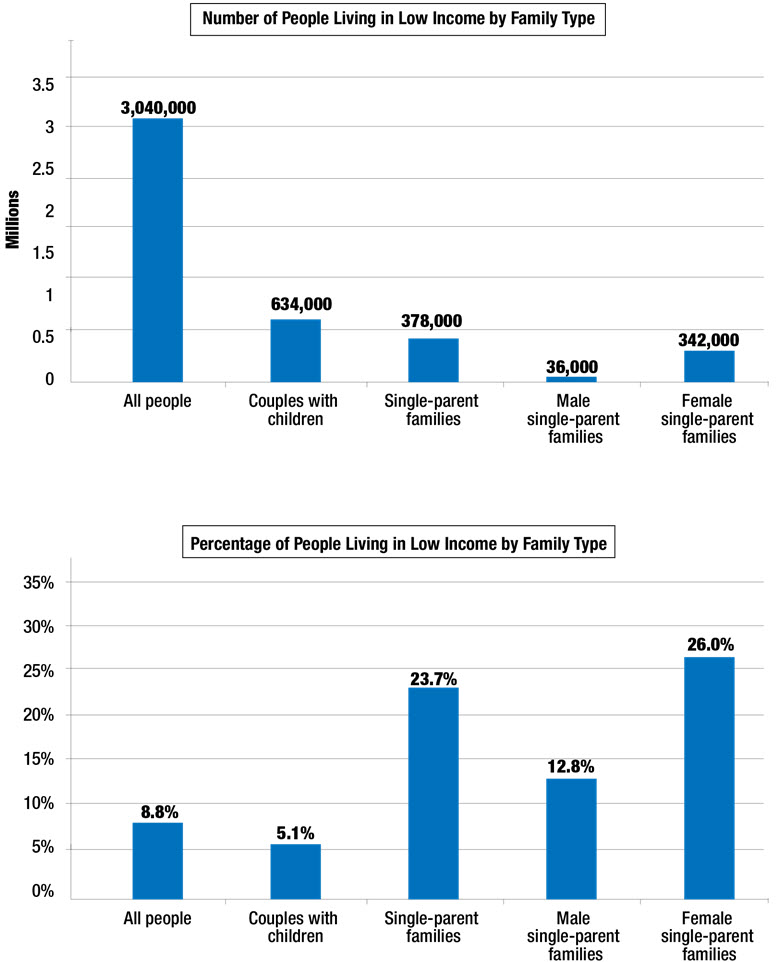
Figure 15 – Text description
| Family type | Number of people living in low income | Percentage (%) of people living in low income |
|---|---|---|
| All people | 3,040,000 | 8.8 |
| Couples with children | 634,000 | 5.1 |
| Single-parent families | 378,000 | 23.7 |
| Male single-parent families | 36,000 | 12.8 |
| Female single-parent families | 342,000 | 26.0 |
Source: Statistics Canada, Canada Income Survey, CANSIM table 206-0042.
It should be noted, however, that the situation of people in single-parent families, including those led by single mothers, has improved over time (Figure 16).
(Low income cut-offs – After tax, base year 1992)
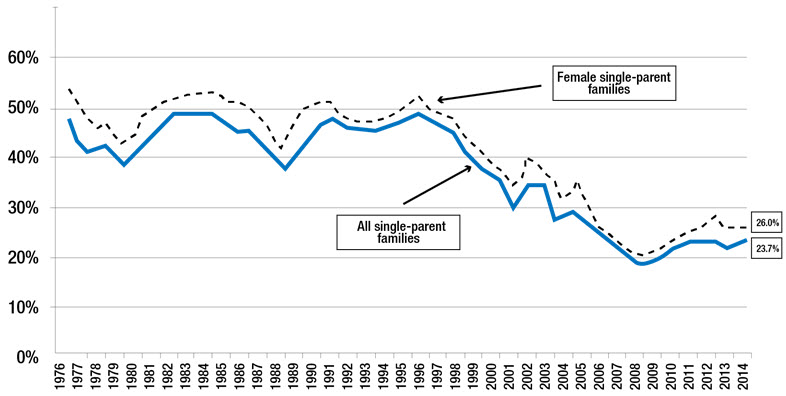
Figure 16 – Text description
| Year | Percentage (%) of people in single-parent families living in low income | Percentage (%) of people in female-led single-parent families living in low income |
|---|---|---|
| 1976 | 49.2 | 53.7 |
| 1977 | 43.3 | 49.5 |
| 1978 | 40.9 | 45.8 |
| 1979 | 41.5 | 47.0 |
| 1980 | 42.1 | 45.5 |
| 1981 | 39.3 | 44.2 |
| 1982 | 44.5 | 49.3 |
| 1983 | 48.7 | 52.1 |
| 1984 | 48.7 | 52.2 |
| 1985 | 48.6 | 52.5 |
| 1986 | 44.0 | 48.7 |
| 1987 | 44.4 | 48.4 |
| 1988 | 41.8 | 45.0 |
| 1989 | 38.6 | 42.1 |
| 1990 | 43.7 | 48.2 |
| 1991 | 46.1 | 49.8 |
| 1992 | 43.0 | 46.5 |
| 1993 | 43.6 | 46.9 |
| 1994 | 42.4 | 45.0 |
| 1995 | 44.1 | 47.5 |
| 1996 | 49.3 | 52.9 |
| 1997 | 44.0 | 48.2 |
| 1998 | 39.3 | 43.5 |
| 1999 | 36.2 | 39.4 |
| 2000 | 32.4 | 36.2 |
| 2001 | 30.4 | 34.2 |
| 2002 | 35.2 | 40.4 |
| 2003 | 34.4 | 39.3 |
| 2004 | 33.0 | 37.2 |
| 2005 | 26.5 | 29.7 |
| 2006 | 28.9 | 33.0 |
| 2007 | 24.7 | 27.6 |
| 2008 | 19.6 | 22.3 |
| 2009 | 19.6 | 21.2 |
| 2010 | 20.4 | 22.2 |
| 2011 | 22.2 | 23.9 |
| 2012 | 24.5 | 27.7 |
| 2013 | 23.0 | 25.9 |
| 2014 | 23.7 | 26.0 |
Source: Statistics Canada, CANSIM table 206-0042.
Unattached individuals aged 45–64
About 518,000 unattached Canadians aged 45 to 64 years old lived in low income in 2014 based on the Low Income Cut-offs after tax. Almost three-quarters (72%) of these unattached Canadians living in low income were not working, and the vast majority of the unattached who were not working were disabled (81%). In general, low-income, unattached Canadians aged 45 to 64 were more likely to be men (57%).Footnote 13
The working poor
In 2014, about 746,000 Canadians lived in a family where the main income earner met the definition of working poor:Footnote 14 they worked over 910 hours a year and lived in low income based on the Low Income Cut-offs. Overall, about 3.1% of Canadians live in a family that is headed by a person considered to be working poor (Figure 17). While the share of Canadians living in working-poor families has declined in recent years, the rate has been stuck at between 3% and 4% since 2007.
(Low income cut-offs – after tax, base year 1992)
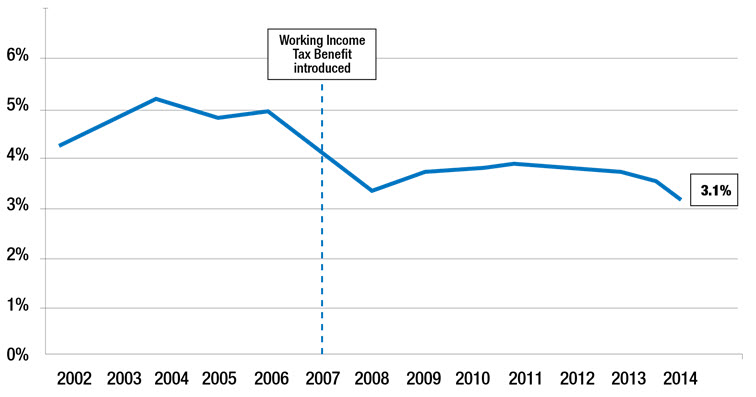
Figure 17 – Text description
| Year | Percentage (%) of people living in a family led by a main income recipient who is working poor |
|---|---|
| 2002 | 4.3 |
| 2003 | 4.8 |
| 2004 | 5.1 |
| 2005 | 4.8 |
| 2006 | 4.9 |
| 2007 (Working Income Tax Benefit Introduced) | 4.1 |
| 2008 | 3.3 |
| 2009 | 3.5 |
| 2010 | 3.5 |
| 2011 | 3.9 |
| 2012 | 3.7 |
| 2013 | 3.6 |
| 2014 | 3.1 |
Source: Statistics Canada, Survey of Labour and Income Dynamics (2002-2011) and Canadian Income Survey (2012-2014). Custom table.
The working poor are more likely to be self-employed or have non-standard working hours.Footnote 15 For example, about 4 in 10 working poor are self-employed at some point during the year. The working poor are also less likely to access work-related benefits such as an employer sponsored private pension plan, disability insurance or a family dental plan.Footnote 16
Upward income mobility
While most Canadians (i.e., those in the bottom nine income deciles) have experienced a decline in their ability to move up the income ladder since the late 1980s, lower- and middle-income Canadians have been even less likely to move up the income distribution. For example, during the 5-year period from 1987 to 1992, 72% of the lowest-income earners (bottom 10%) moved up the income ladder, but by 2007–2012, this percentage fell to 60% (Figure 18).Footnote 17
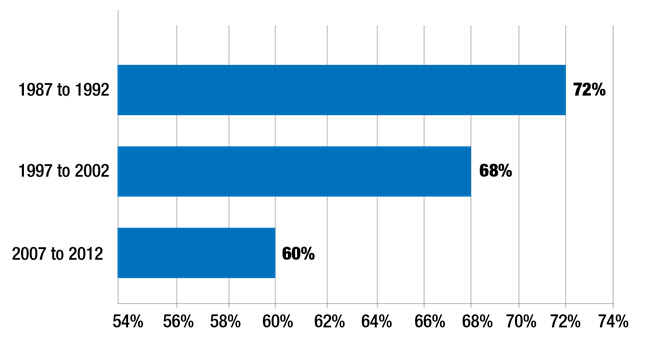
Figure 18 – Text description
| 5-year period | Percentage (%) of low income Canadians who moved into higher income decile |
|---|---|
| 1987-1992 | 72 |
| 1997-2002 | 68 |
| 2007-2012 | 60 |
Source: Xuelin Zhang, Habib Saani, and Jackson Chung. "The evolution of income mobility in Canada: evidence from the longitudinal administrative databank, 1982 to 2012," income research paper series. Statistics Canada, May 2016. Data from Statistics Canada, longitudinal administrative databank, 1982-2012, authors' calculations.
Poverty beyond income in everyday life
Looking at income levels only paints a partial picture of poverty in Canada. To fully understand how poverty affects Canadians, we also need to understand other factors that affect the everyday lives of those who live in poverty, such as housing, food, health and crime.
Housing
The Canada Mortgage and Housing Corporation considers housing “acceptable” if it is affordable, it has enough bedrooms to accommodate for family size and makeup, and it is in adequate condition and does not require any major repairs (e.g. to plumbing, electrical wiring or structure). Housing is thought to be affordable if the cost is equal to less than 30% of total household income before taxes. According to the 2011 National Household Survey, almost 70% of Canadian households lived in “acceptable” housing. About 12.5% of Canadian families could not afford acceptable housing (Figure 19) and were considered to be in “core housing need.”Footnote 18
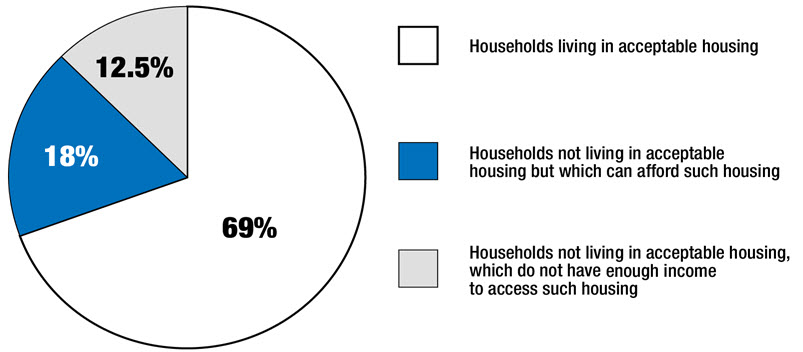
Figure 19 – Text description
| Canadian households | Percentage (%) of Canadian households |
|---|---|
| Households living in acceptable housing | 69.2 |
| Households not living in acceptable housing but which can afford such housing | 18.4 |
| Households not living in acceptable housing, which do not have enough income to access such housing | 12.5 |
Source: CMHC (April 2015). The adequacy, suitability and affordability of canadian housing, 1991-2011 (PDF file). Numbers may not total to 100 due to rounding.
Over 655,000 Canadian households (5%) were in severe housing need, meaning that they were spending at least 50% of their income before taxes on housing. Almost 90% of all households in severe housing need were low-income. In addition, some members of vulnerable groups, who are more at risk of living in low income, were more likely to be among the households in severe housing need. For example, almost 13% of households maintained by recent immigrants, 10% of those maintained by single parents and single people, and 7% of those maintained by Indigenous people living off reserve were in severe housing need.Footnote 19
Generally, Canadians who are in core housing need are deemed to be in need because of affordability issues, rather than because their house is in disrepair or is too small. However, people living in housing need in the territories are more likely to be deemed in need because their homes require major repairs or they are overcrowded. For example, in Nunavut, more than 1 in 4 households (28%) lived in housing conditions where major repairs were needed, and almost 3 in 10 lived in overcrowded housing. The Northwest Territories had the second highest rate of housing in need of major repairs.Footnote 20
In addition, about half of the 91,595 First Nations households living on reserve in 2011 lived in housing below acceptable standards because homes required major repairs and were overcrowded. One-third of Indigenous households on reserve that required better housing due to their home being in disrepair and/or overcrowding could not afford acceptable local housing because they would have to spend over 30% of their income on housing (Figure 20). The majority of Indigenous households on reserve (70%) who lived in housing need lived in band housing.Footnote 21
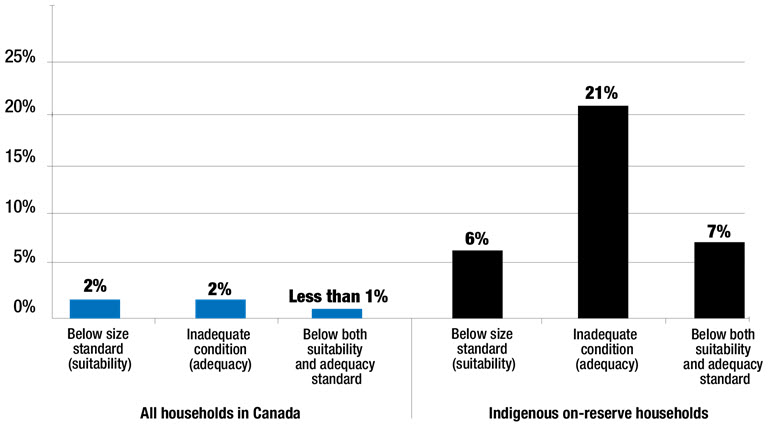
Figure 20 – Text description
| Housing standard | Percentage (%) of all households in Canada |
|---|---|
| Below size standard (suitability) | 2 |
| Inadequate condition (adequacy) | 2 |
| Below both suitability and adequacy standard | Less than 1 |
| Housing standard | Percentage (%) of indigenous on-reserve households |
|---|---|
| Below size standard (suitability) | 6 |
| Inadequate condition (adequacy) | 21 |
| Below both suitability and adequacy standard | 7 |
Source: Canada Mortgage and Housing Corporation, "2011 Census/national household survey housing conditions series: Issue 8-housing conditions of on-reserve aboriginal households," Research highlights, March 2016. Data based on 2011 National household survey
Among the vulnerable groups at risk of being in housing need, the situation of single parents is also of concern. Over 1 in 4 households (27%) led by single parents were in core housing need in 2006, which was more than double the rate for all households in Canada in that year (13%). Single-parent households that were in core housing need also spent 46% of their before-tax income on housing. However, there is a significant difference in the core housing need of households led by single parents who are women compared to those led by men. As shown in Figure 21, households led by a female single parent were significantly more likely to be in core housing need (30%) compared to households led by a male single parent (15%).Footnote 22
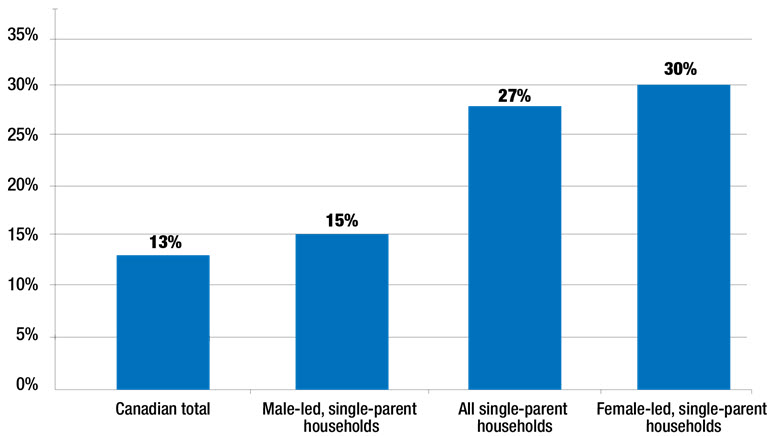
Figure 21 – Text description
| Type of household | Percentage (%) of households in core housing need |
|---|---|
| Canadian total | 13 |
| Male-led, single-parent households | 15 |
| All single-parent households | 27 |
| Female-led, single-parent households | 30 |
Source: Canada Mortgage and Housing Corporation, "2006 Census housing series: issue 18 – Housing conditions of lone-parent-led households," December 2012.
In addition to the number of Canadians with housing needs, on any given night, it is estimated that 35,000 Canadians are homeless.Footnote 23 There are many factors that can affect a person’s chances of becoming homeless, including income level, employment status, mental health, mental illness and addictions.Footnote 24
Food insecurity
Food insecurity means that a household does not have enough money to purchase a sufficient amount and variety of food to live a healthy lifestyle. Being in low income contributes to food insecurity. Research suggests that food insecurity not only affects child development, but also leads to chronic health conditions, obesity, depression and poor health in general.Footnote 25
Between 2011 and 2012, 1.1 million Canadian households (8%) experienced food insecurity according to the Canadian Community Health Survey. However, there were significant differences across provinces and territories, as well as by household type. For example, 37% of households in Nunavut experienced food insecurity compared to about 8% of households in the Prairies, British Columbia, Ontario and Quebec (Figure 22).Footnote 26
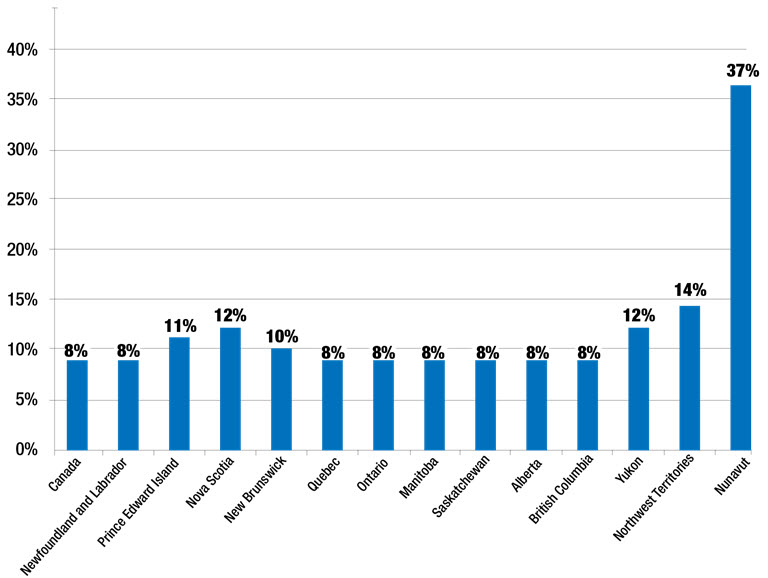
Figure 22 – Text description
| Province / Territory | Percentage (%) of households experiencing food insecurity |
|---|---|
| Canada | 8 |
| Newfoundland and Labrador | 8 |
| Prince Edward Island | 11 |
| Nova Scotia | 12 |
| New Brunswick | 10 |
| Quebec | 8 |
| Ontario | 8 |
| Manitoba | 8 |
| Saskatchewan | 8 |
| Alberta | 8 |
| British Columbia | 8 |
| Yukon | 12 |
| Northwest Territories | 14 |
| Nunavut | 37 |
Source: Shirin Roshanafshar and Emma Hawkins, "Food insecurity in Canada," Health at a glance. Statistics Canada: March 2015. Data based on Canadian community health survey, 2011-2012.
In addition, households with children reported higher rates of food insecurity. About 10% of households with children under the age of 18 were food insecure compared to 7.5% of those without children.Footnote 27
Single-parent households were significantly more likely to experience food insecurity. For example, 22% of adults in single-parent households were food insecure compared to 7% of adults who were part of a couple with children. Similarly, 13% of children in single-parent households were food insecure compared to only 3% of children living in a two-parent household (Figure 23).Footnote 28
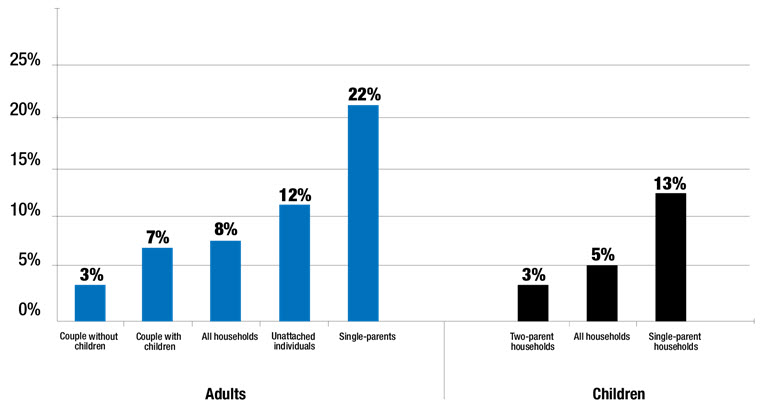
Figure 23 – Text description
| Adults by household type | Percentage (%) of adults experiencing food insecurity |
|---|---|
| Couple without children | 3 |
| Couple with children | 7 |
| Adults living in all household types | 8 |
| Unattached individuals | 12 |
| Single-parents | 22 |
| Children by household type | Percentage (%) of children experiencing food insecurity |
|---|---|
| Children living in two-parent households | 3 |
| Children living in all household types | 5 |
| Children living in single-parent households | 13 |
Source: Statistics, "Household food insecurity, 2011-2012," Health fact sheets. December 2013. Data based on the Canadian community health survey, 2011-2012.
Indigenous people, particularly Indigenous women, experience higher levels of food insecurity than non-Indigenous Canadians. For example, 16% of First Nations men living off reserve and 26% of First Nations women living off reserve reported being food insecure between 2007 and 2010 compared to 7% for non-Indigenous men and 8% for non-Indigenous women. Rates of food insecurity were particularly high among both Inuit women at 28% and Inuit men at 27%, while 17% of Métis women and 14% of Métis men were food insecure.Footnote 29
Furthermore, the share of low-income households that experience food insecurity varies by the type of income received. For instance, low-income Canadians are more likely to experience food insecurity if their main source of income is from government transfers such as Employment Insurance, workers’ compensation, public pensions, social assistance and child benefits. From 2011 to 2012, 41% of low-income households whose main income came from government transfers were food insecure compared to 23% of those whose main source of income came from other sources (e.g. wages, investments, workplace pensions, spousal support and child support).Footnote 30
A similar trend is observed for children, with 27% of children in households that depend on government transfers being food insecure compared to only 3.5% of children living in households dependent on other sources of income (e.g. wages).Footnote 31
Health
Poverty affects an individual’s health. However, poor health may also affect an individual’s productivity and result in economic losses for individuals and society. Research suggests that individuals living in low income have a lower life expectancy, have higher rates of suicide and are more likely to suffer from diseases affecting the heart, chronic conditions and mental health issues.Footnote 32 For instance, women from low-income neighbourhoods (bottom 20% of income earners) had a life expectancy of almost 82 years. This is about two years less than women in high-income neighbourhoods (top 20% of income earners), who had a life expectancy of 84 years. Men living in low-income neighbourhoods had a life expectancy of almost 76 years, while men living in high-income neighbourhoods could expect to live until the age of 80.Footnote 33
Canadians living in low income are also more likely to suffer from lung cancer, the leading cause of cancer deaths, than those with higher incomes. For example, men in the lowest income quintile (bottom 20% of income earners) are two times more likely than their peers in the highest income quintile (top 20% of income earners) to suffer from lung cancer. Similarly, women in the lowest income quintile are 1.8 times more likely than those in the highest income quintile to suffer from lung cancer.Footnote 34 Lower-income women and men are also more likely to suffer from type 2 diabetes than those with higher incomes.Footnote 35
Living in poverty affects overall health due to challenges including food insecurity and poor living conditions. However, poverty also affects an individual’s ability to access health care through visits to the doctor’s office, walk-in clinic or hospital emergency room to address both physical and mental health issues. In 2014, almost 13% of low-income Canadians, compared to 10% of middle- and high-income Canadians, had unmet health care needs, suggesting that they had difficulty accessing health care. Among the groups more likely to be living in low income, Indigenous people were more likely to have unmet health care needs.Footnote 36
In addition, low-income Canadians are more likely to use a greater percentage of their income to pay for health care expenses such as dental services, prescription medications and health insurance premiums than those with higher incomes. On average, low-income households spent 6% of their after-tax income on these health expenses, whereas high-income households spent only 3%. Between 1997 and 2009, Canadians at all income levels experienced an increase in out-of-pocket health care expenses related to dental care, prescriptions and health insurance. However, low-income Canadians saw the largest increases in out-of-pocket health care spending, as their spending increased by 63% between 1997 and 2009.Footnote 37
The differences in health by income level were estimated to cost Canada’s health care system at least $6.2 billion annually, or over 14% of total expenditures on acute care inpatient hospitalizations, prescription medication and physician consultations.Footnote 38
Crime
The overall rate of violent crime in Canada fell between 2004 and 2014. In 2014, there were an average of 76 victims of violent crime for every 1,000 people aged 15 and older. However, there were significant differences in the probability of being a victim of violent crime by income level. The rate of violent crime for Canadians living in households with annual incomes between $140,000 and $179,999 was 54 for every 1,000 people, but this rate was much higher for low-income Canadians earning less than $20,000, at a rate of 79 victims for every 1,000 people.Footnote 39
In general, women are more likely than men to be victims of violent crime. In 2014, the General Social Survey found that 85 women out of 1,000 were victims of violent crime compared to 67 men out of 1,000. In addition, Indigenous people are more likely to be victims of crime than non-Indigenous people.Footnote 40 In 2014, 30% of Indigenous people reported that they or their household were victims of crime compared to 19% of non-Indigenous people. Furthermore, Indigenous people had a victim of violent crime rate of 160 victims for every 1,000 people compared to only 74 victims for every 1,000 people among their non-Indigenous peers. Indigenous women in particular experienced high rates of crime. For example, there were 115 incidents of sexual assault for every 1,000 Indigenous women, compared to 35 per 1,000 for non-Indigenous women.Footnote 41
Have your say
If you have feedback to provide on this backgrounder, please contact:
povertyreduction@canada.gc.ca.
Annex 1: Number and incidence of people below the Low Income Cut-offs, selected groups, 2014
The following table provides a summary of the low-income statistics for key groups and sub-groups of the population. All statistics for this table originate from the 2014 Canadian Income Survey, with the exception of data for people with disabilities which is only available until 2012. The categories below are not all mutually exclusive, meaning that one individual can be represented in more than one category.
Number of Canadians below the Low Income Cut-offs, After Tax
| Category | Number | Statistics in % |
|---|---|---|
| All Canadians | 3,040,000 | 8.8% |
| Children | 573,000 | 8.5% |
| Working-age individuals (18 to 64 years old) | 2,254,000 | 10.0% |
| Seniors (65 years and older) | 212,000 | 3.9% |
| Gender | ||
| Men | 1,522,000 | 8.8% |
| Women | 1,518,000 | 8.7% |
| Family status | ||
| Persons in families | 1,631,000 | 5.6% |
| Unattached individuals | 1,408,000 | 25.9% |
| Number of families | ||
| Families of two or more persons | 531,000 | 5.5% |
| Unattached individuals | 1,408,000 | 25.9% |
| Families with children* | ||
| Children in two-parent families | 306,000 | 5.5% |
| Children in female lone-parent families | 207,000 | 29.6% |
| Children in male lone-parent families | 18,000 | 12.0% |
| Seniors | ||
| Seniors in families | 48,000 | 1.2% |
| Unattached seniors | 164,000 | 11.3% |
| Work attachment (working poor)** | ||
| Individuals in households where the main income recipient worked 910 or more hours | 746,000 | 3.1% |
| Other vulnerable groups | ||
| Indigenous people off reserve*** | 136,000 | 18.7% |
| People with disabilities (2012 data) | 629,000 | 22.5% |
| Recent immigrants | 507,000 | 20.3% |
| Unattached individuals aged 45 to 64 | 518,000 | 30.2% |
*Totals do not add up to total low-income children due to some children living in other family situations (e.g., with a grandparent) or by themselves.
**Does not include seniors or working full-time students.
***The Canadian Income Survey is not administered in the territories or in communities on reserve.