
About the Community Services Recovery Fund
This fund was a one-time, $400 million investment to help community service organizations, including charities, non-profits and Indigenous governing bodies, adapt and modernize, and build internal organizational capacity. This investment strengthened the sector as it supported recovery in communities across Canada.
Three National Funders were selected to deliver the Community Services Recovery Fund (CSRF):
- Canadian Red Cross
- Community Foundations of Canada
- United Way Centraide Canada
National Funders were responsible for:
- setting up the application process
- reaching out to diverse communities across Canada
- assessing applications
- distributing the funding
Consult the Community Services Recovery Fund website for more information.
CSRF results
Funding highlights
- Over 15,000 organizations applied to the CSRF
- Nearly 5,500 organizations received CSRF funding
- Over 55% of funded organizations supported the sustainable development goals: “Good health & well-being” and “Reduced inequalities”
- The following 3 capacity-building supports were the most requested by funded organizations:
- adapting or pivoting existing programs/services (20%)
- digital transformation and data capacity (18%)
- developing/redesigning organizational strategies (14%)
Reach and diversity
- The CSRF reached a broad range of communities across Canada
- The number of CSRF projects funded per province/territory was proportional to the size of its population
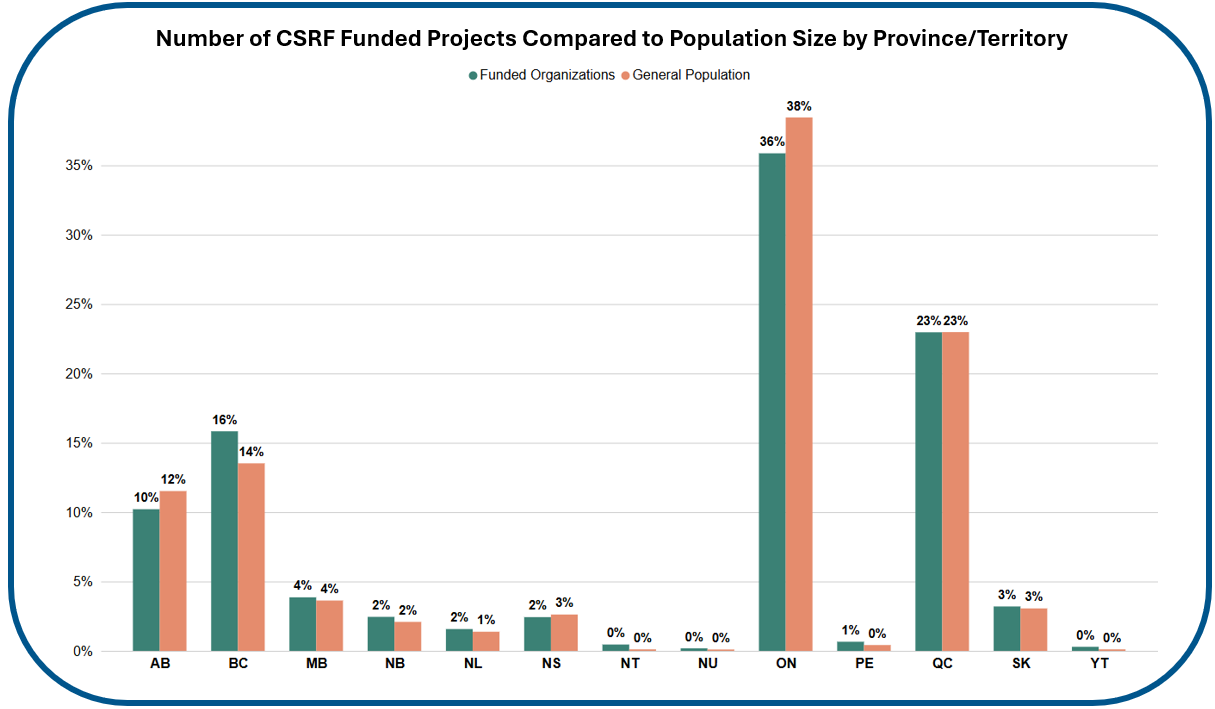
*0% indicates less than 0.5%
Figure 1 – Text version
Long description
| Province/Territory | Funded organizations | General population |
|---|---|---|
| Alberta – (AB) | 10% | 12% |
| British Columbia – (BC) | 16% | 14% |
| Manitoba – (MB) | 4% | 4% |
| New Brunswick – (NB) | 2% | 2% |
| Newfoundland – (NL) | 2% | 1% |
| Nova Scotia – (NS) | 2% | 3% |
| Northwest Territories – (NT) | 0% | 0% |
| Nunavut – (NU) | 0% | 0% |
| Ontario – (ON) | 36% | 38% |
| Prince Edward Island – (PE) | 1% | 0% |
| Quebec – (QC) | 23% | 23% |
| Saskatchewan – (SK) | 3% | 3% |
| Yukon – (YT) | 0% | 0% |
- The number of CSRF projects funded per urban/rural region was proportional to the size of its population
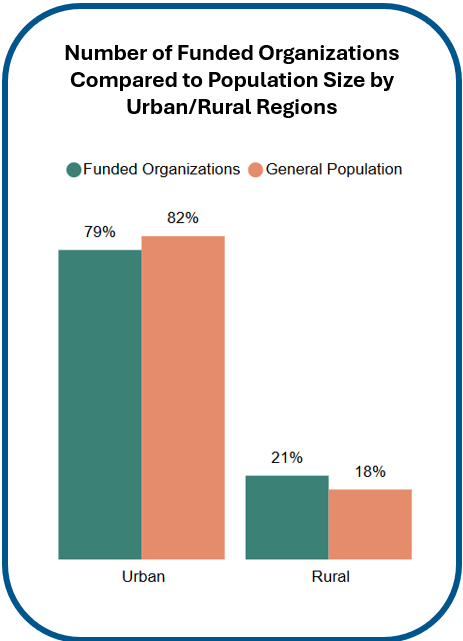
Figure 2 – Text version
Long description
| Region | Funded organizations | General population |
|---|---|---|
| Urban | 79% | 82% |
| Rural | 21% | 18% |
- 92% of funded organizations were led by an equity-deserving community, including:
- 74% led by women
- 40% led by people aged 65 and older
- 28% led by first-generation immigrants, refugees, or newcomers
- 72% of funded organizations served an equity-deserving community, including:
- 14% served persons living with disabilities
- 6% served people aged 65 and older
- 5% served Indigenous Peoples (First Nations, Métis, Inuit)
Impact
- 99% of funded organizations claim they adopted new tools and approaches
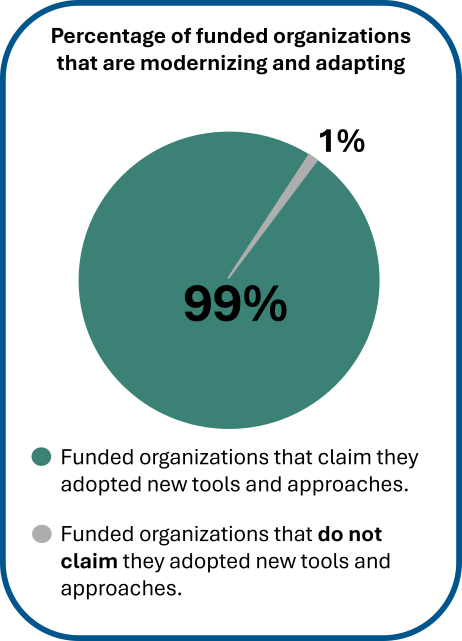
Figure 3 – Text version
Long description
| Funded organizations that claim they adopted new tools and approaches | 99% |
| Funded organizations that do not claim they adopted new tools and approaches | 1% |
- 98% of funded organizations claim they can better predict, respond to and recover from disruptions
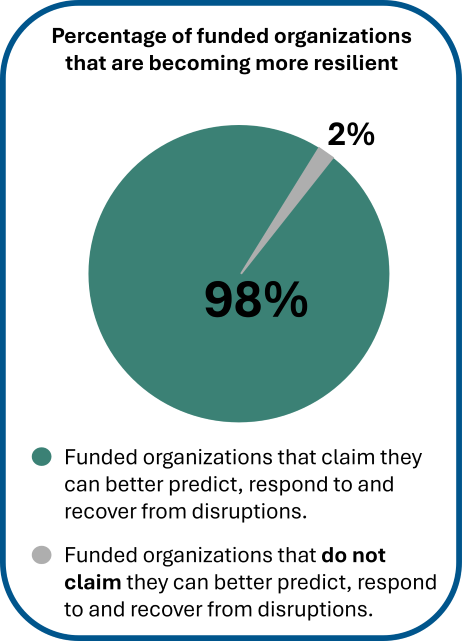
Figure 4 – Text version
Long description
| Funded organizations that claim they can better predict, respond to and recover from disruptions. | 98% |
| Funded organizations that do not claim they can better predict, respond to and recover from disruptions. | 2% |
CSRF data analysis
- DARO, a data and technology organization, analyzed CSRF administrative program data to help better understand the needs of the charitable and non-profit sector in Canada
- Data products from their analysis can be found here: Canadian Nonprofit Data Lab
Success stories
The CSRF made a positive impact for funded organizations and the communities they serve:
- Comité FrancoQueer de l'Ouest – YouTube (3:40 minutes)
- People First of Canada – YouTube (4:21 minutes)
- How Comité ZIP du lac Saint-Pierre is Building Connections
- Promoting Inclusion in the Workplace
- Laying the Groundwork for a Sustainable Future
- MOVE by GoodLife Kids: Creating Inclusivity – YouTube (1:27 minutes)
- Technology is at the center at Umoja
- Investing in People in Prince Edward Island
- Planting SEEDs of Connection
- An Innovator in Food Security and Poverty Reduction
Related links
- News Release: Minister Sudds announces over 5,000 projects funded under the Community Services Recovery Fund
- News Release: Community Services Recovery Fund application process opens to support pandemic recovery
- News Release: Government of Canada announces National Funders selected to support charities and non-profits
- News Release: Government of Canada launches call for proposals for national funders to support charities and not-for-profits