
2022 annual report – Taking action against harassment and violence in workplaces under Canadian federal jurisdiction
On this page
- List of abbreviations
- List of charts
- Territorial acknowledgement
- Executive summary
- Key findings from the 2022 annual report
- Introduction
- Analysis of harassment and violence occurrences in the federal jurisdiction
- Spotlights
- Annex 1: List of terms
- Annex 2: Sexual/non-sexual harassment and violence and fatalities
- Annex 3: Types of resolution methods used by employers
- Annex 4: Types of principal party/responding party relationships identified by employers
- Annex 5: Number of occurrences on discrimination grounds under the Canadian Human Rights Act
Alternate formats

2022 annual report - Taking action against harassment and violence in workplaces under Canadian federal jurisdiction [PDF - 1.36 MB]
Large print, braille, MP3 (audio), e-text and DAISY formats are available on demand by ordering online or calling 1 800 O-Canada (1-800-622-6232). If you use a teletypewriter (TTY), call 1-800-926-9105.
List of abbreviations
- AIRT
- Air Transportation
- BANK
- Banking and Banks
- BRID
- Interprovincial Infrastructure (Bridges, Tunnels, Canals, and Causeways)
- BROAD
- Broadcasting (Television, Radio, and Internet)
- COMM
- Communications
- EAHOR
- Employer's Annual Hazardous Occurrence Report
- EAHVOR
- Employer's Annual Harassment and Violence Occurrence Report
- ENER
- Energy, Mining and Mineral Processing
- FEED
- Feed, Flour and Seed
- FTE
- Full-time equivalent
- GRAIN
- Grain Handling and Grain Elevators
- HV
- Harassment and violence
- INDG
- First Nations, Band Councils, and Indigenous Self-Governments (certain activities)
- LONG
- Longshoring, Stevedoring, Port, Harbour Operations and Pilotage
- PIPE
- Pipeline Transportation
- POST
- Postal Services and Postal Contractors
- PSES
- Public Service Employee Survey
- PUBS
- Federal Public Services, Public Service Departments and Crown Corporations
- RAIL
- Rail Transportation
- ROAD
- Road Transportation
- SEFJ
- Survey of Employees under Federal Jurisdiction
- WATER
- Water Transportation (Shipping and Ferries)
- WHVPF
- Workplace Harassment and Violence Prevention Fund
List of charts
- Chart 1: Distribution of harassment and violence occurrences and employee coverage across sectors in 2022, percentage
- Chart 2: Share of reported harassment and violence occurrences that are sexual harassment and violence in the public vs. private sector in 2021 and 2022, percentage
- Chart 3: Percentage of sexual harassment and violence occurrences by sector in 2022
- Chart 4A: Resolution method for all sectors in 2021 and 2022
- Chart 4B: Resolution method by public and private sector in 2022
- Chart 5: Percentage of principal party relationships for all sectors, by responding party in 2021 and 2022
- Chart 6: Percentage of responding party relationships, public vs. private sector in 2022
- Chart 7: Percentage of third party occurrences by sector in 2022
- Chart 8: Percentage of all reported harassment and violence occurrences involving a third party relationship in 2022
- Chart 9A: Total discrimination identified by sector in 2021 and 2022
- Chart 9B: Percentage of top 4 grounds of discrimination in 2022
The list of terms (Annex 1) provides definitions of relevant terms used in this publication.
Territorial acknowledgement
The 2022 annual report - Taking action against harassment and violence in workplaces under Canadian federal jurisdiction was produced by the Labour Program, of Employment and Social Development Canada, on the traditional unceded territory of the Algonquin, Anishinabewaki, and Mohawk Peoples. We are grateful for the opportunity to work and be present on this territory.
Executive summary
The Labour Program of Employment and Social Development Canada (ESDC) publishes an annual report to provide aggregated statistics on harassment and violence in the workplace within the federal jurisdiction and its regulated industrial sectors. The primary data source for this report is the Employer's Annual Harassment and Violence Occurrence Report (EAHVOR), which federally regulated employers are required to submit to the Labour Program for each reporting year.
Key findings from the 2022 annual report
- 2022 marks the second reporting year the Labour Program has provided an annual report since the Work Place Harassment and Violence Prevention Regulations came into force. This year's report is based on 4,778 EAHVOR submissions received, a 6% increase from the 4,503 EAHVOR submissions received for 2021.
- There were 3 fatalities related to harassment and violence reportedFootnote 1 to the Labour Program in the 2022 EAHVOR compared to zero fatalities related to harassment and violence in the 2021 EAHVOR.
- There was a noticeable 26% increase in harassment and violence occurrences reported to employers in 2022, rising from 4,950 occurrences in 2021 to 6,226 in 2022.
- Occurrences related to sexual harassment and violence rose significantly, from 447 in 2021 to 722 in 2022, representing a 62% increase.
- Both the public sector and private sector saw increases in harassment and violence occurrences reported to employers. The public sector recorded 1,885 occurrences in 2022, up by 13% from 1,664 occurrences in 2021. The private sector saw a 32% increase, with occurrences rising from 3,286 in 2021 to 4,341 in 2022.
- In both 2021 and 2022, the following 5 sectors - Federal Public Services, Public Service Departments and Crown Corporations, Banking and Banks, Road Transportation, Air Transportation, Postal Services and Postal Contractors - accounted for approximately 80% of all reported occurrences.
- The most frequently used method to resolve harassment and violence occurrences in 2021 and 2022 was investigation, accounting for approximately 50% of all resolutions reported in both years.
- The most common relationship type for harassment and violence occurrences between a principal party and responding party was when an employee was the object of harassment or violence from another employee (43% in 2022 and 42% in 2021).
- In both 2021 and 2022, about 20% of total reported occurrences (952 in 2021 and 1,273 in 2022) were linked to the 13 grounds of discrimination defined in the Canadian Human Rights Act .
- The most common form of discrimination underlying harassment and violence in the workplace was on the basis of sex, with approximately 300 occurrences reported in both 2021 and 2022.
This report underscores the ongoing challenges and progress in addressing workplace harassment and violence within federally regulated sectors, highlighting the need for continued efforts to ensure safe and respectful workplaces across the federal jurisdiction.
Introduction
Amendments to Part II (Occupational Health and Safety) of the Canada Labour Code (the Code) and the Work Place Harassment and Violence Prevention Regulations, strengthened harassment and violence prevention, focusing on sexual harassment and sexual violence as well as discrimination in federally regulated industries and workplaces . Part II of the Code also applies to employers and employees covered under the Parliamentary Employment and Staff Relations Act.
In addition to updating the definition of harassment and violence in the Code, the regulations outline the elements required in a workplace harassment and violence prevention policy and steps to resolve an occurrence of workplace harassment and violence. It also outlines the requirement to assess the risk of workplace harassment and violence and inform and train employees on workplace harassment.
Analysis of harassment and violence occurrences in the federal jurisdiction
In this section:
- About the data
- Section 1: What is the distribution of harassment and violence occurrences being reported by federally regulated employers?
- Section 2: What are the commonly used methods of resolution?
- Section 3: What common relationships exist between parties involved in a harassment and violence occurrence?
- Section 4: What role does discrimination play in harassment and violence occurrences?
About the data
The information presented below is based on data collected in the EAHVORs submitted to the Labour Program in 2023, covering harassment and violence occurrences reported to employers under federal jurisdiction throughout the 2022 calendar year. Federally regulated employers are required to submit an EAHVOR to the Labour Program by March 1 each year. This is the second year reporting the data submitted by federally regulated employers. The 2022 data is analyzed and compared against the data from the 2021 calendar year.
EAHVORs must include the following information relating to occurrences of harassment and violence:
- the total number of occurrences reported to the employer, as well as whether or not the occurrence was sexual in nature
- the total number of occurrences that resulted in the death of an employee
- the final method of resolution used by an employer to resolve an occurrence
- the relationship between all parties involved in an occurrence
- the number of occurrences that fell under each prohibited ground of discrimination set out in subsection 3(1) of the Canadian Human Rights Act
- the location where the occurrence took place
- the average number of months taken to complete the resolution process
It is important to note that the data and related analysis presented in this report cover only the harassment and violence occurrences for which a notice of occurrence was provided to the employer (designated recipient) under subsection 15(1) of the Work Place Harassment and Violence Prevention Regulations and, in turn, was reported by the employer to the Labour Program on the EAHVOR. The number of harassment and violence occurrences are to be interpreted within this context of data collection, since they may differ from those collected from anonymous employee surveys.
Information on full-time equivalent (FTE) employees is used to estimate the size of employers who submitted the EAHVOR. FTE data contained in this report comes from Employer's Annual Hazardous Occurrence Report (EAHOR) submissions from federally regulated employers.
Some data in the charts and tables may not sum to exactly 100% due to rounding.
Employer reporting statistics
For the 2022 reporting year, the Labour Program received 4,778 EAHVOR submissions representing about 1.2 million FTEs. That is an increase of 6.1% over the number of EAHVORs submitted for the 2021 calendar year (4,503).
For the 2022 reporting year, 541 employers (11.3%) reported at least 1 harassment and violence occurrence. Over 81% of all occurrences were reported by 104 employers (about 2.2% of employers who submitted a report).
Section 1: What is the distribution of harassment and violence occurrences being reported by federally regulated employers?
Sector analysis
This section presents the distribution of harassment and violence occurrences by federally regulated employers, including the type of occurrence.
The total number of harassment and violence occurrences reported in 2022 was 6,226. This is an increase of 25.8% from the 4,950 harassment and violence occurrences reported in 2021. Occurrences were reported by 541 federally regulated employers out of a total of 4,778 EAHVOR submissions. In 2021, all occurrences were reported by 501 federally regulated employers out of a total of 4,503 EAHVOR submissions.
There were 3 fatalities related to harassment and violence reported to the Labour Program on the 2022 EAHVOR compared to zero fatalities related to harassment and violence on the 2021 EAHVOR.
The distribution of harassment and violence occurrences reported in 2022 generally corresponded to the number of employees in each federal jurisdiction sector.
5,035 occurrences (81%) of harassment and violence occurrences reported in 2022 came from the following sectors:
- Federal Public Services, Public Service Departments and Crown Corporations (PUBS)
- Banking and Banks (BANK)
- Road Transportation (ROAD)
- Air Transportation (AIRT)
- Postal Services and Postal Contractors (POST)
The same 5 sectors reported the majority of the harassment and violence occurrences in 2021. It is worth noting that these 5 sectors are amongst the largest federally regulated sectors. They account for about 1,012,163 FTEs, which corresponds to 82.1% of the total FTEs covered by employers who submitted a report in 2022.

Text description of Chart 1
| Sector | Distribution of harassment and violence occurrences coverage (%) | Distribution of employee coverage (%) |
|---|---|---|
| PUBS | 30.3% | 33.7% |
| ROAD | 22.5% | 13.3% |
| AIRT | 11.4% | 7.8% |
| POST | 8.9% | 4.6% |
| BANK | 7.8% | 22.7% |
| All others* | 19.1% | 17.9% |
- *All others includes sectors not listed above: 1) First Nations, Band Councils, and Indigenous Self-Governments (certain activities), 2) Communications, 3) Rail Transportation, 4) Water Transportation (Shipping and Ferries), 5) Broadcasting (Television, Radio and Internet), 6) Longshoring, Stevedoring, Port, Harbour Operations and Pilotage, 7) Energy, Mining and Mineral Processing, 8) Feed, Flour and Seed, 9) Pipeline Transportation, 10) Grain Handling and Grain Elevators, 11) Interprovincial Infrastructure (Bridges, Tunnels, Canals, and Causeways)
Public vs. private sector analysis
| Sector and year | Distribution of harassment and violence occurrences (%) | Distribution of employees (%) |
|---|---|---|
| Public sector, 2021 | 33.6% | 33.7% |
| Public sector, 2022 | 30.3% | 33.7% |
| Private sector, 2021 | 66.4% | 66.3% |
| Private sector, 2022 | 69.7% | 66.3% |
In both 2021 and 2022, the number of reported sexual harassment and violence occurrences in the private sector was roughly double that of the public sector.
The share of reported sexual harassment and violence occurrences in the public sector as a percentage of the total harassment and violence occurrences remained approximately the same, from 5.4% in 2021 to 5.5% in 2022.
The share of reported sexual harassment and violence occurrences in the private sector increased from 10.9% in 2021 to 14.3% in 2022.
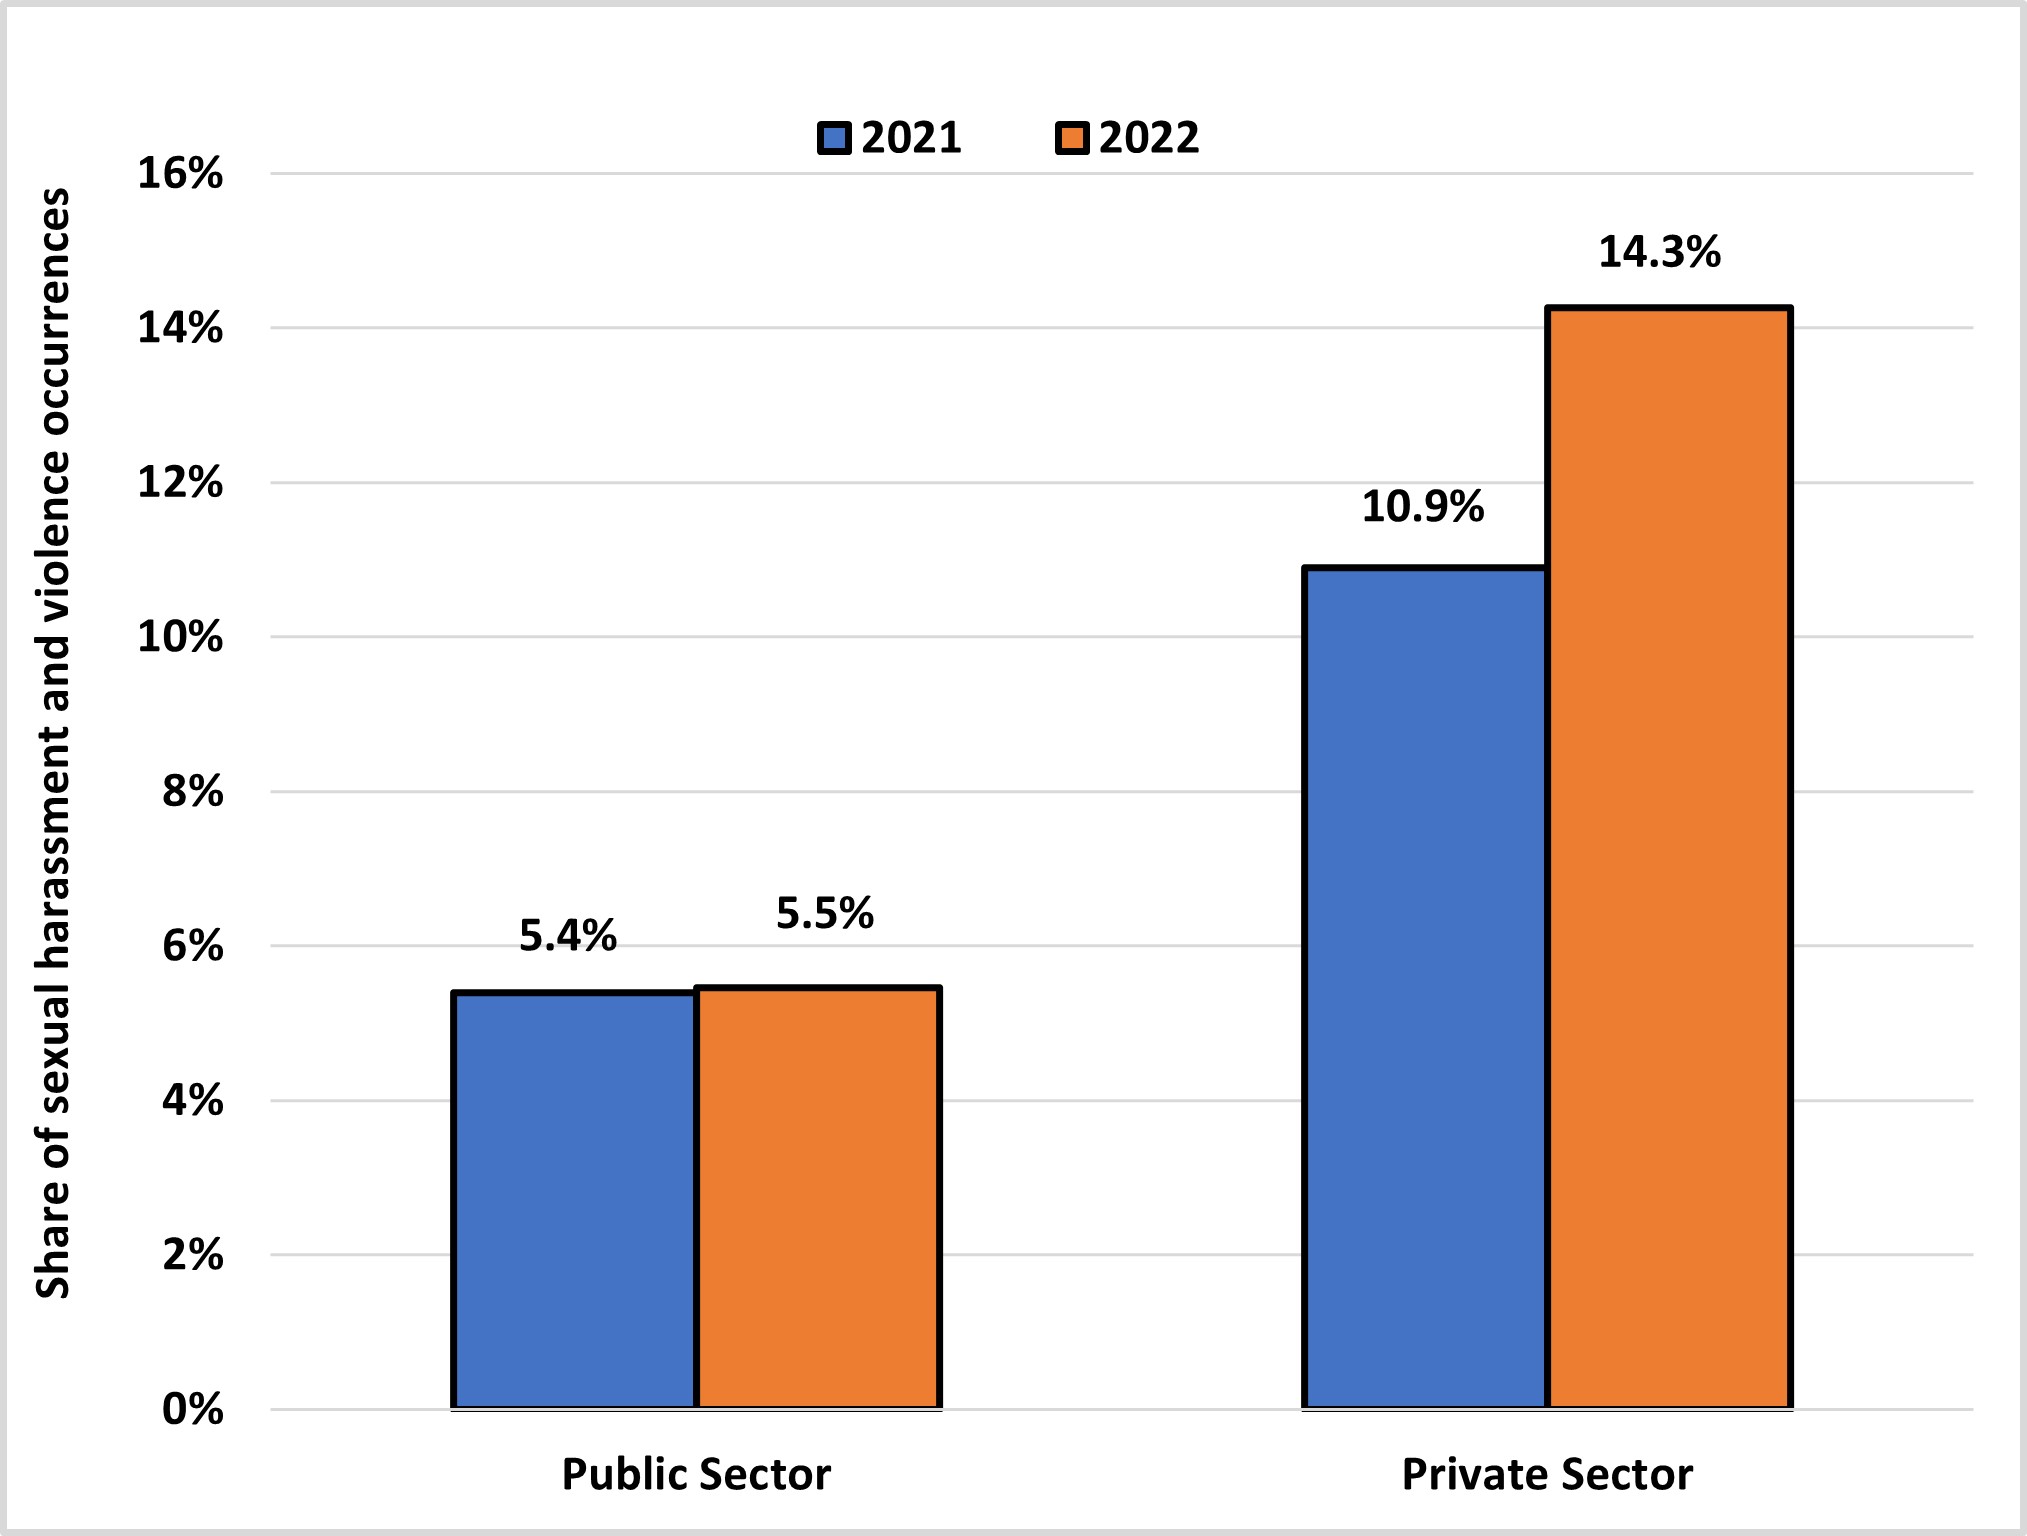
Text description of Chart 2
| Sector and year | Share of sexual harassment and violence occurrences (%) |
|---|---|
| Public sector, 2021 | 5.4% |
| Public sector, 2022 | 5.5% |
| Private sector, 2021 | 10.9% |
| Private sector, 2022 | 14.3% |
Sexual harassment and violence occurrences
In 2022, the following 10 private sector industries reported 79.5% of all sexual harassment and violence occurrences. These industries all reported at least 10% of their total harassment and violence occurrences to be sexual in nature.
- Road Transportation
- Air Transportation
- Banking and Banks
- Communications
- First Nations, Band Councils, and Indigenous Self-Governments (certain activities)
- Water Transportation (Shipping and Ferries)
- Energy, Mining and Mineral Processing
- Feed, Flour and Seed
- Grain Handling and Grain Elevators
- Pipeline Transportation
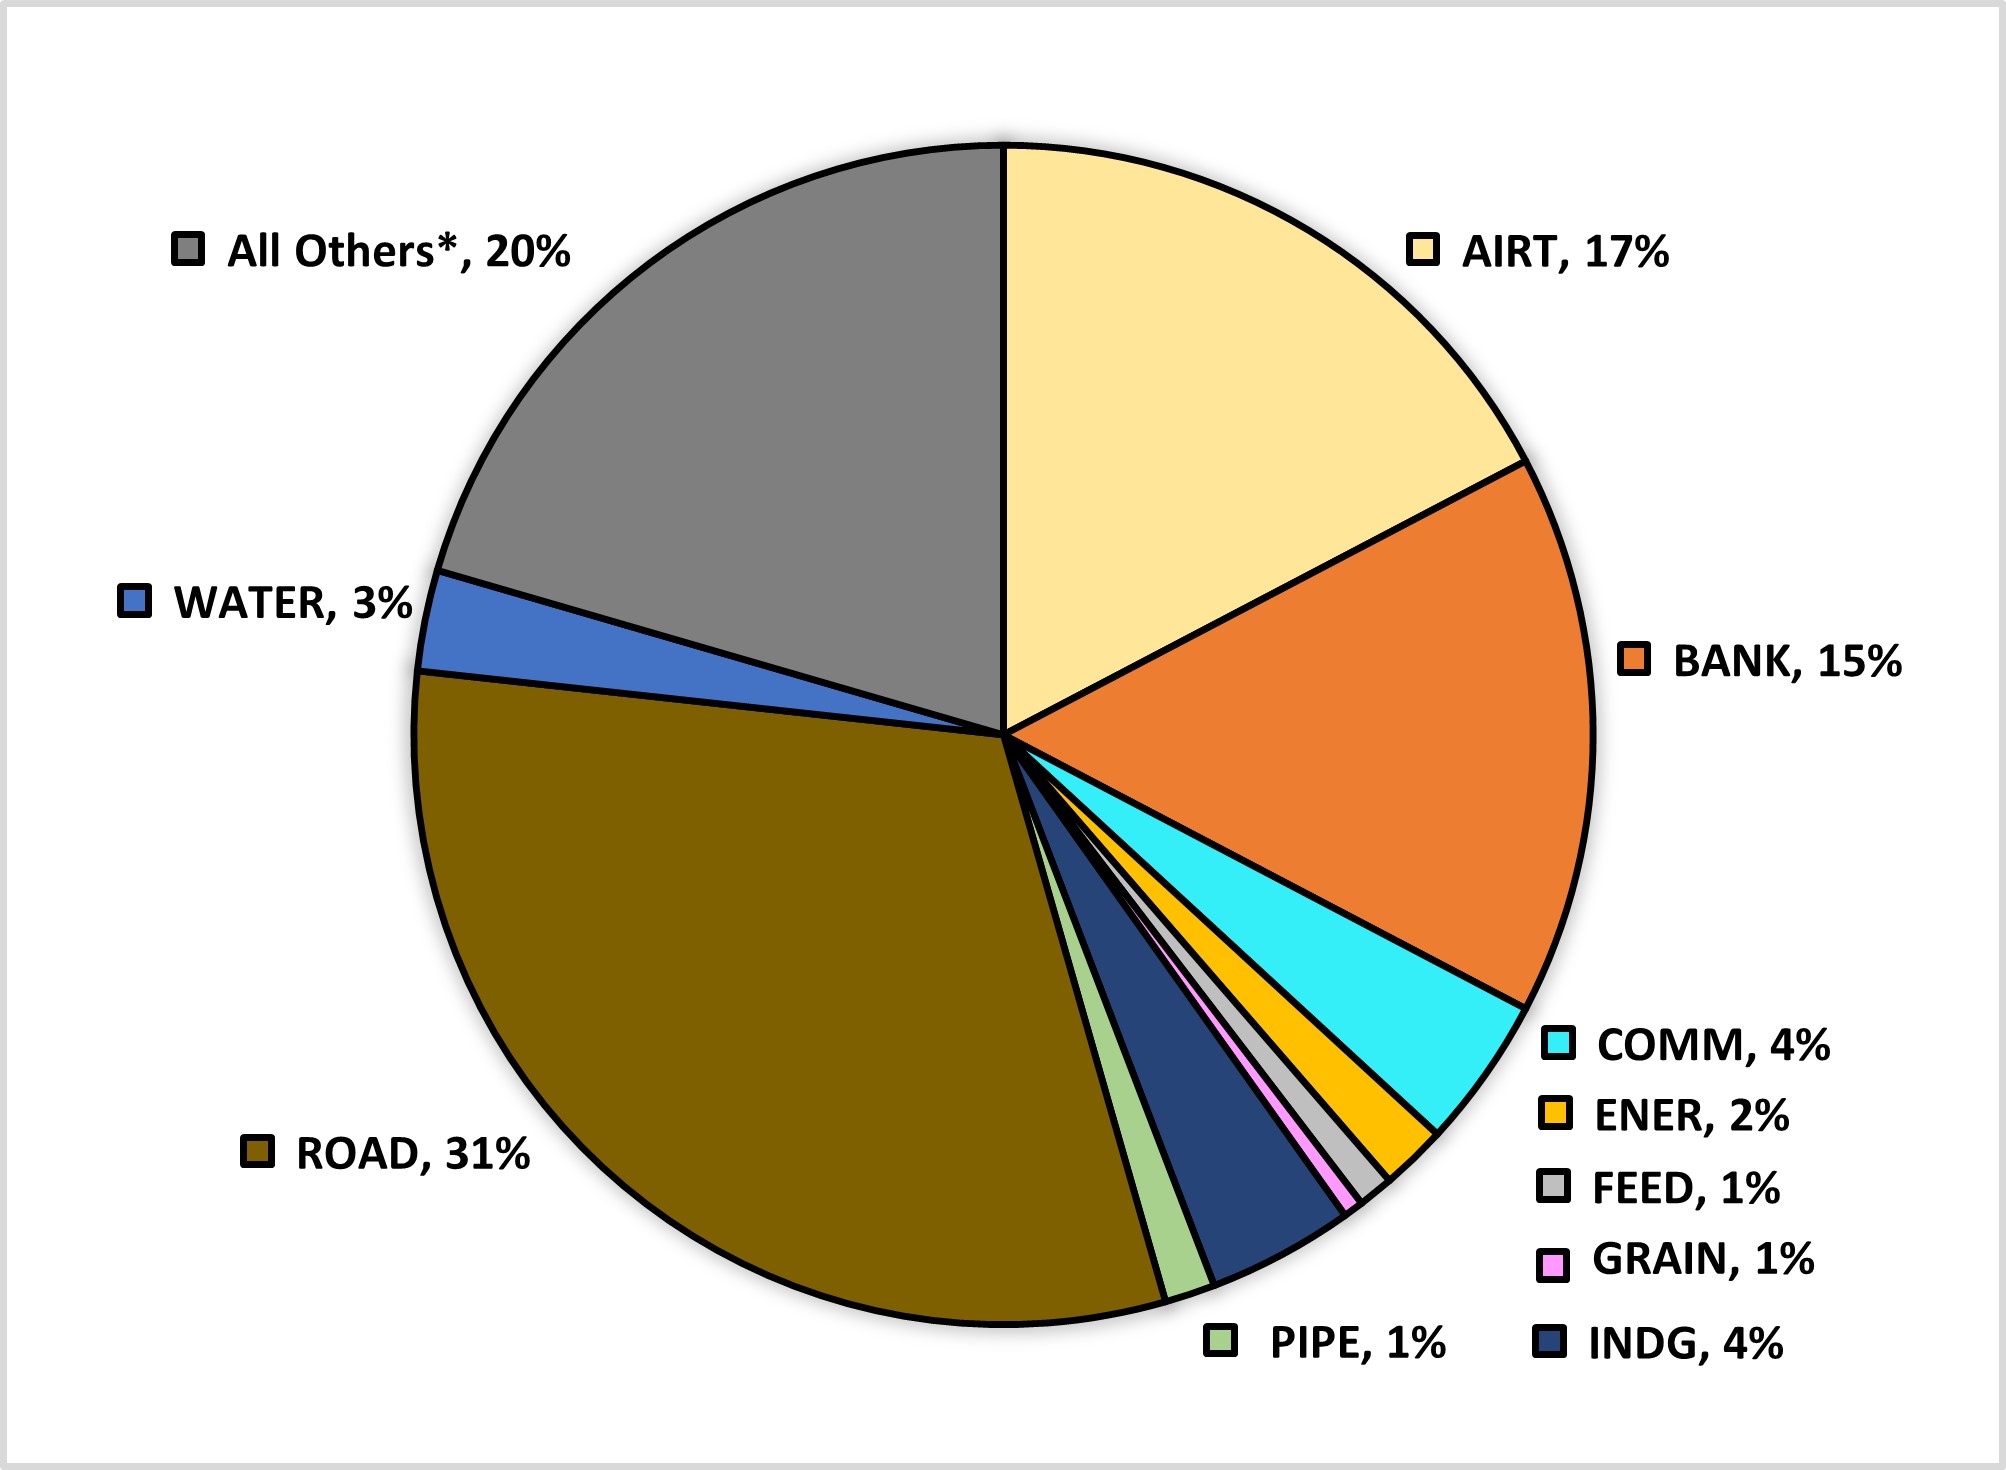
Text description of Chart 3
| Sector | Total sexual harassment and violence occurrences (%) |
|---|---|
| ROAD | 31% |
| AIRT | 17% |
| BANK | 15% |
| COMM | 4% |
| INDG | 4% |
| WATER | 3% |
| ENER | 2% |
| FEED | 1% |
| GRAIN | 1% |
| PIPE | 1% |
| All others* | 20% |
- * All Others includes all industries reporting less than 10% of occurrences being reported as sexual within the sector.
Business size analysis
In 2022, a total of 541 employers reported at least 1 harassment and violence occurrence (501 in 2021). As shown in Table 2, close to 82% of large businesses who submitted an EAHVOR reported at least 1 harassment and violence occurrence, approximately 34% for medium businesses, and almost 5% for small businesses. The percentage breakdown remains relatively similar between 2021 and 2022.
| Business size | Number of submissions | Number of submissions with at least 1 harassment and violence occurrence | Percentage of businesses reporting at least 1 harassment and violence occurrence (%) |
|---|---|---|---|
| Small (fewer than 100 FTEs) | 4,040 | 192 | 4.8% |
| Medium (100 to 499 FTEs) | 530 | 179 | 33.8% |
| Large (500 or more FTEs) | 208 | 170 | 81.7% |
| Total | 4,778 | 541 | 11.3% |
In 2021 and 2022, the majority (77.5% and 78.9% respectively) of reported harassment and violence occurrences were non-sexual across all business sizes.
| Business size | Total number of harassment and violence occurrences | Total number of sexual harassment and violence | Total number of non-sexual harassment and violence |
|---|---|---|---|
| Small | 418 | 53 | 303 |
| Medium | 760 | 86 | 581 |
| Large | 5,048 | 583 | 4,031 |
| Total | 6,226* | 722 | 4,915 |
- * The sum of sexual harassment and violence occurrences and non-sexual harassment and violence occurrences do not equal the total number of harassment and violence occurrences since the type of some occurrences are unknown in employer EAHVOR submissions.
For detailed statistics on the prevalence of harassment and violence occurrences, see Annex 2.
Section 2: What are the commonly used methods of resolution?
Employers are required to begin the resolution process for all harassment and violence occurrences within 45 days of an occurrence being reported. Each employer has the option to employ 1 or more resolution methods in their efforts, with the goal of resolving the occurrence between all parties involved.
Incidents of harassment and violence can be resolved through 4 resolution methods:
- Negotiated Resolution: Employers begin by working with the principal party to review whether the occurrence constitutes harassment or violence as defined in the Code. For occurrences where the employer and principal make a joint determination that the occurrence does not meet the definition, the occurrence is considered resolved. If an occurrence is also being investigated and the investigator has provided their report, a negotiated resolution is no longer an available option.
- Conciliation: Should the principal and responding party agree, employers may engage in a conciliation to address the occurrence. This requires both parties to also agree to the person who facilitates. If an occurrence is also being investigated and the investigator has provided their report, conciliation is no longer an available option.
- Investigation: If an occurrence is not resolved through negotiated resolution or conciliation, a principal party may request an investigation. A qualified investigator is selected as outlined in the provisions within the Regulations. Once selected, the investigator must provide a report that contains a general description of the occurrence, their conclusions including circumstances that contributed to the occurrence, and recommendations to mitigate risk of a subsequent occurrence in the workplace. The employer and the workplace committee or health and safety representative then jointly determine the recommendations to implement. An investigation must be carried out if the principal party requests it. If the occurrence is resolved through a negotiated resolution or conciliation before the investigator has provided their report, the investigation must be discontinued.
- Workplace Assessment: Employers are required to develop a workplace assessment. This involves joint collaboration between employers and the applicable partners (for example: policy committee or, if there is no policy committee, the workplace committee or the health and safety representative) to identify risks of harassment and violence, as well as to develop and implement preventative measures for each risk. This assessment must be reviewed, and updated (if required), by employers and their respective workplace committee or health and safety representative when a case of harassment and violence occurs if the occurrence is not resolved through negotiated resolution, and the principal party informs the employer that they choose not to continue. Workplace assessments are also required to be reviewed if the responding party is not an employee or an employer.
Following the initial review, the occurrence is deemed to be resolved if the notice does not contain the name of the principal party or otherwise allow their identity to be determined.
Each year, employers are required to report the final method they used to resolve a harassment and violence occurrence. In 2022, 4,554 resolutions (2,950 in 2021) were implemented to resolve harassment and violence occurrences, broken down as follows:
Negotiated Resolution: 1,475 of all resolutions reported by employers, or 32.4% (39.2% in 2021).
Conciliation: 255 of all resolutions reported by employers, or 5.6% (6.8% in 2021).
Investigation: 2,287 of all resolutions reported by employers, or 50.2% (47.3% in 2021).
Workplace Assessment: 537 of all resolutions reported by employers, or 11.8% (6.8% in 2021).
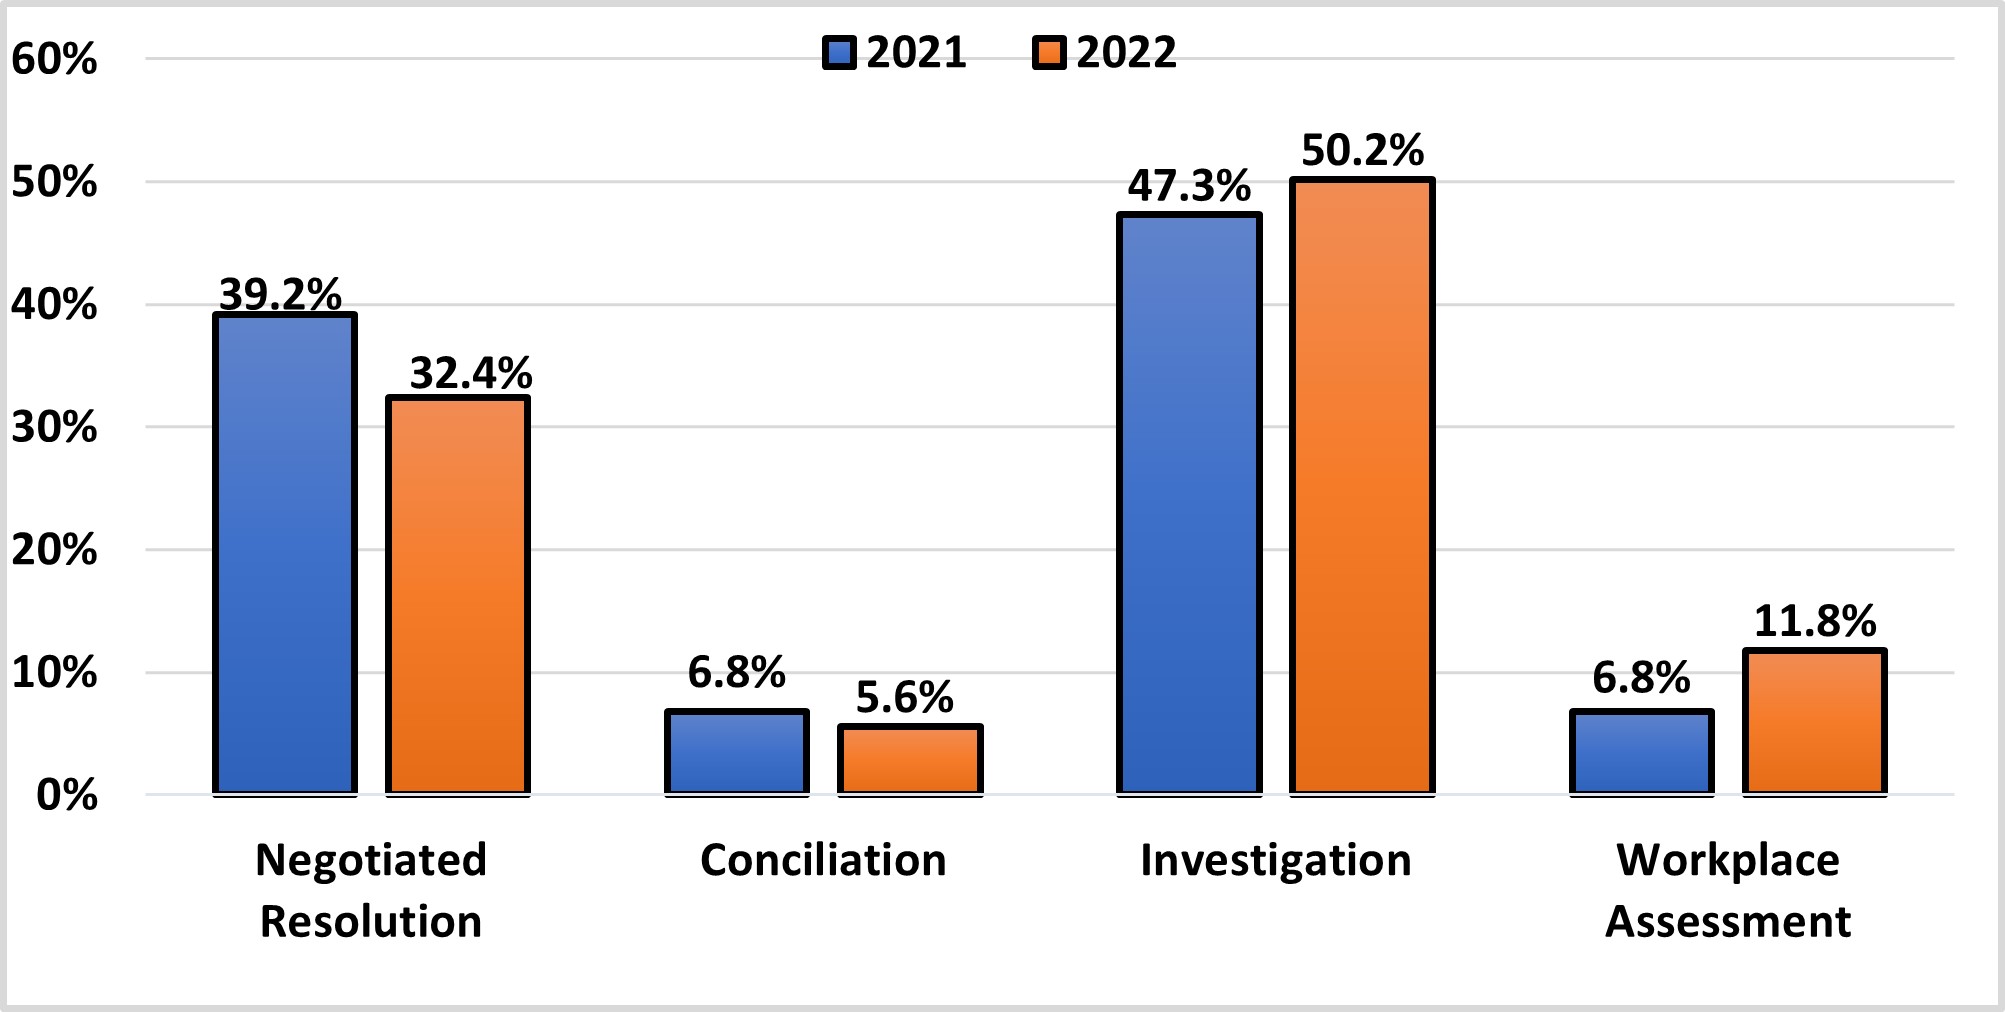
Text description of Chart 4A
| Sectors by year | Negotiated Resolution (%) | Conciliation (%) | Investigation (%) | Workplace Assessment (%) |
|---|---|---|---|---|
| 2021 | 39.2% | 6.8% | 47.3% | 6.8% |
| 2022 | 32.4% | 5.6% | 50.2% | 11.8% |
During the reporting period, negotiated resolution was the most commonly used resolution method in the public sector, with 42% of resolutions being of this type (62% in 2021). Investigation was the most common method of resolution in the private sector, with 57% of resolutions being of this type (53% in 2021).

Text description of Chart 4B
| Type of resolution | Public sector (%) | Private sector (%) |
|---|---|---|
| Negotiated Resolution | 42% | 29% |
| Conciliation | 5% | 6% |
| Investigation | 29% | 57% |
| Workplace Assessment | 24% | 8% |
Business size analysis
In 2021 and 2022, investigations were the most frequently reported resolution method, followed by negotiated resolutions, for all business sizes.
| Business Size | Number of completed resolutions | Investigation (%) | Negotiated Resolution (%) | Workplace Assessment (%) | Conciliation (%) |
|---|---|---|---|---|---|
| Small | 316 | 52.5% | 23.1% | 15.2% | 9.2% |
| Medium | 661 | 53.9% | 23.1% | 12.1% | 10.9% |
| Large | 3,577 | 49.3% | 34.9% | 11.4% | 4.3% |
| Total | 4,554 | 50.2% | 32.4% | 11.8% | 5.6% |
Notably, there was an increase in investigations in 2022 for small and large-sized businesses. There was a slight decrease in the percentage of investigations for medium-sized businesses.
For detailed statistics on the number of harassment and violence occurrences of each resolution type used by employers in a given sector, see Annex 3.
Section 3: What relationships exist between parties involved in a harassment and violence occurrence?
On the EAHVOR employers identify the primary relationships between parties involved in a harassment and violence occurrence. Each relationship type involves a principal party and a responding party.
Six relationship types exist for employers to identify and describe the relationship between those parties involved in an occurrence. An occurrence can involve multiple relationship structures as well, as more than 1 individual may be involved within the occurrence. The 6 relationship types available to employers are:
Employee to Employee: The principal party and responding party are both employees. Employee to Employee accounted for 2,650 occurrences (or 42.6%) in 2022 and 2,222 occurrences (or 41.6%) in 2021.
Employee to Supervisor, Manager, or Business Owner: The principal party is an employee, while the responding party is a supervisor, manager, business owner, or other individual in a supervisory role. Employee to Supervisor, Manager, or Business Owner accounted for 2,178 occurrences (or 35.0%) in 2022 and 2,016 occurrences (or 37.7%) in 2021.
Employee to Third Party, Client, Contractor, or Member of the Public: The principal party is an employee, while the responding party is someone outside of the organization. Employee to a Third Party, Client, Contractor, or Member of the Public accounted for 843 occurrences (or 13.5%) in 2022 and 596 occurrences (or 11.2%) in 2021.
Supervisor, Manager, or Business Owner to Employee: The principal party is a supervisor, manager, business owner, or other individual in a supervisory role, while the responding party is an employee. Supervisor, Manager, or Business Owner to Employee accounted for 395 occurrences (or 6.3%) in 2022 and 370 occurrences (or 6.9%) in 2021.
Employee to Other: The principal party is an employee, while the responding party identified does not fall into one of the other identified categories. Employee to Other accounted for 128 occurrences (or 2.1%) in 2022 and 106 occurrences (or 2.0%) in 2021.
Employee to a Domestic Partner: The principal party is an employee, while the responding party is a domestic partner. Employee to a Domestic Partner accounted for 32 occurrences in both 2022 and 2021, or 0.5% and 0.6% respectively.
Of all the types of principal party and responding party relationships, an employee / employee and employee / supervisor, manager accounted for the majority (a combined 77.6% in 2022 and 79.3% in 2021) of harassment and violence occurrences (see Chart 5). A principal party could not be identified in 2.3% of all resolutions.
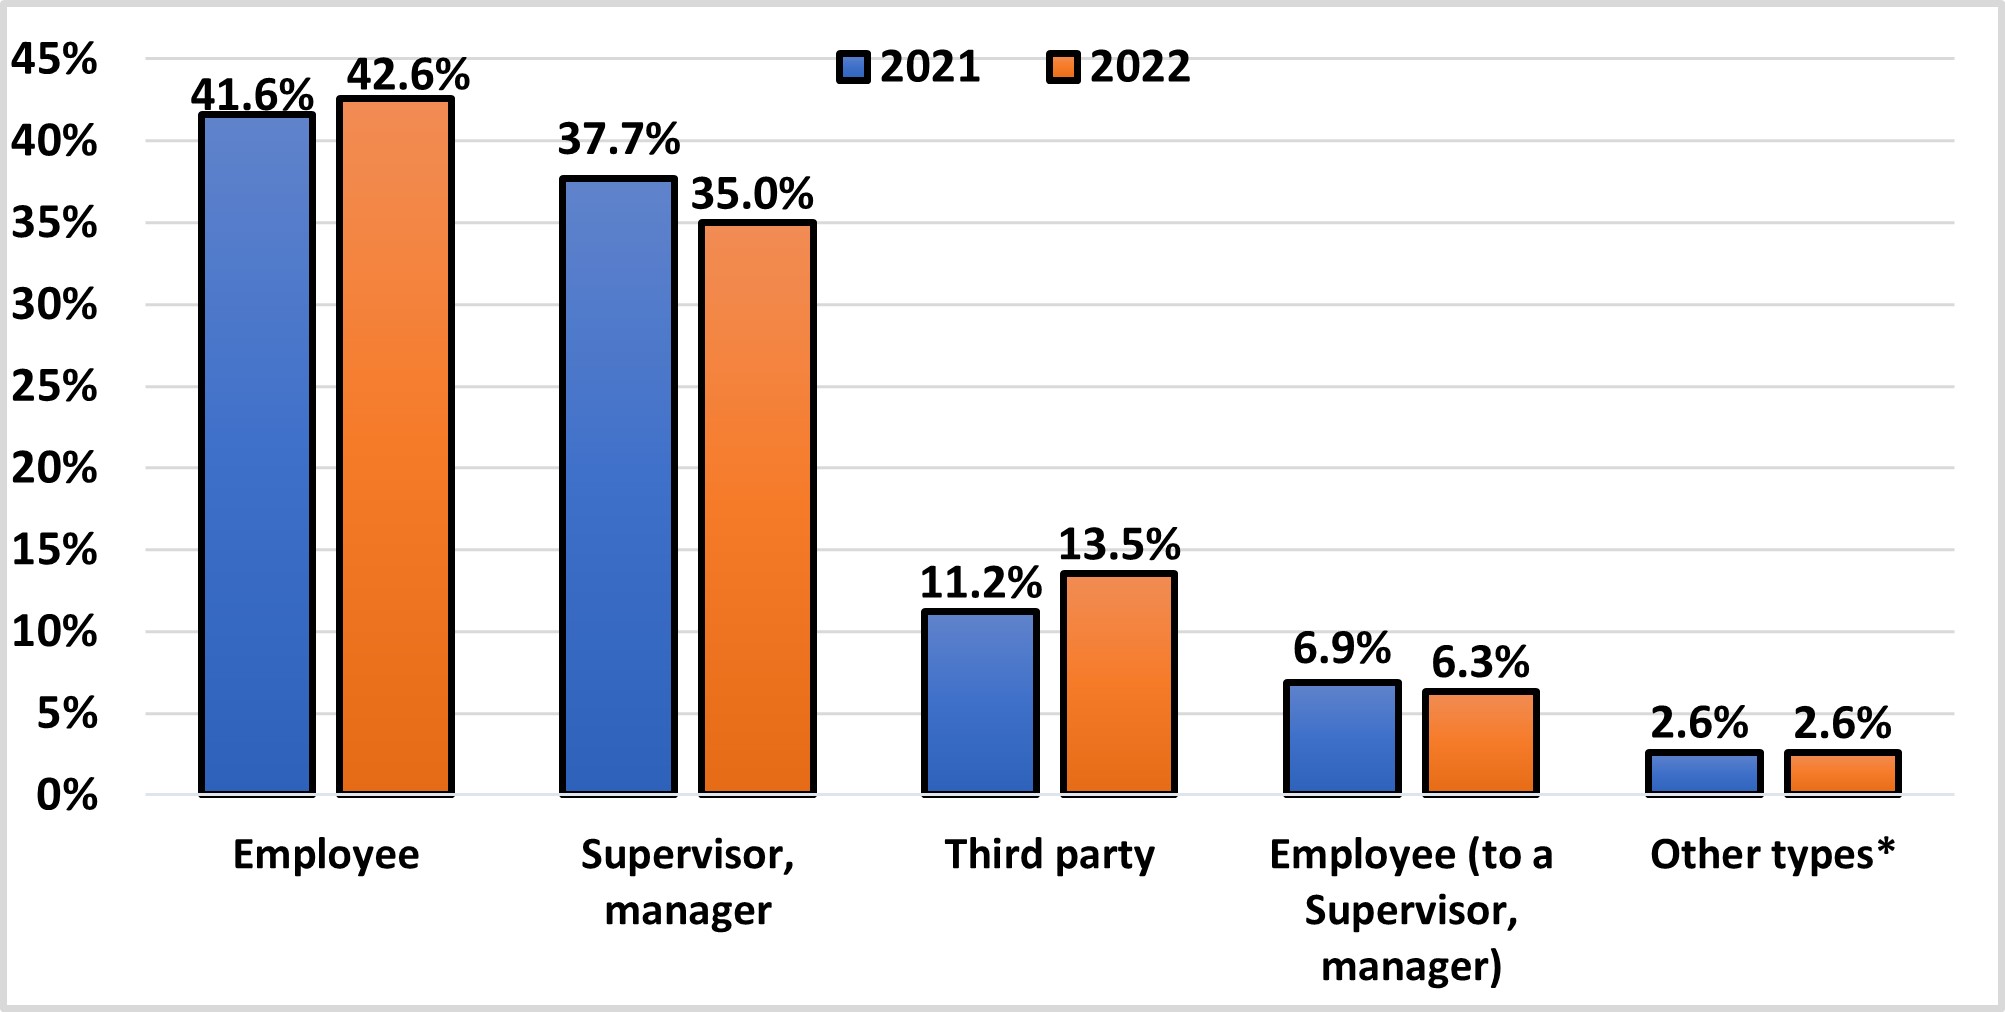
Text description of Chart 5
| All sectors by year | Employee (%) | Supervisor, manager (%) | Third party (%) | Employee (to a supervisor, manager) (%) | Other types* (%) |
|---|---|---|---|---|---|
| 2021 | 41.6% | 37.7% | 11.2% | 6.9% | 2.6% |
| 2022 | 42.6% | 35.0% | 13.5% | 6.3% | 2.6% |
- *Other types include identified relationships involving a Domestic Partner (0.6% of all relationships in 2021 and 0.5% in 2022) and those identified as Other (2.0% of all relationships in 2021 and 2.1% in 2022).
Public vs. private sector analysis
In 2021 and 2022 for both the private and public sector, the percentage reported for each relationship followed a similar percentage pattern.
In 2022, the private sector reported a much higher percentage of third party occurrences compared to the public sector.
In 2022, the public sector reported approximately 26 percentage points more occurrences by a supervisor or manager compared to the private sector.
The most common relationship types for both the private and public sector are depicted in the chart below:

Text description of Chart 6
| Sector | Employee (%) | Supervisor, manager (%) | Third party (%) | Employee (to a supervisor, manager) (%) | Other types* (%) |
|---|---|---|---|---|---|
| Public sector | 31.7% | 53.0% | 5.6% | 6.8% | 2.9% |
| Private sector | 47.6% | 26.6% | 17.2% | 6.1% | 2.4% |
- * Other types include identified relationships involving a domestic partner (0.5% of all relationships) and those identified simply as other (2.1% of all relationships).
Business size analysis
Analysis of the reported relationships involved in harassment and violence occurrences showed that an employee being the victim of harassment or violence by another employee was the most frequently reported harassment and violence relationship for all business sizes in 2022, followed by an employee being the victim of harassment or violence by a supervisor, manager.
| Business size | Total relationships identified | Employee (%) | Supervisor, manager (%) | Employee (to a supervisor, manager, etc.) (%) | Third party (%) | Other types (%) |
|---|---|---|---|---|---|---|
| Small | 434 | 45.6% | 29.5% | 6.0% | 11.8% | 7.1% |
| Medium | 739 | 48.3% | 30.6% | 7.2% | 10.7% | 3.2% |
| Large | 5,053 | 41.5% | 36.1% | 6.3% | 14.1% | 2.1% |
| Total | 6,226 | 42.6% | 35.0% | 6.3% | 13.5% | 2.6% |
In 2022, there were 843 reported occurrences of harassment and violence that involved a third party. This is a 41% increase from 2021, when there were 596 reported occurrences of harassment and violence involving a third party.
Some industries rely on their employees to maintain relationships with individuals outside of their organization, such as members of the public, outside clients, contractors and others. These individuals are identified on the EAVHOR as third party, client, contractor, or member of the public. Among the top 4 types of relationships noted above (see Chart 6), the third party relationship is the most challenging for the employer to control. The 5 industries below reported a higher percentage of this relationship type than the average across all sectors (13.5%), as depicted by the black line in Chart 7.
- Postal Services and Postal Contractors
- Road Transportation
- First Nations, Band Councils, and Indigenous Self-Governments (certain activities)
- Communications
- Banking and Banks

Text description of Chart 7
| Sector | Third party, client, contractor or member of the public (%) |
| POST | 46.5% |
| ROAD | 19.0% |
| INDG | 16.1% |
| COMM | 14.2% |
| BANK | 13.9% |
- * The black line depicts the total reported occurrences by a third party, client, contractor, public divided by the total number of harassment and violence occurrences multiplied by 100 (as a percentage this is equal to 13.5%).
The chart below shows the percentage, by sector, of all 843 occurrences that involved a member of a third party.
In 2022, the 5 industries discussed above reported a combined 77.3% of the 843 occurrences for this relationship type.
Compared to 2021, the 5 industries discussed above reported a combined 81.2% of the 596 occurrences for this relationship type.
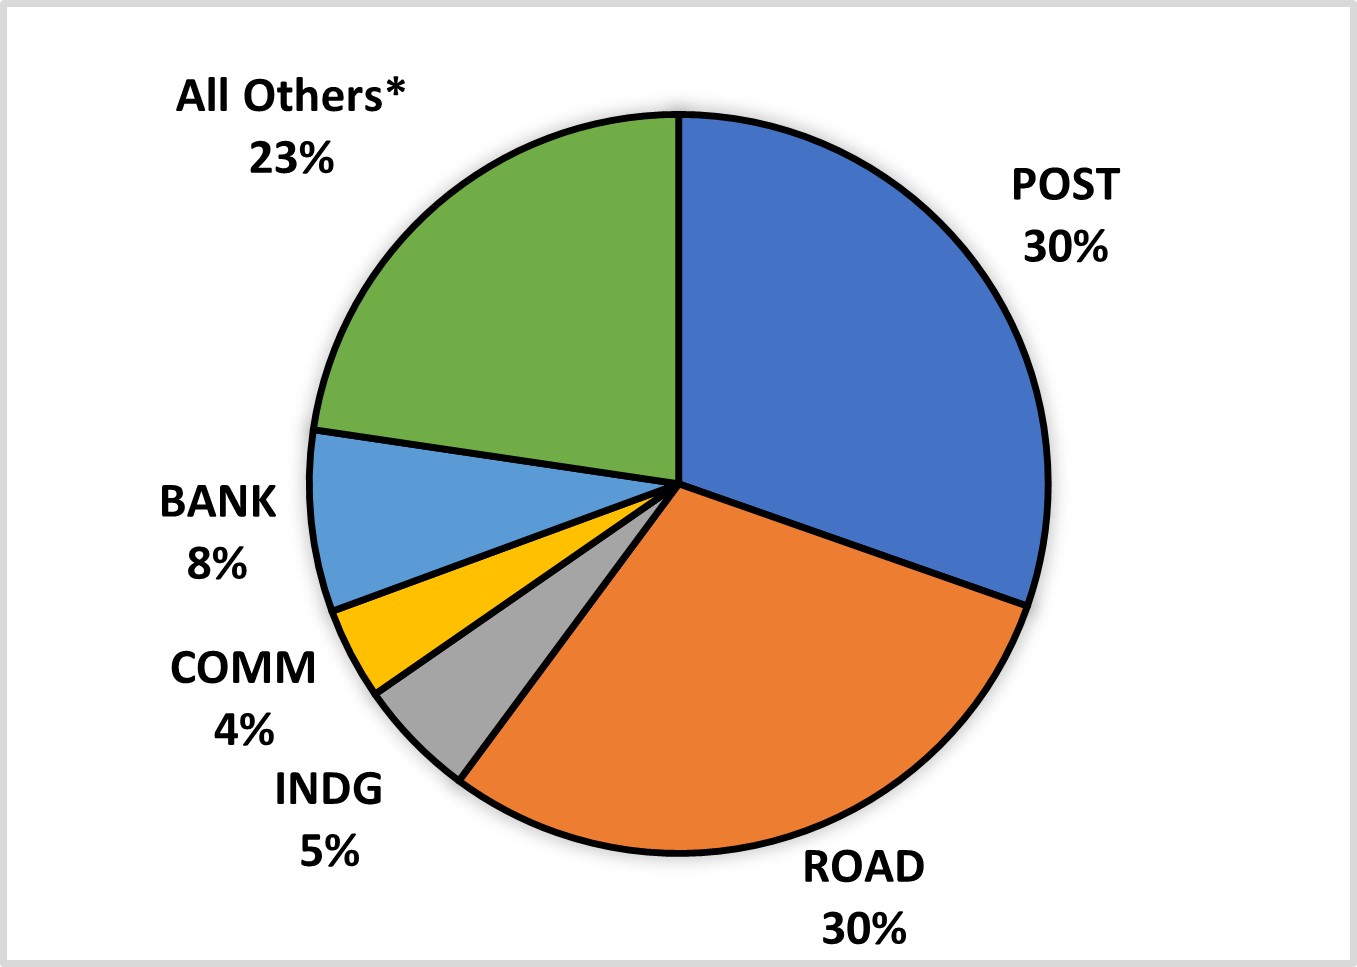
Text description of Chart 8
| Sector | Percentage of all third party harassment and violence occurrences (%) |
|---|---|
| ROAD | 30% |
| POST | 30% |
| BANK | 8% |
| INDG | 5% |
| COMM | 4% |
| All others | 23% |
- * The chart depicts the breakdown of all 843 harassment and violence occurrences involving a third party, client, or contractor. 77.3% of all third party occurrences belong to the 5 sectors identified above.
For detailed statistics on the prevalence of each relationship type identified by employers in a given sector, see Annex 4.
Section 4: What role does discrimination play in harassment and violence occurrences?
When employers report on a harassment and violence occurrence, they are required to indicate if the occurrence is allegedly related to prohibited grounds of discrimination, if known.
The 13 prohibited grounds of discrimination in the Canadian Human Rights Act are discriminatory practices based on race, national or ethnic origin, colour, religion, age, sex, sexual orientation, gender identity or expression, marital status, family status, genetic characteristics, disability or conviction for an offence for which a pardon has been granted or in respect of which a record suspension has been ordered.
For all 6,226 reported occurrences, employers identified that 20% (1,273) of occurrences are related to prohibited grounds of discrimination under the Canadian Human Rights Act in 2022 (19% or 952 occurrences in 2021). It is important to note that it is possible for 1 occurrence to involve multiple grounds of discrimination.
The most identified grounds of discrimination in both 2021 and 2022 included discrimination by Sex, Race, Disability, and National or Ethnic Origin. In 2021 and 2022, the sectors reporting the most instances of discrimination were:
- Federal Public Services, Public Service Departments and Crown Corporations
- Air Transportation
- Road Transportation
- Banking and Banks
- Postal Services and Postal Contractors
The 5 sectors above are amongst the largest federally regulated employers. They account for about 1,012,163 FTEs, which corresponds to 82.1% of the total FTEs covered by employers who submitted a report in 2022. The 5 sectors above reported 87% of the total discrimination identified in the 2022 EAHVORs.
| Sectors | Total discrimination identified | Race | National or Ethnic Origin | Disability | Sex | All other grounds** |
|---|---|---|---|---|---|---|
| PUBS | 551 | 95 | 50 | 114 | 98 | 194 |
| AIRT | 198 | 40 | 27 | 15 | 39 | 77 |
| ROAD | 176 | 72 | 16 | 10 | 52 | 26 |
| BANK | 135 | 20 | 34 | 10 | 60 | 11 |
| POST | 47 | 14 | 3 | 4 | 14 | 12 |
| All other industries* | 166 | 46 | 18 | 21 | 44 | 37 |
| Total | 1,273 | 287 | 148 | 174 | 307 | 357 |
- * All Other Industries includes 1) First Nations, Band Councils, and Indigenous Self-Governments (certain activities), 2) Rail Transportation, 3) Communications, 4) Broadcasting, 5) Water Transportation, 6) Energy, Mining and Mineral Processing, 7) Longshoring, Stevedoring, Port, Harbour Operations and Pilotage, 8) Grain Handling and Grain Elevators, 9) Pipeline Transportation, 10) Feed, Flour and Seed, 11) Interprovincial Infrastructure (Bridges, Tunnels, Canals, and Causeways)
- ** All Other Grounds of Discrimination includes remaining prohibited grounds of discrimination outside of the top 4, as identified by the Canadian Human Rights Act: 1) Age, 2) Colour, 3) Religion, 4) Sexual Orientation, 5) Family Status, 6) Gender Identity or Expression, 7) Genetic Characteristics, 8) Marital Status, 9) Conviction, Pardon Granted, or Record Suspended
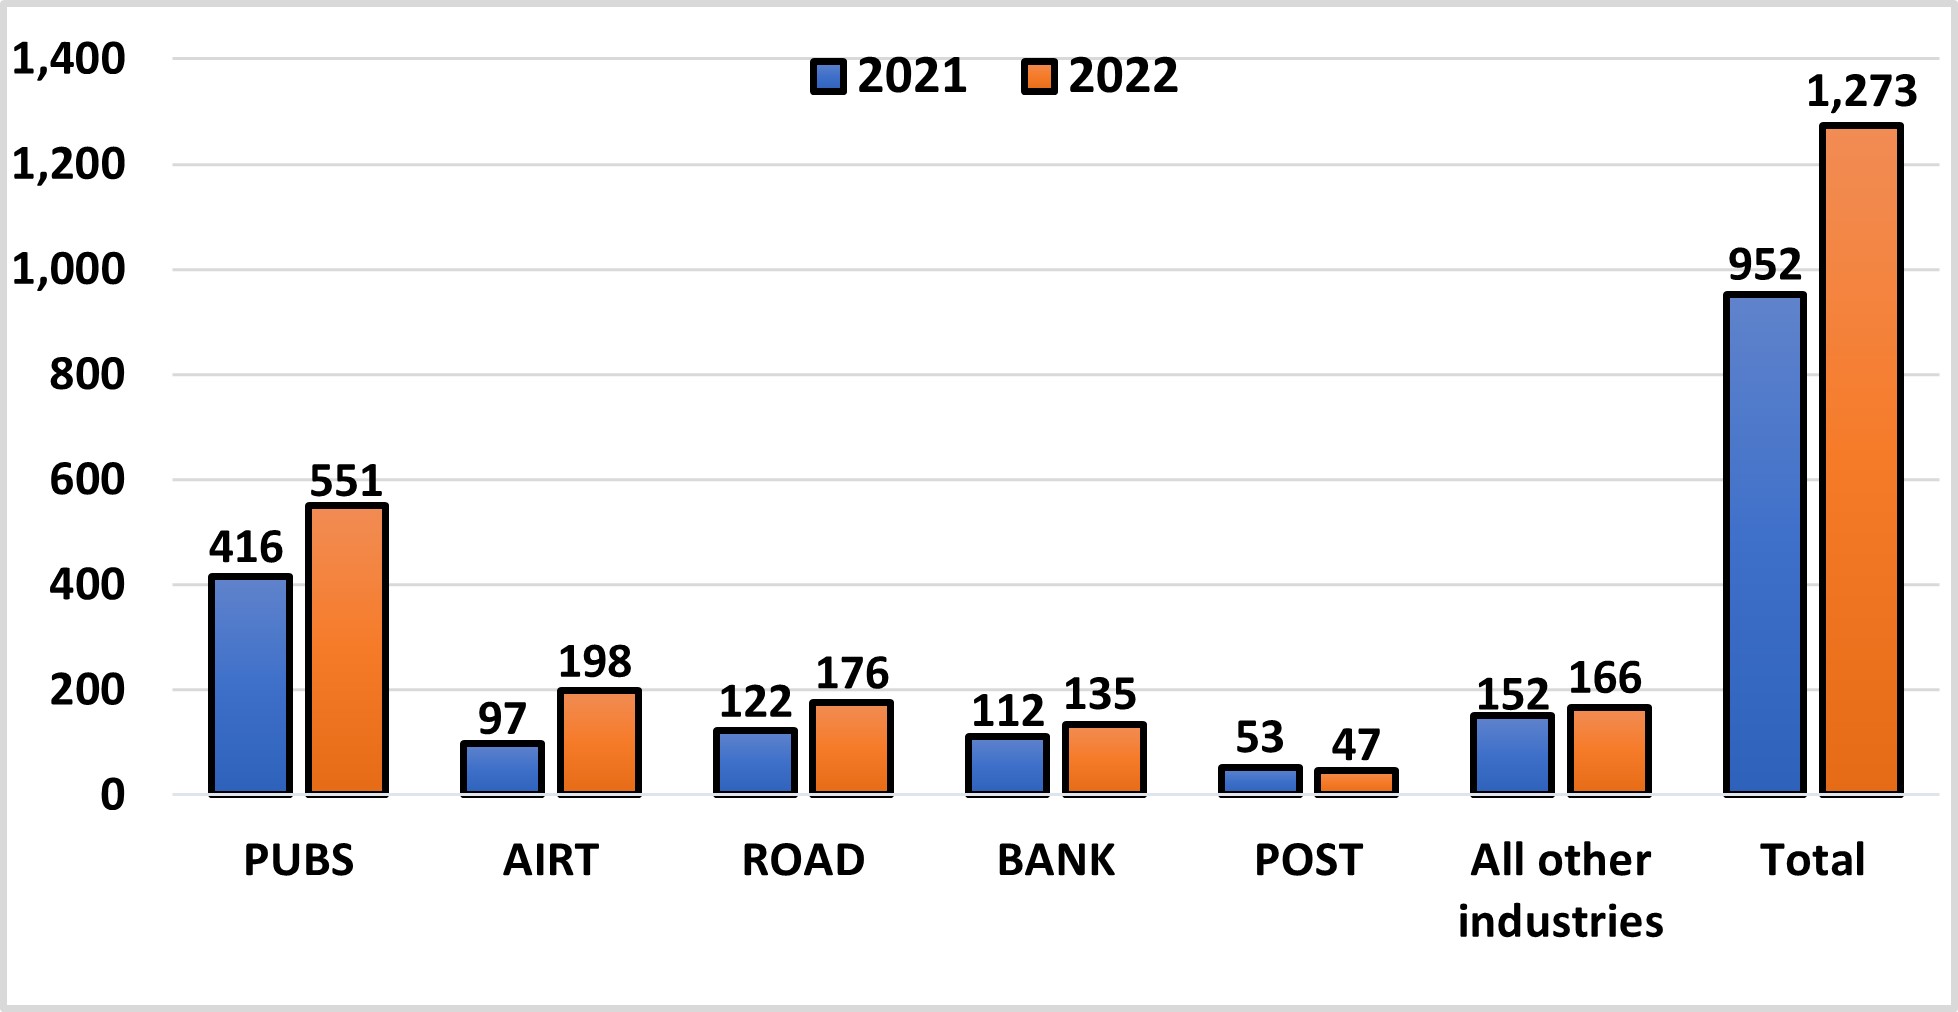
Text description of Chart 9A
| Sector | Total discrimination identified in 2021 | Total discrimination identified in 2022 |
|---|---|---|
| PUBS | 416 | 551 |
| AIRT | 97 | 198 |
| ROAD | 122 | 176 |
| BANK | 112 | 135 |
| POST | 53 | 47 |
| All other industries* | 152 | 166 |
| Total | 952 | 1,273 |
- * All other industries includes 1) First Nations, Band Councils, and Indigenous Self-Governments (certain activities), 2) Rail Transportation, 3) Communications, 4) Broadcasting, 5) Water Transportation, 6) Energy, Mining and Mineral Processing, 7) Longshoring, Stevedoring, Port, Harbour Operations and Pilotage, 8) Grain Handling and Grain Elevators, 9) Pipeline Transportation, 10) Feed, Flour and Seed, 11) Interprovincial Infrastructure (Bridges, Tunnels, Canals, and Causeways)
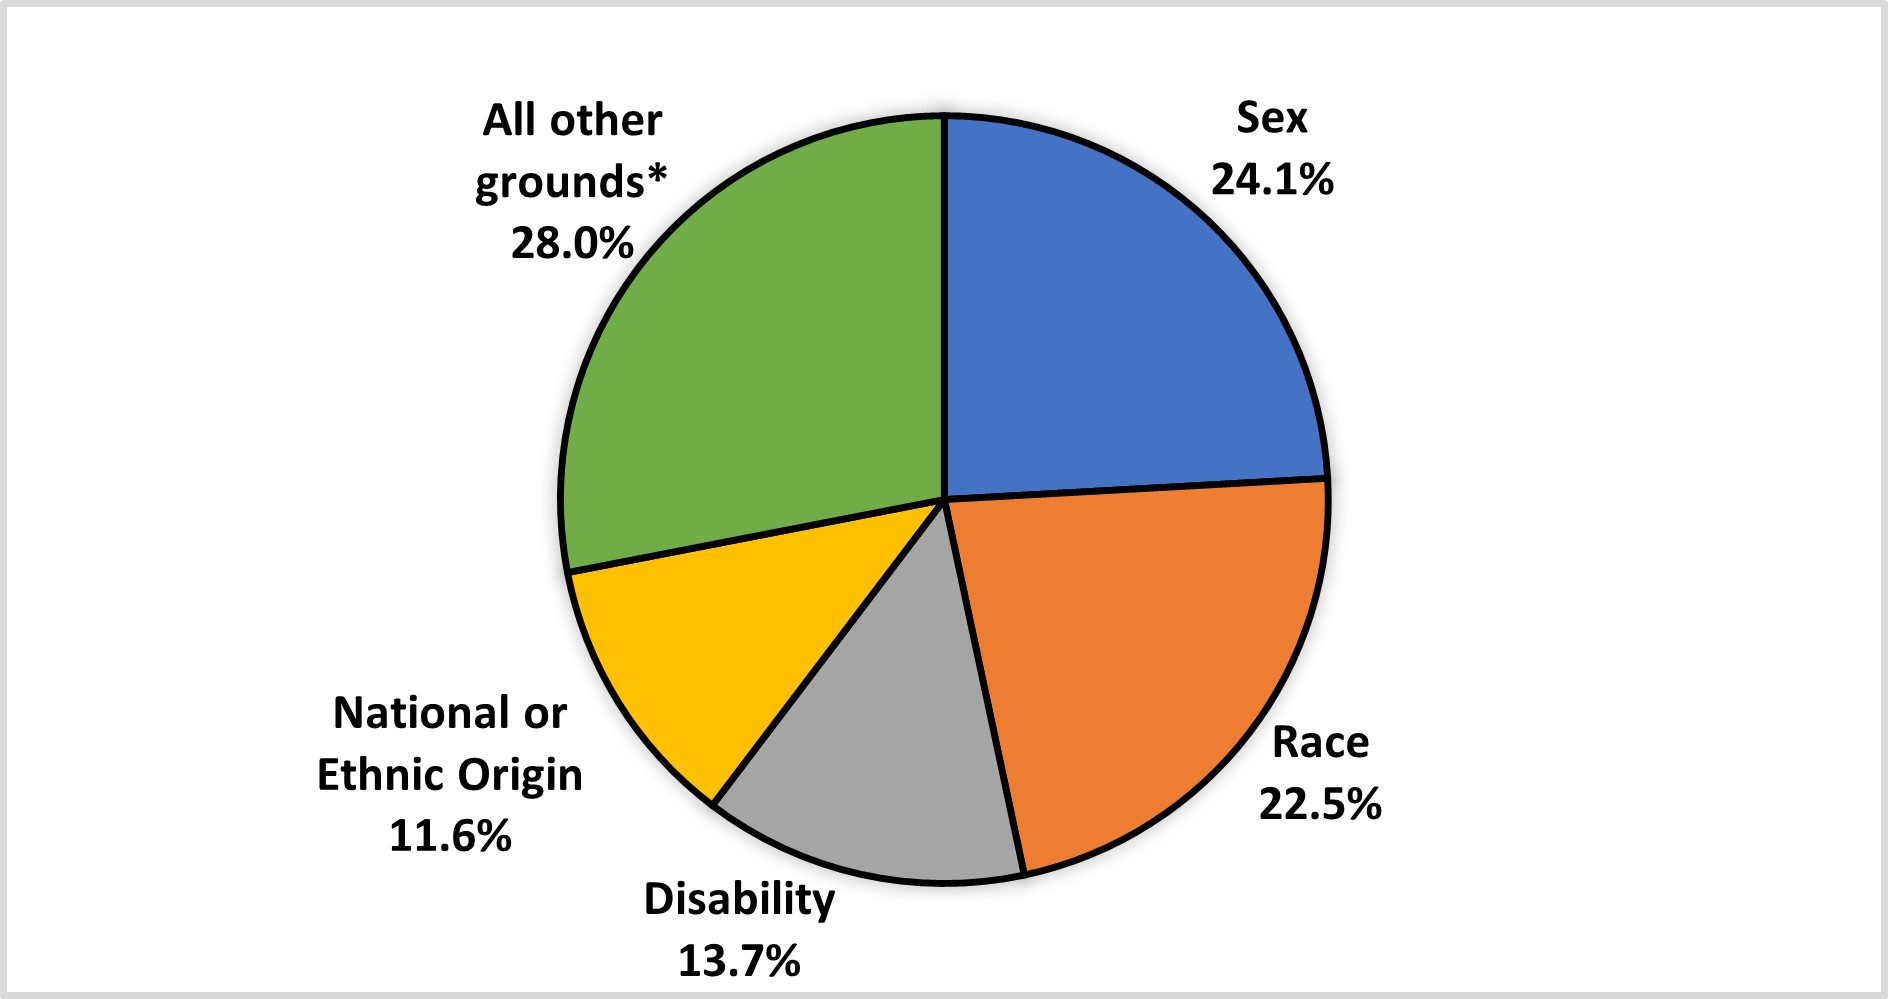
Text description of Chart 9B
| Sector | Sex (%) | Race (%) | Disability (%) | National or Ethnic Origin (%) | All other grounds* (%) |
|---|---|---|---|---|---|
| All industries | 24.1% | 22.5% | 13.7% | 11.6% | 28.0% |
- * All other grounds of discrimination includes remaining types of discrimination outside of the top 4 as identified by the Canadian Human Rights Act: 1) Age, 2) Colour, 3) Religion, 4) Sexual Orientation, 5) Family Status, 6) Gender Identity or Expression, 7) Genetic Characteristics, 8) Marital Status, 9) Conviction, Pardon Granted, or Record Suspended
Business size analysis
In 2021 and 2022, Sex was the most reported ground of discrimination, followed by Race, for small and medium-sized businesses (and for large-sized businesses in 2021). In 2022, Race was the most reported grounds of discrimination for large-sized businesses, followed by Sex.
Medium-sized businesses only provided reasons for 10.3% of harassment and violence occurrences, compared to 17.7% for small-sized businesses and 22.2% for large-sized businesses.
| Business size | Total grounds for harassment and violence occurrences | Percentage of grounds for harassment and violence occurrences of total occurrences (%) | Sex (%) | Race (%) | Disability (%) | National or Ethnic Origin (%) |
|---|---|---|---|---|---|---|
| Small | 74 | 17.7% | 37.8% | 21.6% | 4.1% | 2.7% |
| Medium | 78 | 10.3% | 34.6% | 24.4% | 6.4% | 16.7% |
| Large | 1,121 | 22.2% | 22.5% | 24.4% | 6.4% | 16.7% |
| Total | 1,273 | 20.4% | 24.1% | 22.5% | 13.7% | 11.6% |
For detailed statistics on the number of accounts of discrimination identified by employers in each sector, see Annex 5.
Spotlights
In this section:
- Spotlight: Workplace Harassment and Violence Prevention Fund Initiatives
- Spotlight: Workplace Harassment and Violence Hub
- Spotlight: What are employees working in federally regulated workplaces noting about discrimination, harassment and violence in the workplace?
Spotlight: Workplace Harassment and Violence Prevention Fund Initiatives
The WHVPF (Fund) aims to ensure physical and psychological health and safety in the workplace through promoting and co-developing sector-specific labour management tools with employer and employee groups to help guide cultural change and provide guidance to workplaces regarding the harassment and violence prevention regime. Approaches include behavioural changes, education and guidance, and mandatory training.
The call-out for first round of funding occurred in November 2018 and supported 7 projects whose objectives included developing tools, resources and training materials in several key sectors, including workplaces in First Nations communities and in the maritime, road transportation, banking and performing arts sectors. The organizations that received first round funding include:
- British Columbia Maritime Employers Association
- Nokiiwin Tribal Council
- Trucking HR Canada
- UNI Financial Cooperation
- Centre for Research & Education on Violence Against Women & Children at Western University - this organization is receiving funding for 2 projects
- Canadian Women's Foundation
For further information on the first round projects please see: First round projects funded through the Workplace Harassment and Violence Prevention Fund
The call-out for the second round of funding occurred in April 2022 and supported an additional 7 projects. These 7 projects expand the Fund's geographical and sectoral reach. The organizations scheduled to receive second round funding include:
- Saint Mary's University
- University of Prince Edward Island
- CommeHome Social Services
- Centre for Research & Education on Violence Against Women & Children at Western University
- Trucking HR Canada
- Tk'emlups te Secwepemc
- Berens River First Nation
For further information on the second round projects please see: Second round projects funded through the Workplace Harassment and Violence Prevention Fund
Spotlight: Workplace Harassment and Violence Prevention Hub
A Harassment and Violence Prevention Hub was established in 2018 and includes a webform and 1-800 number linking clients with Labour Program resources who can:
- help clients navigate the harassment and violence prevention provisions
- provide advice to clients on how to file a complaint with the Labour Program if the client believes the employer has been non-compliant with the legislative provision
- direct clients to support services in their community
- direct them to the appropriate jurisdiction if they are not federally regulated
Since being established, on average, the Harassment and Violence Prevention Hub has assisted 1,532 clients each year.
Spotlight: What are employees working in federally regulated workplaces noting about discrimination, harassment and violence in the workplace?
The data and related analysis presented in sections 1 through 4 of the report cover only the harassment and violence occurrences for which a notice of occurrence was provided to the employer (designated recipient) under subsection 15(1) of the Work Place Harassment and Violence Prevention Regulations and, in turn, are reported by employers to the Labour Program on the EAHVOR.
The purpose of this spotlight is to provide 2 other data sources, anonymous employee surveys, for comparison purposes.
The 2022 EAHVOR public sector data is compared to the 2022 Public Service Employee Survey (PSES) results .
As well, the 2022 EAHVOR private sector data is compared to the 2022 Survey of Employees under Federal Jurisdiction (SEFJ) results .
The collection methodology for these 3 data sources (SEFJ, PSES, and EAHVOR) vary and opportunities for comparison are limited. For example, certain values such as employer industries and how they are categorized and what information participants are requested to provide vary from one source to another. The information presented below is meant for general context and provides a high-level analysis, where possible, between the anonymous surveys (PSES and SEFJ) and the 2022 EAHVOR data.
2022 Public Service Employee Survey
The Treasury Board of Canada Secretariat and Statistics Canada partnered to administer the 2022 PSES. The survey measures federal government employees' opinions regarding their engagement, leadership, workforce, workplace, well-being and compensation.
189,584 employees in 90 federal departments and agencies responded to the 2022 PSES, for a response rate of 53%.
For more information on the questions, data source and methodology of the 2022 PSES, please see the following website Public Service Employee Survey (PSES) .
Public sector analysis
The top 4 most reported prohibited grounds of discrimination in the 2022 EAHVOR for the public sector were discrimination on the basis of: 1) Disability, 2) Sex, 3) Race, 4) National or Ethnic Origin.
Compared to the responses from the 2022 PSES, the top prohibited grounds of discrimination in the public sector were discrimination on the basis of: 1) Race, 1) Sex 2) Age, 3) Disability, 3) National or Ethnic Origin 4) Colour.
| Order | 2022 EAHVOR, public sector | 2022 PSES |
|---|---|---|
| 1) | Disability | Race, Sex* |
| 2) | Sex | Age |
| 3) | Race | Disability, National or Ethnic Origin** |
| 4) | National or Ethnic Origin | Colour |
- * Race and Sex received the same percentage of responses in the 2022 PSES regarding the prohibited grounds of discrimination experienced.
- ** Disability and National or Ethnic Origin received the same percentage of responses in the 2022 PSES regarding the prohibited grounds of discrimination experienced.
Please refer to the 2022 PSES for more detailed results on questions related to harassment and discrimination in the workplace.
2022 Survey of Employees under Federal Jurisdiction
The 2022 SEFJ was conducted by Statistics Canada on behalf of Employment and Social Development Canada. Statistics Canada distributed the survey to respondents in early 2022. The purpose of the SEFJ is to gather information about the working conditions and experiences of the employees.
The survey targeted employees in the federally regulated private sector; specifically, 8 sectors: the 4 transportation sectors (air, road, rail, and maritime), Postal and pipelines (includes the big courier companies), Banks, Grain handling ("feed, flour, seed and grain"), and Telecommunications and broadcasting.
Two federally regulated private sectors were excluded: Indigenous governments on First Nations territories and some miscellaneous activities. The latter include activities outside of the 8 sectors above (for example, some of the federal Crown and shared governance corporations, some mines, and some companies engaged in management of fisheries).
The response rate for the SEFJ was 56.4%. It was calculated as the total number of respondents divided by the size of the in-scope population. The size of the in-scope population is estimated based on the observed in-scope rate among survey respondents.
Please refer to Statistics Canada for more information on the data sources and methodology and the data accuracy related to the SEFJ.
Private sector analysis
The top 4 most reported prohibited grounds of discrimination in the 2022 EAHVOR for the private sector were discrimination on the basis of: 1) Sex, 2) Race, 3) National or Ethnic Origin, 4) Disability.
Compared to the responses from the 2022 SEFJ, the top 4 prohibited grounds of discrimination in the private sector were discrimination on the basis of: 1) Race, 2) National or Ethnic origin, 3) Sex, 4) Age.
| Order | 2022 EAHVOR, private sector | 2022 SEFJ |
|---|---|---|
| 1) | Sex | Race |
| 2) | Race | National or Ethnic Origin |
| 3) | National or Ethnic Origin | Sex |
| 4) | Disability | Age |
Table 10 shows the type of discrimination experienced by gender among those responding they have experienced discrimination in the workplace in the previous 2 years.
When asked to state the type of discrimination experienced, the 5 most frequent responses were Race (32.9%), National or Ethnic Origin (20.2%), Sex (19.8%), Age (18.6%), and Colour (17.2%).
Women were more likely to respond that they had been a victim of discrimination based on Sex (30.6% women vs. 13.2% men), Sexual Orientation or Gender Identity or Expression (10.7% women vs. 4.8% men), and Marital or Family Status (8.7% women vs. 5.4% men).
Men were more likely than women to respond that they had been a victim of discrimination based on National or Ethnic Origin (23.5% men vs. 14.9% women), Colour (21.0% men vs. 11.1% women), Religion (5.1% men vs. 2.8% women), and Disability (9.6% men vs. 5.2% women).
Men and women were similarly likely to respond that they had been a victim of discrimination based on Race, Age, and Language.
| Type of discrimination experienced | Men + Women | Women | Men |
|---|---|---|---|
| Race | 32.9% | 32.8% | 33.0% |
| National or ethnic origin | 20.2% | 14.9% | 23.5% |
| Sex | 19.8% | 30.6% | 13.2% |
| Age | 18.6% | 18.5% | 18.6% |
| Colour | 17.2% | 11.1% | 21.0% |
| Language | 8.4% | 8.2% | 8.5% |
| Disability | 7.9% | 5.2% | 9.6% |
| Sexual orientation or gender identity or expression | 7.0% | 10.7% | 4.8% |
| Marital or family status | 6.7% | 8.7% | 5.4% |
| Religion | 4.2% | 2.8% | 5.1% |
| Other | 25.0% | 20.3% | 27.9% |
- Notes: Responses are limited to those who reported experiencing discrimination in the workplace in the previous 24 months.
Please refer to the 2022 SEFJ for more detailed results on questions related to harassment and discrimination in the workplace.
Annex 1: List of terms
The following definitions are used in this publication.
- Applicable partner
- A policy committee, or if no policy committee exists, a workplace committee or the health and safety representative.
- Conciliation
- A discussion or series of discussions that is mediated by a neutral third party who is there to facilitate the discussion(s) and assist the parties involved in reaching resolution. All parties involved in conciliation must mutually agree to participate in conciliation and on the person who will be acting as the conciliator. A conciliator can be a professional mediator, a supervisor, an Elder, a religious figure, a colleague, etc.
- Employee
- Means a person employed by an employer.
- Employer
- Means a person who employs one or more employees and includes an employers' organization and any person who acts on behalf of an employer.
- Full-time equivalent (FTE)
-
Refers to the employment of 1 person full time. It may also refer to more than 1 person part time whose total working time is the equivalent of 1 person working full time. For example:
- 100 people employed full time equals 100 FTEs
- 10 people employed half time equals 5 FTEs
- all 110 people combined represent 105 FTEs
FTE data contained in this report comes from Employer's Annual Hazardous Occurrence Report (EAHOR) submissions from federally regulated employers.
- Harassment and violence
- Under Part II of the Canada Labour Code (the Code), harassment and violence means "any action, conduct or comment, including of a sexual nature, that can reasonably be expected to cause offence, humiliation or other physical or psychological injury or illness to an employee, including any prescribed action, conduct or comment."
This includes all types of harassment and violence, including sexual harassment, sexual violence and domestic violence. - Negotiated resolution
- Any form of communication between the participating parties to discuss the occurrence and attempt to reach agreement on possible actions to resolve the occurrence.
- Occurrence
- An occurrence of harassment and violence in the workplace.
- Principal party
- An employee or employer who is the object of an occurrence.
- Resolution process
- All the avenues of resolution - negotiated resolution, conciliation and investigation.
- Responding party
- The person who is alleged to have been responsible for the occurrence.
- Witness
- A witness to an occurrence or someone who is informed of an occurrence by the principal party or responding party.
- Workplace
- Any place where an employee is engaged in work for the employee's employer as per 122(1) of Code.
Annex 2: Sexual/non-sexual harassment and violence and fatalities
| Sector | Total number of harassment and violence occurrences | Total sexual harassment and violence occurrences | Total non-sexual harassment and violence occurrences | Fatalities related to harassment and violence |
|---|---|---|---|---|
| AIRT | 711 | 125 | 568 | 0 |
| BANK | 483 | 111 | 372 | 0 |
| BROAD | 97 | 8 | 88 | 1 |
| COMM | 240 | 30 | 201 | 0 |
| ENER | 51 | 13 | 36 | 0 |
| PUBS | 1,885 | 103 | 1,395 | 1 |
| INDG | 272 | 29 | 240 | 0 |
| LONG | 74 | 6 | 65 | 0 |
| POST | 553 | 14 | 539 | 0 |
| RAIL | 237 | 17 | 220 | 0 |
| ROAD | 1,403 | 225 | 1,037 | 1 |
| WATER | 115 | 20 | 82 | 0 |
| Other Industries* | 105 | 21 | 72 | 0 |
| All Industries | 6,226** | 722 | 4,915 | 3 |
- * Other Industries includes industries reporting fewer than 50 occurrences: 1) Feed, Flour and Seed, 2) Pipeline Transportation, 3) Grain Handling and Grain Elevators, 4) Interprovincial Infrastructure (Bridges, Tunnels, Canals, and Causeways)
- ** The sum of sexual harassment and violence occurrences, non-sexual harassment and violence occurrences, and fatalities related to harassment and violence do not equal the Total Number of harassment and violence occurrences since the type of some occurrences are unknown in employer EAHVOR submissions.
Annex 3: Types of resolution methods used by employers
| Sector | Total number of resolutions | Negotiated resolution | Conciliation | Investigation | Workplace assessment |
|---|---|---|---|---|---|
| AIRT | 640 | 220 | 35 | 327 | 58 |
| BANK | 402 | 103 | 4 | 231 | 64 |
| BROAD | 81 | 22 | 6 | 44 | 9 |
| COMM | 193 | 92 | 10 | 77 | 14 |
| ENER | 24 | 12 | 1 | 11 | 0 |
| PUBS | 1,137 | 475 | 53 | 333 | 276 |
| INDG | 230 | 37 | 34 | 101 | 58 |
| LONG | 80 | 33 | 3 | 40 | 4 |
| POST | 88 | 76 | 11 | 1 | 0 |
| RAIL | 203 | 31 | 16 | 149 | 7 |
| ROAD | 1,291 | 306 | 69 | 879 | 37 |
| WATER | 98 | 32 | 6 | 57 | 3 |
| Other Industries* | 87 | 36 | 7 | 37 | 7 |
| All Industries | 4,554 | 1,475 | 255 | 2,287 | 537 |
- * Other Industries includes industries reporting fewer than 50 occurrences: 1) Feed, Flour and Seed, 2) Pipeline Transportation, 3) Grain Handling and Grain Elevators, 4) Interprovincial Infrastructure (Bridges, Tunnels, Canals, and Causeways)
- Not listed: Occurrences where the principal party could not be identified.
Annex 4: Types of principal party/responding party relationships identified by employers
| Sector | Number of identified relationships | Employee | Supervisor, manager | Employee (to a supervisor, manager, etc.) | Third party | Domestic partner | Other |
|---|---|---|---|---|---|---|---|
| AIRT | 711 | 470 | 170 | 17 | 36 | 0 | 18 |
| BANK | 483 | 208 | 190 | 6 | 67 | 3 | 9 |
| BROAD | 100 | 47 | 40 | 2 | 3 | 0 | 8 |
| COMM | 239 | 103 | 89 | 7 | 34 | 4 | 2 |
| ENER | 53 | 30 | 7 | 10 | 6 | 0 | 0 |
| PUBS | 1,973 | 626 | 1,045 | 135 | 110 | 12 | 45 |
| INDG | 273 | 107 | 84 | 22 | 44 | 2 | 14 |
| LONG | 74 | 32 | 23 | 9 | 9 | 0 | 1 |
| POST | 551 | 172 | 75 | 41 | 256 | 7 | 0 |
| RAIL | 237 | 94 | 120 | 7 | 11 | 0 | 5 |
| ROAD | 1,323 | 643 | 269 | 131 | 251 | 4 | 25 |
| WATER | 104 | 59 | 32 | 3 | 10 | 0 | 0 |
| Other Industries* | 105 | 59 | 34 | 5 | 6 | 0 | 1 |
| All Industries | 6,226 | 2,650 | 2,178 | 395 | 843 | 32 | 128 |
- * Other Industries includes industries reporting fewer than 50 occurrences: 1) Feed, Flour, and Seed, 2) Pipeline Transportation, 3) Grain Handling and Grain Elevators, 4) Interprovincial Infrastructure (Bridges, Tunnels, Canals, and Causeways
Annex 5: Number of occurrences on discrimination grounds under the Canadian Human Rights Act
| Sector | Total Cases of Discrimination | Sex | Race | Disability | National or ethnic origin | All other grounds** |
|---|---|---|---|---|---|---|
| AIRT | 198 | 39 | 40 | 15 | 27 | 77 |
| BANK | 135 | 60 | 20 | 10 | 34 | 11 |
| BROAD | 17 | 7 | 5 | 0 | 2 | 3 |
| COMM | 33 | 2 | 9 | 6 | 5 | 11 |
| ENER | 13 | 2 | 3 | 3 | 3 | 2 |
| PUBS | 551 | 98 | 95 | 114 | 50 | 194 |
| INDG | 33 | 16 | 11 | 0 | 2 | 4 |
| LONG | 7 | 1 | 5 | 0 | 1 | 0 |
| POST | 47 | 14 | 14 | 4 | 3 | 12 |
| RAIL | 33 | 3 | 9 | 9 | 2 | 10 |
| ROAD | 176 | 52 | 72 | 10 | 16 | 26 |
| WATER | 17 | 8 | 2 | 2 | 1 | 4 |
| Other industries* | 13 | 5 | 2 | 1 | 2 | 3 |
| All industries | 1,273 | 307 | 287 | 174 | 148 | 357 |
- * Other industries includes industries reporting fewer than 50 occurrences: 1) Feed, Flour, and Seed, 2) Pipeline Transportation, 3) Grain Handling and Grain Elevators, 4) Interprovincial Infrastructure (Bridges, Tunnels, Canals, and Causeways)
- ** All Other Grounds of Discrimination includes remaining prohibited grounds of discrimination outside of the top 4, as identified by the Canadian Human Rights Act: 1) Age, 2) Colour, 3) Religion, 4) Sexual Orientation, 5) Family Status, 6) Gender Identity or Expression, 7) Genetic Characteristics, 8) Marital Status, 9) Conviction, Pardon Granted, or Record Suspended