
Report: Labour market impact of a work earnings exemption on benefits for low-income seniors
Official title: Labour market impact of a work earnings exemption on benefits for low-income seniors - Technical study prepared for the evaluation of the Old Age Security program
Authored by: Edouard Imbeau, Evaluation Directorate
Date: March 2017
On this page
Alternate formats

Report: Labour market impact of a work earnings exemption on benefits for low-income seniors [PDF - 496 KB]
Large print, braille, MP3 (audio), e-text and DAISY formats are available on demand by ordering online or calling 1 800 O-Canada (1-800-622-6232). If you use a teletypewriter (TTY), call 1-800-926-9105.
List of abbreviations
- ALW
- Allowances
- CANSIM
- Canadian Socio-Economic Information Management System
- CPI
- Consumer Price Index
- CPP
- Canada Pension Plan
- CRA
- Canada Revenue Agency
- EI
- Employment Insurance
- ESDC
- Employment and Social Development Canada
- GIS
- Guaranteed Income Supplement
- LFS
- Labour Force Survey
- ln
- Natural logarithm
- OAS
- Old Age Security
- p.p.
- Percentage points
- QPP
- Quebec Pension Plan
- RDSP
- Registered Disabilities Savings Plan
- UCCB
- Universal Child Care Benefit
List of figures
- Figure 1: Percentage of seniors (65 and over) and near-seniors (60 to 64) - Receiving OAS benefits
- Figure 2: Employment rates of seniors and near-seniors
- Figure 3: Employment rates by gender
- Figure 4: Employment rates of OAS pension, GIS and allowances recipients
- Figure 5: Proportion of OAS program beneficiaries who are employed by employers
- Figure 6: Proportion of OAS beneficiaries who are self-employed
- Figure 7: Comparison of recipients of the allowances to the control group (percent who work for an employer)
- Figure 8: Comparison of average employment earnings: Allowances recipients and control group [average employment earnings (2014 dollars) of those employed]
List of equations
List of tables
- Table 1: Proportion of population 60 and over filling taxes based on population estimates
- Table 2: Sample comparison to OAS administrative data (2014)
- Table 3: Proportion working for an employer, before and after the increase in the GIS earnings exemption (%)
- Table 4: Average employment income before and after the increase in the GIS earnings exemption [mean employment income (if greater than 0) (2014 dollars)]
- Table 5: Socio-economic characteristics of treatment and control groups
- Table 6: Proportion working for an employer and average work earnings (2014 dollars) for treatment and control group before and after 2008 policy change
- Table 7: Regression results of the effect of the policy change on the proportion who worked for an employer and on employment earnings (2014 dollars)
- Table 8: Robustness of regression results
- Table A1: Proportion working and average work income
Abstract
In 2008, the Canadian government significantly increased the work earnings exemption on benefits for low-income seniors (Guaranteed Income Supplement and Allowances). The new policy allows seniors to earn up to $3500 without having their benefits reduced. This paper examines the impact of this policy change on labour market outcomes, using T1 tax data. To accomplish this, the study uses a control group in a difference-in-difference framework. Results show the policy increased employment rates by 1 percentage point (p.p.) among 60 to 64 year old recipients. Among 60 to 64 year old recipients who worked for an employer, the policy increased work earnings by 15%. Results for older seniors were not as conclusive, but suggested similar increases in work earnings among those who worked. These results are significant given the relatively small policy change involved.
Acknowledgments
The author would like to thank Dr. Stephen Jones, Dr. Nicolas Lepage Saucier, Thomas Lang, James Kuhnke, Benoît-Paul Hébert for helpful comments and suggestions, as well as members of the Old Age Security Policy division (at ESDC) for their support and comments on this project.
This paper is a technical document prepared to provide support for the evaluation of the Old Age Security Program. Its content does not represent the views or opinions of Employment and Social Development Canada (ESDC) or the Government of Canada.
1. Introduction
In 2008, the Canadian government significantly increased the work earnings exemption on benefits for low-income seniors (Guaranteed Income Supplement and Allowances). The new policy allows seniors to earn up to $3500 without having their benefits reduced. This paper examines the impact of this policy change on labour market outcomes, using a control group in a difference-in-difference framework to take into account the increase in labour market participation of all seniors during this period. Results show the policy increased employment rates among 60 to 64 year old recipients and work earnings among those who worked. Results for older seniors were not as conclusive, but suggested similar increases in work earnings among those who worked.
The Old Age Security (OAS) program is the first pillar of Canada’s retirement income system. It provides a basic pension to nearly all seniors, and a supplement to low-income seniors. The OAS program provides a modest base upon which individuals may add income from other sources, such as the Canada or Quebec Pension Plan (C/QPP), retirement pensions and personal savings. The benefits under the OAS program include the OAS pension, the Guaranteed Income Supplement (GIS) and the Allowances (ALW).
This paper examines one of the themes of the evaluation of the OAS program: the employment impacts of the 2008 increase in the GIS earnings exemption. This study is a part of the overall work being conducted for the evaluation of the OAS program.
The paper is divided as follows: Section 2 of the report provides a summary of the OAS program. Section 3 examines the data used in the report, Section 4 presents the analysis and Section 5 offers conclusions.
2. The Old Age Security program
This section presents a general description of the different components of the OAS program and of eligibility rules. The OAS program is a cornerstone of Canada’s retirement income system. The program includes the OAS pension, the GIS and the Allowances. The OAS pension is a quasi-universal basic pension received by seniors aged 65 years and older. The OAS program provides additional support through the income-tested GIS to low-income seniors with little or no other income. In addition, the Allowance and the Allowance for the Survivor are paid to low-income individuals aged 60 to 64 who are the spouses or common-law partners of GIS recipients or who are widows or widowers.
2.1 Old Age Security pension
The OAS pension is paid to Canada’s seniors in recognition of the contribution they have made to Canadian society, the economy, and their community. In July 2015, the OAS pension provided benefits to 5.6 million seniors with the full basic pension amounting to $564.87 per month (or about $6,800 per year). All benefits under the OAS program are indexed quarterly.
Eligibility for the OAS pension is based on years of residence in Canada. In order to qualify, a person living in Canada at the time of application must be 65 years or older, and have resided in Canada for at least 10 years after the age of 18.Footnote 1 The full basic OAS pension is payable to seniors who have resided in Canada for at least 40 years after age 18. A partial pension is paid to seniors who have lived in Canada for at least 10 years after age 18, and their benefits are prorated at the rate of 1 fortieth of the full pension for each complete year of residence.Footnote 2
The OAS Recovery Tax, which is part of the Income Tax Act, requires all higher-income pensioners to repay part of their OAS pension if their individual income exceeds a threshold. For the 2015 tax year, seniors must repay $0.15 for every dollar of income exceeding $72,809. Benefits are completely repaid when income reaches $118,055.Footnote 3 The recovery tax can be deducted at the source, but final amounts are determined when seniors file their income tax returns each year.
2.2 Guaranteed Income Supplement
When seniors have little or no other income, the GIS can be added to their OAS pension.Footnote 4 In July 2015, the GIS was paid to 1.7 million low-income seniors and could reach $765.93 per month for single seniors and $507.87 per month for seniors that were married or in a common-law relationship (or up to about $9,200 or $6,100 per year respectively).Footnote 5 Adding the OAS pension and GIS, OAS benefits can reach $16,000 and $13,000 per year respectively.
In order to qualify for the GIS, a person must receive the OAS pension and have family income below the maximum annual thresholds.Footnote 6 GIS benefits are reduced by $0.50 for every dollar of income, other than the OAS pension and the GIS,Footnote 7 until it reaches $2,048 for single seniors and $4,080 for couples, then by $0.75 for every dollar of other income between $2,048 and $4,544 for single seniors and $4,096 to $7,648 for couples. When income exceeds these amounts, GIS benefits are then reduced by $0.50 for every dollar of other income.Footnote 8 This implies that single seniors qualified for the GIS with incomes up to $17,136 per year and up to $22,608 for senior couples in July 2015.Footnote 9
2.3 Allowances
The Allowances are designed to recognize the difficult circumstances faced by many low-income couples living on only 1 pension until the other spouse reaches age 65 and qualifies for his or her OAS pension, as well as by 60 to 64 year old low-income widows or widowers. In July 2015, the Allowance was paid to 56,000 people and the Allowance for the Survivor to 24,000 people. Benefits can reach $1,072.74 per month for the Allowance and $1,200.98 per month for the Allowance for the Survivor (or about $12,300 and $14,400 per year respectively, based on July 2015 rates).
In order to qualify for the Allowances, a person must be 60 to 64 years old and have resided in Canada for at least 10 years after the age of 18.Footnote 10 In addition, a person must be a low-income widow or widower to qualify for the Allowance for the Survivor, or the spouse or common-law partner of a recipient of the GIS to qualify for the Allowance.
Eligibility for the Allowances is also based on family income. Benefits are reduced by $0.75 for every dollar of other income until income reaches $2,048 for singles and $4,096 for couples, by $1.00 for every dollar of other income between $2,048 and $4,544 for singles and $4,096 to $7,648 for couples, and by $0.75 for every dollar of other income between $4,544 and $9,096 for singles and $7,648 to $9,120 for couples. When income exceeds these amounts, benefits are then reduced by $0.50 for every dollar of other income.Footnote 11 This implies that people qualify for the Allowance for the Survivor with income up to $23,088 per year and up to $31,680 for the Allowance in July 2015. Senior spouses of 60 to 64 year olds would still receive GIS benefits with family incomes up to $41,088.
2.4 Indexation of Old Age Security benefits
Benefits paid under the OAS program are, by law, adjusted quarterly (in January, April, July, and October) according to any change in the cost-of-living, as measured by the Consumer Price Index (CPI).Footnote 12 The CPI measures, on a monthly basis, the average change in retail prices of a “basket” of goods and services commonly purchased by Canadian households such as shelter, food, clothing, and transportation.
3. Data
The T1 data from the Canada Revenue Agency (CRA) is used for this paper. The T1 is the form used by individuals to file their personal income tax return to the CRA. The T1 data include information on income and demographic characteristics of all individuals who file a tax return.
For this study, a 10% sample of individuals who were 60 years of age and older were selected from the T1 data from 2002 to 2014 (8 million observations).Footnote 13 Non-residents were excluded from the sample, as their income information could be incomplete (non-residents’ income from overseas is not taxable in Canada).Footnote 14
It should be noted that some people do not file tax returns. Table 1 examines the coverage of the T1 file by comparing the number of tax filers in the sample to population estimates from Statistics Canada among people 60 years of age and older living in Canada. It is estimated that 97% to 99% of this age group filed taxes (and are therefore included in the sample), with a slightly higher percentage among those who were 65 years old and older.
| Year | Statistics Canada population estimates, 60 to 64 | Statistics Canada population estimates, 65 and over | Number filed taxes (in T1), 60 to 64 | Number filed taxes (in T1), 65 and over | Percentage filed taxes (in T1 sample), 60 to 64 | Percentage filed taxes (in T1 sample), 65 and over | Percentage filed taxes (in T1 sample), 60 and over |
|---|---|---|---|---|---|---|---|
| 2002 | 1,338,885 | 3,980,081 | 1,286,870 | 3,884,410 | 96.1 | 97.6 | 97.2 |
| 2003 | 1,401,659 | 4,051,665 | 1,353,080 | 3,969,060 | 96.5 | 98.0 | 97.6 |
| 2004 | 1,467,107 | 4,127,579 | 1,421,560 | 4,056,880 | 96.9 | 98.3 | 97.9 |
| 2005 | 1,531,876 | 4,205,501 | 1,478,390 | 4,145,610 | 96.5 | 98.6 | 98.0 |
| 2006 | 1,603,269 | 4,309,958 | 1,544,800 | 4,247,700 | 96.4 | 98.6 | 98.0 |
| 2007 | 1,716,250 | 4,412,638 | 1,670,200 | 4,371,970 | 97.3 | 99.1 | 98.6 |
| 2008 | 1,810,449 | 4,532,605 | 1,765,060 | 4,506,260 | 97.5 | 99.4 | 98.9 |
| 2009 | 1,894,766 | 4,661,110 | 1,850,800 | 4,641,470 | 97.7 | 99.6 | 99.0 |
| 2010 | 1,981,692 | 4,796,143 | 1,936,910 | 4,771,570 | 97.7 | 99.5 | 99.0 |
| 2011 | 2,050,443 | 4,950,310 | 2,007,950 | 4,918,590 | 97.9 | 99.4 | 98.9 |
| 2012 | 2,071,097 | 5,167,113 | 2,019,020 | 5,122,370 | 97.5 | 99.1 | 98.7 |
| 2013 | 2,110,229 | 5,383,902 | 2,051,590 | 5,310,250 | 97.2 | 98.6 | 98.2 |
| 2014 | 2,167,800 | 5,589,292 | 2,067,550 | 5,465,190 | 95.4 | 97.8 | 97.1 |
- Source: CANSIM 051-0001 (Statistics Canada) and 10% sample of T1 file from the CRA (8 million observations). All estimates are based on age on July 1st, to be in line with Statistics Canada estimates. All other references to age in this paper use the age at the end of the calendar year, as usually defined.
Tax filing rates diminished significantly from year to year before 2002, making annual employment rate comparisons before 2002 less reliable.Footnote 15 Also note that tax filing rates of more recent years (for example, 2013 and 2014) are based on information up to date and will usually increase in future versions of the T1 data. This version of the T1 data is from mid-2016.
Information on spouses of individuals in the sample was also added to the sample, allowing the examination of couples’ characteristics (for example, couples’ total income, couples’ income used to assess GIS benefit amounts, etc.). However, some of the spouses of individuals in the sample did not file a tax return, especially in earlier years. The percentage of couples with income information on their spouse increases every year, from 93% in 2002 to almost 99% in 2014. In addition, information on income in the 2 previous years (for example, 2000 and 2001) was added to the sample to examine GIS or Allowance eligibility.
The family income used to assess eligibility for the GIS and the Allowances was estimated, as it is not included in the database. This estimated family income includes all sources of income (tax return line 150) from which are subtracted OAS benefits, contributions to Employment Insurance (EI) and the Canada/Quebec Pension Plan (C/QPP), net Universal Child Care Benefits (UCCB), Registered Disability Savings Plan (RDSP) income, the estimated GIS earnings exemption, social assistance payments, Registered Pension Plan deductions, Registered Retirement Savings Plan deductions, the Saskatchewan Pension Plan deduction, Pension Income Splitting (tax return line 210), union and professional dues, child care expenses, the Disability Supports deduction (tax return line 215), allowable business investment loss (tax return line 217), moving expenses, support payments made (tax return line 220), carrying charges and interest expenses (tax return line 221), exploration and development expenses (tax return line 224), other employment expenses (tax return line 229), the Clergy residence deduction (tax return line 231) and other deductions (tax return line 232). This corresponds to the income definition used to calculate GIS and Allowance benefits. However, due to data limitations, social benefits repayments (tax return line 235, in other words, OAS Recovery Tax and repayments of EI benefits) were also subtracted from this estimated income, even though in reality they are not included in the calculation of GIS eligibility.Footnote 16 Also, net UCCB payments were not available in the data for years 2006 and 2007.
Table 2 below shows that the sample provides estimates of the number of recipients of the OAS pension, the GIS and the Allowances that are similar to published numbers from OAS administrative data.Footnote 17
| Number receiving by program | T1 sample (tax filers) | OAS administrative data |
|---|---|---|
| Number receiving OAS pension | 5,408,390 | 5,436,361 |
| Number receiving GIS | 1,882,180 | 1,742,132 |
| Number receiving Allowances | 85,130 | 79,873 |
- Sources: 10% sample of T1 file from the CRA (775,978 observations in 2014) and OAS administrative data (monthly average number of beneficiaries from “The CPP and OAS Stats Book 2015”).
4. Analysis
In 2014, about 96% of tax filing seniors aged 65 and over received the OAS pension (Figure 1).Footnote 18 Among those who received the OAS pension 35% also received the GIS. The percentage of seniors receiving the OAS pension has been relatively steady since 2002. However, the percentage of OAS pension recipients who received the GIS has varied from year to year, decreasing from 40% in 2007 to 35% in 2014. Among tax filers aged 60 to 64 years old, 4% received the Allowances in 2014. The proportion of 60 to 64 year-olds receiving the Allowances has steadily decreased from 7% in 2002 to 4% in 2014.
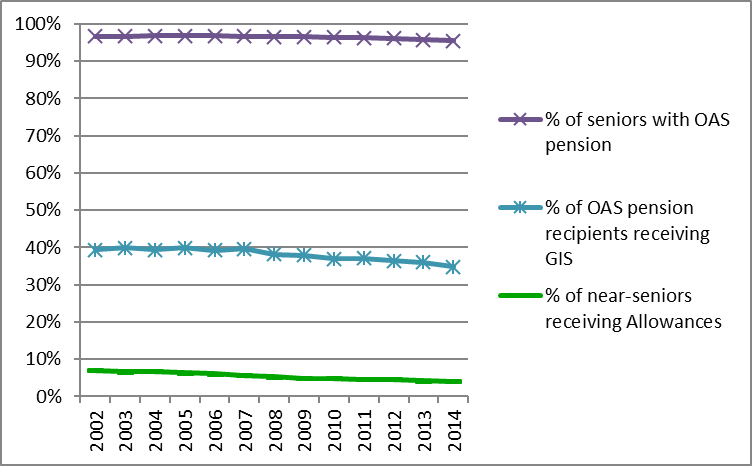
Figure 1 - Text version
| Year | Percent of seniors with OAS pension | Percent of OAS pension recipients receiving GIS | Percent of near-seniors receiving Allowances |
|---|---|---|---|
| 2002 | 96.7% | 39.4% | 7.1% |
| 2003 | 96.7% | 39.9% | 6.7% |
| 2004 | 96.9% | 39.3% | 6.7% |
| 2005 | 96.9% | 39.9% | 6.3% |
| 2006 | 96.9% | 39.2% | 6.1% |
| 2007 | 96.7% | 39.7% | 5.6% |
| 2008 | 96.6% | 38.2% | 5.3% |
| 2009 | 96.5% | 37.9% | 4.9% |
| 2010 | 96.5% | 36.9% | 4.9% |
| 2011 | 96.2% | 37.1% | 4.6% |
| 2012 | 96.2% | 36.3% | 4.6% |
| 2013 | 95.8% | 36.0% | 4.2% |
| 2014 | 95.5% | 34.8% | 4.1% |
- Source: 10% sample of T1 file from the CRA (8,434,625 observations of people 60 and over).
4.1 Labour market participation of seniors and Old Age Security beneficiaries
This section examines the labour market participation of seniors (65 and over), near-seniors (60 to 64) and OAS program beneficiaries. More precisely, it examines employment rates, in other words, the percentage of people with employment income or self-employment revenue in the year.Footnote 19 Both seniors and near-seniors provide a significant contribution to the labour market in Canada. In 2014, there were 1.1 million seniors working and 1.3 million near-seniors that were working.
Note that this section examines employment rates rather than labour market participation rates, in other words, the focus is on the percentage that are working rather than the percentage that are working or looking for work, as individuals looking for work are not identified in the data used. Nevertheless, unemployed individuals looking for work represent a small percentage of this age group.Footnote 20
4.1.1 Recent trends in employment rates of seniors
The employment rate of seniors (65 and over) has increased by over 50% since 2002, increasing from 12% of seniors in 2002 to 19% in 2014 (Figure 2), an increase of 7 percentage points. For near-seniors, aged 60 to 64 years old, there is also an increasing trend. In 2002, 50% of near-seniors were working, and this proportion reached 60% in 2014, an increase of 10 percentage points.Footnote 21
The employment rates of women and men have followed similar increasing trends throughout this period, even though employment rates were higher for men than for women (Figure 3). Employment rates reached their highest point in 2014 when 14% of senior women worked and 25% of senior men (65 and over). Among near seniors, 54% of women worked and 66% of men. As shown in the graph, the increase in the employment rates of senior women and men throughout this period is very similar (an increase of about 7 percentage points). However, the increase is more pronounced for near-senior women than men (an increase of 13 percentage points for women versus 7 percentage points for men).
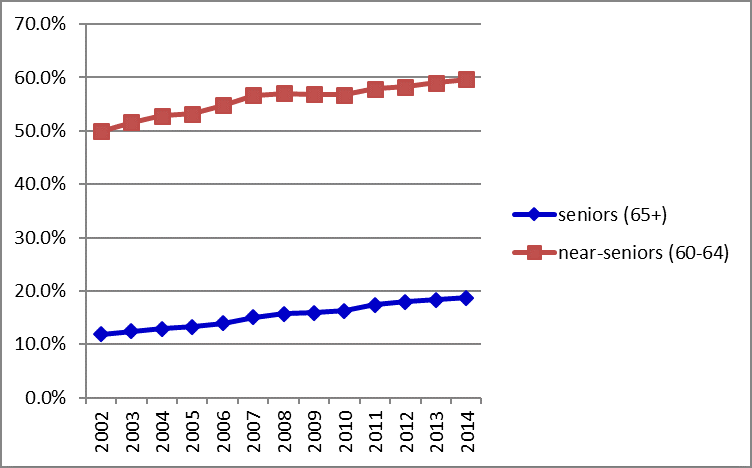
Figure 2 - Text version
| Year | Seniors (65 and over) | Near-seniors (60 to 64) |
|---|---|---|
| 2002 | 11.9% | 49.9% |
| 2003 | 12.5% | 51.6% |
| 2004 | 12.9% | 52.9% |
| 2005 | 13.3% | 53.2% |
| 2006 | 14.0% | 54.8% |
| 2007 | 15.0% | 56.6% |
| 2008 | 15.8% | 57.1% |
| 2009 | 15.9% | 56.9% |
| 2010 | 16.3% | 56.7% |
| 2011 | 17.4% | 57.9% |
| 2012 | 18.0% | 58.2% |
| 2013 | 18.4% | 59.1% |
| 2014 | 18.7% | 59.7% |
- Source: 10% sample of T1 file from the CRA (8,434,625 observations of people 60 and over).
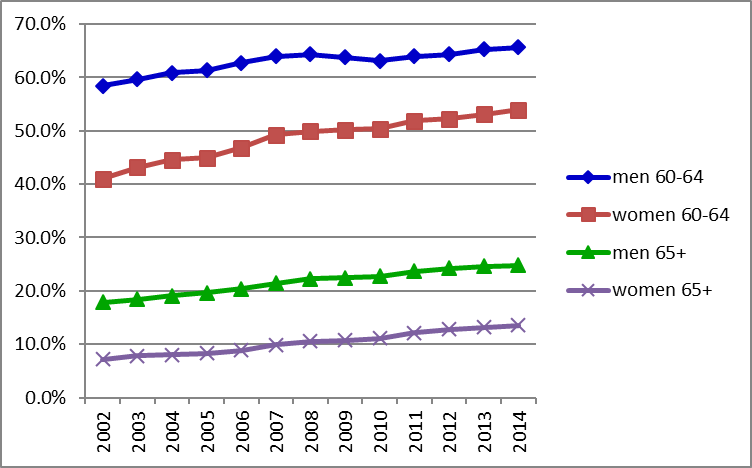
Figure 3 - Text version
| Year | Men 60 to 64 | Women 60 to 64 | Men 65 and over | Women 65 and over |
|---|---|---|---|---|
| 2002 | 58.4% | 41.0% | 17.9% | 7.2% |
| 2003 | 59.7% | 43.2% | 18.4% | 7.8% |
| 2004 | 60.9% | 44.6% | 19.1% | 8.1% |
| 2005 | 61.3% | 45.0% | 19.7% | 8.3% |
| 2006 | 62.7% | 46.8% | 20.4% | 8.9% |
| 2007 | 64.0% | 49.3% | 21.4% | 9.9% |
| 2008 | 64.4% | 49.9% | 22.2% | 10.5% |
| 2009 | 63.8% | 50.2% | 22.4% | 10.7% |
| 2010 | 63.2% | 50.4% | 22.7% | 11.1% |
| 2011 | 64.0% | 51.9% | 23.7% | 12.2% |
| 2012 | 64.4% | 52.3% | 24.2% | 12.8% |
| 2013 | 65.3% | 53.1% | 24.6% | 13.2% |
| 2014 | 65.6% | 54.0% | 24.8% | 13.6% |
- Source: 10% sample of T1 file from the CRA (8,434,625 observations of people 60 and over).
4.1.2 Recent trends in employment rates of Old Age Security program recipients
OAS pension recipients had employment rates that are very similar to rates of seniors in general (65 and over), with employment rates increasing from 12% in 2002 to 18% in 2014 (Figure 4). However, GIS recipients had much lower employment rates in comparison. Employment rates nevertheless increased from 5% in 2002 to 7% in 2014 among GIS recipients.
Allowances recipients also had much lower employment rates than 60 to 64 year olds in general. The employment rates of recipients of the Allowances increased by over 50% throughout this period, increasing from 15% of recipients in 2002 to 24% in 2014. However, this remained well below the employment rate of near-seniors in general, which reached 54% for women and 66% for men in 2014.
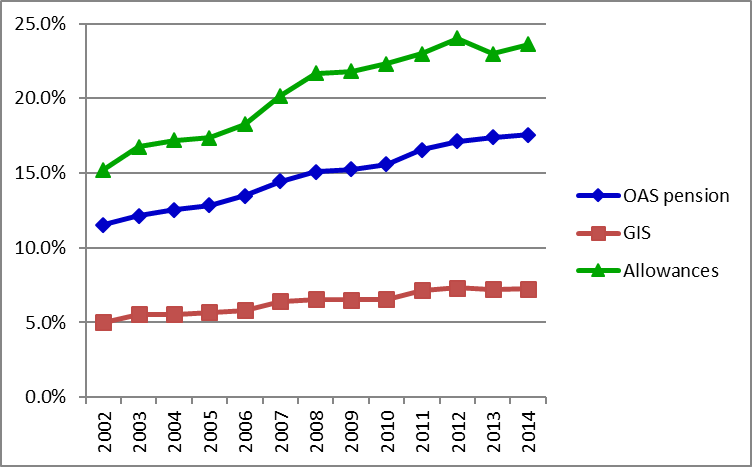
Figure 4 - Text version
| Year | OAS pension | GIS | Allowances |
|---|---|---|---|
| 2002 | 11.5% | 5.0% | 15.2% |
| 2003 | 12.1% | 5.5% | 16.7% |
| 2004 | 12.5% | 5.6% | 17.2% |
| 2005 | 12.9% | 5.7% | 17.4% |
| 2006 | 13.5% | 5.8% | 18.3% |
| 2007 | 14.4% | 6.4% | 20.2% |
| 2008 | 15.1% | 6.5% | 21.7% |
| 2009 | 15.2% | 6.5% | 21.8% |
| 2010 | 15.6% | 6.5% | 22.3% |
| 2011 | 16.6% | 7.1% | 23.0% |
| 2012 | 17.1% | 7.3% | 24.0% |
| 2013 | 17.4% | 7.2% | 23.0% |
| 2014 | 17.5% | 7.2% | 23.6% |
- Source: 10% sample of T1 file from the CRA (8,434,625 observations of people 60 and over).
Figures 5 and 6 show that most of the increase in the employment rate is due to the proportion of OAS recipients employed by an employer, rather than those that are self-employed. For example, among OAS pension recipients, the proportion with salaried employment increased from 6% in 2002 to 12% in 2014, while the proportion that was self-employed increased from 6% in 2002 to 7% in 2014.Footnote 22
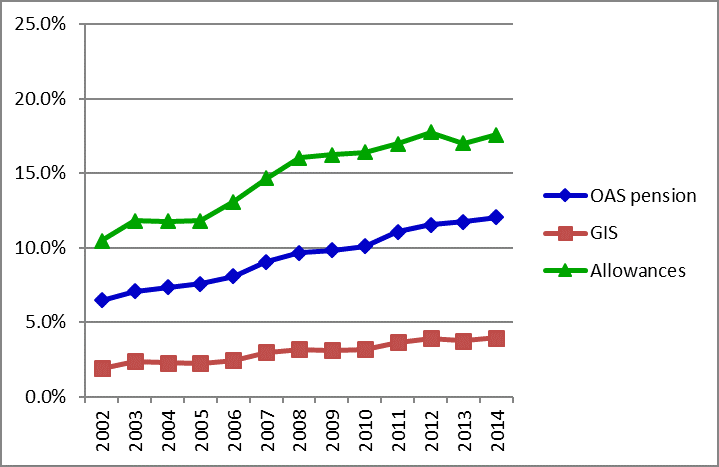
Figure 5 - Text version
| Year | OAS pension | GIS | Allowances |
|---|---|---|---|
| 2002 | 6.4% | 1.9% | 10.4% |
| 2003 | 7.1% | 2.4% | 11.8% |
| 2004 | 7.3% | 2.3% | 11.8% |
| 2005 | 7.6% | 2.3% | 11.8% |
| 2006 | 8.1% | 2.4% | 13.1% |
| 2007 | 9.0% | 3.0% | 14.6% |
| 2008 | 9.7% | 3.2% | 16.0% |
| 2009 | 9.8% | 3.1% | 16.2% |
| 2010 | 10.1% | 3.2% | 16.4% |
| 2011 | 11.1% | 3.6% | 17.0% |
| 2012 | 11.5% | 3.9% | 17.8% |
| 2013 | 11.7% | 3.8% | 17.0% |
| 2014 | 12.0% | 3.9% | 17.6% |
- Source: 10% sample of T1 file from the CRA (8,434,625 observations of people 60 and over).
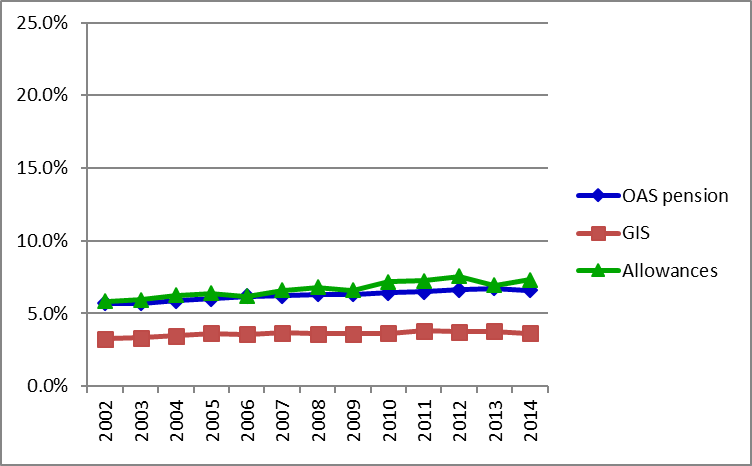
Figure 6 - Text version
| Year | OAS pension | GIS | Allowances |
|---|---|---|---|
| 2002 | 5.7% | 3.3% | 5.9% |
| 2003 | 5.7% | 3.3% | 5.9% |
| 2004 | 5.9% | 3.5% | 6.3% |
| 2005 | 6.0% | 3.6% | 6.4% |
| 2006 | 6.2% | 3.6% | 6.2% |
| 2007 | 6.2% | 3.7% | 6.6% |
| 2008 | 6.3% | 3.6% | 6.8% |
| 2009 | 6.3% | 3.6% | 6.6% |
| 2010 | 6.4% | 3.6% | 7.2% |
| 2011 | 6.5% | 3.8% | 7.3% |
| 2012 | 6.6% | 3.7% | 7.6% |
| 2013 | 6.7% | 3.8% | 6.9% |
| 2014 | 6.6% | 3.6% | 7.3% |
- Source: 10% sample of T1 file from the CRA (8,434,625 observations of people 60 and over).
4.2 Impact of the increase in the Guaranteed Income Supplement earnings exemption
In 2008, the government increased the GIS earnings exemption to fully exempt the first $3,500 of work income so a “GIS recipient will be able to keep more of her or his hard-earned money without any reduction in GIS benefits, encouraging labour market participation and providing support for low-income seniors.”Footnote 23 Before 2008, only 20% of work income up to $2,500 was exempt (providing a maximum earnings exemption of $500). These earnings exemptions also apply to beneficiaries of the Allowances.
Table 3 presents the percentage of recipients of the Allowances and the GIS who were working for an employer, before and after 2008, and compares them respectively to other 60 to 64 year old near-seniors and to other OAS pension recipients. Note that the GIS earnings exemption did not apply to self-employment income during this period.Footnote 24 Therefore self-employment is excluded from the analysis of the earnings exemption.Footnote 25
| Year | Allowances | Other near-seniors (60 to 64) | GIS | Other OAS pension recipients |
|---|---|---|---|---|
| 2002 | 10.4 | 42.0 | 1.9 | 9.4 |
| 2003 | 11.8 | 43.5 | 2.4 | 10.2 |
| 2004 | 11.8 | 44.9 | 2.3 | 10.6 |
| 2005 | 11.8 | 45.2 | 2.3 | 11.1 |
| 2006 | 13.1 | 46.9 | 2.4 | 11.7 |
| 2007 | 14.6 | 48.7 | 3.0 | 13.0 |
| 2008 | 16.0 | 49.1 | 3.2 | 13.7 |
| 2009 | 16.2 | 48.8 | 3.1 | 13.9 |
| 2010 | 16.4 | 48.7 | 3.2 | 14.1 |
| 2011 | 17.0 | 50.0 | 3.6 | 15.5 |
| 2012 | 17.8 | 50.3 | 3.9 | 15.9 |
| 2013 | 17.0 | 51.3 | 3.8 | 16.2 |
| 2014 | 17.6 | 52.1 | 3.9 | 16.4 |
- Source: 10% sample of T1 file from the CRA (8,434,625 observations of people 60 and over). The shaded area corresponds to the year of the increase in the GIS earnings exemption (2008). Note that self-employment is excluded from these results as it does not qualify for the GIS earnings exemption.
| Year | Allowances | Other near-seniors (60 to 64) | GIS | Other OAS pension recipients |
|---|---|---|---|---|
| 2002 | 8,968 | 45,646 | 7,526 | 36,818 |
| 2003 | 8,417 | 44,552 | 6,431 | 35,548 |
| 2004 | 9,249 | 45,459 | 7,304 | 35,241 |
| 2005 | 9,833 | 46,950 | 8,085 | 36,444 |
| 2006 | 9,722 | 48,973 | 8,260 | 37,677 |
| 2007 | 9,472 | 49,066 | 7,632 | 37,258 |
| 2008 | 10,120 | 48,345 | 7,929 | 35,671 |
| 2009 | 11,374 | 47,662 | 8,358 | 35,243 |
| 2010 | 12,273 | 48,290 | 8,973 | 34,980 |
| 2011 | 11,392 | 47,772 | 9,002 | 33,784 |
| 2012 | 12,306 | 48,988 | 8,623 | 34,568 |
| 2013 | 12,125 | 50,287 | 8,904 | 34,266 |
| 2014 | 12,577 | 50,391 | 8,896 | 32,514 |
- Source: 10% sample of T1 file from the CRA (8,434,625 observations of people 60 and over). The shaded area corresponds to the year of the increase in the GIS earnings exemption (2008). Note that self-employment is excluded from these results as it does not qualify for the GIS earnings exemption.
The percentage of Allowances recipients that were working for an employer increased following the increase in the GIS earnings exemption in 2008. In particular, this proportion was higher in 2008, 2009 and 2010, than in 2007, before the change.Footnote 26 By comparison, among other near-seniors (not receiving the Allowances) the proportion working for an employer stayed relatively constant in 2007, 2008, 2009 and 2010. Comparing these 2 trends reinforces the idea that the increase in the GIS earnings exemption might have had an effect on employment rates of recipients of the Allowances. More formal multivariate analysis is conducted below.
In addition, this policy might also have an impact on the amount of work done by recipients of the Allowances who choose to work. Table 4 shows that the average real employment income (2014 dollars) of recipients of the Allowances who already worked increased following the increase in the GIS earnings exemption in 2008, notably in 2008, 2009 and 2010. However, among other near-seniors (not receiving the Allowances), average real work income for those who worked continually decreased from 2007 to 2009. Comparing these 2 trends reinforces the idea that the policy change might have had an effect on the amount of work as well. Again, more formal multivariate analysis is conducted below.
For GIS recipients, the results are not as conclusive. The percentage of GIS recipients working for an employer did not increase significantly following the increase in the GIS earnings exemption in 2008. In particular, the proportion working in 2007 (before the change) was similar to the proportion in 2008, 2009 and 2010. However, if we compare this trend to the one of other OAS pension recipients, among which the proportion working for an employer continuously increased from 2007 to 2008, 2009 and 2010, it reinforces the idea that the increase in the GIS earnings exemption might not have had an effect on employment rates of GIS recipients. More formal analysis using multivariate regression analysis with this difference-in-difference framework could not be performed, as the 2 groups had different trends from 2002 to 2007, before the policy change.
Nevertheless, this policy might have an impact on the amount of work among GIS recipients who chose to work for an employer. The average real work income (2014 dollars) of GIS recipients who work increased following the increase in the GIS earnings exemption in 2008, notably in 2008, 2009 and 2010. However, among other OAS pension recipients, average real work income for those who worked continually decreased from 2007 to 2011. A comparison of real work earnings from the period before the policy change (2002 to 2007) to the period afterwards (2008 to 2014) shows average work earnings increased by 14% among GIS recipients who work, while it declined by 6% among other OAS pension recipients who work. Comparing these 2 trends reinforces the idea that the policy change might have had a positive effect on the amount of work among GIS recipients who work. However, for the same reasons as above, a more formal multivariate analysis could not be used to measure this effect.
Note that the existence of the GIS earnings exemption is likely not known by all GIS and Allowance recipients. If this is in fact the case, it might also reduce its efficiency to encourage recipients to work if they wish to. In 2014, 4% of GIS recipients worked for an employer and only 2% of GIS recipients worked enough to take advantage of the full amount of the exemption ($3,500). Both these figures increased only slightly since 2008. Among recipients of the Allowances, 18% worked for an employer and 13% used the full amount of the earnings exemption in 2014.
4.2.1 Difference-in-difference framework and results
The section presents the difference-in-difference framework used for the multivariate regression analysis of the impacts of the increase in the GIS earnings exemption on the labour market participation of recipients of the Allowances. Two outcomes regarding labour market participation are examined here:
- the likelihood of being employed (working for an employer), and
- the amount of real work earnings (2014 dollars) among those who chose to work
Note that the GIS earnings exemption does not apply to self-employment income. Therefore self-employment income is not taken into account in the following analysis of the earnings exemption, except when examining robustness of results.
Methodology
The identification strategy used here to measure the effect of this policy change is a difference-in-difference framework, where outcomes are compared between a treatment and a control group, both before and after a program change. This can be illustrated by defining the effect as a difference between 4 averages of an outcome:
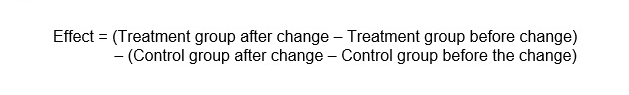
Equation 1 - Text version
The effect of the policy change is estimated by subtracting the change in the control group’s outcome before and after the policy change from the change in the treatment group’s outcome before and after the policy change.
To increase the precision and reliability of the results, effects are measured using regression analysis with this difference-in-difference framework. In the current paper, the treatment group is recipients of the Allowances. The program change examined is the increase in the GIS earnings exemption in 2008. The control group used here is: near-seniors (60 to 64) not receiving the Allowances that have income other than work above Allowances thresholds or that are neither widows nor spouses of seniors.Footnote 27 The choice of this control group ensures assignment to the control group is not affected by the decision to work or not.Footnote 28
In the following analysis, the effect of the increase in the GIS earnings exemption in 2008 will be examined graphically to begin, then examined by comparing averages of different groups before and after the change, and finally examined using regression analysis with a difference-in-difference framework.
Comparison of treatment and control groups
Figures 7 and 8 compare recipients of the Allowances to the control group of other 60 to 64 year old near-seniors, looking at the percentage who worked for an employer and the average employment earnings (2014 dollars) among those that are employed.
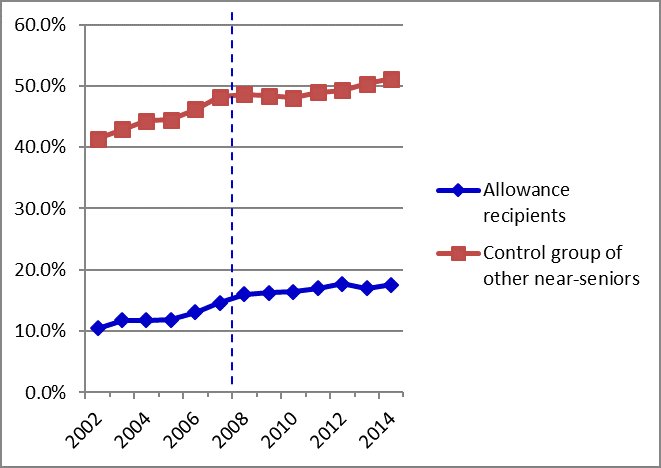
Figure 7 - Text version
| Year | Treatment | Control |
|---|---|---|
| 2002 | 10.4% | 41.4% |
| 2004 | 11.8% | 44.3% |
| 2006 | 13.1% | 46.2% |
| 2008 | 16.0% | 48.6% |
| 2010 | 16.4% | 48.0% |
| 2012 | 17.8% | 49.3% |
| 2014 | 17.6% | 51.2% |
- Source: 10% sample of T1 file from the CRA (2,291,437 observations of 60 to 64 year olds). Control group includes near-seniors (60 to 64) not receiving the Allowances that have income other than work above Allowances thresholds or that are neither widows nor spouses of seniors. Note that self-employment income is not taken into account in these results as it does not qualify for the GIS earnings exemption
![Figure 8 – Comparison of average employment earnings: Allowances recipients and control group [average employment earnings (2014 dollars) of those employed]](/content/dam/esdc-edsc/images/services/pension/reports/labour-market-low-income-seniors/fig8-en.png)
Figure 8 - Text version
| Year | Allowances recipients | Control group of other near-seniors |
|---|---|---|
| 2002 | 8968.165 | 46690.63 |
| 2004 | 9249.154 | 46497.54 |
| 2006 | 9722.203 | 50134.98 |
| 2008 | 10120.1 | 49135.63 |
| 2010 | 12273.17 | 48810.51 |
| 2012 | 12305.61 | 49261.34 |
| 2014 | 12577.48 | 51019.82 |
- Source: 10% sample of T1 file from the CRA (2,291,437 observations of 60 to 64 year olds). Control group includes near-seniors (60 to 64) not receiving the Allowances that have income other than work above Allowances thresholds or that are neither widows nor spouses of seniors. Note that self-employment income is not taken into account in these results as it does not qualify for the GIS earnings exemption.
Regarding the percentages that are employed, both groups followed similar upward trends before the change in 2008. In 2009, 2010 and 2011, this proportion continued to increase for recipients of the Allowances while it stayed relatively constant between 2008 and 2010 in the control group of other 60 to 64 year old near-seniors.
Regarding average employment earnings among those that are employed, the trends follow a similar s-shape before 2008. In 2008, 2009 and 2010, average employment earnings increased among recipients of the Allowances while it remained below its 2007 level among the control group of other 60 to 64 year old near-seniors.
Overall, these 2 graphs show that these 2 groups were following similar trends before 2008, suggesting that the comparison group is adequate to examine the effect of this policy using a difference-in-difference framework. The graphs also suggest that this policy change might have had an effect. Further analysis below is required to confirm this.
Note that attempts were made to find a valid control group to also examine the effect of the increase in the GIS earnings exemption on GIS recipients. Unfortunately, no valid control group was found, as all potential control groups followed different trends than GIS recipients.
Table 5 examines the socio-economic characteristics of the treatment group and the control group. It shows that there are some significant differences between treatment and control groups beyond income. Notably, the treatment group (Allowances recipients) includes a higher percentage of women, a higher percentage of single people, older people, a lower percentage of people that are self-employed and a lower percentage of people whose spouse works. These differences between the control and treatment groups underline the importance of including these socio-economic characteristics in the regression framework, to take into account differences between the groups in the analysis.
| Characteristics | Allowances recipients | Control group of other near-seniors |
|---|---|---|
| Women (%) | 89.6 | 43.6 |
| Men (%) | 10.4 | 56.4 |
| Single (%) | 33.1 | 29.7 |
| Married (%) | 66.9 | 70.3 |
| Average age (years) | 62.6 | 61.9 |
| Self-employed (%) | 6.7 | 14.6 |
| Spouse works (%) | 11.9 | 43.2 |
- Source: 10% sample of T1 file from the CRA (2,291,437 observations of 60 to 64 year olds). Control group includes near-seniors (60 to 64) not receiving the Allowances that have income other than work above Allowances thresholds or that are neither widows nor spouses of seniors. Note that married also includes those in a common-law relationship.
Comparing averages before and after the policy change
Next, Table 6 examines the percentages of those who worked for an employer and the average work earnings (2014 dollars) in the treatment and control groups, before and after the policy change. Differences in averages show that the proportion of recipients of the Allowances who were employed increased by 4.6 percentage points from the 2002 to 2007 period to the 2008 to 2014 period (before and after the policy change). In comparison, the proportion employed increased by 4.5 percentage points in the control group of other 60 to 64 year old near-seniors. Therefore, comparing these 2 differences, the proportion who worked among the treatment group increased by 0.1 percentage point more than among the control group. However, one could argue that because the proportions among the 2 groups were so different to begin with, we should compare growth rates (% change) in the proportion employed instead. The proportion of recipients of the Allowances who were employed increased by 32% from the 2002 to 2007 period to the 2008 to 2014 period. Over the same period, the proportion in the control group of other near-seniors who were employed increased by 10%.Footnote 29 Therefore, comparing the 2 growth rates, the growth in the proportion who were employed in the treatment group was 22 percentage points higher than that in the control group. These 2 interpretations suggest a positive effect of this policy change on the proportion of recipients of the Allowances who worked. However, as discussed above, a regression framework should be used in order to take into account differences in socio-economic characteristics between the treatment and control groups.
| Labour market outcomes | Level and change | Treatment group (Allowances recipients), after | Treatment group (Allowances recipients), before | Treatment group (Allowances recipients), difference | Control group (other near-seniors), after | Control group (other near-seniors), before | Control group (other near-seniors), difference | Difference-in-difference |
|---|---|---|---|---|---|---|---|---|
| Percentage work for employer | level | 16.8% | 12.3% | 4.6 p.p. | 49.3% | 44.8% | 4.5 p.p. | 0.1 p.p. |
| Percentage work for employer | Percent change | n/a | n/a | 31.6% | n/a | n/a | 9.6% | 22.0 p.p. |
| Average employment earnings (if greater than 0) | level | $11,740 | $9,306 | $2,434 | $49,353 | $48,082 | $1,271 | $1,162 |
| Average employment earnings (if greater than 0) | Percent change | n/a | n/a | 23.2% | n/a | n/a | 2.6% | 20.6 p.p. |
- Source: 10% sample of T1 file from the CRA (2,291,437 observations of 60 to 64 year olds). Note that % changes are calculated using differences in the natural logarithm of period averages. ‘p.p.’ stands for percentage points. Control group includes near-seniors (60 to 64) not receiving the Allowances that have income other than work above Allowances thresholds or that are neither widows nor spouses of seniors. Note that self-employment income is not taken into account in these results as it does not qualify for the GIS earnings exemption.
For average work earnings (2014 dollars) among those who were employed, comparisons show that recipients of the Allowances had an increase that was $1,162 higher than among the control group, between the 2002 to 2007 and 2008 to 2014 periods. Comparing growth rates, recipients of the Allowances who worked had an increase in average work earnings that was 21 percentage points higher than the increase among the control group.
Regression results
As discussed above, a regression framework should be used to analyze the effect of this policy change. There are 2 hypotheses (Ho) we should test:
- the increase in the GIS earnings exemption increased the proportion of recipients of the Allowances who were employed, and
- the increase in the GIS earnings exemption increased employment earnings (2014 dollars) among recipients of the Allowances who were employed
Table 7 presents the main regression results; the effect of the policy change is presented in the first line. Other variables in the regression include: an indicator for the group (treatment or control), an indicator for time (pre- or post-policy change), gender, marital status (single or not), an indicator for having a spouse aged 65 years and older, an indicator for having a spouse who works, an indicator for being self-employed, an indicator for living in one of Canada’s largest urban centers (Vancouver, Calgary, Edmonton, Toronto, Ottawa and Montreal), indicators for each age between 61 and 64 and indicators for each province and territory. Indicators for each year (2002 to 2014) were also added to the regression to take into account the changing economic situation during this period, notably the recession of 2008 and the ensuing recovery. It is assumed that the recession had similar effects among the control and treatment groups, given they were following similar trends beforehand. Income was not included in the regressions given it was used to select the treatment and control groups (which are recipients and non-recipients of income-tested benefits).
| Variables | Allowances recipients - Proportion who worked for an employer | Allowances recipients - log natural (employment earnings) if greater than 0 |
|---|---|---|
| Effect of the policy change | 0.011* | 0.150* |
| Group (0 or 1) | -0.176* | -0.841* |
| Time period (0 or 1) | 0.004* | 0.056* |
| Women | -0.070* | -0.448* |
| Single | 0.061* | 0.069* |
| Spouse 65 and over | -0.086* | -0.472* |
| Spouse works | 0.192* | 0.167* |
| Self-employed | -0.241* | -0.380* |
| Largest urban centers | 0.026* | 0.227* |
| Age 60 | (reference) | (reference) |
| Age 61 | -0.048* | -0.113* |
| Age 62 | -0.088* | -0.190* |
| Age 63 | -0.122* | -0.264* |
| Age 64 | -0.154* | -0.350* |
- * indicates significant at the 1% level.
- Source: 10% sample of T1 file from the CRA (2,291,437 observations of people aged 60 to 64).
Regressions include bootstrapped standard errors clustered on individuals and dummies for each province/territory and each year. Note that self-employment income is not taken into account in these results as it does not qualify for the GIS earnings exemption.
For recipients of the Allowances, the increase in the GIS earnings exemption increased the proportion that worked for an employer by 1 percentage point and increased employment earnings by 15% among those who are employed. Based on average employment earnings among recipients of the Allowances that worked in the 2002 to 2007 period ($9,306), a 15% increase represents almost $1,400 per year for the average Allowances recipient that works.
Different ways of defining the regression standard errors were explored (including robust, clustered on individuals and bootstrapped), without any change to the statistical significance of the results.
Table 8 examines the robustness of the results to different regression specifications. Similar regressions were estimated changing the dependent variable from a normal form to a natural logarithm (ln) form, restricting the sample to years before 2011 (using only the first 3 years after the policy change) and including self-employment in the dependent variable. All results were of the same sign and all except 1 were statistically significant, enhancing our confidence in the results presented. Results were also of similar magnitude in all specifications.
| Dependent variable | Specification | Effect of policy change | Effect with sample restricted to before 2011 |
|---|---|---|---|
| Percent who worked for an employer | level | 1.1* p.p. | 1.0* p.p. |
| Percent who worked for an employer | ln | 0.8*% | 0.7*% |
| Percent who worked (including self-employed) | level | 1.5* p.p. | 1.3* p.p. |
| Employment earnings (if greater than 0) | level | $320 | $639*** |
| Employment earnings (if greater than 0) | ln | 15.0*% | 11.3*% |
| Employment and self-employed earnings (if greater than 0) | ln | 11.3*% | 7.5*% |
- * indicates significant at the 1% level
- ** indicates significant at the 5% level
- *** indicates significant at the 10% level
- Source: 10% sample of T1 file from the CRA (2,291,437 observations of people aged 60 to 64). Regressions include bootstrapped standard errors clustered on individuals. Growth rates (%) and percentage points (p.p.) increases are distinguished in the table to be precise. Note that as the natural logarithm of zero does not exist, 1 was added to all values of the employment variable (0 or 1) in the ln specification. Also note that self-employment income is not taken into account in these results as it does not qualify for the GIS earnings exemption.
5. Conclusions
This paper used T1 data from the CRA to examine the labour market impacts of the 2008 increase in the GIS earnings exemption. The study is one of many lines of evidence being produced for the evaluation of the OAS program.
This study showed that the increase in the GIS earnings exemption in 2008 has increased the labour market participation of recipients of the Allowances. Using a treatment and a control group in a difference-in-difference regression framework, it was estimated that this policy change increased employment earnings by 15% among those who work for an employer and increased the employment rate of recipients of the Allowances by 1 percentage point.
It was not possible to use this regression framework to examine the effect on GIS recipients. Nevertheless, descriptive statistics show a similar increase in employment earnings after the increase in the GIS earnings exemption, among GIS recipients who choose to work.
6. Bibliography
Beach, Charles M. (2008), “Canada’s Aging Workforce: Participation, Productivity, and Living Standards”, A festschrift in Honour of David Dodge, Bank of Canada, p. 197 to 218.
Bélanger, A., Y. Carrière and P. Sabourin (2016), “Understanding Employment Participation of Older Workers : the Canadian Perspective”, Canadian Public Policy, p. 94 to 109.
Canada Revenue Agency (2015), “Final Statistics 2015 edition (for the 2013 tax year)”,
https://www.canada.ca/en/revenue-agency/programs/about-canada-revenue-agency-cra/income-statistics-gst-hst-statistics/t1-final-statistics/t1-final-statistics-2015-edition-2013-tax-year.html
Carrière, Yves and Diane Galarneau (2011), “Delayed Retirement: a New Trend?”, Perspectives on Labour and Income, Winter, p. 3 to 16.
ESDC (2015), “The CPP & OAS Stats Book 2015”.
ESDC (2012), “Summative Evaluation of the Old Age Security Program”,
http://publications.gc.ca/pub?id=9.696235&sl=1
Horner, Keith (2011), “The Labour Supply of Older Workers: Review of Trends and Analysis”, report prepared for HRSDC, 59 p.
Kline, Patrick and Melissa Tatari (2016), “Bounding the Labour Supply Responses to a Randomized Welfare Experiment: A Revealed Preference Approach”, American Economic Review, 106(4), p. 972 to 1014.
Office of the Chief Actuary (2014), “Actuarial Report (12th) on the OAS Program”,
http://www.osfi-bsif.gc.ca/Eng/Docs/OAS12.pdf
Pilieci, Paul J. (2014), “Statistical Profile of Employment among GIS and Allowances Recipients and the Earnings Exemption”, PIMA Pension Research Series, no. 2014-01, ESDC, 11 p.
Service Canada (2015), “Information Sheet: Statement of Income for the GIS, the Allowance and the Allowance for the Survivor”, SC ISP-3026A (2015-01-27) E.
Varian, Hal. R. (1995), “Analyse microéconomique”, De Boeck, Bruxelles.
Annex: Supplementary tables
| Year | Proportion working, GIS | Proportion working, other OAS pension recipients | Proportion working, Allowances | Proportion working, other near-seniors (60 to 64) | Mean work income (if individual works) (2014 dollars), GIS | Mean work income (if individual works) (2014 dollars), other OAS pension recipients | Mean work income (if individual works) (2014 dollars), Allowances | Mean work income (if individual works) (2014 dollars), other near-seniors (60 to 64) |
|---|---|---|---|---|---|---|---|---|
| 2002 | 5.0% | 15.8% | 15.2% | 52.4% | 4,932 | 28,770 | 7,916 | 42,630 |
| 2003 | 5.5% | 16.5% | 16.7% | 54.0% | 4,422 | 28,582 | 7,508 | 42,100 |
| 2004 | 5.6% | 17.0% | 17.2% | 55.4% | 4,865 | 28,926 | 7,781 | 43,124 |
| 2005 | 5.7% | 17.6% | 17.4% | 55.6% | 5,284 | 29,466 | 8,633 | 44,282 |
| 2006 | 5.8% | 18.4% | 18.3% | 57.1% | 5,590 | 31,155 | 8,592 | 46,339 |
| 2007 | 6.4% | 19.7% | 20.2% | 58.7% | 5,586 | 31,787 | 8,522 | 46,811 |
| 2008 | 6.5% | 20.4% | 21.7% | 59.0% | 5,911 | 30,447 | 8,896 | 46,162 |
| 2009 | 6.5% | 20.6% | 21.8% | 58.6% | 5,944 | 30,151 | 9,965 | 45,358 |
| 2010 | 6.5% | 20.9% | 22.3% | 58.4% | 6,414 | 29,956 | 10,578 | 45,869 |
| 2011 | 7.1% | 22.1% | 23.0% | 59.5% | 6,605 | 29,936 | 10,005 | 45,402 |
| 2012 | 7.3% | 22.7% | 24.0% | 59.8% | 6,463 | 30,476 | 10,962 | 46,308 |
| 2013 | 7.2% | 23.1% | 23.0% | 60.6% | 6,522 | 29,833 | 10,760 | 47,429 |
| 2014 | 7.2% | 23.0% | 23.6% | 61.2% | 6,582 | 28,504 | 11,095 | 47,658 |
- Source: 10% sample of T1 file from the CRA (8,434,625 observations of people 60 and over). Note that self employment income values that were negative were replaced with zeros when calculating average work income.