
Report: Take-up rate of the Guaranteed Income Supplement: findings from tax and program administrative data
Official title: Take-up rate of the Guaranteed Income Supplement: findings from tax and program administrative data – Technical report prepared for the evaluation of the take-up of the Guaranteed Income Supplement
Authored by: Edouard Imbeau, Evaluation Directorate
Date: January 2018
On this page
- List of abbreviations
- List of figures
- List of tables
- Acknowledgements
- 1. Introduction
- 2. The Guaranteed Income Supplement and the Old Age Security pension
- 3. Data
- 4. Analysis
- 4.1 How has Guaranteed Income Supplement take-up changed since 2006 and, in particular, how has it changed for vulnerable populations
- 4.1.1 Number of Guaranteed Income Supplement eligible non-recipients
- 4.1.2 Guaranteed Income Supplement take-up by socio-economic characteristics
- 4.2 How have the types of potentially eligible non-recipients of the Guaranteed Income Supplement evolved since 2006
- 4.2.1 Guaranteed Income Supplement eligible non-recipient taxfilers
- 5. Conclusions
- 6. Bibliography
- Annex
Alternate formats

Take-up Rate of the Guaranteed Income Supplement: findings from tax and program administrative data [PDF - 577.6 KB]
Large print, braille, MP3 (audio), e-text and DAISY formats are available on demand by ordering online or calling 1 800 O-Canada (1-800-622-6232). If you use a teletypewriter (TTY), call 1-800-926-9105.
List of abbreviations
- CANSIM
- Canadian Socio-Economic Information Management System
- CPI
- Consumer Price Index
- CPP
- Canada Pension Plan
- CRA
- Canada Revenue Agency
- DPR
- Departmental Performance Report
- EI
- Employment Insurance
- ESDC
- Employment and Social Development Canada
- GIS
- Guaranteed Income Supplement
- LAD
- Longitudinal Administrative Databank
- OAS
- Old Age Security
- QPP
- Quebec Pension Plan
- RDSP
- Registered Disability Savings Plan
- UCCB
- Universal Child Care Benefit
List of figures
- Equation 1 – Calculating the GIS take-up rate
- Figure 1 – GIS take-up rate by gender, 2006 to 2015 (taxfilers only)
- Figure 2 – GIS take-up rate by age, 2006 to 2015 (taxfilers only)
- Figure 3 – GIS take-up rate by marital status, 2006 to 2015 (taxfilers only)
- Figure 4 – GIS take-up rate by region, 2006 to 2015 (taxfilers only)
- Figure 5 – GIS take-up rate by real family income (2015 dollars) used to assess eligibility for GIS, 2006 to 2015 (taxfilers only)
- Figure 6 – GIS take-up rate by Canada and Quebec Pension Plan receipt status, 2006 to 2015 (taxfilers only)
- Figure 7 – Distribution of the number of GIS eligible non-recipients in 2015 (%)
- Figure 8 – Distribution of the number of GIS eligible non-recipients in 2006 (%)
List of tables
- Table 1 – Description of senior population estimates (65 and over) in administrative data
- Table 2 – Sample comparison to OAS published figures (2015)
- Table 3A – Distribution (%) of socio-economic characteristics by gender (2015)
- Table 3B – Distribution (%) of socio-economic characteristics by marital status (2015)
- Table 3C – Distribution (%) of socio-economic characteristics by age (2015)
- Table 3D – Distribution (%) of socio-economic characteristics by group (2015)
- Table 4 – Overall OAS pension and GIS take-up rate, 2006 to 2015
- Table 5 – Comparing GIS take-up rates in different sources, 2006 to 2015
- Table 6 – Overall number of GIS eligible non-recipients, 2006 to 2015
- Table 7A – Regression of GIS take-up on socio-economic characteristics by age group
- Table 7B – Regression of GIS take-up on socio-economic characteristics by region
- Table 7C – Regression of GIS take-up on socio-economic characteristics by real family income (2015 dollars), used to assess GIS eligibility
- Table 7D – Regression of GIS take-up on socio-economic characteristics by variable
- Table 8 – Take-up rates of the OAS pension and GIS among taxfilers
- Table 9A – Socio-economic characteristics of GIS eligible taxfilers by gender (%)
- Table 9B – Socio-economic characteristics of GIS eligible taxfilers by marital status (%)
- Table 9C – Socio-economic characteristics of GIS eligible taxfilers by age (%)
- Table 9D – Socio-economic characteristics of GIS eligible taxfilers by regions (%)
- Table 9E – Socio-economic characteristics of GIS eligible taxfilers by real family income (2015 dollars), used to assess GIS eligibility (%)
- Table 9F – Socio-economic characteristics of GIS eligible taxfilers who are getting OAS pension (%)
- Table 9G – Socio-economic characteristics of GIS eligible taxfilers by group (%)
- Table A1 – Overall GIS take-up estimates with different assumptions on take-up among non-taxfilers
Acknowledgements
The author would like to thank Caroline Wong for her invaluable help with the data linking, the data analysis and the first draft of this report. The author would also like to thank Richard De Marco, Harold Henson, James Kuhnke, Josée Perreault for helpful comments and suggestions, as well as members of the Old Age Security Policy division (ESDC) for their support and comments on this project.
This paper is a technical document prepared to provide support for the evaluation of the Old Age Security Program. Its content does not represent the views or opinions of Employment and Social Development Canada (ESDC) or the Government of Canada.
1. Introduction
The Guaranteed Income Supplement (GIS) is a benefit provided to lower income seniors, in complement of their Old Age Security (OAS) pension. This paper examines the take-up rate of the GIS and describes the characteristics of those who are the eligible non-recipients, over the period between 2006 and 2015. Note that 2015 was the most recent available year of tax data from the Canada Revenue Agency.
This study is a part of the overall work being conducted for the evaluation of the take-up of the GIS.
1.1 Study objectives
This report is part of a series of quantitative and qualitative reports that examines how GIS take-up has changed since 2006, including among vulnerable groups (for example, immigrants, Indigenous people, those living in remote communities, etc.). It identifies barriers to take-up among different groups of seniors and the effectiveness of actions taken by ESDC to reach these groups, recognizing that many barriers are at play. The following study will help answer the following evaluation questions:
- how has GIS take-up changed since 2006 and, in particular, how has it changed for vulnerable populations (for example, immigrants, Indigenous people, those living in remote communities, etc.)
- how have the types of potentially eligible non-recipients of the GIS evolved since 2006
1.2 Report outline
Section 2 of the report provides a summary of the GIS and the OAS pension. Section 3 examines the data used in the report, Section 4 presents the analysis and Section 5 offers conclusions.
2. The Guaranteed Income Supplement and the Old Age Security pension
This section presents a general description of eligibility rules for the GIS and the OAS pension. The OAS pension is a quasi-universal basic pension received by seniors aged 65 years and older. The OAS program provides additional support through the income-tested GIS to low-income seniors with little or no other income.
2.1 Old Age Security pension
The OAS pension is paid to Canada’s seniors in recognition of the contribution they have made to Canadian society, the economy, and their community. In July 2015, the OAS pension provided benefits to 5.6 million seniors with the full basic pension amounting to $564.87 per month (or about $6,800 per year). All benefits under the OAS program are indexed quarterly.
Eligibility for the OAS pension is based on years of residence in Canada. In order to qualify, a person living in Canada at the time of application must be 65 years or older, and have resided in Canada for at least 10 years after the age of 18Footnote 1. The full basic OAS pension is payable to seniors who have resided in Canada for at least 40 years after age 18. A partial pension is paid to seniors who have lived in Canada for at least 10 years after age 18, and their benefits are prorated at the rate of 1 fortieth of the full pension for each complete year of residenceFootnote 2.
The OAS Recovery Tax, which is part of the Income Tax Act, requires all higher-income pensioners to repay part or all of their OAS pension if their individual income exceeds a threshold. For the 2015 tax year, seniors must repay $0.15 for every dollar of income exceeding $72,809. Benefits are completely repaid when income reaches $118,055Footnote 3. The Recovery Tax can be deducted at the source, but final amounts are determined when seniors file their income tax returns each year.
2.2 Guaranteed Income Supplement
When seniors have little or no other income, the GIS can be added to their OAS pensionFootnote 4. In July 2015, the GIS was paid to 1.8 million low-income seniors and could reach $765.93 per month for single seniors and $507.87 per month for seniors who were married or in a common-law relationship (or up to about $9,200 or $6,100 per year respectively)Footnote 5. Adding the OAS pension and GIS, OAS benefits can reach $16,000 and $13,000 per year respectively.
In order to qualify for the GIS, a person must receive the OAS pension and have family income below the maximum annual thresholdsFootnote 6. GIS benefits are reduced by $0.50 for every dollar of income, other than the OAS pension and the GISFootnote 7, until income reaches $2,048 for single seniors and $4,096 for couples, then by $0.75 for every dollar of other income between $2,048 to 4,544 for single seniors and $4,096 to $7,648 for couples. When income exceeds these amounts, GIS benefits are then reduced by $0.50 for every dollar of other incomeFootnote 8. This implies that single seniors qualified for the GIS with incomes below $17,136 per year and below $22,608 for senior couples in July 2015Footnote 9.
2.3 Indexation
Benefits paid under the OAS program are, by law, adjusted quarterly (in January, April, July, and October) according to any change in the cost-of-living, as measured by the Consumer Price Index (CPI).Footnote 10 The CPI measures, on a monthly basis, the average change in retail prices of a “basket” of goods and services commonly purchased by Canadian households (such as shelter, food, clothing, and transportation).
2.4 Recent changes to the Old Age Security program
In recent years, the OAS program has undergone several changes that are now in place:
- Budget 2011 introduced the GIS top-up that provides additional income to the lowest-income seniors that rely almost exclusively on the OAS program
- since July 2013, seniors have the option of voluntarily deferring the start of their OAS pension in exchange for a higher monthly payment
- since April 2013, an automatic enrolment process has been introduced, eliminating the need for many seniors to apply for the OAS pension. The second phase of automatic enrolment for the OAS pension was completed in 2016. The Department also introduced a process for automatic enrolment for the GIS in 2018, for clients that are automatically enrolled for the OAS pension
- Budget 2016 increased the GIS top-up for single seniors, restored the age of eligibility for OAS benefits to 65, and committed to looking at how a Seniors Price Index could be developedFootnote 11
3. Data
This paper uses data from the Canada Revenue Agency (CRA) T1 database and OAS administrative data.
The T1 is the tax form used by individuals to file their personal income tax return to the CRA. The T1 database includes information on income and demographic characteristics of all individuals who file a tax return.
The OAS administrative database includes information on OAS and GIS benefits and demographic characteristics of all individuals who are clients of the OAS program, including clients with incomplete applications. Note that OAS clients eligible under international social security agreements (in other words, with less than 10 years of residence in Canada) were not included in the version of the OAS administrative data used for this study.Footnote 12 In the OAS administrative database, income information is available for GIS recipients and for OAS pension recipients who have applied for the GIS. Therefore, no income information is available in this database for most OAS pension recipients. It should be noted that the OAS administrative database is a monthly payment database, in other words, a database is produced for each month recording payments of the month and other information. The current paper uses only June versions of the database each year to create an annual database for each calendar year, therefore a few assumptions had to be made, as explained further.Footnote 13
A 10% sample of individuals aged 65 and older was selected from the T1 and OAS databases from 2006 to 2015 (5.2 million observations).Footnote 14 The sample only includes residents of Canada. Non-residents were excluded from the sample as they are not eligible for the GIS. Furthermore, their income information could be incomplete (non-residents’ income from overseas is not taxable in Canada).Footnote 15
The sample includes taxfilers and non-taxfilers. The non-taxfilers in the sample are seniors who are in the OAS administrative database but were not in the T1 database for that year. Table 1 compares the number of taxfilers and non-taxfilers in the sample to population estimates from Statistics Canada among people 65 years of age and older living in Canada.Footnote 16 It is estimated that each year, 98 to 99% of seniors filed taxes. In recent years, the difference between the sample population estimate and the Statistics Canada population estimate has been less than a percentage point. This suggests that inferences from the sample can be used to represent the general senior population in Canada. In addition, given that population estimates using T1 and OAS administrative data are slightly higher than Statistics Canada population estimates for the number of seniors, these figures suggest that the number of seniors not accounted for by administrative data is likely very limited and likely significantly below 1% of the population of seniors. Therefore, GIS take-up estimates in this paper can be thought of as representative of the entire population of seniors, with a very limited margin of error.
| Year | Statistics Canada population estimates: A | Number of taxfilers (T1 and OAS data): B | Proportion of taxfilers (T1 and OAS data): C=B÷E | Number of non-tax filing OAS clients* (T1 and OAS data): D | Population estimates from administrative data (T1 and OAS data): E=B+D | Percentage difference between both population estimates: F=(E−A)÷A |
|---|---|---|---|---|---|---|
| 2006 | 4,309,958 | 4,247,690 | 97.9% | 92,170 | 4,339,860 | 0.7% |
| 2007 | 4,412,638 | 4,368,790 | 98.3% | 74,220 | 4,443,010 | 0.7% |
| 2008 | 4,532,605 | 4,504,710 | 98.6% | 63,800 | 4,568,510 | 0.8% |
| 2009 | 4,661,110 | 4,640,680 | 98.7% | 59,980 | 4,700,660 | 0.8% |
| 2010 | 4,796,143 | 4,771,200 | 98.7% | 61,300 | 4,832,500 | 0.8% |
| 2011 | 4,950,310 | 4,924,930 | 98.8% | 58,610 | 4,983,540 | 0.7% |
| 2012 | 5,167,113 | 5,135,640 | 98.8% | 62,920 | 5,198,560 | 0.6% |
| 2013 | 5,383,902 | 5,336,650 | 98.7% | 68,970 | 5,405,620 | 0.4% |
| 2014 | 5,589,292 | 5,526,200 | 98.6% | 79,370 | 5,605,570 | 0.3% |
| 2015 | 5,786,907 | 5,667,280 | 97.9% | 124,060 | 5,791,340 | 0.1% |
- Sources: CANSIM 051-0001 (Statistics Canada) and 10% sample of linked T1-OAS databases (5.2 million observations). All estimates are based on age on July 1st, to be in line with Statistics Canada estimates. All other references to age in this paper use the age at the end of the calendar year, as usually defined.
- * Clients whose account was suspended or cancelled were excluded from the number of non-tax filing OAS clients, as many could be deceased. Clients include seniors with incomplete or pending applications that are not receiving OAS benefits. Note that the number of non-taxfilers is always inflated in the 2 to 3 most recent years, as some people file their taxes late.
3.1 Data limitations
The T1 data include information on spouses of individuals in the sample, allowing the examination of couples’ characteristics (for example, couples’ total income, couples’ income used to assess GIS benefit amounts, etc.). However, some of the spouses of individuals in the sample did not file a tax return. The percentage of couples with income information on their spouse varies from 98.6% in 2006 to 99.6% in 2015. Note that information on income in the 2 previous years (for example, 2004 and 2005) was added to the sample to examine GIS eligibility.
Among taxfilers, GIS eligibility was estimated based on income information from the T1 data. The eligibility for GIS from July to June was estimated based on income in the preceding calendar year, following usual procedures of the program. This means that income in the 2 previous calendar years was used to determine eligibility for GIS in a calendar year. In addition, all GIS recipients were also assumed to be eligible for benefits.
To determine an individual’s eligibility for the GIS, the family income used to assess eligibility for the GIS was estimated, as it is not included in the database. This estimated family income includes all sources of income (line 150) from which are subtracted OAS benefits, the estimated GIS earnings exemption, contributions to Employment Insurance (EI) and the Canada / Quebec Pension Plan (C/QPP), net Universal Child Care Benefits (UCCB), Registered Disability Savings Plan (RDSP) income, social assistance payments, Registered Pension Plan deductions, Registered Retirement Savings Plan deductions, the Saskatchewan Pension Plan deduction, Pension Income Splitting (line 210), union and professional dues, child care expenses, the Disability Supports deduction (line 215), allowable business investment loss (line 217), moving expenses, support payments made (line 220), carrying charges and interest expenses (line 221), deduction for Provincial Parental Insurance Plan premiums on self-employment income (line 223), exploration and development expenses (line 224), other employment expenses (line 229), the Clergy residence deduction (line 231) and other deductions (line 232).Footnote 17 This corresponds to the income definition used to calculate GIS benefits. However, due to data limitations, net UCCB payments were not available in the data for years 2006 and 2007.
To determine if an individual met the residence requirements to be eligible for the OAS pension or the GIS, it was assessed if individuals had lived in Canada for a minimum of 10 years after age 18. This information was available in the OAS database or was estimated by the number of years an individual had filed taxes since 1987. Given some people can meet the OAS residence requirements under an international social security agreement with less than 10 years of residence in Canada, it was also assumed that all people receiving OAS benefits met residence requirements.Footnote 18
To determine if an individual received the GIS or the OAS pension, information in the T1 and OAS databases was used, as some people may neglect to indicate OAS benefits when filing taxes (the GIS is non-taxable). Because the version of the OAS database used in this paper has information on benefits received in June, it was assumed that if an individual received GIS benefits in June and their entitlement date (in other words, date first entitled to benefits) for the July-to-June period was before January 1st, then it implied that they also received benefits in the preceding calendar year. However, for years before 2011, the variable indicating GIS entitlement date was not available in the data that were available for the study; it had to be assumed that if the OAS pension entitlement date was before January 1st of that year, the GIS entitlement date should also be before January 1st of that year. Similarly, it was assumed that if an individual received OAS pension benefits in June and their entitlement date for the pension was before January 1st, then it implied that they also received benefits in the preceding calendar year.
Among non-taxfilers, GIS eligibility could not be estimated for each individual, as there is no individual income information to base eligibility on. Assumptions regarding GIS take-up among non-taxfilers are discussed in detail in section 4.1.
Finally, Table 2 below shows that the sample used has estimates of the number of recipients of the OAS pension and the GIS that are similar to published numbers from OAS administrative data. Note that the T1 data provides an estimate of the number of people receiving benefits in a year while the published OAS figures provide the monthly average number of people receiving benefits in a year.Footnote 19
| Item | T1 & OAS data (taxfilers and non-taxfilers) (annual data) | Published numbers from OAS administrative data (monthly average) |
|---|---|---|
| Number receiving OAS pension | 5,707,480 | 5,597,062 |
| Number receiving GIS | 2,103,020 | 1,798,142 |
- Sources: 10% sample of linked T1-OAS databases (599,091 observations in 2015) and OAS administrative data (monthly average number of beneficiaries by calendar year from “The CPP and OAS Stats Book 2016”).
4. Analysis
The GIS take-up rate is the percentage of seniors eligible for the GIS who actually receive the GIS.
Equation 1 – Calculating the GIS take-up rate
Equation 1 – Text version
The GIS take-up rate in percent is equal to the ratio of the number of GIS recipients to the number of people who are eligible multiplied by 100.
The analysis in this paper is divided in 2 parts. Section 4.1 examines how GIS take-up has changed since 2006 and in particular how it has changed for different groups. Changes in the different types of GIS eligible non-recipients are explored in section 4.2.
This report will present findings using only data on taxfilers for most of the report, given data limitations on non-taxfilers outlined earlier. Findings on the overall GIS-take-up rate and the number of eligible non-recipients use data on taxfilers and non-taxfilers. However, findings on take-up of different sub-groups and on the different types of GIS eligible non-recipients use mainly data on taxfilers only. It was not possible to examine the characteristics of non-taxfilers eligible for the GIS due to data limitations. These caveats should not be a significant concern given that taxfilers represent 98 to 99% of seniors each year. Seniors are defined throughout this paper as people aged 65 and over.
Based on taxfilers and non-taxfilers in our sample, in 2015 there were 5.8 million seniors aged 65 and over living in Canada. In 2015, 95.3% of seniors aged 65 and older received the OAS pension, of whom about 97.9% were taxfilers.Footnote 20 Among those who received the OAS pension 36.8% also received the GIS. Among the senior population aged 65 and above, 35.1% of seniors received GIS in 2015.
Table 3 presents the distribution of socio-economic characteristics of senior taxfilers and non-taxfilers. Among taxfilers, about 45.6% were men and 54.4% women. These proportions were more even among non-tax filing OAS pensioners: 49.9% were women and 50.1% men. Among taxfilers, 41.1% were single and 58.9% were married. Marital status is not available for most non-taxfilers. The age distribution was similar among both groups, with about a third being 65 to 69, half aged 70 to 84 and about 15% that are 85 or older. More than 80% of seniors live in urban areas, among both taxfilers and non-taxfilers. Finally, about 95% of the 2 groups receive the OAS pension. However, a higher percentage of seniors receive the GIS among taxfilers than among non-taxfilers in 2015 (35% versus 26%).
For accessibility reasons, the table has been simplified. Consult the PDF version for the full table.
| Gender | Taxfilers | Non-taxfilers |
|---|---|---|
| Women | 54.4 | 49.9 |
| Men | 45.6 | 50.1 |
| Marital status | Taxfilers | Non-taxfilers |
|---|---|---|
| Single | 41.1 | n/a |
| Married | 58.9 | n/a |
| Age | Taxfilers | Non-taxfilers |
|---|---|---|
| 65 to 69 | 32.4 | 34.2 |
| 70 to 74 | 23.5 | 21.8 |
| 75 to 79 | 17.2 | 14.5 |
| 80 to 84 | 12.9 | 12.4 |
| 80 to 84 | 12.9 | 12.4 |
| 85 and over | 14.1 | 17.2 |
| Group | Taxfilers | Non-taxfilers |
|---|---|---|
| Living in urban areas | 81.0 | 81.6 |
| Receiving OAS pension | 95.2 | 96.2 |
| Receiving the GIS | 35.3 | 26.4 |
- Source: 10% sample of linked T1-OAS databases (599,091 observations in 2015). Married includes common-law relationships. n/a indicates not available.
4.1 How has Guaranteed Income Supplement take-up changed since 2006 and, in particular, how has it changed for vulnerable populations
The overall GIS take-up rate was 89.8% in 2015. This is the same take-up as in 2006. Take-up has varied only slightly between those years, as shown in Table 4, with take-up being 2 percentage points lower from 2011 to 2014. The take-up rate was calculated based on take-up of senior taxfilers in the sample and an estimate of the take-up among non-taxfilers. During the period between 2006 and 2015, tax filing seniors accounted for over 98.6% of the senior population while non-tax filing seniors represented about 1.4% of the entire senior population.
For context, Table 4 also presents the overall OAS pension take-up rate, which was 96.8% in 2015, and has only slightly decreased from its high of 98.4% in 2006. This take-up rate was calculated based on take-up of senior taxfilers and non-taxfilers in the sample. Note that since July 2013, seniors have the option of voluntarily deferring the start of their OAS pension in exchange for a higher monthly payment. This could help explain the slight decrease in the OAS pension rate in the last few years. It is not possible to identify individuals who deferred their OAS pension; these are therefore included in the number of eligible people not taking up the OAS pension.Footnote 21
| Year | Overall OAS pension take-up rate (%) | Taxfilers’ OAS pension take-up rate (%) | Overall GIS take-up rate (%) | Taxfilers’ GIS take-up rate (%) |
|---|---|---|---|---|
| 2006 | 98.4 | 98.4 | 89.8 | 90.2 |
| 2007 | 98.3 | 98.3 | 89.4 | 89.8 |
| 2008 | 98.2 | 98.2 | 89.1 | 89.4 |
| 2009 | 98.1 | 98.1 | 89.4 | 89.6 |
| 2010 | 98.1 | 98.0 | 90.0 | 90.2 |
| 2011 | 97.8 | 97.8 | 87.8 | 88.0 |
| 2012 | 97.7 | 97.7 | 87.8 | 88.0 |
| 2013 | 97.5 | 97.5 | 87.4 | 87.6 |
| 2014 | 97.2 | 97.2 | 87.4 | 87.5 |
| 2015 | 96.8 | 96.7 | 89.8 | 90.0 |
- Source: 10% sample of linked T1-OAS databases (5.2 million observations).
Assumptions regarding GIS take-up among non-taxfilers
It is assumed that senior non-taxfilers should have a lower GIS take-up rate than senior taxfilers, given they are a more vulnerable population and already have issues filing their income tax return. For the main estimates of this paper, it was assumed the GIS take-up rate was 75% among non-taxfilers. In the Annex of the paper, it is shown that overall GIS take-up rates do not increase by more than 0.4 percentage points if we alternatively assumed that GIS take-up among non-taxfilers was 90% (a take-up rate similar to the take-up among taxfilers). In the same way, overall GIS take-up rates do not decrease by more than 0.6 percentage points if we alternatively assumed that GIS take-up among taxfilers was 60%. This is because non-taxfilers represent a very small proportion of our sample (about 1.4% of seniors in our sample are non-taxfilers).
GIS take-up rate from other sources
GIS take-up rates presented in this report are similar to take-up rates calculated for ESDC’s Departmental Performance Report (DPR), as shown in Table 5. GIS take-up in the Departmental Performance Report is based on taxfilers in Statistics Canada’s Longitudinal Administrative Databank (LAD).Footnote 22 The advantage of results in this paper is that they are based on taxfilers and non-taxfilers.
| Year | Overall GIS take-up rate (%) using T1-OAS admin data (current paper) | Taxfilers’ GIS rake-up rate (%) using T1-OAS admin data (current paper) | Taxfilers’ GIS take-up rate (%) using Longitudinal Administrative Database (ESDC’s DPR) | Overall GIS take-up rate (%) using National Household Survey (evaluation report) |
|---|---|---|---|---|
| 2006 | 89.8 | 90.2 | n/a | n/a |
| 2007 | 89.4 | 89.8 | n/a | n/a |
| 2008 | 89.1 | 89.4 | n/a | n/a |
| 2009 | 89.4 | 89.6 | 90.7 | n/a |
| 2010 | 90.0 | 90.2 | 89.6 | 89.1 |
| 2011 | 87.8 | 88.0 | 89.4 | n/a |
| 2012 | 87.8 | 88.0 | 88.5 | n/a |
| 2013 | 87.4 | 87.6 | 89.1 | n/a |
| 2014 | 87.4 | 87.5 | 87.5 | n/a |
| 2015 | 89.8 | 90.0 | n/a | n/a |
- Sources: 10% sample of linked T1-OAS databases (5.2 million observations), National Household Survey results from Imbeau (2016), LAD results from ESDC (2017) and internal documents. Note that the LAD results from 2009 to 2011 were updated (by less than 1 percentage point) after the publication of ESDC (2016) to reflect a slight change in methodology adopted thereafter.
4.1.1 Number of Guaranteed Income Supplement eligible non-recipients
The overall estimated number of GIS eligible non-recipients has increased from 203,000 in 2006 to 290,000 in 2014, before decreasing to 240,000 in 2015 (Table 6). The increase between 2006 and 2014 reflects the slight decrease in the GIS take-up rate discussed above and the significant increase in the number of seniors. With population aging, the population of seniors increased by more than 1.3 million from 2006 to 2014 as illustrated in Table 6. The decrease in the number of GIS eligible non-recipients in 2015 reflects the increase in the GIS take-up rate in 2015, as the population of seniors continued to grow.
The table also presents a confidence interval for the number of GIS eligible non-recipients each year. In 2015, it is estimated there were between 232,000 and 251,000 GIS eligible non-recipients. The width of the confidence interval reflects assumptions on GIS take-up among non-taxfilers discussed above. The numbers of GIS eligible non-recipients are based on the data on taxfilers in the sample and on an estimate of GIS take-up among non-taxfilers.Footnote 23
| Year | Main estimates | Confidence interval | Overall GIS take-up rate (%) | Population of seniors (millions) |
|---|---|---|---|---|
| 2006 | 203,000 | 194,000 to 216,000 | 89.8 | 4.3 million |
| 2007 | 214,000 | 206,000 to 225,000 | 89.4 | 4.4 million |
| 2008 | 222,000 | 216,000 to 233,000 | 89.1 | 4.6 million |
| 2009 | 217,000 | 211,000 to 226,000 | 89.4 | 4.7 million |
| 2010 | 209,000 | 203,000 to 218,000 | 90.0 | 4.8 million |
| 2011 | 264,000 | 258,000 to 273,000 | 87.8 | 5.0 million |
| 2012 | 271,000 | 265,000 to 280,000 | 87.8 | 5.2 million |
| 2013 | 285,000 | 279,000 to 293,000 | 87.4 | 5.4 million |
| 2014 | 290,000 | 284,000 to 299,000 | 87.4 | 5.6 million |
| 2015 | 240,000 | 232,000 to 251,000 | 89.8 | 5.8 million |
- Source: 10% sample of linked T1-OAS databases (5.2 million observations). Estimates of the number of GIS eligible non-recipients are rounded off to the nearest thousand.
Main estimates use a 75% take-up rate among non-taxfilers (1.4% of the sample), while also using take-up data on taxfilers (98.6% of the sample). In the confidence interval, the low estimate uses a 90% take-up rate among non-taxfilers, while the high estimate uses 60%. The confidence intervals show that changing the assumption regarding take-up among non-taxfilers increases or decreases overall estimates of the number of GIS eligible non-recipients by less than 13,000 individuals (or less than 6%). This is because non-taxfilers are a very small percentage of the sample (1.4% of the sample).
4.1.2 Guaranteed Income Supplement take-up by socio-economic characteristics
GIS take-up varies with socio-economic characteristics of individuals. This section examines gender, age, marital status, region and income. Take-up varies with most of these characteristics, even though take-up remains high among all groups. Note that results in this section are only based on taxfilers (98.6% of the sample), given the limited information on senior non-taxfilers.
Gender
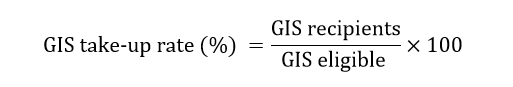
Take-up is higher among women than among men. The difference in take-up between men and women has been steady at around 5 percentage points (Figure 1). For women, take-up varied from 92% in 2006 to 90% in 2014, before reaching 92% again in 2015. For men, take-up was 88% in 2006 and declined to 84% in 2014 before reaching 87% in 2015.
Figure 1 – GIS take-up rate by gender, 2006 to 2015 (taxfilers only)
- Source: 10% sample of taxfilers in linked T1-OAS databases (5.1 million observations)
Figure 1 – Text version
| Year | Men | Women |
|---|---|---|
| 2006 | 87.7% | 91.8% |
| 2007 | 87.5% | 91.2% |
| 2008 | 86.5% | 91.2% |
| 2009 | 86.9% | 91.4% |
| 2010 | 87.3% | 92.1% |
| 2011 | 84.9% | 90.1% |
| 2012 | 84.7% | 90.2% |
| 2013 | 84.3% | 89.8% |
| 2014 | 84.3% | 89.8% |
| 2015 | 87.1% | 92.1% |
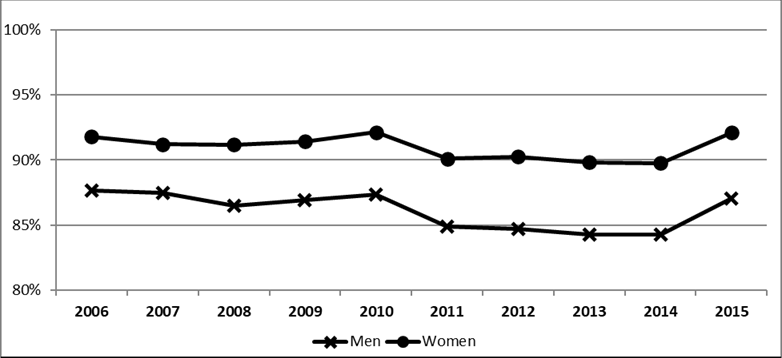
Age
Take-up varies by age group, with lower take-up among younger seniors. Take-up was significantly lower for seniors between the ages of 65 to 69, and somewhat lower for seniors between the ages of 70 and 74 compared to older seniors (with take-up rates of respectively, 84%, 91% and 93% in 2015). The difference in take-up rates was on average about 8 percentage points for 65 to 69 year olds during the period observed, compared to those over 74 years old (Figure 2). Differences in take-up were smaller among older age groups, with very similar take-up rates for age groups above 74.
Figure 2 – GIS take-up rate by age, 2006 to 2015 (taxfilers only)
- Source: 10% sample of taxfilers in linked T1-OAS databases (5.1 million observations).
Figure 2 – Text version
| Year | 65 to 69 | 70 to 74 | 75 to 79 | 80 to 84 | 85 and over |
|---|---|---|---|---|---|
| 2006 | 85.9% | 90.3% | 91.9% | 91.9% | 92.6% |
| 2007 | 85.4% | 89.9% | 91.4% | 91.6% | 92.2% |
| 2008 | 84.3% | 89.6% | 91.2% | 91.5% | 92.2% |
| 2009 | 84.6% | 89.5% | 91.7% | 92.1% | 92.7% |
| 2010 | 85.1% | 90.2% | 92.6% | 92.6% | 93.0% |
| 2011 | 83.1% | 88.4% | 90.3% | 90.2% | 90.4% |
| 2012 | 82.9% | 88.2% | 90.4% | 90.6% | 90.6% |
| 2013 | 82.1% | 88.1% | 89.9% | 90.1% | 90.5% |
| 2014 | 81.5% | 88.0% | 90.4% | 90.6% | 90.5% |
| 2015 | 83.5% | 91.2% | 93.0% | 93.0% | 92.8% |
From 2006 to 2014, there was a slight decrease in take-up among all age groups. It was most apparent among individuals aged between 65 and 69, where take-up declined by 4 percentage points during the period. Other age groups saw take-up decrease by around 2 percentage points during the period. However, 2015 saw an increase in take-up among all age groups, bringing the take-up rates among those aged over 69 higher than in 2006.
Marital status
Take-up varies by marital status, with higher take-up among single and widowed individuals. Take-up for single and widowed seniors is on average about 5 percentage points higher than take-up among married individuals (Figure 3).Footnote 24 Take-up has been relatively steady among single and widowed seniors during this period. It was 92% for both single seniors and widowed seniors in 2015. For married individuals, take-up has also been relatively steady, except for a small dip in take-up between 2011 and 2014. Take-up for married individuals was 87% in 2015.
Region
Regionally, the variation in take-up is quite significant. Take-up is lower in the Ontario, Western and Northern regions of Canada than in the Atlantic and Quebec regions. In 2015, take-up was around 94% in the Atlantic and Quebec regions, while it was 88% in the Western region, 87% in Ontario and it was 85% in the Northern region.
Figure 3 – GIS take-up rate by marital status, 2006 to 2015 (taxfilers only)
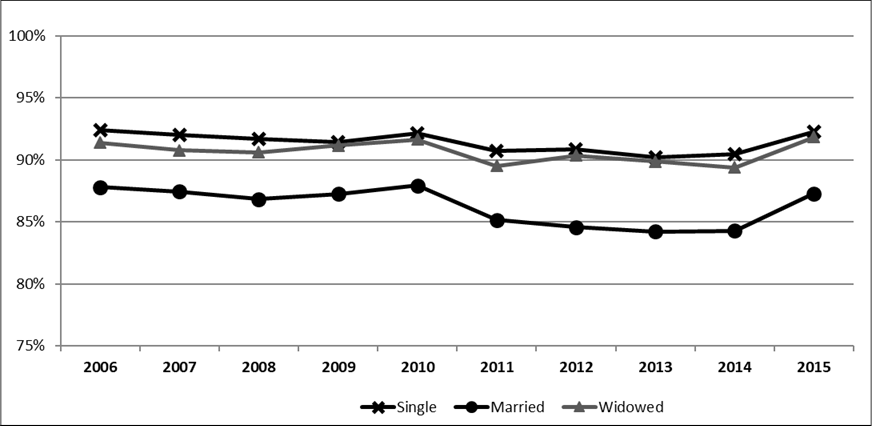
- Source: 10% sample of taxfilers in linked T1-OAS databases (5.1 million observations).
Figure 3 – Text version
| Year | Single | Widowed | Married |
|---|---|---|---|
| 2006 | 92.4% | 91.4% | 87.8% |
| 2007 | 92.0% | 90.8% | 87.4% |
| 2008 | 91.7% | 90.6% | 86.8% |
| 2009 | 91.4% | 91.2% | 87.2% |
| 2010 | 92.1% | 91.6% | 87.9% |
| 2011 | 90.7% | 89.5% | 85.2% |
| 2012 | 90.8% | 90.3% | 84.6% |
| 2013 | 90.2% | 89.9% | 84.2% |
| 2014 | 90.5% | 89.4% | 84.3% |
| 2015 | 92.3% | 91.8% | 87.3% |
Figure 4 – GIS take-up rate by region, 2006 to 2015 (taxfilers only)
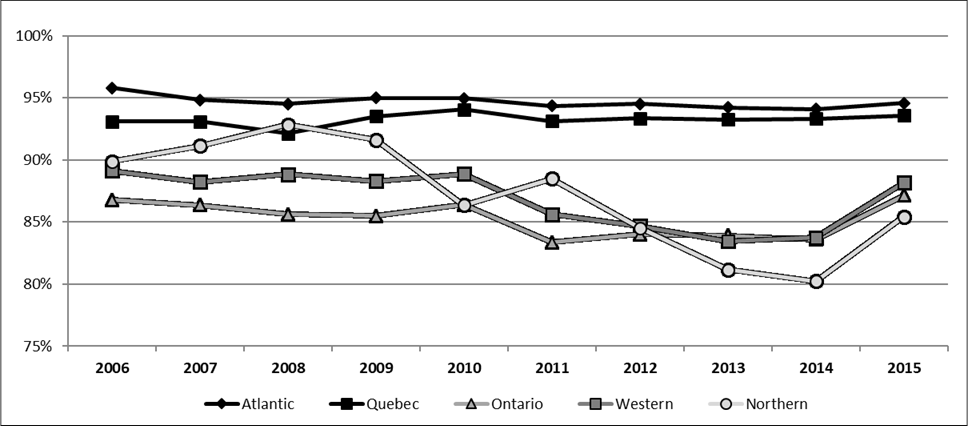
- Source: 10% sample of taxfilers in linked T1-OAS databases (5.1 million observations).
Figure 4 – Text version
| Year | Atlantic | Quebec | Ontario | Western | Northern |
|---|---|---|---|---|---|
| 2006 | 95.8% | 93.1% | 86.8% | 89.1% | 89.9% |
| 2007 | 94.8% | 93.1% | 86.4% | 88.2% | 91.1% |
| 2008 | 94.5% | 92.1% | 85.6% | 88.8% | 92.8% |
| 2009 | 95.0% | 93.5% | 85.5% | 88.3% | 91.6% |
| 2010 | 95.0% | 94.1% | 86.4% | 88.9% | 86.4% |
| 2011 | 94.4% | 93.1% | 83.4% | 85.6% | 88.5% |
| 2012 | 94.5% | 93.3% | 84.0% | 84.7% | 84.5% |
| 2013 | 94.2% | 93.3% | 83.9% | 83.5% | 81.2% |
| 2014 | 94.1% | 93.3% | 83.6% | 83.7% | 80.2% |
| 2015 | 94.6% | 93.6% | 87.1% | 88.2% | 85.4% |
Take-up has remained relatively steady in Quebec and the Atlantic provinces throughout the period, but has varied more in the Ontario, Western and Northern regions (Figure 4). Noticeably, take-up in the Northern region has declined by more than 10 percentage points between 2006 and 2014, to 80% in 2014, before reaching 85% in 2015. Also, the Ontario and Western regions saw a decrease in take-up between 2011 and 2014, before returning to their previous level in 2015.
Overall, urban individuals in Canada had slightly lower take-up than rural individuals (90% versus 91% in 2015). The difference in take-up between both groups remained quite steady throughout the 2006 to 2015 period, with differences of 1 to 2 percentage points (results not shown).
Family income and employment
Take-up decreases with higher family income, as the lowest income seniors have the highest take-up rates (Figure 5). It is interesting that more financially vulnerable seniors have higher take-up. This can be explained by the income-tested nature of GIS benefits, with those with lower incomes getting higher benefits. For individuals whose real family income (2015) used to assess eligibility for GIS is below $10,000, take-up was 96% in 2015. Take-up for individuals with income between $10,000 and $14,999 was slightly lower, at 94% in 2015. Take-up decreases significantly for individuals with incomes above $15,000. In 2015, it was 88% for individuals with family incomes between $15,000 and $19,999 and 72% for individuals with incomes above $20,000. Take-up rates by family income group have remained relatively steady throughout the period for the lowest income seniors with income below $15,000. However, take-up has increased to a new high in 2015 among other income groups, after a decline from 2011 to 2014.
Figure 5 – GIS take-up rate by real family income (2015 dollars) used to assess eligibility for GIS, 2006 to 2015 (taxfilers only)
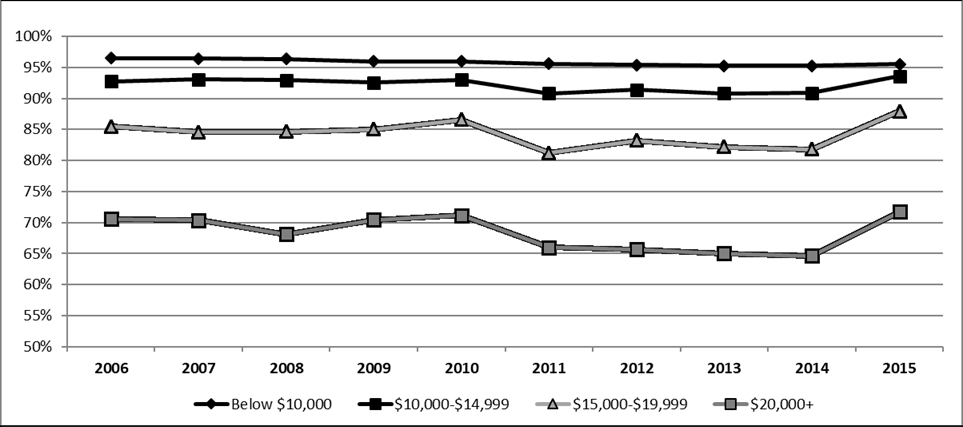
- Source: 10% sample of taxfilers in linked T1-OAS databases (5.1 million observations).
Figure 5 – Text version
| Year | Below $10,000 | $10,000 to $14,999 | $15,000 to $19,999 | $20,000 and over |
|---|---|---|---|---|
| 2006 | 96.5% | 92.7% | 85.5% | 70.6% |
| 2007 | 96.4% | 93.0% | 84.5% | 70.4% |
| 2008 | 96.3% | 92.9% | 84.6% | 68.1% |
| 2009 | 96.0% | 92.5% | 85.0% | 70.5% |
| 2010 | 95.9% | 93.0% | 86.6% | 71.1% |
| 2011 | 95.6% | 90.8% | 81.2% | 66.0% |
| 2012 | 95.4% | 91.4% | 83.2% | 65.7% |
| 2013 | 95.2% | 90.8% | 82.2% | 65.0% |
| 2014 | 95.2% | 90.8% | 81.8% | 64.6% |
| 2015 | 95.5% | 93.6% | 87.9% | 71.7% |
Similarly, take-up among employed seniors was significantly lower than among non-employed seniors (75% versus 91% in 2015).Footnote 25 For context, about 14% of all senior taxfilers were employed, while 86% were not in 2015. In addition, seniors who were not employed were more likely to be eligible for the GIS (43% of seniors who were not employed were eligible for GIS, while only 16% of seniors who were employed were eligible). Finally, the difference in take-up rates between both groups remained relatively steady throughout the period (results not shown).
Canada and Quebec Pension Plan benefits
Take-up was similar for seniors who received Canada and Quebec Pension Plan (C/QPP) benefits and for those who did not receive any of those benefits, except in 2015 (Figure 6). In 2015, take-up was 91% for those receiving C/QPP, while it was 87% among those who did not. The reason behind this change is unknown. For context, in 2015, 92% of tax filing seniors received C/QPP benefits.
Figure 6 – GIS take-up rate by Canada and Quebec Pension Plan receipt status, 2006 to 2015 (taxfilers only)
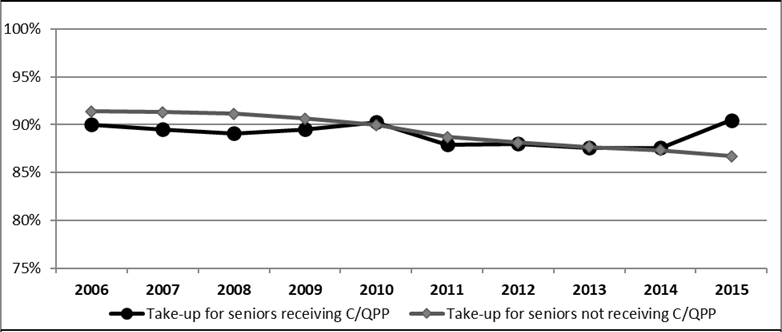
- Source: 10% sample of taxfilers in linked T1-OAS databases (5.1 million observations).
Figure 6 – Text version
| Year | Take-up for seniors receiving C/QPP | Take-up for seniors not receiving C/QPP |
|---|---|---|
| 2006 | 90.0% | 91.4% |
| 2007 | 89.5% | 91.3% |
| 2008 | 89.1% | 91.1% |
| 2009 | 89.5% | 90.6% |
| 2010 | 90.3% | 90.0% |
| 2011 | 87.9% | 88.7% |
| 2012 | 88.0% | 88.1% |
| 2013 | 87.6% | 87.7% |
| 2014 | 87.6% | 87.3% |
| 2015 | 90.5% | 86.7% |
Regression analysis
Mosts results presented above are also present when examining all socio-economic characteristics at the same time in a regression framework. This methodology allows to separate the correlation of each characteristic to GIS take-up, therefore allowing to disentangle the different socio-economic characterisitcs that influence take-up at the same time. Table 7 presents the results of the regression.
As in the results presented in the previous section, take-up is lower for men, younger age groups, seniors living in Ontario, Western and Nothern regions, seniors living in urban areas and seniors with higher income. However, regression results show GIS take-up is lower for single seniors, once all other characteristics are taken into account. This is not the case when marital status is examined on its own (take-up is then higher for single seniors).
For accessibility reasons, the table has been simplified. Consult the PDF version for the full table.
| Age group | Coefficient | Standard error |
|---|---|---|
| 65 to 69 | (reference) | (reference) |
| 70 to 74 | 0.036* | 0.0006 |
| 75 to 79 | 0.044* | 0.0006 |
| 80 to 84 | 0.043* | 0.0007 |
| 85 and over | 0.039* | 0.0007 |
- * indicates significant at the 1% level.
| Region | Coefficient | Standard error |
|---|---|---|
| Atlantic | (reference) | (reference) |
| Quebec | -0.010* | 0.0006 |
| Ontario | -0.079* | 0.0007 |
| Western | -0.065* | 0.0007 |
| Northern | -0.077* | 0.0059 |
- * indicates significant at the 1% level.
| Real family income (2015 dollars), used to assess GIS eligibility | Coefficient | Standard error |
|---|---|---|
| Less than $10,000 | (reference) | (reference) |
| $10,000 to 14,999 | -0.044* | 0.0005 |
| $15,000 to 19,999 | -0.130* | 0.0008 |
| $20,000 and up | -0.286* | 0.0009 |
- * indicates significant at the 1% level.
| Variable | Coefficient | Standard error |
|---|---|---|
| Women | 0.026* | 0.0005 |
| Single | -0.055* | 0.0005 |
| Urban | -0.011* | 0.0005 |
- * indicates significant at the 1% level.
- Source: 10% sample of taxfilers in linked T1-OAS databases who are eligible for the GIS (2.1 million observations).
Dependant variable is GIS receipt (among those eligible). Linear probability regression model uses robust standard errors and also includes dummy variables for the different years (2006 to 2015).
Summary
It was not possible to identify immigrants and indigenous people in the tax data used for this paper.Footnote 26 However, results indicate that GIS take-up has remained high for the different socio-economic groups of seniors. Take-up has remained slightly higher for women, older seniors, seniors in Quebec and the Atlantic region, seniors living in rural regions and seniors with lower incomes.
4.2 How have the types of potentially eligible non-recipients of the Guaranteed Income Supplement evolved since 2006
In section 4.1, it was estimated that there are about 240,000 seniors that were eligible for the GIS but did not receive it in 2015. In this section, these seniors will be described and decomposed into different groups.
Most GIS eligible non-recipients are taxfilers receiving the OAS pension. In 2015, they represented 77% of GIS eligible non-recipients (or about 186,000 seniors). Another 18% were taxfilers not receiving the OAS pension (or about 43,000 seniors) and finally 5% were non-taxfilers that are clientsFootnote 27 of the OAS program (or about 11,000 seniors). Figure 7 and Figure 8 show that these proportions were somewhat similar in 2006, with a higher proportion being taxfilers receiving the OAS pension.
Figure 7 – Distribution of the number of GIS eligible non-recipients in 2015 (%)
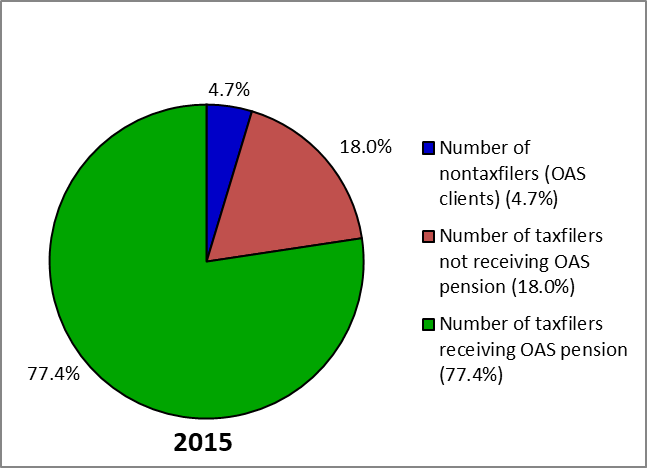
- Source: 10% sample of linked T1-OAS databases (5.2 million observations).
Figure 7 – Text version
| Year | Number of nontaxfilers (OAS clients) | Number of taxfilers not receiving OAS pension | Number of taxfilers receiving OAS pension |
|---|---|---|---|
| 2015 | 4.7% | 18.0% | 77.4% |
Figure 8 – Distribution of the number of GIS eligible non-recipients in 2006 (%)
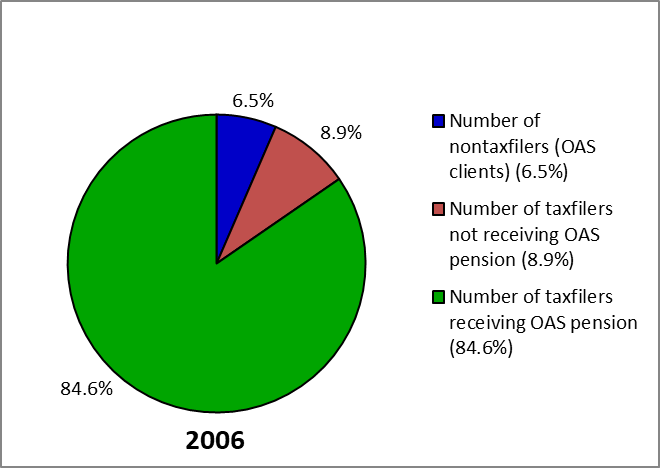
- Source: 10% sample of linked T1-OAS databases (5.2 million observations).
Figure 8 – Text version
| Year | Number of nontaxfilers (OAS clients) | Number of taxfilers not receiving OAS pension | Number of taxfilers receiving OAS pension |
|---|---|---|---|
| 2006 | 6.5% | 8.9% | 84.6% |
4.2.1 Guaranteed Income Supplement eligible non-recipient taxfilers
As there is no information available on the characteristics of non-taxfilers that are GIS eligible non-recipients, the rest of this section will discuss the characteristics of taxfilers, representing 95% or 229,000 of the GIS eligible non-recipients in 2015.
The majority of GIS eligible non-recipients still receive the OAS pension. The last column of Table 8 shows that the OAS pension take-up is above 81% among GIS eligible non-recipients in 2015, and above 87% in previous years.Footnote 28 This is somewhat lower than among all taxfilers or among all GIS eligible seniors which have OAS pension take-up rates of 97% and 98% respectively. Similar results were found by Imbeau (2016) using Statistics Canada’s National Household Survey. Overall, this also means there are about 43,000 GIS eligible individuals who receive neither the OAS pension nor the GIS.
| Year | OAS pension take-up among all taxfilers | OAS pension take-up among GIS eligible | GIS take-up among GIS eligible | GIS take-up among OAS pension recipients | OAS pension take-up among GIS eligible non-recipients |
|---|---|---|---|---|---|
| 2006 | 98.4 | 99.0 | 90.2 | 91.1 | 90.5 |
| 2007 | 98.3 | 99.0 | 89.8 | 90.6 | 90.9 |
| 2008 | 98.2 | 98.9 | 89.4 | 90.2 | 90.7 |
| 2009 | 98.1 | 98.8 | 89.6 | 90.6 | 89.4 |
| 2010 | 98.0 | 98.7 | 90.2 | 91.3 | 87.8 |
| 2011 | 97.8 | 98.6 | 88.0 | 89.2 | 88.9 |
| 2012 | 97.7 | 98.5 | 88.0 | 89.3 | 87.9 |
| 2013 | 97.5 | 98.4 | 87.6 | 88.9 | 87.7 |
| 2014 | 97.2 | 98.3 | 87.5 | 89.0 | 87.2 |
| 2015 | 96.7 | 98.0 | 90.0 | 91.8 | 81.2 |
- Source: 10% sample of taxfilers in linked T1-OAS databases (5.1 million observations).
Table 9 presents the distribution of characteristics of GIS eligible non-recipient taxfilers. This analysis helps show which socio-economic groups represent the highest shares of GIS eligible non-recipients. Gender and marital status are balanced among non-recipients, with just below half being women and just below half of non-recipients being single.
Over 44% of GIS eligible non-recipients are between the ages of 65 and 69, including over 30% aged between 65 and 67 in 2015.Footnote 29 As presented in the previous section, take-up is lower among younger seniors that are new to the OAS program. Naturally, for most seniors, one would expect take-up not to be an issue once seniors have received GIS once. This suggests that outreach efforts might have a higher impact when targeted at younger seniors.
Regionally, Ontario accounts for almost 45% of GIS eligible non-recipients and the Western provinces for another 30% (for a total of 75% of GIS eligible non-recipients in 2015, while these provinces represented 59% of GIS recipients). In contrast the rest of country accounts for only 25% of eligible non-recipients and 41% of GIS recipients. It was shown previously that take-up is significantly lower in Ontario, Western and Northern regions of Canada. This suggests that there may be institutional differences between different parts of the country relating to how outreach is done and perhaps on the implication of not-for-profit organizations and other levels of government in outreach. Further research on the causes of this regional variation would be helpful. In addition, over 80% of GIS eligible non-recipients live in urban areas of the country, where access to Service Canada offices is easier.
For accessibility reasons, the table has been simplified. Consult the PDF version for the full table.
| Gender | 2006 non-recipients | 2010 non-recipients | 2015 non-recipients | 2015 recipients |
|---|---|---|---|---|
| Women | 51.5 | 48.5 | 47.1 | 60.7 |
| Men | 48.5 | 51.5 | 52.9 | 39.3 |
| Marital status | 2006 non-recipients | 2010 non-recipients | 2015 non-recipients | 2015 recipients |
|---|---|---|---|---|
| Single | 48.8 | 47.8 | 45.7 | 58.5 |
| In couple | 51.2 | 52.2 | 54.3 | 41.5 |
| Age | 2006 non-recipients | 2010 non-recipients | 2015 non-recipients | 2015 recipients |
|---|---|---|---|---|
| 65 to 69 | 35.2 | 39.0 | 44.1 | 24.7 |
| 70 to 74 | 21.9 | 21.9 | 19.6 | 22.6 |
| 75 to 79 | 16.3 | 14.3 | 12.5 | 18.4 |
| 80 to 84 | 13.2 | 11.8 | 10.4 | 15.3 |
| 85 and over | 13.4 | 13.0 | 13.4 | 19.1 |
| Regions | 2006 non-recipients | 2010 non-recipients | 2015 non-recipients | 2015 recipients |
|---|---|---|---|---|
| Atlantic | 4.1 | 4.9 | 5.0 | 9.7 |
| Quebec | 21.4 | 18.8 | 19.5 | 31.4 |
| Ontario | 43.2 | 45.3 | 43.5 | 32.6 |
| Western | 31.2 | 30.8 | 31.7 | 26.1 |
| Northern | 0.1 | 0.2 | 0.2 | 0.1 |
| Real family income (2015 dollars), used to assess GIS eligibility | 2006 non-recipients | 2010 non-recipients | 2015 non-recipients | 2015 recipients |
|---|---|---|---|---|
| Less than $10,000 | 17.6 | 20.9 | 22.8 | 53.8 |
| $10,000 to 14,999 | 14.0 | 13.9 | 12.2 | 19.8 |
| $15,000 to 19,999 | 18.7 | 17.1 | 15.3 | 12.4 |
| $20,000 and up | 49.6 | 48.2 | 49.8 | 14.1 |
| Getting OAS pension | 2006 non-recipients | 2010 non-recipients | 2015 non-recipients | 2015 recipients |
|---|---|---|---|---|
| Yes | 90.5 | 87.8 | 81.2 | 100.0 |
| No | 9.5 | 12.2 | 18.8 | 0.0 |
| Group | 2006 non-recipients | 2010 non-recipients | 2015 non-recipients | 2015 recipients |
|---|---|---|---|---|
| Urban | 80.5 | 80.5 | 81.4 | 78.1 |
| Rural | 19.5 | 19.5 | 18.6 | 21.9 |
| All GIS-eligible taxfilers | 100.0 | 100.0 | 100.0 | 100.0 |
- Source: 10% sample of taxfilers in linked T1-OAS databases (5.1 million observations).
Finally, seniors with family incomes above $20,000 accounted for almost half of GIS eligible non-recipients in 2015. Family income is defined in this paper as the income used to determine eligibility for the GIS and does not include OAS pension or GIS benefits. Given the income-tested nature of GIS benefits, these seniors are also the ones entitled to the lowest amounts of benefits. It was shown previously that this group has a significantly lower take-up than other income groups and that this group represented 14% of GIS recipients in 2015.
Most of the characteristics of GIS eligible non-recipients have not changed over time, from 2006 to 2015. However, this group is getting slightly younger on average.Footnote 30
5. Conclusions
This paper used linked administrative data from CRA and the OAS program to examine GIS take-up among different groups of seniors. It uses data from 2006 to 2015, the most recent data available from the Canada Revenue Agency. The study is 1 of 9 lines of evidence being produced for the evaluation of the GIS take-up. In particular, this study provides findings that will help answer the evaluation questions noted below.
How has GIS take-up changed since 2006 and, in particular, how has it changed for vulnerable populations (for example, immigrants, Indigenous people, those living in remote communities, etc.)
The overall GIS take-up rate was 89.8% in 2015. This is the same as in 2006; take-up has varied only slightly during this period. The overall estimated number of GIS eligible non-recipients has increased from 203,000 in 2006 to 240,000 in 2015, following the increase in the number of seniors in Canada. Using a confidence interval, it is estimated there were between 232,000 and 251,000 GIS eligible non-recipients in 2015.
It was not possible to identify immigrants, indigenous people and those living in remote communities in the tax data used for this paper. However, results indicate that GIS take-up has remained high for the different socio-economic groups of seniors. Take-up has remained slightly higher for women, older seniors, seniors in Quebec and the Atlantic region, seniors living in rural regions and seniors with lower incomes.
How have the types of potentially eligible non-recipients of the GIS evolved since 2006
Most GIS eligible non-recipients are taxfilers receiving the OAS pension. In 2015, they represented 77% of GIS eligible non-recipients (or about 186,000 seniors). Another 18% were taxfilers not receiving the OAS pension (or about 43,000 seniors) and finally 5% were non-taxfilers that are clients of the OAS program (or about 11,000 seniors). Taxfilers represent 95% or 229,000 of the GIS eligible non-recipients in 2015. These proportions were somewhat similar in 2006.
Even though they do not receive the GIS, the majority of GIS eligible non-recipients still receive the OAS pension, with an OAS pension take-up rate above 81% among GIS eligible non-recipient taxfilers in 2015, and above 87% in previous years.
Among groups of GIS eligible non-recipient taxfilers in 2015, half are women and about half of non-recipients are single. Almost 45% of non-recipients are between the ages of 65 and 69, including over 30% aged between 65 and 67. Regionally, Ontario accounts for almost 45% of non-recipients and the Western provinces for another 30% (for a total of 75% of GIS eligible non-recipient taxfilers in 2015 even if these provinces represented 59% of GIS recipients). Finally, seniors with family incomes above $20,000 accounted for almost half of GIS eligible non-recipients in 2015, even though they accounted for only 14% of GIS recipients.
6. Bibliography
Canada Revenue Agency (2015), “Final Statistics 2015 edition (for the 2013 tax year)”, http://www.cra-arc.gc.ca/gncy/stts/t1fnl/2013/menu-eng.html#h4-1
ESDC (2017), “Employment and Social Development Canada 2016–2017 Departmental Results Report”
ESDC (2016), “Employment and Social Development Canada 2015–2016 Departmental Performance Report”
ESDC (2015), “The CPP & OAS Stats Book 2016”
ESDC (2012), “Summative Evaluation of the Old Age Security Program”, http://publications.gc.ca/pub?id=9.696235&sl=1
ESDC (2010), “Evaluation of the Guaranteed Income Supplement Take-up Measures and Outreach”, https://www.canada.ca/en/employment-social-development/corporate/reports/evaluations/income-2010-february.html
Hapuarachchi, M. (2008), “GIS Eligible Non-Recipients Statistics: 2006”, OAS-CPP Information. Analysis and Liaison – Research & Analysis
Imbeau, E. (2017), “Seniors’ Labour Force Participation, Income and the GIS Top-up”, technical report prepared for the evaluation of the Old Age Security program, ESDC
Imbeau, E. (2016), “Participation in the Old Age Security Program – National Household Survey”, technical report prepared for the evaluation of the Old Age Security program, ESDC
Luong, M. (2009), “GIS update”, Perspectives on Labour and Income, vol. 10, no 7, July, Statistics Canada Catalogue no 75-001-XIE, p. 5-13, http://www.statcan.gc.ca/pub/75-001-x/2009107/pdf/10906-eng.pdf
Office of the Chief Actuary (2014), “Actuarial Report (12th) on the OAS Program”, http://www.osfi-bsif.gc.ca/Eng/Docs/OAS12.pdf
Poon, P. (2005), “Who’s missing out on the GIS?”, Perspectives on Labour and Income, vol. 6, no 10, October, Statistics Canada Catalogue no. 75-001-XIE, p. 5-14, http://www.statcan.gc.ca/pub/75-001-x/11005/8704-eng.pdf
Service Canada (2015), “Information Sheet: Statement of Income for the GIS, the Allowance and the Allowance for the Survivor”, SC ISP-3026A (2015-01-27) E
Annex
| Item | Taxfilers’ GIS take-up | Overall GIS take-up (among taxfilers and non-taxfilers) | Overall GIS take-up (among taxfilers and non-taxfilers) | Overall GIS take-up (among taxfilers and non-taxfilers) |
|---|---|---|---|---|
| GIS Take-up assumed for non-taxfilers | n/a | 60% | 75% | 90% |
| 2006 | 90.2% | 89.2% | 89.8% | 90.2% |
| 2007 | 89.8% | 88.9% | 89.4% | 89.8% |
| 2008 | 89.4% | 88.6% | 89.1% | 89.4% |
| 2009 | 89.6% | 89.0% | 89.4% | 89.7% |
| 2010 | 90.2% | 89.6% | 90.0% | 90.2% |
| 2011 | 88.0% | 87.4% | 87.8% | 88.0% |
| 2012 | 88.0% | 87.5% | 87.8% | 88.0% |
| 2013 | 87.6% | 87.1% | 87.4% | 87.6% |
| 2014 | 87.5% | 87.0% | 87.4% | 87.6% |
| 2015 | 90.0% | 89.3% | 89.8% | 90.0% |
- Source: 10% sample of linked T1-OAS databases (5.2 million observations).