
Archived: Departmental Performance Report 2015 to 2016, Environment and Climate Change Canada, chapter 4
Section II: Expenditure Overview
Actual Expenditures
| 2015-16 Main Estimates |
2015-16 Planned Spending** |
2015-16 Total Authorities Available for Use |
2015-16 Actual Spending (authorities used) |
Difference (actual minus planned) |
|---|---|---|---|---|
| 961,051,076 | 961,051,076 | 1,034,709,806 | 950,927,395 | -10,123,681 |
*Totals may differ within and between tables due to the rounding of figures. All financial resources figures, throughout the document, are net of respendable revenues.
**Planned Spending comes from the 2015-16 RPP.
The Department’s planned spending reflects approved funding by Treasury Board to support departmental Programs. Throughout the year, new and renewed funding added $73.7 million to planned spending, increasing the total authorities to $1,034.7 million. The increase was mainly attributed to new funding received for the Federal Infrastructure Initiative, the renewal of the Species at Risk Act program, and funding provided via the Treasury Board central votes (e.g., operating and capital budget carry-forwards).
The actual spending of $950.9 million (91.9% of total authorities) reflects the departmental expenditures as reported in the Public Accounts, and is lower than planned spending mostly due to a reduction in funding required for the Contaminated Sediment Remediation Projects, the Monitoring and Supercomputing Infrastructure, and the Revitalization of Canada's Weather Services, for which the unused funding will be available for spending in future years. These reductions are offset by expenditures related to funding received for the renewal of the Species at Risk Act program and the Federal Infrastructure Initiative.
| 2015-16 Planned** |
2015-16 Actual |
2015-16 Difference (actual minus planned) |
|---|---|---|
| 6,167 | 6,322 | 155 |
*Totals may differ within and between tables due to the rounding of figures. The FTE numbers, throughout the document, include students.
**Planned FTE comes from the 2015-16 RPP.
One FTE equals one person working a 37.5-hour work week full-time for the entire year, or any number of part-time employees whose combined hours of work equal one FTE. An average salary was used to calculate 2015-16 planned FTEs based on planned salary spending for the 2015-16 fiscal year. The actual FTEs were determined using the departmental financial system. Environment and Climate Change Canada used 6,322 FTEs versus planned FTEs of 6,167 in 2015-16, resulting in an increase of 155 FTEs (2.5%). Planned and actual FTEs should be read in relation to planned and actual spending, respectively, in the 2015-16 Financial Resources table above.
Budgetary Performance Summary
| Programs and Internal Services | 2015-16 Main Estimates |
2015-16 Planned Spending | 2016-17 Planned Spending | 2017-18 Planned Spending | 2015-16 Total Authorities Available for Use | 2015-16 Actual Spending (authorities used) |
2014-15 Actual Spending (authorities used) | 2013-14 Actual Spending (authorities used) |
|---|---|---|---|---|---|---|---|---|
| Program 1.1 Biodiversity - Wildlife and Habitat | 122,779,285 | 122,779,285 | 137,912,691 | 133,903,800 | 150,950,291 | 150,399,093 | 140,408,483 | 120,519,001 |
| Program 1.2 Water Resources | 95,770,859 | 95,770,859 | 80,035,023 | 82,145,076 | 95,168,261 | 81,784,289 | 92,453,058 | 100,322,337 |
| Program 1.3 Sustainable Ecosystems | 91,480,613 | 91,480,613 | 88,026,739 | 82,431,062 | 99,908,100 | 78,790,925 | 72,619,888 | 70,727,194 |
| Program 1.4 Compliance Promotion and Enforcement - Wildlife | 16,115,510 | 16,115,510 | 16,652,429 | 16,367,544 | 19,985,276 | 19,971,764 | 17,058,497 | 18,208,956 |
| Program 2.1 Weather and Environmental Services for Canadians | 192,103,008 | 192,103,008 | 174,382,678 | 169,118,896 | 205,045,977 | 181,347,768 | 174,493,294 | 182,818,981 |
| Program 2.2 Weather and Environmental Services for Targeted Users | 15,792,293 | 15,792,293 | 19,267,384 | 18,998,851 | 18,757,335 | 15,321,848 | 25,886,657 | 26,618,144 |
| Program 3.1 Substances and Waste Management | 85,149,099 | 85,149,099 | 74,912,985 | 68,461,079 | 85,506,174 | 83,529,612 | 86,779,805 | 84,616,666 |
| Program 3.2 Climate Change and Clean Air | 122,872,074 | 122,872,074 | 97,030,449 | 87,789,682 | 128,325,216 | 119,607,526 | 121,061,134 | 125,118,027 |
| Program 3.3 Compliance Promotion and Enforcement - Pollution | 37,560,222 | 37,560,222 | 34,672,528 | 34,487,231 | 40,718,054 | 40,634,373 | 42,309,866 | 44,661,876 |
| Internal Services | 181,428,113 | 181,428,113 | 179,196,292 | 178,252,358 | 190,345,122 | 179,540,197 | 203,115,955 | 205,338,366 |
| Total | 961,051,076 | 961,051,076 | 902,089,198* | 871,955,579 | 1,034,709,806 | 950,927,395 | 976,186,637 | 978,949,548 |
* Planned figures in the Departmental Performance Report reflect those which had been published in the 2016-17 Report on Plans and Priorities (RPP). The 2016-17 RPP was tabled in Parliament prior to Budget 2016 and therefore, does not reflect new funding announced in the Budget. The department’s 2016-17 and future year planned spending will increase as program renewals and Budget 2016 items are included in future upcoming Estimates processes.
Program 1.1: Biodiversity - Wildlife and Habitat
The actual spending for 2015-16 is higher than planned spending. This is mainly attributed to funding received for the renewal of the Species at Risk Act program and an allocation of additional resources to the Canadian Wildlife Services. The actual spending increase in 2015-16 compared to 2014-15 is mainly due to grants and contributions for the National Conservation Plan offset by a statutory payment to Nature Conservancy Canada issued in 2014-15 and lower contribution payments in support of Biodiversity - Wildlife and Habitat. The 2016-17 planned spending is higher than 2015-16 mainly due to the renewal of the Species at Risk Act program and the Federal Infrastructure Initiative.
Program 1.2: Water Resources
Both the 2015-16 actual spending and the 2016-17 planned spending are lower than 2015-16 planned spending. This is mainly attributed to a realignment of activities between programs. Actual spending also decreased in 2015-16 compared to 2014-15 due to a reduction in payments in lieu of severance, and a one-time transition payment made in 2014-15 as a result of the government’s transition to pay in arrears.
Program 1.3: Sustainable Ecosystems
The actual spending for 2015-16 is lower than planned spending. This is mainly attributed to the reduction in funding requirement for the Contaminated Sediment Remediation projects for which the unused funding will be available for spending in future years.
Program 2.1: Weather and Environmental Services for Canadians
Both the 2015-16 actual spending and the 2016-17 planned spending are lower than 2015-16 planned spending. This is mainly attributed to a reduction in funding for the Clean Air Regulatory Agenda and for the Monitoring and Supercomputing Infrastructure Initiative, offset by new funding received for the Revitalization of Canada's Weather Services, and for the Federal Infrastructure Initiative. The actual spending increase in 2015-16 compared to 2014-15 is mainly due to the Federal Infrastructure Initiative and the Revitalization of Canada's Weather Services, offset by a reduction for the one-time transition payment made in 2014-15 as a result of the government’s transition to pay in arrears.
Program 2.2: Weather and Environmental Services for Targeted Users
The actual spending decrease in 2015-16 compared to 2014-15 is mainly due to a reduction in payments in lieu of severance and a one-time transition payment made in 2014-15 as a result of the government’s transition to pay in arrears. The decrease is also due to a reduction in departmental operational expenditures and Employee Benefit Plans related to salaries.
Program 3.1: Substances and Waste Management
The decrease from 2016-17 to 2017-18 in planned spending is primarily due to the decrease in funding for the World Class Oil Spills Regime. The 2016-17 planned spending is lower than 2015-16, mainly due to the sunsetting of the Federal Contaminated Sites Action Plan funding.
Program 3.2: Climate Change and Clean Air
The decrease from 2016-17 to 2017-18 in planned spending is primarily due to a planned variation in year to year funding for Sustainable Development Technology CanadaFootnote 3 for the Sustainable Development Technology Fund, as well as to the completion of the Single Window Initiative. The 2016-17 planned spending is lower than in 2015-16 mainly due to the sunsetting of the Clean Air Regulatory Agenda.
Internal Services
The decrease in actual spending for 2015-16 compared to 2014-15 is primarily due to a one-time transition payment made in 2014-15 as a result of the government’s transition to pay in arrears and a reduction in funding due to sunsetting of temporary initiatives, and a realignment to activities linked to Internal Services.
See the previous Departmental Performance Report (DPR) for additional details on year-over-year variances between 2014-15 and 2013-14 expenditures.
ECCC will seek ongoing funding for priority initiatives, including for those which currently have time-limited funding. Funding requests for such initiatives are subject to government decisions, and the outcomes will be reflected in future budget exercises and Estimates documents.
Departmental Spending Trend
The following chart depicts the departmental spending trend over a six-year period. For the period 2013-14 to 2015-16, actual spending represents the actual expenditures as reported in the Public Accounts. For the period 2016-17 to 2018-19, the planned spending represents the planned expenditures as reported in the 2016-17 Report on Plans and Priorities, and reflects approved funding by Treasury Board to support the departmental Strategic Outcomes and Programs.

* Planned figures in the Departmental Performance Report reflect those which had been published in the 2016-17 Report on Plans and Priorities (RPP). The 2016-17 RPP was tabled in Parliament prior to Budget 2016 and therefore, does not reflect new funding announced in the Budget. The department’s 2016-17 and future year planned spending will increase as program renewals and Budget 2016 items are included in future upcoming Estimates processes.
Text description of figure
| 2013-14 | 2014-15 | 2015-16 | 2016-17 | 2017-18 | 2018-19 | |
|---|---|---|---|---|---|---|
| Sunset Programs - Anticipated | $0 | $0 | $0 | $110,800,511 | $122,481,454 | $135,114,497 |
| Statutory | $105,709,346 | $100,888,122 | $86,635,859 | $81,932,846 | $80,846,602 | $79,230,381 |
| Voted | $873,240,202 | $875,298,515 | $864,291,536 | $820,156,352 | $791,108,975 | $736,653,620 |
| Total | $978,949,548 | $976,186,637 | $950,927,395 | $1,012,889,709 | $994,437,031 | $950,998,498 |
As indicated in the chart above, Environment and Climate Change Canada’s actual spending for 2015-16 was $950.9 million, a year-over-year decrease of $25.3 million (2.6%) from the 2014-15 actual spending. This decrease is mainly due to a one-time transition payment made in 2014-15 as a result of the government’s transition to pay in arrears, and the payment for the immediate settlement of severance pay.
The decrease of $48.8 million (5.1%) between actual spending for 2015-16 and planned spending for 2016-17 is mainly due to the sunsetting of several core initiatives such as the Clean Air Regulatory Agenda and the Federal Contaminated Sites Action Plan. These decreases are offset by a planned increase in the annual contribution to Sustainable Development Technology Canada.
The decrease in planned spending from 2016-17 to 2018-19 is $86.2 million (9.6%) and is mainly due to the sunsetting of temporary initiatives such as the Species at Risk Act program, Lake Simcoe and Lake Winnipeg Basin, as well as a funding profile decrease for Sustainable Development Technology Canada, the Meteorological Service of Canada and for the Contaminated Sediment Remediation Projects.
The Department will seek renewals of funding to return anticipated spending to existing or increased levels. Funding requests are subject to government decisions; such decisions will be reflected in the Department’s future Estimates documents.
Responsibility for Sustainable Development Technology Canada has now been transferred to the Department of Innovation, Science and Economic Development Canada.
Expenditures by Vote
For information on Environment and Climate Change Canada’s organizational votes and statutory expenditures, please consult the Public Accounts of Canada 2016.
Alignment of Spending with the Whole-of-Government Framework
| Programs | Spending Area | Government of Canada Outcome | 2015-16 Actual Spending |
|---|---|---|---|
| 1.1 Biodiversity - Wildlife and Habitat | Economic Affairs | A clean and healthy environment | 150,399,093 |
| 1.2 Water Resources | Economic Affairs | A clean and healthy environment | 81,784,289 |
| 1.3 Sustainable Ecosystems | Economic Affairs | A clean and healthy environment | 78,790,925 |
| 1.4 Compliance Promotion and Enforcement - Wildlife | Economic Affairs | A clean and healthy environment | 19,971,764 |
| 2.1 Weather and Environmental Services for Canadians | Economic Affairs | A clean and healthy environment | 181,347,768 |
| 2.2 Weather and Environmental Services for Targeted Users | Economic Affairs | A clean and healthy environment | 15,321,848 |
| 3.1 Substances and Waste Management | Economic Affairs | A clean and healthy environment | 83,529,612 |
| 3.2 Climate Change and Clean Air | Economic Affairs | A clean and healthy environment | 119,607,526 |
| 3.3 Compliance Promotion and Enforcement - Pollution | Economic Affairs | A clean and healthy environment | 40,634,373 |
| Spending Area | Total Planned Spending | Total Actual Spending |
|---|---|---|
| Economic Affairs | 779,622,963 | 771,387,198 |
| Social Affairs | 0 | N/A |
| International Affairs | 0 | N/A |
| Government Affairs | 0 | N/A |
* The total planned and actual spending figures in this table are net of the internal services planned spending ($181,428,113) and actual spending ($179,540,197), as they appeared in the Budgetary Performance Summary for Programs section
Financial Statements and Financial Statements Highlights
Financial Statements
The financial highlights offer an overview of Environment and Climate Change Canada’s Statement of Operations and Departmental Net and Statement of Financial Position.
The Unaudited Financial Statements are prepared in accordance with Treasury Board Secretariat policies that are based on Canadian public sector accounting standards and, therefore, are different from appropriation-based reporting, which is reflected in the Actual Expenditure of Sections II and Section III of this report. Those sections are prepared on a modified cash basis, and not an accrual basis. Reconciliation between Parliamentary Appropriations used (modified cash basis) and the Net Cost of Operations (accrual basis) is set out in Note 2 and 3 of the Unaudited Financial Statements on the Department’s website.
Financial Statements Highlights
| Financial Information | 2015-16 Planned Results | 2015-16 Actual | 2014-15 Actual |
Difference (2015-16 actual minus 2015-16 planned) |
Difference (2015-16 actual minus 2014-15 actual) |
|---|---|---|---|---|---|
| Total expenses | 1,133,164,162 | 1,132,391,254 | 1,154,524,465 | -772,908 | -22,133,211 |
| Total revenues | 88,595,684 | 84,807,419 | 90,287,423 | -3,788,265 | -5,480,004 |
| Net cost of operations before government funding and transfers | 1,044,568,478 | 1,047,583,835 | 1,064,237,042 | 3,015,357 | -16,653,207 |
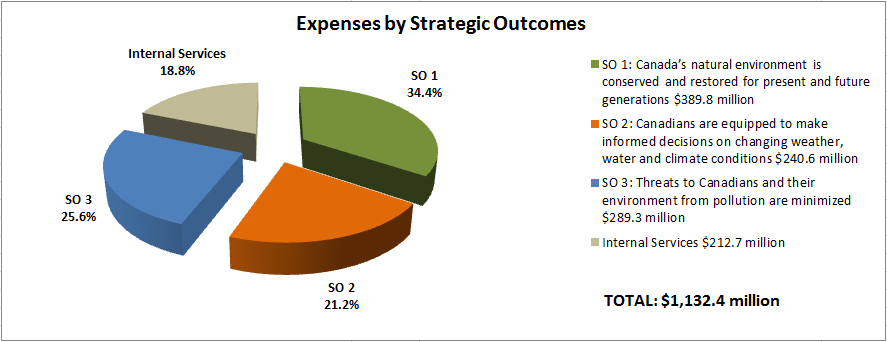
Expenses by Strategic Outcomes
Total departmental expenses by Strategic Outcomes amounted to $1,132.4 million for 2015-16 ($1,154.5 million for 2014-15). The decrease of $22.1 million (2%) is mostly due to lower salary expenditure ($28 million) due to the one-time transition payment made in 2014-15 as a result of the government’s transition to pay in arrears, to amortization ($10.1 million) due to a retirement of a large portion of assets following the asset count occurred in 2014-15 and to loss and adjustments to tangible capital assets ($13.7 million) since a major various cleanup efforts occurred in 2014-15 thus increasing the expenditures during that fiscal year, offset by an increase of $15.6 million in transfer payments mainly for Sustainable Development Technology Canada, and to the National Conservation Plan, an increase of the environmental liabilities expenditure $7.1 million due to the estimate of the liability of unassessed sites based on historical costs incurred for contaminated sites with similar functions that was recorded in 2015-16.
See Note 17 of the Departmental Financial Statements for further breakdown of expenditures - Segmented information by Standard Objects and Strategic Outcomes.
Text description of figure
| Strategic Outcome | Percentage | Expenses |
|---|---|---|
| SO 1: Canada’s Natural environment is conserved and restored for present and future generations | 34.4% | $389.8 million |
| SO 2: Canadians are equipped to make informed decisions on changing weather, water and climate conditions | 21.2% | $240.6 million |
| SO 3: Threats to Canadians and their environment from pollution are minimized | 25.6% | $289.3 million |
| Internal Services | 18.8% | $212.7 million |
| Total | 100.0% | $1,132.4 million |
Revenues by Type
Total revenues amounted to $84.8 million for 2015-16 ($90.3 million for 2014-15). This amount excludes $10.7 million earned on behalf of Government. The majority of the revenue in 2015-16 is derived from Environment and Climate Change Canada’s sales of goods and information products and services of a non-regulatory nature. Major revenue items include for example: oil sands monitoring activities, ocean disposal permit applications, Hydrometric Services, ocean disposal monitoring fees and Weather and Environmental Services.
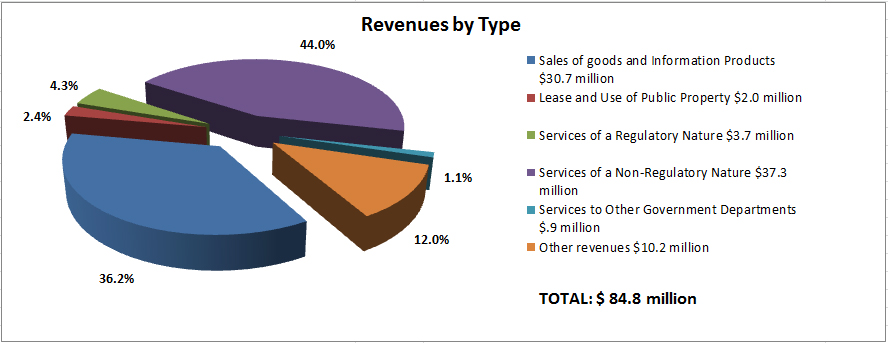
Text description of figure
| Revenue | Percentage | Amount |
|---|---|---|
| Sales of goods and information products | 36.2% | $30.7 million |
| Lease and use of public property | 2.4% | $2.0 million |
| Services of a regulatory nature | 4.3% | $3.7 million |
| Services of a non-regulatory nature | 44.0% | $37.3 million |
| Services to other government departments | 1.1% | $0.9 million |
| Other revenues | 12.0% | $10.2 million |
| Total | 100% | $84.8 million |
| Financial Information | 2015-16 | 2014-15 | Difference (2015-16 minus 2014-15) |
|---|---|---|---|
| Total net liabilities | 366,506,525 | 348,371,623 | 18,134,902 |
| Total net financial assets | 148,456,701 | 147,106,520 | 1,350,181 |
| Departmental net debt | 218,049,824 | 201,265,103 | 16,784,721 |
| Total non-financial assets | 392,107,606 | 372,283,687 | 19,823,919 |
| Departmental net financial position | 174,057,782 | 171,018,584 | 3,039,198 |
Liabilities by Type
Total liabilities were $366.5 million at the end of 2015-16. This represents an increase of $18.1 million (5.2%) from the previous year’s total liabilities of $348.4 million. The accounts payable and accrued liabilities and environmental liabilities represent the largest component of liabilities at $281.7 million (76.9% of total liabilities) in 2015-16.
The increase in Environment and Climate Change Canada’s total net liabilities valuation is mainly attributable to the Environmental Liabilities. In 2016, a statistical model was developed to estimate the liability for unassessed sites based on historical costs incurred for contaminated sites with similar functions. As a result, there are 43 unassessed sites where a liability estimate of $15.4 million has been recorded prospectively in 2016.
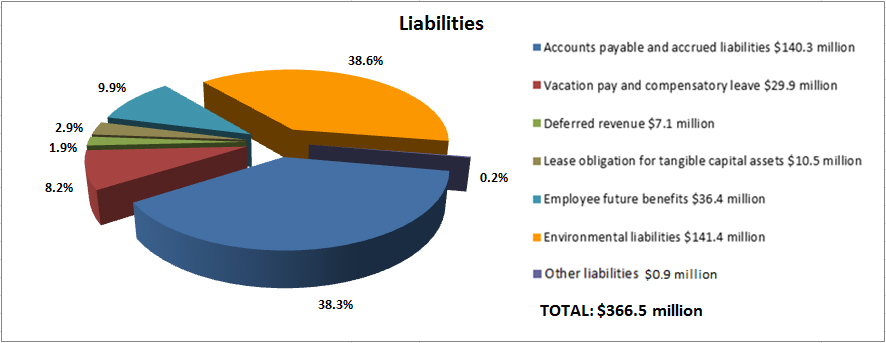
See Notes 4 to 8 and Notes 12 and 13 of the Departmental Financial Statements for more details - Accounts payable and accrued liabilities; Deferred revenue; Lease obligation for tangible capital assets; Employee future benefits; Environmental liabilities; Contractual obligations; Contingent liabilities.
Text description of figure
| Liability | Percentage | Amount |
|---|---|---|
| Accounts payable and accrued liabilities | 38.3% | $140.3 million |
| Vacation pay and compensatory leave | 8.2% | $29.9 million |
| Deferred revenue | 1.9% | $7.1 million |
| Lease obligation for tangible capital assets | 2.9% | $10.5 million |
| Employee future benefits | 9.9% | $36.4 million |
| Environmental liabilities | 38.6% | $141.1 million |
| Other liabilities | 0.2% | $0.9 million |
| Total | 100.0% | $366.5 million |
Assets by Type
Total net financial assets ($148.5 million) and non-financial assets ($392.1 million), together valued at $540.6 million, have increased by $21.2 million (4.1%) in 2015-16. The tangible capital assets continue to represent the largest component of assets at $375.7 million (69.5% of total assets) in 2015-16.
The increase in Environment and Climate Change Canada’s total net assets valuation is mainly attributable to the tangible capital assets that have increased by $13.8 million due to acquisition made during the year for a total of $58.3 million mainly under assets under construction ($40 million) offsets by amortization ($43.3 million).
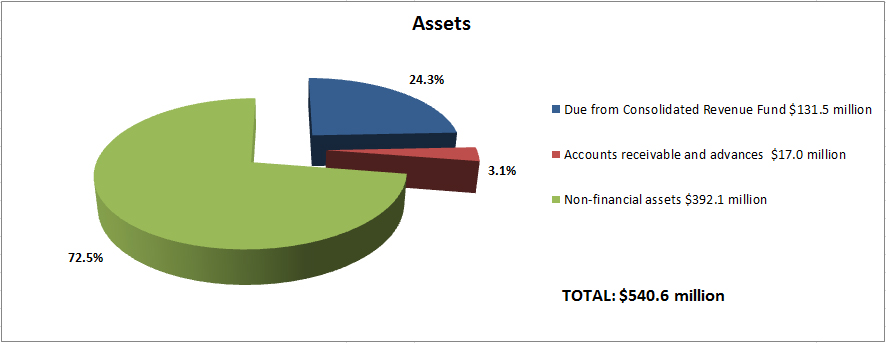
See Notes 9 to 11 of the Departmental Financial Statements for more details - Accounts receivable and advances; Inventory; Tangible Capital Assets.
Text description of figure
| Asset | Percentage | Amount |
|---|---|---|
| Due from Consolidated Revenue Fund | 24.3% | $131.5 million |
| Accounts receivable and advances | 3.1% | $17.0 million |
| Non-financial assets | 72.5% | $392.1 million |
| Total | 100.0% | $540.6 million |