
Ontario: Environment profile
Note
This information was current as of November 2015.

Ontario (ON) in brief
- Premier:
- Hon. Kathleen Wynne (Liberal Party)
- Population:
- 13,678,700 (2014)
- Total Area:
-
1,076,395 km
2
- Land:
- 917,741 km 2
- Freshwater:
- 158,654 km 2
- Real GDP (gross domestic product) 2013:
- $632.4 billion (in 2007 dollars)
- Contribution to real Canadian GDP 2013:
- 37.1%
ON budget 2015-16
- Budgeted total expenditures:
- $132.9 billion
- Funds allocated to Minister of Environment (MoE):
-
$503.3 million
- 0.4% of total budget
- 3.6% decrease from 2014-15
Key environmental federal-provincial agreements
- Canada-ON Agreement respecting the Great Lakes Basin Ecosystem
- Canada-ON Environmental Occurrences Notification Agreement
- Agreement Concerning the Implementation of the North American Waterfowl Management Plan and other Bird Conservation through the Eastern Habitat Joint Venture (EHJV)
- Agreement to Coordinate the Implementation of the EHJV in Ontario
- Great Lakes Water Quality Agreement
- Agreement on Great Lakes Water Quality and Ecosystem Health
- Agreement for Water Quantity Surveys (Hydrometric Bilateral Agreement)
Climate change
- Department responsible for climate change:
- Ministry of Environment and Climate Change
- Minister responsible for climate change:
- Hon. Glen Murray
- Legislation and regulations:
- Ontario Energy Consumer Protection Act, Environmental Protection Amendment Act (Greenhouse Gas Emissions Trading - Bill 185), Green Energy and Green Economy Act, Energy Conservation Responsibility Act, Greener Diesel Regulation, Ethanol in Gasoline Regulation, Greenhouse Gas Emissions Reporting Regulation, Cessation of Coal Use – Atikokan, Lambton, Nanticoke and Thunder Bay Generating Stations Regulation, Renewable Energy Approvals Regulation
Ontario GHG (greenhouse gas) emissions and 2020 target
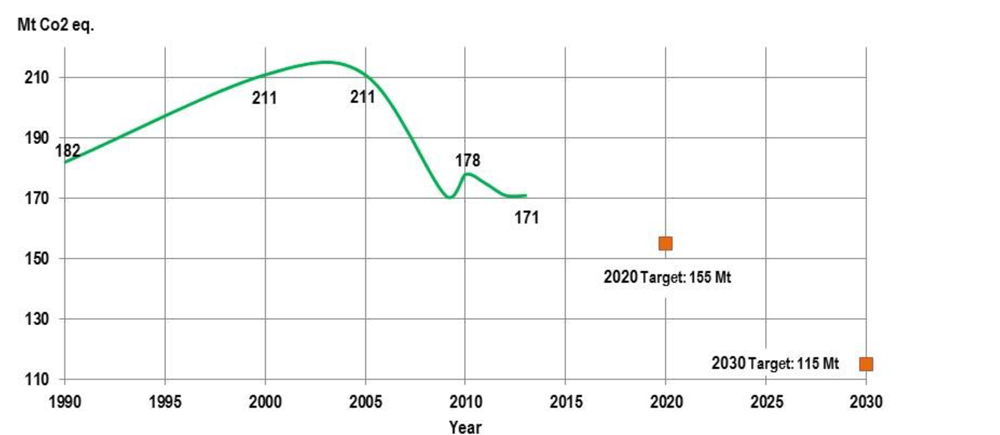
Sources:
- National Inventory Report (2015)
- 2020 target: Ontario’s Climate Action Plan (2007)
- 2030 Target: announced May 2015
Long description
Figure 1 presents a single time series line graph with the horizontal axis spanning the years 1990 to 2030 in five year increments. The vertical axis is Mt CO2 eq and spans the value of 110 to 210 in increments of 20. The starting value in 1990 is 182 Mt, increasing to 211 Mt in 2000, rising and falling to 211 Mt again in 2005. It decreases in 2010 to 178 Mt and 171 Mt in 2013. The provincial 2020 of 155 Mt is noted, with the 2030 target of 115 Mt.
Provincial GHG emissions reduction targets
- 6% below 1990 by 2014
- 15% below 1990 levels by 2020
- 37% below 1990 by 2030
- 80% below 1990 levels by 2050
- 2020 Target Equivalent to a 2005 baseline: 26.7% below
- 2030 Target Equivalent to a 2005 baseline: 45.7% below
ON’s sources of GHG emissions, 2013
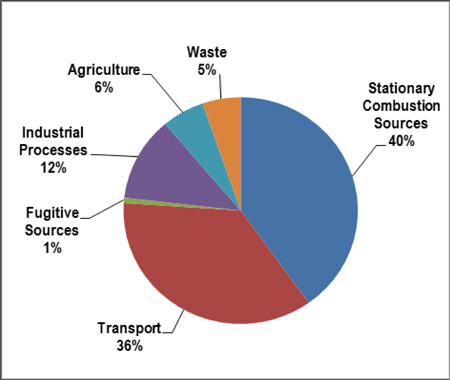
Source: National Inventory Report, 2015
Long description
Figure 2 presents a pie chart of the distribution of major greenhouse gas sources in Ontario.
- Stationary combustion sources: 40%
- Transport: 36%
- Fugitive sources: 1%
- Industrial processes: 12%
- Agriculture: 6%
- Waste 5%
- Climate change strategies: Go Green: Action Plan on Climate Change (2007), 25-year transportation plan—the Big Move (2008), Feed-in Tariff (FIT) energy program (2009)
- Total ON emmissions, 2013: 171 metric tonnes (Mt) (Source: National Inventory Report, 2015)
- ON’s contribution to total Canadian GHG emissions, 2013: 23.6%
- Ranked 2nd largest GHG emitter among Canadian provinces and territories in 2013
- GHG per capita, 2012: 12.5 tonnes; ranked 2nd lowest GHG emitter per capita in 2012
- In April 2015 ON announced its intention to implement a cap and trade system, joining the existing QC and California framework, as a key component of a climate change strategy to be released Fall 2015.
- The ON Environmental Commissioner’s 2015 report indicates ON will likely meet its 2014 interim target but would miss its 2020 target by close to 20 Mt in the absence of additional measures.
- ON completed the phase-out of coal-fired electricity generation in 2014. ON estimates that the phase-out of coal-fired electricity will allow it to reduce electricity sector emissions from 41.4 Mt in 2000 to about 5 Mt by 2020. This constitutes one of the largest single GHG reduction measures in North America.
- Ontario has been active in sub-national climate change fora including as a signatory to the Western Climate Initiative, the Under 2 MOU and as host of the Summit of the Americas in July 2015 which resulted in a statement signed by 21 sub-national governments to comit to GHG reductions and support carbon pricing.
Water
- Departments responsible for water:
- Ministry of Environment and Climate Change, Ministry of Natural Resources and Forestry
- Minister responsible for water:
- Hon. Glen Murray
- Legislation and regulations:
- Water Opportunities and Water Conservation Act, Safeguarding and Sustaining Ontario’s Water Act, Clean Water Act, Safe Drinking Water Act, Sustainable Water and Sewage Systems Act, Nutrient Management Act, Toxics Reduction Act, Environmental Enforcement Statute Law Amendment Act, Lake Simcoe Protection Act, Ontario Water Resources Act, Lakes and Rivers Improvement Act
- Water strategies: Water Sector Strategy (2013), Great Lakes Strategy (2012)
- The MoE is responsible for protection of water quality; drinking water licensing and enforcement; Great Lakes protection and restoration; inspection, compliance and enforcement; environmental assessment; and emergency response. Others: Ministry of Natural Resources (wetlands, conservation), Ontario Clean Water Agency (Crown Agency for water and wastewater services), municipalities and Conservation Authorities.
- Key priorities: source water protection for drinking water (local committees develop protection plans); protection of Great Lakes, Lake Simcoe and Lake of the Woods, innovation in management of drinking water, storm water and wastewater, and hydroelectricity projects.
- The Great Lakes Protection Act, reintroduced in 2013, proposes new tools to protect beaches, wetlands and other coastal areas.
- The Clean Water Act requires communities to develop Source Protection Plans to protect municipal sources of drinking water, in consultation with Conservation Authorities, property owners, farmers, industry, businesses, community groups, public health officials, and First Nations.
- The objectives of ON’s Water Sector Strategy are to collaborate with water companies, municipalities, researchers, and industry to create efficient and affordable solutions for water conservation; attract foreign investment; encourage local water companies to export technologies internationally; and build a globally competitive water sector.
Environment Canada and ON collaboration on water
- Randle Reef remediation
- Niagara River Toxics Management Plan
- Binational Areas of Concern: St. Clair River, Detroit River, St. Mary’s River
- Lakewide Management Plans for Lakes Ontario, Erie and Superior
- Acid Rain (various initiatives)
- Great Lakes Wetlands Conservation Action Plan
Biodiversity and wildlife
- Department responsible for biodiversity and wildlife:
- Ministry of Natural Resources and Forestry
- Minister responsible for biodiversity and wildlife:
- Hon. Bill Mauro
- Legislation:
- Conservation Authorities Act, Conservation Land Act, Crown Forest Sustainability Act, Endangered Species Act, Environmental Assessment Act, Far North Act, Fish and Wildlife Conservation Act, Forestry Act, Heritage Hunting and Fishing Act, Provincial Parks and Conservation Reserves Act, Wilderness Areas Act, Oak Ridges Moraine Conservation Act, Planning Act
- Biodiversity and conservation strategies: Biodiversity: It’s In Our Nature 2012-2020, Invasive Species Strategic Plan (2012), Ontario’s Biodiversity Strategy (2011)
| Extirpated | Endangered | Threatened | Special Concern | |
|---|---|---|---|---|
| Total: 186 Source: Species at Risk Public Registry January 2015 |
10 | 91 | 45 | 40 |
- ON’s 2011 Biodiversity Strategy supports and complements the UN Convention on Biological Diversity’s Strategic Plan for Biodiversity 2011–2020 and the Aichi Biodiversity Targets.
- In 2015, ON launched a review of the wetlands conservation framework, to inform the development of a strategic plan for wetlands.
- In 2014, ON introduced the proposed Invasive Species Act, to support the prevention, early detection, rapid response and eradication of invasive species in the province.
- ON uses a landscape-based adaptive approach to wildlife management which includes population monitoring, harvest planning and allocation, hunter activity and harvest monitoring, research, habitat conservation and planning, input from the public, and policy and regulation.
- ON’s Species at Risk Stewardship Fund supports ON’s efforts protect and recover listed species and their habitats.
- Under the Far North Act, at least 50% of ON’s far North is to be set aside in an interconnected network of protected areas to enhance climate change adaptation and help conserve biodiversity.
- Percentage of freshwater and land protected in ON: 10.2% (Source: Canadian Environment Sustainability Indicators, 2013).
- Environment Canada maintains 19 protected areas in ON, including 10 National Wildlife Areas and 9 Migratory Bird Sanctuaries, comprising over 32,000 hectares of ON’s protected lands and waters
- Over 90% of ON has natural cover in the form of forests, wetlands, lakes and streams. (Source: Biodiversity: It’s in Our Nature, 2012)