
Tables
| Chemical Abstracts Service Registry Number | 3194-55-6 (contains, predominantly mixed isomers α, ß, γ) |
| DSL name | Cyclododecane, 1,2,5,6,9,10-hexabromo- |
| National Chemical Inventories (NCI) names1 | Cyclododecane, 1,2,5,6,9,10-hexabromo- (TSCA, ENCS, AICS, PICCS, ASIA-PAC, NZIoC) 1,2,5,6,9,10-Hexabromocyclodecane (EINECS) 1,2,5,6,9,10-Hexabromocyclododecane (ENCS, ECL, PICCS) Hexabromocyclododecane (ECL) 1,2,5,6,9,10- HEXABROMOCYCLODODECANE (PICCS) CYCLODODECANE, 12,5,6,9,10-HEXABROMO- (PICCS |
| Other names | Hexabromocyclododecane (HBCD); 1,2,5,6,9,10- Hexabromocyclododecane hbcd Bromkal 73-6D FR 1206 FR 1206HT Hexabromocyclododecane (HBCD) Pyroguard SR 104 SR 104 YM 88A |
| Chemical group | Brominated flame retardant |
| Chemical subgroup | Brominated cyclic alkane |
| Chemical formula | C12H18Br6 |
| Chemical structures | 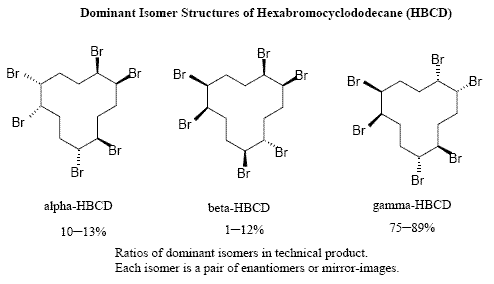 |
| SMILES1 | BrC(C(Br)CCC(Br)C(Br)CCC(Br)C(Br)C1)C1 |
| Molecular mass | 641.69 g/mol (ACC 2002) |
| Physical state | White powder at 25°C |
1 National Chemical Inventories (NCI). 2009: AICS (Australian Inventory of Chemical Substances); ASIA-PAC (Asia-Pacific
Substances Lists); ECL (Korean Existing Chemicals List); EINECS (European Inventory of Existing Commercial Chemical
Substances); ENCS (Japanese Existing and New Chemical Substances); NZIoC (New Zealand Inventory of Chemicals); PICCS (Philippine Inventory of Chemicals and Chemical Substances); and TSCA (Toxic Substances Control Act Chemical Substance Inventory).
2 Simplified Molecular Input Line Entry System
| Property | Type | Value | Temperature (°C) | Reference |
|---|---|---|---|---|
| Molecular mass (g/mol) | Experimental | 641.7 | Sigma Aldrich 2004 | |
| Melting point (ºC) | Experimental | 167-168 (low melt) 195-196 (high melt) |
Buckingham 1982 | |
| 180-185 | Albemarle Corporation 2000a, 2000b | |||
| 175-195 | ACCBFRIP 2005 | |||
| 180-197 | Great Lakes Chemical Corporation 2005a, 2005b | |||
| Modelled | 180 (weighted value) |
MPBPWIN 2000 | ||
| Boiling point (ºC) | Experimental | Decomposition starts at 200 | Albemarle Corporation 2000a | |
| Decomposes at > 445 | Great Lakes Chemical Corporation 2005a | |||
| Modelled | 462 (Adapted Stein and Brown method) |
MPBPWIN 2000 | ||
| Density(g/mL) | Experimental | 2.36-2.37 | Not provided | Albemarle Corporation 2000a, 2000b |
| 2.1 | 25 | Great Lakes Chemical Corporation 2005a, 2005b | ||
| Vapour pressure (Pa) | Experimental | 6.27 × 10⁻⁵ | 21 | CMABFRIP 1997b |
| Modelled | 2.24 × 10⁻⁶ (1.68 × 10⁻⁸ mm Hg; Modified Grain method) |
25 | MPBPWIN 2000 | |
| Henry’s Law constant (Pa m3/mol) | Modelled | 0.174 (1.72 × 10⁻⁶ atm-m3/mole; Bond method) 6.52 × 10⁻⁶ (6.43 × 10⁻¹¹ atm-m3/mole; Group method) 11.8 (1.167 × 10⁻⁴ atm-m3/mole; VP/Wsol method)1 68.8 (6.79 × 10⁻⁴ atm-m3/mole; VP/Wsol method)2 |
25 | HENRYWIN 2000 |
| Water solubility3(mg/L) | Experimental | 3.4 × 10⁻³ | 25 | CMABFRIP 1997c |
| 4.88 × 10⁻² (α-isomer) 1.47 × 10⁻² (ß-isomer) 2.08 × 10⁻³ (γ-isomer) |
20 | EBFRIP 2004a | ||
| Modelled | 2.09 × 10⁻⁵ | 25 | WSKOWWIN 2000 | |
| 3.99 × 10⁻³ (calculated) | 25 | ECOSAR 2004 | ||
| Log Kow(Octanol-water partition coefficient; dimensionless) | Experimental | 5.81 | 25 | Veith et al. 1979 |
| 5.625 | 25 | CMABFRIP 1997a | ||
| Calculated | 5.07 ± 0.09 (α-isomer) 5.12 ± 0.09 (ß-isomer) 5.47 ± 0.10 (γ-isomer) |
25 | Hayward et al. 2006 | |
| Modelled | 7.74 | 25 | KOWWIN 2000 | |
| Log Koc(Organic carbon-water partition coefficient; dimensionless) | Modelled | 5.10 (corrected value) | 25 | PCKOCWIN 2000 |
1 Estimate was derived using user-entered values for water solubility of 0.0034 mg/L (for the gamma isomer) and vapour pressure of 6.27 × 10⁻⁵ Pa (for the commercial product).
2 Estimate was derived using model-entered values for water solubility of 2.089 × 10⁻⁵ mg/L (WSKOWWIN 2000) and vapour pressure of 2.24 × 10⁻⁶ Pa (MPBPWIN 2000).
3 Water solubility is a function of isomer content.
| Fate process | Model and model basis | Model output | Expected half-life (days)1 |
|---|---|---|---|
| AIR | |||
| Atmospheric oxidation | AOPWIN 2000 | t 1/2 = 2.133 days | > 2 |
| Ozone reaction | AOPWIN 2000 | n/a2 | n/a |
| WATER | |||
| Hydrolysis | HYDROWIN 2000 | t1/2 = 1.9 × 10⁵ days (pH7) t 1/2 = 1.9 × 10⁵ days (pH8) | n/a |
| Biodegradation (aerobic) | BIOWIN 2000 Sub-model 3: Expert Survey (ultimate biodegradation) |
2.0 | > 182 |
| Biodegradation (aerobic) | BIOWIN 2000 Sub-model 4: Expert Survey (primary biodegradation) |
3.1 | = 182 |
| Biodegradation (aerobic) | BIOWIN 2000 Sub-model 5: MITI linear probability |
-0.4 | > 182 |
| Biodegradation (aerobic) | BIOWIN 2000 Sub-model 6: MITI non-linear probability |
0.0 | > 182 |
| Biodegradation (aerobic) | CPOPs 2008; Mekenyan et al. 2005 % BOD (biological oxygen demand) |
0.1 | > 182 |
1 Expected half-lives for BIOWIN and CPOPs models are determined based on Environment Canada 2009.
2 Model does not provide an estimate for this type of structure.
Table 4: Persistence and Bioaccumulation Criteria as Defined in CEPA 1999 Persistence and Bioaccumulation Regulations (Canada 2000)
| Persistence1 | Bioaccumulation2 | |
|---|---|---|
| Medium | Half-life | |
| Air Water Sediment Soil | = 2 days or is subject to atmospheric transport from its source to a remote area = 182 days (= 6 months) = 365 days (= 12 months) = 182 days (= 6 months) |
BAF= 5000; BCF = 5000; log Kow= 5 |
1 A substance is persistent when at least one criterion is met in any one medium.
2 When the bioaccumulation factor (BAF) of a substance cannot be determined in accordance with generally recognized methods, then the bioconcentration factor (BCF) of a substance will be considered; however, if neither its BAF nor its BCF can be determined with recognized methods, then the log Kowwill be considered.
| Test organism | Endpoint | Value wet weight (L/kg) | Reference |
|---|---|---|---|
| Fish | BAF | (assuming no metabolic transformation) 6 456 5421; 275 4232 |
Gobas BAF/BCF Middle Trophic Level (Arnot and Gobas 2003) |
| Fish | BCF | (assuming no metabolic transformation) 20 4171; 23 9882 |
Gobas BAF/BCF Middle Trophic Level (Arnot and Gobas 2003) |
| 6211 | BCFWIN 2000 |
1 Log Kow 7.74 (KOWWIN 2000) used
2 Log Kow 5.625 (CMABFRIP 1997a), primarily for γ-isomer, used
Table 6: Concentrations Measured in the Ambient Environment and Waste Treatment Products
| Medium | Location; year | Concentration | Samples | Reference |
|---|---|---|---|---|
| Air | Canadian and Russian Arctic; 1994-1995 | < 0.0018 ng/m3 | 12 | Alaee et al. 2003 |
| Air | United States; 2002-2003 | < 0.00007-0.011 ng/m3 | in 120 of 156 | Hoh and Hites 2005 |
| Air | The Netherlands ; 1999 | 280 ng/m3 | ns1 | Waindzioch 2000 |
| Air | Sweden ; 1990-1991 | 0.0053-0.0061 ng/m3 | 2 | Bergander et al. 1995 |
| Air | Sweden ; 2000-2001 | < 0.001-1070 ng/m3 | 11 | Remberger et al. 2004 |
| Air | Finland ; 2000-2001 | 0.002, 0.003 ng/m3 | 2 | Remberger et al. 2004 |
| Air | China ; 2006 | 0.0012-0.0018 ng/m3 | 4 | Yu et al. 2008a |
| Air | China ; 2006 | 0.00069-0.00309 ng/m3 | 4 | Yu et al. 2008b |
| Air | Sweden urban and rural | 0.00002-0.00061 pg/m3 | 14 | Covaci et al. 2006 |
| Air | Alert, Tagish (Canadian Arctic), Dunai (Russian Arctic) | < 0.0018 pg/m3 | 12 | PWGSC-INAC-NCP 2003 |
| Precipitation | Great Lakes; no year | nd2-35 ng/L | ns | Backus et al. 2005 |
| Precipitation | The Netherlands ; 2003 | 1835 ng/L | in 1 of 50 | Peters 2003 |
| Precipitation | Sweden ; 2000-2001 | 0.02-366 ng/m2·d | 4 | Remberger et al. 2004 |
| Precipitation | Finland ; 2000-2001 | 5.1, 13 ng/m2·d | 2 | Remberger et al. 2004 |
| Water | United Kingdom lakes | 0.08-2.7 ng/L | 27 | Harrad et al. 2009 |
| Water | Lake Winnipeg, Canada ; 2004 | α-HBCD: 0.006-0.013 ng/L ß-HBCD: < 0.003 ng/L γ-HBCD: < 0.003-0.005 ng/L |
3 | Law et al. 2006a |
| Water | United Kingdom ; no year | < 50-1520 ng/L | 6 | Deuchar 2002 |
| Water | United Kingdom ; 1999 | 4810-15 800 ng/L | ns | Dames and Moore 2000b |
| Water | The Netherlands ; no year | 73.6-472 ng/g dw6 (solid phase) | ns | Bouma et al. 2000 |
| Water | Japan ; 1987 | < 200 ng/L | 75 | Watanabe and Tatsukawa 1990 |
| Water (solid phase) | Detroit River, Canada - United States ; 2001 | < 0.025-3.65 ng/g dw | 63 | Marvin et al. 2004, 2006 |
| Sediment | United Kingdom lakes | 0.88-4.80 ng/g dw | 9 | Harrad et al. 2009 |
| Sediment | Lake Winnipeg, Canada ; 2003 | α-HBCD: < 0.08 ng/g dw ß-HBCD: < 0.04 ng/g dw γ-HBCD: < 0.04-0.10 ng/g dw |
4 | Law et al. 2006a |
| Sediment | Norwegian Arctic; 2001 | α-HBCD: 0.43 ng/g dw ß-HBCD: < 0.06 ng/g dw γ-HBCD: 3.88 ng/g dw |
4 | Evenset et al. 2007 |
| Sediment | United Kingdom ; no year | 1131 ng/g dw | 1 | Deuchar 2002 |
| Sediment | England ; 2000-2002 | < 2.4-1680 ng/g dw | 22 | Morris et al. 2004 |
| Sediment | Ireland ; 2000-2002 | < 1.7-12 ng/g dw | 8 | Morris et al. 2004 |
| Sediment | Belgium ; 2001 | < 0.2-950 ng/g dw | 20 | Morris et al. 2004 |
| Sediment | The Netherlands ; no year | 25.4-151 ng/g dw | ns | Bouma et al. 2000 |
| Sediment | The Netherlands ; 2000 | < 0.6-99 ng/g dw | 28 | Morris et al. 2004 |
| Sediment | The Netherlands ; 2001 | 14-71 ng/g dw | ns | Verslycke et al. 2005 |
| Sediment | Dutch North Sea; 2000 | < 0.20-6.9 ng/g dw | in 9 of 10 | Klamer et al. 2005 |
| Sediment | Switzerland ; no year | < 0.1-0.7ng/g dw3 | 1 | Kohler et al. 2007 |
| Sediment | Switzerland ; 2003 | 0.40-2.5 ng/g dw | 1 | Kohler et al. 2008 |
| Sediment | Sweden ; 1995 | nd-1600 ng/g dw | 18 | Sellström et al. 1998 |
| Sediment | Sweden ; 1996-1999 | 0.2-2.1 ng/g dw | 9 | Remberger et al. 2004 |
| Sediment | Sweden ; 2000 | < 0.1-25 ng/g dw | 6 | Remberger et al. 2004 |
| Sediment | Norway ; 2003 | α-HBCD: < 0.03-10.15 ng/g dw ß-HBCD: < 0.08-7.91 ng/g dw γ-HBCD: < 0.12-3.34 ng/g dw |
26 | Schlabach et al. 2004a, 2004b |
| Sediment | Spain ; 2002 | 0.006-513.6 ng/g dw | 4 | Eljarrat et al. 2004 |
| Sediment | Spain ; no year | < 0.0003-2658 ng/g dw | 4 | Guerra et al. 2008 |
| Sediment | Japan ; 1987 | nd-90 ng/g dw | in 3 of 69 | Watanabe and Tatsukawa 1990 |
| Sediment | Japan ; 2002 | 0.056-2.3 ng/g dw | in 9 of 9 | Minh et al. 2007 |
| Soil | United Kingdom ; 1999 | 18 700-89 600 ng/g dw | 4 | Dames and Moore 2000a |
| Soil | Sweden ; 2000 | 140-1300 ng/g dw | 3 | Remberger et al. 2004 |
| Soil | China ; 2006 | 1.7-5.6 ng/g dw | 3 | Yu et al. 2008a |
| Landfill leachate | England ; 2002 | Nd | 3 | Morris et al. 2004 |
| Landfill leachate | Ireland ; 2002 | Nd | 3 | Morris et al. 2004 |
| Landfill leachate | The Netherlands ; 2002 | 2.5-36 000 ng/g dw (solid phase) | 11 | Morris et al. 2004 |
| Landfill leachate | Sweden ; 2000 | 3, 9 ng/L | 2 | Remberger et al. 2004 |
| Landfill leachate | Norway ; no year | α-HBCD: nd-0.0091 ng/g ww7 ß-HBCD: nd-0.0038 ng/g ww γ-HBCD: nd-0.079 ng/g ww |
ns | Schlabach et al. 2002 |
| STP4 influent STP effluent Receiving water | United Kingdom ; 1999 | 7.91 x 10⁷-8.61 x 10⁷ng/L 8850-8.17 x 10⁷ ng/L 528-744 ng/L |
3 9 3 | Dames and Moore 2000b |
| STP influent STP effluent STP sludge | United Kingdom ; no year | 934 ng/L (dissolved phase) 216 000 ng/g dw (solid phase) nd (dissolved phase) 1260 ng/g dw (solid phase) 9547 ng/g dw |
ns | Deuchar 2002 |
| STP influent STP effluent STP sludge | England ; 2002 | nd-24 ng/L (dissolved phase) < 0.4-29.4 ng/g dw (solid phase) < 3.9 ng/L 531-2683 ng/g dw |
5 5 5 5 | Morris et al. 2004 |
| STP sludge | Ireland ; 2002 | 153-9120 ng/g dw | 6 | Morris et al. 2004 |
| STP effluent Activated sludge | The Netherlands ; 1999-2000 | 10 800-24 300 ng/L 728 000-942 000 ng/g dw |
ns 3 | Institut Fresenius 2000a, 2000b |
| STP influent STP effluent STP sludge | The Netherlands ; 2002 | < 330-3800 ng/g dw (solid phase) < 1-18 ng/g dw (solid phase) < 0.6-1300 ng/g dw |
5 5 8 | Morris et al. 2004 |
| STP sludge | Sweden ; 1997-1998 | 11-120 ng/g dw | 4 | Sellström 1999; Sellström et al. 1999 |
| STP sludge | Sweden ; 2000 | 30, 33 ng/g dw | 2 | Remberger et al. 2004 |
| STP primary sludge STP digested sludge | Sweden ; 2000 | 6.9 ng/g dw < 1 ng/g dw | 1 3 | Remberger et al. 2004 |
| STP sludge | Sweden ; 2000 | 3.8-650 ng/g dw | ns | Law et al. 2006c |
| Plant WWTP5 influent effluent | United Kingdom ; 1999 | 1.72 x 10⁵-1.89 x 10⁶ng/L 3030-46 400 ng/L |
3 | Dames and Moore 2000a |
| Laundry effluent | Sweden ; 2000 | 31 ng/L | 1 | Remberger et al. 2004 |
| STP sludge | Switzerland ; 2003 and 2005 | 39-597 ng/g dw | 19 | Kupper et al. 2008 |
| Compost | Switzerland ; no year | 19-170 ng/g dw | ns | Zennegg et al. 2005 |
1 Not specified
2 Not detected; detection limit not specified
3 Values estimated from graphical representation of data
4 Sewage treatment plant
5 Wastewater treatment plant
6 Dry weight
7 Wet weight
| Location; year |
Organism | Concentration (ng/g lipid weight) |
Samples | Reference |
|---|---|---|---|---|
| Canadian Arctic; 1976-2004 |
Ivory gull (Pagophila eburnea) egg | 2.1-3.8 | 24 | Braune et al. 2007 |
| Location; year |
Organism | Concentration (ng/g lipid weight) |
Samples | Reference | |
|---|---|---|---|---|---|
| α-HBCD | Dγ-HBCD | ||||
| Canadian Arctic; 1996-2002 |
Beluga (Delphinapterus leucas) | < 0.63-2.08 | < 0.07-0.46 | 5 | Tomy et al. 2008 |
| Walrus (Odobenus rosmarus) | nd-0.86 | < 0.12-1.86 | 5 | ||
| Narwhal (Monodon monoceros) | 2.05-6.10 | < 0.11-1.27 | 5 | ||
| Arctic cod (Boreogadus saida) | nd-1.38 | nd-0.07 | 8 | ||
| Redfish (Sebastes mentella) | < 0.74-3.37 | < 0.28-1.03 | 5 | ||
| Shrimp (Pandalus borealis, Hymenodoraglacialis) | 0.91-2.60 | 0.23-1.24 | 5 | ||
| Clam (Mya truncate, Serripesgroenlandica) | nd-1.03 | < 0.46-5.66 | 5 | ||
| Zooplankton | nd-9.16 | 0.13-2.66 | 5 | ||
| Location; year |
Organism | Concentration (ng/g lipid weight) |
Samples | Reference |
|---|---|---|---|---|
| Nunavut; 2007 |
Ringed seal (Phoca hispida) | 0.38 | 10 | Morris et al. 2007 |
| Alaska; 1994-2002 |
Polar bear (Ursus maritimus) | < 0.01-35.1 | in 2 of 15 | Muir et al. 2006 |
| Greenland; 1999-2001 |
Polar bear (Ursus maritimus) |
32.4-58.6 | 11 | Muir et al. 2006 |
| Greenland; 1999-2001 |
Polar bear (Ursus maritimus) |
41 ng/g wet weight | 20 | Gebbink et al. 2008 |
| British Columbia, southern California; 2001-2003 |
Bald eagle (Haliaeetus leucocephalus) |
< 0.01 ng/g | 29 | McKinney et al. 2006 |
| Location; year |
Organism | Concentration (ng/g lipid weight) |
Samples | Reference | ||
|---|---|---|---|---|---|---|
| α-HBCD | ß-HBCD | γ-HBCD | ||||
| Lake Winnipeg; 2000-2002 |
Whitefish (Coregonus commersoni) | 0.56-1.86 | 0.10-1.25 | 0.90-1.19 | 5 | Law et al. 2006a |
| Walleye (Stizostedion vitreum) | 2.02-13.07 | 0.66-2.36 | 1.65-6.59 | 5 | ||
| Mussel (Lampsilis radiate) | 6.15-10.09 | < 0.04-2.37 | 6.69-23.04 | 5 | ||
| Zooplankton | 1.40-17.54 | < 0.04-1.80 | 0.22-1.82 | 5 Pooled | ||
| Emerald shiner (Notropis atherinoides) | 4.51-6.53 | < 0.04-5.70 | 3.66-12.09 | 5 | ||
| Goldeye (Hiodon alosoides) | 7.39-10.06 | < 0.04-2.08 | 3.23-6.95 | 5 | ||
| White sucker (Catostomus commersoni) | 2.30-5.98 | 0.27-0.90 | 1.53-10.34 | 5 | ||
| Burbot (Lota lota) | 10.6-25.47 | 2.29-10.29 | 24.4-47.90 | 5 | ||
| Great Lakes; 1987-2004 |
(ng/g ww) Herring gull (Larus argentatus) egg |
nd-20 | nd1 | nd-0.67 | 41 | Gauthier et al. 2006, 2007 |
| Location; year |
Organism | Concentration (ng/g lipid weight) |
Samples | Reference |
|---|---|---|---|---|
| Lake Ontario; no year |
Whitefish (Coregonus commersoni) | 92 | ns2 | Tomy et al. 2004b |
| Walleye (Stizostedion vitreum) | 40 |
| Location; year |
Organism | Concentration (ng/g lipid weight) |
Samples | Reference | |||
|---|---|---|---|---|---|---|---|
| α-HBCD | ß-HBCD | γ-HBCD | ΣHBCD | ||||
| Lake Ontario; 1979-2004 |
Lake trout (Salvelinus namaycush) |
15-27 | 0.16-0.94 | 1.4-6.5 | 16-33 | 29 | Ismail et al. 2009 |
| Location; year |
Organism (ng/g ww) |
Concentration (ng/g lipid weight) |
Samples | Reference | ||
|---|---|---|---|---|---|---|
| α-HBCD | ß-HBCD | γ-HBCD | ||||
| Lake Ontario; 2002 |
Lake trout (Salvelinus namaycush) | 0.37-3.78 | < 0.030 | 0.07-0.73 | 5 | Tomy et al. 2004a |
| Rainbow smelt (Osmerus mordax) | 0.19-0.26 | < 0.030 | 0.03-0.04 | 3 | ||
| Slimy sculpin (Cottus cognatus) | 0.15-0.46 | < 0.030 | 0.02-0.17 | 3 | ||
| Alewife (Alosa pseudoharengus) | 0.08-0.15 | < 0.030 | 0.01-0.02 | 3 | ||
| Mysid (Mysis relicta) | 0.04, 0.07 | < 0.030 | 0.01, 0.02 | 2 | ||
| Amphipod (Diporeia hoyi) | 0.05, 0.06 | < 0.030 | 0.02, 0.03 | 2 | ||
| Plankton | 0.02, 0.04 | < 0.030 | < 0.030, 0.03 | 2 | ||
| Location; year |
Organism | Concentration (ng/g lipid weight) |
Samples | Reference |
|---|---|---|---|---|
| Eastern U.S.; 1993-2004 |
Dolphin (Lagenorhynchus acutus) | 2.9-380 | 73 | Peck et al. 2008 |
| Chesapeake Bay, USA; 2003 |
American eel (Anguilla rostrata) | 2.2, 5.9 | 2 | Larsen et al. 2005 |
| Bluegill (Lepomis macrochirus) | 4.8 | 1 | ||
| Brown bullhead (Ameiurus nebulosus) | 25.4 | 1 | ||
| Brown trout (Salmo trutta) | 7.5 | 1 | ||
| Channel catfish (Ictalurus punctatus) | 2.2-73.9 | 9 | ||
| Largemouth bass (Micropterus salmoides) | 8.7 | 1 | ||
| Pumpkinseed sunfish (Lepomis gibbosus) | 5.3 | 1 | ||
| Redbreast sunfish (Lepomis auritus) | 4.5-9.1 | 4 | ||
| Rock bass (Ambloplites rupestris) | 1.7-6.0 | 3 | ||
| Smallmouth bass (Micropterus dolomieu) | 7.1, 15.9 | 2 | ||
| Striped bass (Morone saxatilis) | nd-59.1 | 9 | ||
| White perch (Morone americana) | 1.0-21.0 | 11 | ||
| White sucker (Catostomus commersoni) | 3.9-19.1 | 3 | ||
| Yellow bullhead (Ameiurus natalis) | 6.9, 18.9 | 2 |
| Location; year |
Organism | Concentration (ng/g lipid weight) |
Samples | Reference | |||
|---|---|---|---|---|---|---|---|
| α-HBCD | ß-HBCD | γ-HBCD | ΣHBCD | ||||
| Florida; 1991-2004 |
Bottlenose dolphin (Tursiops truncates) | 1.29-7.87 | 0.337-2.49 | 0.582-5.18 | 2.21-15.5 | 15 | Johnson-Restrepo et al. 2008 |
| Bull shark (Carcharhinus leucas) | 8.01-14.5 | 4.83-5.57 | 52.3-71.3 | 71.6-84.9 | 13 | ||
| Sharpnose shark (Rhizoprionodon terraenovae) |
11 | 3.78 | 39.7 | 54.5 | 3 | ||
| Location; year | Organism | Concentration (ng/g lipid weight) |
Samples | Reference |
|---|---|---|---|---|
| California; 1993-2000 |
California sea lion (Zalopus californianus) | 0.71-11.85 | 26 | Stapleton et al. 2006 |
| United Kingdom; no year |
Eel (Anguilla anguilla) | 39.9-10 275 ng/g wet weight | ns | Allchin and Morris 2003 |
| Brown trout (Salmo trutta) | < 1.2-6758 ng/g wet weight | |||
| United Kingdom; no year |
Peregrine falcon (Falco peregrinus) | nd-1200 | in 12 of 51 | de Boer et al. 2004 |
| Sparrow hawk (Accipiter nisus) | nd-19 000 | in 9 of 65 | ||
| United Kingdom; 1998 |
Harbour porpoise (Phocoena phocoena) | < 5-1019 | 5 | Morris et al. 2004 |
| United Kingdom; 1999-2000 |
Cormorant (Phalacrocorax carbo) | 138-1320 | 5 | |
| United Kingdom; 2001 |
Sea star (Asterias rubens) | 769 | 1 |
| Location; year |
Organism (ng/g ww) |
Concentration (ng/g lipid weight) |
Samples | Reference | ||
|---|---|---|---|---|---|---|
| α-HBCD | ß-HBCD | γ-HBCD | ||||
| United Kingdom; 1994-2003 |
Harbour porpoise (Phocoena phocoena) | 10-19 200 | < 3-54 | < 4-21 | 85 | Law et al. 2006d |
| Location; year |
Organism | Concentration (ng/g lipid weight) |
Samples | Reference |
|---|---|---|---|---|
| United Kingdom; 2003-2006 |
Harbour porpoise (Phocoena phocoena) | nd-11 500 ng/g wet weight | in 137 of 138 | Law et al. 2008 |
| North Sea; no year |
Harbour porpoise (Phocoena phocoena) | 393-2593 | 24 | Zegers et al. 2005 |
| Scotland; no year |
Harbour porpoise (Phocoena phocoena) | 1009-9590 | 5 | |
| Ireland; no year |
Harbour porpoise (Phocoena phocoena) | 466-8786 | 11 | |
| Dolphin (Delphinus delphis) | 411-3416 | 6 | ||
| France; no year |
Dolphin (Delphinus delphis) | 97-898 | 31 | |
| Spain; no year |
Dolphin (Delphinus delphis) | 51-454 | 27 | |
| North Sea; 1999 | Whelk (Buccinium undatum) | 29-47 | 3 | Morris et al. 2004 |
| Sea star (Asterias rubens) | < 30-84 | 3 | ||
| Hermit crab (Pagurus bernhardus) | < 30 | 9 | ||
| Whiting (Merlangius merlangus) | < 73 | 3 | ||
| Cod (Gadus morhua) | < 0.7-50 | 2 | ||
| Harbour seal (Phoca vitulina) | 63-2055 | 2 | ||
| Porpoise (Phocoena phocoena) | 440-6800 | 4 | ||
| Belgium; 2000 |
Eel (Anguilla anguilla) | < 1-266 | 19 | |
| Belgium; 1998-2000 |
Little owl (Athene noctua) | 20, 40 | in 2 of 40 | Jaspers et al. 2005 |
| The Netherlands; no year |
Mussel (species not known) | 125-177 ng/g dry weight | ns | Bouma et al. 2000 |
| Sprat (Sprattus sprattus) | 65.5 ng/g dry weight | 1 | ||
| Bass (species not known) | 124 ng/g dry weight | 1 | ||
| Tern (Sterna hirundo) egg | 533-844 ng/g dry weight | ns |
| Location; year |
Organism | Concentration (ng/g lipid weight) |
Samples | Reference | ||
|---|---|---|---|---|---|---|
| α-HBCD | ß-HBCD | γ-HBCD | ||||
| The Netherlands; 2001 |
Shrimp (Crangon crangon) | 28, 38 | nd | < 2, 18 | 2 | Janák et al. 2005 |
| Eel (Anguilla anguilla) | 7, 27 | nd, 3.4 | 2, 7 | 2 | ||
| Sole (Solea solea) | 100-1100 | nd | < 1-17 | 4 | ||
| Plaice (Pleuronectus platessa) | 21-38 | nd | < 2-8 | 3 | ||
| Bib (Trisopterus luscus) | 53-150 | nd-2.2 | < 3-43 | 3 | ||
| Whiting (Merlangius merlangus) | 16-240 | nd | < 3-38 | 3 | ||
| Location; year |
Organism | Concentration (ng/g lipid weight) |
Samples | Reference |
|---|---|---|---|---|
| The Netherlands; 1999-2001 |
Eel (Anguilla anguilla) | 6-690 | 11 | Morris et al. 2004 |
| Tern egg (Sterna hirundo) | 330-7100 | 10 | ||
| The Netherlands; 2001 |
Mysid (Neomysis integer) | 562-727 | ns | Verslycke et al. 2005 |
| Location; year |
Organism (Median, maximum; ng/g wet weight) |
Concentration (ng/g lipid weight) |
Samples | Reference | ||
|---|---|---|---|---|---|---|
| α-HBCD | ß-HBCD | γ-HBCD | ||||
| The Netherlands; 2003 |
Eel (species not known) | 12, 41 | 0.9, 1.6 | 3, 8.4 | 10 | Van Leeuwen et al. 2004 |
| Location;year | Organism | Concentration (ng/g lipid weight) |
Samples | Reference |
|---|---|---|---|---|
| Switzerland; no year |
Whitefish (Coregonus sp.) | 25-210 | ns | Gerecke et al. 2003 |
| Baltic Sea; 1969-2001 |
Guillemot (Uria algae) egg | 34-300 | 10 | Sellström et al. 2003 |
| Baltic Sea; 1980-2000 |
Grey seal (Halicoerus grypus) | 30-90 | 20 | Roos et al. 2001 |
| Sweden; 1995 |
Pike (Esox lucius) | < 50-8000 | 15 | Sellström et al. 1998 |
| Sweden; 1991-1999 |
Peregrine falcon (Falco peregrinus) egg | < 4-2400 | 21 | Lindberg et al. 2004 |
| Sweden; 1987-1999 |
Peregrine falcon (Falco peregrinus) egg | nd-1900 | 44 | Johansson et al. 2009 |
| Sweden; 2000 |
Pike (species not known) | 120-970 | Pooled: 20 | Remberger et al. 2004 |
| Eel (species not known) | 65-1800 | 20 | ||
| Sweden; 1999-2000 |
Herring (species not known) | 21-180 | 60 | |
| Sweden; 1999 |
Salmon (Salmo salar) | 51 | 5 | |
| Sweden; 2002 |
Herring (Clupea harengus) | 1.5-31 | ns | Asplund et al. 2004 |
| Norwegian Arctic; no year |
Northern fulmar (Fulmarus glacialis) | 3.8-61.6 | 14 | Knudsen et al. 2007 |
| Norwegian Arctic; 2002 |
Polar bear (Ursus maritimus) | 18.2-109 | 15 | Muir et al. 2006 |
| Norwegian Arctic; 2002-2003 |
Amphipod (Gammarus wilkitzkii) | nd | 5 | SØrmo et al. 2006 |
| Polar cod (Boreogadus saida) | 1.38-2.87 | 7 | ||
| Ringed seal (Phoca hispida) | 14.6-34.5 | 6 | ||
| Polar bear (Ursus maritimus) | 5.31-16.51 | 4 | ||
| Norwegian Arctic; 2002 |
North Atlantic kittiwake (Rissa tridactyla) yolk sac | 118 (Mean) | 18 | Murvoll et al. 2006a, 2006b |
| North Atlantic kittiwake yolk sac | 260 (Mean) | 19 | ||
| Norway; 2002 |
European shag (Phalacrocorax aristotelis) yolk sac | 417 (Mean) | 30 | |
| Norwegian Arctic; 2002 |
Polar bear (Ursus maritimus) | < 0.03-0.85 ng/g wet weight | 15 | Verreault et al. 2005 |
| Norwegian Arctic; 2004 |
Glaucous gull (Larus hyperboreus) | 0.07-1.24 ng/g wet weight | 27 | |
| Norwegian Arctic; 2002 |
Glaucous gull (Larus hyperboreus) | 0.51-292 | 57 | Verreault et al. 2007b |
| Norwegian Arctic; 2006 |
Glaucous gull (Larus hyperboreus) | < 0.59-63.9 | 80 | Verreault et al. 2007a |
| Norwegian Arctic; 2003 |
Polar cod (Boreogadus saida) | 7.67-23.4 | 6 | Bytingsvik et al. 2004 |
| Norway; 1998-2003 |
Atlantic cod (Gadus morhua) | nd-56.9 | 41 |
| Location; year |
Organism (ng/g ww) |
Concentration (ng/g lipid weight) |
Samples | Reference | ||
|---|---|---|---|---|---|---|
| α-HBCD | ß-HBCD | γ-HBCD | ||||
| Norway; no year |
Perch (Perca fluviatilis) | 3.14-8.12 | < 0.04 | < 0.07-0.37 | 7-20 pooled | Schlabach et al. 2004a, 2004b |
| Pike (Esox lucius) | 1.02-9.25 | < 0.02 | 0.03-0.92 | |||
| Smelt (Osmerus eperlanus) | 2.1 | 0.03 | 0.25 | |||
| Vendace (Coregonus albula) | 3.15 | 0.4 | 0.62 | |||
| Trout (Salmo trutta) | 2.28-13.3 | 0.06-1.12 | 0.24-3.73 | |||
| Norway; 2003 |
Perch (Perca fluviatilis) | 22.3 | < 0.2 | < 0.2 | 5-20 pooled | |
| Orfe (Leuciscus idus) | 14.8 | < 0.2 | < 0.2 | |||
| Flounder (Platichthys flesus) | 7.2 | < 0.2 | < 0.2 | |||
| Cod (Gadus morhua) | 9.3 | < 0.2 | < 0.2 | |||
| Trout (Salmo trutta) | < 1.9 | < 0.2 | < 0.2 | |||
| Eel (Anguilla anguilla) | 4.7 | < 0.2 | < 0.2 | |||
| Location; year |
Organism | Concentration (ng/g lipid weight) |
Samples | Reference |
|---|---|---|---|---|
| Northern Norway; no year |
Blue mussel (Mytilus edulis) | 3.6-11 | ns | Fjeld et al. 2004 |
| Atlantic cod (Gadus morhua) | 6.6, 7.7 | |||
| Norway; 2003 |
Blue mussel (Mytilus edulis) | < 0.17-0.87 ng/g wet weight | 33 | Bethune et al. 2005 |
| Herring (Clupea harengus) | < 0.63-2.75 ng/g wet weight | 23 | ||
| Mackerel (Species not known) | < 0.89-1.19 ng/g wet weight | 24 | ||
| Norway; 1986-2004 |
Tawny owl (Strix aluco) egg | 0.04-36.5 | in 34 of 139 | Bustnes et al. 2007 |
| Spain; 2002 |
Barbell (Barbus graellsi) | nd-1172 ng/g wet weight | 23 | Eljarrat et al. 2004, 2005 |
| Bleak (Alburnus alburnus) | nd-1643 ng/g wet weight | 22 | ||
| South Africa; 2004-2005 |
African darter (Anhinga rufa) egg | < 0.2-11 | 14 | Polder et al. 2008 |
| Reed cormorant (Phalacrocoraxafricanus) egg | < 0.2 | 3 | ||
| Cattle egret (Bubulcus ibis) egg | < 0.2 | 20 | ||
| Sacred ibis (Threskiornis aethiopicus) egg | 4.8, 71 | 2 | ||
| Crowned plover (Vanellus coronatus) egg | 1.6 | 1 | ||
| Little grebe (Tachybaptus ruficollis) egg | < 0.2 | 1 | ||
| White-fronted plover (Charadrius marginatus) egg | < 0.2 | 1 | ||
| Kelp gull (Larus dominicanus) egg | < 0.2 | 1 |
| Location; year |
Organism | Concentration (ng/g lipid weight) |
Samples | Reference | |||
|---|---|---|---|---|---|---|---|
| α-HBCD | ß-HBCD | γ-HBCD | ΣHBCD | ||||
| Asia-Pacific; 1997-2001 |
Skipjack tuna (Katsuwonus pelamis) | < 0.1-45 | < 0.1-0.75 | < 0.4-14 | nd-45 | 65 | Ueno et al. 2006 |
| South China Sea; 1990-2001 |
Finless porpoise (Neophocaena phacaenoides) | 4.4-55 | < 0.006-4.0 | < 0.006-21 | 4.7-55 | 19 | Isobe et al. 2008 |
| Humpback dolphin (Sousa chinensis) | 31-370 | < 0.006-0.59 | < 0.006-4.6 | 31-380 | |||
| China; 2006 |
Silver carp (Hypophthalmichthysmolitrix) | 15-29 | < 0.005-1.2 | 5.5-8.9 | 23-38 | 17 | Xian et al. 2008 |
| Bighead carp (Aristichthys nobilis) | 11-20 | < 0.005-0.69 | 1.7-2.8 | 13-24 | |||
| Grass carp (Ctenopharyngodon idella) | 7.2-75 | < 0.005-2.8 | 4.3-13 | 12-91 | |||
| Common carp (Cyprinus carpio) | 14-28 | 0.50-0.76 | 2.9-5.7 | 18-34 | |||
| Crucian carp (Carassius auratus) | 12-130 | 0.37-2.2 | 2.9-26 | 16-160 | |||
| Brass gudgeon (Coreius heterodon) | 20-57 | < 0.005-1.7 | 5.2-5.6 | 25-64 | |||
| White amur bream (Parabramis pekinensis) | 8.1-74 | 0.32-6.7 | 2.0-51 | 14-130 | |||
| Mandarin fish (Siniperca chuatsi) | 80, 120 | 2.8, 3.6 | 150, 200 | 240, 330 | |||
| Snakehead (Channa argus) | 37 | < 0.005 | 0.26 | 37 | |||
| Location; year |
Organism | Concentration (ng/g lipid weight) |
Samples | Reference |
|---|---|---|---|---|
| Korea; 2005 |
Blue mussel (Mytilus edulis) | 6.0-500 | 17 | Ramu et al. 2007 |
| Japan; 1987 |
Fish (species not provided) | 10-23 ng/g wet weight | in 4 of 66 | Watanabe and Tatsukawa 1990 |
| Japan; 1999 |
Minke whale (Balaenoptera acutorostrata) | 57 | 1 | Marsh et al. 2004 |
| Striped dolphin (Stenella coeruleoalba) | 90 | 1 |
| Location; year |
Organism | Concentration (ng/g lipid weight) |
Samples | Reference | |||
|---|---|---|---|---|---|---|---|
| α-HBCD | ß-HBCD | γ-HBCD | ΣHBCD | ||||
| Japan; 2001-2006 |
Racoon dog (Nyctereutes procyonoides) | < 0.005-10 | < 0.005-3.7 | < 0.005-20 | < 0.005-29 | 39 | Kunisue et al. 2008 |
1 Not detected; detection limit not specified
2 Not specified
Table 8: Human Milk Lipid Concentrations of Individual HBCD Isomers and Total (Σ) HBCD
| Location | Human milk (µg /kg lipid weight) | N= | Reference |
|---|---|---|---|
| Canada , Province of Ontario 2003, 2005 United States of America , Austin, State of Texas 2002, 2004 |
Median α-HBCD 0.41 Range α-HBCD 0.2-8.8 | n=27 (+13) | Ryan et al. 2006a |
| Median α-HBCD 0.54 Range α-HBCD 0.2-28 | n=35 (+23) | ||
| Median α-HBCD 0.40 Range α-HBCD 0.2-0.9 | n=24 (+21) | ||
| Median α-HBCD 0.49 Range α-HBCD 0.2-1.2 | n=25 (+20) | ||
| Sweden 2000-2001 | Median α-HBCD 0.30 Range α-HBCD 0.2-2.4 | n=30 (+24) | |
| Sweden 2002-2003 | Median α-HBDD 0.35 Range α-HBCD 0.2-1.5 | n=30 (+24) | |
| Norway 2003-2004 | Median α-HBCD 0.60 Range α-HBCD 0.4-20 | n=85 (+49) | |
| Norway 1993-2001 | Median 0.6 Range 0.3-20 | n=85 (+49) | |
| Belgium 2006 | ΣHBCD 1.5 | n=197 women between 18 and 30 years old distributed over all Belgian provinces. n=178 pooled | Coles et al. 2008 |
| A Corûna (northwestern Spain ) 2006, 2007 | Median 27 Range 3-188 | n= 33 (+30) Diastereoisomer levels were determined and body burden of mothers and infant exposure reported. Nursing infant dietary intake of 0.175 µg/kg-bw per day. | Eljarrat et al. 2009 |
| Location | Human blood serum (µg /kg lipid weight) |
N= | Cord plasma | N= | Reference |
|---|---|---|---|---|---|
| Canada , Arctic Nunavut and NWT regions 1994-1999 |
Median α-HBCD 0.7 Range α-HBCD 0.5-0.9 |
n=10 (+3) | Median α-HBCD 2.4 Range α-HBCD 2.4-2.4 |
n=10 (+1) | Walker et al.2003 as cited in Ryan et al. 2005 |
| Canada , Arctic | HBCD at quantities < 1 Median 0.7 Range 0.5-0.9 |
n=10 (+3) Lipid 0.63% |
Non-detect Lipid 0.17% |
n=10 (0) | Muckle et al. 2001 |
| Netherlands | Mean 1.1 Range < 0.16-4.2 |
n=78 weeks 20 and 35 of pregnancy |
Weiss et al. 2004 as cited in Antignac et al. 2008 | ||
| Netherlands | Range n.d-7 | n=90 | Means of 1.1 and 1.7 at weeks 20 and 35 of pregnancy | Weiss et al. 2004 | |
| Netherlands | Median 0.7 Range nd-7.4 |
n=69 (+68) | Median 0.2 Range 0.2-4.3 |
n=12 (+5) | Meijer et al. 2008 |
| Netherlands | Median of 1.1 Range < 0.2-7.0 |
n=78 | Meijer et al. 2008 | ||
| Norway | ΣHBCDs Median 4.1 Range < 1.0-52 ΣHBCDs Median 2.6 Range < 1.0-18 |
n=41 (men) n=25 (women) |
Thomsen et al. 2008 | ||
| Norway | ΣHBCDs Median 101 Range 6-856 |
n=2 (workers) Gamma-HBCD was high at 39% nd > 1 in a control group having no work-related exposure |
Thomsen et al. 2007 | ||
| Sweden | ΣHBCDs Median 0.5 Range < 0.24-3.4 |
n=50 Gamma at 13% |
Weiss et al. 2006a | ||
| Belgium | ΣHBCDs Median of 1.7 Range of < 0.5-11.3 |
n=16(+7) | Roosens et al. 2009 |
| Location | Tissue | Result | Reference |
|---|---|---|---|
| France | Adipose tissue | 1-12 µg/kg lipid weight (l.d) in 50% of samples from n=26 mother-infant pairs | Antignac et al. 2008 |
| Czech Republic | Adipose tissue | n=98 Mean 1.2 ng/g l.d. Relative standard deviation (RSD)% 150 Median < 0.5 ng/g l.d. 5-95th percentile range 0.5-7.5 ng/g l.d. |
Pulkrabova et al. 2009 |
| - | Skin | HBCD remained on surface of skin and stratum corneum was an efficient barrier to 14C -HBCD penetration. | Roper et al. 2007 |
Note: In Europe, the calculated margin of safety (MOS) for HBCD was 5.1 x 10+3 to 2.0 x 10+5, exceeding the MOS reference of 5.3 x 10+2 (Weiss and Bergman 2006b). The 2006 level of HBCD in European humans was not considered to be of concern. It was also determined that the HBCD data were too weak for any assessment in the U.S. at that time.
| Location | Food (ng/g wet weight) and dietary intakes (ng/day) | Reference |
|---|---|---|
| United States | n=31 food commodities, 310 samples Intake mainly from meat 16 ng/day (n.d. at 60 pg/g wet weight; measured values from 23 to 192 pg/g wet weight) Dairy and Eggs (n.d. range from 4 to 128 pg/g wet weight) Fats (n.d. range from 35 to 393 pg/g wet weight; measured value for peanut butter of 300 pg/g wet weight) Cereals (n.d. of 180 pg/g wet weight) Fruit (apples) (n.d. of 22 pg/g wet weight) Potatoes (n.d. of 18 pg/g wet weight) Fish (n.d. range from 29 to 59; measured values from 113 to 593 pg/g wet weight) |
Schecter et al. 2009 |
| Belgium | n=165(+13) Median 0.10 Mean 0.13 ± 0.11 Range < 0.01-0.35 (duplicate diets) Intake median 5.5 Intake mean 7.2+/-5.2 Intake range 1.2-20 |
Roosens et al. 2009 |
| Sweden | Range < 0.8-4.9 (various items) | Remberger et al. 2004 |
| United Kingdom | Range 0.02-0.30 (market basket survey) Intake Range 354-474 | Driffield et al. 2008 |
| Norway | Range 0.12-5 (fish) Range 0.03-0.15 (meat) Range 0.2-6 (egg) Intake median 16 Intake mean 18 Intake range 4-81 |
Knutsen et al. 2008 |
| Netherlands | (Market basket survey) Intake range 174 |
De Winter-Sorkina et al. 2003 |
Note: Roosens et al.’s (2009) dietary estimates of 0-20 ng ΣHBCD/day are lower than those previously reported. They are based on a short snapshot of time of exposure for a small number of individuals; the diets consumed consisted of lean meats and vegetables with low or no HBCD content; there were low detection frequencies of HBCD in the market survey; and LOQ or half LOQ concentrations were used.
Table 12: Dust Concentrations for Individual Isomers and ΣHBCD (Roosens et al. 2009)
| Location | Level ng/g dry weight | n= | Reference |
|---|---|---|---|
| Canada | ΣHBCD Median 640 Mean 670+/- 390 Range 64-1300 |
n=8 | Abdallah et al. 2008b |
| United States | ΣHBCD Median 390 Mean 810+/- 1100 Range 110-4000 |
n=13 | Abdallah et al. 2008b |
| United States | ΣHBCD Median 230 Mean (geo) 354 Range <4.5-130 200 |
n=16 | Stapleton et al. 2008 |
| Belgium | ΣHBCD Median 114 Mean 160+/- 169 Range 33-758 |
n=16 | Roosens et al. 2009 |
| United Kingdom | ΣHBCD Median 1300 Mean 8300+/- 26 000 Range 140-140 000 |
n=45 | Abdallah et al. 2008a |
| United Kingdom | ΣHBCD Median 730 Mean 6000+/- 20 000 Range 140-110 000 |
n=31 | Abdallah et al. 2008b |
| Compound | Food (n=12) | Dust (n=9) | Serum (n=9) |
|---|---|---|---|
| α-HBCD | 0.49 ± 0.04 | 0.52 ± 0.02 | 0.28 ± 0.02 |
| ß-HBCD | 0.52 ± 0.02 | 0.48 ± 0.03 | ND |
| γ-HBCD | 0.51 ± 0.03 | 0.50 ± 0.02 | ND |
Note: Chiral signature of all detected isomers in food and dust was racemic or close to it in all samples above LOQ. The (-)α-HBCD was the dominating enantiomer in human serum. Comparison of exposure factors with other studies is not possible as this is the first study to suggest a racemic chiral signature of HBCD in duplicate diets (Roosens et al. 2009).
| Media | Level | Reference |
|---|---|---|
| Indoor air (occupational) | Median 2.1 µg/m3 Range 2-150 µg/m3 |
Thomsen et al. 2007 |
n=33 homes Median=180 pg/m3 n=25 offices Median=170 pg/m3 n=4 micro-environments Median=900 pg/m3 |
Abdallah et al. 2008a | |
| 1.8 pg/m3 for Alert, Tagish (Canadian Arctic) and Dunai, (Russian Arctic) | PWGSC-INAC-NCP 2003 | |
n=9 Range 880-4800 pg/g dry weight |
Harrad et al. (pending) | |
| Dust | n=45 homes Median 1300 ng/g n=28 offices Median 760 ng/g n=20 cars Median 13 000 ng/g n=4 public micro-environments Median 2700 ng/g p< 0.05 total cars >>> total HBCDs in homes and offices |
Abdallah et al. 2008a |
n=31 homes Median 730 ng/g United Kingdom , Birmingham n=13 homes Median 390 ng/g Amarillo/Austin Texas n=8 homes Median 640 ng/g Toronto, Canada n=6 offices United Kingdom , Birmingham Median 650 ng/g Highest U.K. house dust level was 110 000 ng/g |
Abdallah et al. 2008b | |
Median 230 ng/g Range <4.5-130 200 ng/g dry weight |
Stapleton et al. 2008 |
Table 15: European Union Risk Assessment on HBCD
Exposure estimates of the HBCD EU Risk Assessment Report 1,2 (EU RAR 2008)
| Exposure scenario | EU RAR exposure estimate | Reference |
|---|---|---|
| Consumer products | ||
| Oral exposure of children to HBCD from sucking a fabric (50 cm2), one back-coated with HBCD daily for 2 years at 1 hr/day | Exposure estimate = 26 µg/kg-bw/day | US NRC 2000 as cited in EU RAR 2008 |
| Dermal exposure that assumed exposure from furniture upholstery, back-coated with HBCD | Exposure estimated = 1.3 x 10⁻³ µg/kg-bw/day Exposure level was insignificant and not brought forward in the EU RAR risk characterization. |
|
| Inhalation exposure in a room, caused by wear of and evaporation of HBCD from fabric upholstery treated with HBCD | Cindoors of 3.9µg/m3 Assume 60 kg adult , 24 hour exposure, inhalation rate of 20 m3/day , 100% absorption Exposure estimate= 1.3 µg/kg-bw/day Exposure level was insignificant and not brought forward in the EU RAR risk characterization. |
|
| Textile in furniture and curtains | Concentration of HBCD in debris during wear testing (UV-aging and non-aging) was 0.47% HBCD by debris weight | EU RAR 2008 |
| Sub-scenario: oral exposure to dust | Assume 10 kg child eating all dust generated from 2 sofas, 4 m2 textile area, pica behaviour thus 2.5 mg/day Exposure estimate = 1.2 µg/kg-bw/day Exposure level was insignificant and not brought forward in the EU RAR risk characterization. |
|
| Sub-scenario: inhalation exposure | Cindoors= 4.4 µg/m3 Assume 60 kg adult , 24 hour exposure, inhalation rate of 20 m3/day , 100% absorption Exposure estimate= 1.5 µg/kg-bw/day Exposure level was insignificant and scenario construction was unrealistic so it was not brought forward in the EU RAR risk characterization. |
|
| Sub-scenario: oral exposure by mouthing of textile | Assume daily mouthing of 50 cm2 fabric back-coated with HBCD (2mg/cm2), 0.9% release during 0.5 hours, 100% absorption, one mouthing every three days Exposure estimate= 30 µg/kg-bw/day If the back side is not available, exposure becomes 3 µg/kg-bw/day This sub-scenario estimate was carried forward for risk characterization. |
|
| Indoor air exposure from XPS construction boards | Exposure estimate= 0.19 or 0.002 µg/kg-bw/day Exposure level was insignificant and not brought forward in the EU RAR risk characterization. |
|
| Mattress ticking - lying down in a bed on a mattress with flame-retarded ticking | Exposure estimate of 0.01 µg/kg-bw/day Exposure level was insignificant and not brought forward in the EU RAR risk characterization. |
|
| Indirect exposure - regional intake | EUSES model prediction of ~ 5 µg/kg-bw/day | |
| Regional exposure of humans via the environment | Exposure estimate= 20 ng/kg-bw/day was derived from food basket studies. | |
1 The EU RAR concluded that humans are primarily exposed to HBCD mainly by inhalation or ingestion of airborne dust or from direct contact with treated textiles and materials. Inhalation exposure to HBCD vapour is negligible due to HBCD’s low vapour pressure. All these scenarios were found to typically result in insignificant exposures. Indirect exposure via the environment was estimated using EUSES modelling based on measured levels in biota and food. These estimates of exposures were attributed to food basket study data and the ingestion of fish and root crops contaminated with HBCD. Human exposures to HBCD from usage of consumer products or via the environment were concluded to be much lower than occupational exposures. Prenatal and neonatal exposures in utero or via breast feeding were also found to occur.
2 The Scientific Committee on Health and Environmental Risks (SCHER) adopted an opinion on the final Human Health Part of the EU Risk Assessment Report (EU RAR) on HBCD. SCHER members felt that the health part of the EU RAR is of good quality, comprehensive and that the exposure and effects assessment adhere to the EU’s Technical Guidance Document.
Table 16: Summary of Key Toxicity Studies Used in the Assessment of HBCD
| Species, life stage | Test material compo- sition |
Study design | Effect level | Reference |
|---|---|---|---|---|
Daphnia magna, water flea < 24 hours old at test initiation |
93.6% purity |
|
|
CMABFRIP 1998 |
Skeletonema costatum and Thalassiosira pseudonana, marine algae |
compo- sition and purity not provided |
|
|
Walsh et al. 1987 |
Oncorhynchus mykiss, rainbow trout juvenile |
compo- sition and purity not provided |
|
|
Ronisz et al. 2004 |
| Lumbriculus variegates, oligochaete | 95% purity |
|
|
Oetken et al. 2001 |
Hyalella azteca, amphipod Chironomus riparius, chironomid Lumbriculus variegates, oligochaete |
99.99% purity |
|
Results for definitive Hyalella test:
|
ACCBFRIP 2003d, 2003e |
Eisenia fetida, earthworm adult |
99.99% purity |
|
|
ACCBFRIP 2003a |
Zea mays, corn Cucumis sativa, cucumber Allium cepa, onion Lolium perenne, ryegrass Glycine max, soybean Lycopersicon esculentum, tomato |
99.99% purity |
|
|
ACCBFRIP 2002 |
| Rat | 99.99% purity |
|
|
CMABFRIP 2001 |
1 Study identified that the highest concentration tested did not result in statistically significant results. Since the NOEC could be higher, the NOEC is described as being greater than or equal to the highest concentration tested.
2 500 mg/kg-bw dose could not be dissolved completely in peanut oil carrier, and residue was measured in the stomach cavity of test fish during analysis. Analysis confirmed that the fish had taken up most of the test substance; however, dose was considered to probably be less than 500 mg/kg-bw (i.e., < 500 mg/kg-bw).
3 Not detected
4 Value is less than the lowest test concentration used and is therefore considered to be an estimate only.
Table 17: Summary of Data Used in the Risk Quotient Analysis of HBCD
| Pelagic organisms | Benthic organisms | Soil organisms | Wildlife consumers | |
|---|---|---|---|---|
| PEC | 0.00004-0.015 mg/L1 | 0.33-108.2 mg/kg dry weight (dw)1 | 0.021-0.041 mg/kg soil dw6 | 4.51 mg/kg wet weight (ww)9 |
| CTV | 0.0056 mg/L2 | 29.25 mg/kg sediment dw4 | 235 mg/kg soil dw7 | 395 mg/kg food ww10 |
| Assessment factor | 103 | 103 | 103 | 1011 |
| PNEC | 0.00056 mg/L | 6.5 mg/kg sediment dw5 | 10.9 mg/kg soil dw8 | 39.5 mg/kg food ww |
| Risk quotient (PEC/PNEC) | 0.071-10.7 | 0.05-7.11 | 0.002-0.004 | 0.114 |
1 Due to the lack of adequate measured data, PECs were estimated using a fugacity Level III (steady-state) box model described in Appendix B, and in Environment Canada (2009).
2 CMABFRIP 1998.
3 An assessment factor of 10 was applied to account for extrapolation from laboratory to field conditions and interspecies and intraspecies variations in sensitivity.
4 Oetken et al. 2001.
5 The critical toxicity value (CTV) of 29.25 mg/kg dw was obtained using sediments containing 1.8% organic carbon (OC). To allow comparison between the predicted no effects concentration (PNEC) and predicted environmental concentrations ( PECs), the PNEC was standardized to represent sediment with 4% OC.
6 Due to the lack of measured soil data, PECs were calculated for tilled agricultural soil and pastureland based on Equation 60 of the European Commission Technical Guidance Document (TGD; European Communities 2003) and the approach by Bonnell Environmental Consulting (2001):
PECsoil = (Csludge x ARsludge) / (Dsoil x BDsoil)
where:
PECsoil = PEC for soil (mg/kg)
Csludge = concentration in sludge (mg/kg)
ARsludge = application rate to sludge amended soils (kg/m2/yr); default = 0.5 from Table 11 of TGD
Dsoil = depth of soil tillage (m); default = 0.2 m in agricultural soil and 0.1 m in pastureland from Table 11 of TGD
BDsoil = bulk density of soil (kg/m3); default = 1700 kg/m3 from Section 2.3.4 of TGD
The equation assumes no losses from transformation, degradation, volatilization, erosion or leaching to lower soil layers. Additionally, it is assumed there is no input of HBCD from atmospheric deposition and there are no background HBCD accumulations in the soil. To examine potential impacts from long-term application, an application time period of 10 consecutive years was considered. A sludge concentration of 1.401 mg/kg dw reported by Morris et al. (2004) was used as Csludge in the calculation. As the organic carbon content of the sludge was not specified, a standard OC level of 2% (European Communities 2003) was assumed.
7 ACCBFRIP 2003a.
8 The CTV of 235 mg/kg dw was obtained using a soil with 4.3% OC. To allow comparison between the PNEC and PECs, the PNEC was standardized to represent a soil with 2% OC.
9 Tomy et al. 2004a.
10 Due to the lack of data for wildlife species, a lowest observed effect level (LOEL) of 100 mg/kg-bw per day, based on significantly reduced levels of circulating thyroid hormones in rats (CMABFRIP 2001), was selected as the CTV for the evaluation of potential effects in wildlife. This endpoint was considered relevant as disruptions in thyroid hormone homeostasis may alter critical metabolic processes such as development of the central nervous system and cell metabolic rates. Interspecies scaling was applied to extrapolate the total daily intake (TDI) in rats to a concentration of food in mink, Mustela vison, a surrogate wildlife species. The calculation used the typical adult body weight (bw; 0.6 kg) and daily food ingestion rate (DFI; 0.143 kg/d ww) of a female mink to estimate a CTV in mink based on exposure through food (CCME 1998). That is, CTVfood = (CTVTDI in rats x bwmink) / DFImink This equation assumes that all of the substance is exposed via food and that the substance is completely bioavailable for uptake by the organism. An allometric scaling factor of 0.94 (Sample and Arenal 1999) was then applied to this CTV value in order to account for observed higher sensitivities in larger animals (i.e., mink) when compared with smaller ones (i.e., rat). The final CTV, incorporating both interspecies and allometric scaling, is therefore 395 mg/kg food ww.
11 An assessment factor of 10 was applied to account for extrapolation from laboratory to field conditions and from a rodent to a wildlife species.