
Gulf of Maine quarterly climate impacts and outlook: March 2016
Gulf of Maine Region, March 2016
Gulf of Maine Significant Events - December 2015-February 2016
Atmospheric drivers such as El Niño and the Arctic Oscillation played a role in the region’s mild and stormy weather this winter. Numerous significant storms impacted the region, with four of the most powerful described below. There were two main storm tracks: an offshore track near Massachusetts and Nova Scotia and a track northwest of Maine and New Brunswick.
- January 13: A rapidly intensifying storm brought up to 51 cm (20 in.) of snow and wind gusts of up to 92 km/h (57 mph) to Maine and the Maritimes. Southern Maine experienced thundersnow, with snowfall rates of up to 15 cm (6 in.) per hour. A storm surge of more than 100 cm (3 ft.) resulted in minor flooding along the east coast of New Brunswick. Many federal, provincial, and city services were closed. In Nova Scotia, the Trans-Canada Highway was partially shut down and more than 12,000 customers lost power.
- February 8-9: A strong Nor’easter brought blizzard conditions to parts of Massachusetts and southern sections of the Maritimes. Winds gusted to 102 km/h (63 mph), and snow totals were up to 43 cm (17 in.), with the highest amounts in Nova Scotia. Many schools and government offices closed. Transportation services, ferry crossings between New Brunswick and Nova Scotia, and numerous flights were cancelled. Minor to moderate coastal flooding occurred in Massachusetts, with some roads temporarily impassable. The storm further eroded beaches damaged by storms in January.
- February 15-17: Up to 15 cm (6 in.) of snow and 51 mm (2 in.) of rain fell in the region. Up to 6 mm (0.25 in.) of ice accumulated in parts of Maine. Wind gusts to 124 km/h (77 mph) downed trees and powerlines, and damaged houses. More than 20,000 customers lost power in Maine. Rain and snowmelt flooded roads, while ice jams caused flooding along the Kennebec River in Augusta, ME, and along the Salmon River in Truro and Bible Hill, NS. Lightning also accompanied the storm. Several stations in New Brunswick broke daily maximum temperature and/or precipitation records.
- February 24-25: The region received up to 20 cm (8 in.) of snow and up to 50 mm (2 in.) of rain. Freezing rain fell for up to 19 hours in parts of New Brunswick, and up to 1.8 cm (0.7 in.) of ice accumulation was reported in Maine. The storm also produced frequent lightning over parts of New England and New Brunswick. Wind gusts of up to 134 km/h (83 mph) downed trees and wires, resulting in tens of thousands of power outages and closed roads. Many sites set daily high temperature records on the 25th. Yarmouth, NS, and Saint John, NB, set a new record for warmest day in February. Several sites also set new highest daily precipitation records for February.

Long description for significant events map
The map of the Gulf of Maine Region, including the eastern half of Massachusetts, New Hampshire, Maine, New Brunswick, Nova Scotia, Prince Edward Island, and the nearby marine areas, highlights significant events that occurred in the winter of 2016. The following highlights are noted:
- Many sites had their warmest December on record. With above-normal temperatures in January and February too, some sites also had a record-warm winter.
- Several major storms brought heavy precipitation, strong winds, and flooding to the region during winter.
- Sea surface temperatures in the Gulf of Maine remained above normal during winter.
Regional Climate Overview - December 2015-February 2016
Temperature
Departure from Normal
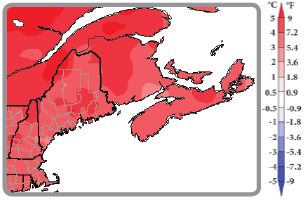
Long description for map of temperature departure from normal
Map of the temperature departure from normal for the Gulf of Maine region averaged over December 2015 and January and February 2016. The map shows that when averaged over the 3 winter months, most parts of the Gulf of Maine states were 4° to 5° C above normal. There were small areas with higher anomalies, above 5° C above normal, including over extreme northeastern Maine, central Maine, and northern New Hampshire. The Cape Cod area was 3° to 4° C above normal. Northwestern New Brunswick, parts of northern and eastern mainland Nova Scotia, and eastern Prince Edward Island were 4° to 5° C above normal. Much of the rest of the 3 Maritime provinces was 3° to 4° C above normal. The exceptions were part of southeastern New Brunswick, the Cape Chignecto area of Nova Scotia, and eastern Cape Breton, with temperatures 2° to 3° C above normal.
December was extremely mild for the entire region. Temperatures were up to 6°C (11°F) above normal. The three states had a record warm December, as did numerous sites. The entire region was warm again in January, with temperatures up to 5°C (9°F) above normal. The warmest areas were in northern New Brunswick and Maine. In February, with the exception of a brief Arctic outbreak, temperatures continued to be above normal. Most areas were 1°C (2°F) to 5°C (9°F) above normal, with the warmest spots in northern Nova Scotia and eastern Prince Edward Island. Winter (averaged over December, January, and February) was warm region-wide, with temperatures 2°C (4°F) to 5°C (9°F) above normal. The three states had their warmest winter on record, as did several sites, such as Caribou, ME, Concord, NH, Fredericton, NB, and Moncton, NB.
Precipitation
Percent of Normal
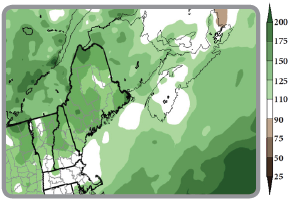
Long description for map of precipitation as percent of normal
Map of total precipitation as a percent of normal total precipitation, summed over the 3 months of December 2015 and January and February 2016, for the Gulf of Maine region. Northern and central New Hampshire, the Cape Cod area of Massachusetts, much of Maine, New Brunswick, western Prince Edward Island, and parts of Nova Scotia received above normal precipitation, ranging from 110% to 175% of normal. Parts of northern Maine and Downeast Maine received 175 % to 200% of normal. Near normal amounts are shown over southern New Hampshire, eastern Massachusetts, eastern Prince Edward Island, northern parts of Cape Breton, and parts of the southern half of Nova Scotia.
December precipitation ranged from 110-200% of normal for most of the region. Some areas of western Maine saw precipitation amounts in excess of 200% of normal, while parts of Cape Breton, NS, saw less, from 75-90% of normal. January was drier, with most areas seeing 50-90% of normal precipitation. A few spots in New Brunswick saw 25-50% of normal, while Cape Cod, MA, and parts of southern Maine saw 110-150% of normal. Numerous storms led to above-normal precipitation for most areas in February. Precipitation generally ranged from 110% to more than 200% of normal, with the wettest areas in northern Maine and New Brunswick. Winter precipitation ranged from near normal to 175% of normal.
Temperature and precipitation normals based on 1981-2010. Canada and ocean precip data: Canadian Precipitation Analysis. U.S. precipitation data: interpolated station data.
Sea Surface Temperatures
Departure from Normal
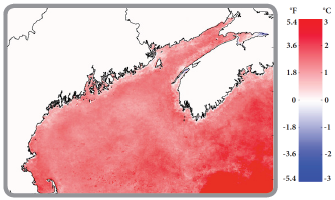
Long description of map of sea surface temperature departure from normal
Map of total precipitation as a percent of normal total precipitation, summed over the 3 months of December 2015 and January and February 2016, for the Gulf of Maine region. Northern and central New Hampshire, the Cape Cod area of Massachusetts, much of Maine, New Brunswick, western Prince Edward Island, and parts of Nova Scotia received above normal precipitation, ranging from 110% to 175% of normal. Parts of northern Maine and Downeast Maine received 175 % to 200% of normal. Near normal amounts are shown over southern New Hampshire, eastern Massachusetts, eastern Prince Edward Island, northern parts of Cape Breton, and parts of the southern half of Nova Scotia.
Winter sea surface temperature anomalies in the Gulf of Maine were substantially warmer than the winter long-term average over the entire study area. Temperatures over coastal areas of Maine, New Brunswick, and Nova Scotia were 0.5°C (1°F) to 1.0°C (2°F) above normal. Off the coast of Massachusetts, temperatures were up to 2°C (4°F) above normal. Temperatures were 1.0°C (2°F) to 2.0°C (4°F) warmer than normal over deeper basins in the central Gulf of Maine and the entire Scotian Shelf. These warm anomalies continue a region-wide continuous warm surface ocean period that began in September 2015.
Sea surface temperature anomalies based on 1985-2014. Mean SST anomalies from NOAA AVHRR data. Credit: University of Maine School of Marine Sciences and NERACOOS
Regional Impacts - December 2015-February 2016
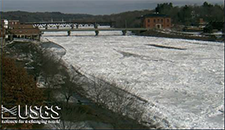
An ice jam in mid-February caused flooding along the Kennebec River in Augusta, ME. Ice out on the lower part of the river was earlier than usual. Courtesy: U.S. Geological Survey
Long description
The photograph of the Kennebec River in Augusta, ME shows broken and jumbled ice covering nearly all parts of the river from bank to bank, including under two bridges shown in the background. Narrow sections of open water are shown along the bank on the left side of the river.
Warm Winter
Mild temperatures during winter had numerous impacts. Some U.S. golf courses saw an increase in business in December, while a few Maritime courses opened earlier than usual this spring. Business slowed for winter recreation venues and winter gear retailers. In fact, several ski resorts opened late or had limited trails open. The Mount Washington Auto Road in New Hampshire opened for guided auto tours in late December for the first time in (at least) 35 years. In the U.S., the warmth allowed some crops to be harvested later into December, but caused other plants to bloom early. The warm temperatures also caused maple sap to start flowing, leading to an early start for syrup production. In early February, ice development around Prince Edward Island (P.E.I.) was about three weeks behind normal, which was good for marine shipping. Outdoor ice rinks in Charlottetown and Stratford, P.E.I., were closed in early February, while only one of eight rinks in Fredericton, NB, was operating. The above-normal temperatures left many lakes and waterways unfrozen or with unsafe ice conditions. Several ice fishing tournaments were cancelled or postponed in New Hampshire and Maine. Ice on the Saint John River at Fredericton broke up on February 21, which was the second earliest break up since 1825. In the three states, transportation departments performed roadwork and continued construction projects longer into the season, as well as saved money on snow removal, fuel, and personnel costs. Home heating costs were also down, in part due to the warm weather.
Seasonal Snowfall
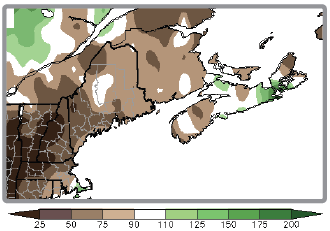
Percent of normal snowfall for winter (accumulated from December to February).
Long description
The map shows seasonal snowfall total (summed over the 3 months from December 2015 to February 2016) as a percentage of the totals of the normal amounts for these 3 months, for the Gulf of Maine region. Details are provided in the text.
December snowfall ranged from less than 75% of normal in Massachusetts, New Hampshire, and southern Maine to more than 150% of normal in parts of New Brunswick and P.E.I. At the end of December, average snow on the ground in the Maritimes was near to above normal. January snowfall was 25-90% of normal for most of New England, New Brunswick, and P.E.I. However, Cape Cod, MA, and much of Nova Scotia saw more than 125% of normal. Snow on the ground at the end of January was below normal in New Brunswick and P.E.I, but above normal in Nova Scotia. In February, coastal New England and much of the Maritimes saw more than 110% of normal snowfall, while inland areas of New England saw less than 90% of normal. While snowfall was above normal, it did not remain on the ground for extended periods of time due to warm temperatures. In the Maritimes, snow on the ground at the end of February was below normal. Winter snowfall ranged from 50-90% of normal for most of New England. In New Brunswick and P.E.I., winter snowfall ranged from 75-125% of normal, while Nova Scotia and Cape Cod, MA, saw 50-175% of normal.
Regional Outlook - Spring 2016
El Niño

Long description for the graph of the probabilistic ENSO forecast
The graph shows the consensus probabilistic ENSO (El Nino Southern Oscillation) Forecast issued in early March by the US Climate Prediction Center and the International Research Institute for Climate and Society. Bar graphs of the probability of El Nino conditions, over 3 month intervals for 2016, shows very high probabilities (nearly 100%) of El Nino in the early part of the year, gradually decreasing to less than 50% for the May June July period and to less than 10% by fall. Bar graphs of the probability of neutral conditions are very low in the early months, increasing in late spring/early summer to about 50%, then slowly decreasing. The probability of La Nina conditions increases through the summer to over 50% for the fall months. The climatological probabilities of these 3 conditions are also shown. Based on climatology, the probability of neutral conditions is highest (above 50%) through most of the year, decreasing to 40% or less in the fall. The climatological probabilities of El Nino and La Nina are lower, at 20 to 30% for much of the year, increasing to above 30% by the end of the year.
While sea surface temperatures in the equatorial Pacific Ocean peaked in late 2015, atmospheric and oceanic observations during February indicated that the strong El Niño event continues. El Niño conditions and impacts will weaken during spring, with a transition to ENSO-neutral conditions by early summer. An El Niño is frequently followed by a La Niña. Most computer models indicate a transition to La Niña is somewhat likely by winter 2016-17. (Above graphic courtesy: International Research Institute for Climate and Society/NOAA).
Spring Flood Potential
The potential for river flooding during spring is near to below normal for most of New England. In mid-March, river levels and soil moisture were near to above normal, but snowpack and snow water equivalent were below normal. In northwest Maine, where snowpack and river ice lingered, the river flood and ice jam flood potential is near to above normal. Very heavy rain can cause flooding at any time of the year, even in areas that have little to no snow on the ground.
Temperature and Precipitation
For March through May, NOAA’s Climate Prediction Center and Environment and Climate Change Canada are both calling for an increased chance of above-normal temperatures for the entire Gulf of Maine region. Both groups are predicting equal chances of below-, near-, or above-normal precipitation in the region for spring.
Environment and Climate Change Canada map produced on February 29.
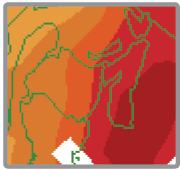
Long description of map of probability of above normal temperature produced by Environment and Climate Change Canada
The map shows probability for above normal temperatures for March to May. The probability is over 50% for the Maritimes. Probabilities are over 50% for northwestern New Brunswick, increasing toward the southeast to over 80% for Nova Scotia and eastern Prince Edward Island.
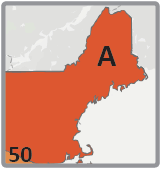
U.S. Climate Prediction Center map produced on February 18.
Long description of map of probability of above normal temperature produced by US Climate Prediction Center
The map shows probability of above normal temperatures for March to May. The probability is over 50% for all the Gulf of Maine states.
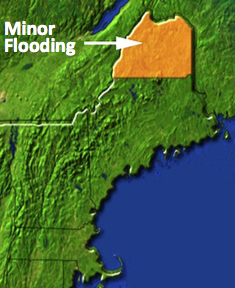
Long description of map of spring flood potential
The map covers the New England states. It shows there is a risk of exceeding minor river flood levels only over Northern Maine.
Gulf of Maine Region Partners
- Environment and Climate Change Canada
- Northeast Regional Climate Center
- National Oceanic and Atmospheric Administration
- Gulf of Maine Research Institute
- State Climatologists
- National Integrated Drought Information System
- Cooperative Institute for the North Atlantic Region
- Gulf of Maine Council on the Marine Environment, Climate Network
- Northeastern Regional Association of Coastal and Ocean Systems
- University of Maine, School of Marine Sciences
Contacts
NOAA:
Ellen Mecray
Samantha Borisoff
Environment and Climate Change Canada:
1-800-668-6767 (in Canada only)
819-997-2800 (long-distance charges apply)
Sign up to receive this publication every quarter.