
Gulf of Maine quarterly climate impacts and outlook: March 2017
Gulf of Maine Region
March 2017
Gulf of Maine Significant Events - December 2016-February 2017
Drought conditions lingered but slowly improved during winter in New England and parts of the Maritimes. By early January, extreme drought had eased in eastern Massachusetts and New Hampshire. By late January, severe drought had eased in eastern Massachusetts and Maine, while moderate drought had eased in New Brunswick and much of Nova Scotia. Conditions continued to improve in Maine during February. See Impacts section for more details.
Three blizzards affected the region in February. The first storm brought up to 61 cm (24 in.) of snow and wind gusts of up to 113 km/h (70 mph) from February 9-10. Blizzard conditions occurred for several hours in eastern Massachusetts and southern New Brunswick. Snowfall rates of 5-8 cm (2-3 in.) per hour were reported in New England, as was thundersnow. The second storm brought up to 102 cm (40 in.) of snow and wind gusts of up to 146 km/h (91 mph) from February 12-14. There was at least one location in every Maine county that saw at least 61 cm (24 in.) of snow. Blizzard conditions occurred in Nova Scotia and southeastern New Brunswick for 6-10 hours. All public roads in central and southern New Brunswick were restricted to emergency vehicles only. Plowing operations in portions of New Brunswick and Maine were temporarily suspended due to poor conditions. More than 100,000 customers lost power in the region. From February 15-16, the third storm brought up to 60 cm (24 in.) of snow and wind gusts of up to 80 km/h (50 mph). Blizzard conditions occurred in parts of New Brunswick for 6-9 hours. On February 16, Andover, ME, had 201 cm (79 in.), or 2 m (6.6 ft.), of snow on the ground, which was the second greatest one-day snow depth on record for Maine. Due to the storms, February snowfall totaled over 1 m (3 ft.) for many areas in the three provinces and Maine.
A major ice storm brought mixed precipitation and wind gusts of more than 100 km/h (62 mph) from January 24-26. Southern New Brunswick experienced 6-12 hours of freezing rain. Northern New Brunswick experienced a prolonged freezing rain event, with some coastal areas reporting 24-30 hours of freezing rain and up to 50 mm (2 in.) of ice accumulation. See Impacts section for details.
A powerful storm brought mixed precipitation and wind gusts of up to 158 km/h (98 mph) to the region from December 29-31. Thundersnow was reported in parts of New England. Snowfall rates were up to 15 cm (6 in.) per hour. The greatest snow totals of up to 69 cm (27 in.) were reported in Maine, where more than 100,000 customers lost power. The weight of the snow caused an air-supported indoor practice dome at the University of Maine to collapse. More than 45,000 customers lost power in the Maritimes. Strong winds and storm surge washed up a large number of lobsters, crabs, and clams on the beach in Val-Comeau, NB.
Long description
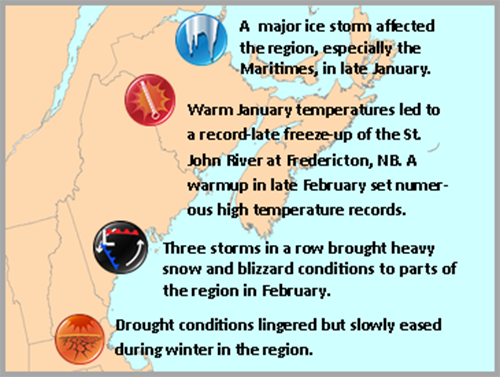
Map of the Gulf of Maine Region, including the eastern half of Massachusetts, New Hampshire, Maine, New Brunswick, Nova Scotia, Prince Edward Island, and the nearby marine areas, highlighting key significant events that occurred in the winter of 2016-2017 (December 2016 to February 2017). The highlights are as follows:
- A major ice storm affected the region, especially the Maritimes, in late January.
- Warm January temperatures led to a record-late freeze-up of the St. John River at Fredericton, NB. A warmup in late February set numerous high temperature records.
- Three storms in a row brought heavy snow and blizzard conditions to parts of the region in February.
- Drought conditions lingered but slowly eased during winter in the region.
Regional Climate Overview - December 2016-February 2017
Temperature
Long description
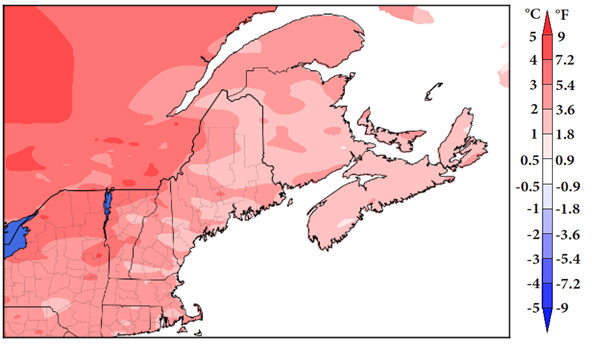
Map of the Gulf of Maine Region showing the temperature departure from normal, averaged over December 2016 to February 2017. Temperatures were above normal across the entire region. Most of the Maritimes and eastern Maine generally averaged 1°C to 2°C above normal. Northern New Brunswick and the rest of New England generally averaged 2°C to 3°C above normal.
Winter temperatures (average of December- February) were 1°-3°C (2°-5°F) above normal.
December temperatures ranged from 2°C (4°F) below normal to 2°C (4°F) above normal, with most areas within 1°C (2°F) of normal.
January temperatures were 1°-5°C (2°-9°F) above normal. January’s warmth contributed to the St. John River at Fredericton, NB, having its latest freeze-up (since 1825) on February 2, 2017. In 2016, the river had its second earliest ice break up (Feb. 20), resulting in the longest open water season (348 days) in more than 190 years.
February temperatures were 1°-3°C (2°-5°F) above normal. From February 23-26, more than 60 max temperature records were set, with some sites setting records three days in a row. With highs near 20°C (68°F), Boston, MA; Concord, NH; and Greenwood, NS, had their warmest February day on record on the 24th or 25th.
Precipitation
Long description
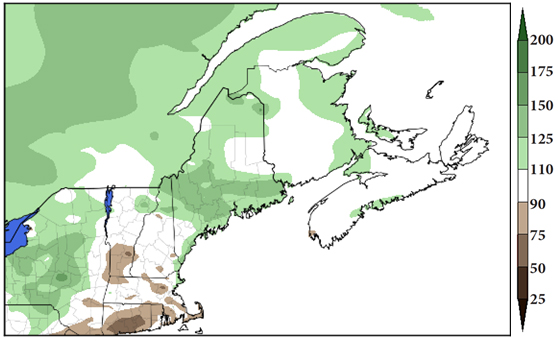
Map of the Gulf of Maine region showing the total precipitation as a percentage of normal precipitation, averaged over December 2016 to February 2017. Above normal precipitation was measured over much of Maine, eastern New Brunswick, and parts of Prince Edward Island. Elsewhere in the Maritimes, and in New Hampshire, precipitation totals averaged near normal. Parts of Massachusetts received less precipitation than normal.
Winter precipitation (accumulated from December-February) ranged from 75% of normal in parts of eastern Massachusetts to 150% of normal in portions of Maine, with most areas seeing near to above-normal precipitation.
December precipitation ranged from 50% of normal in southeastern Massachusetts, southern New Brunswick, and northern Nova Scotia to 150% of normal in the western half of Maine.
January precipitation ranged from 50% of normal in central and southern New Hampshire to 200% of normal in central Maine.
In February, precipitation ranged from 50% of normal in Cape Cod, MA and northwestern New Brunswick to 175% of normal in parts of Maine.
Temperature and precipitation normals based on 1981-2010.
Sea Surface Temperature
Long description
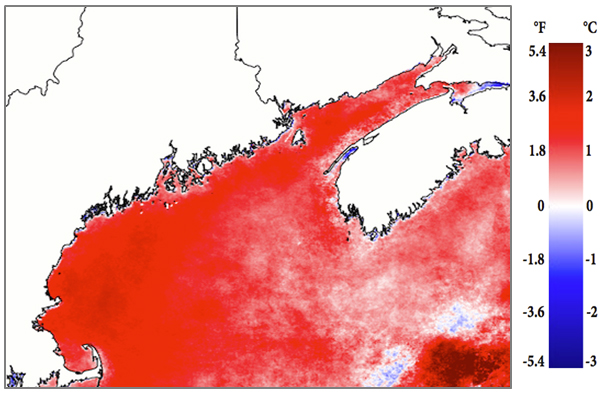
Map of the departure from normal of sea surface temperatures for the Gulf of Maine region, covering the Bay of Fundy, the Gulf of Maine, and waters south of Nova Scotia, over the winter (averaged over December 2016 to February 2017). Sea surface temperatures were warmer than the long term average for these months over the entire area. Details are described in the main text.
Winter sea surface temperature anomalies in the Gulf of Maine were warmer than average over most of the region (except the eastern Minas basin and some Gulf Stream-influenced regions outside the Gulf of Maine). Temperatures over coastal areas of eastern Maine, New Brunswick, and Nova Scotia were 0.5°C (0.9°F) to 1.5°C (2.7°F) above average. Off the coast of western Maine, Massachusetts, and in Wilkinson basin, temperatures were 2.0°C (3.6°F) above average. Temperatures were 0.5°C (0.9°F) to 1.5°C (2.7°F) above average over Jordan basin, in the central Gulf of Maine, and Scotian Shelf. There was a general trend of warmer anomalies in western portions of the central Gulf of Maine. These warm anomalies continue a region-wide warm surface ocean period that began in September 2015.
Sea surface temperature anomalies based on 1985-2017. Mean SST anomalies from NOAA AVHRR data. Credit: University of Maine School of Marine Sciences and NERACOOS
Regional Impacts - December 2016-February 2017
Drought

Long description
February 2017 North American Drought Monitor map over the New England and the Maritimes. The map shows the intensity of abnormally dry or drought conditions in five categories: D0 abnormally dry, D1 drought - moderate, D2 drought - severe, D3 drought - extreme, and D4 drought - exceptional. The map shows moderate to severe drought conditions over Massachusetts and the southern half of New Hampshire. Southwestern Nova Scotia had abnormally dry to moderate drought conditions. Northern New Hampshire, southern Maine and Downeast Maine, and parts of New Brunswick were abnormally dry.
Long description
Left to right, top row:
- US Department of Agriculture
- National Drought Mitigation Center
- Comisión Nacional del Agua (Mexican National Commission of Water)
Left to right, bottom row:
- Department of Commerce, USA
- NOAA: National Oceanic and Atmospheric Administration, US Department of Commerce
- Agriculture and Agri-Food Canada
- Environment and Climate Change Canada
Streamflow on New England’s waterways was near to below normal in December and near to above normal in January and February. Streamflow also returned to near to above normal in the Maritimes. Groundwater and reservoir levels increased slowly during winter, returning to near normal in some areas, but remaining below normal in other areas. For instance, the Emergency Declaration issued for Ipswich, MA, in mid- September due to a water supply shortage was terminated on January 26 because the town’s water supply had recharged. However, the Massachusetts Water Resources Authority continued to urge its customers to conserve water as the Quabbin Reservoir hovered just below normal capacity since mid-November.
January 24-26 Ice Storm
A major ice storm affected the region in late January. Up to 50 mm (2 in.) of ice accumulated in New Brunswick, downing trees, poles, and wires. NB Power estimated up to 400 power poles were brought down and in need of replacement. More than 200,000 NB Power customers lost power, surpassing Hurricane Arthur in 2014 to become the worst crisis in NB Power history. Some customers were without power for up to 12 days. Residents of Port Elgin and Miramichi were asked to conserve water until power was restored to the communities’ pumps, while water and food supplies ran low in Tracadie. Gas stations with power had long lines, with some running out of gas. Two died and 45 people were hospitalized for carbon monoxide poisoning. Several communities declared a state of emergency and the military provided assistance. About 12,000 customers in Nova Scotia and 1,600 Maritime Electric customers in PEI lost power. In New England, wind gusts of up to 100 km/h (62 mph) and rough seas caused coastal flooding and beach erosion. Caribou, ME received 106.7 mm (4.2 in.) of sleet. The National Weather Service said, “It was likely one of the biggest sleet storms in northern Maine during the past 75 years.” At least 4,500 customers lost power in Maine.

Long description
The photograph of ice on a power pole shows thick ice on the pole as well as ice coating two cross pieces.
Seasonal Snowfall
December snowfall ranged from near normal to more than 200% of normal, except in eastern Massachusetts, which saw less. In a news report, the National Weather Service estimated that "most roofs in northern and central Maine have 60-90% of the total weight they are designed to handle...", which is more typical of late February. In January, snowfall ranged from less than 25% of normal to near normal, except in Cape Cod, which saw more. In February, snowfall ranged from near normal to more than 200% of normal, except in northern New Brunswick, which saw less. The snowfall boosted business for Maine ski resorts. Winter snowfall (accumulated from December-February) ranged from 75%-200% of normal.
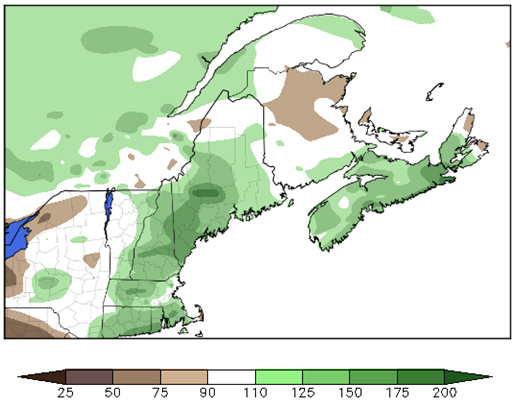
Long description
The map shows seasonal snowfall total (summed over the 3 months from December 2016 to February 2017) as a percentage of the normal for New England and the Maritimes. The seasonal snowfall was above normal over most of New England and Nova Scotia and near or below normal in most of New Brunswick and Prince Edward Island.
Regional Outlook - Spring 2017
ENSO
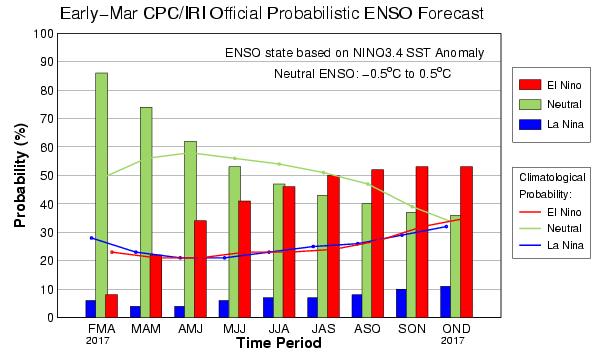
Long description
Graph of the official probabilistic El Niño Southern Oscillation (ENSO) forecast, issued in early March by the US Climate Prediction Center (CPC) and the International Research Institute (IRI) for Climate and Society.
Bar graphs show the probability over 3 month intervals of each ENSO condition (El Niño, neutral, and La Nina), with bars in red, green, and blue, respectively. The climatological probabilities of these 3 conditions are shown as line graphs of the corresponding colour.
The intervals range from late winter/early spring (February- March- April 2017) to the fall/early winter (October-November-December 2017).
The bar graphs show that neutral conditions are the most probable (probability over 80%) at the beginning of the period in late winter/early spring. That is much higher than the climatological probability of 50% for neutral conditions. The probability of neutral conditions decreases steadily over the year falling to near the climatological value by the last time period (October-November-December 2017).
The probability of El Nino conditions increases over the year. It becomes approximately the same as the probability of neutral conditions in the summer (June-July-August). After that an El Nino is the most probable condition. The probability for El Nino is about 55% for most of the months of fall months. The climatological probability of El Nino in these months is less, ranging from 30 to 40%.
The probability of La Nina is low throughout the year, remaining below 10% except near 10% for the fall and early winter. That is much lower than the climatological probability of La Nina, which ranges from a low of 20 % in the spring to about 30% in the late fall, winter, and early spring.
In February, sea surface temperatures in the equatorial Pacific Ocean and atmospheric conditions indicated ENSO-neutral conditions were present. NOAA’s Climate Prediction Center indicates there is around a 60% chance that ENSO-neutral conditions will continue through spring. After that, the chances of El Niño increase to around 50% by autumn.
Spring Flood Potential
With near to below-normal precipitation this winter, the flood threat during spring is low in southern New Hampshire and Massachusetts. For much of Maine and northern New Hampshire, minor flooding is possible due to a deep snowpack and extensive river ice. Very heavy rain can cause flooding at any time of the year, even in areas experiencing drought or that have little to no snow on the ground.
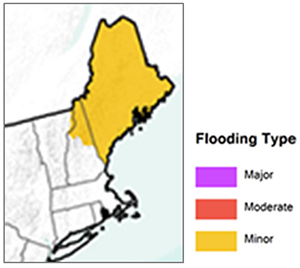
Long description
The map shows the river flood potential during spring. There is the potential for minor flooding in northeastern New Hampshire and all of Maine, with little potential for flood elsewhere in New England.
Temperature and Precipitation
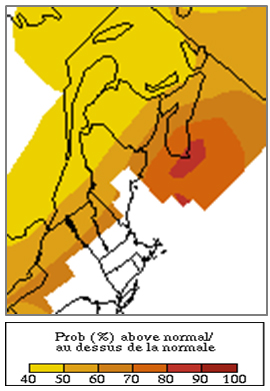
Long description
The map shows the probability of above-normal temperatures, averaged over March to May 2017, over the Maritime Provinces. It shows that the probability of above-normal temperatures is at least 40% over all of the Maritimes. The probability is 70 to 80% in southwestern Nova Scotia. It is 40 to 50% over the northern half of New Brunswick, and between 50 to 70% over the rest of the Maritimes.
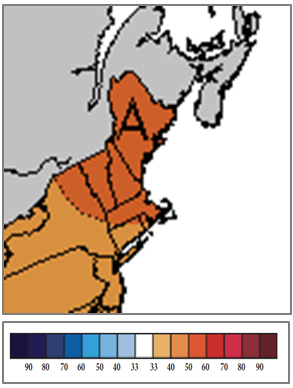
Long description
The map shows the probability of above-normal temperatures, averaged over March to May 2017, over New England. It shows that there is at least 40% probability of above-normal temperatures over all of Massachusetts, New Hampshire, and Maine.
Drought
The U.S. Drought Outlook for March 16-June 30, 2017 indicates that drought conditions are expected to ease in Maine and eastern Massachusetts. Drought conditions are expected to remain but improve for much of southern New Hampshire.
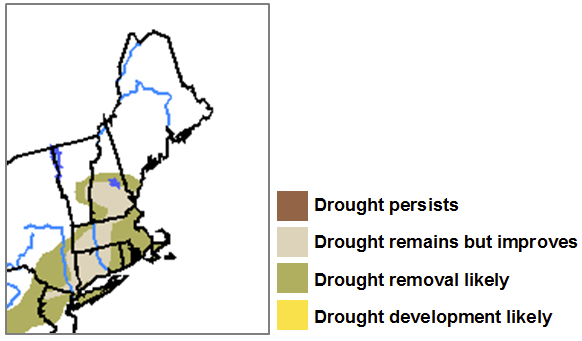
Long description
Map of the U.S. Drought Outlook for the New England states for March 15 - June 30, 2017. It shows the probability of drought over the next four months in four categories: drought persists, drought remains but improves, drought removal likely, and drought development likely. Over the next few months it shows that drought remains but improves, or drought removal is likely, over the south half of New Hampshire and Massachusetts. There is no drought indicated for northern New Hampshire or Maine.
Gulf of Maine Region Partners
- Environment and Climate Change Canada
- Northeast Regional Climate Center
- National Oceanic and Atmospheric Administration
- Gulf of Maine Research Institute
- State Climatologists
- National Integrated Drought Information System
- Cooperative Institute for the North Atlantic Region
- Gulf of Maine Council on the Marine Environment, Climate Network
- Northeastern Regional Association of Coastal and Ocean Systems
- University of Maine, School of Marine Sciences
Contacts
NOAA:
Ellen Mecray
Samantha Borisoff
Environment and Climate Change Canada:
1-800-668-6767 (in Canada only)
819-997-2800 (long-distance charges apply)
ec.enviroinfo.ec@canada.ca
To receive this publication every quarter, sign up at http://www.gulfofmaine.org/2/climate-network-climate-outlook.