
Gulf of Maine quarterly climate impacts and outlook: September 2016
Gulf of Maine Region, September 2016
Gulf of Maine Significant Events - June - August 2016
Parts of the region saw well below normal precipitation this summer. Five Nova Scotia sites had their second driest June on record. Boston, MA and three sites in southwestern Nova Scotia, including Yarmouth, had their driest summers on record. The lack of rain contributed to drought conditions across the region. See the Impacts section for more details.
Numerous severe thunderstorm events occurred in the region during summer.
- Over 100 mm (4 in.) of rain, which is more than a month’s worth, fell in northeastern New Brunswick from June 7-8. This led to road closures and erosion in the Campbellton area. More than 150 mm (6 in.) of rain washed out a network of dirt and gravel roads in Somerset County, ME on June 28, making it difficult for home owners and emergency and fire personnel to access camps in the area. On June 29, more than 70 mm (2.75 in.) of rain fell in 2 hours resulting in flash flooding in the Edmundston, NB area.
- On July 18, severe thunderstorms produced wind gusts of up to 145 km/h (90 mph), two EF-0 tornadoes, and golfball-sized (4.4 cm, 1.75 in.) hail in the three states. Hundreds of trees were snapped or uprooted. Thunderstorms on July 23-24 knocked out power for up to 28,000 customers in Nova Scotia. Flooding severely damaged streets in Montague, PEI, and four people were struck by lightning in the Maritimes. An unconfirmed tornado touched down in Woodstock, NB on July 28, uprooting trees and damaging crops.
- A severe thunderstorm caused significant wind damage to eight campers and other structures in Tracadie-Sheila, NB on August 4. An unconfirmed tornado blew a large trailer off its blocks in Grand Mira, NS on August 7. Thunderstorm winds of up to 145 km/h (90 mph) downed dozens of trees in Cumberland County, ME on August 12. An EF-1 tornado damaged 39 houses and downed trees in Middlesex County, MA on August 22. According to the storm report, the trees were likely weakened by the drought.

Long description
Map of the Gulf of Maine Region, including the eastern half of Massachusetts, New Hampshire, Maine, New Brunswick, Nova Scotia, Prince Edward Island, and the nearby marine areas, highlighting key significant events that occurred in the summer of 2016 (June, July, and August).
The highlights are as follows:
- Thunderstorms produced damaging winds and flash flooding during summer.
- August temperatures were well above normal in New England.
- Drought conditions intensified in parts of the region during summer. See Impacts section for details.
Heat warnings were issued in New Brunswick during a significant heat wave from July 11-16. Observed temperatures were above 30°C (86°F), but with the humidity, it felt like 35-40°C (95-104°F). Boston, MA had twelve days with a high of at least 32°C (90°F) in July and Concord, NH had ten such days, six more than average for both sites.
Boston, MA had its warmest August on record, while several other New England sites ranked this August among their top five warmest. Summer 2016 also ranked among the top five warmest on record for several sites.
Regional Climate Overview - June - August 2016
Temperature
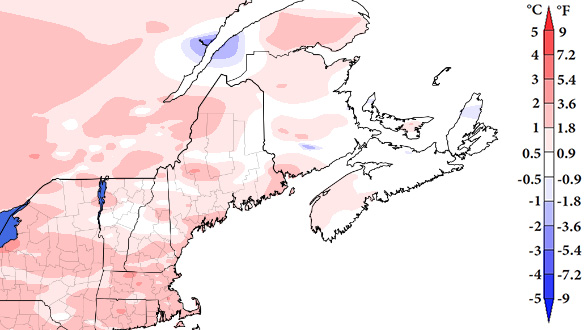
Long description
Map of the Gulf of Maine Region showing the temperature departure from normal averaged over June, July, and August 2016. Temperatures were generally near normal over the eastern half of the Maritimes. Shades of pink show that the New England states, parts of New Brunswick, and the western half of Nova Scotia were above normal. The seasonal anomaly was up to 2 degrees Celsius, except up to 3 degrees Celsius above normal in Massachusetts.
Summer temperatures (averaged over June, July, and August) generally ranged from near normal to 2°C (4°F) above normal. Massachusetts, southern New Hampshire, and parts of Maine were the warmest spots. June average temperatures were within 1°C (2°F) of normal for most of the region. July average temperatures were generally within 1°C (2°F) of normal in New Brunswick and Prince Edward Island, but ranged from near normal to 2°C (4°F) above normal in Nova Scotia and the three states. August average temperatures ranged from near normal to 3°C (5°F) above normal. Eastern Massachusetts was the warmest area. In fact, the state had its warmest August on record.
Precipitation
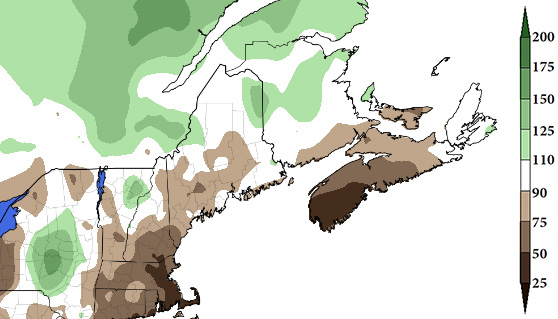
Long description
Map of the Gulf of Maine region showing the total precipitation as a percentage of normal precipitation over the summer of 2016 (averaged over June, July, and August). Shades of brown show that much of the region received less rain than normal. There was less than 50% of the normal amount in eastern Massachusetts and southwestern Nova Scotia, and 50% to 75% or 75% to 90% of normal in other parts of New England, southern New Brunswick, mainland Nova Scotia, and Prince Edward Island. Shades of light to medium green over northern and central New Brunswick and northeastern Maine show that these areas had more rain than normal (110% to 125% or 125% to 150% of normal).
Summer precipitation (accumulated from June through August) ranged from 25% of normal in eastern Massachusetts and southwestern Nova Scotia to 150% of normal in northeastern Maine. June precipitation ranged from less than 25% of normal to near normal for most of the region. However, precipitation in New Brunswick ranged from 75% of normal in southwestern areas to more than 200% in northeastern areas. July precipitation generally ranged from 25% of normal to near normal for Prince Edward Island, New Brunswick, New Hampshire, and Massachusetts. Precipitation in Maine and Nova Scotia varied, generally ranging from 50-150% of normal. August precipitation ranged from 25% of normal in parts of Nova Scotia and southeastern Massachusetts to 175% of normal in parts of central New Brunswick and northern Maine.
Temperature and precipitation normals based on 1981-2010. Canada and ocean precip data: Canadian Precipitation Analysis. U.S. precipitation data: interpolated station data.
Sea Surface Temperature

Long description
Map of the departure from normal of sea surface temperatures over the summer (averaged over June, July, and August) for the Gulf of Maine region, covering the Bay of Fundy, the Gulf of Maine, and waters south of Nova Scotia. Shades of pink to red over nearly all water areas show that surface waters were warmer than normal. The largest anomalies were over the deeper basins, especially in the western Gulf of Maine and Scotian Shelf (south of Nova Scotia), with surface waters more than 1.5 degrees Celsius higher than normal.
Summer sea surface temperature anomalies in the Gulf of Maine were warmer than the summer long-term average over the entire region. These warm anomalies were strongest (greater than 1.5°C, 3°F) over the deeper basins, especially in the western Gulf of Maine and on the Scotian Shelf, and weaker (less than 1.0°C, 2°F) in shallower coastal regions and in the Bay of Fundy. These region-wide warm conditions continue from those that were present in fall, winter, and spring of 2015- 2016. The warm ocean temperatures likely contributed to a large die-off of puffin chicks on Machias Seal Island, which is home to the largest puffin colony in the Gulf of Maine.
Sea surface temperature anomalies based on 1985-2014. Mean SST anomalies from NOAA AVHRR data. Credit: University of Maine School of Marine Sciences and NERACOOS
Regional Impacts - June - August 2016

Long description
Map of the intensity of drought over the Gulf of Maine region. The legend shows 5 possible categories: abnormally dry and drought - moderate, severe, extreme, or exceptional. Shades of yellow and beige over western and central Nova Scotia, southern New Brunswick, Prince Edward Island, southern Maine, and New Hampshire show these areas had abnormally dry to moderate drought conditions. Brown and red areas over southern Maine, southeast New Hampshire and Massachusetts show conditions of severe or extreme drought.

Long description
Left to right, top row:
- US Department of Agriculture
- National Drought Mitigation Center
- Comisión Nacional del Agua (Mexican National Commission of Water)
Left to right, bottom row:
- Department of Commerce, USA
- NOAA: National Oceanic and Atmospheric Administration, US Department of Commerce
- Agriculture and Agri-Food Canada
- Environment and Climate Change Canada
North American Drought Monitor for August shows moderate to extreme drought in parts of New England, Nova Scotia, and PEI.

Summer Dryness
New England started summer with abnormally dry conditions, but ended summer with areas of moderate, severe, and extreme drought. It is the first time Massachusetts and New Hampshire had extreme drought conditions since at least 2000, which is when U.S. Drought Monitor data began. Parts of Prince Edward Island (P.E.I.) and Nova Scotia were also extremely dry. Several New England waterways had record or near record low streamflow. Groundwater and reservoir levelswere also below normal, with wells going dry. By late July, some Nova Scotia homeowners were paying for water trucks to replenish their systems. Scituate, MA’s reservoir was at 21% of capacity as of August 29. Due to water shortages, more than 290 water systems in New Hampshire and Massachusetts had restrictions in early September. A few reports indicated low water levels led to fish deaths in some rivers and that it could impact river ecology for several years.
Crops such as corn and hay were stressed and growth was stunted. Dry conditions led to small-sized carrots in P.E.I. and small-sized wild blueberries in Nova Scotia. Many farmers irrigated, but water supplies were low or ran dry and costs were increased. Dried up pastures forced some farmers to supplement with hay and other winter feed. Crop losses in Massachusetts for producers participating in USDA Farm Service Agency programs exceeded $13 million as of late August. The largest losses, of over 50%, were hay crops. Due to drought-related crop losses, growers in eight New Hampshire and three Massachusetts counties are eligible for federal assistance.
Massachusetts had an unusually high number of lightning strike fires during late July. Moisture in dead vegetation was historically low, meaning fires could start easily and spread rapidly. In addition, fires were burning deeper into the ground and were taking longer than normal to suppress. The dry conditions also contributed to a large gypsy moth caterpillar population, which decimated tree foliage in Massachusetts and heightened fire danger. In early August, New Brunswick and Nova Scotia banned open-air burning because of a high risk of fires. For the first time in 15 years, Nova Scotia also banned activities in wooded areas of provincial parks and lands. The ban lasted for about two weeks. As of August 9, fire crews were battling nine fires in the province, with air quality alerts issued for some areas. It could take some forests hundreds of years to heal from the fires. Nova Scotia had spent more than three times its allocated firefighting budget as of mid-August. In New Brunswick, there have been 268 fires from January through early September compared to the average-to-date of 223 fires.
Regional Outlook - Autumn 2016
ENSO
While sea surface temperatures were generally below average in the equatorial Pacific Ocean during August, El Niño/Southern Oscillation (ENSO) neutral conditions were observed. According to NOAA’s Climate Prediction Center, there is a 55-60% chance of ENSO-neutral conditions continuing during fall and winter 2016-17. The chances of La Nina have decreased to around 35-40%.

Long description
Graph of the official probabilistic El Nino Southern Oscillation (ENSO) forecast, issued in early September, by the US Climate Prediction Center (CPC) and the International Research Institute (IRI) for Climate and Society. Bar graphs show the probability over 3 month intervals of each kind of ENSO condition (El Nino, neutral, and La Nina), with bars in red, green, and blue, respectively. The intervals range from late summer/early fall (August to October), 2016, to the following spring (April to June), 2017.
The climatological probabilities of these 3 conditions are shown as line graphs of the corresponding colour.
The bar graphs show that neutral or La Nina conditions are the most probable at the beginning of the period (at about 50%). The probability of neutral conditions is higher than that of El Nino or La Nina over the whole period, at about 55%. The probability of La Nina decreases slowly to about 30% by late winter to spring (February to April), and to about 20% by the end of the period. The probability of El Nino is very low in the fall. It increases to about 5% over the winter months, then to 15% in the spring, and to 20% by the end of the period.
The lines show that based on climatology the lowest probability of neutral conditions is over the winter months, at about 30%, and the highest probability is over the late spring and summer months, at 55 to 60%. The climatological probabilities of El Nino and of La Nina are lower than neutral conditions during the late spring and summer months, at about 20%. They increase above 30% in the fall, to reach about 35% in the winter.
Temperature and Precipitation
For September through November, NOAA’s Climate Prediction Center and Environment and Climate Change Canada are calling for an increased chance of above-normal temperatures for the Gulf of Maine region. Both groups are forecasting equal chances of below-, near-, or above-normal precipitation from September through November for the region.
Atlantic Hurricane Season
In early September, the remnants of Hurricane Hermine tracked along the U.S. East Coast and stalled south of New England, where it gradually dissipated. The storm brought gusty winds and large waves, but generally less than 25 mm (1 in.) of rain to eastern Massachusetts. Tree limbs and wires were downed, and some beaches received minor erosion. Through September 1, there were eight named tropical systems in the Atlantic Basin, including three hurricanes, one of which was a major hurricane. On average, there are only five named storms, including two hurricanes by late August. The average date of the first major hurricane is September 4.
NOAA’s updated hurricane outlook from August 11 calls for a 70% chance of 12-17 named storms, with 5-8 of those becoming hurricanes, and 2-4 of those becoming major hurricanes. Those numbers are slightly higher than the original outlook from May.
Drought
The U.S. Drought Outlook from NOAA’s Climate Prediction Center issued September 15, 2016 calls for drought conditions to persist in New England from September 15-December 31. While drought development and intensification become less likely in the fall, persistence was forecast due to the precipitation outlook calling for equal chances.

Long description
Map of the Drought Outlook for the US part of the Gulf of Maine region. The legend shows 4 possibilities, including drought persisting, drought remains but improves, drought removal likely, and drought development. Only 1 possibility is indicated for the US part of the Gulf of Maine region. Brown areas over Massachusetts, southern New Hampshire, and southern and coastal Maine shows drought persisting. There is no indication of drought over the remaining US sections of the Gulf of Maine region.
Gulf of Maine Region Partners
- Environment and Climate Change Canada
- Northeast Regional Climate Center
- National Oceanic and Atmospheric Administration
- Regional Climate Services
- Gulf of Maine Research Institute
- State Climatologists
- National Integrated Drought Information System
- Cooperative Institute for the North Atlantic Region
- Gulf of Maine Council on the Marine Environment, Climate Network
- Northeastern Regional Association of Coastal and Ocean Systems
- University of Maine, School of Marine Sciences
Contacts
NOAA:
Ellen Mecray
Samantha Borisoff
Environment and Climate Change Canada:
ec.enviroinfo.ec@canada.ca
1-800-668-6767 (in Canada only)
819-997-2800 (long-distance charges apply)
Sign up to receive this publication every quarter.