
Residential water use in Canada indicator: data sources and methods, chapter 3
3. Data
3.1 Data source
Per capita residential water use and the percentage of Canadians with water meters for 1991 to 1999 are taken from Environment Canada's Municipal Water Use and Pricing (MUD) survey. After 1999, the survey was revised to become the Municipal Water and Wastewater Survey (MWWS). The 2011 data for residential water use are taken from Statistics Canada's Survey of Drinking Water Plants (SDWP), and the 2006 through 2011 data for water meters are taken from the Households and the Environment Survey (HES).
The 2009 MWWS sampled all Canadian municipalities with a population greater than 1000 and included a sample of over 600 municipalities with less than 1000 residents. The SDWP is a census with a target population of drinking water plants serving communities of 300 or more inhabitants. As both essentially surveyed the same populations, their data match well; the 2011 SDWP data are used in the indicator (Figure 1).
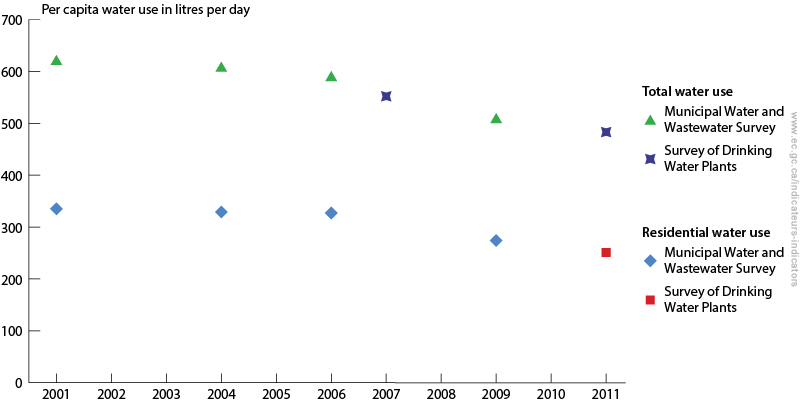
Figure 1: Per capita residential water use results from the 2001 to 2009 Municipal Water and Wastewater Survey (MWWS), and the 2007 and 2011 Survey of Drinking Water Plants (SDWP)
Long Description
In the graph, the top line shows the total water use and the bottom line shows the residential water use, both presented as per capita water use in litres per day. The data are from the Municipal Water and Wastewater Survey (2000 to 2009) and the Survey of Drinking Water Plants (2007 to 2011). As both surveys essentially surveyed the same populations, their data match well; the 2011 Survey of Drinking Water Plants data are used in the indicator.
Note: The SDWP did not collect drinking water use data by sector until 2011. Total water use data are included to show the data correspondence between the two surveys.
Source: Environment Canada's Municipal Water and Wastewater Survey; Statistics Canada's Survey of Drinking Water Plants, Catalogue no. 16-403-X.
The MWWS and HES, however, sample different populations. The MWWS was sent to municipalities, and asked what percentage of each municipality was metered, whereas the HES asks households connected to a municipal water supply if they have a meter. The results from the two populations can be very different. For example, a condo tower may be metered and thus counted in the municipal count, but individual units may not have a meter and thus not be included in the household counts, and therefore households in apartments are excluded from the calculations based on the HES.
Data from the 2006 and subsequent iterations of the HES replace the 2006 and 2009 data from the MWWS (Figure 2). In spite of differences between the two data sources, the HES is a robust statistical survey and the long-term trends are reliable.
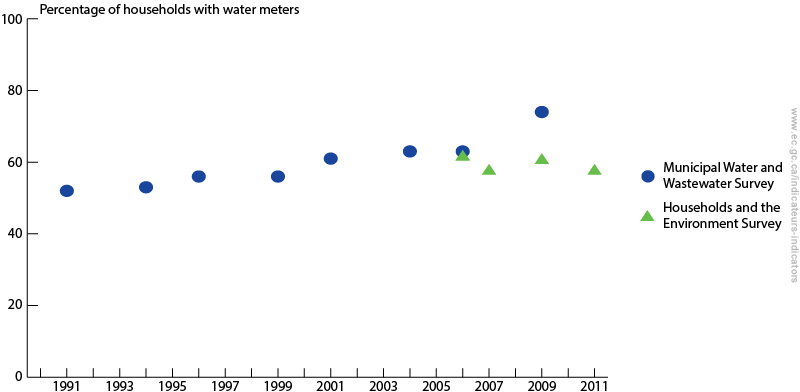
Figure 2: Percentage of households with water meter results from the 1991 to 2009 Municipal Water and Wastewater Survey (MWWS), and the 2006 to 2011 Households and the Environment Survey (HES)
Long Description
In this graph, data from the 1991 to 2009 Municipal Water and Wastewater Survey are compared to data from the 2006 to 2011 Households and the Environment Survey. Data from the 2006 and subsequent iterations of the Households and the Environment Survey replace the 2006 and 2009 data from the Municipal Water and Wastewater Survey. In spite of differences between the two data sources, the Households and the Environment Survey is a robust statistical survey and the long-term trends are reliable.
Source: Environment Canada's Municipal Water and Wastewater Survey; Statistics Canada Households and the Environment, Catalogue no. 11-526-X.
3.2 Spatial coverage
The Residential Water Use in Canada indicator includes data from across Canada. For both Environment Canada surveys, municipalities on federal lands and First Nations municipalities are excluded.
The SDWP is sent to drinking water treatment plants licensed and regulated by provincial/territorial agencies drawing and processing source water from the environment to supply water for human consumption. The survey excludes facilities supplying water to First Nations communities, communities with fewer than 300 people, and regulated systems that service schools, campgrounds, commercial establishments, provincial parks, etc.
The target population of the HES consists of Canadian households, excluding those in Yukon, the Northwest Territories and Nunavut, households located on Indian reserves or Crown lands, and households consisting entirely of full-time members of the Canadian Armed Forces. Institutions and households of certain remote regions are also excluded from the survey.
3.3 Temporal coverage
The MWWS and its predecessor, the MUD survey, were conducted every two to three years from 1983 to 2009. The MUD survey was reformatted following the 1999 survey. The first MWWS was conducted in 2001.
The SDWP began to collect information about residential water use in its second cycle, which collected data for 2011.
The 2006 HES was conducted as a supplement to the Labour Force Survey from February 15 to April 15, 2006. The 2007, 2009 and 2011 HES were conducted from October to December of their respective years as a follow-up survey to the Canadian Community Health Survey.
3.4 Data completeness
To collect the 1991 to 1999 data, the MUD survey was only sent to municipalities across Canada with populations greater than 1000. The MWWS, which replaced the MUD survey, was sent to all municipalities with a population greater than 1000 and a sample of municipalities with fewer than 1000 residents. The final year of the MWWS, 2009, included a sample of over 600 municipalities with fewer than 1000 residents. Data remained comparable among surveys because small municipalities make up less than 3% of the Canadian population and have little effect on aggregate statistics due to population weighting.Footnote [1] For information on changes to the survey sample and methodology between the MUD surveys and MWWS, consult Environment Canada's Municipal Water Use Data. Response rates for the MWWS vary by survey year and question.
The SDWP is a census with a cross-sectional design. In 2011, the SDWP surveyed approximately 2100 drinking water treatment plants, yielding an 87% response rate. The response rate for the 2007 survey data was 58% from approximately 2200 drinking water plants. The number of plants in the survey frame has decreased between cycles, mainly due to removing smaller out-of-scope systems.
The 2006 HES surveyed 36 431 households and yielded a 75% response rate; the 2007 HES surveyed 29 980 households and yielded a 72.3% response rate; and the 2009 HES surveyed 20 000 households and yielded a 73.8% response rate. A total of 14 862 households responded to the 2011 HES survey, yielding a final response rate of 74.3%.
3.5 Data timeliness
The most recent data available at the time this indicator was produced are for 2011.