Canada's water use in a global context
Access PDF (411 KB)
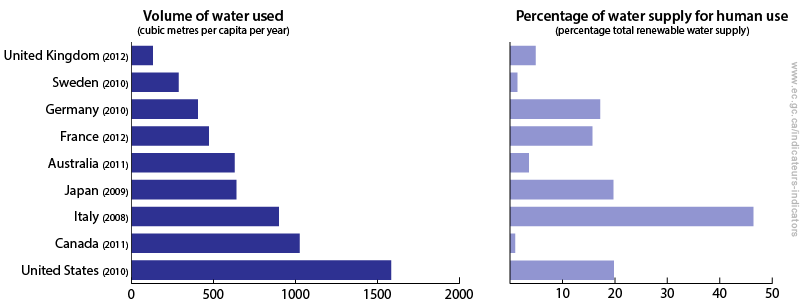
Canada, the country with the third-smallest population among the nine nations examined, uses the second-highest amount of freshwater per person per year from the environment. As a percentage of its total renewable freshwater resources, Canada's water use rate is the lowest at 1%.
Although Canada has a great deal of renewable water, much of this water flows north and is not easily available to the majority of the population, which is located mostly in the south.
Volume of water used and percentage of renewable water supply used, selected countries, selected years

Long description
The bar chart on the left shows the volume of freshwater removed from surface and ground water sources for use in Canada and other countries, in cubic metres per person per year. Countries are listed in increasing order of freshwater withdrawals, from the United Kingdom, the country that withdraws the smallest volume of water per person, to the United States, which withdraws the largest volume per person. Canada withdraws the second-largest amount of water per person at 1025 cubic meters of water per person per year.
The bar chart on the right shows the amount of renewable water used as a percentage of a country's total renewable water resource. Italy uses the largest volume of water relative to its renewable water resource (46.4%) and Canada uses the lowest at 1.0%.
Data for this chart
| Country | Year | Water used per person (cubic metres per person per year) |
Percentage total renewable water used | Volume of total renewable water (billion cubic metres) |
|---|---|---|---|---|
| United States | 2010 | 1583 | 19.8 | 2478 |
| Canada | 2011 | 1025 | 1.0 | 3524 |
| Italy | 2008 | 898 | 46.4 | 116 |
| Japan | 2009 | 639 | 19.7 | 414 |
| Australia | 2011 | 629 | 3.6 | 387 |
| France | 2012 | 472 | 15.7 | 191 |
| Germany | 2010 | 404 | 17.2 | 192 |
| Sweden | 2012 | 287 | 1.4 | 186 |
| United Kingdom | 2010 | 129 | 4.9 | 168 |
Download data file (Excel/CSV; 1.00 KB)
Note: Selected countries are the G7 plus Australia, whose population, population density, and territorial extent are similar to those of Canada; and Sweden, which has a similar climate.
Source: Organisation for Economic Co-operation and Development (2014) OECD Factbook 2014: Economic, Environmental and Social Statistics.
Freshwater is withdrawn from the environment for public water supplies, irrigation, industrial processes, and the cooling of electric power plants. While much of the water that is withdrawn is circulated back into the water body from which it was taken, water use impacts both the amount and quality of freshwater resources. Proper monitoring of water resources is critical to ensure this resource is well managed, so that lakes, rivers and aquifers are not subjected to undue stress from human activity. Excessive water removal can lead to rivers drying up or to an unacceptable drop in the level of groundwater aquifers.
Related indicators
Other information
Access PDF (411 KB)