
Performance measurement evaluation of the ecological component for inorganic cadmium compounds
Cat. No.: En84-374/2024E-PDF
ISBN: 978-0-660-71037-2

Executive summary
Performance measurement evaluations are an important part of the overall chemicals management process that provide Canadians with information on the effectiveness of risk management actions in place for toxic substances. This report measures the performance of the risk management approach applied to inorganic cadmium compounds that were found to pose a risk to the environment.
Risk management of inorganic cadmium compounds was selected for performance measurement evaluation because the substance met several readiness criteria outlined in the Performance Measurement Evaluation Strategy for Risk Management of Toxic Substances. These criteria include having risk management tools implemented for a sufficient amount of time to measure impact and the availability of key performance indicator data.
Inorganic cadmium compounds are found in the environment as a result of cadmium released through natural processes like forest fires, volcanic activity, erosion, weathering, as well as human activities such as metal production, fossil-fuel burning, manufacture, use and disposal of products, and land application of sewage sludge. In 1994, the Government published a Priority Substance List Assessment (the 1994 Assessment) which concluded several inorganic cadmium compounds were entering the environment in a quantity or concentration or under conditions that have or may have a harmful effect on the environment and may constitute a danger to human life or health in Canada. For this reason, they were added to Schedule 1, the List of Toxic Substances, under the Canadian Environmental Protection Act, 1999 in 2000.
Adding a substance to the List of Toxic Substances allows the Government of Canada to consider taking action to manage and reduce the risks of that substance to humans and the environment; for example, through the development of regulations, guidelines, codes of practice or other measures to control any aspect of the substance’s lifecycle. The approach taken to manage the risks of inorganic cadmium compounds was to rely on existing measures put in place to control releases of metals and other toxic substances, rather than develop new risk management measures. The Government’s objectives are to prevent or reduce releases of inorganic cadmium compounds to the greatest extent feasible (the risk management objective) and reduce environmental concentrations to below levels thought to cause adverse effects (the environmental objective). This report evaluates the effectiveness of the risk management approach and measures taken to reduce the risks of inorganic cadmium compounds to the environment since 1994, takes stock of progress meeting the risk management and environmental objectives, and evaluates Environment and Climate Change Canada’s efforts to communicate environmental risks of inorganic cadmium compounds to the public.
Overall, the performance measurement evaluation found that progress has been made to achieve the risk management and environmental objectives. Risk management measures have generally been effective at reducing releases for the sources of concern identified in the 1994 Assessment. Industrial releases of cadmium have declined by more than 95% since 1994, mainly due to reductions from the base metals smelting and refining industry. The base metals smelting and refining industry remains the largest source of release of cadmium to the environment. This sector and other sectors of concern should continue to further reduce releases through existing risk management measures. Measures should be updated as appropriate to capture advances in best environmental practices and best available technologies and allow for tracking of the rate of implementation of voluntary measures.
Reductions in industrial releases have resulted in declines in environmental concentrations to be below levels of concern in many areas, although there are some areas in Canada where cadmium levels in the environment are still above those thought to cause adverse effects (for example Great Lakes). Monitoring cadmium levels in the environment must continue in order to provide evidence for future evaluations. Gaps in monitoring should be filled to the extent possible, noting that there may be opportunities for collaboration with provinces and territories and that new technologies may be useful to fill gaps in remote areas. A diversity of monitoring locations would also be beneficial to compare areas near point sources with background levels. Research into adverse effects levels and sub chronic effects of cadmium in wildlife and fish tissues is also recommended in order to better evaluate environmental risk levels. Monitoring should also continue in order to understand the impacts of cadmium releases from sources in the United States on levels in the Canadian environment. Chemical transport modelling would be another useful tool to identify transboundary sources of cadmium releases. This data should be used to advance and strengthen bilateral agreements with the United States.
Sectors and sources of release where no risk management measures have been put in place to control releases of metals including cadmium have not shown declines, and releases have remained steady or increased over time. As major sources of release have been addressed by risk management actions implemented in the 1990s and early 2000s, sources without controls are making up a larger part of the release profile. For example, releases from residential, commercial and institutional heating have no federal risk management measures in place and account for nearly one quarter of cadmium releases to air. Sources of release not considered in the 1994 Assessment should also be investigated further to determine if additional risk management measures are required. Releases from pulp and paper effluent as well as from wastewater treatment facilities are important contributors to overall cadmium releases to water according to release inventories, but little is known about the source of cadmium in wastewater influent or cadmium levels in the environment near pulp and paper effluent discharge points. Additional study into these sources is warranted and risk management actions to address cadmium releases should be considered, where appropriate.
There have been few communications materials published on cadmium in the environment and associated environmental risks. Communication is expected to improve as Environment and Climate Change Canada has recently undertaken increased efforts to make information on the risk management of toxic substances more available. Ongoing work to improve public access to data including more user-friendly dashboards will further help Canadians to understand the risks of toxic substances, their sources, and actions that they could take to help prevent pollution.
In summary, human activities continue to release cadmium into the environment, resulting in levels above which adverse effects can be expected. Investigation is needed to determine whether releases can feasibly be reduced further and whether new risk management actions are required for some sectors and sources. Continued collaboration with international and domestic partners is important to manage releases from areas beyond federal jurisdiction. A follow-up evaluation on the performance of risk management actions is recommended by 2033 to allow for the implementation of new measures where warranted and collection of performance measurement data and environmental data. Environmental data will play an important role in future evaluations and provide evidence for future risk assessment and risk management efforts.
A performance measurement evaluation of the effectiveness of the Government of Canada’s actions to address risks to human health from inorganic cadmium compounds will be conducted separately by Health Canada.
1. Introduction
The Government of Canada aims to reduce the risks posed by substances found to be toxic to Canadians and the environment under the Canadian Environmental Protection Act, 1999 (CEPA) through risk management actions under the Chemicals Management Plan. Performance measurement evaluations are an important part of the overall chemicals management process that provide Canadians with information on the effectiveness of risk management actions in place for toxic substances. The approach to evaluating the effectiveness of risk management actions and whether objectives for toxic substances have been met is set out in the Performance Measurement Evaluation Strategy for Risk Management of Toxic Substances (Environment and Climate Change Canada, 2020b).
The intent of this report is to evaluate the Government of Canada’s risk management approach for inorganic cadmium compounds, specifically, to determine whether the objectives set for this substance have been met, whether additional action is required, or, whether the risk management approach has not achieved the intended results.
Health Canada will report on the results of its evaluation of the effectiveness of the Government of Canada’s actions to protect human health in a separate report.
1.1 Sources, fate, and effects of exposure
Cadmium is an elemental metal that is found naturally in the earth’s crust. In nature, cadmium is rarely found in its elemental (metallic) state, and is more commonly found in combination with other elements to form what are called compounds. When these compounds contain carbon, they are called organic compounds and when carbon is absent, they are called inorganic compounds. There is no evidence that organic cadmium compounds are found in nature (World Health Organization, 1992).
Natural processes like forest fires, volcanic activity, erosion, weathering, and oceanic cycling can release inorganic cadmium compounds to the environment. In the mid 1990s, global emissions of cadmium from natural processes were estimated to be around 41 thousand tonnes per year, with about 53 tonnes coming from Canada (Richardson et al., 2001). Inorganic cadmium compounds can also be released to the environment through human (anthropogenic) activities such as coal burning, metal extraction, manufacture, use and disposal of products, and land application of sewage sludge (Government of Canada, 1994). It is estimated that in the mid 1990s global cadmium emissions were 2,983 tonnes, and Canada’s emissions were around 61 tonnes (Pacyna & Pacyna, 2001).
Cadmium is produced primarily as a by-product of zinc refining, but is also recovered from recycled products or industrial scrap (MacLatchy 1992, Government of Canada 1994). Canada is the fourth largest producer of cadmium (U.S. Geological Survey, 2022). It may be found in many different products like batteries, paints and coatings, ceramics, plastics and solar cells.
Cadmium does not break down in the environment, and may be found in air, water, soil, sediment, plants, and animals, including humans. Inorganic cadmium compounds are formed when cadmium bonds with other elements in the environment. For example, inorganic cadmium compounds may be formed following cadmium emissions from high temperature activities such as metal production and refining or combustion processes. These particles can stay in the air for up to four weeks and are removed from the air by rain or by gravity (United Nations Environment Programme, 2019). Larger particles fall to the ground or water closer to the source of emission while smaller particles may be transported over long distances, and be deposited up to a few thousand kilometers away from the source (U.S. Environmental Protection Agency, 1980). Inorganic cadmium compounds may include cadmium chloride (CdCl2), cadmium bromide (CdBr2), cadmium iodide (CdI2), cadmium nitrate [Cd(NO3)2], and cadmium sulphate (CdSO4) (Government of Canada, 1994)
Cadmium itself is not easily dissolved in water, however; its compounds are highly soluble (easily dissolved in water). Due to this high solubility, inorganic cadmium compounds that enter water or aquatic environments may be carried downstream, away from the initial point of release. Once in water, inorganic cadmium compounds can also end up in the sediment by attaching to small floating particles that then fall to the bottom. If conditions in the sediment or overlying water change, the inorganic cadmium compounds can re-dissolve from the sediment and once again enter the water.
In nature, physical and chemical factors influence the form, fate, and toxicity of cadmium, as well as its ability to be taken up by plants and animals (bioavailability). For example, in aquatic environments- acidity, hardness, salinity, and level of organic matter can influence how much cadmium is taken up by an animal or plant, and whether this cadmium is in a toxic or non-toxic form. In soil, acidity, soil particle size, moisture, and organic content influence the form and toxicity (Kubier et al., 2019).
Animals can take up cadmium when inorganic cadmium compounds are present in the food, water, or air that they eat, drink, or breathe. Cadmium accumulates in the bodies of animals (bioaccumulation) and, in high enough levels, can cause reduced growth, changes to organ weights and organ damage, cancer, reduced ability to reproduce, cognitive and developmental delays, and changes in behaviour (Government of Canada, 1994).
1.2 Federal approach to risk management of inorganic cadmium compounds
In 1994, the Government published a Priority Substance List Assessment (the 1994 Assessment) on risks of cadmium and its compounds. The assessment concluded that several inorganic cadmium compounds were entering the environment in a quantity or concentration or under conditions that have or may have a harmful effect on the environment and may constitute a danger to human life or health in Canada. Several sectors of concern were noted as potential sources of releases of inorganic cadmium compounds to the environment, resulting in levels that may cause environmental harm. These include metal production (particularly base metal smelting and refining), stationary fuel combustion (power generation and heating), transportation, solid waste disposal, and sewage sludge application.
As a result of the findings of the 1994 Assessment, inorganic cadmium compounds were added to Schedule 1, the List of Toxic Substances, under the CEPA in 2000. Listing inorganic cadmium compounds on the List of Toxic Substances gave the Government the power to take actions to reduce the risks of inorganic cadmium compounds over the course of their life cycle, from research and development to manufacture, use, storage, transport, and final disposal in accordance with the 1995 Toxic Substances Management Policy. The Toxic Substances Management Policy provides a preventative and precautionary management framework for making science-based decisions when managing toxic substances. The key management objectives of the policy are:
- virtual elimination from the environment of toxic substances that result predominantly from human activity and that are persistent and bioaccumulative (referred to in the policy as Track 1 substances)
- management of other toxic substances and substances of concern throughout their entire lifecycles to prevent or minimize their releases into the environment (referred to in the policy as Track 2 substances)
The policy also sets out management approaches for toxic substances, and accordingly inorganic cadmium compounds were determined to be Track 2 substances. In the case of inorganic cadmium compounds, they are naturally occurring and so their complete elimination from the environment is not possible.
The approach taken for Track 2 substances is to prevent or minimize releases, taking into account: human contributions to total release, environmental and health effects, technology, and socioeconomics. This approach allows the Government to put in place regulatory and non-regulatory pollution prevention and reduction measures. Additional measures can be developed if release reporting or environmental monitoring indicate residual problems or impacts on the environment or public health. This approach is intended to allow for risk management measures to be developed for any part of the substance’s lifecycle and to address any environmental media, as appropriate.
The implementation of the Toxic Substances Management Policy led to the development of a risk management phase called the Strategic Options Process. The Strategic Options Process emphasised the implementation of best technologies and practices for pollution prevention and control supported by socioeconomic considerations, followed by environmental monitoring programs, where feasible. These monitoring programs were to assist in identifying the need for further action based on site-specific or industry-specific assessments.
Sector-based Strategic Options Process established multi-stakeholder panels (known as issue tables) in the mid-late 1990s. Issue tables discussed management actions for specific sectors to manage releases of toxic substances. The issue tables for base metal smelting, coal-fired power generation and steel manufacturing included inorganic cadmium compounds in their list of toxic substances released from these sectors. The results of the issue tables led to the publication of Environmental Codes of Practice for Integrated and Non-Integrated Steel Mills under the provisions of section 54 of CEPA in 2001 as well as a Code of Practice for base metal smelting and refining. These Codes of Practice include recommendations aimed at reducing the releases of metals, including inorganic cadmium compounds, and still remain in effect.
The Chemicals Management Plan was introduced in 2006. Under this plan, the Government announced that it would assess and manage, where appropriate, the potential health and ecological risks associated with approximately 4300 substances. A prioritization exercise was initiated due to the large number of substances requiring assessment and potentially risk management to allow the Government to focus on substances that had not yet been addressed. Inorganic cadmium compounds were considered to have been already addressed and appropriately managed by past risk assessment activities and risk management actions. As a result, no substance-specific risk management approach or strategy was developed. The approach taken was to continue to manage the risks of inorganic cadmium compounds through the implementation of the Toxic Substances Management Policy and existing measures.
1.3 Performance measurement evaluation for the ecological component of inorganic cadmium compounds
The evaluation aims to report on the effectiveness of the Government’s approach to managing the ecological risks of inorganic cadmium compounds since the 1994 assessment. It will consider all of the relevant risk management actions taken and their effectiveness by examining the trends in anthropogenic releases and environmental concentrations of cadmiumFootnote 1 in the environment and the results of instrument-based performance measurement reports.
In evaluating the performance of the Government’s risk management actions, it is important to consider whether the risk management approach has led to implementation of actions that have resulted in progress in achieving objectives for the substance. Using the objectives of the Toxic Substances Management Policy for guidance and considering substance-specific risk management objectives proposed for other toxic metal substances, the following risk management and environmental objectives are proposed for the purposes of this evaluation:Footnote 2
- Risk management objective: to achieve the lowest level of anthropogenic releases of inorganic cadmium compounds that are technically and economically feasible, taking into consideration socioeconomic factors
- Environmental objective: to reduce Canadian anthropogenic releases of inorganic cadmium compounds so as not to exceed levels expected to cause adverse effects to the environment, taking into consideration natural background concentrations
There are 3 components of the evaluation that will work together to assess progress made in achieving the risk management and environmental objectives. In the first component, progress will be evaluated through an analysis of indicators that show trends in anthropogenic releases and environmental concentrations. This analysis will compare the current state of conditions with those before risk management tools were implemented (baseline conditions). Other indicators and approaches will also be used, including, but not limited to, comparisons of the current state with established guidelines and targets (see Annex 1 – Indicators and additional information considered in the evaluation for a list of indicators used). These other methods will be particularly important where data on baseline conditions do not exist.
In the second component, progress will be evaluated using the results of performance evaluations for individual risk management actions, and other relevant indicators to assess the overall performance of the risk management approach to minimize the releases of inorganic cadmium compounds to the environment from the sectors of concern identified in the 1994 assessment.
The third component of the evaluation will be to conclude whether controls are sufficient and whether overall progress is reasonable and timely. While efforts will be made to identify links between the findings in components one and two and the implementation of risk management strategies and tools, these linkages are challenging considering multiple external variables. The aim will be to identify links based on information available while acknowledging uncertainties. In addition, new information (for example, emerging concerns or new sources of exposure) will be taken into consideration to ensure long-term effectiveness of actions in place.
The communication of information about the risks of inorganic cadmium compounds to the environment will also be assessed in this third component in consideration of the findings of the 2018 audit made by the Commissioner of Environment and Sustainable Development (CESD). This report indicated that Environment and Climate Change Canada and Health Canada were not doing enough to inform the public about the health and environmental risks from toxic substances.
To conclude, this performance measurement evaluation report will make recommendations on the need for further consideration of new risk management actions, communication efforts, changes to the risk management approach or objectives, or new exposure sources and whether future evaluations are required.
2. Releases of cadmium from human activities in Canada
Trends in environmental releases from human activities can be used as an indicator to assess progress in achieving the risk management objective of lowering anthropogenic releases of cadmium to the lowest levels feasible. Human generated sources of releases are monitored through federal programs. The federal government requires industrial facilities to report the amount of toxic substances released through their operations. This section of the evaluation considers the trends in environmental releases with a focus on the sectors of concern and notes any areas where further consideration of emerging risks may be warranted. Decreasing trends in environmental releases indicate that progress has been made to achieve the risk management objective.
2.1 Release inventories
National Pollutant Release Inventory
The National Pollutant Release Inventory (NPRI) is Canada’s public inventory of releases, disposals, and recycling. It tracks over 320 pollutants from over 7000 facilities across Canada. Reporting facilities include facilities that manufacture a variety of goods, mines, oil and gas operations, power plants, and wastewater treatment plants. The information gathered from the NPRI program helps the government set environmental priorities and monitor environmental performance. NPRI data is published annually for all facilities that are required to report.
Figure 1. Total releases of cadmium and its compounds reported to the NPRI across Canada in 2020

Long description
Map showing the total releases of cadmium and its compounds reported to the NPRI across Canada in 2020.
Every year, businesses, institutions, and other facilities across Canada that meet the reporting requirements must report their releases, disposals and transfers off-site of pollutants to the NPRI in accordance with the Canadian Environmental Protection Act. Over the years, the requirements for reporting to the NPRI have changed. Relevant to cadmium, in 2002, the substance reporting threshold for cadmium manufactured, processed, or used in any other way at a facility was reduced from 10 tonnes at 1% concentration to 5 kg at 0.1% concentration. This 5 kg mass threshold also applies to facilities where cadmium may be incidentally produced or used as a by-product or where cadmium is contained in tailings or non-inert waste rock, but at any concentration (Environment and Climate Change Canada, 2022a).
A 2013 report compiled by Environment and Climate Change Canada estimated the sector coverage of facilities subject to the NPRI reporting requirements (Environment Canada, 2013). This report estimated the proportion of facilities, employees and/or production volumes across Canada that are accounted for in the NPRI on a sector by sector basis. In addition, the report estimated the rate of compliance with the NPRI reporting requirements. The study found that while gaps remain, all operating coal-fired power plants, primary metal smelters, steel mills, oil sands facilities, off-shore oil and gas platforms, crude oil refineries, major automobile assembly plants and Portland cement manufacturing facilities reported to the NPRI for the study year, 2008. High rates of coverage were observed for Canadian metal ore mines and mills as well.
Lower rates of NPRI coverage were noted for other types of facilities, including wood product manufacturing, paper manufacturing, foundries, rubber and plastics manufacturing plants, transportation equipment manufacturing facilities, conventional oil and gas extraction facilities, pits and quarries, non-metallic mineral mines and waste and wastewater facilities. In most cases, the lower rates of sector coverage were due to the fact that many facilities in these sectors are small and fall below the mandatory reporting thresholds. In some cases, lower rates of reporting coverage were the result of facilities’ non-compliance with NPRI reporting requirements. For these facilities and sectors, the report recommended additional investigation as well as prioritized compliance promotion activities.
Data in NPRI is organized by industrial sectors according to codes issued under the North American Industry Classification System (NAICS codes). It should be noted that a single facility reporting to NPRI may have activities that fall under more than one industrial sector code. While facilities do have the ability to report more than one NAICS code to the NPRI (if applicable), releases are not divided to each code, making it difficult to determine exactly which industrial activities cadmium and other substances are being released from by a single facility.
Air Pollutant Emissions Inventory
The Air Pollutant Emissions Inventory (APEI) is a comprehensive inventory of air pollutants at the national, provincial, and territorial level. It compiles emissions of 17 air pollutants contributing to smog, acid rain, and poor air quality with records beginning in 1990. The APEI is compiled from many different data sources. Emissions data reported by individual facilities to the NPRI and, to a lesser extent, data provided directly by the provinces are supplemented with well-documented, science-based estimation tools and methodologies to quantify total emissions. Together, these data sources provide a comprehensive coverage of air pollutant emissions across Canada.
It is important to note that for facilities reporting to the NPRI for the first time, the NAICS codes reported by the facilities, are used to assign preliminary APEI sector and subsector classifications (Environment and Climate Change Canada, 2022d). Additional research and verifications are then performed to confirm or correct the classification. The assigned classification is used for subsequent reporting years, as long as the facility does not change operations. For this reason, there may be years where NPRI and APEI data do not align for a particular facility if that facility has reported under a different NAICS code.
The information provided by the NPRI and APEI can be used to track trends in releases of cadmium to the environment over time and is useful to evaluate whether the risk management approach has made progress in achieving the risk management and environmental objectives. APEI is the primary source of information used to report releases to air, while NPRI is the primary source of information used to report releases to water and land. NPRI data is also used to estimate the number of facilities reporting releases.
2.1.1 Releases to air
Approximately 4.12 tonnes of cadmium were emitted to air in Canada in 2020, according to APEI (Environment and Climate Change Canada, 2022d). Ore and mineral industries; fuel combustion for heating in residential, commercial, and institutional settings; and manufacturing together accounted for 86% of cadmium emissions (Figure 2).
Figure 2. 2020 Canadian cadmium emissions profile according to APEI

Long description
A donut chart showing the percentage of releases from industrial sectors and other sources in 2020. See descriptive text for Figure 3 for values for 2020.
From 1994 to 2020, national cadmium emissions decreased by 95% (71.8 tonnes) (Figure 3). This trend is almost entirely driven by the declines from the non-ferrous smelting and refining sector in which the majority of the reductions come from the base metals smelting and refining industry, which reduced its cadmium emissions from 73.1 tonnes in 1994 to 2.09 tonnes in 2020. Emissions from this industry fluctuated greatly between 1994 and 2006, but decreased steadily from 2007 onward. Fluctuations in emissions prior to 2010 are primarily due to emissions from a single smelter in Manitoba that is now closed. Emissions from this industry may fluctuate greatly from year to year due to variations in the composition of ore and the amount of ore processed.
In 2020, cadmium emissions from electricity and power generation were 27% lower than in 1994. Cadmium emissions from this sector varied over time. Levels remained stable from 1994 to 2001 at around 0.14 tonnes. In 2002, cadmium emissions from this sector jumped significantly and continued to increase to a peak of 0.75 tonnes in 2011. Following 2011, there was a substantial decline and cadmium emissions have been below 1994 values since 2017.
Emissions from fuel combustion for space and water heating in commercial/residential/institutional settings have remained relatively stable since 1994. For the transportation sector, cadmium emissions have slowly decreased by 62% since 1994 from 0.17 tonnes to 0.06 tonnes.
Cadmium emissions from incineration and waste treatment and disposal have also declined since 1994 from 0.079 tonnes to 0.038 tonnes, a decrease of 52%. This decline was rapid after 2002 and a slow decline continued until around 2009 after which time emissions from this source have remained relatively steady, though have shown a slightly increasing trend since 2017. In 2020, cadmium emissions from incineration and waste accounted for only 1% of total emissions.
Generally, the sectors of concern identified in the 1994 assessment account for the vast majority of cadmium emissions in 2020. However, with the declines observed in these sectors, particularly in the metals and ore sector, the proportion of emissions released from the sectors of concern compared to other sectors is declining. In 1994, releases from sectors of concern made up 98% of cadmium emissions while in 2020 they made up 80%.
Although not identified as a sector of concern in the 1994 assessment, the manufacturing sector has consistently been in the top 3 sectors for cadmium emissions and accounts for 12% of the total emissions in 2020. The sector has also reduced its emissions by 54% since 1994, from 1.10 tonnes to 0.51 tonnes. All of the industries in the manufacturing sector have reduced their emissions since 1994 and includes the chemicals, metal fabrication, plastics manufacturing, pulp and paper, wood products, and vehicle manufacturing industries.
The oil and gas industry was also not identified as a concern in 1994, based on the data available at that time. Cadmium emissions from this industry have increased steadily over time from 0.16 tonnes in 1994 to 0.23 tonnes in 2020. Emissions from the sector peaked at 0.55 tonnes in 2010. This increase is driven by the upstream oil and gas industry, in particular, oil sands mining and extraction. Releases from the downstream oil and gas industry have declined over this same period. Nonetheless, the cadmium emissions from this industry made up 6% of total cadmium emissions in 2020. Cadmium is not added to oil and gas during its production, but it is naturally occurring in the oil and gas extracted.
Using records from the NPRI, it is possible to analyze the trends in the number of facilities who reported cadmium releases. Since the change to the reporting threshold in 2002, the number of facilities that report cadmium releases to air over time has increased by 52%. The increase is seen across all sectors, but the ore and minerals sector and manufacturing sector account for the majority of the increases. In the case of the ore and minerals sector, the increase in facilities reporting is due to more mining and quarrying facilities reporting. Additionally, in 2006 the reporting exemption for extraction and primary crushing activities was removed, and reporting requirements were added for tailings and waste rock, which may have contributed to the increase in the number of mining facilities reporting.
Examining the intensity of cadmium emissions by sector is also possible using NPRI data by comparing the quantity of releases reported with the number of facilities in each sector. Over time, there is a clear trend that shows for sectors as a whole, cadmium emissions are lower on average per facility.
To conclude, most cadmium emissions in Canada come from sectors of concern and releases from the sectors of concern have declined considerably from 1994 levels. More facilities are reporting releases of cadmium to air due to changes to reporting requirements and opening of new facilities; however, for most sectors, this has not resulted in an increase in emissions reported from the sector as the average quantity of cadmium emissions per facility has declined over time. With dramatic declines in emissions from non-ferrous smelting and refining, the profile of cadmium releases is slowly changing. Notably, residential/commercial/institutional heating and manufacturing play a much larger role in the emissions profile in 2020 than in 1994.
Figure 3. Releases of cadmium to air from 1994 to 2020 according to APEI

Long description
A bar chart showing the tonnes of cadmium to air from Canadian sources from 1994 to 2020 according to the APEI. Data shown in table below. Note 0s indicate very small releases, N/A indicates no releases.
| Year | Agriculture | Commercial Residential Institutional |
Electric power generation | Incineration and waste | Manufacturing | Oil and gas | Ore and minerals | Paints and solvents | Transportation | Total | Number of facilities |
|---|---|---|---|---|---|---|---|---|---|---|---|
| 1994 | 0.06 | 1.08 | 0.14 | 0.08 | 1.10 | 0.16 | 73.1 | N/A | 0.17 | 75.9 | 20 |
| 1995 | 0.07 | 1.13 | 0.14 | 0.08 | 1.38 | 0.16 | 17.7 | N/A | 0.16 | 20.8 | 21 |
| 1996 | 0.06 | 1.15 | 0.14 | 0.08 | 1.18 | 0.17 | 25.0 | N/A | 0.16 | 28.0 | 21 |
| 1997 | 0.07 | 1.14 | 0.14 | 0.08 | 1.11 | 0.18 | 41.4 | N/A | 0.17 | 44.3 | 25 |
| 1998 | 0.05 | 0.98 | 0.13 | 0.08 | 1.09 | 0.18 | 42.5 | N/A | 0.17 | 45.1 | 25 |
| 1999 | 0.06 | 1.03 | 0.13 | 0.08 | 1.14 | 0.18 | 37.0 | N/A | 0.17 | 39.8 | 31 |
| 2000 | 0.05 | 1.10 | 0.13 | 0.09 | 0.96 | 0.19 | 34.3 | N/A | 0.18 | 37.0 | 34 |
| 2001 | 0.05 | 1.06 | 0.14 | 0.09 | 1.09 | 0.19 | 65.4 | N/A | 0.18 | 68.2 | 46 |
| 2002 | 0.05 | 1.09 | 0.26 | 0.14 | 1.35 | 0.19 | 36.2 | 0 | 0.17 | 39.5 | 167 |
| 2003 | 0.05 | 1.11 | 0.64 | 0.04 | 1.34 | 0.20 | 27.9 | 0 | 0.17 | 31.5 | 211 |
| 2004 | 0.05 | 1.20 | 0.30 | 0.04 | 1.18 | 0.21 | 30.4 | 0 | 0.18 | 33.6 | 229 |
| 2005 | 0.06 | 1.11 | 0.25 | 0.04 | 0.74 | 0.19 | 31.9 | 0 | 0.18 | 34.5 | 222 |
| 2006 | 0.06 | 1.07 | 0.21 | 0.04 | 0.71 | 0.21 | 38.0 | 0 | 0.18 | 40.5 | 232 |
| 2007 | 0.07 | 1.17 | 0.45 | 0.03 | 0.73 | 0.27 | 25.6 | 0 | 0.18 | 28.5 | 232 |
| 2008 | 0.07 | 1.16 | 0.41 | 0.07 | 0.67 | 0.29 | 19.8 | 0 | 0.18 | 22.6 | 226 |
| 2009 | 0.06 | 1.05 | 0.39 | 0.03 | 0.92 | 0.42 | 18.0 | 0 | 0.16 | 21.0 | 225 |
| 2010 | 0.07 | 1.03 | 0.36 | 0.04 | 0.60 | 0.55 | 13.5 | N/A | 0.15 | 16.3 | 237 |
| 2011 | 0.08 | 1.10 | 0.75 | 0.03 | 0.60 | 0.26 | 5.52 | N/A | 0.15 | 8.47 | 240 |
| 2012 | 0.09 | 1.08 | 0.43 | 0.02 | 0.60 | 0.27 | 6.97 | 0 | 0.14 | 9.60 | 258 |
| 2013 | 0.08 | 1.05 | 0.36 | 0.03 | 0.65 | 0.24 | 5.96 | 0 | 0.12 | 8.49 | 256 |
| 2014 | 0.07 | 1.05 | 0.16 | 0.02 | 0.59 | 0.21 | 5.37 | 0 | 0.10 | 7.59 | 253 |
| 2015 | 0.07 | 1.03 | 0.14 | 0.02 | 0.57 | 0.22 | 5.43 | 0 | 0.07 | 7.56 | 248 |
| 2016 | 0.08 | 1.03 | 0.16 | 0.01 | 0.59 | 0.22 | 5.48 | 0 | 0.07 | 7.64 | 250 |
| 2017 | 0.08 | 1.08 | 0.12 | 0.02 | 0.56 | 0.25 | 4.67 | 0 | 0.07 | 6.84 | 252 |
| 2018 | 0.08 | 1.09 | 0.10 | 0.02 | 0.59 | 0.26 | 4.67 | 0 | 0.08 | 6.87 | 260 |
| 2019 | 0.08 | 1.08 | 0.11 | 0.03 | 0.58 | 0.23 | 4.30 | 0 | 0.07 | 6.48 | 265 |
| 2020 | 0.07 | 1.01 | 0.10 | 0.04 | 0.51 | 0.23 | 2.09 | 0 | 0.07 | 4.11 | 255 |
2.1.2 Releases to water
Releases of cadmium to water totalled 2.34 tonnes in 2020, according to NPRI. More than half (1.21 tonnes) of the cadmium releases were reported by wastewater treatment facilities (Figure 4). Approximately 0.70 tonnes of cadmium were released from the pulp and paper industry, and an additional 0.38 tonnes were released from the ore and minerals industry, primarily from non-ferrous metals production and processing. Coal mining accounted for 0.03 tonnes of releases. The remaining 0.02 tonnes were released by other industries in very small amounts.
Figure 4. Release profile of cadmium to water in 2020 according to NPRI

Long description
A donut chart of cadmium releases to water from industries in 2020. See descriptive text of Figure 5 for values in 2020.
Note that facility releases to water reported to the NPRI do not include the amount of cadmium that may be sent by facilities to municipal wastewater systems – these are reported as transfers for treatment (see section 2.1.4 below). Wastewater treatment facilities receive industrial and residential inputs from upstream sources, and are required to report the estimated releases of cadmium contained in treated wastewater leaving the facility, but do not themselves contribute to cadmium releases.
Total releases of cadmium declined sharply after 1994 (Figure 5). When new substance reporting thresholds came into place in 2002, there was an increase in the total amount of cadmium releases reported for most sectors, likely due to an increase in the number of facilities required to report. Also in 2002, the 20,000-hour employee threshold requirement was removed for wastewater treatment facilities with an average daily discharge of 10,000 cubic metres. This adjustment corresponded to an increase in the amount of cadmium reported from wastewater treatment facilities as well as the number of wastewater treatment facilities that reported. There are no significant trends over time in releases from wastewater treatment plants following the initial peak in releases after the introduction of the new reporting requirements in 2002. This may be due in part to either no change in inputs to municipal wastewater systems, or methods of estimation of releases used at wastewater treatment plants that use calculations with a concentration-based release factor multiplied by the total volume of effluent (Environment and Climate Change Canada, 2019a). Methods used by facilities to estimate and report releases may be based on analyzed data or chosen from a range of numbers presented in reporting guidance documents developed from real-world measurements and scientific studies. In 2020, there were 26 wastewater treatment facilities that reported releases of cadmium to water. In their reports of cadmium releases to water, 23 used values determined by effluent testing, one used a published emission factor, and two used values determined by engineering estimates based on measured values in sewage sludge. Cadmium levels at eight facilities were below detection limits in all samples, seven facilities detected cadmium in less than half of samples, one detected cadmium in more than half of samples, and the remaining seven reported that cadmium was detected in all samples. Detection limits vary greatly from 5 ug/L to 0.001 ug/L depending on the laboratory and method used to analyze samples. Due to the large volumes of water processed by wastewater treatment plants, the reported releases of cadmium to water may be overestimated where reporting is based on estimates of cadmium levels that are below detection limits.
The decline in total cadmium releases since 1994 is mainly due to reductions from non-ferrous metal production and processing (Figure 5). Releases of cadmium to water from non-ferrous smelting and refining were 96% lower in 2020 than 1994 and 41% lower than in 2002. In 2020, two smelting and refining facilities accounted for 63% (0.24 tonnes) of the total releases from this sector.
Figure 5. Trends in releases of cadmium to water according to NPRI

Long description
A bar chart showing the releases of cadmium to water by industry from 1994 to 2020. A line represents the number of facilities reporting releases. Data are noted in the following table where 0s indicate a very small quantity of release and N/A indicates no releases reported.
| Year | Cement and concrete | Chemical manufacturing | Coal mining | Electric power generation | Foundries | Iron and steel mills | Metal ore mining | Non-ferrous metal production | Non-metallic mineral mining and quarrying | Oil and gas | Other | Petroleum and coal product manufacturing | Pulp, paper and paperboard mills | Waste treatment and disposal | Water, sewage and other systems | Total | Number of facilities |
|---|---|---|---|---|---|---|---|---|---|---|---|---|---|---|---|---|---|
| 1994 | N/A | N/A | N/A | N/A | N/A | N/A | 0.58 | 7.72 | N/A | N/A | N/A | N/A | N/A | N/A | N/A | 8.30 | 11 |
| 1995 | N/A | N/A | N/A | N/A | 0.10 | 0.00 | 0.44 | 3.34 | N/A | N/A | N/A | N/A | N/A | N/A | N/A | 3.88 | 16 |
| 1996 | N/A | N/A | N/A | N/A | N/A | N/A | 0.27 | 2.43 | N/A | N/A | N/A | N/A | N/A | N/A | N/A | 2.70 | 11 |
| 1997 | N/A | N/A | N/A | N/A | 0.12 | N/A | 0.16 | 1.85 | N/A | N/A | N/A | N/A | N/A | N/A | N/A | 2.13 | 12 |
| 1998 | N/A | N/A | N/A | N/A | 0.13 | N/A | 0.06 | 0.98 | N/A | N/A | N/A | N/A | N/A | N/A | N/A | 1.17 | 13 |
| 1999 | N/A | N/A | N/A | N/A | 0.16 | N/A | 0.21 | 0.70 | N/A | N/A | N/A | N/A | N/A | N/A | 0.38 | 1.44 | 16 |
| 2000 | N/A | N/A | N/A | N/A | 0.21 | N/A | 0.21 | 0.49 | N/A | N/A | N/A | N/A | N/A | N/A | N/A | 0.91 | 17 |
| 2001 | N/A | N/A | N/A | N/A | 0.32 | N/A | 0.65 | 0.40 | N/A | N/A | N/A | N/A | N/A | N/A | 0.04 | 1.41 | 23 |
| 2002 | 0.00 | N/A | N/A | 0.09 | 0.03 | N/A | 0.10 | 0.48 | N/A | N/A | N/A | 0.03 | 0.82 | N/A | 1.03 | 2.57 | 109 |
| 2003 | 0.01 | N/A | N/A | 0.03 | 0.09 | 0.00 | 0.18 | 0.43 | N/A | N/A | N/A | N/A | 1.01 | N/A | 3.19 | 4.94 | 134 |
| 2004 | 0.00 | N/A | N/A | 0.03 | 0.07 | 0.00 | 0.42 | 0.87 | N/A | 0.00 | 0.01 | 0.03 | 0.96 | N/A | 2.26 | 4.65 | 154 |
| 2005 | 0.01 | N/A | N/A | 0.03 | 0.14 | N/A | 0.40 | 0.45 | N/A | 0.00 | 0.01 | 0.06 | 0.93 | N/A | 1.39 | 3.41 | 147 |
| 2006 | 0.00 | N/A | N/A | 0.01 | 0.19 | N/A | 0.52 | 0.44 | N/A | 0.00 | 0.01 | 0.05 | 1.08 | N/A | 1.45 | 3.75 | 145 |
| 2007 | 0.00 | N/A | N/A | 0.02 | 0.16 | 0.00 | 0.40 | 0.88 | N/A | 0.01 | 0.01 | 0.06 | 1.11 | N/A | 1.12 | 3.76 | 157 |
| 2008 | 0.00 | N/A | N/A | 0.01 | 0.21 | 0.05 | 0.06 | 0.39 | N/A | 0.00 | 0.03 | 0.05 | 0.77 | N/A | 0.98 | 2.54 | 144 |
| 2009 | 0.00 | N/A | N/A | 0.04 | 0.34 | 0.02 | 0.37 | 0.36 | N/A | 0.01 | 0.05 | 0.07 | 0.71 | 0.00 | 1.26 | 3.22 | 151 |
| 2010 | 0.00 | N/A | 0.07 | 0.01 | 0.19 | 0.07 | 0.12 | 0.29 | N/A | 0.00 | 0.01 | 0.06 | 0.70 | N/A | 1.21 | 2.74 | 163 |
| 2011 | 0.00 | 0.02 | 0.06 | 0.01 | 0.11 | 0.01 | 0.08 | 0.32 | N/A | N/A | 0.01 | 0.05 | 0.78 | N/A | 1.36 | 2.79 | 158 |
| 2012 | 0.00 | 0.00 | 0.10 | 0.00 | 0.06 | 0.02 | 0.06 | 0.33 | N/A | 0.06 | 0.01 | 0.04 | 0.82 | N/A | 1.24 | 2.74 | 165 |
| 2013 | 0.00 | N/A | 0.11 | 0.01 | 0.07 | 0.01 | 0.15 | 0.35 | N/A | N/A | 0.01 | 0.05 | 1.10 | N/A | 0.90 | 2.76 | 169 |
| 2014 | N/A | N/A | 0.04 | 0.01 | 0.06 | N/A | 3.96 | 0.32 | N/A | N/A | 0.00 | 0.03 | 0.94 | N/A | 0.97 | 6.33 | 163 |
| 2015 | N/A | 0.00 | 0.03 | 0.01 | 0.04 | N/A | 0.09 | 0.29 | N/A | N/A | 0.00 | 0.03 | 0.78 | N/A | 0.97 | 2.24 | 150 |
| 2016 | N/A | N/A | 0.02 | N/A | 0.05 | N/A | 0.09 | 0.31 | N/A | 0.00 | 0.00 | 0.02 | 0.84 | N/A | 1.12 | 2.46 | 137 |
| 2017 | N/A | N/A | 0.04 | N/A | 0.07 | N/A | 0.20 | 0.28 | N/A | 0.00 | 0.00 | 0.02 | 0.86 | N/A | 1.24 | 2.70 | 142 |
| 2018 | N/A | N/A | 0.04 | 0.00 | 0.07 | N/A | 0.26 | 0.23 | N/A | 0.02 | 0.00 | 0.03 | 0.78 | N/A | 1.20 | 2.64 | 163 |
| 2019 | N/A | N/A | 0.04 | 0.00 | N/A | 0.04 | 0.09 | 0.31 | N/A | 0.00 | 0.00 | 0.02 | 0.79 | N/A | 1.65 | 2.93 | 168 |
| 2020 | N/A | N/A | 0.03 | 0.00 | N/A | 0.02 | 0.09 | 0.28 | 0.00 | 0.00 | 0.00 | 0.00 | 0.70 | N/A | 1.21 | 2.35 | 171 |
Note that in 2014, there was a large spike in cadmium releases to water (approximately 3.77 tonnes) due to a tailings pond breach at the Mount Polley Mine.
In the manufacturing sector, releases of cadmium to water are driven by the pulp and paper industry. Cadmium is naturally found in the wood materials that are used in pulp and paper manufacturing. It is not added during production processes. There were no releases reported from this sector until 2002, following the introduction of new NPRI reporting requirements. Since 2002, releases from the sector increased until 2007 and have generally decreased since this time although there are fluctuations from year to year.
Releases from all other industries and sectors are typically much less than the 3 industries reported above. Despite the small quantities of release, electric power generation has steadily reduced cadmium releases to water from 0.09 tonnes in 2002 to 0.001 tonnes in 2020, representing a 98% decrease in cadmium releases from the sector. Releases from the oil and gas sector are typically very small (less than 0.005 tonnes).
In comparing the quantity of releases to the number of facilities, there is an overall declining trend. Even though there are more facilities reporting releases of cadmium to water, the quantity reported per facility is decreasing. This trend is due largely to fewer releases from the ore and minerals sector. On a per facility basis, releases are stable from the manufacturing industry, oil and gas industry, and electric power generation. Releases of cadmium to water per facility appear to be increasing for wastewater treatment facilities, likely due to increases in the volumes of water treated as well as increases in upstream inputs to municipal wastewater systems.
Overall, cadmium releases to water from industrial facilities were lower in 2020 than they were in 1994, and have remained relatively stable over the last 10 years. Decreases in cadmium releases to water are mainly due to reductions in the non-ferrous metal production and processing industry, which was one of the sectors of concern in the 1994 assessment. Releases of cadmium to water from electric power generation, another sector of concern, also declined over time, although cadmium releases to water from this sector have always been relatively small. The vast majority of cadmium releases to water are consistently reported by wastewater treatment, pulp and paper manufacturing, non-ferrous metal production and processing and mining and quarrying facilities. Releases of cadmium to water from wastewater treatment has remained relatively unchanged since 2002. This sector was not previously identified as a sector of concern for cadmium releases.
2.1.3 Releases to land
Facilities are required to report to NPRI any spills, leaks or other releases to land that are not disposals. Disposals are activities that facilities do to manage substances to limit their release to the environment. Tailings and waste rock containing cadmium are not included as releases to land and are instead counted as disposals or transfers.
In 2020, there were 0.20 tonnes of cadmium released to land. Eleven facilities in the pulp and paper industry, wastewater treatment, and metal ore mining industry accounted for all of the releases (Figure 6). No releases were recorded for the other industrial sectors.
Figure 6. Releases profile of cadmium to land in 2020 according to NPRI

Long description
A donut chart showing cadmium releases to land from industrial facilities in 2020. See descriptive text for Figure 7 for data.
No releases of cadmium to land were recorded in the NPRI between 1994 and 2002, likely due to the reporting requirements and thresholds in place at that time. Since the reporting threshold changes in 2002, cadmium releases to land have been reported. The amount of cadmium released to land from industrial facilities has varied substantially, from year to year, but is generally higher than the amount reported in 2002 (Figure 7). A large variation in year to year reporting is normal because releases to land usually result from spills and leaks, which are highly variable in nature. The manufacturing industry, specifically the pulp and paper industry and wood products industry account for the majority of cadmium releases to land in almost all years. Releases from the ore and minerals sector are due to mining and quarrying operations.
The number of facilities reporting cadmium releases to land increased sharply between 2002 and 2007, but then has decreased over time. There are far fewer facilities reporting releases to land compared to the number of facilities reporting releases to air and water. In the peak of 2007, there were only 18 facilities reporting releases to land. Due to the low number of facilities reporting, the intensity of cadmium releases to land follows the same pattern as the trends in releases to land for each sector.
Releases of cadmium to land have mostly come from the manufacturing industry via the pulp and paper sector and wood products sector, which were not identified as a concern in the 1994 assessment. Releases of cadmium to land from metal production and waste treatment do occur, though they are usually small (<0.005 tonnes).
Figure 7. Trends in cadmium releases to land in tonnes according to NPRI*

Long description
A bar chart showing tonnes of industrial releases of cadmium to land since 2002. A line shows the number of facilities reporting releases to land. Data are noted in the following table where 0s indicate a very small quantity of release and N/A indicates no releases reported.
| Year | Coal mining | Electric power generation | Metal ore mining | Non-ferrous metal production | Non-metallic mineral mining and quarrying | Other | Petroleum and coal product manufacturing | Plastic product manufacturing | Pulp, paper and paperboard mills | Waste treatment and disposal | Water, sewage and other systems | Wood product manufacturing | Total | Number of facilities |
|---|---|---|---|---|---|---|---|---|---|---|---|---|---|---|
| 2002 | N/A | 0.08 | N/A | N/A | N/A | N/A | 0.00 | N/A | 0.00 | N/A | 0.00 | N/A | 0.08 | 4 |
| 2003 | N/A | N/A | N/A | N/A | N/A | 0.00 | N/A | N/A | N/A | N/A | N/A | 0.05 | 0.06 | 3 |
| 2004 | N/A | N/A | N/A | 0.00 | N/A | N/A | N/A | N/A | 0.10 | N/A | 0.01 | 0.07 | 0.18 | 12 |
| 2005 | N/A | N/A | N/A | N/A | N/A | 0.06 | N/A | N/A | 0.15 | N/A | N/A | 0.20 | 0.40 | 12 |
| 2006 | N/A | N/A | N/A | N/A | N/A | N/A | N/A | 0.00 | 0.13 | N/A | 0.00 | 0.46 | 0.59 | 21 |
| 2007 | N/A | 0.07 | N/A | N/A | N/A | N/A | N/A | N/A | 0.15 | N/A | 0.00 | 0.38 | 0.60 | 21 |
| 2008 | N/A | N/A | N/A | N/A | N/A | N/A | N/A | N/A | 0.11 | 0.03 | 0.01 | 0.36 | 0.51 | 15 |
| 2009 | N/A | N/A | N/A | N/A | N/A | N/A | N/A | N/A | 0.05 | N/A | 0.01 | 0.03 | 0.08 | 8 |
| 2010 | N/A | N/A | 0.09 | N/A | 0.00 | N/A | N/A | N/A | 0.32 | N/A | 0.01 | 0.09 | 0.50 | 14 |
| 2011 | 0.26 | N/A | 0.02 | N/A | N/A | N/A | N/A | N/A | 0.51 | N/A | 0.02 | 0.03 | 0.83 | 16 |
| 2012 | 0.55 | N/A | 0.02 | N/A | N/A | N/A | N/A | N/A | 0.06 | N/A | 0.01 | 0.09 | 0.73 | 13 |
| 2013 | 0.01 | N/A | 0.04 | N/A | N/A | N/A | N/A | N/A | 0.07 | N/A | 0.03 | 0.09 | 0.23 | 11 |
| 2014 | N/A | N/A | 0.07 | N/A | N/A | N/A | N/A | N/A | 0.07 | N/A | 0.01 | 0.01 | 0.16 | 8 |
| 2015 | N/A | N/A | 0.04 | N/A | N/A | N/A | N/A | N/A | 0.12 | N/A | 0.01 | N/A | 0.17 | 9 |
| 2016 | N/A | N/A | 0.04 | N/A | N/A | N/A | N/A | N/A | 0.11 | N/A | 0.02 | N/A | 0.17 | 10 |
| 2017 | N/A | N/A | 0.02 | 0.01 | N/A | N/A | N/A | N/A | 0.17 | N/A | 0.01 | 0.01 | 0.22 | 10 |
| 2018 | N/A | N/A | 0.02 | N/A | N/A | N/A | N/A | N/A | 0.06 | N/A | 0.01 | N/A | 0.08 | 6 |
| 2019 | N/A | N/A | 0.02 | N/A | N/A | N/A | N/A | N/A | 0.07 | N/A | 0.02 | N/A | 0.11 | 7 |
| 2020 | N/A | N/A | 0.02 | N/A | N/A | N/A | N/A | N/A | 0.16 | N/A | 0.02 | N/A | 0.20 | 10 |
*Note that the large quantities of cadmium releases to land reported in 2011 and 2012 from the pulp and paper and coal mining sectors appear to be reporting errors: 3 coal mining facilities have reported identical quantities as releases to land and disposals of tailings and waste rock; and one pulp and paper facility reported "other releases to land" in these years while reporting disposals to landfill in all other years. These data have been kept in the report as they appear in the NPRI dataset but may not reflect actual increases in releases of cadmium to land.
2.1.4 Disposal, waste treatment, and recycling
NPRI also gathers information on how facilities handle and dispose of cadmium waste. Disposal activities may be conducted on-site at the facility or off-site, for example, at specialized hazardous waste treatment facilities. Examples of disposal activities include landfilling, land application, and underground injection. Substances may be transferred between facilities for recycling, energy recovery, or for treatment before final disposal, including transfers to municipal wastewater treatment systems. To avoid double counting, on-site and off-site disposals and transfers are described separatelyFootnote 3 . Reviewing the data on disposal, waste treatment and recycling activities can provide information used to better understand which industries generate the most cadmium waste and how this waste is managed.
The quantity of cadmium subject to on-site disposal has increased over time, from less than 100 tonnes in the mid-1990s to more than 1000 tonnes in the late 2010s (Figure 8). In 2020, 1,676 tonnes of cadmium were disposed of on-site. By weight, hazardous waste treatment facilities accounted for 77% of on-site disposal activities in 2020. Metal ore mining and non-ferrous smelting and refining together accounted for another 21%, of on-site disposal activities (including on-site disposals of tailings and waste rock). Landfilling disposal of tailings and waste rock management account for nearly all of the on-site disposal activities. The number of facilities conducting on-site disposals has increased steadily over time. The largest growth has been seen in the metal ore mining industry, which increased from 45 facilities in 2006, to 72 facilities in 2020. As previously noted, in 2006, the NPRI reporting exemption for extraction and primary crushing mines was removed, and reporting for tailings and waste rock was added. Hazardous waste treatment facilities account for nearly all of the releases, disposals, and transfers of cadmium recorded in NPRI. Municipal waste treatment facilities typically do not report data on cadmium, but do report to NPRI for other substances. This may be because municipal waste treatment facilities do not meet NPRI reporting thresholds for the substance, or may be because they do not have sufficient data to estimate the quantities of cadmium in waste materials received.
Quantities of cadmium subject to off-site disposal activities are much smaller and have declined over time from 180 tonnes in the late 1990s to 30 tonnes in 2020 (Figure 9). Landfilling is the most frequent disposal activity (typically at least 95% of the total by weight) for cadmium waste. Although, notably in 2018 and 2019, storage accounted for 47% and 26% of total off-site disposals of cadmium waste by weight. The amounts of cadmium waste that are disposed of off-site vary substantially by sector over time, but commonly are from the waste, ore and minerals, and manufacturing sectors. The number and types of facilities reporting off-site disposal activities have remained mostly consistent since 2003.
Total transfers by weight have increased steadily over time, with 1,067 tonnes being reported in 2020 (Figure 10). The purpose of the transfers has also changed substantially over time. From the 1990s until the early 2010s, the majority of cadmium transfers were for recovery of metals and metal compounds (recycling). More recently, most of the cadmium transferred between facilities is sent for treatment prior to disposal. Except for 2010, when one facility shut down part of its operations, the non-ferrous smelting and refining industry usually accounts for more than 95% of transfers by weight, despite only consisting of around 5% of reporting facilities. The number and types of facilities recording transfers has been mostly consistent since 2003.
To summarize, more cadmium is being disposed of on-site by more facilities. Landfilling accounts for the majority of on-site disposal operations and most operations are completed by hazardous waste treatment facilities. The amount of cadmium disposed of off-site has declined despite a relatively consistent number of facilities reporting off-site disposals. The amount of cadmium transferred has also increased since 2003. Over this period, more waste is being transferred for treatment before final disposal, while less waste is being transferred for metals recycling and recovery operations. Most of the waste transferred comes from only a small number of facilities in the non-ferrous smelting and refining industry.
Figure 8. Onsite disposals reported in tonnes to NPRI 1994-2020 by disposal type*

Long description
A bar chart showing tonnes of cadmium reported by onsite disposal activity types with a line showing the number of facilities conducting onsite disposal activities. Data are noted in the following table where 0s indicate a very small quantity of disposals and N/A indicates no disposal reported.
| Year | Land Treatment | Landfill | Tailings Management | Underground Injection | Waste Rock management | Number of facilities |
|---|---|---|---|---|---|---|
| 1994 | N/A | 21.70 | N/A | N/A | N/A | 2 |
| 1995 | N/A | 30.60 | N/A | N/A | N/A | 4 |
| 1996 | N/A | 2.62 | N/A | N/A | N/A | 1 |
| 1997 | N/A | 3.35 | N/A | N/A | N/A | 4 |
| 1998 | N/A | 2.62 | N/A | N/A | N/A | 1 |
| 1999 | 0.00 | 141.37 | N/A | N/A | N/A | 3 |
| 2000 | N/A | 129.51 | N/A | N/A | N/A | 3 |
| 2001 | N/A | 137.40 | N/A | N/A | N/A | 2 |
| 2002 | 0.12 | 150.79 | N/A | 0.00 | N/A | 66 |
| 2003 | 0.23 | 67.68 | N/A | 0.00 | N/A | 81 |
| 2004 | 0.23 | 43.31 | N/A | 0.00 | N/A | 94 |
| 2005 | 0.28 | 206.99 | N/A | 0.00 | N/A | 86 |
| 2006 | 0.38 | 216.73 | 238.18 | 0.00 | 6.95 | 132 |
| 2007 | 0.28 | 1257.89 | 242.13 | 0.00 | 8.48 | 137 |
| 2008 | 0.33 | 513.51 | 261.05 | 0.01 | 25.11 | 134 |
| 2009 | 0.06 | 3648.84 | 208.25 | 0.00 | 16.19 | 131 |
| 2010 | 0.10 | 479.74 | 203.70 | 0.00 | 14.08 | 134 |
| 2011 | 0.03 | 1869.64 | 189.85 | 0.00 | 18.16 | 132 |
| 2012 | 0.09 | 257.69 | 214.25 | 0.00 | 19.04 | 148 |
| 2013 | 0.11 | 249.35 | 169.58 | 0.00 | 16.99 | 153 |
| 2014 | 0.03 | 696.08 | 174.62 | 0.00 | 51.10 | 155 |
| 2015 | 0.05 | 625.53 | 192.44 | 0.00 | 19.30 | 142 |
| 2016 | 0.01 | 1103.51 | 172.15 | 0.00 | 20.25 | 136 |
| 2017 | 0.04 | 1220.88 | 197.71 | 0.01 | 14.80 | 145 |
| 2018 | 0.02 | 1221.28 | 290.91 | 0.01 | 28.00 | 154 |
| 2019 | 0.01 | 1080.93 | 265.68 | 0.01 | 48.19 | 163 |
| 2020 | 0.01 | 1302.00 | 313.14 | 2.47 | 58.65 | 158 |
* Note: The 2009 and 2011 values for landfill contain a potential reporting error. One facility in the waste disposal sector reported 3119 tonnes of cadmium in 2009 and 1584 tonnes in 2011 compared to approximately 100 tonnes or less in other years. Data were kept in the report as they appear in the NPRI dataset as entered by the reporting facilities.
Figure 9. Offsite disposals reported to NPRI 1994-2020 by disposal type and number of facilities conducting disposal activities*

Long description
A bar chart showing amounts of cadmium reported by offsite disposal activity types with a line showing the number of facilities conducting disposal activities. Data are noted in the following table where 0s indicate a very small quantity of disposals and N/A indicates no disposal reported.
| Year | Land treatment | Landfill | Storage | Tailings management | Underground injection | Waste rock management | Number of facilities |
|---|---|---|---|---|---|---|---|
| 1994 | N/A | 9.33 | N/A | N/A | N/A | N/A | 4 |
| 1995 | N/A | 21.57 | N/A | N/A | N/A | N/A | 7 |
| 1996 | N/A | 19.48 | N/A | N/A | N/A | N/A | 7 |
| 1997 | N/A | 180.11 | N/A | N/A | N/A | N/A | 14 |
| 1998 | N/A | 186.16 | N/A | N/A | N/A | N/A | 12 |
| 1999 | N/A | 127.99 | 0.10 | N/A | N/A | N/A | 13 |
| 2000 | N/A | 137.41 | N/A | N/A | N/A | N/A | 16 |
| 2001 | 0.15 | 149.42 | 6.84 | N/A | N/A | N/A | 17 |
| 2002 | 0.63 | 175.29 | 1.02 | N/A | N/A | N/A | 108 |
| 2003 | 0.96 | 77.56 | 0.61 | N/A | N/A | N/A | 149 |
| 2004 | 0.78 | 151.59 | 0.38 | N/A | N/A | N/A | 160 |
| 2005 | 0.78 | 79.26 | 3.28 | N/A | N/A | N/A | 143 |
| 2006 | 0.90 | 66.59 | 5.09 | N/A | N/A | 0.04 | 150 |
| 2007 | 0.86 | 76.10 | 0.73 | N/A | N/A | 0.00 | 147 |
| 2008 | 0.90 | 61.18 | 1.85 | 0.02 | 0.06 | 0.00 | 140 |
| 2009 | 1.07 | 131.34 | 0.78 | 0.10 | 0.08 | 0.38 | 150 |
| 2010 | 1.56 | 156.74 | 0.73 | N/A | 0.07 | 0.31 | 156 |
| 2011 | 4.95 | 129.46 | 0.62 | 0.19 | 0.07 | 0.34 | 151 |
| 2012 | 1.08 | 161.44 | 0.49 | 0.11 | 0.14 | 0.22 | 146 |
| 2013 | 1.03 | 160.23 | 17.51 | 0.09 | 0.16 | 0.08 | 138 |
| 2014 | 1.18 | 148.49 | 6.19 | 0.12 | 0.14 | 0.09 | 142 |
| 2015 | 1.16 | 148.25 | 0.48 | 0.08 | 0.00 | 0.14 | 130 |
| 2016 | 1.28 | 75.54 | 0.46 | 0.12 | 0.00 | 0.09 | 132 |
| 2017 | 1.15 | 64.39 | 0.44 | 0.09 | 0.00 | 0.16 | 132 |
| 2018 | 1.49 | 31.41 | 29.50 | 0.13 | 0.00 | 0.03 | 144 |
| 2019 | 1.46 | 34.80 | 13.01 | 0.20 | 0.01 | 0.02 | 146 |
| 2020 | 1.24 | 28.43 | 0.40 | 0.20 | 0.17 | 0.03 | 148 |
* Note: in the NPRI database, there was likely a reporting error for one facility in 1999 who reported 12 thousand tonnes of cadmium in onsite disposals. This value was left out of the chart for this analysis as its inclusion would make it difficult to read the chart for other reporting years.
Figure 10. Transfers reported to NPRI 1997-2020 by treatment type

Long description
A bar chart showing the amount of transfer activities by treatment type for cadmium from 1997 to 2020. A line shows the number of facilities reporting transfers. Data are noted in the following table where 0s indicate a very small quantity of disposals and N/A indicates no disposal reported.
| Year | Biological treatment | Chemical treatment | Energy recovery | Incineration / Thermal | Municipal sewage treatment plant | Other | Physical treatment | Recovery of acids and bases | Recovery of catalysts | Recovery of inorganic materials (not metals) | Recovery of metals and metal compounds | Recovery of organic substances (not solvents) | Recovery of pollution abatement residues | Recovery of solvents | Refining or re-use of used oil | Number of facilities |
|---|---|---|---|---|---|---|---|---|---|---|---|---|---|---|---|---|
| 1997 | N/A | 9.48 | N/A | 0.02 | 0.01 | 1.02 | N/A | N/A | N/A | N/A | 144.04 | N/A | N/A | N/A | N/A | 6 |
| 1998 | N/A | N/A | N/A | 11.00 | 0.00 | 2.33 | N/A | N/A | N/A | N/A | 144.00 | N/A | N/A | N/A | N/A | 7 |
| 1999 | N/A | 0.06 | 6.00 | 6.00 | 0.08 | 0.00 | 0.29 | N/A | N/A | 0.16 | 194.26 | N/A | N/A | N/A | N/A | 10 |
| 2000 | N/A | N/A | N/A | N/A | 0.02 | N/A | 1.90 | N/A | N/A | 4.01 | 186.31 | N/A | N/A | N/A | N/A | 10 |
| 2001 | N/A | N/A | N/A | 8.80 | 0.02 | 2.56 | 1.75 | N/A | N/A | 16.16 | 160.11 | N/A | N/A | N/A | N/A | 12 |
| 2002 | 0.16 | 12.77 | 0.00 | 0.01 | 0.14 | 3.04 | 4.98 | N/A | N/A | 0.11 | 199.31 | N/A | 0.52 | N/A | N/A | 83 |
| 2003 | 0.18 | 13.29 | 0.22 | 0.04 | 0.13 | 1.00 | 3.84 | N/A | N/A | 0.01 | 281.59 | 0.01 | 0.89 | N/A | 0.00 | 107 |
| 2004 | 0.14 | 5.23 | 0.02 | 0.08 | 0.09 | 0.80 | 17.50 | N/A | 0.00 | 0.04 | 285.85 | N/A | 0.86 | N/A | 0.00 | 108 |
| 2005 | 0.10 | 2.00 | 0.02 | 0.20 | 0.17 | 1.31 | 11.62 | 0.00 | 0.00 | 0.05 | 377.67 | N/A | 1.02 | N/A | N/A | 111 |
| 2006 | 0.05 | 4.13 | 0.05 | 0.16 | 0.10 | 2.68 | 3.31 | 0.00 | 0.00 | 0.07 | 413.29 | 0.01 | 1.31 | N/A | 0.00 | 107 |
| 2007 | 0.06 | 2.69 | 0.01 | 1.22 | 0.07 | 0.56 | 428.36 | N/A | 0.00 | 0.16 | 310.52 | 0.01 | 1.23 | N/A | 0.00 | 109 |
| 2008 | 0.01 | 4.59 | 0.01 | 0.08 | 0.12 | 0.55 | 470.98 | N/A | 0.00 | 0.23 | 667.52 | N/A | 1.22 | N/A | 0.00 | 103 |
| 2009 | 0.04 | 5.26 | 0.02 | 1.67 | 0.08 | 0.52 | 252.16 | 0.00 | 0.00 | 0.19 | 530.36 | 0.00 | 0.87 | N/A | 0.00 | 108 |
| 2010 | 0.04 | 5.69 | 0.04 | 1.51 | 0.07 | 2.14 | 183.73 | 0.00 | 0.03 | 0.19 | 1573.94 | 0.00 | 1.00 | N/A | 0.00 | 101 |
| 2011 | 0.45 | 5.65 | 0.02 | 10.70 | 0.08 | 1.73 | 305.72 | N/A | 0.05 | 0.10 | 1028.46 | N/A | 1.13 | N/A | 0.01 | 105 |
| 2012 | 0.21 | 3.31 | 0.03 | 1.76 | 0.07 | 1.29 | 305.90 | N/A | 0.05 | 0.07 | 570.23 | N/A | 0.21 | 0.01 | 0.01 | 115 |
| 2013 | 0.23 | 8.71 | 0.04 | 2.61 | 0.06 | 2.99 | 440.27 | N/A | 0.05 | 0.05 | 466.76 | 0.00 | 0.20 | 0.00 | 0.01 | 110 |
| 2014 | 0.33 | 11.39 | 0.00 | 7.44 | 0.05 | 3.56 | 498.91 | N/A | 0.04 | 0.10 | 338.48 | 0.00 | 0.07 | N/A | 0.01 | 101 |
| 2015 | 0.35 | 19.15 | 0.00 | 3.45 | 0.08 | 2.51 | 656.61 | N/A | 0.04 | 0.09 | 179.92 | 0.00 | 0.12 | N/A | 0.01 | 100 |
| 2016 | 0.24 | 16.55 | 0.01 | 44.18 | 0.07 | 0.43 | 668.48 | N/A | 0.04 | 0.02 | 236.11 | 0.05 | 0.23 | N/A | 0.03 | 102 |
| 2017 | 0.28 | 25.22 | 0.01 | 34.77 | 0.07 | 0.47 | 566.05 | N/A | 0.06 | 0.02 | 104.06 | 0.00 | 0.19 | N/A | 0.01 | 101 |
| 2018 | 0.24 | 19.81 | 0.01 | 3.98 | 0.06 | 16.01 | 519.40 | N/A | 0.00 | 0.02 | 113.68 | 0.46 | 0.19 | N/A | 0.73 | 112 |
| 2019 | 0.03 | 43.85 | 0.04 | 5.99 | 0.10 | 0.84 | 582.52 | N/A | 0.00 | 0.02 | 473.39 | 0.47 | 0.41 | N/A | 0.99 | 110 |
| 2020 | 0.02 | 21.53 | 0.09 | 7.49 | 0.04 | 0.69 | 630.38 | 0.17 | N/A | 0.02 | 404.49 | 0.01 | 0.87 | N/A | 0.88 | 115 |
Findings and Recommendations
According to 2020 data from the NPRI and APEI, most cadmium is released to the air and about half as much is released to water. Releases of cadmium to air mainly come from base metals smelting and refining while releases to water mainly come from wastewater treatment and pulp and paper. Releases to land are very small and also come mostly from the pulp and paper industry.
NPRI and APEI show that releases of cadmium to the environment have declined significantly since 1994, mostly due to reductions in releases to air from base metals smelting and refining. Releases to land vary substantially over time, but are generally lower from 2013 to 2020 than from 2005 to 2012 and have mostly come from the pulp and paper and wood products manufacturing sectors. Releases to water have also been reduced over time because of reductions in releases from base metals smelting and refining. The sector contributions of cadmium releases to water have changed over the years, where wastewater treatment and pulp and paper production are now the main sources of releases.
Releases of cadmium to water from pulp and paper facilities have shown declines over time while, releases from wastewater treatment facilities did not show a significant trend over time. However, as noted in section 2.4.1, release estimates from wastewater treatment facilities are dependent on the volume of water processed by the facility. Only a small amount of cadmium was reported to be transferred from industrial facilities to wastewater treatment plants. Since wastewater treatment plants are not themselves sources of cadmium, it appears that municipal wastewater treatment plants are receiving cadmium from sources unaccounted for in NPRI reporting. This may include either smaller facilities without reporting obligations, use and disposal of consumer products containing cadmium, or another unknown source (for example atmospheric deposition or runoff for combined sewer/water systems). While cadmium concentrations measured in wastewater effluent are low and similar to levels found through environmental monitoring of surface water (see section 3.2.3), the total volume of wastewater processed across Canada is quite large. As such, cadmium entering municipal wastewater systems from sources such as facilities not subject to NPRI reporting requirements or consumer products may represent an important source of releases to the aquatic environment. Not all wastewater treatment plants report to NPRI and so cumulatively, releases may be significant given the number of wastewater treatment facilities in Canada and the volume of effluent discharged to water.
Over time, industrial facilities have reported to NPRI that they transfer more cadmium waste to specialized hazardous waste treatment facilities who typically use landfilling as final disposal method, after treating the waste. Only small amounts of cadmium enter the environment from hazardous waste treatment facilities according to release data reported to the NPRI.
It is recommended that release inventories continue to collect and report on industrial releases. Where facilities are required to estimate releases based on measured values below detection limits, inventories may wish to explore improvements to estimation methods to make reporting more accurate and to the way the data is presented to provide context on detection rates.
2.2 Pollutants affecting whales and their prey inventory tool
Several species of whales are listed as Endangered under Canada’s Species at Risk Act (2002), including the Southern Resident Killer Whale (Orcinus orca) or SRKW, and the St Lawrence Estuary Beluga (Delphinapterus leucas) or SLEB. Environmental contaminants are listed as a key threat to viability and recovery of endangered whale populations in Canada in the Recovery Strategies developed for these whales (Fisheries and Oceans Canada, 2012, 2018). The Recovery Strategy for the Northern and Southern Resident Killer Whales recommends identifying and prioritizing key contaminants and their sources, reducing the introduction of chemical pollutants into the habitats of killer whales and their prey, and mitigating the impacts of currently and historically used legacy pollutants (for example PCBs, PBDEs).
The Pollutants Affecting Whales and their Prey Inventory Tool (PAWPIT) was created to identify and prioritize contaminants and their sources that are potentially affecting endangered whales in Canada and their primary prey. The tool was initially developed for killer whales in the Salish Sea and their prey Fraser Basin Chinook salmon (Oncorhynchus tshawytscha), but is now being expanded to include St Lawrence Estuary Beluga. PAWPIT uses environmental monitoring data from various levels of government as well published reports and scientific studies to develop the estimates, using extrapolation and correlations to close data gaps where needed. PAWPIT has several data layers including: a geospatial database of estimated releases of pollutants, a database of contaminated sites, an analysis of contaminant loads in ambient freshwater, and exceedances of environmental quality guidelines for water in these areas.
A source of contaminants within the scope of PAWPIT is defined as being any identified source of release of contaminants to air, water, or land in areas identified as habitat for the whales or their prey. There may be sources outside the spatial extent that deposit into the area of interest, such as sources producing air emissions and long-range transport of those emissions. These sources are not included in the releases database as of this version of PAWPIT, but may be captured in the Contaminant Load Analysis, which is based on ambient freshwater monitoring data and streamflow. Release estimates in the PAWPIT are different from those in NPRI, because PAWPIT includes any facility or activity found to be releasing contaminants, including facilities that would not meet NPRI’s reporting requirements and contaminants releases below reporting thresholds. Additionally, PAWPIT records disposal activities as releases to land. Finally, PAWPIT only covers about 13% of the land area of Canada because of its focus on the habitats of endangered whales and their prey.
2.2.1 Releases to water
PAWPIT data indicates that releases of cadmium from effluents from mining, pulp and paper, wastewater treatment plants, surface runoff, seafood processing plants, leachate from landfills and dumpsFootnote 4 , wood waste leachate, and various other commercial facilities, to water bodies in the areas of interest for killer whales and St Lawrence Beluga totalled approximately 24 tonnes in 2017. This is an underestimate because it does not include releases from landfill leachate or wood waste leachate in the St Lawrence Estuary region, which were not available at the time of writing. The total number of these sites is about 2,600, the majority of which are wastewater treatment plants and solid waste facilitiesFootnote 5 (Table 1).
2.2.2 Releases to land
PAWPIT estimates that 1,250 tonnes of cadmium were released to land in 2017. It is important to note that PAWPIT inventories all releases to land, including those that would be characterized in NPRI as disposal activities. Examples of disposal activities that are counted as releases to land in PAWPIT but not in NPRI include waste rock, tailings ponds, and hazardous waste landfills. It is important to recognize that many of these contaminants are considered contained and do not represent contamination of water bodies and ecosystems. With this in mind, excluding on-site disposals, PAWPIT estimates releases of cadmium to land to be approximately 11 tonnes in 2017.
2.2.3 Surface water runoff
Runoff is excess precipitation like rain or snow that does not evaporate or percolate into the ground. This water then flows over land into streams, lakes, rivers, and the sea. A significant amount of the rainfall is absorbed into the ground depending on type of surface. As land becomes more urbanized, natural areas are replaced with materials that do not absorb water like roads, roofs, and parking lots. This increases the amount of runoff. As runoff moves over land, it can pick up contaminants from soils and lawns, farms and fields, roadways, and even forests where pesticides have been used. Runoff flow and contamination are a function of many things including rainfall, slope of the land, ability of land to absorb water, vegetation, as well as land use and activities present.
In PAWPIT, land use is currently divided into 3 general types:
- urban areas such as streets, parking lots, residential roofs, commercial buildings and other areas characterized by less permeable surfaces than other land-use types;
- agricultural areas including crop farms, animal farms, and fields; and
- other non-urban areas like forests, wetlands, wild prairie and grasslands, deserts, and beaches.
Surface water runoff in PAWPIT was characterized using a combination of hydrological data and modelling as well as contaminant concentration data found in scientific studies for different land-use types. Runoff flows and land uses were estimated for most of the area of interest for killer whales but only for selected segments of the St Lawrence River Basin closest to the St Lawrence Estuary Beluga critical habitat. For these areas only, the estimate of cadmium in surface water runoff is approximately 5 tonnes, or about 22% of the total releases to water as per the current estimate.
| Sector | Killer whales/ Chinook - Water | Killer whales/ Chinook - Land | St Lawrence river basin - Water | St Lawrence river basin - Land | Totals - Water | Totals - Land |
|---|---|---|---|---|---|---|
| Mining | 1.55 | 10.54Footnote 6 | 2.47 | 14.81 | 4.02 | 25.35 |
| Pulp & paperFootnote 7 | 2.26 | 0.61 | 10.06Footnote 8 | 0.53 | 12.32 | 1.14 |
| LandfillsFootnote 9 | 0.60 | N/D | 0.03 | 1,207.64Footnote 10 | 0.63 | 1,207.64 |
| Seafood processing | 0.04 | N/D | 0.14 | N/D | 0.18 | N/D |
| Spills | 0.01 | 0.01 | 0.00 | N/D | 0.01 | 0.01 |
| Wood waste leachate | 0.04 | 0.04 | N/D | 0.01 | 0.04 | 0.05 |
| Wastewater treatment | 0.07 | 0.02 | 0.90 | 0.01 | 0.97 | 0.03 |
| Other commercial facilities | 0.02 | N/D | 0.13 | 9.01 | 0.15 | 9.01 |
| Surface water runoff | 1.40 | N/D | 2.94 | N/D | 4.34 | N/D |
| Totals | 5.99 | 11.21 | 16.67 | 1,232.01 | 22.66 | 1,243.22 |
2.2.4 Contaminant load analysis
The contaminant load analysis estimates contaminant loads in ambient freshwater using water quality monitoring data and streamflow. This analysis was used to estimate the amount of contaminants across freshwater monitoring stations in the areas of interest. Environment and Climate Change Canada has monitoring stations set up across Canada representing urban, rural, and remote areas where atmospheric pollution is recorded from local and long-range sources (see section 3). While sediments and atmospheric deposition of pollutants from local and long range sources are not included in the current database, their impact may be captured by the contaminant load analysis.
The contaminant load analysis uses time series for ambient freshwater pollutant levels in surface water from 2003 to present to estimate levels of contaminants, where sufficient data is available. Currently, a contaminant load analysis for the Fraser Basin for 2003 to 2018 is available, and one is being developed for select areas in the St Lawrence River Basin. Comparing the contaminant load analysis to the release data can indicate whether there are missing sources and gauge where pollutants are ending up. The contaminant load analysis concentration data is also compared to environmental quality guideline and benchmark values and PAWPIT maps out areas where there are exceedances. This can identify where existing controls may not be sufficient to protect habitat from pollution.
Analyses of water quality data used in the contaminant load analysis have shown exceedances of environmental quality guidelines for cadmium in 2004 to 2006 in the Lower Fraser River. An analysis of more recent water quality data is underway.
Findings and recommendations
Data from 2017 PAWPIT estimates agree with NPRI that pulp and paper is the primary contributor to cadmium releases to water, though differences in accounting for disposals make it difficult to compare releases to land between PAWPIT and the other inventories. PAWPIT also estimates releases from a significant number of facilities and sources that do not report releases of cadmium to NPRI, leading to a much larger number of estimated releases to land and water, despite covering a much smaller area of Canada. This suggests that, smaller sources of release that do not meet the reporting requirements and thresholds set by NPRI, may be important contributors to the overall, cumulative releases of cadmium to the environment.
Using PAWPIT to compare release estimates with levels of cadmium measured in water through the contaminant load analysis indicates that some sources of metals (as well as other pollutants) may be missing from PAWPIT estimates. For example, surface water runoff may also represent a significant source of cadmium entering water.
It is recommended that Environment and Climate Change Canada consider identifying sources of cadmium releases to the environment and municipal wastewater that are not captured by NPRI on a national scale as data from wastewater monitoring (see section 2.3) and PAWPIT suggest that these sources may be important contributors to cadmium levels in the environment.
2.3 Releases from municipal landfill leachate and municipal wastewater
2.3.1 Municipal solid waste landfill leachate
Municipal solid waste landfills receive waste from both industrial and residential sources. Cadmium may be present in the waste as a result of industrial processes or due to disposal of cadmium-containing products. Through the mixing of waste and exposure to environmental conditions, liquid runoff from landfills (leachate) may contain a number of toxic substances, including inorganic cadmium compounds. It may take several years for cadmium to leach out of waste in landfills. It is estimated that for Canadian municipal solid waste landfills, approximately 5.5% of leachate is released directly to the environment, 7.1% is treated on site and then discharged to the environment and 87.4% is treated at a wastewater treatment plant (Conestoga Rovers, 2015). Data on the chemical make-up of the leachate collected over time can provide an estimate of the amount of cadmium that is entering the environment from waste disposal activities.
Under the Chemicals Management Plan, leachate sampling was conducted at Canadian municipal solid waste landfills between 2008 and 2013. Landfills selected for sampling permitted to receive 40,000 tonnes of municipal solid waste per year, had a minimum of 1 million tonnes of waste in place, and had operating leachate collection systems. Thirteen landfills voluntarily participated in the study, four in western Canada and nine in central Canada. Over the 2008-2013 period, cadmium was detected in 43% of leachate samples. The average concentration in pre-treated landfill leachate was 0.38 ug/L for total cadmium; although the median concentrations were below detection limits. This indicates that most samples were below detection limits, but some samples had concentrations well above detection limits. The maximum value detected was 2.25 ug/L. Following onsite treatment, the estimated average rate of removal was 6.7%.
Based on this data and using the highest 10% of leachate values (90th percentile) to calculate a worst-case scenario, it was estimated that, at most, 23.6 kg (0.0236 tonnes) of cadmium per year is released to the environment from landfill leachate in Canada, including leachate treated by municipal wastewater treatment plants (Conestoga Rovers, 2015). Performing the same calculation using the average cadmium concentrations in landfill leachate rather than the top 10% of values, the estimate of environmental loading was reduced to 3.7 kg (0.0037 tonnes) of cadmium per year (Conestoga Rovers, 2015). There were no clear trends in the data to indicate a change in cadmium levels in leachate over time suggesting that waste materials received by these municipal solid waste landfills contained about the same levels of cadmium over the 2009 to 2013 period.
The average and maximum values reported by the Chemicals Management Plan leachate sampling are similar to those reported for Europe where municipal solid wastes had cadmium contents of 0.2 to 12 mg/kg with average leachate concentrations between 0.5 and 3.4 ug/L (European Chemicals Bureau, 2007).
2.3.2 Municipal wastewater
Municipal wastewater treatment plants serve approximately 86% of Canada’s population. Municipal wastewater refers to used water from homes, businesses, industries and institutions that drains into sewers. It contains sanitary sewage and is sometimes combined with storm water from rain or melting snow draining off rooftops, lawns, parking lots and roads. Municipal wastewater can contain human and other organic waste, nutrients, pathogens, microorganisms, suspended solids and household and industrial chemicals. Treating wastewater before it is released into lakes and rivers reduces the risks posed to human health and the environment.
There are 3 kinds of wastewater treatment that facilities can perform:
- Primary treatment: Removing a portion of suspended solids and organic matter by physical and/or chemical processes
- Secondary treatment: Removing organic matter and suspended solids using biological treatment processes
- Tertiary/advanced treatment: Removing specific substances of concern (solids, nutrients and/or contaminants) after secondary treatment using a number of physical, chemical or biological processes
About 96% of municipal wastewater in Canada is treated before being discharged, while about 4% is discharged untreated (Environment and Climate Change Canada, 2020). Examining the levels of cadmium in wastewater can provide an indication of the use and disposal of cadmium containing products and the amount of cadmium entering the environment from use and disposal activities. Substances in products may be put down the drain in domestic and industrial facilities served by wastewater treatment plants. Additionally, the majority of landfill leachates are processed by wastewater treatment facilities before being discharged to the environment.
Wastewater is sampled annually under the Chemicals Management Plan. The wastewater sampling program is designed to look at representative wastewater treatment plants for a number of toxic substances. This helps to balance the many different needs for monitoring toxic substances and provides data that is representative to wastewater treatment type, and geographic regions. Due to this arrangement, it is not possible for site-specific temporal trends to be established.
Between 2009 and 2019, 317 influent (wastewater before treatment) and effluent (wastewater after treatment) samples from 36 wastewater treatment plants were analyzed. Cadmium was detected in 48% of influent samples, and 41% of effluent samples. The levels of cadmium measured in influent are related to upstream inputs and do not appear to be correlated with the volume of water flowing through each plant; nor do they appear to be correlated with estimated percentages of residential versus commercial inputs to the wastewater system.
Wastewater treatment removes cadmium from the influent by partitioning to solids, reducing the overall levels of cadmium in the effluent. The efficiency of treatment methods varies, with facultative and aerated lagoons being significantly more effective at removing cadmium from wastewater at an average rate of 85 to 86%, compared to primary, secondary and advanced treatment processes, which remove cadmium at rates between 71 and 73%. The maximum influent concentration of cadmium was 16.9 µg/L, which was reduced to below the limit of detection in the effluent. 90% of wastewater treatment plants had median influent concentrations of 0.17 µg/L or less. The maximum effluent concentration was 1.65 µg/L. 90% of wastewater treatment plants had median effluent concentrations of 0.05 µg/L or less.
Cadmium is an element and cannot be destroyed or broken down further. Cadmium removed from wastewater during treatment processes ends up in the sludge. Sludge is the organic solid material removed or generated during wastewater treatment processes. Facilities may treat sludge to generate biosolids for land application, fertilizer, or compost; or it may be treated as waste and sent to landfills or incinerated. Since most of the cadmium entering wastewater treatment facilities is removed from the water during the treatment process and found in biosolids, looking at the levels of cadmium in municipal biosolids will also indicate changes in domestic and industrial uses of cadmium containing products. Analyzing municipal biosolids will provide insight into the amount of cadmium being added to land through their use.
Municipal biosolids were sampled 197 times from 27 wastewater treatment plants over the 2009 to 2019 period. Cadmium was detected in 98% of samples, being below the limit of detection in four cases. 90% of wastewater treatment plants had median cadmium concentrations in biosolid samples below 2.50 µg/g and 75% had medians below 1.48 µg/g. The two plants with concentrations above the 90th percentile (2.50 µg/g) were significantly higher. One had a median of 34.7 µg/g (max 94.0 µg/g, min 7.50 µg/g) and the other had a median of 17.0 µg/g (max 17.4 µg/g, min 5.30 µg/g). Both these facilities were sampled in the 2009 to 2011 sampling period and again in the 2018 to 2019 period, where concentrations declined. There does not appear to be a correlation with the volume of wastewater processed at each plant and cadmium concentrations of biosolids, nor with the estimated percentages of residential versus commercial inputs to the wastewater system. The two facilities with the highest concentrations of cadmium in biosolids were in the 50th and 75th percentiles respectively for both influents and effluents. The biosolids from the first facility are destined for land application, and those from the second facility are incinerated.
The Canadian Council of Ministers of the Environment, Bureau de Normalisation du Quebec, and Canadian Food Inspection Agency have standards for concentrations of trace metals in fertilizers and soil supplements. The Canadian Council of Ministers of the Environment and Bureau de Normalisation du Quebec use a threshold approach to recommend the maximum levels of trace metals in composts depending on the end use (Bureau de normalisation & du Québec, 2016; Canadian Council of Ministers of the Environment, 2005). For compost that can be used without limits in any application such as agriculture, residential gardens, nurseries and horticultural operations, the standard is 3 mg/kg (or 3 µg/g). The maximum cadmium content for compost where its use should be restricted is 20 mg/kg (20 µg/g). Compost with cadmium levels higher than 20 mg/kg should be used only for specific circumstances in accordance with provincial and territorial rules or disposed of appropriately. Provinces and territories may have their own standards for compost that apply.
The Canadian Food Inspection Agency uses a set of metal limits for fertilizers and soil supplement products based on a calculation that takes into account soil loading over a 45-year period according to the labelled application rate (Canadian Food Inspection Agency, 2021). The cumulative application approach is intended to account for the persistence of metals in the environment, which ultimately determines the level of contamination and long-term impacts. The standards apply to total metal content and are conservative to account for long-term cumulative effects of metals on plant, animal and human health. They further account for metal concentrations in soils, and plant uptake factors such as soil acidity and soil cation exchange capacity.
Biosolids that were destined for use in land applications were below the content limits for unrestricted use, except for at one facility in eastern Canada which had much higher cadmium levels than maximum content set in the compost standards for restricted use set by the Canadian Council of Ministers of the Environment and Bureau de Normalisation du Quebec (Table 2). This facility was sampled in warm and cold seasons from 2009 to 2011 and again in summer in 2018 and 2019. The cadmium levels in biosolids in the 2018 and 2019 samples were higher than the unrestricted use content, but lower than the restricted use content. It is not possible to compare the concentrations of municipal biosolids used for land application with the metals standards set by the Canadian Food Inspection Agency, because those standards are set based on rates of application according to product labels.
| Biosolids destination | Number of wastewater treatment plants | Number of samples | Average | Median | Minimum | Maximum |
|---|---|---|---|---|---|---|
| Compost | 4 | 28 | 1.09 | 0.76 | 0.49 | 2.22 |
| Forest fertilization | 1 | 6 | 2.15 | 2.09 | 1.91 | 2.45 |
| Land application | 16 | 106 | 7.87 | 0.97 | 0.00 | 94.00 |
| Mine reclamation | 1 | 9 | 2.07 | 2.08 | 1.80 | 2.36 |
| Landfill | 1 | 12 | 0.92 | 0.91 | 0.37 | 1.37 |
| Incineration | 4 | 36 | 5.92 | 5.35 | 0.34 | 17.40 |
In sum, cadmium is present in the influent, effluent, and biosolids of wastewater treatment plants as a result of inputs from residential and industrial activities. Although not designed to do so, wastewater treatment plants are effective at removing cadmium from influent. Cadmium removed from water is captured in biosolids, which are often destined for land application. Cadmium levels in municipal biosolids used for land application are generally not above thresholds for use set by the Canadian Council of Ministers of the Environment and Bureau de Normalisation du Quebec.
Findings and recommendations
Although not reported to NPRI, it is likely that cadmium from products and industrial waste is entering municipal solid waste landfills, given the presence of cadmium in leachate samples. Leachate data from municipal solid waste landfills suggested that they are unlikely to be a large source of cadmium releases to the environment, which is consistent with the findings of other studies (Five Winds International, 2001; Young & Lund, 2006), though this could change if larger amounts of cadmium are being disposed of as the leaching of cadmium from waste could take several years. There was not enough data available from monitoring of municipal solid waste landfills or wastewater treatment facilities to determine trends over time or to compare sites to each other. Monitoring data from municipal solid waste landfills and wastewater treatment facilities were also not able to provide a clear picture of releases of cadmium from product use and disposal.
It is recommended that monitoring of wastewater influent, effluent and municipal biosolids should continue. Where possible, data collection should support the development of time series to better track changes in cadmium levels. Leachate from municipal solid waste landfills should be periodically monitored as data show that more cadmium waste is being disposed of over time.
2.4 Environmental effects monitoring
In Canada, some federally regulated industries are required to monitor effluent (wastewater) released from their facilities to identify potential effects caused by effluents on fish, fish habitat and use of fish by humans. Environmental effects monitoring is a performance measurement tool used to evaluate the adequacy of effluent regulations in protecting fish, fish habitats and the usability of fisheries resources. Environmental effects monitoring studies include water quality monitoring, effluent chemical characterization, effluent sublethal toxicity testing, and biological monitoring in the environment.
Relevant to this evaluation, there are two industrial sectors that report releases of cadmium to the National Pollutant Release Inventory (NPRI) that also are required to conduct environmental effects monitoring. These are the metal and diamond mining sector, regulated by the Metal and Diamond Mining Effluent Regulations, and the pulp and paper sector, regulated by the Pulp and Paper Effluent Regulations (see Section 4.1 for details on the regulations). Provincial and territorial legislation and permitting requirements may also require environmental monitoring; however, these are beyond the scope of this evaluation.
Data collected under environmental effects monitoring programs will provide insight into the levels of cadmium released in effluents from industrial sectors. While the NPRI provides an idea of total releases to the environment, environmental effects monitoring data is useful to consider because it will give an understanding of how much cadmium is typically entering the environment by facility effluent at a given point in time. Using this data, it is possible to see whether there are patterns in cadmium concentrations across mines and pulp and paper facilities respectively.
2.4.1 Releases from metal and diamond mining
The Metal and Diamond Mining Effluent Regulations require that mines conduct water quality monitoring and effluent characterization four times per year. The purpose of effluent characterization and water quality monitoring is to support the interpretation of biological monitoring studies which assess and investigate any mine-related effects on fish health, habitat, food sources, and usability of fish for human consumption. Effluent characterization is conducted by analyzing a sample of effluent to provide information on the concentrations of contaminants.
Water quality monitoring is conducted by collecting and analyzing samples of water from the exposure area surrounding the point of entry of effluent into water from each final discharge point and from the related reference areas. In addition, samples of water are collected and analyzed from sampling areas in receiving environments where biological monitoring is completed.
At the same time, sublethal toxicity testing is also required. This testing monitors effluent quality by measuring survival, growth and/or reproduction endpoints in marine or freshwater organisms in a controlled laboratory environment.
Certain types of mines have been required to submit the results of their environmental effects monitoring and effluent characterization to Environment and Climate Change Canada since December 2002 (see section 4.1.1.4), when environmental monitoring requirements were added to the regulations. Between 2004 and 2021 cadmium was found to be present in reference areas, effluent and exposure areas, at nearly all mine sites. Detection rates for cadmium in samples taken from reference areas ranged from 93-99% (present at 96% to 100% of mines), and 94% to 99% in exposure areas (present at 96% to 100% of mines). In effluent, cadmium was detected between 6% and 34% of the time in samples taken between 2004 and 2018 (present at 17% to 53% of mines), but following the new analytical requirements introduced by the 2018 MDMER amendments, cadmium was detected in effluent between 88% and 92% of samples taken between 2019 and 2021 (present at 95% to 99% of mines).
When cadmium was detected, levels in samples taken from reference areas were the lowest and levels in effluent samples were the highest; although, there was a high degree of variability in the range of cadmium concentrations reported from year to year and from mine to mine. Cadmium levels found in the reference area were sometimes higher than those found in the exposure area, indicating that there may be natural sources of cadmium present, or that the reference area may be influenced by other anthropogenic sources. Overall, median cadmium concentrations recorded in effluent, exposure, and reference areas have generally declined over time (Figure 11). Median cadmium levels in exposure areas of mining facilities are higher than those reported in surface water reported in section 3.2.3.2, except for in the Arctic Ocean drainage area and Hudson Bay drainage basins, which have naturally high cadmium levels. However, there were still some drainage areas within the larger Arctic Ocean and Hudson Bay drainage basins where cadmium levels in exposure and reference areas were higher than those recorded by freshwater quality monitoring and surveillance programs.
In reference and exposure areas where cadmium was detected, some samples exceeded the Canadian water quality guidelines for the protection of aquatic life. The percentage of samples exceeding Canadian environmental quality guidelines declined over time (Figure 12). A similar pattern follows for the percentage of mine sites that had at least one sample over the Canadian water quality guidelines each year. In 2004, 92% of mines reporting cadmium levels above detection in reference areas had reported levels that exceeded the long-term Canadian water quality guideline and 72% exceeded the short-term water quality benchmark. For exposure sites in 2004, 69% of mines reported values that exceeded the long-term water quality guideline and 42% reported values that exceeded the short-term benchmark. In 2021, 29% of mines reporting cadmium levels above detection limits in reference areas had at least one sample exceeding long-term water quality guidelines and 12% exceeding the short-term benchmark. For exposure areas, 38% of mines reported levels exceeding long-term water quality guidelines and 14% reported levels exceeding the short-term water quality benchmark in 2021. Further investigation may be warranted for sites with exceedances of water quality guidelines, especially for those exceeding the short-term benchmark.
In examining cadmium levels in effluent, only comparisons to the short-term water quality benchmark are appropriate, since this would tell us if the effluent may be acutely toxic. The number of samples collected, the number of samples where cadmium has been detected, and the number of samples exceeding the short-term water quality benchmark have increased over time (Figure 13). However, the percentage of samples exceeding short-term water quality guidelines has declined over time and remained relatively stable, typically at less than 5%.
Figure 11. Median cadmium concentration in effluent, exposure areas, and reference areas reported under regulatory requirements
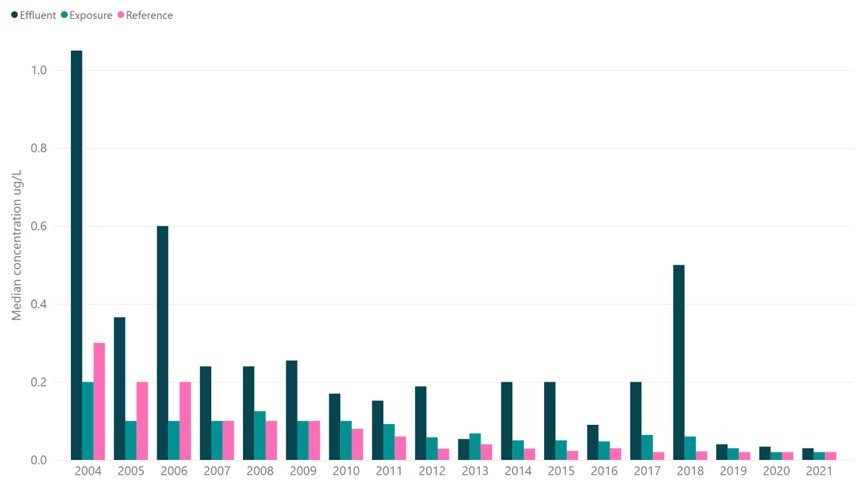
Long description
Bar chart showing median cadmium concentrations (µg/L) in effluent, exposure areas, and reference areas reported under the MDMER between 2004 and 2021. Concentrations in each category have declined over time. Effluents have more cadmium than reference or exposure areas, exposure areas typically have higher concentrations than reference areas except for between 2004 and 2006. Data are reported in the following tables:
| Year | Median | Min | Max | Standard deviation |
|---|---|---|---|---|
| 2004 | 1.050 | 0.010 | 300.000 | 53.528 |
| 2005 | 0.366 | 0.010 | 300.000 | 45.062 |
| 2006 | 0.600 | 0.020 | 67300.000 | 4723.214 |
| 2007 | 0.240 | 0.003 | 300.000 | 22.776 |
| 2008 | 0.240 | 0.003 | 140.000 | 14.780 |
| 2009 | 0.255 | 0.003 | 20.100 | 2.752 |
| 2010 | 0.170 | 0.010 | 95000.000 | 13927.312 |
| 2011 | 0.152 | 0.010 | 15.000 | 2.297 |
| 2012 | 0.189 | 0.005 | 194000.000 | 19696.532 |
| 2013 | 0.054 | 0.017 | 3.860 | 0.673 |
| 2014 | 0.200 | 0.020 | 16.110 | 3.741 |
| 2015 | 0.200 | 0.010 | 273000.000 | 29436.180 |
| 2016 | 0.090 | 0.005 | 7.580 | 1.182 |
| 2017 | 0.200 | 0.007 | 4.760 | 0.796 |
| 2018 | 0.500 | 0.005 | 9580.000 | 885.552 |
| 2019 | 0.040 | 0.001 | 36.950 | 2.807 |
| 2020 | 0.034 | 0.002 | 542000.000 | 20032.913 |
| 2021 | 0.030 | 0.001 | 774000.000 | 28124.318 |
| Year | Median | Min | Max | Standard deviation |
|---|---|---|---|---|
| 2004 | 0.200 | 0.005 | 40.000 | 4.547 |
| 2005 | 0.100 | 0.003 | 7580.000 | 346.686 |
| 2006 | 0.100 | 0.003 | 17600.000 | 731.560 |
| 2007 | 0.100 | 0.003 | 140.000 | 6.661 |
| 2008 | 0.125 | 0.003 | 50.000 | 3.540 |
| 2009 | 0.100 | 0.002 | 200.000 | 9.768 |
| 2010 | 0.100 | 0.002 | 113000.000 | 4391.835 |
| 2011 | 0.092 | 0.003 | 180.000 | 8.595 |
| 2012 | 0.058 | 0.003 | 30.000 | 1.992 |
| 2013 | 0.068 | 0.003 | 19300.000 | 1237.224 |
| 2014 | 0.050 | 0.003 | 397000.000 | 23853.187 |
| 2015 | 0.050 | 0.002 | 10.000 | 1.328 |
| 2016 | 0.048 | 0.003 | 10.000 | 1.073 |
| 2017 | 0.064 | 0.002 | 14.000 | 0.919 |
| 2018 | 0.060 | 0.002 | 15000.000 | 851.924 |
| 2019 | 0.030 | 0.002 | 171000.000 | 6896.460 |
| 2020 | 0.020 | 0.001 | 18000.000 | 698.003 |
| 2021 | 0.020 | 0.002 | 26000.013 | 1255.417 |
| Year | Median | Min | Max | Standard deviation |
|---|---|---|---|---|
| 2004 | 0.300 | 0.011 | 30.000 | 3.979 |
| 2005 | 0.200 | 0.010 | 6320.000 | 463.248 |
| 2006 | 0.200 | 0.010 | 100.000 | 11.293 |
| 2007 | 0.100 | 0.003 | 67.900 | 4.212 |
| 2008 | 0.100 | 0.003 | 30.000 | 2.225 |
| 2009 | 0.100 | 0.003 | 30.000 | 2.454 |
| 2010 | 0.080 | 0.002 | 40.000 | 2.613 |
| 2011 | 0.060 | 0.002 | 30.000 | 2.032 |
| 2012 | 0.029 | 0.003 | 18800.000 | 1219.879 |
| 2013 | 0.040 | 0.003 | 48100.000 | 2101.242 |
| 2014 | 0.029 | 0.003 | 20.000 | 1.536 |
| 2015 | 0.023 | 0.003 | 38400.000 | 2208.410 |
| 2016 | 0.030 | 0.003 | 37300.000 | 2286.982 |
| 2017 | 0.020 | 0.005 | 43.600 | 1.879 |
| 2018 | 0.022 | 0.004 | 154.000 | 6.944 |
| 2019 | 0.020 | 0.002 | 63200.000 | 2685.100 |
| 2020 | 0.020 | 0.001 | 1850.000 | 75.334 |
| 2021 | 0.020 | 0.001 | 6470.000 | 265.321 |
Figure 12. Percentage of samples containing cadmium with concentrations exceeding long-term Canadian fresh water quality guidelines and short-term benchmarks
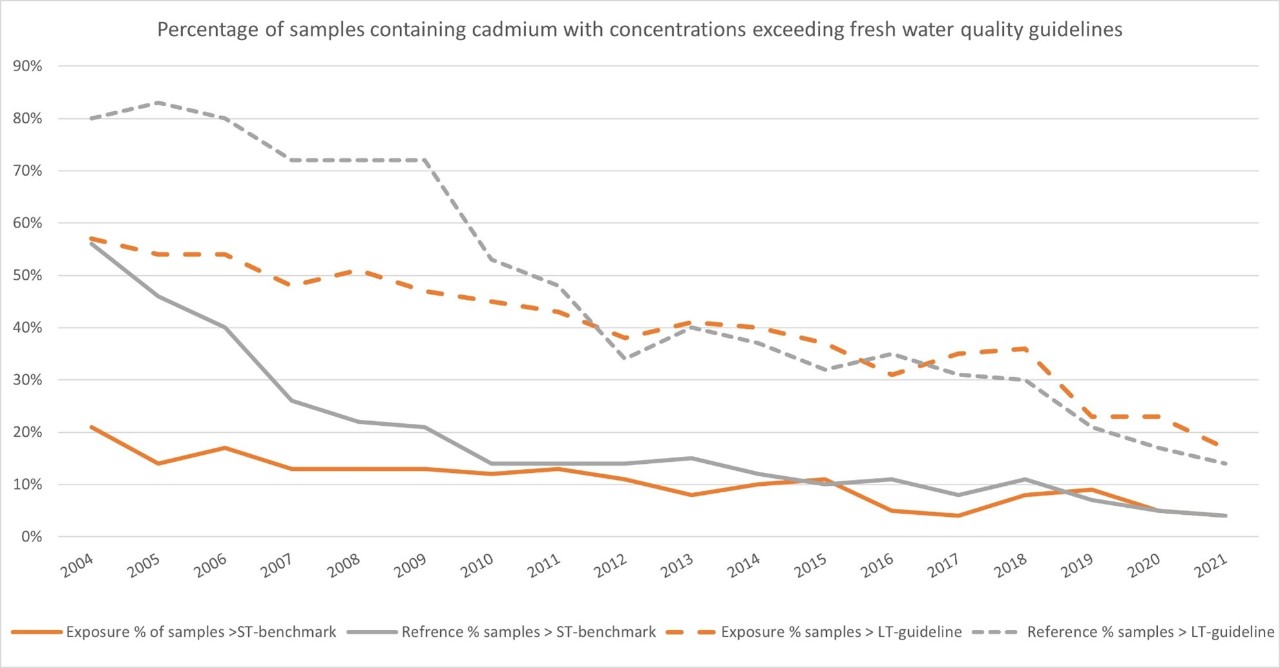
Long description
A line graph showing decreasing trends in the percentage of samples exceeding fresh water quality guidelines and short term benchmarks in reference and exposure areas. Data are reported in the following tables:
| Year | Number of samples | Percent with cadmium detected | Percent exceeding long term guideline | Percent exceeding short term benchmark |
|---|---|---|---|---|
| 2004 | 280 | 97% | 57% | 21% |
| 2005 | 492 | 97% | 54% | 14% |
| 2006 | 587 | 99% | 54% | 17% |
| 2007 | 649 | 98% | 48% | 13% |
| 2008 | 595 | 99% | 51% | 13% |
| 2009 | 691 | 99% | 47% | 13% |
| 2010 | 679 | 97% | 45% | 12% |
| 2011 | 577 | 98% | 43% | 13% |
| 2012 | 413 | 99% | 38% | 11% |
| 2013 | 289 | 97% | 41% | 8% |
| 2014 | 281 | 98% | 40% | 10% |
| 2015 | 308 | 99% | 37% | 11% |
| 2016 | 336 | 95% | 31% | 5% |
| 2017 | 311 | 99% | 35% | 4% |
| 2018 | 318 | 97% | 36% | 8% |
| 2019 | 658 | 94% | 23% | 9% |
| 2020 | 695 | 96% | 23% | 5% |
| 2021 | 683 | 96% | 17% | 4% |
| Year | Number of samples | Percent with cadmium detected | Percent exceeding long term guideline | Percent exceeding short term benchmark |
|---|---|---|---|---|
| 2004 | 241 | 96% | 80% | 56% |
| 2005 | 337 | 97% | 83% | 46% |
| 2006 | 358 | 97% | 80% | 40% |
| 2007 | 383 | 98% | 72% | 26% |
| 2008 | 419 | 99% | 72% | 22% |
| 2009 | 413 | 99% | 72% | 21% |
| 2010 | 414 | 98% | 53% | 14% |
| 2011 | 457 | 96% | 48% | 14% |
| 2012 | 478 | 99% | 34% | 14% |
| 2013 | 528 | 99% | 40% | 15% |
| 2014 | 516 | 98% | 37% | 12% |
| 2015 | 518 | 98% | 32% | 10% |
| 2016 | 544 | 97% | 35% | 11% |
| 2017 | 556 | 97% | 31% | 8% |
| 2018 | 533 | 98% | 30% | 11% |
| 2019 | 597 | 93% | 21% | 7% |
| 2020 | 642 | 95% | 17% | 5% |
| 2021 | 631 | 94% | 14% | 4% |
Figure 13. Number of effluent samples collected relative to the number of cadmium detections and exceedances of the short-term water quality benchmark over time

Long description
A stacked chart showing the total number of samples collected, and of those, how many contained cadmium, and further, how many of the samples had cadmium present in levels exceeding the short term fresh water quality benchmark. Data are noted in the following table
| Year | Number of samples | Percent with cadmium detected | Percent exceeding short term benchmark |
|---|---|---|---|
| 2004 | 369 | 8% | 13% |
| 2005 | 510 | 34% | 9% |
| 2006 | 686 | 29% | 5% |
| 2007 | 697 | 25% | 1% |
| 2008 | 837 | 13% | 8% |
| 2009 | 849 | 11% | 4% |
| 2010 | 810 | 10% | 4% |
| 2011 | 863 | 11% | 3% |
| 2012 | 854 | 11% | 3% |
| 2013 | 984 | 7% | 2% |
| 2014 | 921 | 6% | 12% |
| 2015 | 958 | 9% | 11% |
| 2016 | 1046 | 12% | 2% |
| 2017 | 1157 | 10% | 2% |
| 2018 | 1181 | 10% | 4% |
| 2019 | 748 | 88% | 5% |
| 2020 | 840 | 91% | 3% |
| 2021 | 894 | 92% | 3% |
2.4.2 Releases from pulp and paper
Under the Pulp and Paper Effluent Regulations, sublethal toxicity testing is required once or twice per calendar year depending on whether the mill deposits effluent for more or less than 120 days per year. Sublethal toxicity testing is conducted on effluent from the outfall structure that has potentially the most adverse environmental impact. This testing monitors effluent quality by measuring survival, growth and/or reproduction endpoints in marine or freshwater algae and invertebrate organisms in a controlled laboratory environment. The requirement to also test a fish species was removed in amendments made to the regulations in 2008.
Biological monitoring studies are conducted in 3- or 6-year cycles. The requirements for each study are dependent on the results of the previous cycle’s results. To assess effects, biological monitoring studies are conducted for 3 components: 1) a study respecting the fish population to assess effects on fish health; 2) a study respecting the benthic invertebrate community to assess fish habitat or fish food; and 3) a study respecting fish tissue dioxins and furans to assess the human usability of the fisheries resources. The studies for the fish population and benthic invertebrate community components are conducted in both exposure and reference areas.
The environmental effects monitoring shows a marked improvement in effluent quality since the introduction of the regulations. However, the data from biological monitoring studies show that mill final effluents from 77% of the mills in operation in 2019 have impacts on receiving environments. The national average pattern of effects for fish was typical of those conditions related to nutrient enrichment, co-occurring with metabolic disruption (reduced gonad size), and the national pattern of effects for fish habitat (benthic invertebrate communities) was typical of various degrees of eutrophication (that is, nutrient enrichment conditions).
Mills subject to the regulations continue to investigate and monitor environmental effects. Studies indicated that the observed effects may be linked with elevated levels of organic matter in mill effluents. Effluent characterization analyses used to report the concentrations of metals in effluent is not currently a requirement under this regulation. However, amendments to the regulation will likely introduce quarterly effluent characterization analysis and water quality monitoring requirements are also being considered.
Similar to wastewater treatment facilities, pulp and paper facilities report releases of cadmium to water to the NPRI using calculations based on source testing, published emission factors, or site-specific engineering estimates. In 2020, there were 23 facilities that conducted effluent testing and reported average cadmium concentrations in effluent ranging from 0.08 to 12.9 µg/L. Only one facility reported that cadmium levels in effluent were below detection limits for all samples; however, their reported detection limit was the highest at 5 µg/L. Data from provincial monitoring programs collected for the PAWPIT on pulp and paper effluent facilities in British Columbia estimated an average cadmium concentration of approximately 5 µg/L.
Findings and recommendations
Cadmium was usually present in reference areas, effluent, and exposure areas of mining operations. The percentage of samples that exceeded environmental quality guidelines declined over time even though detection rates and the number of samples increased. Cadmium levels in mining effluent are infrequently above levels expected to be acutely toxic to aquatic life; however, cadmium levels in exposure areas are still above long-term environmental quality guidelines about 17% of the time. In some cases, cadmium levels were higher in reference areas than exposure areas, and reference areas levels were higher than the long-term guideline 14% of the time. There may be upstream activities or natural processes that should be accounted for when evaluating the impacts of the mining operation.
Environmental effects monitoring of pulp and paper effluent is useful for evaluating the Pulp and Paper Effluent Regulations, but is currently of limited value for the evaluation of performance measurement for cadmium because the effluent is not characterized. Data collected under the existing environmental effects monitoring requirements show whether the environment is impacted, and provide some information as to what is causing impacts, but the role of specific metals in the impacts is unknown. Effluent characterization being considered for the new amendments to the regulations would help to shed light on the causes of environmental impacts. As noted in section 2, pulp and paper facilities account for a large portion of cadmium releases to water reported to NPRI. Characterization of effluent and metals monitoring in exposure areas could help to draw conclusions regarding environmental impacts of pulp and paper facilities.
It is recommended that:
- further investigation be considered for mining effluent exposure areas and reference areas where cadmium levels are higher than calculated guideline levels.
- requirements for effluent characterization for metals including cadmium should be included in the amended regulations to help assess the environmental impacts of cadmium releases from pulp and paper facilities and inform future performance measurement evaluations.
2.5 Conclusion on releases of cadmium from human sources
Release inventories are important tools to track trends in releases of cadmium to the environment over time. Trends in reported environmental release are indicators that can help determine if risk management approaches are effective and whether progress has been made to achieve the risk management objective to reduce releases of inorganic cadmium compounds to the environment to the lowest extent feasible. Progress has been made in achieving the risk management objective as total releases reported to NPRI have declined by more than 93% since 1994. There have been marked declines in reported releases to air, water, and land for the sectors of concern identified in the 1994 Assessment (metal production, stationary fuel combustion, transportation, solid waste disposal, sewage sludge application). At the same time, other sectors that were not identified as concerns in the 1994 assessment have begun to make up a larger part of the cadmium releases profile, in particular manufacturing of pulp and paper and wood products. Additional work is needed to better understand releases from sources not captured by NPRI reporting to determine whether additional risk management action should be considered.
3. Cadmium in the environment
As previously noted, cadmium enters the environment through both human and natural sources. As part of the Government’s commitment to protecting human health and the environment, a number of different programs monitor toxic substances, including cadmium in air, water, sediments, fish, and wildlife.
In order to assess whether progress has been made in achieving the environmental objective, an analysis of trends of cadmium levels in the environment is required. It is important to consider natural background concentrations in this analysis as well as compare environmental cadmium concentrations to established guidelines or adverse effects thresholds.
3.1 Air
Cadmium enters the atmosphere from natural processes like volcanic eruptions, erosion and dust, and forest fires, but most cadmium in the air comes from human activities as noted in section 2. When released into the atmosphere, cadmium compounds are associated with respirable-sized airborne particles, known as air particulate matter (PM). These particles can be carried long distances and deposited onto the earth below by rain or falling out of the air. Breathing air with high levels of cadmium is harmful to people and animals.
Particles are defined by their diameter for air quality regulatory purposes. Particles less than or equal to 2.5 micrometers in diameter, or PM2.5, are known as “fine” particles. Those larger than 2.5 micrometers but less than or equal to 10 micrometers are known as “coarse” particles (PM10-2.5). PM10 refers to all particles less than or equal to 10 micrometers in diameter. PM contains a broad range of chemical species, including elemental and organic carbon compounds, oxides of silicon, aluminum and iron, trace metals, sulphates, nitrates and ammonium.
Air quality has been monitored for over fifty years in Canada by a number of government programs. The National Air Pollution Surveillance (NAPS) program was established in 1969 to monitor and assess the quality of outdoor air in Canadian neighbourhoods with the goal of providing accurate and long-term air quality data of a uniform standard across Canada (Celo & Dabek-Zlotorzynska, 2011; Environment and Climate Change Canada, 2022g; Government of Canada, 2022a). It is a joint program of federal, provincial, territorial and some regional government partners. Air quality data for a variety of pollutants are currently collected from nearly 260 NAPS stations Canada-wide. NAPS began measuring metals in air in 1984. Analysis initially included both coarse and fine particulate matter by Energy Dispersive X-ray Fluorescence spectrometry method (ED-XRF) which is not sensitive enough for most of the elements. In 2004, NAPS added the metal analysis of PM2.5 by Inductively Coupled Plasma Mass Spectrometry (ICP-MS) method at 5 sampling sites. This method is much more sensitive and allowed for measurements of very low levels of toxic elements in air particulate matter. As of 2022, metals are routinely measured by ICP-MS in PM2.5 at 14 NAPS sites and in PM10-2.5 at selected sites.
Long-term air quality data for PM10 is also available from the Great Lakes Basin Monitoring and Surveillance Program, which has operated at 3 sites since the 1980s. The monitoring stations are located on Burnt Island, in Northern Lake Huron; Egbert, in eastern Lake Huron/Georgian Bay; and Point Petre in eastern Lake Ontario.
Short-term projects have also been completed to better understand air quality contaminants, sources, and cumulative risks to human health in the environment. For example:
- as part of a comprehensive 2015 to 2016 near-road study, trace elements were monitored in particulate matter collected at 3 near-road monitoring stations established in the downtown area and near a busy highway in Toronto, and beside a major trucking route in Vancouver (Celo et al., 2021; Dabek-Zlotorzynska et al., 2019)
- air quality was measured at five sites near oil sands processing activities from 2010 to 2017, under the Joint Canada-Alberta Implementation Plan for Oil Sands Monitoring (JOSM) Program (Mamun et al., 2021)
- the Air Toxics in Canada (ATiC) project was initiated in 2009 to provide data to support an assessment of cumulative risk of toxic substances in air. The work under this study has led to a baseline understanding of ambient air toxics measurements in Canada and has identified several knowledge gaps for which research is ongoing
- new Canadian-led passive sampling techniques were recently developed to measure trace metals in air (Gaga et al., 2019) and may help to provide new data for areas where traditional sampling methods are not suitable as passive sampling offers several advantages in terms of cost, maintenance, ease of use and no need for electricity or infrastructure
The data collected through Environment and Climate Change Canada’s research supports government policies, programs and research studies including the Air Quality Health Index, Canadian Environmental Sustainability Indicators, and the US-Canada Air Quality Agreement. Declining trends in cadmium measured in air indicates that progress has been made to achieve the environmental objective.
3.1.1 Air quality guidelines
To protect people and the environment from cadmium in the air, many provinces established air quality guidelines for outdoor ambient air; however, there are no federal air quality guidelines for cadmium in place. Guidelines for cadmium are typically calculated as the average cadmium concentration in either particulate matter over a period of one year (annual) or over 24 hours. Quebec has established an air quality guideline (norm) for cadmium in particulate matter of 0.0036 µg/m3 annual (3.6 ng/m3) (Ministère de l’Environnement, de la Lutte contre les changements climatiques, 2022). Ontario’s annual ambient air quality guideline for cadmium is 0.005 µg/m3 (5 ng/m3) and the 24-hour air quality guideline is 0.025 µg/m3 (25 ng/m3) (Ontario Ministry of the Environment, Conservation and Parks, 2020). Additionally, the European Union set annual air quality standards of 0.005 µg/m3 in PM10, in line with the air quality guidelines developed by the World Health Organization (European Environment Agency, 2021). Although other Canadian provinces have also set ambient air quality guidelines, the guidelines for Ontario and Quebec are the lowest and are the ones that will be used in this evaluation.
Another important indicator to consider in this evaluation of the effectiveness of risk management measures for cadmium is the amount of times cadmium levels in air exceeded air quality guidelines put in place to protect the environment and human health. It is important to note that the guidelines developed by Ontario are based on evaluation of impacts to human health, not the environment. Quebec’s guidelines were developed based on toxicological modelling as well as considerations for background levels, costs and benefits to public health, industry competitiveness, and technological feasibility (Ministère de l’Environnement, de la Lutte contre les changements climatiques, 2022).
3.1.2 Levels of cadmium in Canadian air and comparisons with air quality guidelines
A review of monitoring data collected by the programs and studies noted above has found that average cadmium levels were similar in particulate matter in both urban and rural areas.
Average cadmium levels in fine particulate matter ranged from 0.04-0.09 ng/m3 between 2004 and 2019. Over this period, Montreal, QC and Windsor, ON had the highest average and median cadmium concentrations. The maximum level of cadmium recorded was in Edmonton, AB; (outlier, not shown in Figure 14, see Table 3). However, there was no exceedance of the 24-hour air quality guideline of ON and of annual ambient air quality guidelines of ON and QC. Halifax had the lowest average and median concentrations of cadmium. Studies in the Alberta Oil Sands Region, for the 2016 to 2017 period, showed that the main source of cadmium in the region was wildfires (Mamun et al., 2021). The highest concentrations, ranging from 0.26 to 0.38 ng/m3, were recorded during the wildfires in Alberta in May 2016. However, the concentrations of cadmium are lower or comparable to most of the urban sites in Canada. Cadmium levels do not appear to be correlated with seasonality (Celo & Dabek-Zlotorzynska, 2011; Li et al., 2020), though it appears that higher levels of cadmium are observed in areas affected by local or regional industrial activities, for example non-ferrous metal smelting. Even though monitoring stations may not be located near industrial areas, cadmium in particulate matter travels far from the source of release. For example, residential areas can receive particulate matter from industrial activities happening in a different neighbourhood or a different city.
Monitoring data show that 53% to 79% of cadmium and its compounds reside in the PM2.5 fraction (Table 5). This means that monitoring cadmium concentrations in PM2.5 only leaves a potentially significant amount of cadmium unaccounted for. As noted by Galarneau et al. (2016), including the coarse particulate matter fraction in the measurement of cadmium in ambient air is important in order to ensure that the relative burden of metals in air is not underestimated. Cadmium levels in PM10 and PM2.5 measured across programs did not exceed the Ontario or Quebec annual ambient air quality guidelines.
Figure 14. Concentration of cadmium in air at NAPS and Oil Sands monitoring locations between 2004 and 2019

Long description
A box and whisker plot showing the average, median, and quantiles of cadmium levels recorded in air by the National Air Pollutants Surveillance program between 2004 and 2019. Whisker lines note the 10th and 90th percentile values. Boxes represent 25th, 50th, and 75th percentile values. Averages are marked with an +, medians are marked with a horizontal line in the box. Outliers not shown. See Table 3 for values.
All values were below air annual quality guidelines of 5 ng/m3 and 24-hour guidelines of 25 ng/m3
| Location | Years of operation | Detection frequency | Minimum | Maximum | Median | Mean | Standard deviation |
|---|---|---|---|---|---|---|---|
| Halifax | 2012 to 2019 | 64.9 | 0.009 | 2.38 | 0.02 | 0.03 | 0.08 |
| Saint John | 2010 to 2019 | 66.0 | 0.009 | 0.87 | 0.03 | 0.04 | 0.05 |
| Canterbury | 2004 to 2009 | 72.9 | 0.005 | 0.30 | 0.03 | 0.04 | 0.03 |
| Montreal | 2004 to 2019 | 95.7 | 0.009 | 12.02 | 0.09 | 0.21 | 0.55 |
| St. Anicet | 2014 to 2017 | 83.2 | 0.008 | 0.74 | 0.04 | 0.06 | 0.07 |
| Ottawa | 2012 to 2019 | 83.5 | 0.009 | 0.54 | 0.05 | 0.06 | 0.07 |
| Windsor | 2004 to 2019 | 96.1 | 0.008 | 1.11 | 0.12 | 0.15 | 0.13 |
| Toronto | 2004 to 2019 | 90.0 | 0.005 | 4.72 | 0.06 | 0.09 | 0.17 |
| Hamilton | 2013 to 2019 | 93.3 | 0.009 | 0.73 | 0.07 | 0.10 | 0.09 |
| Wallaceburg | 2010 to 2012 | 83.5 | 0.009 | 0.72 | 0.08 | 0.09 | 0.08 |
| Simcoe | 2010 to 2019 | 91.8 | 0.009 | 2.00 | 0.06 | 0.07 | 0.10 |
| Edmonton | 2010 to 2019 | 85.4 | 0.008 | 14.89 | 0.05 | 0.09 | 0.49 |
| Burnaby | 2010 to 2019 | 76.3 | 0.009 | 2.35 | 0.03 | 0.07 | 0.14 |
| Abbotsford | 2004 to 2019 | 80.2 | 0.005 | 2.59 | 0.04 | 0.06 | 0.11 |
| Alberta Oil Sands - Fort McKay | 2016 to 2017 | 78.9 | 0.005 | 0.28 | 0.02 | 0.03 | 0.04 |
| Alberta Oil Sands - Lower Camp | 2011 to 2015 | 62.8 | 0.004 | 3.50 | 0.02 | 0.04 | 0.21 |
| Alberta Oil Sands - Mannix | 2011 to 2015 | 61.9 | 0.004 | 0.53 | 0.02 | 0.03 | 0.06 |
| Alberta Oil Sands - Buffalo Viewpoint | 2017 | 65.5 | 0.005 | 0.25 | 0.02 | 0.03 | 0.04 |
| Alberta Oil Sands - Syncrude | 2011 to 2015 | 59.2 | 0.004 | 0.75 | 0.02 | 0.03 | 0.06 |
| Alberta Oil Sands - Wapasu Creek | 2016 to 2017 | 53.4 | 0.005 | 0.33 | 0.01 | 0.02 | 0.05 |
| Alberta Oil Sands - Stony Mountain | 2016 to 2017 | 53.7 | 0.005 | 0.38 | 0.01 | 0.02 | 0.04 |
| Near Road Study - HWY 401 | 2015 to 2019 | 96.9 | 0.009 | 4.49 | 0.06 | 0.08 | 0.20 |
| Near Road Study - Vancouver | 2015 to 2019 | 90.9 | 0.009 | 0.63 | 0.04 | 0.07 | 0.09 |
| Location | Years of operation | Detection frequency | Minimum | Maximum | Median | Average | Standard deviation |
|---|---|---|---|---|---|---|---|
| Burnt Island | 1995 to 2013 | 84.5 % | 0.002 | 1.2 | 0.05 | 0.09 | 0.11 |
| Egbert | 1995 to 2008 | 94.3 % | 0.009 | 1.4 | 0.11 | 0.15 | 0.15 |
| Point Petre | 1995 to 2017 | 94.9 % | 0.006 | 1.1 | 0.07 | 0.10 | 0.09 |
| Site | Median concentration in PM10 (ng m-3) | Minimum concentration in PM10 (ng m-3) | Maximum concentration in PM10 (ng m-3) | Average size fraction (%) Fine (<2.5 µm) | Average size fraction (%) Coarse (2.5 to 10 µm) |
|---|---|---|---|---|---|
| Montreal, QC | 0.144 | 0.012 | 1.312 | 68.0 | 32.0 |
| Hamilton, ON | 0.134 | 0.012 | 0.420 | 78.4 | 21.6 |
| Toronto, ON | 0.115 | 0.040 | 0.515 | 74.5 | 25.5 |
| Edmonton, AB | 0.091 | 0.012 | 0.561 | 62.2 | 37.8 |
| Vancouver, BC | 0.081 | 0.027 | 0.623 | 53.1 | 46.9 |
| HWY 401, ON | 0.076 | 0.034 | 0.423 | 71.6 | 28.4 |
| Burnaby, BC | 0.049 | 0.012 | 0.672 | 74.2 | 25.8 |
| Saint John, NB | 0.039 | 0.008 | 0.149 | 75.1 | 24.9 |
The potential sources of cadmium in particles in air were also investigated. NAPS monitoring data have shown that urban sites have higher concentrations of cadmium than regional background sites (Celo & Dabek-Zlotorzynska, 2011). Wildfires are thought to be responsible for maximum cadmium levels found in samples collected in the Alberta Oil Sands region (Mamun et al., 2021). Recently, preliminary data collected by passive sampling methods suggests that urban and rural areas have higher cadmium levels than remote background regions (see Annex 2 for details). Compared to samples collected in urban areas in Europe, Japan, and the USA, samples collected in Canadian urban areas contained equal or less cadmium and other trace metals (Celo & Dabek-Zlotorzynska, 2011).
Data from sevenFootnote 11 selected NAPS sites obtained between May 2004 and December 2006 were analyzed to identify potential sources of trace metals at each sampling site (Celo & Dabek-Zlotorzynska, 2011). There were two possible sources that accounted for most of the cadmium in air: fly ash emitted from coal burning facilities, and industrial pollution including metal production and manufacturing. Natural processes and road traffic were not found to highly impact cadmium levels at the sampling sites. A recent study in dense traffic areas in Toronto and Vancouver, confirmed that the traffic does not have a significant effect on particulate matter, but that regional and local industry contributed to the levels of cadmium found in particulate matter at these urban sites (Celo et al., 2021; Jeong et al., 2019, 2020). Studies using passive sampling techniques in the Greater Toronto Area suggest that cadmium levels in particulate matter are influenced by traffic emissions and local and residential sources (Gaga et al., 2019, Annex 2), but this method is still relatively new, and further validation and investigation is necessary to make any conclusions and rule out any possible confounding factors.
In the Great Lakes region, analyses suggest that some of the cadmium in particulate matter comes from human sources; mainly fossil fuel combustion, metal processing and refining, and traffic-related exhaust sources or vehicle emissions (Li et al., 2020). Computer models were used to look at where the pollution was coming from. For cadmium, most of the pollution was found to originate in the United States, although some Canadian pollution sources were noted around Sudbury, ON and near Montreal, QC (Figure 15) (Li et al., 2020). Data continues to be collected at Point Petre, but is no longer collected at Burnt Island or Egbert, which will make this type of modelling analysis difficult to replicate in the future.
In addition to analyzing the total amount of cadmium levels in particulate matter, tests are also done to see how much of the cadmium in particulate matter can be dissolved in water. This information helps to understand the potential for exposure, long and short-term negative health effects of particulate matter and for explaining how metals move and are transported in air. NAPS data show that cadmium found in PM2.5 is more than 85% soluble at all sites. This means that most of the cadmium released in the atmosphere as part of particulate matter can be dissolved in precipitation like rain or snow, which falls to the ground or enters surface water. The dissolved cadmium can then be taken up by plants and animals. Therefore, the release of cadmium to air in particulate matter may have an important impact on the levels of cadmium observed in soils, sediments, and surface waters, as well as aquatic life.
Figure 15. Modelled source areas where cadmium is coming from based on the concentrations of cadmium in PM10 at Burnt Island, Egbert, and Point Petre monitoring stations

Long description
Three maps of eastern North America showing the likely origin areas for cadmium in particles in air recorded at each of the monitoring locations in the Great Lakes Basin. Each map shows consistently that the most likely sources of cadmium are found in the industrial areas of the United States, particularly Pennsylvania, West Virginia, Ohio and Kentucky. The model also shows some lesser sources in the Montreal and Sudbury areas.
This analysis is commonly used to identify source locations of pollutants in the region by calculating where the air carrying the particles that contained cadmium flew through. The colour grids on the map shows the following: Black shows the most likely source areas (99% likely) at the highest concentration range (shown on the legend); followed by dark green (95% to 99% likely); followed by light gray (75% to 95% likely); to most unlikely as clear colour (0% to 75% likely).
3.1.3 Trends in cadmium levels in air over time
Progress in achieving the environmental objective can be shown by decreasing levels of cadmium in the air with the objective reached when they are equal to estimated background concentrations. In the Great Lakes Basin, a decline was observed at all 3 monitoring stations since the mid 1990s (Figure 16).
About half of the stations monitored by NAPS displayed significant downward trends in cadmium concentrations in ambient air over time (Table 6). No trend was observed in: Halifax, NS; Canterbury, NB, Saint-Anicet, QC; Wallaceburg, ON, Simcoe, ON, Edmonton, AB, Burnaby, BC or Vancouver, BC. It is unclear why these sites have not shown declines; however, it could be due to contributions from natural sources, or that cadmium emissions in these areas have not been affected by Canadian risk management measures. Still, on a country level, cadmium concentrations in air have declined significantly (Figure 17). Unfortunately, there were not enough data to investigate these sites further by comparing between site types and surrounding land uses.
Figure 16. Cadmium concentrations in PM10 measured at 3 long-term monitoring stations in the Great Lakes Basin from 1995 to 2008

Long description
A box and whisker plot showing the average, median, and quantiles of cadmium levels recorded in air by the Great Lakes Basin Monitoring and Surveillance program between 1995 and 2008. Whisker lines note the 10th and 90th percentile values. Boxes represent 25th, 50th, and 75th percentile values. Averages are marked with an +, medians are marked with a horizontal line in the box. A line connects the averages showing a declining trend in concentrations. Outliers not shown. Data are noted in the following table below. N/D indicates no data available.
| Year | BNT average | BNT median | BNT standard deviation | EGB average | EGB median | EGB standard deviation | PPT average | PPT median | PPT standard deviation | Combined average | Combined median | Combined standard deviation |
|---|---|---|---|---|---|---|---|---|---|---|---|---|
| 1995 | 0.09 | 0.042 | 0.082 | 0.143 | 0.098 | 0.125 | 0.079 | 0.037 | 0.072 | 0.103 | 0.039 | 0.099 |
| 1996 | 0.145 | 0.039 | 0.17 | 0.173 | 0.14 | 0.147 | 0.139 | 0.12 | 0.11 | 0.152 | 0.11 | 0.145 |
| 1997 | 0.11 | 0.073 | 0.137 | 0.151 | 0.13 | 0.105 | 0.166 | 0.16 | 0.082 | 0.143 | 0.12 | 0.112 |
| 1998 | 0.083 | 0.047 | 0.093 | 0.181 | 0.14 | 0.241 | 0.137 | 0.11 | 0.116 | 0.134 | 0.095 | 0.169 |
| 1999 | 0.094 | 0.052 | 0.094 | 0.227 | 0.175 | 0.199 | 0.154 | 0.13 | 0.106 | 0.157 | 0.12 | 0.15 |
| 2000 | 0.079 | 0.053 | 0.08 | 0.175 | 0.15 | 0.168 | 0.138 | 0.093 | 0.134 | 0.13 | 0.075 | 0.138 |
| 2001 | 0.083 | 0.052 | 0.098 | 0.161 | 0.108 | 0.133 | 0.115 | 0.098 | 0.081 | 0.12 | 0.088 | 0.111 |
| 2002 | 0.065 | 0.05 | 0.062 | 0.166 | 0.13 | 0.132 | 0.104 | 0.079 | 0.073 | 0.112 | 0.087 | 0.103 |
| 2003 | 0.121 | 0.074 | 0.158 | 0.101 | 0.098 | 0.055 | 0.097 | 0.099 | 0.046 | 0.106 | 0.097 | 0.101 |
| 2004 | 0.091 | 0.075 | 0.104 | 0.147 | 0.11 | 0.163 | 0.127 | 0.1 | 0.084 | 0.122 | 0.096 | 0.124 |
| 2005 | 0.108 | 0.081 | 0.082 | 0.128 | 0.091 | 0.099 | 0.161 | 0.099 | 0.2 | 0.132 | 0.091 | 0.139 |
| 2006 | 0.064 | 0.035 | 0.068 | 0.128 | 0.091 | 0.144 | 0.091 | 0.052 | 0.089 | 0.094 | 0.057 | 0.108 |
| 2007 | 0.097 | 0.043 | 0.211 | 0.099 | 0.079 | 0.077 | 0.081 | 0.074 | 0.054 | 0.092 | 0.069 | 0.133 |
| 2008 | 0.061 | 0.041 | 0.055 | 0.088 | 0.085 | 0.03 | 0.069 | 0.065 | 0.04 | 0.068 | 0.054 | 0.047 |
| 2009 | 0.051 | 0.039 | 0.049 | N/D | N/D | N/D | 0.062 | 0.063 | 0.042 | 0.056 | 0.045 | 0.046 |
| 2010 | 0.056 | 0.04 | 0.055 | N/D | N/D | N/D | 0.072 | 0.052 | 0.064 | 0.064 | 0.048 | 0.06 |
| 2011 | 0.055 | 0.044 | 0.034 | N/D | N/D | N/D | 0.064 | 0.053 | 0.041 | 0.06 | 0.05 | 0.038 |
| 2012 | 0.059 | 0.04 | 0.071 | N/D | N/D | N/D | 0.067 | 0.055 | 0.055 | 0.063 | 0.044 | 0.064 |
| 2013 | 0.074 | 0.024 | 0.118 | N/D | N/D | N/D | 0.078 | 0.061 | 0.049 | 0.076 | 0.051 | 0.081 |
| 2014 | N/D | N/D | N/D | N/D | N/D | N/D | 0.03 | 0.024 | 0.019 | 0.03 | 0.024 | 0.019 |
| 2015 | N/D | N/D | N/D | N/D | N/D | N/D | 0.051 | 0.051 | 0.027 | 0.051 | 0.051 | 0.027 |
| 2016 | N/D | N/D | N/D | N/D | N/D | N/D | 0.036 | 0.024 | 0.022 | 0.036 | 0.024 | 0.022 |
| 2017 | N/D | N/D | N/D | N/D | N/D | N/D | 0.04 | 0.035 | 0.022 | 0.04 | 0.035 | 0.022 |
Figure 17. Median cadmium concentrations in PM2.5 at NAPS stations in Canada between 2010 and 2019

Long description
A box and whisker plot showing the average, median, and quantiles of cadmium levels recorded in air by the National Air Pollutants Surveillance program between 2004 and 2019. Whisker lines note the 10th and 90th percentile values. Boxes represent 25th, 50th, and 75th percentile values. Averages are marked with an +, medians are marked with a horizontal line in the box. A line connects the averages showing a declining trend in concentrations since 2010. Outliers not shown.
| Year | Average | Median | Standard deviation |
|---|---|---|---|
| 2010 | 0.141 | 0.078 | 0.190 |
| 2011 | 0.087 | 0.038 | 0.147 |
| 2012 | 0.082 | 0.044 | 0.165 |
| 2013 | 0.084 | 0.037 | 0.518 |
| 2014 | 0.091 | 0.037 | 0.427 |
| 2015 | 0.084 | 0.048 | 0.265 |
| 2016 | 0.081 | 0.041 | 0.178 |
| 2017 | 0.073 | 0.040 | 0.090 |
| 2018 | 0.065 | 0.048 | 0.063 |
| 2019 | 0.064 | 0.044 | 0.106 |
| Location | Site type | Surrounding land use | Dates of operation | Number of samples | Trend |
|---|---|---|---|---|---|
| Halifax | General population exposure | Residential | 2012 to 2019 | 949 | No trend |
| Saint John | Point source | Residential | 2010 to 2019 | 877 | Decrease** |
| Canterbury | Regional background | Un-developed | 2004 to 2009 | 406 | No trend |
| Montreal | General population exposure | Residential | 2004 to 2019 | 1598 | Decrease** |
| St. Anicet | Regional background | Agricultural | 2014 to 2017 | 208 | No trend |
| Ottawa | General population exposure | Residential | 2012 to 2019 | 497 | Decrease* |
| Windsor | Transportation source | Residential | 2004 to 2019 | 1323 | Decrease** |
| Toronto | General population exposure | Industrial | 2004 to 2019 | 1886 | Decrease** |
| HWY 401 | Transportation source | Commercial | 2015 to 2019 | 509 | Decrease* |
| Hamilton | Point source | Residential | 2013 to 2019 | 787 | Decrease** |
| Wallaceburg | Regional background | Residential | 2010 to 2012 | 158 | No trend |
| Simcoe | Regional background | Agricultural | 2010 to 2019 | 571 | No trend |
| Edmonton | General population exposure | Industrial | 2010 to 2019 | 969 | No trend |
| Burnaby | General population exposure | Residential | 2010 to 2019 | 709 | No trend |
| Vancouver | Transportation source | Residential | 2015 to 2019 | 330 | No trend |
| Abbotsford | General population exposure | Industrial and Agricultural | 2004 to 2010 and 2012 to 2019 | 1015 | Decrease** |
| Alberta Oil Sand Region – Fort McKay | Regional background | Forest | 2016 to 2017 | 232 | NA |
| Alberta Oil Sand Region - Lower Camp | Point Source | Industrial | 2011 to 2015 | 285 | No trend |
| Alberta Oil Sand Region - Mannix | Point Source | Industrial | 2011 to 2015 | 294 | Decrease** |
| Alberta Oil Sand Region - Buffalo Viewpoint | Point Source | Industrial | 2017 | 55 | NA |
| Alberta Oil Sand Region - Syncrude | Point Source | Forest | 2011 to 2015 | 223 | Decrease** |
| Alberta Oil Sand Region - Wapasu Creek | Regional background | Forest | 2016 to 2017 | 116 | NA |
| Alberta Oil Sand Region - Stony Mountain | Regional background | Industrial | 2016 to 2017 | 205 | NA |
* Indicate significance levels p<0.05
** indicate significance levels p<0.01
Site Type: Characterizes sites in terms of source influences
General Population Exposure - site located in an urban area where populations live, work, shop, play, and that are not classified as transportation or point sources
Regional Backgrounds - site outside urban area
Transportation source–influenced - site within 100 m of a major road or influenced by off-road vehicles and engines, rail, marine or aviation sources located in an urban area
Point source–influenced - site near (< ~10 km) a major stationary emissions source located in an urban area; classification based on VOC and SO2 ambient measurement data
Land use: indicates the main type of land use within a radius of 400 m from the station
Findings and recommendations
Human sources contribute to cadmium levels in air that are above natural background concentrations. Coal and fossil fuel combustion, metals production and manufacturing are the main sources of cadmium in air. Wildfires are also important sources of cadmium in particulate matter. Canadian traffic sources do not appear to contribute to cadmium levels in particulate matter (Celo et al., 2021; Celo & Dabek-Zlotorzynska, 2011). In contrast, road dust collected near highways in Toronto were found to be moderately to strongly contaminated with cadmium (Nazzal et al., 2013) and traffic related sources from the United States were found to influence cadmium levels in PM10 collected in the Great Lakes Basin (Li et al., 2020). Preliminary passive sampling studies showed differences in cadmium levels across the Greater Toronto Area (Gaga et al., 2019), though further study is needed to better understand the potential contribution of Canadian sources compared to long range sources and local industrial sources as well as explore other confounding factors.
Cadmium levels in air in Canada also appear to be affected by industrial activities in the United States. Attributive modelling is key for drawing conclusions about source contributions of cadmium in areas away from the point of release and for providing evidence to advance work under binational agreements, not only for cadmium, but a number of other substances. The closure of two monitoring stations in the Great Lakes Basin will impact the ability of this type of modelling to be replicated in the future.
Ambient air quality guidelines have not been exceeded at any of the locations monitored by Environment and Climate Change Canada programs. This indicates that progress has been made to achieve the environmental objective. However, these air quality guidelines are primarily aimed at protecting human health and may have not taken into account risks to wildlife or the effects of atmospheric deposition to cadmium levels in sediment and water.
High quality long-term monitoring data is available for core locations in Canada, despite some gaps in spatial and temporal coverage. However, air quality monitoring locations for metals have been reduced over time. Little information is available for the Prairie provinces, Newfoundland and Labrador, Prince Edward Island, and the North.
Cadmium levels in air have generally decreased over time with most monitoring station locations showing significant downward trends, although some have remained stable in recent years. Cadmium levels observed are similar to those of other developed countries.
It is recommended that:
- ambient air monitoring continues to support future performance measurement evaluations and ensure that a full range of particle sizes be collected and included in analyses where practicable
- consideration be given to expanding existing ambient air monitoring coverage for metals analysed using ICPMS to fill spatial gaps and to areas near point sources of pollution, including through cooperation with provinces and territories, as appropriate, subject to available resources
- atmospheric modelling and source attribution analyses for cadmium and other metals continue and gaps in data key to modelling activities should be filled
- further investigation of sources of cadmium in ambient air is considered to determine whether stable concentrations in some locations are due to local sources of release or due to natural or international sources
- existing ambient air quality guidelines for cadmium should be reviewed to determine their adequacy for protection of aquatic environments through atmospheric deposition and consider development of updated or new environmental quality guidelines, as needed
3.2 Aquatic environment
The federal Government operates monitoring networks in water bodies across Canada in coordination with provincial, territorial and international partners in the United States. Within the mandate to monitor the quality of transboundary waters, Environment and Climate Change Canada measures the levels of anthropogenic and naturally occurring contaminants that enter the environment and may cause harm. Due to the varied nature and complex characteristics of the contaminants being monitored, Environment and Climate Change Canada’s networks monitor chemicals dissolved or attached to suspended particles in water, those that settle out as sediments, and also those that tend to accumulate in the plants and animals living in lakes and rivers. Some compounds, like metals, have been measured since the beginning of the monitoring networks, others have been added for specific priorities, such as Canada’s Chemicals Management Plan.
3.2.1 Understanding the natural presence of cadmium in the environment and impact of aquatic conditions on toxicity
As a naturally occurring element, regional and local geology play a large role in patterns of cadmium occurrence across Canada. Natural occurrences need to be considered when interpreting environmental concentrations to determine if the levels observed in environmental monitoring programs are similar to expected background concentrations and if the observed levels are posing a risk to the environment. While a complete geological summary of Canada would be out of scope for this report, links between regional geology and occurrence of cadmium using the Great Lakes and St. Lawrence River Basin can be shown as an example. In this watershed, bedrock has an important influence on the baseline concentrations of metals found in the sediments. The bedrock in Lakes Superior and Huron and the northern watershed of the St. Lawrence River are part of the Canadian Shield. These rocks are low in calcium, resulting in lower hardness and greater acidity in the overlying waters (Figure 18). This also means that metals are leached from the bedrock more easily in these waters and are more often found in the sediment. The bedrock in Lake Erie, Lake Ontario, and the southern watershed of the St. Lawrence River is made up of sedimentary rocks, which are high in calcium. In these watersheds, the presence of calcium results in greater hardness and lower acidity, which reduces the toxicity of metals in the aquatic environment.
The differences between the upper and lower Great Lakes is an example of how the interpretation of environmental concentrations of naturally occurring elements such as cadmium should be made. With an understanding of regional geology, particularly considering the effects that geology can have on toxicity mitigating factors such as pH (the level of acidity) and calcium in aquatic systems.
Figure 18. Concentrations of Lanthanum (a) and Calcium (b) in Great Lakes Sediments

Long description
Two maps of the Great Lakes are shown. The first map shows lanthanum concentrations over the 2014 to 2018 period. Lanthanum concentrations are highest in Lake Superior and Georgian Bay and show decreasing concentrations as the water drains into Lake Huron. Lakes Erie and Ontario have very low lanthanum concentrations. The second map shows calcium concentrations in the Great Lakes. This shows an inverse pattern from the lanthanum concentrations. Calcium concentrations are highest in Lakes Ontario and Erie and lowest in Lake Superior. Only the shorelines of Lake Huron have high calcium concentrations.
Lanthanum is a naturally occurring element that can be used to indicate areas where the sediment has originated from rocks making up the Canadian Shield. Calcium concentrations indicate sediments originate from sedimentary rocks and areas where cadmium toxicity may be lower. Higher lanthanum concentrations may indicate areas where the toxicity of cadmium is greater. Areas with high calcium concentrations may indicate areas where cadmium toxicity is lower. Together, these images show the need to consider regional geology in interpreting environmental concentrations of naturally occurring elements.
In water, cadmium can be present in many different forms depending on aquatic conditions such as pH, hardness, and presence of natural organic matter (Canadian Council of Ministers of the Environment, 2014). These conditions can cause cadmium to be removed from the water and deposited into the sediment and are one of the primary factors in determining its fate and transport (Lawrence et al., 1996). Hardness, a measure of positively charged ions (cations) in water (usually, calcium and magnesium), is considered a toxicity modifying factor for cadmium and strongly influences the toxicity of cadmium to aquatic organisms (Canadian Council of Ministers of the Environment, 2014).
Cadmium is toxic to aquatic organisms because it blocks their ability to take up calcium, an essential mineral for bone growth and maintenance and muscle movement. Instead of taking in calcium, aquatic organisms take in cadmium (Roch & Maly, 1979). Waters with higher hardness reduce the toxicity of cadmium as the higher concentrations of calcium reduce the amount of cadmium taken up by aquatic organisms (McGeer et al., 2012; Niyogi & Wood, 2004). Other toxicity modifying factors such as dissolved organic carbon affect cadmium toxicity by lowering its bioavailability. In fish, the main cause of acute cadmium toxicity is the inhibition of calcium uptake and transport in the gills. Concentrations of cadmium in whole fish at a given site provide an indication of the amount of biologically available cadmium present in the aquatic system. Cadmium is readily accumulated by some aquatic organisms, such as shellfish or molluscs, and tends to accumulate in organs rather than in muscle or fat. Fish are important food sources to birds, mammals and humans, thus body burdens of cadmium are a good indicator of dietary exposure and potential associated negative effects.
3.2.2 Sediment
Cadmium enters the aquatic environment through atmospheric deposition, runoff, or industrial releases and accumulates in sediments by associating with particulate matter or precipitating out of solution. Sediments act as an important route of exposure for aquatic organisms. The concentration of cadmium in sediment is often measured by taking a sample of the top five centimeters of sediment or by using a tool to take a cross sectional sample of the underlying sediment in a way that preserves the layers of sediment that have accumulated over time in that spot. This second type of sample is called a sediment core. The rate at which sediment collects in one area over time can be used to estimate how long ago each layer was deposited. In some areas, sediment may collect very quickly, while in others it may be very slow, depending on where the sediment is coming from and the wave action or currents in the area.
Several sediment sampling campaigns have taken place across Canada since the late 1960s through various monitoring programs, including the St. Lawrence Action Plan, Great Lakes Action Plan, and Chemicals Management Plan. Under the Chemicals Management Plan, sediment monitoring has been conducted on a regular basis since the mid-2000s on surface sediments mainly in the Great Lakes-St. Lawrence River basin, with limited collections from the Atlantic Provinces and British Columbia, between 2011 and 2014.
Cadmium concentrations in sediment are used as an indicator to show progress in meeting the environmental objective. Sediment is particularly useful as an indicator, because the cores can tell us the background levels of cadmium from a long time ago and because cadmium pollution in the air, water, and land tends to accumulate in sediments. Decreasing levels of cadmium in sediments will indicate that progress has been made to achieving the environmental objective.
3.2.2.1 Sediment quality guidelines
To protect aquatic life, the Canadian Council of Ministers of the Environment (CCME) developed interim sediment quality guidelines (ISQG) and reference effect levels that can be used to evaluate the degree to which adverse biological effects are likely to occur as a result of exposure to cadmium (Canadian Council of Ministers of the Environment, 1999) in sediment. The ISQG is based on calculating the threshold effect level (TEL) for the most sensitive aquatic organisms. Adverse effects are rarely observed in aquatic organisms when cadmium concentrations in sediment are below the threshold effect level. When cadmium concentrations in sediment are between the threshold effect level and the probable effect level (PEL), adverse effects are occasionally expected to occur. At cadmium concentrations above the probable effect level, adverse biological effects are expected to occur frequently.
This report mainly uses the threshold effect level and probable effect level for analyses, but also sometimes refers to additional reference effect levels in order to better visualize the results (Table 7). These additional levels were defined by a working group of the Saint Lawrence Action Plan, which included members from Environment and Climate Change Canada and the Ministère du Développement Durable, de l’Environnement et des Parcs du Québec (Environment Canada & Ministère du Développement Durable de l’Environnement et des Parcs du Québec, 2007). The benchmarks used for cadmium in freshwater sediment are as follows:
| Rare effect level (REL): intended to monitor vulnerable sites and provide advance warning of potential contamination. Adverse effects rarely occur at this concentration | 0.33 µg/g |
|---|---|
| Threshold effect level (TEL)/interim sediment quality guideline (ISQG): lowest level at which adverse effects are observed | 0.60 µg/g |
| Occasional effect level (OEL): is the concentration above which adverse effects are anticipated in many benthic species | 1.70 µg/g |
| Probable effect level (PEL): the concentration above which adverse biological effects are frequently observed | 3.50 µg/g |
| Frequent effect level (FEL): the concentration above which adverse effects are anticipated for the majority of benthic species | 12.0 µg/g |
The exceedances of the sediment quality guidelines and benchmark values will be used to evaluate whether progress has been made to reduce the risks of cadmium to the environment. Decreasing rates of exceedances indicate that progress has been made.
3.2.2.2 Cadmium concentrations in Canada and comparisons to sediment quality guidelines
From the sampling programs mentioned previously, it is possible to see spatial differences in cadmium concentrations across the Pacific, Great Lakes, St. Lawrence and Atlantic regions (Figure 19).
Figure 19. Distribution of Cadmium Concentrations in Sediments in the Canadian Environment 2008 to 2018

Long description
Box and whisker plot showing the average and standard deviation of cadmium levels in sediments between 2008 and 2018
| Region | Year | n | MDL µg/g |
Median µg/g |
Average µg/g |
Maximum µg/g |
SD µg/g |
Reference |
|---|---|---|---|---|---|---|---|---|
| Pacific | 2011 to 2014 | 9 | <0.1 | 0.5 | 0.62 | 1.57 | 1.39 | Pelletier (WQMS, unpublished) |
| Lake Superior | 2016 | 70 | <0.1 | 1.0 | 0.90 | 1.9 | 0.44 | Burniston (WQMS, unpublished) |
| St. Mary River | 2017 | 34 | <0.1 | 0.4 | 0.47 | 1.4 | 0.31 | Burniston (WQMS, unpublished) |
| Lake Huron | 2017 | 101 | <0.1 | 0.9 | 0.95 | 4.4 | 0.77 | Burniston (WQMS, unpublished) |
| Georgian Bay | 2017 | 26 | <0.1 | 1.2 | 1.74 | 17.6 | 3.27 | Burniston (WQMS, unpublished) |
| St. Clair River | 2014 | 50 | <0.1 | 0.3 | 0.30 | 0.8 | 0.18 | Burniston (WQMS, unpublished) |
| Lake St. Clair | 2014 | 10 | <0.1 | 0.2 | 0.18 | 0.3 | 0.08 | Burniston (WQMS, unpublished) |
| Detroit River | 2014 | 10 | <0.1 | 0.4 | 1.71 | 9.5 | 3.02 | Burniston (WQMS, unpublished) |
| Lake Erie | 2014 | 44 | <0.1 | 1.1 | 1.20 | 6.5 | 0.97 | Burniston (WQMS, unpublished) |
| Lake Ontario | 2018 | 41 | <0.1 | 2.6 | 2.50 | 4.4 | 1.04 | Burniston (WQMS, unpublished) |
| Ontario tributaries | 2011 | 15 | <0.1 | 0.5 | 0.65 | 1.7 | 0.53 | Pelletier (WQMS, unpublished) |
| Lake Saint-François | 2018 | 115 | <0.1 | 0.3 | 0.39 | 1.5 | 0.35 | Pelletier, 2020 |
| Lake des Deux-Montagnes | 2008 | 22 | <0.1 | 0.4 | 0.37 | 0.6 | 0.13 | Pelletier (WQMS, unpublished) |
| Lake Saint-Louis | 2015 | 85 | <0.1 | 0.6 | 0.62 | 4.1 | 0.57 | Pelletier, 2019 |
| Petit bassin La Prairie | 2014 | 16 | <0.1 | 0.8 | 0.89 | 1.6 | 0.27 | Pelletier (WQMS, unpublished) |
| Fluvial Corridor | 2008 to 2013 | 55 | <0.1 | 0.4 | 0.71 | 3.07 | 0.76 | Pelletier (WQMS, unpublished) |
| Lake Saint-Pierre | 2013 | 101 | <0.1 | 0.1 | 0.18 | 2.2 | 0.31 | Pelletier, 2018 |
| Trois-Rivières | 2016 | 54 | <0.1 | <0.1 | 0.20 | 1.3 | 0.26 | Pelletier (WQMS, unpublished) |
| Quebec | 2012 | 44 | <0.1 | 0.3 | 0.51 | 2.6 | 0.61 | Pelletier and Blais, 2018 |
| Upper Estuary | 2009 | 45 | <0.1 | <0.1 | 0.09 | 0.2 | 0.05 | Pelletier (WQMS, unpublished) |
| Atlantic | 2011 to 2014 | 17 | <0.1 | 0.2 | 0.93 | 9.6 | 2.31 | Pelletier (WQMS, unpublished) |
Pacific sector
In the Pacific region, surficial sediment samples and a sediment core were collected at six locations in southern British Columbia between 2011 and 2014 (Figure 20). Four of the six locations had cadmium levels below the interim sediment quality guidelines. Cadmium concentrations at Frederick Lake and Still Creek exceeded the threshold effect level and some samples reached the occasional effect level. For Still Creek, the high concentrations are likely attributable to industries located nearby in the Vancouver Industrial Park. The sediment core taken at Still Creek shows a gradual increase in cadmium concentration since the 1960s, suggesting that there are current active source(s) of cadmium in the area.
Figure 20. Cadmium concentrations in sediments collected between 2011 and 2014 in Southern British Columbia (Colours of points are based on CCME quality criteria for cadmium)

Long description
A map of southern British Columbia with six sediment core sampling locations taken between 2011 and 2014: Frederick Lake, Still Creek, Serpentine River, Mill Creek, Osoyoos Lake, and Beaver Creek. Mill Creek and Osoyoos Lake had low cadmium concentrations, Serpentine River, Beaver Creek, and one sample from Still Creek showed moderately low cadmium concentrations. A second sample from Still Creek and Frederick Lake showed cadmium concentrations above the threshold effect level. A second chart shows a sediment core profile taken from Still Creek. The profile shows increasing cadmium concentrations in sediments since the early 1950s to the late 2000s, with a sharp increase after 1960. Concentrations began at about 0.5 µg/g in the 1950s and are around 1.8 µg/g in the late 2000s.
Great Lakes Region
Lake Superior, St. Mary’s River, Lake Huron and Georgian Bay
Median cadmium concentrations remained the same in Lake Superior, St. Mary’s River and Lake Huron between the 1968 to 1973 sampling period and the 2010 to 2018 sampling period. However, the average concentrations declined by 32% in Lake Superior, and 38% in Lake Huron. Maximum concentrations were much higher in the 1968 to 1973 sampling period (10.0 µg/g for Lake Superior and 49.0 µg/g for Lake Huron) than in the 2010 to 2018 period (1.9 µg/g for Lake Superior and 4.4 µg/g for Lake Huron).
In Georgian Bay, the maximum observed concentration increased from 9.0 to 17.6 µg/g and the average cadmium concentration increased by almost 20%, from 1.49 µg/g in 1973 to 1.74 µg/g in 2017. This increase was also observed in the median values which increased from 1.0 µg/g to 1.2 µg/g.
Despite the overall decrease in average lake-wide concentrations between the time periods, for Lake Superior and Lake Huron, the percentage of samples with concentrations above the threshold effect level remained well above 50%. The percentages of samples over the threshold effect level for Lake Superior, Lake Huron and Georgian Bay were 81%, 78% and 86% respectively in 1969 to 1973 and 71%, 59% and 85% in 2016 to 2017. For St. Mary’s River 24% of samples exceeded the threshold effect level in 2017.
Sediment cores taken from Lakes Superior and Huron show similar trends in cadmium concentrations over time, since before the pre-industrial period (Figure 21). The trends observed in the sediment cores show that pollution control efforts put in place over the last few decades have been effective, but that there are still active sources of inputs that prevent the sediment from returning to pre-industrial levels of cadmium.
Analysis of sediment at stream mouths north of Lake Superior, Lake Huron and Georgian Bay in 2004 and 2005 provides an overview of cadmium concentrations transported to the Great Lakes from the areas upstream of the lakes (Burniston et al., 2006; Burniston & Kraft, 2008). For Lake Superior, the cadmium concentrations at stream mouths were very low and mostly below detection limits, meaning that there are few local sources of cadmium input to Lake Superior. For Lake Huron, and especially Georgian Bay, cadmium concentrations at stream mouths were detectable 25% of the time, indicating that there may be local sources of input along the north shore of Georgian Bay.
These observations suggest that natural sources may account for between 0.5 µg/g and 0.8 µg/g of cadmium found in a sediment sample taken from Lake Superior, St. Mary’s River, Lake Huron and Georgian Bay. The remainder of cadmium found in any given sample may be due to atmospheric transport and local industrial sources still active mainly in the Georgian Bay area. These inputs could represent about 0.2 µg/g to 0.5 µg/g of cadmium in a sample for Lake Superior and Lake Huron and between 0.5 and 1.0 µg/g for Georgian Bay.
Sediment accumulates at the bottoms of Lake Superior and Lake Huron very slowly (Burniston, unpublished). Samples taken 1 cm deep in sediment represent 25 years of history in Lake Superior, making it challenging to estimate the current conditions and level of recovery in the ecosystem. Discharges from local industrial sources also contribute to cadmium concentrations in this region, but these are less significant than natural and atmospheric inputs (Kemp et al., 1978). Declines in the average and maximum concentrations of cadmium observed in the sediment indicates that there is a gradual improvement in sediment quality that appears to be related to the decline in metal production and use over the last 40 to 50 years in Canada (Belzile et al., 2004). Declines in the percentage of samples exceeding the threshold effect level also show progress in reducing environmental risks from cadmium in these areas; however, rates of exceedance are still high and have increased in some areas.
Figure 21. Cadmium concentrations measured in sediment cores collected from Lake Superior and Lake Huron between 2007 and 2018 (Aliff et al., 2020; Burniston, unpublished; Reavie et al., 2005, 2017)

Long description
A map showing locations of sediment core sampling in Lakes Superior and Huron. Three sediment core profiles are also shown, one from western Lake Superior, eastern Lake Superior, and Lake Huron. Pre-industrial concentrations can be estimated from the sediment cores collected from Lakes Superior and Huron between 2007 and 2011 (Aliff et al., 2020; Reavie et al., 2017) and in 2016 and 2017 (Burniston, unpublished). The average pre-industrial (pre-1900) concentration for Lake Superior is reported to be between 0.37 µg/g ± 0.13 (Aliff et al., 2020) and 0.48 µg/g ± 0.10 (Burniston, unpublished) and 0.34 µg/g ± 0.08 for Lake Huron (Aliff et al., 2020). Cadmium concentrations in the sediments increased in the early 1900s to reach maximum concentrations in the mid-1950s, rising from about 0.5 µg/g to about 2.0 µg/g. Concentrations remained relatively stable for a few decades before showing a slight decrease of about 0.5 to 0.7 µg/g from the late 1970s to the present.
Figure 22. Cadmium concentrations in Great Lakes sediments for 1968 to 1973 sampling campaigns (a) and (b) for 2014 to 2018 sampling campaigns

Long description
Two heat maps of the Canadian Great Lakes showing cadmium concentrations. Map (a) shows concentrations measured in the 1968 to 1973 sampling campaign and (b) shows concentrations measured in the 2014 to 2018 sampling campaign. In (a), cadmium concentrations are high, most often between 3.5 and 18 µg/g across the Great Lakes, throughout Lakes Erie and Ontario, and Northern Lake Superior. In (b), cadmium concentrations are lower most often between 0.6 and 1.7 µg/g in the Great Lakes with even lower values in coastal Lake Huron, Lake St. Clair, and western Lake Erie. However high concentrations between 3.5 and 18 µg/g are observed in western Georgian Bay, Lake Ontario and Southern Lake Erie.
Lake Erie, St. Clair River, Lake St. Clair and Detroit River
Average and median cadmium concentrations in Lake Erie decreased by approximately 50% between 1971 and 2014 (Figure 22). Western Lake Erie has higher levels than eastern Lake Erie ( Figure 22). In 1971, the highest concentration was at the mouth of the Detroit River with 11.0 µg/g (Kemp & Thomas, 1976). In 2014, two samples (out of 10), collected near the city of Detroit, exceeded the probable effect level in the Detroit River at 4.4 µg/g and 9.5 µg/g.
Eastern Lake Erie appears to be much less affected by cadmium contamination. This could be due to the settling of suspended particles in the center of the lake before reaching the eastern portion of the lake. Current surface concentrations of cadmium are about 0.7 µg/g in the eastern portion and between 1.4 µg/g and 1.7 µg/g in the western and central portions, respectively. The number of samples exceeding the threshold effect level for the lake as a whole was 77% in 2014, nearly 20% fewer than in 1971. Only 2% of samples (1/44 samples) exceeded the probable effect level in 2014 compared to over 20% of the samples (52/259 samples) collected in 1971.
Scientists have attempted to estimate pre-industrial values for cadmium in sediments for all of Lake Erie. Reports indicate that the pre-industrial levels may vary between 0.1 µg/g and 1.7 µg/g (Kemp et al., 1976; Mudroch et al., 1988; Yuan, 2017) with an average concentration between 0.14 µg/g (Förstner, 1976) and 1.12 µg/g (Kemp & Thomas, 1976). However, given the wide variation in the reports of these scientists and others, it is likely that the pre-industrial level of cadmium in Lake Erie varies depending on the location of the sampling. Therefore, it is impossible to determine a representative background value for the whole basin with the data currently available.
Atmospheric input may be responsible for up to 70% of the cadmium concentration in sediments for Lakes Ontario and Erie (Coale & Flegal, 1989; Nriagu, 1986); though, this may be overestimated (Gatz et al., 1989). Atmospheric input appears to have increased rapidly until the 1950s (Coale & Flegal, 1989; Nriagu, 1986; Yuan et al., 2014), likely due to fossil fuel use thought to be responsible for most of the cadmium levels in the lake up until the 1950s (Förstner, 1976).
The overall results for Lake Erie show a clear decrease in cadmium concentrations for the lake as a whole over the last 40 years (Figure 23). Cadmium concentrations have decreased by approximately 50%, although many of the surface sediments (70%) are still above the threshold effect level for aquatic wildlife protection. Cleveland Bay is still strongly affected by cadmium contamination.
Figure 23. Cadmium concentrations measured in sediment cores collected from Lake Erie between 2007 and 2018 (Aliff et al., 2020; Burniston, unpublished; Reavie et al., 2017)

Long description
A map of Lake Erie showing sediment core sampling stations and a sediment core profile. The sediment cores profiled indicate that the trends in cadmium concentrations over time are different depending on which area of Lake Erie was sampled. Cadmium concentrations in sediment cores from the center of the lake show a rapid increase from 0.5 µg/g around 1870 to over 3.6 µg/g in the early 1950s. While cores located in the west near the mouth of the Detroit River show a rapid increase from 0.7 µg/g in 1930 to 2.8 µg/g in 1962. The increase in cadmium concentrations in the center of Lake Erie in the late 1940s was related to the growth of the electroplating industry in Cleveland (Förstner, 1976). The decline of cadmium and other metal pollutants is linked to strict regulations in the 1970s, the banning of leaded gasoline, and municipal wastewater improvements (Yuan, 2017)
Lake Ontario
The average cadmium concentration observed in 2018 is 2.50 µg/g (median=2.0 µg/g) and is similar to the average of 2.54 µg/g (median=2.6 µg/g) reported in 1968 (Kemp & Thomas, 1976) ( Figure 22). In 2018, all samples (100%) had concentrations above the threshold effect level while in 1968 and 1998 the exceedances were 95% and 76% respectively. However, the maximum concentration is significantly lower in 2018 with 4.4 µg/g compared to 1968 with 21.0 µg/g and in 1998 with 5.8 µg/g.
Of the Great Lakes, Lake Ontario is located the furthest downstream, and receives inputs from all of the upstream Great Lakes as well as its own drainage basin. In 2002, 69% of the sediments in 218 rivers and streams that flow into Lake Ontario had concentrations above the threshold effect level and 3 samples (1.4%) had concentrations above the probable effect level. The overall average of these sediments was 0.94 µg/g (Dove et al., 2003, 2004).
A large amount of cadmium in Lake Ontario comes from the Niagara River, which was heavily industrialized during the last World War. The Oswego and Genesee Rivers and the urbanized Toronto - Kingston corridor are also sources of cadmium to the lake (Aliff et al., 2020; Thomas, 1983). According to Nriagu (1986), atmospheric deposition is responsible for 60% of the cadmium input in Lake Ontario. (Aliff et al., 2020; Thomas, 1983)
Sediment cores show an overall increase in cadmium levels from the 1930s and then declines between 1970 to 1999 (Figure 24). It appears that the tributaries, especially the Niagara River and surrounding industrialized and urbanized areas, carry cadmium to Lake Ontario at levels that are above the threshold effect level. Surface concentrations are almost identical to those in 1968 and these concentrations remain higher than pre-industrial concentrations. This suggests that there are still some active sources of cadmium pollution, especially since concentrations seem to be increasing since the early 2000s.
Figure 24. Cadmium concentrations measured in sediment cores collected from Lake Ontario between 2007 and 2018

Long description
A map of Lake Ontario showing sediment core sampling stations and a graph of sediment core profiles. The profiles show pre-industrial levels of cadmium in sediment of Lake Ontario ranged from 0.9 µg/g to 1.5 µg/g (Kemp et al., 1976). Sediment cores indicate cadmium concentrations increased rapidly in the early 20th century with the increasing industrialization and urbanization of the western part of the lake and the Niagara River area. Concentrations increase from east to west in 1968, 1976 and 1985 with the sediment core containing the highest concentration of cadmium (6.1 µg/g) located in the east portion of the lake, and the lowest peak concentration (4.3 µg/g) near the mouth of the Niagara River. It is unclear why sampling from these years show an east to west increase in concentration, but it may be related to the positioning of sampling for each of the sediment cores instead of sediment deposition patterns or local inputs. There was a marked decrease of cadmium concentrations in sediments during the 1970s and 1980s mainly in the eastern portion of the lake, while cores collected in the western portion of the lake show a smaller decrease in concentrations before 2004 to 2005. From these dates onward, concentrations remain stable or increase slightly to the present day (Aliff et al., 2020)
The St. Lawrence River
Less than 3% of the suspended particulate matter carried by the river waters originates from Lake Ontario, (Rondeau et al., 2000), suggesting that cadmium contamination in river sediments comes from local sources and has little connection to the Great Lakes. The river has been separated into several sectors in order to better illustrate the data.
Upper St. Lawrence River
The Upper St. Lawrence River sector includes the territory between Cornwall and Montreal and the Lake des Deux-Montagnes formed where the Ottawa and St. Lawrence River meet (Figure 25). It should be noted that the northern portion of Lake Saint-Louis receives turbid water from the Ottawa River, which partially drains through the rocks of the Canadian Shield that contain higher levels of cadmium. Average cadmium concentrations in surface sediments were 0.39 µg/g in Lake Saint-François, 0.62 µg/g in Lake Saint-Louis and 0.37 µg/g in Lake des Deux-Montagnes, respectively, between 2008 and 2018. The percentage of samples exceeding the threshold effect level were 29% in Lake Saint-François, 54% in Lake Saint-Louis and 9% in Lake des Deux-Montagnes. One percent of samples (1/85 samples) from Lake St. Louis exceeded the probable effect level.
The highest cadmium level in the upper St. Lawrence was observed in Lake Saint-Louis near the Beauharnois industrial zone. Additional sampling for monitoring purposes near this zone showed concentrations of 9.2 µg/g and 25.8 µg/g cadmium in surface sediments. This area is known to have been the site of a smelter that operated between 1940 and 1990 (Pelletier, 2009, 2019). Average sediment cadmium concentration declined in Lake Saint-Louis by an estimatedFootnote 12 71% and the median declined by 45% between 1985 and 2015 (Pelletier 2009 and 2019).
Average cadmium levels in Lake Saint-François showed a 28% decrease between 1989 and 2018 and 40% decrease in the median concentration (Pelletier, 2010, 2020). The lake had not been contaminated at a high level in the past as the maximum values measured did not exceed 2.0 µg/g.
For the upper St. Lawrence River, Lake Saint-Louis was the lake most affected by cadmium contamination in the middle of the last century. Cadmium levels measured in the upper St. Lawrence appear to correspond to residual ambient levels from a heavy industrial past (Environment Canada & Ministère du Développement Durable de l’Environnement et des Parcs du Québec, 2007).The high concentrations are related to local industries, most of which have closed down or made major changes in their industrial processes. Current average concentrations are below or close to the threshold effect level.
Figure 25. Cadmium concentration in sediments and sediment cores from the Upper St. Lawrence River for the 2008 to 2018 sampling campaigns

Long description
A heat map of the upper St. Lawrence River showing cadmium concentrations. Most cadmium concentrations are low, less than 0.6 ug/g with some higher concentrations found in eastern Lake Saint-François, Beauharnois and northern Lake Saint-Louis close to Montreal. A sediment core profile from Lake St. Francois is also displayed. The profile of the sediment core from Lake Saint-François does not allow an evaluation of pre-industrial values from before the 1900s. The profile shows an increase in cadmium levels between the 1950s and 1970s, reaching 1.4 µg/g and originating from the industrial area of Cornwall, ON and Massena (USA) in the upstream sector of the lake. With the remediation measures implemented in Quebec beginning in the late 1970s, cadmium levels gradually decreased to reach about 0.8 µg/g in the early 1990s (for example le Programme d’assainissement des eaux du Quebec, le Programme de Réduction des Rejets Industriels, and the St. Lawrence Action Plan).
In Lake Saint-Louis, cadmium levels are below the detection limit for the pre-industrial period. For cores located in the northern part of the lake, an increase in concentrations began around 1920 and reached maximums of 4.0 µg/g and 4.9 µg/g in the mid-1970s. Subsequently, cadmium levels declined rapidly with the environmental remediation measures noted above to reach 2.2 µg/g and 2.6 µg/g in the early 1990s. Cadmium in surface sediments in the northern sector showed average concentrations of 0.63 µg/g in 2003 and 0.5 µg/g in 2015 (Pelletier, 2019).
Fluvial Corridor
The Fluvial Corridor is the sector of the river between the mouth of Lake Saint-Louis and the entrance to Lake Saint-Pierre (Figure 26). The mean and median cadmium concentration in the Petit Bassin de La Prairie were 0.89 µg/g and 0.8 µg/g in 2014, representing a decrease of 67% (mean) and 28% (median) since 1987. This decrease is very similar to that observed in Lake Saint-Louis from which it receives its water. All except two samples had concentrations above the threshold effect level and the maximum concentration was 1.6 µg/g. Using the results of sampling for other contaminants, it appears that this sector is mostly impacted by urban discharges which have currently not been identified.
The picture is different for the rest of the Fluvial Corridor. It shows that concentrations are generally below the threshold effect level, except for the Contrecoeur sector, which is home to several industries, including an aluminum smelter.
Figure 26. Cadmium concentration in the sediments of the Fluvial Corridor for the sampling campaigns from 2008 to 2014

Long description
A map of the fluvial corridor of the St. Lawrence River between Montreal and Contrecoeur. The map shows concentrations of cadmium in sediments samples along the corridor. Most are below 0.6 µg/g with slightly higher concentrations near Petit Bassin La Prairie and Contrecoeur.
Lake Saint-Pierre
Lake Saint-Pierre is the last lake before the St. Lawrence estuary. It has a shallow depth of water on each side of the navigation channel located in its center. Cadmium levels in sediments of this lake have never been an environmental issue. Still, average and median cadmium levels were lower in 2013 (0.18 µg/g and 0.1 µg/g) compared to 1986 (0.56 µg/g and <1 µg/g) (Figure 27). However, upstream of the lake, 6% of the samples exceed the threshold effect level.
Figure 27. Cadmium concentration in Lake Saint-Pierre sediments and sediment cores for the 2013 to 2014 sampling campaigns

Long description
A heat map of Lake Saint-Pierre in the St. Lawrence River showing cadmium concentrations. Throughout this section of the river, cadmium concentrations are low, typically less than 0.3 µg/g. Moderate levels of cadmium were found around the Sorel-Berthier Islands, around 1.7 µg/g
Estuary
There are very few areas of sedimentation except along shores sheltered from the current or in harbor enclosures such as the Harbor of Trois-Rivières and the Harbor of Quebec City. The estuary is subject to tidal effects, and the currents are relatively strong along its entire length.
The average concentration has remained almost identical over the last 30 years at 0.2 µg/g (median 0.1 µg/g), with the exception of contamination related to the transport and shipping of merchandise in the Trois-Rivières and Quebec City harbours, where cadmium levels in the estuary are low. In the Upper Estuary and the Saguenay Fjord, the overall average and median values were <0.1 µg/g (Lebeuf, 2009), below pre-industrial values of 0.2 µg/g (Gobeil et al., 1987).
The highest cadmium levels measured in 2016 in the harbour of Trois-Rivières were similar to those obtained in 1989 (G.D.G.Environnement Ltée, 1990) and did not exceed 1.3 µg/g. However, the threshold effect level was exceeded in 12% of samples (6/52 samples).
In 1989, the Quebec City area showed very high cadmium contamination in surface sediments, up to 37 µg/g, with an average for the whole area of 2.29 µg/g (median 1.4 µg/g), and more than 98% exceeding the threshold effect level and 16% exceeding the probable effect level (Procéan Inc, 1990). By 2012, the situation had greatly improved, with a 78% decrease in surface sediment concentrations for the whole sector (Pelletier & Blais, 2018). The maximum concentration was 2.60 µg/g with an overall average of 0.51 µg/g (median 0.3 µg/g). The highest concentrations were found within the harbour of Quebec, with more than 90% of the samples having values above the threshold effect level. These concentrations are probably related to the shipment of ores and their transportation.
Atlantic Region
Surface sediment samples and a sediment core were collected in the Atlantic region between 2011 and 2014. The overall mean concentration for the region was 0.93 µg/g (median 0.2 µg/g) and is strongly influenced by a maximum concentration of 9.6 µg/g measured at Grand Lake station in New Brunswick. Removing this value from the calculation reduces the average to 0.39 µg/g for the Atlantic region, which is below the threshold effect level. The elevated cadmium levels were measured at Grand Lake station, located on the Salmon River near Chipman (Figure 28). This area has been the site of a coal mine for more than 350 years, which has ceased operations. Considering that coal-related tailings may contain cadmium and several other metals, the high concentration measured in this sector is possibly related to this operation. Contamination appears to be localized, as downstream of Grand Lake, cadmium levels were between 0.3 µg/g and 1.0 µg/g (Lalonde et al., 2011). The sediment core for the Saint John River shows that cadmium levels have remained relatively the same since the 1950s.
The other samples containing cadmium levels exceeding the threshold effect level are located at Lake Banook, NS with 1.6 µg/g in 2012 and 2.1 µg/g in 2014. Lake Banook is located in the heart of the City of Dartmouth and does not receive industrial discharges or sewage. It is a major aquatic recreation site hosting several annual regional, national and international paddling competitions. Despite significant urbanization in the last part of the 20th century, the water of this lake is relatively clean. However, it sometimes has algae blooms in the summer and the hills surrounding the lake regularly overflow with rainwater (C. Garron & B. Lalonde, personal communication, n.d.). The presence of high cadmium levels in this lake is difficult to explain.
Figure 28. Cadmium concentration in sediment and sediment core from the Atlantic region collected between 2011 and 2014

Long description
A map of Atlantic Canada showing sediment sampling stations at the St. John River, Grand Lake, Petitcodiac, Napan River in New Brunswick; Cornwallis River, Zekes Brook, Vales River, Kejimikujik Lake, and Banook Lake in Nova Scotia, and Waterford River in Newfoundland. All sites were less than 0.3 µg/g except for one sample from the St. John River and Napan River which showed concentrations between 0.3 and 0.6 µg/g, two samples from Banook Lake which were between 0.6 and 1.7 µg/g and one sample from Grand Lake which was higher than 3.5 µg/g. The image also shows a sediment core profile collected from the St. John River that shows no trends in cadmium levels since the 1950s with an average concentration of 0.38 µg/g representative of the regional average.
Cadmium levels were also reported for Atlantic Canada in the literature. Cadmium levels above the probable effect level and threshold effect level were found at small craft harbours throughout Nova Scotia (Zhang et al., 2019). Fifteen harbours were found to be moderately contaminated with cadmium and 3 severely contaminated with cadmium out of 31 studied.
3.2.3 Surface water
Cadmium enters rivers, lakes, and streams by direct releases from industrial facilities and municipal wastewater and also indirectly through atmospheric deposition. Since cadmium is very easily dissolved in water, it is important to measure and track the levels of cadmium in the water to see whether the government’s efforts to reduce cadmium pollution have been effective and whether risks to aquatic life are still present and if they have been reduced. Decreasing cadmium levels indicate progress in achieving the environmental objective.
Environment and Climate Change Canada has conducted metals monitoring in surface waters across Canada since 1986. The Canada Water Act requires that the Government of Canada, in coordination with the provinces, conduct water quality monitoring to determine the status and trends in water quality in the country. Core water quality parameters monitored under the program include temperature, acidity, hardness, salinity, turbidity, nutrients and metals. Cadmium has been monitored in surface waters from the onset of the program.
The monitoring of surface water quality in Canada can be broken down into 3 distinct categories by physical environmental differences and program priorities (Figure 29):
- Inland rivers and streams: the 220 sites in this long-term network include various land uses and a range of types and degrees of stress on water quality. They vary in size and include transboundary waters, non-impacted reference locations, urban sites and sites considered to be at high risk of water quality impairment. These sites are monitored across the country to report on national water quality and also inform Canadian Environmental Sustainability Indicators (CESI) such as the Water Quality index (WQI).
- Connecting channels of the Great Lakes: in a sense large rivers, the channels connecting the Great Lakes are characterized by very large flows (>3,500 m3/s) and are strongly influenced by the water quality of the lake upstream. The connecting channels are also key transport corridors for goods and materials between the Great Lakes and their shorelines are heavily industrialized, particularly the Niagara and Detroit Rivers. The monitoring programs in the connecting channels were established with the intent to compare levels of contaminants leaving one lake and entering the next (that is upstream-downstream) to characterize and account for toxic chemicals entering the Great Lakes from these industrial areas.
- Open waters of the Great Lakes: due to their large size and depths, monitoring off-shore water quality in the Great Lakes is more similar to oceanography. Generally, water quality is monitored from a large research vessel in two of the Canadian Great Lakes each year in the spring and fall. As binational waterways, the monitoring activities in the Great Lakes and connecting channels are coordinated with the United States through the Great Lakes Water Quality Agreement (GLWQA).
In addition to long-term sites, there are many hundreds of sites that have been monitored for metals for shorter periods of time, some of which are affiliated with point source releases of metals such as mining operations, power generation facilities, smelters and other industrial sources. These shorter-term data records were not included in this analysis as point source or point in time data do not necessarily reflect the condition in Canada now, especially as industries close or are redesigned and short-term datasets are not sufficient to perform temporal trend analyses.
Due to changes and improvements in analytical methods for metals, the detection limit for cadmium in surface waters has decreased significantly over time. Major analytical changes occurred in 2003 that vastly improved the detection limits for cadmium, reducing them from 0.1 to 1 to 0.001 µg/L. Most measurements from samples prior to 2004 were not included in the analysis for this section as detection limits were 0.1 µg/L or greater and are not comparable with samples analysed using the newer analytical method.
Figure 29. Long-term water quality monitoring sites

Long description
A map of Canada showing long term water quality monitoring sites and the sites monitored by each program. There are 72 federal monitoring sites, 99 joint federal-provincial/territorial monitoring sites, 35 sites under Canada-US transboundary water programs, and also monitoring locations in the Great Lakes where there are multiple sites sampled on a rotational basis (see annex 2 for details). The map also shows Canada’s ocean drainage areas. The Arctic Ocean, which spans from the northern tip of Nunavut, covers most of the Northwest Territories and Northern Alberta, Northeastern British Columbia and Northern Saskatchewan. The Pacific Ocean drainage region, which spans from Alaska through to western and southern British Columbia. The Hudson Bay drainage region covers from the southern half of Baffin Island and eastern Nunavut though all of Manitoba, most of Saskatchewan and southern Alberta, as well as the northern half of Quebec and northern Ontario. The Atlantic drainage region spans from Labrador south along the eastern coast through to the southern half of Ontario, ending just north of Lake Superior in the east. The Gulf of Mexico drainage region covers only a very small area in southern Alberta and Saskatchewan.
3.2.3.1 Environmental quality guidelines for the protection of aquatic life
The Canadian Council of Ministers of the Environment developed a Canadian Water Quality Guideline for the protection of aquatic life in freshwater. The guideline for surface waters is dependent on hardness, which is a toxicity modifying factor for cadmium (Canadian Council of Ministers of the Environment, 2014). For long-term exposure, at hardness values below 17 mg CaCO3/L, the guideline is 0.04 µg/L, and when hardness is above 280 mg CaCO3/L, it is 0.37 µg/L. When hardness is between 17 and 280 mg CaCO3/L, the guideline value is calculated using the following equation:
Guideline (µg/L) = 10{0.83(log[hardness]) – 2.46}
Long-term exposure guidelines identify benchmarks in the aquatic ecosystem that are intended to protect all forms of aquatic life for indefinite exposure periods. Short-term exposure benchmarks are developed using severe-effects data, such as lethality, for defined periods of time (24 to 96 hours). These benchmarks do not indicate levels protective of the aquatic environment, rather they provide guidance on the impacts of severe, but temporary situations (for example spills, or infrequent releases).
For short-term exposure, at hardness values below 5.3 mg CaCO3/L, the short-term benchmark is 0.11 µg/L, and when hardness is above 360 mg CaCO3/L, it is 7.7 µg/L. When hardness is between 5.3 and 360 mg CaCO3/L, the short-term benchmark value is calculated using the following equation:
Benchmark (µg/L) = 10{1.016(log[hardness]) –1.71}
Comparing cadmium levels in water to these guideline values is an indicator of environmental risks. If levels are above the guidelines, then there may be risks for aquatic life. If levels are below the guidelines, then risks have likely been successfully managed. Progress toward achieving the environmental objective will be indicated by the percentage of samples above environmental quality guidelines. Declines in the number of samples over the guidelines will show that risk management efforts have made progress in reducing the environmental risks of cadmium.
3.2.3.2 Spatial distribution and trend of cadmium concentrations in Canadian surface water and comparisons to water quality guidelines
Cadmium concentrations in surface waters are summarized by drainage areas. Drainage areas are boundaries in which all of the water from different sources runs into one water body, usually a large lake or ocean. Canada has five major drainage basins named after the body of water that they drain into: Atlantic Ocean, Hudson Bay, Gulf of Mexico, Pacific Ocean, and Arctic Ocean. Total concentrations measured in surface waters across Canada from 2004 to 2019 range from <0.001 to 2.69 µg/L. Median concentrations across the different areas ranged from 0.009 µg/L in the Pacific Ocean drainage to 0.032 µg/L in the Arctic Ocean drainage. These large drainage areas are made up of smaller areas called drainage regions. The highest median values for drainage regions are in the Assiniboine-Red drainage region (0.05 µg/L) and northern drainage regions such as the Lower Mackenzie (0.037 µg/L) and Peace-Athabasca (0.03 µg/L). In general, cadmium levels are lower in the Pacific and Atlantic Ocean drainage areas, possibly owing to geology (Figure 30 and Figure 31).
Figure 30. Median cadmium concentrations (µg/L) for each drainage region in Canada

Long description
A map of Canada showing the cadmium levels measured in each drainage region. See table in descriptive text of Figure 31 for details on median concentrations for each drainage region.
There are no data available for the Northern Ontario and Northern Quebec drainage regions.
Figure 31. Boxplot of cadmium concentrations (µg/L) by ocean drainage regions

Long description
| Ocean drainage area | Pearse drainage area | No. sites | No. samples | No. censored | Minimum (µg/L) | Median (µg/L) | Maximum (µg/L) |
|---|---|---|---|---|---|---|---|
| Arctic | Arctic Coast-Islands | 11 | 143 | 3 | <0.001 | 0.009 | 0.481 |
| Arctic | Lower Mackenzie | 21 | 1173 | 4 | <0.001 | 0.037 | 2.69 |
| Arctic | Peace-Athabasca | 6 | 621 | 24 | <0.001 | 0.030 | 2.3 |
| Arctic | Total | 38 | 1937 | 31 | <0.001 | 0.032 | 2.69 |
| Atlantic | Great Lakes Connecting Channels | 5 | 1802 | 11 | <0.001 | 0.011 | 0.312 |
| Atlantic | Maritime Coastal | 58 | 2835 | 1687 | <0.005 | 0.010 | 0.516 |
| Atlantic | Newfoundland-Labrador | 41 | 1679 | 250 | <0.001 | 0.006 | 0.658 |
| Atlantic | North Shore-Gaspé | 2 | 60 | 1 | <0.002 | 0.003 | 0.374 |
| Atlantic | Ottawa | 1 | 157 | 21 | <0.010 | 0.010 | 1.03 |
| Atlantic | Saint John-St. Croix | 4 | 215 | 157 | <0.005 | 0.010 | 0.09 |
| Atlantic | St. Lawrence | 6 | 793 | 80 | <0.008 | 0.010 | 0.42 |
| Atlantic | Total | 117 | 7547 | 2207 | <0.001 | 0.010 | 1.030 |
| Gulf of Mexico | Missouri | 2 | 134 | 0 | 0.003 | 0.018 | 0.546 |
| Gulf of Mexico | Total | 2 | 134 | 0 | 0.003 | 0.018 | 0.546 |
| Hudson Bay | Assiniboine-Red | 6 | 1030 | 0 | 0.006 | 0.050 | 1.51 |
| Hudson Bay | Churchill | 3 | 328 | 7 | <0.001 | 0.009 | 1.35 |
| Hudson Bay | Keewatin-Southern Baffin | 2 | 47 | 2 | <0.001 | 0.023 | 0.971 |
| Hudson Bay | Lower Saskatchewan-Nelson | 3 | 448 | 0 | 0.005 | 0.023 | 0.332 |
| Hudson Bay | North Saskatchewan | 3 | 534 | 26 | <0.001 | 0.015 | 0.952 |
| Hudson Bay | South Saskatchewan | 6 | 848 | 57 | <0.001 | 0.009 | 1.59 |
| Hudson Bay | Winnipeg | 1 | 90 | 0 | 0.001 | 0.004 | 0.037 |
| Hudson Bay | Total | 24 | 3325 | 92 | <0.001 | 0.022 | 1.59 |
| Pacific | Columbia | 14 | 4135 | 70 | <0.001 | 0.011 | 0.375 |
| Pacific | Fraser-Lower Mainland | 15 | 4211 | 18 | <0.001 | 0.010 | 0.837 |
| Pacific | Okanagan-Similkameen | 3 | 1034 | 0 | 0.001 | 0.007 | 0.365 |
| Pacific | Pacific Coastal | 12 | 3108 | 120 | <0.001 | 0.005 | 2.1 |
| Pacific | Yukon | 7 | 877 | 4 | <0.001 | 0.024 | 1.62 |
| Pacific | Total | 51 | 13365 | 214 | <0.001 | 0.009 | 2.1 |
In each box, the central line represents the median value while the upper and lower edges of the box represent the 75th and 25th percentiles respectively. Lines extending from the boxes show the extent of values up to 1.5 times the interquartile range (range from the 25th to 75th percentiles) above and below the box. Dots show values that lie outside the range of the whiskers, commonly referred to as outliers.
Classifications from the Canadian Environmental Sustainability Indicators (CESI) program were used to group sites by land-use type. The CESI program classifies its core long-term monitoring sites according to the dominant land-use(s) within a site’s drainage area, which broadly captures the types of environmental pressures that a site may be experiencing. Classifications include remote/least impacted sites and land-uses such as agriculture, forestry, mining, oil sands, populated areas, as well as different combinations of these categories. These classifications were last updated in 2019 and the criteria for classification can be found in the 2020 CESI Water Quality in Canadian Rivers report (Environment and Climate Change Canada, 2020a).
Sites classified as mainly influenced by agricultural activities showed the highest median cadmium concentration (0.031 µg/L), while medians for populated and mixed forestry/mining sites fell in the middle (0.010 – 0.011 µg/L), and reference sites had the lowest median concentration (0.005 µg/L) (Figure 32). The higher values at agricultural sites may be due to where the sites were located, rather than land use alone. Apart from sites located in PEI, all agriculture sites were found in Manitoba, Saskatchewan, and Alberta (within the Hudson Bay drainage area). As seen in above, the Hudson Bay drainage area has higher cadmium levels compared to other ocean drainage areas. Reference sites in the Hudson Bay drainage area and Arctic have statistically higher levels of cadmium than any other region in Canada. Despite the very intensive agricultural land use in PEI, there were quite low cadmium concentrations in surface waters, supporting the need to consider background characteristics in the interpretations of these data.
The frequency of values exceeding the CCME long-term guideline values for the protection of aquatic life were determined for each site. Overall, most sites had fewer than 20% of their samples exceed the calculated guideline values and only sites in the Mixed Forestry/Mining and Reference categories exceeded guideline values in greater than 20% of their samples.
Many of the sites with high exceedances of guidelines were found in northern Canada. Four of seven sites with greater than 20% exceedances were found in the Lower Mackenzie drainage region while the others were located in Newfoundland-Labrador, Yukon, and Pacific Coastal drainage regions. Of the seven sites, four were classified as Mixed Forestry/Mining based on their land-use, which may play a role in the elevated concentrations at these sites.
Figure 32. Cadmium concentrations (µg/L) by combined CESI site classifications

Long description
A box plot of cadmium concentrations for CESI site classifications
| Classification | Number of samples | Min | Median | Max | Q25 | Q75 | Standard deviation |
|---|---|---|---|---|---|---|---|
| Agriculture | 2053 | 0.0005 | 0.032 | 1.51 | 0.019 | 0.07 | 0.118519 |
| Mixed forestry/mining | 7461 | 0.0005 | 0.011 | 2.1 | 0.005 | 0.026 | 0.071409 |
| Populated | 2339 | 0.0005 | 0.01 | 1.59 | 0.007 | 0.02 | 0.064124 |
| Reference | 3206 | 0.0005 | 0.005 | 1.62 | 0.003 | 0.01 | 0.141303 |
Interestingly, reference sites were among those with the greatest frequency of exceedances. For example, some reference sites within the Yukon and Lower Mackenzie drainage regions had very frequent exceedances of guideline values with the South McQuesten River below Flat Creek site showing exceedances in 84% of its samples. These results emphasize the need to consider local factors such as watershed geology and other potential sources when assessing guidelines and exceedances.
In general, most sites in each category showed either decreasing trends in cadmium or no detected trends. A total of 3 sites showed increasing trends, one in each category except Mixed Forestry/Mining. This may be a sign that impacts within the watersheds of those sites are leading to increased cadmium concentrations. The greatest improvements were seen in the Mixed Forestry/Mining and Reference categories while Agriculture and Populated sites showed the least improvement. However, there were many times where this analysis could not be completed because cadmium concentrations in the samples collected were below detection limits.
In addition to trend direction, the size of the trend and environmental quality guideline values were considered when interpreting trend results. For example, sites were highlighted if an upward trend could bring concentrations close to guideline values, or if a decreasing trend is likely to bring concentrations that often exceed guidelines below the guideline values in the near future. No sites with increasing trends are expected to approach guideline values in the near future based on the current values and calculated rate of change. Some sites with decreasing trends frequently exceed guideline values, where the decreasing trends may reduce the frequency of guideline exceedances.
3.2.3.3 Trends of cadmium concentrations in water in the Great Lakes connecting channels and comparisons to water quality guidelines
Environment and Climate Change Canada began water quality monitoring in the connecting channels of the Great Lakes with the establishment of a fixed sampling site on the Niagara River at Niagara-on-the-Lake in 1975. Over the next decade, additional sites were added on the St. Lawrence River at Wolfe Island (1976), upstream on the Niagara River at Fort Erie (1983), and at Point Edward and Port Lambton on the St. Clair River (1986).
Water quality monitoring in the connecting channels is undertaken as part of Canada’s commitment to the Canada-United States Great Lakes Water Quality Agreement (GLWQA). More specifically, monitoring in the connecting channels is intended to aid in the evaluation of the effectiveness of pollution control programs carried out in the Great Lakes Basin and data generated from this sampling are used to identify exceedances of water quality guidelines, to assess current water quality conditions, and to evaluate trends.
Similar to monitoring in the surface waters of Canadian rivers outlined above, cadmium levels measured in the water samples taken from the connecting channels prior to 2004 were often below detection limits and are not comparable with samples taken after 2004. Only water data from 2004 to 2019 was analysed for this reason. However, particle phase data (measurements of cadmium in particles floating in water) is presented from 1978 to 2019 as the improvements in laboratory methods for suspended sediments did not impact comparability of the data between time periods.
Between 2004 and 2019, cadmium levels in the connecting channels of the Great Lakes range between <0.001 µg/L and 0.31 µg/L with a median of 0.01 µg/L and an average of 0.02 µg/L. Cadmium levels in particulate phase range between 0.01 µg/g and <10 µg/g with median and average values of 0.80 and 0.92 µg/g respectively. Cadmium concentrations appear to increase from the upper connecting channel sites in the St. Clair River through the Niagara River and into the St. Lawrence. In addition, concentrations are typically higher at the downstream site, which suggests sources of cadmium pollution exist along the connecting channels.
Federal reporting under the Niagara River Toxics Management Plan compares water quality measurements against criteria set out in the Great Lakes Water Quality Agreement. For cadmium, the criterion is 0.20 µg/L. Applying this criterion to the 2004 to 2019 water data from the connecting channels identifies two exceedances at Niagara-on-the-Lake in 2009 and 2016. Using the CCME’s long-term water quality guideline for the protection of aquatic life of 0.16 µg/L for waters at typical hardness of 100 mg CaCO3/L, one additional exceedance was found at Point Edward. Using the CCME guideline of 0.04 µg/L for typical hardness below 17 mg CaCO3/L identified six exceedances at Wolfe Island, eight at Port Lambton, 11 at Point Edward, 31 at Fort Erie, and 53 at Niagara-on-the-Lake.
Comparing the particulate phase data against sediment guidelines noted in section 3.2.2.1, shows exceedances of the threshold effect level (0.6 µg/g) 52 times at Point Edward (24% of the 214 samples between 2005 and 2019), 61 times at Port Lambton (28% of the 219 samples between 2005 and 2019), 238 times at Wolfe Island (91% of the samples between 1988 and 2019), 770 times at Fort Erie (79% of the samples between 1983 and 2019), and 943 times at Niagara-on-the-Lake (81% of the samples between 1978 and 2019). Application of the sediment guidelines’ occasional effect level (1.70 µg/g) reduces these numbers to 47 exceedances at Fort Erie (5% of all samples), 55 exceedances at Wolfe Island (21% of all samples), and 82 exceedances at Niagara-on-the-Lake (7% of all samples), while application of the guidelines’ probable effect level (3.5 µg/g) identifies 6 exceedances at each of Niagara-on-the-Lake and Wolfe Island but none at the other 3 locations.
With the exception of water at Niagara-on-the-Lake, the assessment of long-term data indicates downward trends in cadmium concentrations for monitoring sites in all Great Lakes connecting channels. Between 2004 and 2019, cadmium levels in water appear to be declining by approximately 8% per year at Point Edward, 5% per year at both Port Lambton and Fort Erie, and 9% at Wolfe Island. A decline of approximately 1.5% per year is also observed in water concentrations at Niagara-on-the-Lake; however, this may not be a significant trend (adjusted p value= .096). Downward trends appear to be present in both the historical and more recent records for particulate phase cadmium concentrations. Particulate phase concentrations declined by approximately 4% per year in the St. Clair River between 2005 and 2019 and at Wolfe Island between 1987 and 2019, while Niagara River concentrations fell by 1.3% per year at Fort Erie (1983 to 2019) and 1.9% per year at Niagara-on-the Lake (1978 to 2019). More recently, 2004 to 2019 particulate phase concentrations show a similar 3-5% per year decrease at all five of the connecting channels monitoring sites.
3.2.3.4 Spatial and temporal trends of cadmium concentrations in water in the Great Lakes and comparisons to water quality guidelines
The previous sections have considered “lotic” (flowing water) systems, such as tributaries and connecting channels that are monitored in transboundary watersheds. In “lentic” (still water) environments, such as lakes, concentrations of many contaminants tend to be lower because sediments settle to the bottom near the mouths of the rivers and are less likely to float downstream in lake environments with slower moving waters. However, even trace levels of contaminants in lake waters can have significant impacts to aquatic health due to cycling in the environment and due to the processes of bioaccumulation and biomagnification.
Cadmium is included among a suite of total metals that is monitored as part of the Great Lakes Surveillance Program (GLSP), which is Environment and Climate Change Canada’s ship-based, long-term water quality monitoring program on the Great Lakes. Spatial patterns in water quality can be determined using the network of the GLSP. Samples are taken from both nearshore and offshore environments, in both Canadian and US waters with the exception of the 2019 campaign in Lake Superior in which only Canadian waters were sampled. Using offshore stations alone, temporal trends can be detected that may not be evident in tributaries and nearshore waters.
The spatial distribution of cadmium in Great Lakes waters, using the most recent data from GLSP surveys (2015 to 2019), (Figure 33) indicates that concentrations are highest in Lake Erie, followed by Lake Superior, Lake Ontario, and lowest in Georgian Bay and Lake Huron. The highest concentrations are observed in the western basin of Lake Erie. Within Lake Erie, concentrations are lower in the eastern basin, intermediate in the central basin, and highest in the west. Evidence from nearshore sampling by the Ontario Ministry of the Environment and Parks (Benoit, Unpublished), confirms these spatial patterns.
The distribution of cadmium in Great Lakes waters is mainly related to the geological conditions across the lakes, with some additional cadmium input from both long-range atmospheric sources and local sources. Abnormally high values are likely related to contributions from anthropogenic sources. The most recent data indicate concentrations are higher in Lake Superior (Figure 33), where the Canadian Shield underlying the northern lakes contributes higher cadmium concentrations, compared to Lake Ontario where sedimentary materials form more of the basin’s geology. This was not always the case; during the initial (2003 and 2005) surveys, values were greater in Lake Ontario compared to Lake Superior, and this is likely due to historically higher anthropogenic contributions to Lake Ontario. Concentrations of cadmium in water are declining throughout the Great Lakes, and the rate of decline has been highest in Lake Ontario.
Figure 33. Recent (2015 to 2019) spatial distribution of Cadmium in Great Lakes Surface Waters

Long description
A heat map of the Canadian Great Lakes showing cadmium concentrations measured in surface water. Lake Superior shows cadmium concentrations typically less than 0.009 µg/L with western and central Lake Superior showing levels slightly higher than 0.009 µg/L. Lake Huron shows low cadmium concentrations typically well below 0.003 µg/L. Lake Erie shows higher concentrations of cadmium, especially in the western portion of the lake. Values are often more than 0.009 µg/L and as high as 0.075 µg/L. The northeastern part of the lake shows much lower concentrations between 0.003 and 0.006 µg/L. Lake Ontario has moderately low cadmium concentrations, mostly around 0.003 µg/L, but higher concentrations are found where the connecting channel from Lake Erie enters Lake Ontario and around Hamilton Harbour. Values in these areas are around 0.009 µg/L.
The Great Lakes datasets demonstrate no CCME water quality guideline exceedances for cadmium at any of the monitored locations. It should be noted that concentrations in the western basin of Lake Erie (range 0.013 to 0.103 ug/L) reach up to 65% of the long-term guideline (0.16 µg/L for typical hardness of 100 mg CaCO3/L). Because these monitoring locations are not located in close proximity to discharges, higher concentrations in nearshore waters may be expected and there may be water quality guideline exceedances closer to shore or to potential sources.
There is strong evidence of declines for the time period 2003 to 2019 in all of the Great Lakes with the exception of the central and western basins of Lake Erie. The declines have likely occurred due to reduced releases of industrial and other sources of cadmium to the environment. In Lake Erie, however, concentrations are higher and more variable due to the historic prevalence of potential sources in the Detroit River area.
The evidence provided here, using the most recent and highest quality laboratory data, indicates that levels of cadmium in Great Lakes waters have been reduced since the early 2000s and continue to decline in all of the lakes with the exception of the western and central basins of Lake Erie. Any ongoing contributions (for example, from contaminated sediment in the Detroit River and/or sources within US or Canadian watersheds) may be contributing to the higher variability in cadmium concentrations and lack of trends in the western and central basins of Lake Erie.
3.2.4 Fish
Fish accumulate cadmium directly from the water column or through their diet. Bioaccumulation is the gradual accumulation of a substance in an organism. Cadmium concentrations in fish are often higher than in their ambient environment, as cadmium bioaccumulates in aquatic organisms (Pelgrom et al. 1995). Water is generally the most important route of uptake, followed by diet; however, this may vary depending on the source of cadmium in the ecosystem.
Top predator fish, primarily lake trout (Salvelinus namaycush), and walleye (Sander vitreus) are typically used as indicators of aquatic conditions. Top predator fish are ideal bio-indicators of aquatic contaminants as they feed high on the food web and are long lived. This results in the accumulation of elevated concentrations of some contaminants relative to the environment and the lower food web through bio-concentration. In addition to being long-lived, they have high fat content, and have large home ranges making them excellent spatial and temporal integrators of contamination. Both lake trout and walleye occur throughout much of Canada, allowing for comparison of contaminant concentrations nationally. At locations where lake trout or walleye are not present, alternative top predator fish are collected. Depending on the geographic location and habitat, these may include chain pickerel, northern pike, rainbow or cutthroat trout.
Prey fish and other food web components are also collected at monitoring sites when possible. Food web collections include prey fish consumed directly by the predator fish such as perch, smelt, and sculpins and organisms lower in the food web such as invertebrates, mysids and phytoplankton. This allows for a comparison of contaminant burdens at different levels of the food web, to estimate the potential for biomagnification and relate changes in contaminants in predator fish to the food web. Some contaminants become more concentrated (biomagnify) at higher levels of the food web, while others do not and may even decline (biodilution).
Fish are useful indicators to assess progress in meeting the environmental objective, since they will show how much of the cadmium in the air, water, and sediments is ending up in aquatic life. Fish move around in lakes and rivers and so are exposed to different levels of cadmium in different environments compared to water or sediment samples that are typically taken in only one place. Decreasing trends in levels of cadmium in fish indicate that less cadmium is entering the food chain and that progress has been made towards achieving the environmental objective.
3.2.4.1 Impacts of cadmium on fish
Exposure to cadmium can be lethal to fish at varying concentrations depending on the sensitivity of the species, life stage and duration of exposure. Juvenile rainbow trout are relatively sensitive to cadmium (Hollis et al. 2000), whereas juvenile yellow perch are much less sensitive (Niyogi et al. 2004). Exposure of fish to cadmium concentrations below lethal levels has been associated with behavioral effects such as changes in activity levels (Atchison et al. 1987; McGreer et al. 2000) and social interaction behaviors such as dominance and aggression (Atchinson et al. 1987; Sloman et al. 2003). Exposure to cadmium may have negative impacts to reproduction in fish, such as reductions in the size of gonads (Pyle et al. 2005), sex steroid production, ovarian development, hatching success and increased deformities (Vetillard and Bailhache 2004).
Many factors can reduce the toxicity and bioavailability of cadmium and affect how much cadmium fish accumulate in a given environment. As previously discussed, the form, toxicity and mobility of cadmium in water can be influenced by pH, hardness, alkalinity, and natural organic matter. Age and sex do not appear to be strongly related to the cadmium concentrations accumulated in fish.
Freshwater quality guidelines for cadmium concentrations in Canadian waters are in place, and intended to be protective of aquatic life. There are no known guidelines for fish to indicate at what levels cadmium in the body leads to negative health effects. This is likely due to the fact that there is a poor relationship between toxicological impacts of cadmium and levels of cadmium in the body, also known as body burden. Environment and Climate Change Canada monitors contaminants in whole fish, as the intent is to get a picture of the overall contamination level of the environment for many different chemicals and metals. Whole fish concentrations are useful in assessing the impacts of dietary exposure of cadmium to wildlife consumers of fish such as birds and mammals.
3.2.4.2 Spatial and temporal trends of cadmium concentrations in fish
The Fish Contaminants Monitoring Program was initiated in 1976. The objective was to collect a variety of biological samples in freshwater environments for the purpose of determining ecosystem contaminant levels. Annually, from two to four offshore sites are monitored on each Great Lake, with the exclusion of Lake Michigan. In 2006, the program expanded to include areas outside the Great Lakes and become national in scope. From 2006 to 2015, biota samples from many freshwater sites across Canada were collected. The focus of these collections was primarily to assess concentrations of mercury and other contaminants in the environment from atmospheric deposition.
Multiple species of fish were analyzed for cadmium at some sites, allowing for a direct comparison of differences in accumulation amongst species. (Figure 34). In general, smaller prey species, lower on the food chain, accumulated higher concentrations of cadmium than top predator fish. Interestingly, at sites with the highest concentrations of cadmium in fish, differences between species were reduced.
In this national survey, cadmium body burdens are higher in prey fish than they are in the top predator fish which consume them (at the same location). This finding was observed across sites and indicates that no biomagnification of cadmium is occurring in the upper aquatic food web at the sites monitored. This finding is consistent with the literature (for example Andres et al. 2000, Amundsen et al. 1997, Carru et al. 1996, Marcovecchic and Moreno 1993, Pip and Stephaniuk 1997).
Figure 34. Comparison of average concentrations of whole body cadmium burdens in multiple species of fish from the same site

Long description
Box and whisker plots for four lakes showing the differences in average concentrations of cadmium in prey and predator species in Western Lake Erie, Lake Ontario, Kejimkujik Lake, and Lac-Edouard. In western Lake Erie, trout perch had the highest concentrations while walleye had the lowest. In Lake Ontario, slimy sculpin had the highest levels of cadmium and lake trout had the lowest. In Kejimkujik Lake, shiner species had the highest average concentration and brook trout had the lowest. In Lac-Edouard, common shiner had the highest concentration and brook trout had the lowest. Data available in Annex 2.
Fish are ordered from largest to smallest on the X axis, with top predator species on the left.
Spatial trends by species
Cadmium body burdens varied significantly across the country and for predatory fish, were highest in British Columbia and the Yukon, as well as sites in eastern Canada and the Maritimes, such as Kejimkujik Lake and Lac Edouard, QC. Concentrations were lowest in the Northwest Territories and Prairie Provinces, and high to moderate in the Great Lakes, with higher concentrations in the upper Great Lakes compared to the lower Great Lakes (Figure 35).
Figure 35. Whole body mean concentrations of cadmium (mg/kg wet weight) as quartiles of top predatory fish in Canadian water bodies from 2010 to 2018

Long description
A map of Canada showing monitoring locations and cadmium concentrations in top predator fish. Concentrations were significantly lower in Buffalo Lake, Cold Lake, and Forestburg Reservoir in Alberta; Lake Athabasca, and Reindeer Lake in Saskatchewan; Lake Champlain, and Lake Memphremagog, QC. The highest concentrations in predator fish were in rainbow trout from Salsbury Lake BC, lake trout in Lac Edouard, QC and brook trout in Kejimkujik Lake, NS. These were followed by walleye from Western Lake Erie and the Columbia River, BC, cutthroat trout from Frederick Lake in BC, and lake trout from Whitefish Bay and Thunder Bay, Lake Superior.
Cadmium body burdens in lake trout were significantly higher in Lac Edouard, QC, followed by Lake Kusawa, YK and Lake Superior, ON. The results are consistent with that reported in the literature for Lake Superior, averaging approximately 0.02 mg/kg (May & McKinney, 1981). For walleye, concentrations of cadmium were highest in western Lake Erie, the Columbia River and the St. Lawrence River. See Appendix 2 for cadmium concentrations by species and location.
The prey fish present varied greatly amongst sites across Canada and cadmium concentrations varied significantly amongst prey species from the same sites. For this reason, it was not appropriate to pool prey species in a single nation-wide analysis. Rainbow smelt were the prey species which occurred at the most sites, most commonly at Great Lakes locations (Figure 36).
Concentrations of cadmium in rainbow smelt were highest at Whitefish Bay, Wheatley, Dunkirk, and Thunder Bay, and lowest in Lake Ontario sites and Goderich in Lake Huron. Cadmium body burdens in sculpin were highest in Whitefish Bay, Lake Superior, and in Port Credit, Lake Ontario (Figure 37a). Round gobies were found primarily in the lower Great Lakes and had the highest cadmium concentrations in Western Lake Erie (Figure 37b).
As highlighted in the sediment section of this report, higher concentrations of cadmium in fish from some areas may be a result of regional differences in natural cadmium concentrations based on the local geology and on factors affecting bioavailability, while at other sites, elevated concentrations may be the result of anthropogenic inputs. Cadmium body burdens in fish are reflective of the bioavailability of cadmium in the environment. In this study, sites with the highest cadmium body burdens in fish were associated with both natural and anthropogenic inputs. Salsbury Lake, BC, where the fish with the highest cadmium concentration was captured, is an isolated lake surrounded by forest. Although seemingly pristine, Salsbury Lake was the site of a lake fertilization program in the 1980s. Phosphate and nitrate fertilizers were added to Salsbury Lake for four years in an effort to enhance the productivity of the fishery (Hume, 1987). This is the likely reason for the relatively high cadmium concentrations in the ecosystem, as phosphate fertilizers can contain significant amounts of cadmium (T. L. Roberts, 2014). The Columbia River passes through the Columbia Mountains and drains areas which are naturally high in cadmium ore. Several mines that produce zinc and cadmium occur in its drainage basin and the site where fish are sampled is located close to a zinc processing plant in Trail, BC; a likely source of cadmium as well as other heavy metals to the Columbia River. Lac Edouard, QC also drains an area high in cadmium-containing sulphide ore and is the site of the former Lac Edouard mine which produced nickel and copper. Kejimkujik Lake is known for having high mercury and heavy metal concentrations, thought to be the combined result of aerial deposition from heavily populated areas to the south, and contamination from historic gold mining (S. Roberts et al., 2019).
Figure 36. Mean whole body concentrations of cadmium (mg/kg wet weight) in rainbow smelt in Canadian water bodies from 2010 to 2018

Long description
A map of the Great Lakes showing monitoring locations and cadmium concentrations in rainbow smelt. Concentrations were lowest in Lake Ontario and highest in Long Point followed by Whitefish Bay, Thunder Bay and Wheatly. See Appendix 2 for cadmium concentrations by species and location.
Figure 37. Mean whole body cadmium concentrations of a) sculpin species and b) round gobies in the Canadian Great Lakes


Long description
Two maps of the Great Lakes showing cadmium concentrations in (a) sculpin species and (b) round goby. Cadmium body burdens in sculpin were highest in Whitefish Bay Lake Superior, and in Port Credit, Lake Ontario (Figure 37a). Round gobies were found primarily in the lower Great Lakes and had the highest cadmium concentrations in Western Lake Erie (b)
The spatial trends of cadmium body burdens in top predator fish are different from the trends seen at water quality monitoring sites across Canada, which found that cadmium levels were lower in southern BC, and higher in the prairies and Arctic. For top predator fish, cadmium levels were instead highest in British Columbia, and relatively low in the prairies and arctic. The reasons for this are likely two-fold. First, fish, sediment and water quality data were often collected from different sites and so would have different background concentrations of cadmium. Second, even where fish are collected from the same sites as water or sediment samples, relative spatial trends may differ as body burdens are reflective of cadmium availability to fish and this varies depending on such factors as pH, organic matter and hardness.
In the Great Lakes, there is also some disconnect between the areas with the highest cadmium levels in sediments versus fish. Body burdens of cadmium in both lake trout (predator) and rainbow smelt (prey) were among the highest recorded for Lake Superior, and among the lowest for Lake Ontario, while the trends in cadmium levels in sediments and water are the reverse. This may be explained by differences in cadmium bioavailability between Lake Superior waters and Lake Ontario due to differences in the physiochemical environment. For instance, water hardness, which reduces cadmium bioavailability, is higher in Lake Ontario (~125 mg CaCO3/L) than Lake Superior (~45 mg CaCO3/L). It should be noted that sculpins from Port Credit, in Lake Ontario did have relatively higher body burdens. Unlike walleye, lake trout and smelt, which feed pelagically (in the water column), sculpins are more likely to be benthivorous (bottom feeding) and thus may be more exposed to cadmium in the sediments. Cadmium body burdens were elevated in most fish species in parts of the western basin of Lake Erie which corresponds to the elevated levels observed in sediments and water. In addition to the legacy sources noted in the sediment section, potential sources to the western basin could also be from the application of sewage sludge to agricultural fields, which can be high in cadmium (Jing & Logan, 1992).
Temporal trends by site and species in the Great Lakes
Temporal trends of annual cadmium body burdens were analyzed at all Great Lakes sites with sufficient long-term data. In general, the longest and most complete data sets are for lake trout and rainbow smelt. The longest temporal data set is for rainbow smelt, which extends as far back as the late 1970s at some locations, whereas for trout, there were only sufficient data to examine trends since 2000. The results of temporal trend analysis for all Great Lakes fish species with sufficient data are summarized in Table 8.
| Site | Lake trout | Walleye | Rainbow smelt | Sculpin species | Alewife |
|---|---|---|---|---|---|
| Thunder Bay | Decrease, not significant | N/D | Increase, not significant | N/D | N/D |
| Whitefish Bay | No trend | N/D | Increase, not significant | N/D | N/D |
| North Channel | N/D | N/D | Significant decrease | N/D | N/D |
| Georgian Bay | N/D | N/D | Decrease, not significant | N/D | N/D |
| Lake Huron | Significant decrease | N/D | Significant decrease | Decrease, not significant | N/D |
| Western Lake Erie | N/D | Increase, not significant | Decrease, not significant | N/D | N/D |
| Eastern Lake Erie | Significant decrease | N/D | Decrease, not significant | N/D | N/D |
| Niagara on the Lake | Decrease, not significant | N/D | Significant decrease | N/D | N/D |
| Western Lake Ontario | Increase, not significant | N/D | Decrease, not significant | N/D | N/D |
| Central Lake Ontario | Decrease, not significant | N/D | Significant decrease | No trend | Increase, not significant |
| Eastern Lake Ontario | Decrease, not significant | N/D | Significant decrease | Significant decrease | N/D |
At most sites in the Great Lakes, cadmium body burdens in fish are declining, and no significant increasing trends were found. However, trends in cadmium body burdens did vary by both lake and species. In Lake Superior, there were no significant trends in cadmium body burdens in either direction. Cadmium body burdens in smelt appear to be increasing, in a non-significant fashion, while body burdens in trout are declining non-significantly or remaining relatively stable. The sediment data indicates that concentrations of cadmium have declined in Lake Superior between the late 1960s and the present, but the long-term dataset for rainbow smelt do not reflect this despite covering much of the same time period from the early 1980’s to present. This may be because smelt feed primarily on the pelagic portion of the food web. If cadmium in Lake Superior is quickly bound to suspended particles and settles to the lake bed it might not appear in this portion of the food web or be bioavailable in the water column. However, cadmium in Lake Superior water samples has also declined for the period 2004 to 2019.
In Lake Huron, including Georgian Bay and the North Channel, cadmium is declining at all sites in all species, although those declines are not always rapid or statistically significant. Cadmium concentrations in rainbow smelt from Lake Huron decreased most steeply from the mid 1990s to the early 2000s, after which the trend has leveled off slightly. This corresponds to declining cadmium trends in the sediments and water of Lake Huron, except for Georgian Bay, where cadmium concentrations in sediments increased in some areas, but not where fish were collected.
In western Lake Erie, cadmium burdens in walleye appeared to be increasing slightly, whereas cadmium in smelt appears to be declining. Declines in smelt correspond to declining trends in cadmium in sediments and are over a similar time period, whereas cadmium burdens in walleye appear to be increasing recently and could be impacted by high cadmium levels still seen in areas such as Cleveland Bay or potentially from re-suspended sediment during upstream dredging. Similarly, the water data indicate variable cadmium levels and no trend over the past 15 years. In the colder waters of eastern Lake Erie, cadmium concentrations in lake trout declined steadily from 2006 to 2014. Declines in cadmium are also observed in rainbow smelt, similar to trends in sediment and water, although levels in smelt did appear to increase over the period from 1978 to 1995.
In Lake Ontario, there were no significant trends in predator fish. Lake trout at most sites appeared to be experiencing slight declines, with the exception of western Lake Ontario, where concentrations show a slight increase in recent years. In contrast, smelt at all Lake Ontario locations showed declines. Trends were more ambiguous for other prey species. Cadmium burdens in sculpin declined in eastern Ontario, but were unchanged in the central basin and concentrations in alewife in the central basin increased slightly. Declines in cadmium seen in eastern Lake Ontario and eastern Lake Erie are also confounded by changes in site location. In both cases, sampling locations shifted from Canadian to US waters during the time period of record which may account for some of the noted decline.
Findings and recommendations
Environmental monitoring of aquatic environments has been undertaken for many years by the federal government in coordination with provincial, territorial and international partners in the United States. The behaviour and toxicity of cadmium in the aquatic environment is complex and interpreting monitoring data requires a strong understanding of the natural sources of cadmium and toxicity modifying factors. Generally, the levels of cadmium found in sediments, water, and fish are declining, showing that progress is being made towards achieving the environmental objective, although cadmium levels in some areas remain above levels of concern. Atmospheric sources are likely important contributors to cadmium levels in aquatic environments, particularly in sediments. Forest fires may release significant amounts of cadmium into the air since cadmium tends to accumulate in plants and organic soils. However, there is no method to quantify this input to sediments (CEPA, 1994). With an increase in forest fires in recent years due to climate change, this could become an important source of cadmium input to aquatic environments. Harbour operations and shipping may also be linked with cadmium contamination in sediments.
It is recommended that:
- Work continues to identify and manage, as appropriate, sources of cadmium releases in areas where levels remain above guidelines or threshold effects levels in sediment and water. Particular attention should be paid to areas where levels are increasing or holding steady, taking into consideration natural conditions and potential contributions from the United States. Sources of sediment contamination in harbours may warrant further investigation.
- The role and relative contribution of atmospheric deposition of cadmium to water and sediment from different sources of release, including forest fires, should be explored further.
- Additional research on cadmium body burdens for aquatic species and potential impacts of cadmium in food web dynamics should be considered.
3.3 Wildlife
Wildlife are exposed to cadmium primarily through their diet (Burger, 2008). Inhalation can be another exposure route, although it likely only occurs near a major emission source, where air concentrations of cadmium are high (Archbold et al., 2007; Burger, 2008). Due to the importance of dietary exposure, an animal’s position in the food chain can influence the bioaccumulation of this metal. In general, cadmium does not biomagnify through food chains; rather tissue concentrations of cadmium tend to decrease as this metal is transferred from prey to predator. As a result, the highest cadmium concentrations are often found in lower trophic level animals, particularly herbivores (animals that eat plants)(Sun et al., 2020). However, there are exceptions where animals higher up on the food chain, such as marine mammals and birds, have elevated cadmium concentrations (Dietz et al., 1996, 1998). In addition, cadmium biomagnification has sometimes been reported for benthic environments, resulting in greater tissue concentrations at higher trophic levels as it is transferred up the food chain (Croteau et al., 2005; Espejo et al., 2018).
Among vertebrates, when cadmium is released from digested food in the gut and enters the blood stream, it accumulates primarily in the kidney and liver, and to a much lesser extent in other soft tissues such as muscle and brain. Wildlife excrete cadmium slowly from the body via feces and urine as well as in inert keratin tissues such as feathers, claws and fur and female birds and reptiles transfer small amounts of cadmium to their offspring during egg laying (Cooke, 2011; Wayland & Scheuhammer, 2011). Cadmium concentrations have been commonly reported to increase with age in a variety of wildlife such as seals and birds (Brown et al., 2016; Wayland & Scheuhammer, 2011).
3.3.1 Toxicological effects and risk of elevated cadmium exposure
Laboratory studies show elevated cadmium exposure can have sublethal toxicological effects on vertebrate animals. In birds and small mammals, cadmium exposure can cause damage to the intestine, kidneys and testes, reduce bone strength via osteoporosis, negatively impact reproduction and metabolism, and induce anemia (Cooke, 2011; Wayland & Scheuhammer, 2011; World Health Organization, 1992). The experimental doses of cadmium that caused those toxicological effects in the laboratory differed among studies and test species, although the doses (for example, dietary cadmium of 50 to 300 ppm dry weight; Hughes et al., 2003) were higher than what would naturally be found in the environment of the non-industrialized areas of Canada. In addition to dose, other factors can influence effects of cadmium exposure on wildlife such as age, a calcium-poor diet, and possible species-specific differences in sensitivity to cadmium (Larison et al., 2000; Schertz et al., 1991; Scheuhammer, 1987; World Health Organization, 1992).
Limited information is available on sublethal toxicological effects of cadmium to wild animals. Research on a sea duck species at a remote Arctic location showed little or no adverse effects on survival rates or growth and development in relation to levels of cadmium in the birds’ bodies (Wayland et al., 2002, 2003, 2008). Similarly, stress and reproductive indicators were not related to the level of cadmium found in a freshwater duck species (Pollock & Machin, 2008, 2009). An examination of kidneys in four species of ungulates from the Northwest Territories showed no evidence of effects to function for animals with kidney cadmium up to approximately 150 ppm dry weight (Larter et al., 2016). At a contaminated gold mine site in Yellowknife (Northwest Territories), muskrat and red squirrel showed signs of oxidative stress in their brains, and snowshoe hare had skeletal abnormalities in relation to higher cadmium exposure (Amuno, Jamwal, et al., 2018; Amuno et al., 2020). However, the study species were also highly exposed to arsenic from mining contamination, which may have either contributed to or been the primary cause of the observed health effects. It is challenging in field-based ecotoxicology studies to relate health effects with specific exposure to cadmium, because wildlife are commonly exposed to multiple contaminants in their diet, which may be contributing to observed health impacts. The most widely cited report of cadmium toxicity in wild animals from other countries is that of ptarmigan (a bird) in Colorado (United States), which fed on willow, a naturally elevated source of cadmium (Larison et al., 2000). In that study, 57% of ptarmigan in highly exposed populations showed damage to their kidneys. Elevated cadmium levels have been observed in ptarmigan in Canada as well (Rodrigue et al., 2007), although those levels were lower than in birds from the Colorado study. No information is available on potential toxicological effects from naturally elevated exposure to cadmium in ptarmigan of Canada.
Due to limited toxicological observations for wild animals, an assessment of tissue cadmium burdens was conducted to evaluate the potential risk of cadmium exposure to wildlife health in Canada. Critical tissue levels of cadmium that are associated with adverse sublethal effects were identified for animals (Table 9). Those thresholds are based on observed effects (that is, tissue dysfunction, altered metabolism) in animals with known tissue burdens, and they are commonly presented as ranges for specific types of animals due to variability among species and studies.
| Wildlife category | Tissue | Threshold tissue concentration (ppm dry weight) | Threshold tissue concentration (ppm wet weight) | Source |
|---|---|---|---|---|
| Birds | Kidney | 260a | 65 | (Wayland & Scheuhammer, 2011) |
| Birds | Liver | 150 to 235a | 45 to 70 | (Wayland & Scheuhammer, 2011) |
| Small mammals | Kidney | 105 to 210 | 30 to 60 | (Cooke, 2011) |
| Marine mammals | Kidney | 210a | 50 | (Caurant, 2013) |
a Converted from wet weight concentration using factors from (Dietz et al., 1996)
It is important to note that exceedance of a critical threshold tissue concentration suggests a greater risk of toxicological effects but does not indicate with certainty that the animal’s health was impaired. Applying threshold values obtained in laboratory studies to a range of wild species may not provide accurate indications of health risk. In addition to the amount of bioaccumulated cadmium, other factors such as age, diet, and species-specific sensitivity influence cadmium toxicity (World Health Organization, 1992). Marine mammals in Greenland, for example, had cadmium concentrations that far exceeded risk thresholds but showed no clear signs of cadmium-induced toxicity to their kidney (Dietz et al., 1998). In contrast, more subtle sub chronic effects, such as suppression of the immune system, may occur at lower tissue concentrations than the thresholds noted in Table 9 (Desforges et al., 2016).
3.3.2 Levels of cadmium in wildlife of Canada
Large amounts of data are available on cadmium concentrations in wildlife of Canada (Figure 38). Details on the sources of the data, locations of collection, and study species can be found in Appendix 1. The most common wildlife tissues analyzed for cadmium were liver and kidney, and concentrations in those tissues varied widely from 0.02 to 75 and 0.03 to 226 ppm dry weight, respectively. Higher concentrations were observed in marine and terrestrial birds, marine mammals, and ungulates (animals with hooves) compared with waterbirds and aquatic mammals living in freshwater environments and other terrestrial mammals. Considering all data available for liver of wildlife species across Canada (representing 6,266 measurements), 95% of average cadmium concentrations reported in studies were less than 50 ppm dry weight. Similarly, 95% of average cadmium concentrations in kidney reported in wildlife studies were less than 151 ppm dry weight (representing 1,384 measurements). These are generally below the threshold tissue concentrations noted in Table 9. The highest reported cadmium concentrations were found in liver of a marine mammal (ringed seal, Pusa hispida, 75 ppm dry weight) and a marine bird species (northern fulmar, Fulmarus glacialis, 73 ppm dry weight), and in kidney of a terrestrial bird (willow ptarmigan, Lagopus lagopus, 214 to 226 ppm dry weight). Differences in cadmium concentrations of wildlife reflect a number of factors including age, diet, location-specific exposure to cadmium, and physiological variation among species in their capacity to eliminate this metal from their body (Burger, 2008; Wayland & Scheuhammer, 2011).
Figure 38. Cadmium concentrations in liver and kidney of wildlife measured in Canada since 1994

Long description
Box and whisker plots showing the distribution of mean values from published and unpublished studies documenting cadmium levels in the liver and kidney of wildlife (see Annex 2 for data and sources). The thick line is the median value, the box delineates the 25th and 75th percentiles, and the horizontal error bars delineate the 5th and 95th percentiles. Data points are 86 mean values for kidney (representing 1,384 measurements) and 169 means for liver (representing 6,266 measurements). The plots show that terrestrial birds have the highest mean concentrations in the kidney and marine mammals and birds have the highest concentrations in the liver. Non-ungulate terrestrial mammals have the lowest mean cadmium levels in their kidney and aquatic mammals have the lowest mean cadmium levels in their liver.
Cadmium does not typically accumulate to high levels in other wildlife tissues. The cadmium content of bird blood, muscle and eggs is sometimes so low as to be below analytical detection (Braune & Malone, 2006; Hargreaves et al., 2011; Pratte et al., 2015). In Canada, eggs of marine and terrestrial birds typically have cadmium concentrations less than 0.5 ppm dry weight (Pratte et al., 2015) while blood cadmium concentrations of 0.05 to 0.1 ppm dry weight were reported for marine birds in the Arctic (Wayland et al., 2008); converted from wet weight assuming 90% moisture). Birds with higher cadmium concentrations in blood also tend to have higher concentrations in their kidneys, reflecting differences in exposure among individuals (Wayland et al., 2001). Similarly, bone contains little cadmium, with reported concentrations in Canada of less than 1 ppm dry weight for elk (Parker & Hamr, 2001) and less than 3 ppm dry weight for sandpipers (McFarland et al., 2002). Muscle of upland game birds, waterfowl and large game, which may be consumed by humans, typically have cadmium concentrations less than 1 ppm dry weight, although higher values have been reported for ptarmigan (Braune & Malone, 2006; Gamberg et al., 2005; Parker & Hamr, 2001).
As part of Canada’s Chemicals Management Plan, two aquatic and terrestrial wildlife bioindicators were monitored for chemicals across Canada since 2008 (Figure 39). Eggs of herring gulls (Larus argentatus), glaucous-winged gulls (L. glaucescens), and California gulls (L. californicus), all aquatic-feeding species, and the European starling (Sturnus vulgaris), a land-based (terrestrial) songbird that nests near urban centres, were assessed for cadmium from 2008–2019. Cadmium concentrations in eggs of aquatic-feeding species (gulls) and terrestrial-feeding species (starlings) were generally very low across Canada during this period and below 0.001 ppm dry weight (Figure 40 and Figure 41). Of 196 gull egg measurements for cadmium, 66.3% had concentrations above respective method detection limits (MDLs). Similarly, of 214 starling egg measurements, 42.5% had concentrations above respective cadmium MDLs.
Limited data are available for cadmium in snapping turtle (Chelydra serpentina) eggs in Canada. Mean (± standard deviation) cadmium concentrations in eggs ranged from 0.0028 (± 0.001) ppm to 0.0029 (±0.0013) ppm dry weight at two sites on Lake Ontario and one remote site at Algonquin Provincial Park in 2004 (based on 3–25 clutches analyzed)(De Solla, Unpublished).
An assessment using the available database for Canadian wildlife showed all cadmium levels in liver of birds and the vast majority of kidney concentrations (>99%) of birds, small mammals and marine mammals were below thresholds for greater risk of sublethal toxicological effects noted in Table 9. Cadmium concentrations in kidney of Arctic hare (106 ppm dry weight) from Nunavut slightly exceeded the lower threshold for small mammals, while kidney concentrations in willow ptarmigan (214 to 226 ppm dry weight) approached but did not exceed the threshold for birds. In those cases, elevated cadmium exposure was likely not due to human-driven contamination but instead naturally high levels of cadmium in the environment that accumulated in plants, the primary food source for these animals.
Based on the best available information, this assessment suggested that wildlife in Canada are, in general, not likely to be at greater risk of sublethal toxicological effects from cadmium exposure. Limited measurements exist for cadmium in wildlife near point-sources of release in Canada, and further toxicological study may be warranted, particularly for small mammals (Amuno, Al Kaissi, et al., 2018).
Figure 39. Monitoring locations of eggs under the Chemicals Management Plan

Long description
A map of Canada showing the locations of monitoring for contaminants in eggs of European Starlings and gulls. Two photos of birds and their eggs are also shown. The European Starling (top left) is a small dark bird with small light blue eggs. The gull shown (top right) is a medium sized bird with a white head and torso and a grey body. Its eggs are speckled light brown.
Eggs of aquatic-feeding gulls are collected annually from 14 colonies across Canada (red circles) plus 11 to 12 Great Lakes colonies. Eggs of starlings (an indicator of terrestrial exposure) are also collected annually at 5 large metropolitan areas (yellow stars) and from nest boxes within these areas that are associated with 3 land-use types: in close proximity to landfill sites, within urban/industrial centres, and 10 to 40 kilometres outside urban/industrial areas (rural).
3.3.3 Temporal trends of cadmium in wildlife
Changes in the levels of cadmium in wildlife over time provide information on changes in environmental exposure that may, in part, result from an increase or reduction in cadmium loading to the environment. A few populations of caribou and ringed seal in the Canadian Arctic have been monitored routinely over 10 to 30 years by the Northern Contaminants Program to assess temporal trends in contaminant bioaccumulation. The Northern Contaminants Program was established in 1991 in response to concerns about human exposure to elevated levels of contaminants in wildlife species that are important to the traditional diets of northern Indigenous peoples. Early studies found a wide variety of substances, many of which had no Arctic or Canadian sources, but which were, nevertheless, reaching unexpectedly high levels in the Arctic ecosystem (Government of Canada, 2022b) . Time series were available for cadmium levels in kidney of caribou from 3 different regions: the Porcupine herd in the northern Yukon (28 years of data between 1990 and 2017), the Qamanirjuaq herd in western Nunavut (13 years between 2006 and 2018), and the Tay/Finlayson herds in the Central Yukon (13 years between 1992 and 2010). For the Porcupine caribou herd, a statistically significant declining trend of 3% per year in kidney cadmium concentration was observed over the last 3 decades (n = 645, p < 0.001) while no temporal trends were observed for the other studied caribou herds. Time series were also available for cadmium concentrations in ringed seal liver from Lancaster Sound (13 years of data between 2000 and 2018) and Western Hudson Bay (10 years between 2008 and 2018) in Nunavut; no temporal trends in cadmium levels were observed in either of these populations. These findings indicate that exposure of these caribou and seal populations to cadmium in terrestrial and marine environments of northern Canada has either not changed or has slightly decreased in recent decades.
For gulls monitored as part of the Chemicals Management Plan, cadmium levels were compared in eggs at 10 colonies between two time periods: 2008 to 2011 and 2016 to 2019 (Figure 40). Many of the gull egg samples had very low cadmium levels, below analytical detection limits, and the average concentrations were consistently low during both time periods. No evidence was found of a general increase in cadmium bioaccumulation during the more recent sampling period. A similar trend was observed for terrestrial starlings, based on a comparison of cadmium levels in eggs at 12 sites measured during the two same time periods (Figure 41).
Figure 40. Comparisons of average concentrations (± standard deviation) of cadmium in gull eggs collected in 2008 to 2011 and 2016 to 2019 (ppm, dry weight)

Long description
A box and whisker plot showing the average concentration and standard deviations for cadmium content in gull eggs measured at locations across Canada.
| Location | Average concentration (ppm) 2008 to 2011 | Standard deviation | Average concentration (ppm) 2016 to 2019 | Standard deviation |
|---|---|---|---|---|
| BC Mandarte I. | 0.0004 | 0 | 0.00027 | 0.00022 |
| BC Mitlenatch I. | 0.00038 | 0 | 0.00067 | 0.00035 |
| BC Cleland I. | 0.00146 | 0 | 0.00073 | 0.00026 |
| AB Dalemead | 0.00185 | 0 | 0.00151 | 0.00067 |
| MB Pipestone Rocks | 0.00089 | 0 | 0.00021 | 0.00015 |
| ON Hamilton Harbour | 0.00119 | 0.00035 | 0.00031 | 0.00015 |
| ON Toronto Harbour | 0.00082 | 0.00051 | 0.00044 | 0.00026 |
| QC Ile Deslauriers | 0.00064 | 0.00025 | 0.00037 | 0.00018 |
| QC Ile Bellechasse | 0.00023 | 0 | 0.00035 | 0.00026 |
| NL Gull I. | 0.00093 | 0 | 0.0007 | 0.00045 |
Measurements were made on pooled samples composed of multiple eggs and the sample sizes of average values ranged from 1 to 11. The orange band represents the range in method detection limits used in this study.
Figure 41. Comparisons of average concentrations (± standard deviation) of cadmium in starling eggs collected in 2008 to 2011 and 2016 to 2019 (ppm, dry weight)

Long description
A box and whisker plot showing the average concentration and standard deviations for cadmium content in starling eggs measured at locations across Canada.
| Location | Type | Average concentration (ppm) 2008 to 2011 | Standard deviation | Average concentration (ppm) 2016 to 2019 | Standard deviation |
|---|---|---|---|---|---|
| BC Delta | Landfill | 0.0012 | 0.0007 | 0.0003 | 0.0003 |
| BC Abbotsford | Industrial | 0.0013 | 0.0000 | 0.0002 | 0.0003 |
| AB Calgary | Landfill | 0.0014 | 0.0003 | 0.0004 | 0.0006 |
| AB Calgary | Industrial | 0.0037 | 0.0031 | 0.0002 | 0.0001 |
| AB Strathmore | Rural | 0.0006 | 0.0000 | 0.0002 | 0.0002 |
| ON Halton | Landfill | 0.0007 | 0.0000 | 0.0002 | 0.0001 |
| ON Delhi | Rural | 0.0020 | 0.0003 | 0.0003 | 0.0002 |
| QC Lachenaie | Landfill | 0.0011 | 0.0004 | 0.0003 | 0.0002 |
| QC PN/Montreal | Industrial | 0.0012 | 0.0000 | 0.0002 | 0.0001 |
| QC Lanoraie | Rural | 0.0012 | 0.0000 | 0.0003 | 0.0001 |
| NS Otter Lake | Landfill | 0.0012 | 0.0000 | 0.0004 | 0.0003 |
| NS Graves Island | Rural | 0.0006 | 0.0000 | 0.0003 | 0.0002 |
Measurements were made on pooled samples composed of multiple eggs and the sample sizes of mean values ranged from 1 to 16. The orange band represents the range in method detection limits used in this study.
3.3.4 Spatial patterns of cadmium in wildlife
Wildlife exposure to cadmium differs between marine, terrestrial and freshwater environments in Canada (Figure 42). The highest cadmium levels in both liver and kidney were found in marine birds and mammals from Atlantic, Pacific or Arctic marine regions. Terrestrial wildlife, including birds, ungulates and small mammals, varied widely in their tissue cadmium concentrations, though many values were found to be in-between those found for marine and freshwater wildlife. The lowest cadmium concentrations were found in freshwater wildlife, including waterbirds and aquatic mammals. A review of cadmium bioaccumulation in birds similarly noted marine birds tend to have the highest tissue levels compared to birds living in freshwater and terrestrial environments (Wayland & Scheuhammer, 2011).
Figure 42. Comparison of cadmium concentrations in liver and kidney of wildlife feeding in marine, terrestrial and freshwater environments of Canada

Long description
Box and whisker plots showing the distribution of mean values from published and unpublished studies documenting cadmium levels in the liver and kidney of wildlife (see Annex 2 for data and sources). The thick line is the median value, the box delineates the 25th and 75th percentiles, and the horizontal error bars delineate the 5th and 95th percentiles. Data points are 86 mean values for kidney (representing 1,384 measurements) and 169 means for liver (representing 6,266 measurements). The plots show similar patterns for cadmium accumulation in the kidneys and liver of wildlife based on their feeding environments. Generally, wildlife feeding in marine environments have higher cadmium levels than those in terrestrial environments, and those feeding in freshwater environments have the lowest cadmium levels.
These patterns likely reflect natural processes that enhance the bioavailability and uptake of cadmium at the base of marine and terrestrial food webs. Marine benthic invertebrates (animals without a spine) such as mussels, oysters and snails efficiently absorb cadmium through their diet and have little capacity to eliminate this metal, which can result in higher levels in those biota (Wang, 2002). Some marine invertebrates living in the water column in the open ocean can also accumulate higher levels of cadmium (C. R. Macdonald & Sprague, 1988). In terrestrial environments, plants differ considerably in their cadmium uptake, and willow in particular is a known natural accumulator of cadmium (Ohlson & Staaland, 2001). Higher concentrations found in willow increase the cadmium exposure of herbivores that feed on this plant such as moose and willow ptarmigan (a bird)(Gamberg et al., 2005; Rodrigue et al., 2007).
Several species of sea ducks, which have a similar diet of marine benthic invertebrates, differed in their cadmium concentrations among coastal areas of Canada (Figure 43). Eider and scoter species generally had lower kidney and/or liver cadmium levels in southern British Columbia and the Atlantic provinces compared with eider species sampled in Hudson Bay and the Arctic Archipelago. It is unclear whether this spatial pattern reflected a geographic effect of greater cadmium exposure at the Arctic sites or the influence of factors associated with their annual life cycle. Sea ducks are typically migratory, and the birds at Arctic locations were sampled during the breeding period while birds along the Pacific and Atlantic coasts were sampled during the non-breeding, wintering period. Cadmium bioaccumulation in sea ducks is influenced by cadmium exposure from local food availability at both their northern breeding sites and their overwintering locations at lower latitudes (Gurney et al., 2014). Similarly, physiological changes during reproduction such as weight loss can influence cadmium concentrations in sea ducks, which can confound comparisons between breeding and non-breeding birds (Wayland et al., 2005). It is possible that higher cadmium concentrations in sea ducks at Arctic sites reflected greater exposure since elevated cadmium has been reported for marine biota in the Canadian Arctic and Greenland due to natural geochemical processes rather than greater loading of cadmium from anthropogenic sources (AMAP, 2005; R. W. Macdonald et al., 2000). An investigation of ringed seal showed spatial patterns in liver cadmium were related to differences in diet, with higher concentrations of seals feeding on marine invertebrates than those feeding on fish (Brown et al., 2016). Geological influences may have also played a role in the higher cadmium burdens of ringed seal in the eastern Arctic relative to the western Arctic (Brown et al., 2016).
Figure 43. Spatial patterns of cadmium concentrations in liver and kidney of sea ducks sampled on Atlantic, Pacific and Arctic coasts of Canada

Long description
A map of Canada with different sized dots showing the locations of sea ducks sampled for cadmium in the liver and kidney. The size of the dots corresponds to the concentrations of cadmium found. The two largest dots show the highest concentrations found in the kidneys of sea ducks in East Bay, NU (150 ppm dry weight), in Ulukhaklok, NU (120 ppm dry weight), and in Sanikiluaq, NU (90 ppm dry weight). Liver concentrations at these locations were substantially lower, and less than 50 ppm dry weight. Liver and kidney concentrations appear to be higher in the Arctic than in southern Canada. A bar chart is also shown in the figure plotting both cadmium levels in liver and kidney tissues for each sampling location. The highest liver concentrations were found at Tern Island, NU, and lowest at Mahone Bay, NS. See Annex 2 for data.
Location-specific values are means of measurements on an eider or scoter species, which feed on marine benthic invertebrates. The median sample size for each location was 10 (range of 3 to 73).
For monitoring under the Chemicals Management Plan, where confounding effects of bird annual life cycle were accounted for, cadmium levels in gull eggs were low at both coastal and inland sites across Canada, and there was no evidence of any locations with elevated bioaccumulation. The highest mean cadmium concentration (0.0015 ppm) was found in gull eggs at Dalemead, Alberta, collected from 2016–2019. Little difference in egg cadmium levels were observed between colonies where gulls fed in a marine environment (that is, 3 BC colonies; East Bay, NU; Kent Island, NB; and Gull Island, NL) (0.00063 ppm) and those where gulls fed in freshwater environments (remaining 13 colonies) (0.00056 ppm). For starlings, egg cadmium concentrations were low and, in general, similar at locations near landfills, industrial sites or in rural areas, suggesting little difference in cadmium exposure among starling sites across Canada or among the 3 land-use types (Figure 44). The highest concentration (0.0061 ppm) was found in a pooled sample of starling eggs from a landfill in Brantford (ON).
Figure 44. Mean concentrations (+ standard deviation) of cadmium in starling eggs at sites across Canada from 2016 to 2019 (ppm, dry weight)

Long description
| Cadmium | Type | Average concentration (ppm) | Standard deviation |
|---|---|---|---|
| BC Delta landfill | Landfill | 0.00028 | 0.00029 |
| BC Abbotsford | Industrial | 0.00021 | 0.00026 |
| BC Langley | Rural | 0.00057 | 0.00059 |
| AB Calgary landfill | Landfill | 0.00041 | 0.00061 |
| AB Calgary ind. | Industrial | 0.00023 | 0.00011 |
| AB S. of Strathmore | Rural | 0.00025 | 0.00017 |
| AB Redcliff | Rural | 0.00035 | 0.00012 |
| ON Brantford | Landfill | 0.00160 | 0.00297 |
| ON Halton | Landfill | 0.00020 | 0.00080 |
| ON Hamilton | Industrial | 0.00021 | 0.00010 |
| ON Delhi | Rural | 0.00026 | 0.00017 |
| QC Lachenaie | Landfill | 0.00028 | 0.00017 |
| QC Montreal | Industrial | 0.00025 | 0.00011 |
| QC Lanoraie | Rural | 0.00025 | 0.00011 |
| NS Otter Lake waste | Landfill | 0.00040 | 0.00034 |
| NS Dartmouth refinery | Industrial | 0.00030 | 0.00011 |
| NS Graves I. PP | Rural | 0.00025 | 0.00021 |
Three land-use types are indicated. Measurements were made on pooled samples composed of multiple eggs and the sample sizes of mean values ranged from 3 to 16 per site. The orange band represents the range in MDLs in this study.
Human activities, particularly non-ferrous refining and smelting, are important sources of cadmium emissions in Canada (as noted in section 2). Higher tissue concentrations of cadmium were found in muskrat at sites closer to ore smelters at Sudbury, Ontario (Parker, 2004) and in snowshoe hare collected close to a gold mine at Yellowknife, Northwest Territories (Amuno, Jamwal, et al., 2018). Other studies of wildlife exposure to metals from a lead-zinc mine in Nunavut and a uranium mine in northern Saskatchewan showed no enhancement of cadmium bioaccumulation in hare or moose collected close to those developments (Amuno et al., 2016; Thomas et al., 2005). In the oil sands region of northern Alberta, small mammals and tree swallows (Tachycineta bicolor) did not show higher exposure to cadmium near bitumen mining developments (Godwin et al., 2016; Rodríguez-Estival & Smits, 2016). The bioaccumulation of cadmium released from human activities is related to the amount of cadmium deposited in the receiving environment as well as site-specific environmental conditions that influence cadmium bioavailability to biota. For example, soil acidification can stimulate the uptake of cadmium by plants in terrestrial environments (Muhammad et al., 2012), which may result in greater exposure to herbivores.
Findings and recommendations
Cadmium bioaccumulates primarily in the kidney and liver of vertebrate animals. Concentrations differed among wildlife species in Canada, with higher levels found in marine animals compared with those in terrestrial and freshwater ecosystems.
Temporal trend monitoring of cadmium concentrations in caribou and ringed seal populations indicated that wildlife exposure to cadmium in terrestrial and marine environments of northern Canada either did not change or slightly decreased over the last 2 to 3 decades. Monitoring of cadmium in gull and starling eggs between two time periods (2008 to 2011 and 2016 to 2019) showed consistently low concentrations in the last two decades at locations across Canada.
Cadmium concentrations in starling eggs were low and similar at locations near landfills, industrial sites or in rural areas, suggesting little difference in cadmium exposure for starlings among those land-use types. Some evidence was reported for higher tissue concentrations of cadmium in wildlife near ore smelters and mine sites.
Limited information is available on sublethal toxicological effects of cadmium to wild animals in Canada. Based on the available data on cadmium levels in wildlife tissues presented in this section, in general, wildlife in Canada are likely at low risk of sublethal toxicological effects from cadmium exposure.
It is recommended that:
- additional measurements for cadmium in wildlife be collected near point-sources of release in Canada
- further toxicological study of the effects of cadmium in wildlife be considered, particularly for small mammals
3.4 Conclusion on cadmium in the environment
Levels of industrial release have declined and levels in the environment have mostly followed the same trends. According to NPRI, most cadmium released from industries goes into the air and atmospheric deposition appears to be an important contributor to cadmium levels in the aquatic environment in some regions. Sediment concentrations across Canada showed the greatest cause for concern compared to other environmental media due to a number of locations with levels higher than threshold effects levels and probable effects levels. In particular, the Great Lakes, parts of the St. Lawrence, and the Atlantic sector had median concentrations above guideline levels. However, it is important to consider the bioavailability of cadmium in assessing impacts to the environment as demonstrated by conflicting data patterns for water, fish and sediments for the Great Lakes region.
It is difficult to compare sampling undertaken in different media because they are often collected at different locations at different times. The Great Lakes region is the most well studied and has the most comprehensive datasets. Looking at the data from all environmental media, it appears that Lake Erie and the connecting channels of the lower Great Lakes may be more greatly impacted by cadmium pollution than other areas in Canada. This is evidenced by observations of higher cadmium levels in air in the Great Lakes regions (Windsor, Hamilton) compared to other regions, sediment levels well above the threshold effects levels, particularly in the western basin, exceedances of water quality guidelines, and observations of higher levels in fish from this area compared to other areas. However, wildlife observations of cadmium levels were no higher in the Great Lakes region compared to other areas of Canada.
Higher levels of cadmium were observed in wildlife, fish, and sediment near active and closed mining and smelting operations (for example Columbia River, St. Lawrence, Grand Lake, Kejimijujik) and transportation of ores (as seen in Quebec City). Data from metals mining operations showed that cadmium concentrations released in effluent and concentrations in exposure areas are declining, though some reference and exposure areas have cadmium levels exceeding environmental quality guidelines. Cadmium levels in air, fish, and wildlife did not appear to be higher near oil sands operations than elsewhere in Canada. These findings are consistent with the release data noted in section 2, where the metals and ore industry is the primary source of cadmium releases and oil and gas production contributes much smaller amounts. Data for cadmium in the environment near other industrial sources were not available.
Additional hotspots and industrial sources may be discovered as work continues to identify sources of contaminants of concern in the critical habitat areas of endangered whales and their prey. Data from PAWPIT suggests there may be sources of cadmium releases not currently captured by existing federal release inventories and that surface water runoff may be a large contributor to cadmium levels in the Fraser River basin and St Lawrence River.
Cadmium appears to be present in all environmental media at relatively low levels across Canada, with the exception of some hotspots. Levels found in land based animals are typically lower than those expected to cause sublethal toxicological effects. However, the impacts of cadmium at very low levels has not been well studied in wild animals and there may be potential impacts to behaviour or immune responses that are not obvious in post mortem examinations. Similarly, the impacts on fish are unclear as no known guidelines for fish exist to indicate at what levels cadmium in the body leads to negative health effects. Cadmium does not appear to biomagnify, meaning that adverse impacts seen due to high cadmium levels in sediments may not be apparent in fish feeding on small aquatic invertebrates at the bottom of the food chain that live in the sediments. In addition, the relative burden of cadmium in the mixture of contaminants to which wildlife are exposed is difficult to estimate.
4. Risk management
The Canadian Environmental Protection Act enables the Government of Canada to take action to manage the risks of toxic substances to the environment and human health. Recalling the approach taken under the Toxic Substances Management Policy as well as the Chemicals Management Plan, the following section outlines the relevant risk management actions taken for inorganic cadmium compounds with a goal to provide information that will be used in section 6 to evaluate the progress made in achieving the risk management approach and objective. While provincial and territorial efforts have played an important role in reducing cadmium emissions and releases to the environment, they are beyond the scope of this report, which focuses only on federal actions.
4.1 Risk management actions
The risk management actions the Government has put in place to control releases of substances to the environment are also called risk management instruments and may include: policies, guidelines, pollution prevention planning notices, performance agreements, legislation, and other measures. A review of risk management instruments will provide information on whether the Government has taken action to achieve the risk management objective. Indicators will be the number of instruments developed to address releases of cadmium to the environment as well as the proportion of those instruments that take action to the primary release pathways of concern as identified in the 1994 assessment.
To conduct this evaluation, a review of the CEPA registry and Canadian Council of Ministers of the Environment documentation was undertaken as an initial screening exercise. Subsequent literature searches were also conducted. Keeping in mind the risk management approach for track 2 substances, risk management instruments were included in this section if they:
- control emissions or releases from a source or sector of concern noted in the 1994 Assessment
- directly target cadmium releases or emissions or set a guideline, limit, or threshold for cadmium releases from sectors of concern
- result in a co-benefit for cadmium from a specific source/sector of concern, for example, reductions in particulate matter from combustion activities
- control general toxicity of releases in a sector of concern that contributes significantly to cadmium releases
- are linked to one of the Strategic Options Process Issue Tables
Due to the long time period under consideration in this evaluation, instruments that are no longer in force may still be relevant to overall performance measurement of risk management measures if they contributed to cadmium reductions during the time that they were in force.
The evaluation will also consider the proportion of instruments that have met their intended targets and objectives where information is available. This information will indicate whether the risk management instruments were successful and will provide helpful context for the overall evaluation of the risk management approach. For example, links could be made between the success of risk management instruments and the trends in industrial releases.
Additionally, where possible, information on the proportion of facilities implementing best available technologies and best environmental practices will be considered in the evaluation of the risk management objective. The proportion of facilities implementing best practices and technologies will provide information on whether there has been progress made to achieve the risk management objective to reduce cadmium releases to the lowest extent technically and economically feasible.
For ease of reference, actions were grouped by industrial sectors.
4.1.1 Metal and mineral production
4.1.1.1 Base metals smelting and refining
Base metals smelting and refining is the production of one or more of the following metals: cobalt, copper, lead, nickel and zinc from raw materials that come primarily from ore. This is generally completed through processes such as pyrometallurgy and/or hydrometallurgy. Primary smelting and refining processes produce metals directly from ore concentrates, while secondary processes produce metals from scrap and waste. Base metals smelting and refining facilities release various substances found on the List of Toxic Substances in Schedule 1 to the Canadian Environmental Protection Act. These toxic substance releases include air releases of particulate matter containing cadmium. Because of these releases, the Government has been working to reduce pollution from this industry since the mid-1970s. As noted in section 2, the base metals smelting and refining sector consistently accounts for most of the releases of cadmium to air.
Accordingly, this sector was targeted in the Strategic Options Process over the 1996-1997 period. The Strategic Options Process produced a Strategic Options Report that resulted in 10 recommendations for the management of toxic substances from the sector, including the development of environmental performance standards (Government of Canada, 2002).
Seven of the 10 recommendations are relevant to the risk management of cadmium and can be summarized as:
Recommendation #1 – release reduction targets and schedules: reduce total releases of arsenic, cadmium, lead, mercury and nickel from the base metals smelting sector by 80% from 1988 levels by the year 2008 and by 90% beyond 2008 through the application of technically and economically feasible methods.
Recommendation #2 – environmental standards: develop Canada-wide environmental ambient air and water quality guidelines for substances of relevance to the base metals smelting sector; develop appropriate environmental source performance guidelines for discharges to water and air taking into account best available pollution prevention techniques and control technologies economically achievable for new and existing smelters no later than the year 2000; develop protocols for measurement and reporting of releases and provide appropriate opportunities for stakeholder involvement in development of environmental guidelines and protocols.
Recommendation #3 – site-specific environmental management plans: develop and implement site-specific environmental management plans for each facility and evaluate the effectiveness of these plans in 2001.
Recommendation #4 – consistent data and reporting: develop and implement standard reference methods for release monitoring, quality assurance/quality control, and independent verification of the system for monitoring and reporting of data to support Canadian Council of Ministers of the Environment guidelines.
Recommendation #5 – Federal-Provincial cooperation: develop a coordinated approach that avoids duplication in the implementation of environmental measures for the sector.
Recommendation #8 – research and development: undertake cooperative scientific research programs to characterize smelter releases, validate predictive models, investigate environmental behaviours and effects, and identify and develop pollution prevention opportunities and technologies.
Recommendation #10 – public review: initiate a public review process to assess the implementation and effectiveness of the recommendations of the SOR in 2001, focusing on the management of CEPA substances released by the base metals smelting sector to determine if further action is needed.
In response to these recommendations, the Government commissioned several reports to collect information and assist in the development of environmental standards, best practices, and available pollution prevention opportunities and technologies. Additionally, Environment Canada held two public national workshops on the performance of the base metals sector and the development of environmental performance standards for the sector. This work led to the establishment of a Base Metals Environmental Multi-Stakeholder Advisory Group that assisted in the development of the Code of Practice for Base Metal Smelters and Refineries and Pollution Prevention Planning Notice for the sector.
Code of Practice for Base Metal Smelters and Refineries
The Environmental Code of Practice for Base Metals Smelters and Refineries was published in 2006, taking into account the recommendations resulting from the Strategic Options Report. Its objective is to identify and promote recommended practices as requirements for new facilities and as goals for continual improvements for existing facilities. It describes operational activities and associated environmental concerns of this industrial sector. The Code of Practice made 38 recommendations related to the development and implementation of environmental management systems and the prevention and control of atmospheric emissions, wastewater effluents, and wastes. The Code of Practice includes recommended ambient air quality objectives for some pollutants, including cadmium. The recommended objective for cadmium in ambient air is 2 µg/m3 averaged over a 24-hour period.
Progress to date: The Code of Practice itself does not require reporting. However, facilities subject to the Pollution Prevention Planning Notice for base metals smelters and refineries and zinc plants and Environmental Performance Agreements (discussed below) are required and report annually on progress towards implementing the 38 recommendations in the Code of Practice.
These reports, submitted under the Pollution Prevention Planning Notice have been collected from most facilities since 2006. Between 2006 and 2018, the 11 base metals smelting facilities as a whole fully implemented more than 80% of applicable recommendations, on average, and were in conformance with the Code of Practice.
Pollution Prevention Planning Notice
In 2006, the Government of Canada published its Notice requiring the preparation and implementation of pollution prevention plans in respect of specified toxic substances released from base metals smelters and refineries and zinc plants under the Canadian Environmental Protection Act, 1999. This Notice required the base metals smelting and refining sector to prepare and implement “pollution prevention plans” by December 31, 2015. The risk management objective of this Notice was to consider the application of best available techniques to prevent and control pollution in order to avoid or minimize pollutants and waste and reduce risk to the environment or human health.
Under the Pollution Prevention (P2) Planning Notice, annual air release targets for particulate matter, which contains metals including cadmium, were identified for specific facilities for 2008 and 2015. The sector was subject to a total metals reduction (recommendation 1 of the 1997 Strategic Options Report) however, no specific release limit targets were developed for cadmium, since controlling emissions of particulate matter were determined to be sufficient to control emissions of cadmium.
Pollution prevention focuses on avoiding the creation of pollutants rather than trying to manage them after they have been created. In developing their plans, facilities were asked to prioritize pollution prevention methods such as “equipment or process modifications”, “good operating practices or training”, “material or feedstock substitution”, etc. and also to consider the use of pollution control methods to manage the pollution generated during the industrial process. Additionally, facilities were required to consider the recommendations of the Strategic Options for the Management of Toxic Substances from the Base Metals Sector and the Environmental Code of Practice for Base Metals Smelters and Refiners in developing and implementing their pollution prevention plans, as noted in the sections above. Some facilities applied for, and were granted extensions until December 31, 2018, to implement their pollution prevention plans.
Progress to date: The P2 Planning Notice ended in December 2018. The implementation of P2 plans resulted in a reduction in emissions of targeted toxic substances from the base year of 2005. From 2005 to 2018, there was an 89% decrease (28 tonnes) in cadmium emissions and an overall metals reduction of 93% since 1988, exceeding the recommendations set out in the Strategic Options Report. The final performance report of the P2 Notice indicated that total emissions of metals were reduced by 7 facilities but two facilities increased their total metal emissions when compared to 2005 levels (Figure 45) (Environment and Climate Change Canada, 2022f). All nine facilities with particulate matter targets met their 2008 reduction targets, and eight out of nine met their 2015 targets.
Examples of the pollution prevention activities implemented were custom feed purchasing, or applying limits on the concentration of metals in secondary feed materials. Another example of good operating practices was paving or wetting unpaved roads on-site in order to reduce fugitive particulate matter emissions. Examples of effective pollution control measures implemented include replacing or upgrading equipment such as electrostatic precipitators to allow greater capture of particulate matter and metals at some facilities. In some cases, the captured particulate matter contained a lot of metals and so it could be recycled back into the production process (on-site recovery and reuse).
Overall, the 2006 Pollution Prevention Planning Notice met its objective and contributed to a reduction in emissions of targeted toxic substances from the base year of 2005. Facilities implemented both pollution prevention and pollution control methods to achieve results. Factors to consider from the Notice, like the recommended practices of the Code of Practice and the Strategic Options report were taken into consideration by each facility in order to meet the risk management objective. Facilities that were subject to the 2008 and 2015 targets for targeted substances largely achieved them. As of December 31, 2018, all the facilities had considered the factors listed in the Notice and implemented air release limit targets.
Figure 45. Total emissions of metals for base metals smelting facilities subject to the P2 Notice

Long description
This figure shows the trend of total emissions of metals (arsenic, cadmium, lead, nickel, mercury) for each facility subject to the Notice. Nine facilities are presented on the figure from left to right. Four column charts show emissions for 2005, 2008, 2015 and 2018 for seven facilities. HBMS and Glencore Kidd only show two column charts emissions for 2005 and 2008 because they closed their operations in 2010.
From left to right, the figure shows total emissions of metals column charts for HBMS, Vale-Thompson, Vale Copper Cliff, Glencore-Sudbury, Glencore Horne, Glencore Brunswick, Glencore CEZ, Teck-Trail and Glencore Kidd.
Performance Agreements
On January 5, 2018, Environment and Climate Change Canada published Performance Agreements that focus on air pollutants from 11 base metals facilities owned by 5 companies, . These agreements, part of Canada’s Air Quality Management System, were intended to implement the base-level industrial emissions requirements for base metals smelting and refining facilities, for sulfur dioxide and particulate matter (see section 4.1.5 for more information on base-level industrial emissions requirements). Specific agreements between Environment and Climate Change Canada and these 5 companies are in effect from January 5, 2018 to December 31, 2025.
These companies have agreed to achieve and maintain the emissions requirements for sulphur dioxide and particulate matter. They will make continual improvements (where reasonably feasible) with respect to further reducing emissions of sulfur dioxide and particulate matter. In addition, these companies committed to reducing emissions of metals and fugitive particulate matter (that is, particulate matter which escapes into the atmosphere rather than being released in a controlled way). The companies also agreed to continue to implement recommendations from the Environmental Code of Practice for Base Metals Smelters and Refineries. Achieving the facility-specific particulate matter targets is expected to reduce overall particulate matter containing metals (including cadmium).
Additionally, facilities agreed to:
- participate in a working group with representatives from federal and provincial governments, other companies in the base metals sector, and the Mining Association of Canada, with a particular focus on releases of key metals, fine particulate matter and fugitive particulate matter
- participate in bilateral discussions with Environment and Climate Change Canada to discuss reports and results and to identify possible methods to further reduce emissions
- report on progress towards implementing applicable recommendations in the Code of Practice
Working group activities such as regular meetings and bilateral discussions take place each year and will continue. Annual reports received by the facilities are reviewed by Environment and Climate Change Canada and verified to ensure any corrective actions are being addressed.
Progress to date: Annual reports for the 2021 calendar year were received from all of the 8 participating facilities and these facilities are meeting their BLIERs targets. In addition, each signatory has participated in working group meetings and bilateral discussions and continue to report on progress towards implementing applicable recommendations in the Code of Practice. In 2021, reports submitted indicate that, on average, all facilities fully implemented 95% of applicable recommendations including 3 facilities that implemented 100% of their applicable recommendations.
Findings and recommendations
The 1994 Assessment indicated that the base metals smelting and refining sector was a large source of cadmium releases to the environment. These conclusions are supported by the information reported by NPRI and APEI. Since 1994, there have been a number of efforts to reduce environmental releases of cadmium to the environment from the base metals smelting and refining sector, both from a multi-sectoral approach and from an industry specific approach. Risk management actions relevant to cadmium for this sector have primarily been multi-pollutant emission control measures and have been consistent with the recommendations from the Strategic Options Report (see Annex 1 for status of implementation of recommendations). This approach makes sense as most cadmium released to the environment from this sector comes from emissions of particulate matter. Releases to land and water are relatively minor in comparison. As noted in section 2, cadmium emissions have declined from this sector significantly since 1994. This is likely the result of both federal and provincial risk management efforts as well as other factors like closure of facilities, changes to production levels and feedstocks, and improvements to industrial operations. However, this sector is still by far the largest contributor of cadmium releases to air and more work needs to be done to continue reducing cadmium releases.
Given that the 2018 Performance Agreements are still being implemented no recommendations are made for the sector at this time. The Performance Agreements will be assessed on their progress in reducing emissions, including metals such as cadmium, upon their completion in 2025.
4.1.1.2 Iron, steel, and ilmenite sector
Iron and steel production are complex and energy intensive operations that have many steps to turn iron ore into iron concentrate in the form of pellets. These are reduced to produce pure iron and eventually become steel which is made up of a mixture of iron and carbon. Canada is an important producer of iron ore concentrate, iron and steel products.
Iron ore concentrate production in Canada is made at two facilities, which both use a pelletizing process. Currently no sintering plants are operating in Canada.
Iron production in Canada is performed in traditional integrated facilities, at one direct reduced iron facility and at one ilmenite facility. Steel is produced at all these previously listed facilities and also at non-integrated mills which use scrap metal with some purchased iron into electric arc furnace to produce steel. Traditional integrated mills use a blast furnace fed with coke and iron ore pellets to produce iron and the iron is fed to the basic oxygen furnace. The direct reduced iron mill is coupled with an electric arc furnace with scrap and direct reduced iron to produce steel. Ilmenite ore is processed in a similar way to make titanium slag and iron and steel as a by-product. Integrated mills direct reduced iron facility, ilmenite facility and non-integrated facilities produce a wide diversity of products including bars, rods, rails, structural shapes, plates, sheets, pipes and tubes and wire rod.
Cadmium and other metals can be present as trace elements in the raw materials such as coal (used to produce the coke in the coke oven batteries), iron ores, and recycled scrap metals. Metals can be released to both air and water during sintering, iron ore pelletizing, coke making, operation of blast furnaces and basic oxygen furnaces, operation of electric arc furnaces, and finishing processes such as coating or galvanizing. The iron and steel sector is consistently in the top 8 sectors for cadmium emissions since 2002 and some of the facilities mentioned in the Notice are among the top 20 cadmium emitters (median of releases to air) since 2004, according to NPRI.
A Strategic Options Report Issue Table worked between 1995 and 1996 to assess potential options for the management of toxic substances released by the sector. The primary release pathways considered in the report were air and wastewater effluent. A range of pollution control measures were considered in the report from voluntary programs to federal regulation. Overall, it was recommended that there should be enhanced voluntary programs, non-regulatory environmental performance standards, backed up by potential regulatory requirements.
Relevant to cadmium, the Strategic Options Report made the following recommendations:
Recommendation #4 – metal emissions to air: reduce emissions of toxic metals through the adoption of a CCME Code of Practice by December 1998 that includes emission guidelines; standardized emissions measuring, monitoring and reporting practices; and best management practices for achieving continuous improvement in design, operation and maintenance of air pollution control systems. Additionally, source-specific targets and schedules should be developed for two facilities.
Recommendation #5 – metal effluents to water: reduce wastewater releases of toxic metals from non-integrated mills through the development and adoption of a CCME Code of Practice by December 1998 that includes effluent release guidelines; standardized effluent measuring, monitoring and reporting practices; and best management practices for achieving continuous improvement in the design, operation and maintenance of water pollution control systems. No recommendation was made for wastewater effluents from integrated mills since it was expected that facilities would already be implementing best available technologies and practices to control releases of metals by 1998.
Recommendation #7 – emissions from sintering plants: develop an enhanced voluntary program to reduce emissions of dioxins and furans, arsenic, cadmium, lead and mercury at the Algoma Sintering Plant by December, 1997. This program would include emission reductions targets and schedules for these substances and be consistent with the Toxic Substances Management Policy. It was also recommended that an emission management program be conducted at the Stelco Hilton Works Sintering Plant and that the results be reported to the Province of Ontario and Environment Canada.
Recommendation #10 – pollution prevention plans: steel manufacturing sector facilities should prepare and implement pollution prevention plans.
Recommendation #12 – ministerial review: the Government of Canada should develop a report on the implementation and effectiveness of the recommendations and relevant provincial toxics management programs that is submitted to the Ministers of Environment and Health by March 1999, so that regulatory action or further non-regulatory action can be taken, as appropriate.
Environmental Codes of Practice for Integrated and Non-integrated Steel Mills
Published in 2000, these Codes of Practice were developed to address the recommendation in the Strategic Options Report for the sector. The Codes identify minimum environmental performance standards for steel mills and provide a set of environmental performance goals for existing mills to achieve through continual improvement over time. They recommend measures and best practices to control and minimize the releases of certain toxic substances from steel mills as well as performance standards for air emissions and effluent quality. At the time of publication, there were 5 integrated and 12 non-integrated mills operating in Canada. One integrated mill was closed following publication of the Code of Practice.
The Code of Practice for integrated steel mills sets out guidelines and targets for emissions of particulate matter from different parts of the steel manufacturing process and monthly average effluent guidelines for cadmium of 0.1 mg/L.
The Code of Practice for non-integrated steel mills identifies good environmental protection practices for various production processes and operations of a non-integrated steel plant, with air emission and water effluent considerations as the highest priorities. It also includes multimedia and other considerations consistent with a comprehensive and life cycle approach to environmental protection. In terms of metal releases to air, the Code recognized that effective control of particulate emissions would result in reductions of metal emissions from the sector.
Progress to date: No formal instrument-based performance measurement was conducted; however, Environment Canada contracted a third party review of the iron and steel sector in 2003. The report indicated that the degree of implementation of the Code of Practice recommendations varied substantially across the sector (Stratos Inc., 2003). Integrated mills reported a greater rate of implementation of relevant recommendations than non-integrated mills (Table 10).
| Recommendations implemented | Number of integrated mills (n=4) |
Number of non-integrated mills (n=12) |
|---|---|---|
| > 90% | 3 | 0 |
| 75% to 90% | 1 | 3 |
| 50% to 74% | 0 | 6 |
| < 50% | 0 | 2 |
| Insufficient information provided | 0 | 1 |
Implementation of control measures for waste and emissions from coke making were generally well implemented, but implementation of other atmospheric emissions management measures was mixed. Only 8 of 15 mills reported having ambient air monitoring programs with two monitoring metals. Implementation of measures related to water and wastewater management also was mixed; however, all mills reported that they met effluent guidelines for cadmium. All facilities reported having a formal environmental policy, although few facilities had reported having pollution prevention plan in place, applying life cycle management techniques, developing decommissioning plans, or establishing community advisory panels. Only one facility reported monitoring its implementation of the Code of Practice.
Code of Practice to reduce fugitive emissions of total particulate matter and volatile organic compounds from the iron, steel and ilmenite sector
This Code of Practice recommends best practices to control and limit fugitive (unintentional and uncontrolled) air emissions of total particulate matter and volatile organic compounds from facilities in the iron, steel and ilmenite sectors, with the objective of facilitating and encouraging continual improvement in environmental performance of fugitive total particulate matter and volatile organic compound emissions from steel mills. As noted, reducing emissions of particulate matter from this sector would also result in reductions in cadmium emissions. The Code of Practice was developed as part of the base-level industrial emissions requirements (BLIERs) process (see section 4.1.5) and the final Code was published in May 2016.
The Code identifies sources of fugitive emissions and makes recommendations to reduce them. It is complementary to the existing published steel Codes of Practice and forms an integral component of the Pollution Prevention Planning Notice for the sector discussed in the next section. Although there are no reporting requirements under this Code of Practice, as part of the P2 Notice, facilities will report on the implementation of the recommendations. Performance measurement for this risk management measure is undertaken jointly with the P2 Notice.
Iron, steel and ilmenite sector: Pollution Prevention Planning Notice
The Notice is in effect from May 6, 2017, to June 1, 2028 and requires iron, steel and ilmenite facilities to prepare and implement a pollution prevention plan in respect of sulphur dioxide (SO2), nitrogen oxide (NOX), and volatile organic compounds (VOC). The Notice includes targets for SO2 and NOx and facilities have to consider implementing best practices to reduce fugitive VOC emissions where appropriate and practicable in developing their plans. Facilities need to report annually on progress made to develop and implement their P2 plans. There is not a formal reporting requirement in the P2 Notice to report emissions of fugitive total particulate matter because it is not listed as a toxic substance on Schedule 1 of the Canadian Environmental Protection Act. In order for a substance to be listed in a P2 Notice it must be listed on Schedule 1. Nonetheless, the P2 Notice is expected to reduce fugitive total particulate matter emissions because they are covered by the Code of Practice, which is a factor that facilities must consider in developing a P2 plan. In summary, the P2 Notice will inform on NOx and SO2 emissions and in addition to this, the implementation of the recommendations found in the Code of Practice with regards to fugitive VOCs will be monitored via the P2 Notice. The implementation status of fugitive total particulate matter recommendations of the Code will be collected via a voluntary survey. Many of the recommendations in the Code target both VOCs and total particulate matter.
In implementing measures to control air emissions and fugitive air emissions, there may be co-benefits realized for total particulate matter and therefore for cadmium emissions. Overall, facilities are expected to meet the Code of Practice’s objectives for fugitive particulate matter through the implementation of their P2 plans.
Progress to date: 1 facility out of 14 facilities subject to the Notice is officially closed. All 13 facilities subject to the notice submitted their declaration of preparation and their first and second interim progress reports for the year of 2017, 2018 and 2019, respectively.
The BLIERs targets for the iron and steel sector are to be met in various timelines depending on the substance and the type of facility. These targets are assessed annually and the results are published on Environment and Climate Change Canada’s website.
Findings and recommendations
The Government of Canada has put in place measures to reduce releases of cadmium from the iron, steel and ilmenite sector through implementing measures to control releases of total particulate matter. This approach is logical given that overall, toxic metals are primarily released to the environment from this sector as part of particulate matter. It is difficult to assess the success of these measures since most were voluntary and did not require reporting. NPRI and APEI data show a decline in releases beginning in the mid 2000s, suggesting it is not related to the implementation of the Codes of Practice. The decline in releases continues steadily since that time without significant change following the introduction of the 2016 Code of Practice or 2017 P2 Notice.
Most of the recommendations from the Strategic Options Process have been implemented through the development of codes of practice and P2 plans (see Annex 1 for status of implementation of recommendations). While the Code of Practice for integrated mills set a guideline for cadmium in wastewater effluent, it is unclear whether facilities are meeting this guideline since there are no reporting mechanisms. However, evidence indicates that facilities are generally implementing the Codes of Practice. Iron, steel and ilmenite facilities meeting NPRI reporting thresholds are required to report their releases to municipal sewer systems as transfers to wastewater treatment plants and also need to comply with municipal bylaws which generally have minimum water quality criteria for industrial effluent. It is recommended that further evaluation of the effectiveness of the Code of Practice and BLIERS targets to minimize releases of cadmium and other metals be considered following an analysis of the results of the voluntary survey.
4.1.1.3 Cement
Cement is made by heating up a mixture of crushed limestone, clay, and sand and then grinding the mixture into a fine powder to which other ingredients may be added, depending on the purpose of the cement. This manufacturing process uses a coal/petcoke or gas fired kiln and requires very high temperatures. Sometimes, other material can be used as a fuel source to heat the kiln. This could include using biomass waste materials as fuel such as biosolids, construction waste, non-recycle plastic, scrap tires, spent solvents, used oil, wood chips and wood bark. Stationary fuel combustion and solid waste disposal were identified as a potential source of cadmium pollution in the 1994 Assessment.
Metals, including cadmium, are released when cement is made, primarily due to the burning of fossil fuels or waste derived fuels to heat the kiln. Metals like cadmium are primarily emitted as a component of particulate matter. Fugitive emissions from equipment leaks and on-site materials handling, storage or transfer operations can also release cadmium to air. Metals releases to the atmosphere may increase when wastes or hazardous wastes are burned as fuel, depending on the concentration of metals in the waste material.
The fate of metals in cement manufacturing has been widely studied. For almost all trace metals, more than 99% are captured in the finished product or in the dust collected by emission control technology (Inland Cement Ltd., 2000; St. Lawrence Cement Inc, 2001; U.S. Environmental Protection Agency, 1999). Dust captured is either recycled (usually by adding it back into the cement production process) or is sent to a landfill for final disposal. A study conducted by the United States Environmental Protection Agency found that the average concentration of cadmium and some other metals was higher in dust made from kilns that burned hazardous waste than those that did not burn hazardous waste (U.S. Environmental Protection Agency, 1998). The average concentration of cadmium in dust found by that study was 9.7 mg/kg (minimum 0.005 mg/kg and maximum 44.9 mg/kg).
All cement plants in Canada are regulated through operating permits that in some cases integrate multi-media discharges within a single operating permit (Environment Canada, 2004). The Provinces of Alberta, Ontario and Quebec have regulations of general application or specific cement sector-based regulations in addition to operating permits.
National guidelines for the use of hazardous and non-hazardous wastes as supplementary fuels in cement kilns
The development of national guidelines on the use of hazardous and non-hazardous wastes as supplementary fuels in cement kilns was commissioned by the Canadian Council of Ministers of the Environment (CCME) and was undertaken under the direction of the Wastes as Fuels Sub-Committee of the Hazardous Waste Task Group. This Sub- Committee was composed of representatives from the federal and provincial governments, and the cement industry. The group decided to develop these guidelines because existing CCME guidelines for Operating and Emission Guidelines for Municipal Solid Waste Incinerators (1989) and National Guidelines for Hazardous Waste Incineration Facilities (1992) were not considered to appropriately address incineration of waste in the cement production process. The guidelines were published in 1996 with the intent to supplement applicable national and provincial regulations and guidelines. Recommendations were provided on: criteria for the selection of wastes; handling and storage of wastes; emission limits; testing and monitoring requirements; solid residue management; and reporting requirements.
The guidelines specify metal emission guidelines for the sum of Class III Metals (mercury, cadmium and thallium) of 0.15 mg/m3. For the management of cement kiln dust collected by emission control measures, the guidance recommends that the leachate from the dust be tested for metals concentrations.
Progress to date: These guidelines were voluntary and their performance has not been measured.
A joint industry-government study was conducted at a Canadian cement plant to find out the impacts of burning wood waste as fuel on emissions (Lapointe & Goyer, 1997). The amount of heavy metals was tracked in the kiln feed, clinker, collected cement kiln dust, and emissions. Emissions of key parameters were characterized when the kiln burned wood treated with various preservatives and untreated wood. The study found that all categories of metals exiting the stack were below the maximum allowable levels set in the 1996 national guidelines.
Relevant information was also reported in the Foundation report on the cement manufacturing sector (Environment Canada, 2004). This report was developed to compile information on the sector for consideration in the development of environmental release standards. The report noted that in 2000, wastes contributed approximately 5.5 percent of the fuel energy consumed by the Canadian cement sector. The fuel energy (Joules per tonne of clinker) contributed by wastes, however, declined 23 percent from 1995 to 2000, and the percentage of plants burning wastes also decreased to 47 percent from 56 percent in 1993.
In 2001, six Canadian cement plants reported burning waste-derived fuels, 3 of which, burn used whole tires or tire-derived fuel. One plant burns petroleum coke and wastes as primary fuels. Waste-derived fuels at one plant comprised 17 percent of the fuel consumption in 2001.
More recent information collected showed that in 2009, eight Canadian cement plants reported burning waste-derived fuels, 5 of which, burn used whole tires or tire-derived fuel. Waste-derived fuels accounted for 9.1 percent of fuel consumption within the Canadian cement sector in 2009, in comparison to 3.0 percent in 1990.
Findings and recommendations
In reviewing NPRI and APEI data, releases of cadmium from the cement sector are low in comparison with other sectors. The most likely release pathway for cadmium from the cement sector is through emissions of particulate matter. Existing provincial and national requirements and guidelines for facilities to implement emissions control measures for particulate matter appear to be effective in preventing cadmium releases to air, regardless of the fuel type used. Cadmium emissions have declined from this sector over time, although this is likely related to other efforts to reduce emissions of nitrous oxides and greenhouse gases from the sector and are not related to the national guidelines published in 1996. No further action is recommended to control cadmium releases from the sector at this time.
4.1.1.4 Mining
There are approximately 200 active mines in Canada including 143 metal mines and 5 diamond mines. Mining operations involve crushing large quantities of rock and using chemical processes to get valuable minerals like iron, copper, gold and other precious metals or stones. This process creates mine waste, including a liquid sludge, or effluent, that may contain substances that are harmful to fish. The effluent is treated to reduce the concentrations of these substances before being released into the environment. Cadmium may be released in the effluent from mining operations because it naturally occurs in the same rock as other minerals mined for industrial purposes like lead or zinc. Mining operations can also release cadmium to air in the dust created during the crushing and processing of ore.
Metal and diamond mining effluent regulations
To protect water and fish habitat from pollution from mining operations, regulations under the Fisheries Act were put in place in 1977. The Metal Mining Liquid Effluent Regulations and Guidelines were intended to limit harmful substances from base metal, uranium and iron ore mines entering the environment.
In 1993, the Assessment of the Aquatic Effects of Mining in Canada (AQUAMIN) was initiated in response to the federal government’s commitment to update and strengthen the Metal Mining Liquid Effluent Regulations (MMLER). The objective of AQUAMIN was to examine the effectiveness of the MMLER, by conducting an assessment of the environmental effects of mining, and to formulate, on the basis of this assessment, recommendations in 3 key areas: (1) amendments to the MMLER, (2) the design of a national environmental effects monitoring (EEM) program for metal mining, and (3) information gaps and research needs. AQUAMIN was directed by a Steering Group that included representatives of all stakeholder groups. The assessment of the effects of metal mining on aquatic ecosystems in Canada included a review of over 700 reports related to more than 95 Canadian mine sites and detailed case studies for 18 sites.
The recommendations of the report were considered and in 2002, the Metal Mining Effluent Regulations were put in place to cover all metal mines and require environmental effects monitoring. Environmental effects monitoring was intended to help inform possible future changes to the regulations based on the need for enhanced protection of the aquatic environment from risks posed by already regulated substances or new substances that would need to be regulated. These regulations also authorized the use of certain bodies of water for deposit of harmful substances.
In 2018, the regulations were amended to cover effluents of diamond mines, lower the limits of harmful substances in mining effluents, strengthen acute lethality testing requirements for mine effluent and streamline environmental effects monitoring requirements. Reflecting these changes, the regulations were renamed to the Metal and Diamond Mining Effluent Regulations (MDMER). The regulations were amended again in 2021 to require acute lethality testing for invertebrate species for deposits of saline (saltwater) effluent into marine environments.
Today, the Metal and Diamond Mining Effluent Regulations help protect Canada’s lakes and rivers by setting strict limits on the quality of effluent that can be discharged by metal and diamond mines. The Regulations authorize the deposit of effluent into water frequented by fish and places referred to in subsection 36(3) of the Fisheries Act. Effluent must meet concentration-based limits for arsenic, copper, cyanide, lead, nickel, zinc, suspended solids, radium 226 and un-ionized ammonia. Effluent must also have a pH that is between a minimum and maximum level, and must not be acutely lethal. Cadmium was considered for addition to the list of substances with concentration-based limits in the early 2010s, but was not added because effluent characterization data at that time suggested that cadmium occurred only in effluents from a small number of metal mines and at low concentrations. At that time, it was determined that there would be little or no environmental benefit to adding cadmium to the list.
Progress to date: The number of mines subject to the regulations has grown and more than doubled since 2002. In 2002, there were 73 and in 2019 there were 148 (143 of which are metal mines, and 5 of which are diamond mines). The performance of the regulations is reported annually through the Canadian Environmental and Sustainability Indicators program. While cadmium is not one of the metals reported, the results of fish toxicity testing are reported. The report published in 2021 found that between 2003 and 2019, there was between 91.7 and 99.6% compliance with the regulatory limits for fish toxicity (Environment and Climate Change Canada, 2021a). However, compliance rates have shown a declining trend since 2015, though still remain above 91%. An increase in the number of exceedances for several parameters, including nickel, zinc, TSS, and pH low, was observed in 2019. The majority of these exceedances occurred at a small number of mines. For example, a mine in Quebec was responsible for majority of the exceedances for nickel, zinc, pH≤6, and pH≥9.5. Observations on trends for years prior to 2019 are available in annual publications of the Status Report on the Performance of Metal Mines Subject to the Regulations. Compliance rates for effluent limits of other metals with regulatory limits were consistently above 98%. As noted in section 2.4.1, cadmium is detected in reference areas, effluent, and exposure areas at most mines. Cadmium levels and exceedances of freshwater quality guidelines have been declining over time; however, 38% of mines reported cadmium levels in exposure areas above long-term guideline values intended to protect aquatic environments and 14% reported levels above short-term benchmarks.
In 2019, the Commissioner for the Environment and Sustainable Development published the results of an audit that focused on whether the federal government protected fish and their habitat from mining effluent at active mine sites in accordance with the Fisheries Act and the Metal Mining Effluent Regulations between 2009 and 2018. The audit overall found that there were steps taken to protect fish and their habitat from metal mining effluent, including enforcement actions to address non-compliance (Office of the Auditor General of Canada, 2019). Environment and Climate Change Canada was found to have met its requirements to monitor effluent and ensured that mining companies submitted data on the environmental effects of metal mining on fish and their habitat and on the cause of these effects. Data were verified by the Department to be complete and accurate and the department used this information to help change limits for harmful substances. The audit also identified that further work on prioritizing inspections based on risk was needed, as well as inspections of non-metal mines.
Environmental Code of Practice for Metal Mines
The Code of Practice was designed to support the regulations controlling mining effluent as discussed above. It was published in 2009 and used the final AQUAMIN report as a starting point for its development as well as the Environmental Code of Practice for Mines that was published with the MMLER in 1977. The 2009 Environmental Code of Practice for Metal Mines applies to the complete life cycle of mining, from exploration to mine closure, and recommends environmental management practices to reduce environmental concerns. The practices that this code recommends include the development and implementation of environmental management tools, the management of wastewater and mining waste, and the prevention and control of environmental releases to air, water, and land. The objective of the Code is to identify and promote recommended best practices in order to facilitate and encourage continual improvement in the environmental performance of mining facilities.
Progress to date: The implementation of the recommendations in the Code of Practice is voluntary and is not tracked by Environment and Climate Change Canada.
Findings and recommendations
Federal risk management actions for the mining sector have been focused on controlling releases of harmful substances to water from mining effluent. These measures have generally been effective in reducing acute toxicity from mining effluent and most mines are compliant with the regulations. The concentration of cadmium in mining effluent has decreased since 2002, likely as a co-benefit of effluent discharge limits imposed on other substances. However, cadmium levels in exposure areas were above long-term water quality guidelines values at one third of mines. The implications of these exceedances in terms of effects to fish and fish habitat should be examined further by looking at the biological monitoring study results conducted by mines as part of Environmental Effects Monitoring. Cadmium was also detected in almost all mining effluents. The results of environmental effects monitoring are used as a science-based performance measurement tool to evaluate the adequacy of the MDMER in protecting fish, fish habitats and the use of fisheries resources. A complete assessment of the results will support the Department in determining if further consideration of risk management measures for cadmium in mining effluent is warranted. It is recommended that Environment and Climate Change Canada review all available data and consider further risk management to control cadmium releases from mining effluent, as appropriate. It should be noted that there is some uncertainty around the releases of cadmium reported to NPRI for the metal and mineral production sector. This is because facilities may report under different primary NAICS codes depending on the activities conducted at the facility in a given year. Integrated facilities where mining and processing of ores and concentrates happen at the same site may report under different industrial sector codes depending on the year and which are the main activities occurring at the site. It is recommended that Environment and Climate Change Canada works to resolve this issue in consultation with industry and reporting facilities, as appropriate, to prevent misinterpretation of sectoral releases.
4.1.2 Pulp and paper
The pulp and paper sector produces a wide range of products by using wood chips and recycled paper products as their fibre source to make pulp. The pulp may be used to make paper products on-site or shipped offsite to other manufacturing facilities.
Depending on the type of pulp and paper manufacturing process, mechanical and/or chemical means are used to transform the incoming fibre in the production of pulp and paper. The use of water and heat is commonplace. The majority of pulp and paper mills produce heat on-site through the combustion of spent cooking liquors, fuel oil, natural gas, wood wastes and byproducts of the pulping process such as tall oil soap and methanol. In some cases biogas and biological solids are produced and combusted to recover heat. Some pulp and paper mills generate combined heat and power from spent cooking liquor and wood wastes to generate heat and electricity for on-site use and for sale on the electric utility grid.
Wastewater generated from the manufacturing process is treated on or off site by primary, secondary and sometimes tertiary treatment before the effluent is discharged.
The pulp and paper sector was not identified in the 1994 Assessment. However, in reviewing the release inventories noted in section 2, the pulp and paper sector appears to be a large contributor to cadmium releases to land and water, with smaller releases of cadmium to air. Further, some pulp and paper mills deposit effluent through a dedicated off-site wastewater treatment facility (this would be reported in the inventories as a release to water). However, those mills generally use pulp as their feedstock, and therefore the cadmium concentration from those mills are generally low.
Pulp and Paper Effluent Regulations
The Pulp and Paper Effluent Regulations were developed under the Fisheries Act in 1971 to manage threats to fish, fish habitat, and to human health from fish consumption. They limit the deposit of harmful substances into fish-bearing waters by pulp and paper mills. The Regulations were designed to encourage mills to modify their processes in order to improve water quality and protect fish, fish habitat and the use of fisheries resources.
The 1971 Regulations differentiated between new, expanded, altered and existing mills. New, expanded and/or altered mills were subject to the prescribed limits. For mills already in operation, the limits served as non-enforceable guidelines. In 1992, the 1971 regulations were updated to expand coverage to all mills, and to drive further effluent quality improvements based on standards achievable using secondary wastewater treatment. After a transition period, all mills became subject to the regulations in 1996. The regulatory standards have remained unchanged since.
The Regulations set limits for the maximum quantities of biochemical oxygen demand matter (which consumes oxygen dissolved in water) and suspended solids that can be deposited from pulp and paper mills under prescribed conditions. The Regulations do not allow the deposit of any effluent that is acutely lethal to fish. The Regulations also contain requirements for mills to conduct environmental effects monitoring to identify effects of the effluent on fish, fish habitat and the use of fisheries resources. Facilities are required to submit monthly effluent reports that include the biochemical oxygen demand of matter in effluent, the quantity of suspended solids in effluent, effluent volume and summary results of rainbow trout acute lethality tests and Daphnia magna monitoring tests.
Progress to date: Environment and Climate Change Canada publishes annual summary reports on the compliance and effluent discharge amounts of pulp and paper mills subject to the Regulations as well as environmental effects monitoring. Additionally, the performance of the regulations is measured through the Canadian Environmental and Sustainability Indicators (CESI) program.
In 2019, 77 pulp and paper mills operating in Canada were subject to the Regulations. CESI reported that between 1985 and 2019, the quality of pulp and paper effluent released directly to the environment has improved (Environment and Climate Change Canada, 2022e). Tests for toxicity met regulatory standards 25% of the time in 1985 and 97.8% of the time in 2019 while tests for biochemical oxygen demand and total suspended solids met regulatory standards 68% and 60% of the time, respectively, in 1985. Both tests met the standards 99.9% of the time in 2019.
However, the annual summary report prepared by ECCC also notes that mill final effluents showed sublethal toxicity impacts of growth and reproduction inhibition in laboratory test species in more than half of all tests conducted (Environment and Climate Change Canada, 2021b). The data from biological monitoring studies show that mill final effluents from 77% of the mills in operation in 2019 have impacts on receiving environments.
ECCC began consultations on possible ways to improve the regulations in 2017 and initiated consultations on proposed amendments to the regulations in 2019. The proposed amendments include new requirements for effluent characterization for metals and other substances and quarterly water quality monitoring studies, including metal monitoring (Environment and Climate Change Canada, 2019c).
Findings and recommendations
While the pulp and paper effluent regulations do not directly apply to cadmium, the pulp and paper industry is the second largest source of releases to water. Co-benefits may be realized from the implementation of measures that control overall toxicity of effluent from pulp and paper facilities, but there are not enough data to fully assess whether the existing risk management actions are beneficial for controlling cadmium releases.
The approach to manage the risks of effluent from the pulp and paper sector has been effective at reducing acute toxicity of effluent; but has not been fully successful in mitigating the sublethal toxicity of effluent. While the cause of sublethal toxicity is not known at this time, it is recommended that Environment and Climate Change Canada implement the proposed measures to require effluent characterization and water quality monitoring studies from pulp and paper facilities. This will be important for informing risk management for the sector and contribute to future performance measurement evaluations for a number of substances, including cadmium.
4.1.3 Stationary fuel combustion
This sector is broken up into two main categories, power generation and heating. Both were identified as sources of concern in the 1994 Assessment.
4.1.3.1 Electric power generation sector
Electricity in Canada is generated from a diversified mix of sources. In the long term, electricity generation tends to rise slightly every year in order to meet gradually increasing demand. In 2021, electricity generation amounted to over 627 million megawatt hours. By comparison, electricity generation totaled 467 million megawatt hours in 1990, an increase of 34% (Natural Resources Canada, 2020; Statistics Canada, 2022).
The most important source in Canada is moving water, which generates 60% of electricity supply (Natural Resources Canada, 2020; Statistics Canada, 2022). Fossil fuels are the second most important source of electricity in Canada and together make up about 20% of the electricity supply. About 9.5% of electricity supply comes from coal, 8.5% from natural gas and 1.3% from petroleum. Nuclear power and non-hydro renewable sources like wind, solar and biomass make up the remaining electricity supply.
Fossil fuel combustion releases particulate matter containing cadmium and other metals and pollutants. Coal combustion in particular contributes a large proportion of atmospheric emissions of cadmium, other metals, and particulate matter. Nuclear power generation and renewable electricity generation are not significant sources of cadmium releases.
Fossil fuel generation is particularly important in Alberta and Saskatchewan, where several power stations have been built adjacent to large coal deposits. Fossil fuel generation is also important in the Atlantic Provinces, Northwest Territories and Nunavut. Ontario used to rely heavily on coal-fired generation; however, in April 2014, the last coal-fired generating capacity was shut down.
In 1995, a Strategic Options Process Issue Table was formed to develop, where warranted, goals, targets, and effective and efficient options for managing releases of toxic substances from the electricity generation sector. The Issue Table agreed that management options for particulate matter would also effectively reduce emissions of cadmium and other metals since these toxic substances are primarily emitted as particulate matter. Only atmospheric emissions were considered by the Issue Table since provincial permits already control releases to solid and liquid waste.
The Issue Table explored 15 risk management options and presented four broad categories for consideration: regulatory performance standards, emission caps, bubbles and trading, and agreements. The options are not mutually exclusive. The Issue Table was not able to agree on specific risk management recommendations due to diverging views on emission reduction targets and technical and economic feasibility of proposed emission reduction measures. However, there was general agreement between industry, stakeholders, and Environment Canada participants in the Issue Table on the application of an emission limit of 0.03 pounds of particulate matter per million BTUs of heat input (12.9 nanograms per Joule) for new facilities.
New Source Emission Guidelines for Thermal Electricity Generation
The New Source Emission Guidelines for Thermal Electricity Generation are a revised version of the former Thermal Power Generation Emissions - National Guidelines for New Stationary Sources which were issued May 15, 1993. The revised Guidelines were published in Part I of the Canada Gazette in January, 2003 and set emission limit targets for new fossil fuel-fired electricity generating units.
Under the guidelines, the hourly mean rate of discharge of particulate matter emitted into ambient air over a 720 hour period should not exceed 0.0095 kg/MWh net energy output. The guidelines also advise emissions testing and monitoring and recommend that the feasibility of emission reduction measures be assessed for existing units.
Progress to date: The implementation of these guidelines is not tracked by Environment and Climate Change Canada. No significant changes in cadmium releases from the electricity generation sector were recorded in release inventories following the introduction of the guidelines. Environment and Climate Change Canada is planning to review and update the guidelines as required.
Reduction of Carbon Dioxide Emissions from Coal-fired Generation of Electricity Regulations
These regulations were published in September 2012 and came into force on July 1, 2015. They set a performance standard of 420 tonnes of carbon dioxide per gigawatt hour of electricity produced. The standard applies to new coal-fired electricity plants commissioned on or after July 1, 2015, and to existing units that have reached the end of their useful life as defined by the Regulations (generally 45 to 50 years). Because cadmium is released during the combustion of coal, cadmium will also be reduced when facilities close.
In December 2018, the Government of Canada published amendments to these regulations to speed up the phase-out of traditional coal-fired electricity by 2030. By then, all facilities are expected to be shut down, transitioned to firing or co-firing with lower emitting fuels, or converted to a carbon capture and storage system in order to meet the standard. In most cases, the more likely option is the closure of facilities, which would mitigate emissions of cadmium. The majority of emission reductions will occur in the period of 2020 to 2030, with only relatively small reductions having occurred before then.
Progress to date: More data are needed to evaluate the success of these regulations. Emissions from this sector will continue to be monitored through reporting required under the National Pollutant Release Inventory, and the Air Pollutants Emissions Inventory will be kept updated for coal-fired electric power generation until this activity is phased out in Canada. Analysis of release inventory data shows that cadmium releases from this sector have already declined substantially from 2012 (4.01 tonnes in 2012 to 2.51 tonnes in 2020).
4.1.3.2 Commercial, residential, and industrial heating
Emissions from this sector are primarily from burning oil, natural gas, firewood or other fuel sources used for heating in commercial establishments, health and educational institutions, government/public administration facilities, residences and construction sites.
No federal risk management measures have been put in place to address releases from these sources and releases have remained relatively unchanged over the 1994 to 2020 period.
Findings and recommendations
Electricity produced using coal combustion is a source of cadmium releases to air. Actions to reduce particulate matter emissions from coal-fired power plants will result in reductions in cadmium releases. Recalling the 1994 Assessment listing of stationary fuel combustion as a sector of concern, actions to reduce particulate matter are appropriate and link directly with the one area of agreement in the SOP report.
With the transition to renewable electricity sources and implementation of measures to reduce emissions of greenhouse gases and other pollutants, there has been a reduction of cadmium emitted from the sector as a co-benefit. The phase-out of coal-fired electricity by 2030 will minimize cadmium emissions from this sector to the lowest extent possible, and support progress in meeting the environmental and risk management objectives.
Actions for this sector have been largely focused on coal-fired power plants as they are large emitters of greenhouse gases. Unfortunately, the issue of commercial, institutional, and residential fuel combustion (that is operation of boilers or home firewood burning for heating) has largely remained unaddressed at the federal level. This sector is a large contributor to overall cadmium releases because it releases a lot of particulate matter through relatively uncontrolled burning.
It is recommended that Environment and Climate Change Canada conduct further investigation into cadmium releases from heating in conjunction with provincial and territorial governments as appropriate.
4.1.4 Waste and municipal biosolids
Cadmium may end up in waste as the result of use in industrial or manufacturing processes, disposal of batteries and electronic devices or other products. As noted in section 2.3.2 cadmium can also be present in municipal biosolids following the treatment of wastewater containing cadmium that enters the municipal sewer system from commercial, industrial and residential sources. Municipal biosolids may be applied to land, used as a fuel source, or sent to landfills for disposal depending on their quality.
Cadmium may accumulate in soil upon repeated applications of municipal biosolids to land. If cadmium is present in biosolids at elevated concentrations and they are improperly applied to land, this may lead to health and environmental concerns. Most jurisdictions have regulations that include limits for metal concentrations for municipal biosolids that are applied to land and limits for metal concentrations in the soil. These are usually similar to regulatory limits for metals in chemical fertilizers or other soil improvement products.
The 1994 Assessment indicated that solid waste disposal and sewage sludge application were sources of release of cadmium to the environment. At that time, there was little information on the nature of the waste and the amount of bioavailable cadmium that could potentially be released. As municipalities improve, install and upgrade wastewater treatment systems, the amount of municipal biosolids produced has increased over time and will likely continue to increase, as the minimum wastewater treatment standards are implemented following the coming into force of the Wastewater Systems Effluent Regulations in 2015.
4.1.4.1 Solid waste
In Canada, the responsibility for managing and reducing waste is shared among federal, provincial, territorial and municipal governments. Municipal governments manage the collection, recycling, composting, and disposal of household waste, while provincial and territorial authorities establish waste reduction policies and programs, approve and monitor waste management facilities and operations, including hazardous waste management facilities. Since cadmium may be present in hazardous waste and hazardous recyclable materials, their sound management contributes to risk management efforts.
For its part, the federal government complements the activities of the other levels of government by controlling international and interprovincial movements of hazardous waste and hazardous recyclable material, as well as identifying approaches and best practices that will reduce pollutant and greenhouse gas emissions from the management of waste.
Through a wide variety of programs, the federal government provides funding for pilot projects, community activities and major infrastructure in order to reduce waste sent to landfills and improve how Canada manages its resources. It also collaborates with provincial, territorial, municipal and Indigenous partners to develop and implement standards on matters of mutual concern such as the management of plastics and mercury from used fluorescent lights. Under the Canadian Council of Ministers of the Environment, environment ministers from the federal, provincial and territorial governments work together to improve waste reduction policies and practices across Canada.
National Guidelines for Hazardous Waste Landfills
This document was commissioned by the Canadian Council of the Ministers of the Environment in 2006 to establish guidelines for engineered hazardous wastes landfill facilities. The guidelines are intended to provide a reference on the basic design, operating and performance requirements for use by the various federal, provincial and territorial regulatory agencies, and designers, owners and operators of engineered hazardous waste landfill facilities in Canada. They do not set thresholds for concentrations of contaminants in waste or in leachate, rather they recommend performance criteria for regulating authorities to consider in municipal or provincial permitting and reporting programmes.
Progress to date: The implementation of these guidelines is not tracked. According to NPRI data, industrial facilities have reported more cadmium waste has been transferred offsite for treatment over time. At the same time, more cadmium waste has been landfilled by hazardous waste treatment facilities. Reported releases to the environment from hazardous waste treatment facilities have remained stable or decreased slightly over this period. However, since there is no reporting conducted under the voluntary guidelines, it is difficult to directly link release inventory data to guideline implementation.
Export and Import of Hazardous Wastes and Hazardous Recyclable Materials Regulations
The first Export and Import of Hazardous Wastes Regulations came into force on November 26, 1992, under the former CEPA. These regulations were replaced by the Export and Import of Hazardous Waste and Hazardous Recyclable Material Regulations in November 2005. The Regulations establish a permitting regime to control and track transboundary movements of hazardous waste and hazardous recyclable material between Canada and other countries.
The regulations were amended in 2012, mainly to address some minor clarity issues and inconsistencies that were identified in the regulatory text by the Standing Joint Committee for the Scrutiny of Regulations. The regulations were further amended in 2016 to strengthen Canada’s ability to meet two of its obligations under the Basel Convention: the obligation to seek the consent of importing and transit countries for any export from Canada of waste or recyclable material subject to the Basel Convention, including household waste; and the obligation to take or send back shipments that cannot be completed as planned.
Wastes containing cadmium are considered hazardous under these regulations. Additionally, the regulations require material under a certain size to be evaluated using a leachate characterization test. This testing evaluates the mobility of a number of contaminants that may be found in waste and recyclable material and their potential for release. If the leachate testing shows that cadmium is present in concentrations equal to or greater than 0.500 mg/L, then it is considered to be hazardous.
Progress to date: These regulations were repealed in 2021 with the introduction of the Cross-border Movement of Hazardous Waste and Hazardous Recyclable Material Regulations. No instrument-based performance measurement information is available for these regulations. However, shipments of hazardous waste and recyclable material containing cadmium are tracked under these regulations. Data on the number of shipments of hazardous waste and hazardous recyclable materials containing cadmium are available from 2010 to 2021; however, the data does not specify how much cadmium is contained in any particular shipment, as the shipments are typically made up of more than one hazardous component.
Reporting under these regulations has shown that most shipments are exports, and that the number of exports appear to have been slightly declining over time. Meanwhile, imports have been rising, particularly in the last two years. Imports are primarily destined for environmentally sound disposal operations, although recently, the number of shipments received for metal recycling or recovery operations have increased substantially. The majority of export shipments are destined for metal recycling and recovery operations with a smaller number of shipments sent for environmentally sound disposal. Most exports are sent to the United States, with fewer shipments to South Korea, Mexico, United Kingdom, and France. Imports have been received from Germany, Finland, Switzerland, Barbados, and Ireland.
Cross-border Movement of Hazardous Waste and Hazardous Recyclable Materials Regulations
The Cross-border Movement of Hazardous Waste and Hazardous Recyclable Material Regulations (XBR) came into force on October 31, 2021. These regulations aim to ensure that shipments of hazardous waste and hazardous recyclable material crossing Canada's international and interprovincial or territorial borders reach the intended destination to reduce releases of contaminants to the environment, in Canada and abroad. When the regulations entered into force, they consolidated and replaced 3 pre-existing regulations: the Export and Import of Hazardous Waste and Hazardous Recyclable Material Regulations, the PCB Waste Export Regulations, 1996, and the Interprovincial Movement of Hazardous Waste Regulations.
The XBR consolidates and streamlines requirements set out in the previous regulations and bring clarity to the Canadian definitions for hazardous waste and hazardous recyclable materials and into alignment with those used internationally. They also provide the flexibility to track movements more efficiently using an electronic movement tracking system, and improvement management and overall administration of the regulations. Additionally, the new regulations help Canada to meet its obligations under international agreementsFootnote 14 .
One important update relevant to the risk management of cadmium is that the new regulations require more comprehensive testing of waste being shipped across provincial or international borders. The new requirements close the gap on leachate toxicity testing so that all waste will need to undergo testing, regardless of the size of the material.
Progress to date: The regulations have recently entered into force. Information will continue to be collected in the coming years to inform future risk management of cadmium.
4.1.4.2 Municipal biosolids
The framework for biosolids management is similar to that of waste management. Generally, municipal biosolids are managed similarly across Canada in that they are required to meet certain process and quality criteria in order to be used for specific purposes. For example, some jurisdictions have developed quality criteria for a range of parameters, including metals and pathogens.
Provinces are responsible for setting policies for municipal biosolids. Each province has either developed its own policy or uses policies created in other jurisdictions. In the territories, federal or territorial agencies may have jurisdiction of facilities that generate municipal biosolids. The federal or territorial agency responsible for facilities, and relevant standards, requirements or guidelines may cover one or more aspects of the lifecycle of biosolids, including production, handling, storage, transport, beneficial use and disposal methods. The Canadian Council of Ministers of the Environment (CCME) has worked to support the harmonization of wastewater treatment and biosolids management across Canadian jurisdictions.
At the federal level, the Canadian Food Inspection Agency (CFIA) regulates municipal biosolids if they are manufactured, imported, or sold in Canada as a fertilizer, compost or soil supplement, under the Fertilizers Regulations. The CFIA undertakes pre-market assessments of fertilizer products. Pre-market assessment consists of a detailed, science-based evaluation of product safety information and labelling. These assessments focus on evaluation of product safety towards humans, plants, animals and the environment. To assess a product, the Agency requires supporting information, which varies in scope depending on the nature of the product. The basic supporting information includes the product label, the manufacturing method, and a complete list of ingredients and source materials. For certain products, additional information may be required. This includes a detailed description of the physical and chemical properties of each ingredient, results of analytical tests that show freedom from biological and chemical contaminants, and/or a toxicological data package derived from either laboratory studies or scientific publications.
Safety assessments are conducted by a team of highly qualified and trained evaluators. Safety evaluators examine all ingredients in a fertilizer or supplement, including the active components as well as the formulants, carriers, additives, potential contaminants and by-products that might be released into the environment as a result of the product's use and application to soil. The CFIA also examines unintended and potentially adverse effects of the application of the product. This includes bystander and worker exposure (for example retailer, farmer, home owner), safety of food crops grown on land that has been treated with the product, impacts on animals and plants other than the target crop species, and ecosystem effects, including impact on soil, biodiversity, leaching to waterways, etc.
The CFIA also monitors fertilizer and supplement products that are already available in the marketplace to verify their compliance with the prescribed standards. Across the country, the CFIA inspectors visit facilities, sample products and review labels. These efforts are focused on verifying that products satisfy the safety standards for biological and chemical contaminants (pathogens, heavy metals, pesticide residues, and dioxins and furans). Products found to be non-compliant are subject to regulatory action, which may include product detention (stop sale) and, in severe cases, prosecution.
Canada-wide approach for the management of wastewater biosolids
The CCME developed an approach for the management of wastewater biosolids in 2012 to complement the Canada-wide Strategy for the Management of Municipal Wastewater Effluent. The approach and the supporting Guidance Document for the Beneficial Use of Municipal Biosolids, Municipal Sludge and Treated Septage present best management practices, and encourage the beneficial use and sound management of municipal biosolids across Canada based on four principles:
Principle 1: municipal biosolids, municipal sludge and treated septage contain valuable nutrients and organic matter that can be recycled or recovered as energy.
Principle 2: adequate source reduction and treatment of municipal sludge and septage should effectively reduce pathogens, trace metals, vector attraction, odours and other substances of concern
Principle 3: beneficial use of municipal biosolids, municipal sludge and treated septage should minimize the net greenhouse gas emissions
Principle 4: beneficial uses and sound management practices of municipal sludge and treated septage must adhere to all applicable safety quality and management standards, requirements and guidelines
The approach and guidance document identifies and provides rationale for factors that jurisdictions may consider when designing a biosolids management program. The guidance also provides information for decision makers on when biosolids should be used for a beneficial use (for example energy production, compost and soil products, application to land as a soil conditioner for agriculture, forestry, or land reclamation) and how to mitigate potential environmental and human health concerns that may arise from the beneficial uses. Additionally, the guidance notes that in 2005 the CCME set Guidelines for Compost Quality that include cadmium limits. These would apply to any biosolids intended for use as compost and are consistent with the Standards Council of Canada/Bureau de normalisation du Quebec content limits.
Progress to date: The implementation of this guidance is not tracked. Reviewing NPRI data related to disposals shows that about half of the cadmium goes to landfills and about half goes to land application. The amount of cadmium disposed of by wastewater treatment operations has not changed substantially over time.
Fertilizers Act and Fertilizers Regulations
The Canadian Food Inspection Agency (CFIA) administers standards to ensure product safety and quality with respect to trace metal content, dioxin and furan contamination and pathogens under the Fertilizers Act and the Fertilizers Regulations. Legislation for fertilizers has been in place since around 1867. Most recently, the Fertilizers Act and Regulations were amended in 2020 as part of a modernization exercise to address deficiencies identified during a review of the regulations initiated in 2011. The regulations prohibit the manufacture, sale, and import of any fertilizer or supplement that contains any substance or mixture of substances in quantities that pose a risk to humans, animals, plants or the environment. Fertilizers developed solely for export are exempt from the regulations. The amendments additionally require manufacturers, importers, and exporters of fertilizers to register their products with the CFIA, unless they are on the List of Primary Fertilizer and Supplement Materials or are otherwise exempt. Municipal biosolids that have been subjected to physical, chemical or biological treatment, or a combination of these treatments, sufficient to mitigate against the presence and effect of generally detrimental or serious injurious substances that may be associated with untreated forms of this material are exempted from registration requirements. However, they still must meet the quality standards (including content limits for cadmium, see section 2.3.2) set by the CFIA in Trade Memorandum T-4-93 in order to be sold or imported in addition to guidelines for use set by provinces and municipalities. Additionally, under the Fertilizers Act, fertilizers must not contain any substance that would leave in the tissues of a plant a residue of a poisonous or harmful substance.
Progress to date: The 2013 evaluation of the fertilizers program reported an average of 77% compliance with the metals and lesser nutrient content of fertilizers inspected between 2009 and 2012. It is too early to report on progress made following the new amendment, however; the amendments are expected to better position the CFIA to address emerging risks such as contaminants (chemical and biological), poor sources of primary materials, waste diversion into fertilizer streams, toxic residues in feed and food. CFIA will also be better positioned to contribute to addressing concerns over nutrient pollution, watershed contamination and eutrophication (oversupply of nutrients), which are often attributed to fertilizer use and contribute to climate change. The latter can impact the overall environmental sustainability of agricultural practices which, in recent years, has become a significant preoccupation of regulatory jurisdictions both domestically and internationally. This approach will also increase consistency in approaches between regulatory bodies in achieving broad Government of Canada environmental protection and sustainability objectives.
Findings and recommendations
Management of waste and biosolids is a complex multi-jurisdictional issue. Most direct actions for this sector are undertaken primarily at the provincial/territorial and municipal levels due to the division of federal and provincial powers. Federal efforts have been focused on providing support to harmonize waste and municipal biosolid management programs across Canada to ensure a consistent level of risk management.
The CCME has encouraged governments to re-purpose municipal biosolids for beneficial uses, including application to land as fertilizer, compost or soil conditioners. One concern raised in the 2013 CFIA evaluation of the fertilizers program was that the safety of waste-derived fertilizers containing trace metals, such as cadmium, depends largely on the usage pattern. The primary concern is over-loading the soil with contaminants as the maximum threshold amounts for fertilizers on the market are based on calculations using cumulative amounts over a 45-year time frame based on the usage directions on the product. The CFIA does not have the mandate to test soils and the maximum allowable concentrations set out in the standards are based on the underlying assumption that soils have not been previously contaminated. Runoff from land is thought to be a potential source of cadmium contamination contributing to threats to the recovery of the Southern Resident Killer Whale and its prey the Chinook Salmon (see section 4.2 for details). Additionally, water sampling conducted near agricultural sites had higher levels of cadmium than other sites. It is recommended that Environment and Climate Change Canada consider monitoring soil and surface water runoff to better understand the risks of cadmium to the environment.
4.1.5 Multi-sectoral actions
Accelerated Reduction/Elimination of Toxics program
The Accelerated Reduction / Elimination of Toxics (ARET) program was led by the Government of Canada as a voluntary, non-regulatory initiative that targeted 117 toxic substances selected based on available toxicity, persistence and bioaccumulation data. One of the main goals of the program, was to use an open and inclusive process to encourage industry to take early action on toxic substances (Environment Canada, 2000). This was one of the first attempts to take action on a number of industrial sectors and the first relevant risk management action for cadmium.
In 1994, the ARET Stakeholder Committee issued a challenge to eight industry sectors to voluntarily reduce by 90% or eliminate their releases of persistent, bioaccumulative and toxic substances and reduce all other toxic substance releases by 50% by the year 2000. The ARET committee could not agree on whether cadmium and a few other substances should be included in the group of persistent, bioaccumulative and toxic substances (category A substances), since there was not enough evidence at the time to say that cadmium was bioaccumulative. Instead, they decided that the challenge for substances that were toxic but not necessarily persistent and bioaccumulative (category B substances), should be to take “best efforts” to reduce emissions. For all substances, industry participants chose a base year after 1987 and reported reductions based on that year in addition to outlining their commitments in a publicly accessible action plan.
Progress made: The Audit and Evaluation Branch of Environment Canada undertook an evaluation of the ARET program and concluded that the ARET challenge targets were met and in most cases exceeded (Environment Canada, 2000). However, the evaluation also found that the ARET initiative was not one of the main factors in motivating industry to reduce releases of toxic substances. Other factors such as regulations, modernization, and business decisions played a more important role. An additional issue with the ARET program identified in the evaluation was the choice of the base year. While the ARET program reported that cadmium emissions in 2000 were 76% lower than the base year (1987), a total reduction of 113 tonnes (Environment Canada 2003), the evaluation found that 87% of reductions reported for persistent and bioaccumulative toxic substances occurred between 1988 and 1993, before ARET was in place. This is also true for cadmium, where 87% of the reductions achieved occurred between the base year and 1995. Cadmium emissions further increased between 1995 and 1999 from 27.2 tonnes, peaking at 47.6 tonnes in 1997, before falling to 13 tonnes reported for year 2000, according to data reported to ARET.
Another evaluation undertaken by academic researchers was critical of the success of the ARET program, largely due to its self-reporting of success (Antweiler & Harrison, 2006; Antweiler & Harrison, 2007). One of the primary indicators of success used in the Antweiler & Harrison papers was comparing the ARET-reported release values for substances with the release values recorded by NPRI. They suggested that for some substances, ARET participants made fewer release reductions than their non-ARET peers, and that the releases reported to NPRI were often much higher than those reported under the ARET program.
Using the most current information available in NPRI, the methods of comparison used in the papers were replicated by Environment and Climate Change Canada as part of this performance measurement evaluation. It was found that, for cadmium specifically, ARET participants accounted for between about 95 to 99% of releases reported to NPRI annually, between 1994 and 2002. However, there were large variations in terms of the estimated release data reported to NPRI compared with the data reported to ARET. There may be a number of reasons for this, including corrections made by facilities as well as different emission factors or re-calculations that have since occurred. Nonetheless, the overall trend in releases recorded by ARET and NPRI is somewhat consistent between 1995 and 1999. Both inventories noted an increase between 1995 and 1998, followed by a slight decrease.
Despite its weaknesses, the ARET program did target the primary industrial sectors of concern identified in the 1994 Assessment and the primary release pathway, as well as engaging the sectors responsible for most releases of cadmium. Although the final ARET report notes a decline of 76% in releases of cadmium (Environment Canada, 2003), a closer examination of annual cadmium releases and NPRI data indicates that the voluntary program was not successful in reducing releases and is unlikely to have contributed to progress in achieving the risk management or environmental objectives for inorganic cadmium compounds. Nonetheless, the program may have helped to collect information, raise awareness about industrial releases of toxics, and engage industry in further dialogue about emission reduction measures. In particular, the Strategic Options Process that followed, used the data and information provided through the ARET program to help inform and develop the reports made by each Issue Table group.
Multi-pollutant Emission Reduction Strategies
The Canadian Council of Ministers of the Environment endorsed Canada Wide Standards for Particulate Matter and Ground-level Ozone in 2000. These standards set limits for ambient particulate matter less than 2.5 microns and ozone to be achieved by 2010. As part of the efforts to achieve these standards, the Ministers of the Environment agreed to a list of actions aimed at reducing pollutant emissions contributing to particulate matter and ozone. The actions included the development of comprehensive multi-pollutant emission reduction strategies (MERS) for key industrial sectors. This approach was taken in an effort to pursue integrated solutions to the problems of smog, acid rain, toxic release and climate change. To support this work, the Government put forward national, multi-pollutant emission reduction analysis foundation reports, that included technical feasibility studies of emission reduction options and costs, economic profiles, and input into development of sectoral actions and plans.
The sectors identified for the development of a MERS include the electric power generation, base metals smelting, iron and steel, pulp and paper, lumber and allied wood products, concrete ready-mix, and asphalt hot-mix sectors. The selection of these sectors was based on several factors, including the following:
- These sectors are significant sources of direct emissions of PM and of the precursor pollutants that form PM and ozone, as based on best available information
- These sectors are common to most jurisdictions and affect many communities across Canada
- Effective action requires a multi-jurisdictional approach
- Effective action can be initiated in the near-term
Several of the sectors identified for the development of a MERS are also sectors of concern for cadmium releases to air, including electric power generation, base metals smelting and iron and steel.
Progress: No information was available on the MERS developed or on the success of this initiative. The Canada Wide Standards for Particulate Matter and Ground-level Ozone were replaced with the Canadian Ambient Air Quality standards under the Air Quality Management System. Provincial and federal ministers of the environmentFootnote 15 agreed to implement a new Air Quality Management System in 2012 to guide work on air emissions across Canada to better protect human health and the environment. The Air Quality Management System is a comprehensive and collaborative approach by federal, provincial and territorial governments to reduce the emissions and ambient concentrations of various pollutants of concern. It provides a framework for collaborative action across Canada to further protect human health and the environment from harmful air pollutants through continuous improvement of air quality.
Base Level Industrial Emissions Requirements
A principle of the Air Quality Management System is that all significant industrial sources in Canada, regardless of where facilities are located, meet a good base-level of performance. Base-level Industrial Emissions Requirements (BLIERs) were developed with this principle in mind. BLIERs are quantitative or qualitative emissions requirements proposed for new and existing major industrial sectors and some equipment types. BLIERs are focused on nitrogen oxides (NOx), sulphur dioxide (SO2), volatile organic compounds (VOCs) and particulate matter (PM). They are not designed to be the sole instrument used to improve air quality, but to support existing policy frameworks at federal and provincial or territorial levels. The federal government led a time-limited federal, provincial and territorial consensus-based process, with stakeholder involvement to develop BLIERs. A number of BLIERs expert groups that included industry and health and environmental non-governmental organizations were created to carry out this work. The federal government was to finalize the BLIERs through collaboration with provinces and territories and propose recommended BLIERs, where consensus could not be achieved.
Cadmium may be a component of particulate matter released from some industrial sources. For this reason, BLIERs for some sectors are relevant to the overall risk management of cadmium in the environment. Reducing particulate matter emissions from key industrial sources will result in a co-benefit of reducing cadmium releases to air. The sectors considered under the Air Quality Management System relevant to cadmium risk management based on the1994 Assessment or on the quantity of cadmium releases to air reported to NPRI and estimates by APEI are: base metal smelting, cement, iron, steel and ilmenite, and electricity generation.
Progress to date: Environment and Climate Change Canada is implementing the BLIERs using a mix of regulatory and non-regulatory instruments. Some of these instruments were developed based on the BLIERs work and other instruments are the result of ECCC’s implementation of the Chemicals Management Plan, climate agenda or other programs. In some cases, regulatory instruments were introduced prior to 2012, to help reduce air pollutants from off-road vehicles and engines, such as those used in agriculture, construction, forestry, and mining applications. Performance measurement for the Air Quality Management System and instruments to implement the BLIERs is ongoing.
As noted in sections 4.1.1.1 and 4.1.1.2, the BLIERs are integrated into risk management instruments for the base metals smelting sector and iron, steel and ilmenite sector. Facilities are working toward implementation of the BLIERs and progress is being tracked by Environment and Climate Change Canada through annual reporting.
Environment and Climate Change Canada’s Audit and Evaluation Branch recently undertook an evaluation of the Addressing Air Pollution Horizontal Initiative (AAPHI) – the cornerstone of the federal government’s approach to addressing air pollution. The Air Quality Management System is a central element of the AAPHI and BLIERs are a key element of the Air Quality Management System. The AAPHI Evaluation noted that despite some progress, certain planned mitigation measures had not moved forward to the extent originally envisioned and that less progress than planned had been made in developing and establishing some of the BLIERs. Several BLIERs expert groups did not achieve full consensus for some sources, sectors or pollutants. In other cases, consensus was achieved with all stakeholders or with federal, provincial and territorial governments, but no federal instrument was developed. As a result, instruments for a few sectors and pollutants were not developed at the conclusion of the BLIERs process. In response to the evaluation of the AAPHI, a report on the outstanding BLIERs was developed (Environment and Climate Change Canada, 2022b). The outstanding BLIERs relevant to cadmium are electricity generation and cement.
The report reviewed the actions taken and found that a significant portion of emissions from the electricity sector is already being addressed by federal and provincial measures, including the accelerated coal phase-out. The measures to phase-out coal-fired electricity go well beyond the original objective of BLIERs. In addition, recent announcements to achieve net-zero for electricity generation by 2035 will go even further to reduce air pollutants from most types of electricity generation. The report concluded that due to recent federal and provincial measures to address electricity generation, the original objectives for BLIERs will be achieved once all of the current and proposed measures for the sector have been fully implemented.
For the cement sector, no consensus was reached among governments and stakeholders during the BLIERs process for both the grey and white cement plants for total particulate matter. No new federal instruments have been implemented that are currently addressing total particulate matter emissions from this sector, however, provincial governments address particulate emissions via operating permits. The provincial measures for total particulate matter meet the original objectives of the BLIERs, which were based on European standards as the leading jurisdiction. Alberta, Ontario and Quebec have particulate matter emissions standards and fugitive dust control regulations. These 3 provinces account for 85% of the total of total particulate matter sector emissions. British Columbia and Nova Scotia also have particulate matter emissions standards. The report concluded that provincial governments address particulate emissions through operating permits and that the BLIERs for total particulate matter from the cement sector are being addressed.
Findings and recommendations
Multi-sectoral actions are useful to target many substances across sectors. They also are effective at engaging with provinces and territories, industry and stakeholders to collect views and input; however, reaching consensus on issues is often difficult, and often results in lengthy working or expert group processes and delays in action. Little consolidated information has been made publicly available on the progress made under multi-sectoral actions, making it challenging to evaluate their usefulness. Performance measurement is still ongoing to monitor achievement of BLIERs. It is expected that with the full implementation of risk management measures, the BLIERs targets will be met in the near future. If multisectoral actions are to be continued, it is recommended that that the goals and targets of multisectoral actions are made publicly available, that there is a clear and transparent method of tracking success in their implementation, and that progress is regularly tracked and reported.
4.2 Domestic and international agreements and collaboration
Canada Ontario Water Quality Agreement
The Canada-Ontario Agreement on Great Lakes Water Quality and Ecosystem Health is the federal-provincial agreement that supports the restoration and protection of the Great Lakes basin ecosystem. The Agreement outlines how the governments of Canada and Ontario will cooperate and coordinate their efforts to restore, protect and conserve the Great Lakes basin ecosystem. It is the means by which Canadian federal departments interact with the Ontario provincial ministries to help meet Canada's obligations under the Canada-US Great Lakes Water Quality Agreement.
The Parties signed their first agreement in 1971. Since then, the Great Lakes community has collaborated to implement nine subsequent agreements. Based on shared understanding and commitment, the achievements include significant reductions in persistent toxic substances and excess phosphorus, and the return of native species such as the bald eagle.
Annex 2 of the agreement guides actions to reduce or eliminate releases of harmful pollutants into the Great Lakes basin. It contains commitments to cooperate on specific research, monitoring, surveillance and risk management actions related to Chemicals of Concern – a list of chemicals that Canada and Ontario agree are of concern to human health or the environment.
The agreement signed in 1994 identified a group of chemicals in the Great Lakes Basin that were of concern and outlined actions to reduce and prevent releases. These chemicals were grouped into two categories: Tier 1 and Tier 2. Cadmium was listed as a Tier 2 chemical. Tier 2 chemicals have the potential to impair and cause widespread impacts in the Great Lakes Basin ecosystem, but less information is available about their persistence and toxicity in the environment and their impacts on human health than Tier 1 chemicals.
Progress to date: In 2014, a review was undertaken to inform on the progress made in addressing chemicals under the agreement. It was found that although concentrations had decreased since the mid 1990s, in some areas, cadmium continued to exceed the water quality (20% of samples) and sediment guidelines (6% of samples) set by the CCME and the Province of Ontario. Cadmium concentrations in fish were below provincial consumption guidelines. Cadmium concentrations in air in the Great Lakes Basin were also examined as part of the review and found to be lower than the Ontario Ambient Air Criterion. Remediation activities were implemented under the Canada-Ontario Agreement that serve to manage and clean up contamination from cadmium and other chemicals at Areas of Concern and as components of Lakewide Action and Management Plans. Under the current Canada-Ontario Agreement signed in 2021, the focus remains on the Tier 1 chemicals as Chemicals of Concern where action was agreed to for these higher priority chemicals.
To date, 3 Areas of Concern have been completely restored: Severn Sound, Collingwood Harbour and Wheatley Harbour. In order for a site to be considered fully restored, all remedial actions must be complete and monitoring results show that water quality and ecosystem health criteria have been met. Another two sites – Spanish Harbour and Jackfish Bay – are designated as Areas in Recovery, which means all required remedial actions are complete and the areas need more time for the environment to fully recover.
Contaminated sediment management projects have been completed in Collingwood Harbour, Severn Sound, and Peninsula Harbour Areas of Concern. Projects to remediate contaminated sediment are planned or are underway in Thunder Bay, St. Clair River, Hamilton Harbour and Port Hope Areas of Concern.
Convention on Long-Range Transboundary Air Pollution
Canada became a Party to the Protocol on Heavy Metals under the United Nations Economic Commission for Europe’s (UNECE) Convention on Long-range Transboundary Air Pollution (LRTAP) in 1998. The Protocol is a regional agreement covering most of the Northern Hemisphere, and requires Parties to reduce their emissions of lead, cadmium and mercury below 1990 levels, or for an alternate year between 1985 and 1995, inclusive. Although regional by geography, it is the only international agreement in place to address cadmium and lead, and provided the framework for the Minamata Convention on Mercury. It sets limits for emissions from listed stationary sources, sets standards for mercury content in products and requires countries to phase out leaded petrol (gasoline). Under the Protocol, guidance has been developed on best available techniques to control and reduce heavy metal emissions from the listed stationary sources. The Protocol also provides guidance on product management measures.
Amendments were made to the Heavy Metals Protocol in 2012, to provide flexibility in implementation and encourage ratification from countries with economies in transition, notably countries in Eastern Europe, the Caucasus and Central Asia and Southeastern Europe.
Progress to date: Implementation of the Heavy Metals Protocol has resulted in decreasing levels of lead, cadmium and mercury entering the environment from industrial sources in the European Union, Canada and the United States. Further decreases in emissions are expected upon ratification and implementation of the Protocol by countries in the Eastern Europe, Caucasus and Central Asia region and the Southeastern European region. While evidence indicates that cadmium is entering Canada through the transportation of airborne particulate matter originating in the United States, given that cadmium emissions do not generally travel between continents, it is unlikely that the ratification of the Protocol by new countries will result in declines in cadmium in Canada. That said, the United States has made particulate matter reduction commitments under the Gothenburg Protocol (another protocol under the LRTAP Convention) which could lead to further reductions in transboundary cadmium. The resulting overall improvements to health and ecosystems are still relevant and important to Canada.
Canada submits inventory reports for the pollutants covered by the Heavy Metals Protocol, including comprehensive emissions inventories of mercury, lead and cadmium, in its annual submission to the UNECE. Current air emissions of lead, cadmium and mercury are well below Canada’s 1990 emissions levels. Note that by 2008, Canada had reduced its emissions of lead, cadmium and mercury by more than 50% from its reference year (1990). For this reason, Canada is exempted from having to apply the emission limit values for new and existing stationary sources and best available techniques for existing stationary sources.
Risk management actions for contaminants affecting endangered whales
Several species of whales are listed as Endangered under Canada’s Species at Risk Act, including The Southern Resident Killer Whale (Orcinus orca). The Recovery Strategy for the Northern and Southern Resident Killer Whales [PDF] lists environmental contaminants, ranging from persistent, bioaccumulative, and toxic organic pollutants (POPs) to biological agents, as a key threat to viability and recovery of killer whale populations. The Strategy recommends:
- identifying and prioritizing key contaminants
- reducing the introduction of chemical pollutants into the environment
- mitigating the impacts of currently used pollutants
The Strategy also identifies:
- urban runoff and stormwater as a source of pollutants affecting Southern Resident Killer Whales (pesticides, metals, hydrocarbons, and animal wastes)
- data gaps, including “The full range of anthropogenic environmental contaminants to which killer whales and their prey are exposed, over time and in space, with special attention paid to the identification of sources and the resulting effects of environmental contaminants on resident killer whales, their prey and their habitat”
The Action Plan for the Northern and Southern Resident Killer Whale provides a recovery measure that Resident Killer Whales and their prey be protected from pollutants from urban and agricultural runoff,Footnote 16 ,Footnote 17 and recommends that key sources of pollutants be identified.
Progress to date: Environment and Climate Change Canada is leading the Southern Resident Killer Whale Contaminants Technical Working Group, with members from all levels of government, non-governmental organizations, academia, and representatives from Washington State, to support the development of measures to address the threat of contaminants to the survival and recovery of these whales. One of the objectives of the Contaminants Technical Working Group was to identify contaminants of concern for Southern Resident Killer Whales and Chinook salmon (Oncorhynchus tshawytscha), their primary prey. Cadmium was identified as a contaminant of concern for Chinook salmon and was also identified as such in the Recovery Strategy. Consideration of cadmium and other trace metals was based on potential toxic effects for salmon, even at relatively low concentrations.
Another objective of the Contaminants Technical Working Group was to identify and evaluate the contributions of various contaminant sources to the Southern Resident Killer Whales, their habitat and their primary prey. The Pollutants Affecting Whales and their Prey Inventory Tool (PAWPIT) was developed to meet this objective.
As noted in section 2, PAWPIT is a web application that includes a geospatial database of estimates of contaminant releases from point, mobile, and area sources as well as a contaminant load analysis for the Fraser River Basin. Geo-spatial data are visualized in a mapping tool with a graphic user interface that allows users to view and interact with data layers to:
- estimate releases of priority contaminants for endangered whalesFootnote 18 and their prey
- identify and evaluate all known sources of contaminants in the habitats of endangered whales and their prey
- perform geospatial analyses of pollutants being released near habitats of whales and their prey, including hotspot identification per pollutant-type (for example PCBs, PBDEs, pesticides), or per source-type (for example wastewater treatment plants, mining operations, solid waste)
- assess contributions from area sources such as urban surfaces and agricultural areas
- compare contaminant concentrations in ambient freshwater to environmental quality guidelines
- determine which sources or sinks require further evaluation (for example, sediments)
- inform models that predict environmental fate of contaminants and estimate total maximum loads (the maximum amount of a pollutant that a water body can receive and still meet water quality standards)
- evaluate how pollutants affecting whales change over time and space (as data becomes available)
Findings and recommendations
Collaboration with partners both domestically and abroad is important to address sources of cadmium releases beyond federal jurisdiction and protect species at risk. Success has been realized in terms of reducing releases and remediating contaminated sites in Ontario, although recent actions under the Canada-Ontario Agreement have been refocused on other contaminants. Risks from cadmium levels in the Great Lakes remain, and further action on cadmium should be considered in future iterations of the agreement. Internationally, progress has been made under the Convention on Long-range Transboundary Air Pollution, and Canada has reduced its cadmium emissions to be in compliance with the Convention commitments. Environmental data suggest that Canada may still be receiving cadmium from sources of release in the United States (see section 3). This issue may be relevant to consider in future revisions to the Canada-US Water Quality Agreement and the Canada-US Air Quality Agreement.
4.3 Conclusion on risk management
Actions have been taken to manage the risks of cadmium to the environment starting from the early 1990s. Although none have targeted cadmium directly, they have resulted in decreases in releases of cadmium to the environment. Twenty-four relevant risk management measures have been put in place, 20 for sectors of concern identified in the 1994 assessment, and four for other sectors determined to be relevant based on the criteria noted in section 4.1. No relevant action was taken to reduce cadmium releases from the transportation sector, which was noted to be of concern in the 1994 assessment. Cadmium has not been the primary target for any environmental risk management action; however, it is addressed through efforts to manage more broadly the release of metals and particulate matter from industrial sectors.
Clear targets and objectives were only set for 11 of 24 instruments (Annex 3). Three achieved their objectives, one did not achieve its objective, and seven are in progress, so it is too soon to say whether they have been successful. There are no trends between successful instruments and trends in industrial releases, due to the small number of instruments that have been evaluated and determined to have met their objectives.
Voluntary instruments accounted for one third of relevant instruments. In general, no objectives or targets were set for them and there was limited information available on their implementation as no reporting was required. Integrating the reporting on the implementation of voluntary instruments into mandatory reporting under other risk management tools would provide useful information for risk management, as was done for the base metals smelting sector. Many of the voluntary codes of practice contain recommendations for the implementation of best available technologies and best environmental practices to reduce releases of cadmium and other substances. Information on their rates of implementation would inform risk managers whether further work is needed or if all facilities have worked to reduce their releases as much as possible. Additionally, a periodic review of the environmental codes of practice and guidelines should be conducted to keep current with advances in technologies or practices that can further reduce releases.
It is difficult to evaluate the success of multi-sectoral risk management actions. The administration of such instruments is challenging and progress reporting is inconsistent. The benefit of multi-sectoral actions is that many substances can be targeted across sectors to have a common goal.
Collaborations with international and domestic partners are important for managing risks in areas beyond federal jurisdiction and for managing risks of toxic substances for migratory species.
5. Risk communication
5.1 Government communications on cadmium
Informing Canadians of the risks of chemicals to the environment and what the government is doing to manage those risks is an important part of transparent government operations. It also helps people to know what actions can increase risk and what they can do to minimize risk. Environment and Climate Change Canada mainly communicates this information using online webpages, publications and news releases.
The hub for most information about cadmium is the toxic substance webpage for inorganic cadmium compounds. The page for inorganic cadmium compounds provides an overview of the substance, sources of cadmium in the environment, and links to risk assessment documents, risk management tools, and other information. Data on the number of webpage visits are available since October 2019. The number of new visitors to this page has increased each year from 216 in 2020 to 275 in 2022.
Information on past and present risk management and assessment activities under the Chemicals Management Plan is posted on the Chemical Substances webpage that is managed jointly by Environment and Climate Change Canada and Health Canada. Additionally, work under the Chemicals Management Plan is communicated to stakeholders who have registered for email updates. These mail-outs are public notifications of publications, opening of comment periods or other relevant information. For example, the Government published the Chemicals Management Plan approach for a subset of inorganic and organometallic substances for public comment (Environment and Climate Change Canada, 2022c). Stakeholders provided comments requesting further assessment of cadmium and cadmium compounds.
Data collected by Environment and Climate Change Canada’s inventory and monitoring programs are made publicly available online on Canada’s Open Data Portal. These data are used in annual reporting of the Canadian Environmental and Sustainability Indicators for releases of hazardous substances to water and to air as part of commitments under the Federal Sustainable Development Strategy reporting. All of this information is also reported in the annual Canadian Environmental Protection Act reports along with information on the implementation of risk management instruments. The performance of individual risk management instruments is also posted on the instruments’ web pages and on the CEPA registry. Additionally, the APEI publishes an annual report of emissions and the NPRI is currently developing a fact sheet on cadmium as well as on a number of substances and industrial sectors. The NPRI website shows the sources of cadmium releases in Canada and allow users to see point sources of release in their community. NPRI also recently developed an interactive dashboard that allows users to interact with release data.
Another interactive tool available to the public is the recently launched Pollutants Affecting Whales and their Prey Inventory Tool (PAWPIT). As noted in section 4.2, the PAWPIT web page is a user-friendly, graphical interface that allows users to filter by pollutant-type, source-type, sub-basin, or generate regional pollution inventories for any set of coordinates within the area of interest. Users are able to view the critical habitat of Southern and Northern Resident Killer Whales and important Chinook Salmon conservation areas with an overlay of releases of pollutants, including metals. Locations and number of cadmium exceedances of the CCME guidelines at water quality monitoring stations are also able to be viewed on the map.
Social media postings for cadmium have been relatively limited. Only two relevant postings were found to be made by Environment and Climate Change Canada since 2010, while Health Canada had 25 postings over the same time period. The first was part of the 2021 Protect Nature Challenge intended to engage the public in taking everyday actions to protect the environment. This campaign issued 31 challenges for individuals to take and encouraged people to share their progress in completing the challenges on social media. Challenge number 29 was to “Dispose of toxic chemicals, electronics, and lightbulbs properly”. The challenge noted that cadmium and other chemicals can be found in old electronics and provided information on where these items could be safely disposed. The second posting, from 2019, was related to the publication of the Canadian Environmental Sustainability Indicators interactive map which shows the status of water quality in Canadian rivers. Users can find which rivers monitor levels of cadmium and other contaminants. No data are available on social media engagement.
5.2 Evaluation of efforts to communicate risks to the public
In the 2018 audit undertaken by the Commissioner for Environment and Sustainable Development, it was found that Environment and Climate Change Canada had undertaken limited public communication activities on environmental risks from toxic substances. The audit recommended that Environment and Climate Change Canada and Health Canada work together to develop communication activities that address both environmental and human health issues.
5.3 Findings and recommendations
The information available on risks of cadmium to the environment on Environment and Climate Change Canada’s webpages was found to be spread across many pages and different communications material. This may make it difficult for the public to find information about environmental risks of cadmium relevant to them. Newly developed interactive pages are becoming more easily accessible and are useful to provide engaging visual information that can be filtered to levels of interest to individuals. While environmental datasets are publicly available, without scientific analyses, these data are not accessible for a general audience and do not provide meaningful information about levels of toxic substances in the Canadian environment.
Environment and Climate Change Canada’s social media postings related to cadmium and its risks to the environment have been minimal. In the same period of time, Health Canada had a number of social media postings relevant to risk management actions taken to reduce the risks of cadmium in consumer products. Despite this, the public has shown an interest in cadmium as a toxic substance, as demonstrated through visits to the Risk Management Toxic Substance webpage and commentary on risk assessment work.
It is recommended that:
- the Risk Management of Toxic Substances webpage for cadmium should be the hub for environmental information about the substance and include links to the relevant resources and tools. This page was found to be out of date during the evaluation and was updated as part of this work. Environment and Climate Change Canada should continue to maintain the page and ensure that its content is up-to-date and in plain language for Canadians to understand. Information in one centralized location would help to decrease confusion amongst users and allow for easier access to important information on risks of cadmium
- information on levels of cadmium measured in the environment and an interpretation of the results, should be more accessible to the public
- the Government should track the frequency, successfulness and level of engagement of social media postings and work to improve messaging, as applicable, to better inform Canadians of environmental risks. Tracking of webpage visits should continue to provide information for future evaluations
- increased targeted communication products (infographics, fact sheets, videos) to educate and communicate environmental risks of cadmium should be produced in plain language and be easily accessible
5.4 Conclusion on risk communication
There have been few communications materials published on cadmium in the environment and associated environmental risks. Communication is expected to improve as Environment and Climate Change Canada and Health Canada work together to develop a coordinated communications approach as recommended by the 2019 audit. Ongoing work to improve public access to data including more user-friendly dashboards will further help Canadians to understand the risks of toxic substances, their sources, and actions that they could take to help prevent pollution.
6. Evaluation of the effectiveness of cadmium risk management
6.1 Effectiveness of the risk management approach
In evaluating the effectiveness of the risk management approach, the first step is to determine whether the Government has taken action to address the risks of inorganic cadmium compounds and whether the actions were targeted to the sectors of concern and release pathways listed in the Priority Substance List Assessment. The second step is to consider any actions taken individually and report on whether they met their targets and objectives. Finally, the evaluation of the effectiveness of the risk management approach will consider whether the implementation of risk management actions resulted in reductions in releases over time.
In terms of actions taken for sectors of concern (metal production, stationary fuel combustion, transportation, solid waste disposal, sewage sludge application), seven of the instruments were targeted at the metal production sector. Risk management of cadmium for the base metals smelting industry has been effective resulting in a decrease of 98% of cadmium releases from the sector since 1994, however it is noted that some of these decreases were due to the closure of facilities during this period. Risk management actions for this sector have targeted emissions, the main pathway of cadmium releases and have evolved over time from voluntary implementation of guidelines, to requirements for pollution prevention planning, and finally performance agreements. While the sector remains the largest source of cadmium releases, it has demonstrated continual improvement. Cadmium releases in the iron and steel industry, part of the metal production sector, have declined over time, but appear to be unrelated to the implementation of risk management measures. Without instrument reporting data, it is difficult to conclude that they have had any effect on cadmium releases.
Two instruments targeted coal-fired electricity generation facilities, part of the stationary fuel combustion sector. One was a voluntary guideline that did not appear to have any co-benefits for cadmium release reduction and the second was a regulation to limit carbon dioxide emissions. While no performance measurement was undertaken on these instruments, the regulation appears to have contributed to reducing cadmium releases, as declines in emissions based on inventory data can be seen following its introduction.
No relevant instruments were put in place to target heating. Commercial, residential, and institutional heating continue to contribute significantly to cadmium releases to the environment. While the government has made efforts to improve heating efficiency and reduce greenhouse gas emissions from homes and businesses, this does not seem to have had an effect on cadmium releases.
No relevant instruments were put in place to control cadmium releases from the transportation sector. It is unclear how much this sector contributes to levels of cadmium in the environment. Air quality monitoring data suggests that it may be a larger contributor than previously thought. APEI estimates for the transportation sector are very low and show declines since 2005 for rail and marine navigation, and no emissions from other transportation sources like vehicles and airplanes. Cadmium is below detection limits in most transportation fuels, except for residual oil which is used in rail and marine transportation. Cadmium is not usually detected in exhaust measurements for vehicles or aircraft, suggesting that cadmium detected by monitoring activities near roadways likely does not come from fuels, but from other sources like vehicle coatings or tire wear.
Solid waste disposal is primarily managed by provinces and territories, but the federal government has put in place four measures to control the movements of hazardous waste across provincial and international borders. The impacts of these measures in controlling cadmium releases is not clear. Studies of municipal solid waste landfills suggest that they do not play a large role in environmental releases (see section 2.2).
Sewage sludge application is managed by both federal and provincial/territorial measures. There are two relevant federal measures, guidelines for beneficial use and management of biosolids and a regulation for the sale and trade of composts and fertilizers, including those containing biosolids. Monitoring data suggest that most of the sewage sludge applied to land is below limits thought to cause adverse effects to the environment. Risk management measures for this section do not address influent entering wastewater treatment plants which is the source of cadmium found in sewage sludge.
The approach to use risk management measures developed for controlling metals in general rather than to develop new risk management measures specific to cadmium has worked to address the risks of cadmium for many of the sectors of concern, particularly those where air is the primary release pathway. Controlling overall releases of metals in particulate matter is effective at controlling cadmium releases, but controls for releases of other substances like PAHs and VOCs do not appear to co-benefit cadmium releases. Risk management instruments developed for the sectors of concern were targeted at the appropriate release pathways for each sector. Overall, the risk management approach was successful at reducing cadmium releases to the environment; however, it led to gaps for some sectors where no relevant instruments were developed, despite being listed as potentially posing a risk to the environment.
6.1.1 Progress in achieving the risk management objective
The risk management objective is to achieve the lowest level of anthropogenic releases of inorganic cadmium compounds that are technically and economically feasible, taking into consideration socioeconomic factors. Releases of cadmium to the environment have been reduced over time. Most of the releases and corresponding reductions can be attributed to the base metals smelting sector. Reductions are clearly linked to the implementation of risk management measures for the sector. For other sectors, the links between release reductions and introduction of risk management instruments are less clear, because of the lack of reporting data. Releases may be lower due to implementation of risk management measures at provincial/territorial levels, closure of facilities due to economic conditions, or changes to industrial processes and feedstocks. Data available for these factors was not sufficient to include them in the evaluation. Lack of data on implementation of best environmental practices and best available technologies also limited this evaluation in determining whether the risk management objective has been achieved.
To conclude, releases of cadmium have been reduced, but there is not enough information to determine whether they are at the lowest levels technically and economically feasible. Risk managers should consider conducting periodic reviews of voluntary Codes of Practice and guidelines to ensure they remain current with the latest available technologies and practices and seek ways to collect information on the implementation of these voluntary measures. This is particularly warranted for industries where there have been no significant changes or where cadmium levels have shown increases over time, or within the last 10-15 years. Discussions with industry may also be productive to foster innovation and identify new research and development activities that may identify novel pollution prevention opportunities and technologies. Public communication of efforts to implement best environmental practices and best available technologies is important for record-keeping and transparency.
6.1.2 Progress in achieving the environmental objective
The environmental objective is to reduce Canadian anthropogenic releases of inorganic cadmium compounds so as not to exceed levels expected to cause adverse effects to the environment, taking into consideration natural background concentrations. Reductions in anthropogenic releases have led to declines in environmental concentrations in most locations and in most environmental media. Environmental data are mostly limited to the period after 2010, due to changes in analytical methods. Patterns in environmental releases to air and ambient air quality monitoring show similar trends, suggesting that reducing industrial releases does lead to reductions in the environment.
Cadmium levels in air and water are generally below those thought to cause adverse effects, but anthropogenic inputs are still evident. Cadmium levels in sediment are above the levels thought to cause adverse effects on aquatic life in many locations. Atmospheric inputs are thought to be a major contributor to cadmium levels in sediment in some areas. For this reason, the protectiveness of ambient air quality guidelines for cadmium may need to be reconsidered.
Cadmium levels in fish are highest in small prey fish, although it is unknown what level of cadmium in the body causes adverse impacts to fish. Cadmium was identified as a threat to the recovery of Southern Resident Killer Whales, because of its potential effects on the whales’ food source, Chinook Salmon. For wildlife, cadmium levels are below those estimated to cause sublethal effects, though sub chronic effects like immune suppression may still occur and are unable to be estimated using currently available data.
The environmental objective has not yet been achieved, though there has been progress made towards its achievement. Continued environmental monitoring will be important to support evidence-based performance evaluations. While a lot of scientific studies measuring cadmium have been completed, spatial gaps exist across Canada. Environmental data near sources of cadmium releases is also lacking. Scientific programming should consider the recommendations for future research and monitoring proposed in section 3, especially those related to developing or re-examining environmental quality guidelines and adverse effects thresholds.
6.1.3 Response to new or emerging exposure sources
Sectors of concern identified in the 1994 Assessment account for the majority of reported releases to air, water, and land. However, as these sectors have reduced their releases, other sectors that were not identified as concerns in the 1994 Assessment have begun to make up a larger part of the cadmium releases profile. In 1994, sources of concern were responsible for nearly 100% of total releases reported to NPRI, in 2020, they were only responsible for 50%. Releases from wastewater treatment facilities and the pulp and paper industry now make up 40% of total reported releases. Releases of cadmium to water from wastewater treatment facilities may be overestimated in NPRI due to methods used to estimate releases when cadmium levels are below detection limits, even though NPRI only includes reporting from larger wastewater treatment plants. Since cadmium levels in wastewater treatment effluents are dependent on the influents received, and NPRI does not show a large amount of transfers to wastewater treatment facilities, it appears that facilities that do not meet NPRI reporting requirements, the use and disposal of cadmium-containing products, or other sources may account for a substantial amount of releases to the environment from wastewater treatment facilities. These are not sources of cadmium that have been considered in previous risk assessment work. Similarly, releases from pulp and paper facilities have not been considered.
A review of minerals production reports and trade data show that most of the cadmium ore produced in Canada is exported. Cadmium ore production has decreased since 1994, although it has remained relatively stable since 2012. Canada does not import much raw cadmium materials, but imports a substantial amount of cadmium batteries. Batteries are the main product containing cadmium that is traded internationally, with imports accounting for more than $20 million per year. However, the number of units imported is declining over time, likely due to increased use of nickel-metal hydride batteries and lithium-ion batteries, which provide more energy and have longer life spans. A recycling rate of 32% was reported for all batteries in British Columbia in 2020 (Call2Recycle Canada Inc., 2021), well above the 7.7% recycling rate for nickel-cadmium batteries in 2005 (RIS International Ltd., 2005). No federal risk management measures have been put in place for the end-of-life management of batteries containing cadmium. As noted, environmental risks from cadmium in municipal solid waste landfill leachate appear to be low, yet it may take several years for cadmium to leach from solid waste. The amount of cadmium entering the environment from human activities is still causing adverse effects. Landfill leachate monitoring was discontinued under the Chemicals Management Plan and no recent data on cadmium in leachate are available.
Data on production and trade do not show what the end use of cadmium may be; however, there may be increased interest in demand for cadmium used to develop cadmium telluride photovoltaic cells for use in solar panels. The Canadian solar market is projected to increase by 20% to 25% in the next few years and most solar cells sold in Canada are domestically produced (Order on photovoltaic modules and laminates originating in or exported from the People’s Republic of China, 2021). Should an increase in Canadian production of photovoltaic cells occur, risk management measures may be warranted to protect the environment and human health. Risk management measures could include recycling and environmentally sound end-of-life handling procedures (Curtin et al., 2020).
Risk assessment work related to cadmium since the 1994 assessment has been conducted under the Identification of Risk Assessment Priorities (IRAP) approach. As part of this approach, Environment and Climate Change Canada compiles new information on substances, evaluates this information, and then subsequently determines if further action on the substance(s) may be warranted. In 2018, cadmium was identified as one of the substances for which further scoping was required to determine if there were additional sources of exposure to assess or manage (Environment and Climate Change Canada, 2019b). Additional scoping work is underway and will consider the results of this evaluation.
7. Moving forward
Progress has been made toward achieving the risk management and environmental objectives, but more actions may be needed as data show that cadmium levels in the environment are still above those thought to cause adverse effects in some locations. There has been no coordinated approach for cadmium risk management, but generally, measures put in place to control releases of metals from the sectors of concern in the 1994 Assessment have been effective to reduce releases in the environment and have resulted in declines in environmental concentrations. The federal Government should continue to implement existing risk management measures and improve collection of data on the rates of implementation of voluntary measures, codes of practice, guidelines, and pollution prevention planning notices. Guidelines should be reviewed periodically to ensure they recommend the best available technologies and practices for pollution prevention.
No risk management measures were put in place for two sources of concern in the 1994 Assessment. The first was stationary fuel combustion sources related to heating of homes and buildings. Releases from this source have not declined and now makes up a large portion of cadmium releases to the environment. The second was transportation sources which had little data available on cadmium releases. Additional studies into these sources is warranted and risk management actions to address cadmium releases should be considered where appropriate.
Sources of release not considered in the 1994 assessment should be investigated further. Based on the outcome of the investigations for these sources, risk management actions should be considered where appropriate. For example, releases from pulp and paper effluent as well as from wastewater treatment facilities are important contributors to overall cadmium releases, according to release inventories. Little is known about the sources of cadmium in wastewater influent. Further study of cadmium sources in wastewater may be appropriate, for example by collecting information on cadmium used in products and industrial processes as well as processes that release cadmium as a by-product. This information could then be used to explore possible substitutions for cadmium used in products and industrial processes to reduce cadmium inputs to wastewater systems. The contribution of cadmium in atmospheric deposition and surface water runoff to combined sewer flows could also be explored as a source of cadmium in wastewater.
Cadmium enters pulp and paper effluent because it is in the wood or source material used by the facilities. Cadmium levels in pulp and paper effluent and exposure areas are not monitored under current regulatory requirements; however, some facilities report cadmium measured in effluent to the NPRI. Nearly all facilities who conducted testing reported that cadmium was present in effluent. Proposed amendments to the Pulp and Paper Effluent Regulations include effluent characterization and environmental effects monitoring in areas exposed to mill effluent.
Effluent characterization and environmental effects monitoring undertaken by mining operations in accordance with the Metal and Diamond Mining Effluent Regulations has shown that cadmium is present in almost all mining effluents and is above predicted effects levels in exposure areas at one third of mines. The government should review available effluent and environmental monitoring data to consider additional risk management actions, as appropriate.
Monitoring cadmium levels in the environment must continue in order to provide evidence for future evaluations. Gaps in monitoring should be filled to the extent possible, noting that there may be opportunities for collaboration with provinces and territories and that new technologies may be useful to fill gaps in remote areas. A diversity of monitoring locations would also be beneficial to compare areas near point sources with background levels as well as to understand the impacts of climate change on cadmium concentrations in the environment (for example increases in atmospheric cadmium from forest fires). Additionally, monitoring of additional media like soil and surface water runoff may be important to better understand cadmium sources and sinks in the environment. Periodic leachate sampling from municipal solid waste facilities should be reinitiated.
Monitoring should also continue in order to understand the impacts of cadmium releases from sources in the United States on levels in the Canadian environment. Evidence suggests that atmospheric cadmium in the Great Lakes region is originating in the United States and aquatic monitoring also suggests that inputs along the Great Lakes and their connecting channels are important contributors to cadmium levels in water and sediment. This data should be used to advance and strengthen bilateral agreements with the United States.
Research into adverse effects levels and sub chronic effects of cadmium in wildlife and fish tissues is recommended in order to better evaluate whether the environmental objective is achieved. Consideration of cumulative effects of cadmium and other substances in the environment may also warrant further investigation.
Communication on cadmium in the environment should be improved. Webpages should be maintained and public engagement should be strengthened. Metrics to track the use of communications materials and engagement on social media are important to assess whether communication efforts have been successful.
To conclude, the environmental indicators used in this report show that although cadmium releases and environmental levels have decreased significantly in some areas, cadmium is still entering the environment and, in some locations, is present in levels above which adverse effects can be expected as a result of human activities. The collection of environmental data must be maintained and additional investigations are needed to determine whether releases can feasibly be reduced further and whether new risk management actions are required for some industrial sectors and both industrial and non-industrial sources. Continued collaboration with international and domestic partners is important to manage releases from areas beyond federal jurisdiction. A follow-up evaluation on the performance of risk management actions is recommended by 2033 to allow for the implementation of new measures where warranted and collection of performance measurement data and environmental data.
8. References
Aliff, M. N., Reavie, E. D., Post, S. P., & Zanko, L. M. (2020). Anthropocene geochemistry of metals in sediment cores from the Laurentian Great Lakes.
AMAP. (2005). AMAP Assessment 2002: Heavy Metals in the Arctic.
Amuno, S., Al Kaissi, A., Jamwal, A., Niyogi, S., & Quenneville, C. E. (2018). Chronic arsenicosis and cadmium exposure in wild snowshoe hares (Lepus americanus) breeding near Yellowknife, Northwest Territories (Canada), part 2: Manifestation of bone abnormalities and osteoporosis. Science of the Total Environment, 612, 1559–1567.
Amuno, S., Jamwal, A., Grahn, B., & Niyogi, S. (2018). Chronic arsenicosis and cadmium exposure in wild snowshoe hares (Lepus americanus) breeding near Yellowknife, Northwest Territories (Canada), part 1: Evaluation of oxidative stress, antioxidant activities and hepatic damage. Science of the Total Environment, 618, 916–926.
Amuno, S., Niyogi, S., Amuno, M., & Attitaq, J. (2016). Heavy metal bioaccumulation and histopathological alterations in wild Arctic hares (Lepus arcticus) inhabiting a former lead-zinc mine in the Canadian high Arctic: A preliminary study. Science of the Total Environment, 556, 252–263.
Amuno, S., Shekh, K., Kodzhahinchev, V., & Niyogi, S. (2020). Neuropathological changes in wild muskrats (Ondatra zibethicus) and red squirrels (Tamiasciurus hudsonicus) breeding in arsenic endemic areas of Yellowknife, Northwest Territories (Canada): Arsenic and cadmium accumulation in the brain and biomarkers of oxidative stress. Science of the Total Environment, 704.
Archbold, J. A., Hull, R. N., & Diamond, M. (2007). Potential importance of inhalation exposures for wildlife using screening-level ecological risk assessment. Human and Ecological Risk Assessment, 13(4), 870–883.
Belzile, N., Chen, Y. W., Gunn, J. M., & Dixit, S. S. (2004). Sediment trace metal profiles in lakes of Killarney Park. Canada: From regional to continental influence. Environmental Pollution, 130, 239–248.
Benoit. (Unpublished). Ontario Ministry of the Environment and Parks.
Braune, B. M., & Malone, B. J. (2006). Organochlorines and trace elements in upland game birds harvested in Canada. Science of the Total Environment, 363(1–3), 60–69.
Brown, T. M., Fisk, A. T., Wang, X., Ferguson, S. H., Young, B. G., Reimer, K. J., & Muir, D. C. G. (2016). Mercury and cadmium in ringed seals in the Canadian Arctic: Influence of location and diet. Science of the Total Environment, 545–546, 503–511.
Bureau de normalisation & du Québec. (2016). National Standard of Canada CAN/BNQ 0413-200/2016 Organic Soil Conditioners—Composts.
Burger, J. (2008). Assessment and management of risk to wildlife from cadmium. Science of the Total Environment, 389(1), 37–45.
Burniston, D. (unpublished).
Burniston, D., & Kraft, J. (2008). Sediment Quality in Lake Superior Tributaries: A Screening-Level Survey. Ecosystem Health Division, Ontario Region, Environmental Conservation Branch. Report, ECB/EHD-OR/08-01/I, 59.
Burniston, D., Kraft, J., Backus, S., & Dove, A. (2006). Sediment Quality in Canadian Lake Huron Tributaries: A Screening-Level Survey. Ecosystem Health Division, Ontario Region, Environmental Conservation Branch. Report, ECB/EHD-OR/06-01/I, 28.
Call2Recycle Canada Inc. (2021). 2020 Provincial Annual Report: British Columbia.
Canadian Council of Ministers of the Environment. (1999). Canadian Sediment Quality Guidelines for the Protection of Aquatic Life: Cadmium.
Canadian Council of Ministers of the Environment. (2005). Guidelines for compost quality: En108-4/25-2005E-PDF - Government of Canada Publications
Canadian Council of Ministers of the Environment. (2014). Canadian Water Quality Guidelines for the Protection of Aquatic Life: Cadmium.
Canadian Food Inspection Agency. (2021). T-4- 93 – Safety standards for fertilizers and supplements.
Caurant, F. (2013). Trace element trends and effects for small cetaceans in European waters. European Cetacean Society’s 25th Annual Conference.
Celo, V., & Dabek-Zlotorzynska, E. (2011). Concentration and Source Origin of Trace Metals in PM2.5 Collected at Selected Canadian Sites within the Canadian National Air Pollution Surveillance Program. In Environ Sci Eng (pp. 19–38).
Celo, V., Yassine, M. M., & Dabek-Zlotorzynska, E. (2021). Insights into Elemental Composition and Sources of Fine and Coarse Particulate Matter in Dense Traffic Areas in Toronto and Vancouver, Canada. Toxics, 9(10), Article 10.
Coale, K. H., & Flegal, A. R. (1989). Copper, Zinc, Cadmium and Lead in Surface Waters of lakes Erie and Ontario. The Science of the Total Environment, 87(88), 297–304.
Cooke, J. A. (2011). Cadmium in Small Mammals. In W. N. Beyer & J. P. Meador (Eds.), Environmental Contaminants in Biota. Interpreting Tissue Concentrations. Second Edition (pp. 627–642). CRC Press.
Croteau, M. N., Luoma, S. N., & Stewart, A. R. (2005). Trophic transfer of metals along freshwater food webs: Evidence of cadmium biomagnification in nature. Limnology and Oceanography, 50(5), 1511–1519.
Curtin, A. M., Vail, C. A., & Buckley, H. L. (2020). CdTe in thin film photovoltaic cells: Interventions to protect drinking water in production and end-of-life. Water-Energy Nexus, 3, 15–28.
Dabek-Zlotorzynska, E., Celo, V., Ding, L., Herod, D., Jeong, C.-H., Evans, G., & Hilker, N. (2019). Characteristics and sources of PM2.5 and reactive gases near roadways in two metropolitan areas in Canada. Atmospheric Environment, 218, 116980.
De Solla, S. (Unpublished). Cadmium in snapping turtle eggs in Canada.
Desforges, J. P. W., Sonne, C., Levin, M., Siebert, U., Guise, S., & Dietz, R. (2016). Immunotoxic effects of environmental pollutants in marine mammals. Environment International, 86, 126–139.
Dietz, R., Nørgaard, J., & Hansen, J. C. (1998). Have arctic marine mammals adapted to high cadmium levels? Marine Pollution Bulletin, 36(6), 490–492.
Dietz, R., Riget, F., & Johansen, P. (1996). Lead, cadmium, mercury and selenium in Greenland marine animals. Science of the Total Environment, 186(1–2), 67–93.
Dove, A., Painter, S., & Kraft, J. (2003). Sediment Quality in Canadian Lake Ontario Tributaries: Part one (West of the Bay of Quinte. Ecosystem Health Division, Ontario Region, Environmental Conservation Branch Report, ECB/EHD-OR/03-01/I, 30.
Dove, A., Painter, S., & Kraft, J. (2004). Sediment Quality in Canadian Lake Ontario Tributaries: Part Two (Bay of Quinte and St. Lawrence River). Ecosystem Health Division, Ontario Region, Environmental Conservation Branch Report, ECB/EHD-OR/04-01/I, 27.
Environment and Climate Change Canada. (2019a). Reporting guidance for the wastewater sector to the National Pollutant Release Inventory.: En14-406/2020E-PDF - Government of Canada Publications
Environment and Climate Change Canada. (2019b). Identification of Risk Assessment Priorities (IRAP) 2017-18.
Environment and Climate Change Canada. (2019c). Modernization of the Pulp and Paper Effluent Regulations detailed proposal for consultation May 2019.
Environment and Climate Change Canada. (2020a). Canadian Environmental Sustainability Indicators: Water quality in Canadian rivers.
Environment and Climate Change Canada. (2020b). Strategic performance measurement: Evaluating the effectiveness of risk management actions on toxic substances in protecting Canadians and their environment.
Environment and Climate Change Canada. (2021a). Canadian environmental sustainability indicators: Metal and diamond mining effluent quality.
Environment and Climate Change Canada. (2021b). Pulp and Paper Effluent Regulations Annual Report: Executive summary.
Environment and Climate Change Canada. (2022a). Guide for reporting to the National Pollutant Release Inventory.
Environment and Climate Change Canada. (2022b). Report on the outstanding base-level industrial emissions requirements (BLIERs): Response to AAPHI Evalution Recommendation #2 (Part 1).
Environment and Climate Change Canada. (2022c). Summary of public comments received on the Chemicals Management Plan approach for a subset of inorganic and organometallic substances.
Environment and Climate Change Canada. (2022d). Canada’s Air Pollutant Emissions Inventory Report 2022.
Environment and Climate Change Canada. (2022e). Pulp and paper effluent quality.
Environment and Climate Change Canada. (2022f). Base metals smelters and refineries, and zinc plants: Final performance report.
Environment and Climate Change Canada. (2022g). National Air Pollution Surveillance Program.
Environment Canada. (2004). Foundation report on the cement manufacturing sector (p. 304).
Environment Canada. (2013). National Pollutant Release Inventory (NPRI) Sector Coverage Study for the 2008 Reporting Year.
Environment Canada, & Ministère du Développement Durable de l’Environnement et des Parcs du Québec. (2007). Criteria for the Assessment of Sediment Quality in Quebec and Application Frameworks: Prevention, Dredging and Remediation. 39.
Espejo, W., Padilha, J. D. A., Kidd, K. A., Dorneles, P. R., Barra, R., Malm, O., & Celis, J. E. (2018). Trophic transfer of cadmium in marine food webs from Western Chilean Patagonia and Antarctica. Marine Pollution Bulletin, 137, 246–251.
European Chemicals Bureau. (2007). European Union risk assessment report: Cadmium oxide and cadmium metal. Publications Office of the European Union.
European Environment Agency. (2021). Air quality standards.
Fisheries and Oceans Canada. (2012). Beluga whale (Delphinapterus leucas), St. Lawrence Estuary population, recovery strategy.
Fisheries and Oceans Canada. (2018). Northern and Southern Resident Killer Whales (Orcinus orca): Recovery strategy 2018.
Five Winds International. (2001). Toxic and Hazardous Materials in Electronics: An Environmental Scan of Toxic and Hazardous Materials in IT and Telecom Products and Waste : Final Report.
Förstner, U. (1976). Lake Sediments as Indicators of Heavy-Metal Pollution. Naturwissenschaften, 63, 465–470.
Gaga, E. O., Harner, T., Dabek-Zlotorzynska, E., Celo, V., Evans, G., Jeong, C.-H., Halappanavar, S., Jariyasopit, N., & Su, Y. (2019). Polyurethane Foam (PUF) Disk Samplers for Measuring Trace Metals in Ambient Air. Environmental Science & Technology Letters, 6(9), 545–550.
Galarneau, E., Wang, D., Dabek-Zlotorzynska, E., Siu, M., Celo, V., Tardif, M., Harnish, D., & Jiang, Y. (2016). Air toxics in Canada measured by the National Air Pollution Surveillance (NAPS) program and their relation to ambient air quality guidelines. Journal of the Air & Waste Management Association, 66(2), 184–200.
Gamberg, M., Braune, B., Davey, E., Elkin, B., Hoekstra, P. F., Kennedy, D., & Zeeb, B. (2005). Spatial and temporal trends of contaminants in terrestrial biota from the Canadian Arctic. Science of the Total Environment, 351–352, 148–164.
Garron, C., & Lalonde, B. (n.d.). [Personal communication].
Gatz, D. F., Bowersox, V. C., & Su, J. (1989). Lead and Cadmium loadings to the Great Lakes from Precipitation. J. Great Lakes Res, 15(2), 246–264.
G.D.G. Environnement Ltée. (1990). Caractérisation des sédiments du port de Trois-Rivières. Annexes A & H. Conservation et Protection. Environnement Canada. (available in French only)
Gobeil, C., Silverberg, N., Sundby, B., & Cossa, D. (1987). Cadmium diagenesis in Laurentian Trough sediments. Geochim Cosmochim Acta, 51, 589–596.
Godwin, C. M., Smits, J. E. G., & Barclay, R. M. R. (2016). Metals and metalloids in nestling tree swallows and their dietary items near oilsands mine operations in Northern Alberta. Science of the Total Environment, 562, 714–723.
Government of Canada. (1994). Cadmium and its compounds—Priority Substance List Assesment.
Government of Canada. (2002). Strategic options for the management of toxic substances from the base metals smelting sector: Report of stakeholder consultations : En84-121/1997E-PDF - Government of Canada Publications
Government of Canada. (2022a). National Air Pollution Surveillance (NAPS) Program—Open Government Portal.
Government of Canada. (2022b). Northern Contaminants Program. Crown-Indigenous and Northern Affairs Canada.
Gurney, K. E. B., Wood, C. J., Alisauskas, R. T., Wayland, M., Devink, J. M. A., & Slattery, S. M. (2014). Identifying carry-over effects of wintering area on reproductive parameters in white-winged scoters: An isotopic approach. Condor, 116(2), 251–264.
Hargreaves, A. L., Whiteside, D. P., & Gilchrist, G. (2011). Concentrations of 17 elements, including mercury, in the tissues, food and abiotic environment of arctic shorebirds. Science of the Total Environment, 409(19), 3757–3770.
Hughes, M. R., Bennett, D. C., Gray, D. A., Sharp, P. J., Scheuhammer, A. M., & Elliott, J. E. (2003). Effects of cadmium ingestion on plasma and osmoregulatory hormone concentrations in male and female Pekin ducks. Journal of Toxicology and Environmental Health - Part A, 66(6), 565–579.
Hume, J. (1987). Salsbury Lake Fertilization. Habitat Conservation Fund Progress Report 1986-1987 (p. 14) [Fisheries project Report No RD13.]. Province of British Columbia, Ministry of Environment and Parks.
Inland Cement Ltd. (2000). Substitution Fuel Project, Edmonton, Alberta. Public Disclosure Document, 13.
Jeong, C.-H., Traub, A., Huang, A., Hilker, N., Wang, J. M., Herod, D., Dabek-Zlotorzynska, E., Celo, V., & Evans, G. J. (2020). Long-term analysis of PM2.5 from 2004 to 2017 in Toronto: Composition, sources, and oxidative potential. Environmental Pollution, 263, 114652.
Jeong, C.-H., Wang, J. M., Hilker, N., Debosz, J., Sofowote, U., Su, Y., Noble, M., Healy, R. M., Munoz, T., Dabek-Zlotorzynska, E., Celo, V., White, L., Audette, C., Herod, D., & Evans, G. J. (2019). Temporal and spatial variability of traffic-related PM2.5 sources: Comparison of exhaust and non-exhaust emissions. Atmospheric Environment, 198, 55–69.
Jing, J., & Logan, T. J. (1992). Effects of sewage sludge cadmium concentration on chemical extractability and plant uptake. J. Environ. Qual, 21, 1–8.
Kemp, A. L. W., C.I., D., & Harper, N. S. (1978). Sedimentation rates and a sediment budget for Lake Superior. J. Great Lakes Res, 4, 276–287.
Kemp, A. L. W., & Thomas, R. L. (1976). Impact of man’s activities on the chemical composition in the sediments of Lakes Ontario. Erie. and Huron. Water. Air. and Soil Pollution, 5, 469–490.
Kemp, A. L. W., Thomas, R. L., Dell, C. I., & Jaquet, J.-M. (1976). Cultural Impact on the Geochemistry of Sediments in Lake Erie. J. Fish. Res. Board Can, 33, 440–462.
Kubier, A., Wilkin, R. T., & Pichler, T. (2019). Cadmium in soils and groundwater: A review. Applied Geochemistry : Journal of the International Association of Geochemistry and Cosmochemistry, 108, 1–16.
Lalonde, B., Ernst, W., & Comeau, F. (2011). Trace metal concentrations in sediments and fish in the vicinity of ash lagoon Discharges from Coal-Combustion Plants in New Brunswick and Nova Scotia, Canada. Archives of Environmental Contamination and Toxicology, 61, 472–481.
Lapointe, J., & Goyer, C. (1997). Reclaiming Treated Wood Waste as Fuel in Cement Making. St. Lawrence Technologies.
Larison, J. R., Likens, G. E., Fitzpatrick, J. W., & Crock, J. G. (2000). Cadmium toxicity among wildlife in the Colorado Rocky Mountains. Nature, 406(6792), 181–183.
Larter, N. C., Macdonald, C. R., Elkin, B. T., Wang, X., Harms, N. J., Gamberg, M., & Muir, D. C. G. (2016). Cadmium and other elements in tissues from four ungulate species from the Mackenzie Mountain region of the Northwest Territories, Canada. Ecotoxicology and Environmental Safety, 132, 9–17.
Lawrence, S. G., Holoka, M. H., Hunt, R. V., & Hesslein, R. H. (1996). Multi-year experimental additions of cadmium to a lake epilimnion and resulting water column cadmium concentrations. Can. J. Fish. Aquat. Sci, 53, 1876–1887.
Lebeuf, M. (2009). Department of Fisheries and Oceans.
Li, W., Dryfhout-Clark, H., & Hung, H. (2020). PM10-bound trace elements in the Great Lakes Basin (1988-2017) indicates effectiveness of regulatory actions, variations in sources and reduction in human health risks. Environment International, 143, 106008.
Macdonald, C. R., & Sprague, J. B. (1988). Cadmium in marine invertebrates and arctic cod in the Canadian Arctic. Distribution and Ecological Implications. Marine Ecology Progress Series, 47, 1–15.
Macdonald, R. W., Barrie, L. A., Bidleman, T. F., Diamond, M. L., Gregor, D. J., Semkin, R. G., Strachan, W. M. J., Li, Y. F., Wania, F., Alaee, M., Alexeeva, L. B., Backus, S. M., Bailey, R., Bewers, J. M., Gobeil, C., Halsall, C. J., Harner, T., Hoff, J. T., Jantunen, L. M. M., … Yunker, M. B. (2000). Contaminants in the Canadian Arctic: 5 years of progress in understanding sources, occurrence and pathways. Science of The Total Environment, 254(2), 93–234.
Mamun, A. A., Celo, V., Dabek-Zlotorzynska, E., Charland, J.-P., Cheng, I., & Zhang, L. (2021). Characterization and source apportionment of airborne particulate elements in the Athabasca oil sands region. Science of The Total Environment, 788, 147748.
Markovic, M. Z., Prokop, S., Staebler, R. M., Liggio, J., & Harner, T. (2015). Evaluation of the particle infiltration efficiency of three passive samplers and the PS-1 active air sampler. Atmospheric Environment, 112, 289–293.
May, T. W., & McKinney, L. (1981). Cadmium, lead, mercury, arsenic and selenium concentrations in freshwater fish, 1976-77. National Pesticide Monitoring Program. Pest. Monit. J, 15, 14–39.
McFarland, C. N., Bendell-Young, L. I., Guglielmo, C., & Williams, T. D. (2002). Kidney, liver and bone cadmium content in the western sandpiper in relation to migration. Journal of Environmental Monitoring, 4(5), 791–795.
McGeer, J. C., Niyogi, S., & Smith, D. S. (2012). Cadmium. Fish Physiol, 31(Part B), 125–184.
Ministère de l’Environnement, de la Lutte contre les changements climatiques. (2022). Normes et critères québécois de qualité de l’atmosphère, version 7. (available in French only)
Mudroch, A., Sarazin, L., & Lomas, T. (1988). Summary of surface and background concentrations of selected elements in Great Lakes sediments. J. Great Lakes Res, 14(2), 241–251.
Muhammad, I., Puschenreiter, M., & Wenzel, W. W. (2012). Cadmium and Zn availability as affected by pH manipulation and its assessment by soil extraction, DGT and indicator plants. Science of the Total Environment, 416, 490–500.
Natural Resources Canada. (2020). About-electricity.
Nazzal, Y., Rosen, M. A., & Al-Rawabdeh, A. M. (2013). Assessment of metal pollution in urban road dusts from selected highways of the Greater Toronto Area in Canada. Environmental Monitoring and Assessment, 185(2), 1847–1858.
Niyogi, S., & Wood, C. M. (2004). Biotic ligand model, a flexible tool for developing site-specific water quality guidelines for metals. Environmental Science and Technology, 38, 6177–6192.
Nriagu, J. O. (1986). Metal pollution in the Great Lakes in relation to their carrying capacity. In G. Kullenberg (Ed.), The Role of the Oceans as a Waste Disposal Option (pp. 441–468). D. Reidel Publishing Co.
Office of the Auditor General of Canada. (2019). Report 2—Protecting Fish From Mining Effluent.
Ohlson, M., & Staaland, H. (2001). Mineral diversity in wild plants: Benefits and bane for moose. Oikos, 94(3), 442–454.
Ontario Ministry of the Environment, Conservation and Parks. (2020). Ontario’s Ambient Air Quality Criteria.
Order on Photovoltaic Modules and Laminates Originating in or Exported from the People’s Republic of China, RR‑2020-001 (Canadian International Trade Tribunal 2021).
Pacyna, J. M., & Pacyna, E. G. (2001). An assessment of global and regional emissions of trace metals to the atmosphere from anthropogenic sources worldwide. Environmental Reviews, 9(4), 269–298.
Parker, G. H., & Hamr, J. (2001). Metal levels in body tissues, forage and fecal pellets of elk (Cervus elaphus) living near the ore smelters at Sudbury, Ontario. Environmental Pollution, 113(3), 347–355.
Pelletier, M. (2009). Toxic Contamination in sediments—Lake Saint-Louis: Where Two Rivers Meet. Environment Canada (ISBN 978-1-100-10542-0 8).
Pelletier, M. (2010). Sediment Quality Monitoring in Lake Saint-François. Environment Canada.
Pelletier, M. (2019). Sediment quality status of Lake Saint-Louis. Environment Canada (ISBN 978-0-660-32833-1 10).
Pelletier, M. (2020). Sediment Quality Status of Lake Saint-François in 2018. Environment Canada (ISBN 978-0-660-35248-0 12).
Pelletier, M., & Blais, S. (2018). Sediment quality in the St. Lawrence River in the Quebec sector in 2012 and its evolution since 1989. Environment Canada (ISBN 978-0-660-08699-6 7).
Pollock, B., & Machin, K. L. (2008). Effects of cadmium, mercury, and selenium on reproductive indices in male lesser scaup (Aythya affinis) in the western boreal forest. Archives of Environmental Contamination and Toxicology, 54(4), 730–739.
Pollock, B., & Machin, K. L. (2009). Corticosterone in relation to tissue cadmium, mercury and selenium concentrations and social status of male lesser scaup (Aythya affinis). Ecotoxicology, 18(1), 5–14.
Pratte, I., Tomlik, M. D., Betsch, T. A., Braune, B. M., Milton, G. R., & Mallory, M. L. (2015). Trace elements in eggs of common eiders (Somateria mollissima) breeding in Nova Scotia, Canada. Marine Pollution Bulletin, 100(1), 586–591.
Procéan Inc. (1990). Caractérisation de la qualité des sédiments du port de Québec. Tome, 1, 124.
Reavie, E. D., Robbins, J. A., Stoermer, E. F., Douglas, M. S., Emmert, G. E., Morehead, N. R., & Mudroch, A. (2005). Paleolimnology of a fluvial lake downstream of Lake Superior and the industrialized region of Sault Saint Marie. Canadian Journal of Fisheries and Aquatic Sciences, 62(11), 2586–2608.
Reavie, E. D., Srgo, G. V., Estepp, L. R., Bramberger, A. J., Shaw Chraibi, V. L., Pillsbury, R. W., Cai, M., Stow, C. A., & Dove, A. (2017). Climate warming and changes in Cyclotella sensu lato in the Laurentian Great Lakes: Great Lakes warming and Cyclotella. Limnology and Oceanography. Limnology and Oceanography, 62(2), 768–783.
Richardson, G. M., Garrett, R., Mitchell, I., Mah-Poulson, M., & Hackbarth, T. (2001). Critical review on natural global and regional emissions of six trace metals to the atmosphere. Prepared for the International Lead Zinc Research Organisation, the International Copper Association, and the Nickel Producers Environmental Research Association.
RIS International Ltd. (2005). Canadian Consumer Battery Baseline Study.
Roberts, S., Kirk, J. L., Wiklund, J. A., Muir, D. C. G., Yang, F., Gleason, A., & Lawson, G. (2019). Mercury and metal(oid) deposition to remote Nova Scotia Lakes from both local and distant sources. Science Total Environ, 675, 192–202.
Roberts, T. L. (2014). Cadmium and phosphorus fertilizers: The issues and the science. Procedia Engineering, 83, 52–59.
Roch, M., & Maly, E. J. (1979). Relationship of cadmium-induced hypocalcemia with mortality in rainbow trout (Salmo gairdneri) and the influence of temperature on toxicity. Journal of the Research Fisheries Board of Canada, 36(11), 1297–1303.
Rodrigue, J., Champoux, L., Leclair, D., & Duchesne, J. F. (2007). Cadmium concentrations in tissues of willow ptarmigan (Lagopus lagopus) and rock ptarmigan (Lagopus muta) in Nunavik, Northern Québec. Environmental Pollution, 147(3), 642–647.
Rodríguez-Estival, J., & Smits, J. E. G. (2016). Small mammals as sentinels of oil sands related contaminants and health effects in northeastern Alberta, Canada. Ecotoxicology and Environmental Safety, 124, 285–295.
Rondeau, B., Cossa, D., Gagnon, P., & Bilodeau, L. (2000). Budget and sources of suspended sediment transported in the St. Lawrence River, Canada. Hydrological Processes, 14, 21–36.
Schertz, T. L., Alexander, R. B., & Ohe, D. J. (1991). The Computer Program Estimate Trend (Estrend), A System For The Detection Of Trends In Water-Quality Data [U.S. GEOLOGICAL SURVEY. Water-Resources Investigations Report 91-4040.].
Scheuhammer, A. M. (1987). The chronic toxicity of aluminium, cadmium, mercury, and lead in birds: A review. Environmental Pollution, 46(4), 263–295.
St. Lawrence Cement Inc. (2001). Greenport Project Overview. Permit Application to New York State Department of Environmental Quality, 2–20.
Statistics Canada. (2022). Electric power generation, monthly generation by type of electricity.
Stratos Inc. (2003). Environmental performance review of the iron and steel sector.
Sun, T., Wu, H., Wang, X., Ji, C., Shan, X., & Li, F. (2020). Evaluation on the biomagnification or biodilution of trace metals in global marine food webs by meta-analysis. Environmental Pollution, 264.
Thomas, P., Irvine, J., Lyster, J., & Beaulieu, R. (2005). Radionuclides and trace metals in Canadian moose near uranium mines: Comparison of radiation doses and food chain transfer with cattle and caribou. Health Physics, 88(5), 423–438.
Thomas, R. L. (1983). Lake Ontario Sediments as Indicators of the Niagara River as a Primary Source of Contaminants. J. Great Lakes Res, 9(2), 118–124.
United Nations Environment Programme. (2019, March 12). Final review of scientific information on cadmium.
U.S. Environmental Protection Agency. (1980). Atmospheric cycles of cadmium and lead: Emissions, transport, transformation and removal.
U.S. Environmental Protection Agency. (1999). NESHAPS: Final Standards for Hazardous Air Pollutants for Hazardous Waste Combustors; 40 CFR Part 60 Final Rule.
U.S. Environmental Protection Agency, Office of Solid Waste (1998). Draft-Technical Background Document on Ground Water Controls at CKD Landfills, (pp. 1–8).
U.S. Geological Survey. (2022). Mineral commodity summaries 2022. In Mineral Commodity Summaries (2022). U.S. Geological Survey.
Wang, W.-X. (2002). Interactions of trace metals and different marine food chains. Marine Ecology Progress Series, 243, 295–309.
Wayland, M., Drake, K. L., Alisauskas, R. T., Kellett, D. K., Traylor, J., Swoboda, C., & Mehl, K. (2008). Survival rates and blood metal concentrations in two species of free-ranging North American sea ducks. Environmental Toxicology and Chemistry, 27(3), 698–704.
Wayland, M., Gilchrist, H. G., Dickson, D. L., Bollinger, T., James, C., Carreno, R. A., & Keating, J. (2001). Trace elements in king eiders and common eiders in the Canadian arctic. Archives of Environmental Contamination and Toxicology, 41(4), 491–500.
Wayland, M., Gilchrist, H. G., Marchant, T., Keating, J., & Smits, J. E. (2002). Immune function, stress response, and body condition in arctic-breeding common eiders in relation to cadmium, mercury, and selenium concentrations. Environmental Research, 90(1), 47–60.
Wayland, M., Gilchrist, H. G., & Neugebauer, E. (2005). Concentrations of cadmium, mercury and selenium in common eider ducks in the eastern Canadian arctic: Influence of reproductive stage. Science of the Total Environment, 351–352, 323–332.
Wayland, M., & Scheuhammer, A. M. (2011). Cadmium in Birds. In W. N. Beyer & J. P. Meador (Eds.), Environmental Contaminants in Biota. Interpreting Tissue Concentrations. Second Edition (pp. 645–666). CRC Press.
Wayland, M., Smits, J. E. G., Gilchrist, H. G., Marchant, T., & Keating, J. (2003). Biomarker responses in nesting, common eiders in the Canadian arctic in relation to tissue cadmium, mercury and selenium concentrations. Ecotoxicology, 12(1–4), 225–237.
World Health Organization. (1992). Cadmium: Environmental Health Criteria.
Young, K. L., & Lund, K. (2006). An investigation of cadmium and lead from a High Arctic waste disposal site, Resolute Bay, Nunavut, Canada. Hydrology Research, 37(4–5), 441–453.
Yuan, F. (2017). A multi-element sediment record of hydrological and environmental changes from Lake Erie since 1800. J Paleolimnol, 58, 23–42.
Yuan, F., Depew, R., & Soltis-Muth, C. (2014). Ecosystem regime change inferred from the distribution of trace metals in Lake Erie sediments. Scientific Reports, 4, 7265.
Zhang, H., Walker, T. R., Davis, E., & Ma, G. (2019). Ecological risk assessment of metals in small craft harbour sediments in Nova Scotia, Canada. Marine Pollution Bulletin, 146, 466–475.
Annex 1 – Indicators and additional information considered in the evaluation
A. Indicators to assess the environmental objective: to reduce Canadian anthropogenic releases of inorganic cadmium compounds so as not to exceed levels expected to cause adverse effects to the environment, taking into consideration natural background concentrations
Indicator A1: Trends in environmental concentrations; number, proportion and magnitude of exceedances of environmental quality guidelines per year and by site
Sub indicator: Cadmium levels in ambient air
Data source(s)
- National Air Pollution Surveillance program
- Air Toxics in Canada research program
- Passive sampling program
- Great Lakes Basin monitoring program
Rationale for sub indicator selection
- Cadmium is released to air through industrial activities and noted as primary release pathway in 1994 assessment
- Trends in ambient air may indicate whether trends in reported Canadian industrial emissions are related to trends in environmental concentrations
- Exceedances of environmental quality guidelines may help to evaluate whether there are adverse effects to the environment
Result
- Significant declines in cadmium levels at most locations, but some show no trend
- Guidelines were not exceeded
Limitations and considerations
- Gaps in monitoring for the Prairie provinces, Prince Edward Island, Newfoundland and Labrador, and Northern Canada
- Little monitoring close to point sources and not enough sites to analyze trends by different land uses
- Modelling in the Great Lakes Basin suggests that atmospheric transport of cadmium from the United States accounts for much of the cadmium levels in the region
- Existing ambient air quality guidelines developed may not have considered impacts to the aquatic environment
Conclusions and recommendations
- Atmospheric levels of cadmium are declining at most locations, but anthropogenic activities still contribute to levels higher than natural background levels
- Ambient air quality guidelines are based on an assessment of effects for human health, not to the environment. A review of the protectiveness of existing guidelines or development of new federal guidelines may be warranted and consider the full range of particulate matter sizes and potential risks of atmospheric deposition of cadmium to the aquatic environment. Atmospheric deposition plays a large role in sediment concentrations in some areas of Canada and cadmium in particulate matter is highly soluble
- Atmospheric monitoring is important for assessing effectiveness and risks of cadmium in the air. Closure of some monitoring sites has resulted in spatial and temporal gaps that will grow with time
- Environmental monitoring should continue and analyzing metals using ICPMS at additional monitoring sites would help to achieve better national coverage and analytical power for a more fulsome assessment. Passive sampling may be useful to complement existing monitoring networks
- Modelling would strengthen efforts to identify sources that contribute to cadmium concentrations in air and shed light on the primary drivers for cadmium concentrations in air. For example, the role of local and long range transport, impact of transportation sources, forest fires, and climate change
- Long range transport of cadmium from the United States is an important source of cadmium in areas near the border. Further work on binational and international agreements that reduce pollution will result in positive impacts for transboundary air pollution impacting the Canadian environment
Sub indicator: Cadmium levels in sediment
Data source(s)
- Chemicals Management Plan Monitoring and Surveillance programme
Rationale for sub indicator selection
- Cadmium is found in sediments due to atmospheric deposition and dissolution/precipitation of dissolved cadmium in water
- Exceedances of environmental quality guidelines may help to evaluate whether there are adverse effects to the environment
Result
- Declining overall, but local hotspots remain with levels above threshold effects level and increases observed in some locations, especially Lake Ontario
Limitations and considerations
- Temporal analyses were limited in Pacific and Atlantic Canada
- No monitoring data available for the North
Conclusions and recommendations
- Generally declining concentrations in Canadian sediments indicate progress has been made toward achieving the objective; however, increases in sediment concentrations in some areas are concerning. The number of areas with sediment concentrations above threshold effects levels is also a cause for concern. Continued sediment monitoring is recommended for future evaluations, especially for the Pacific and Atlantic regions where no temporal information was collected
- Atmospheric deposition is an important factor in sediment concentrations. Further reductions in atmospheric concentrations of cadmium will help to reduce cadmium loadings in aquatic environments
- Investigation into local sources contributing to contamination in areas with increasing cadmium levels, particularly when above the probable effect level should be considered to determine if additional actions are warranted
Sub indicator: Cadmium levels in fresh water
Data source(s)
- Chemicals Management Plan Monitoring and Surveillance programme
Rationale for sub indicator selection
- Cadmium is released to water through industrial processes and wastewater treatment
- Atmospheric deposition also contributes to cadmium in water
- Exceedances of environmental quality guidelines may help to evaluate whether there are adverse effects to the environment
Result
- Mostly declining or no trend. Sites with increasing trends still well below guideline levels
Limitations and considerations
- Trend analysis could not be performed at many sites
- Cadmium levels were often below detection limits
Conclusions and recommendations
- Exceedances of environmental quality guidelines were infrequent and cadmium concentrations are generally declining; however, hotspots remain, in particular, at Niagara-on-the-Lake
- Pollution sources in the western and central basins of Lake Erie continue to contribute to elevated cadmium concentrations. Continued collaboration with the United States is recommended to address current and legacy sources of cadmium contamination where warranted
- Natural conditions play an important role in cadmium concentrations and need to be considered when assessing risks and toxicity
Indicator A2: Trends in tissue concentrations; number, proportion and magnitude of exceedances in levels of cadmium in biota above thresholds for adverse effects over time and by location.
Sub indicator: Cadmium levels in fish
Data source(s)
- Chemicals Management Plan Monitoring and Surveillance programme
Rationale for sub indicator selection
- Cadmium bioaccumulates in fish at concentrations higher than in the water
- Levels in fish may provide insight into the amount of cadmium that is bioavailable in the environment
Result
- Mostly decreasing, but trends differ by species and by waterbody
Gaps/considerations/limitations
- Little data on sublethal toxicological effects, and difficult to determine given confounding effects of other substances to which fish are exposed
- Concentrations were highest amongst prey species of fish but monitoring program is designed to focus on top predators
- Higher concentrations in cadmium in fish from some areas may be due to regional differences in water conditions that influence bioavailability
Conclusion and recommendations
- Not enough information is available to determine whether cadmium levels are adversely impacting fish, but generally levels in fish are decreasing. Higher cadmium body burdens were found in fish near current and former mining areas, and in areas with intentional fertilizer application
- Fish are good indicators of the amount of cadmium that is bioavailable in the environment and entering the food chain
- Monitoring prey species should continue and is important in assessing risks of toxics that bioaccumulate but do not biomagnify
Sub indicator: Cadmium levels in wildlife
Data source(s)
- Ecotoxicology research
- Northern Contaminants Program
Rationale for inclusion
- Trends of cadmium levels in wildlife inform on the relative bioavailability of cadmium in the environment at locations across Canada and over time
- Exceedances of threshold concentrations in wildlife tissue can inform on whether cadmium is having adverse effects on the environment
Result
- Levels mostly remained the same or slightly declined. No increasing trends found
- Levels found in Canadian wildlife typically below threshold tissue concentrations in literature, but sub chronic effects may be present at lower levels
Limitations and considerations
- Limited information available on sublethal toxicological effects and difficult to determine given confounding effects of other substances to which wildlife are exposed
Conclusion and recommendations
- Cadmium levels have generally remained stable or slightly decreased over time. Most cadmium levels were below thresholds for greater risk of sublethal toxicological effects, but sub chronic effects may be present
- Limited measurements exist for cadmium near point-sources of release and further study may be warranted
Indicator A3: Trends in cadmium levels released from industrial sources and number of exceedances of release guidelines/criteria (as applicable) over time
Data source(s)
- Canadian Environmental and Sustainability Indicators reports
- Environmental effects monitoring under regulatory requirements
- Chemicals Management Plan municipal wastewater and municipal biosolids monitoring data
Rationale for inclusion
- Examining the number of exceedances of applicable guidelines or criteria can indicate whether industrial releases are entering the environment in levels that may be harmful to aquatic life
- Land application of sewage sludge was a source of concern identified in PSL Assessment. An analysis of trends and/or comparison to guidelines or other limits/requirements for land application will help to inform whether municipal biosolids applied to land contain levels that may pose risks to the environment
- Monitoring of wastewater data may be useful to show trends in upstream inputs to municipal wastewater systems from industrial sources and consumer products
Result
- Effluent from pulp and paper and mining operations was generally not acutely toxic
- Effluents from pulp and paper facilities have been shown to impact exposure areas, but the role of specific metals in the impacts is unknown
- Cadmium levels in mining reference and effluent exposure areas in some cases were higher than those expected to cause adverse effects
- Cadmium levels in municipal biosolids used as compost and other land applications are typically below standards for unrestricted use
Limitations and considerations
- Levels in wastewater were unable to be compared to environmental quality guidelines because data on hardness was not available
Conclusion and recommendations
- Effluents are generally not acutely toxic, but may still be impacting the environment in exposure areas. Further investigation into the composition of effluent from pulp and paper facilities is warranted to determine the cause of impacts in exposure areas
- Cadmium levels in reference and exposure areas of mining facilities were higher than those expected to cause adverse effects. Further investigation into these sites is recommended particularly where the short-term exposure guidelines were exceeded
- Municipal biosolids are most often applied to land, concentrations vary depending on land use. Most biosolids intended for compost or land application are below levels expected to cause adverse effects to the environment
- Levels of cadmium in wastewater and biosolids are related to inputs in the sewershed, and are specific to each wastewater treatment facility. Levels in influent are higher than ambient fresh water, indicating that there are inputs from human activities
B. Indicators to assess the risk management objective: to achieve the lowest level of anthropogenic releases of inorganic cadmium compounds that are technically and economically feasible, taking into consideration socioeconomic factors
Indicator B1: Trends in cadmium releases, disposals and transfers by sectors of concern and trends in number of facilities reporting on cadmium by sector
Data source(s)
- Release inventories (NPRI, APEI)
Rationale for indicator selection
- Trends in release data will show whether progress has been made to reduce anthropogenic releases
- When read with trends in the number of facilities reporting releases, the data can indicate whether there has been progress due to improvements in facility processes or whether the trends in release were simply influenced by more or less facilities reporting
Result
- Most cadmium is released to air
- Significant declines in releases since 1994 despite increasing number of facilities reporting releases, but declines slowing since late 2000s
- Releases are mostly coming from sectors of concern, but release profile is changing
- Increase in amount of cadmium transferred off-site for waste treatment
- Increase in on-site disposals by landfilling and decrease in off-site disposals
Limitations and considerations
- Only facilities who meet NPRI reporting thresholds are obligated to report releases
- Not all facilities/sources that release cadmium are required to report
- Trends may be influenced by external factors (for example, price of materials; facility closures)
- Inventories are based on industry reports and calculated emission factors. Errors in reporting or calculations are possible
- Inventory data provides information on the total amount of releases from a given facility, but does not provide information about the intensity of cadmium in releases at a given time, dilution factors, or environmental conditions at point of release
- Facilities may change the NAICS code used to report releases to NPRI from year to year based on what they consider to be their primary activity. This is problematic for tracking sector releases over time, though releases can still be followed on a facility-by-facility level
Conclusions and recommendations
- Most cadmium releases come from sectors of concern and releases from the sectors of concern have declined considerably from 1994 levels
- More facilities are reporting releases. For most sectors, this has not resulted in an increase in emissions from the sector, as the average amount of cadmium releases from facilities have declined over time, though declines have slowed over recent years
- The profile of cadmium releases is slowly changing. Notably, residential/commercial/institutional heating and manufacturing (mostly via pulp and paper production facilities) play a much larger role in the release profile in 2020 than in 1994. Releases from wastewater treatment facilities did not show a significant trend which may indicate further investigation into wastewater inputs is warranted
- More cadmium is being disposed of on-site by more hazardous waste facilities. Landfilling accounts for the majority of on-site disposal operations and most operations are completed by hazardous waste facilities
- The amount of cadmium transferred has also increased. More waste is being transferred for treatment before final disposal
- Further investigation into sources/sectors of releases that have not shown declines may be appropriate to determine whether additional risk management actions are warranted. Investigations into sources of release that make up a significant portion of the release profile and that were not considered in the 1994 Assessment may also be warranted
- The Government should work to resolve the issue of changing NAICS codes in consultation with industry as appropriate
Indicator B2: Trends in releases from product use and disposal
Data sources
- Municipal solid waste landfill leachate monitoring
- Consultant reports
- Municipal wastewater and biosolid sampling
- Chemicals Management Plan Monitoring and Surveillance programme
- NPRI data
Rationale for indicator selection
- Solid waste was identified as a source of concern in the PSL Assessment
- Municipal solid waste landfill leachate data may provide information on trends of cadmium use in upstream sources like consumer products and/or industrial sources
- Analysis using observed municipal wastewater effluent releases to make estimates of total releases from a facility may be useful in order to compare with estimated release values as reported to NPRI
- Municipal wastewater and biosolids data may provide information on trends of cadmium use in upstream sources like products or industrial sources
- Trends in releases from waste management facilities and wastewater facilities are likely a function of cadmium content in influent or waste materials received
- Disposal and transfer data from the inventory can also provide information on the amount of cadmium received from industries/industrial processes
Result
- Cadmium was detected in less than half of municipal solid waste landfill leachate samples
- No clear trends in landfill leachate levels over time
- No clear links between cadmium levels in water or biosolids and, volume processed and percentage of commercial/industrial vs residential inputs to wastewater system
- Cadmium concentrations in wastewater effluent are low and similar to levels found through environmental monitoring of surface water
- Municipal biosolids are used or disposed of appropriately
- No trends in quantity of cadmium disposed of from wastewater treatment plants over time according to release inventory
- Releases from municipal wastewater treatment plants reported to NPRI have remained relatively unchanged
- Releases from hazardous waste landfills reporting to NPRI are intermittent and very small
- About half of cadmium disposed of from municipal wastewater treatment are destined for land application, likely via biosolids according to NPRI
- NPRI shows that disposals of cadmium from hazardous waste treatment facilities are increasing over time. Most is sent to hazardous waste landfills
- NPRI shows that the amount of cadmium transferred to hazardous waste treatment facilities has also increased over time, while the amount of cadmium transferred to municipal wastewater treatment plants via releases to sewage systems has no significant trends.
Limitations and considerations
- Data collection was limited to 13 municipal solid waste landfills with a permitted fill rate of 40,000 tonnes per year, no less than 1,000,000 tonnes in place, and operational leachate collection systems
- It may take several years for cadmium to leach from materials into leachate
- The Government’s sampling program does not provide enough data to analyze in wastewater and biosolids over time, but provides a general picture of cadmium levels in Canadian wastewater effluent and municipal biosolids
- Small sample may not allow for correlations or patterns to be identified
- Residential inputs and non-NPRI reporting facilities are not captured in disposal and transfer data
- Only hazardous waste landfills reported cadmium releases to NPRI
Conclusion and recommendations
- No trends in landfill leachate levels were detected, suggesting that there have not been changes in the amount of cadmium containing waste disposed of at municipal solid waste landfills
- Municipal solid waste landfills do not appear to be a large sources of cadmium releases, although there were no data to report on potential releases from smaller landfills or those without leachate capture systems
- Periodic landfill leachate monitoring may be useful for future evaluations as it may take several years for cadmium to leach out of waste. NPRI reported increased amounts of cadmium being sent to hazardous waste landfills, this may be mirrored in municipal solid waste landfills, but no NPRI data on cadmium releases and transfers was available for municipal solid waste facilities
- Wastewater treatment effectively removes cadmium from influent and removal efficiency vary depending on treatment methods
- Municipal wastewater effluent levels are often below detection limits and within the range of values recorded by surface water quality monitoring
- The lack of correlation between concentrations of cadmium found in municipal wastewater influent and municipal biosolids and the percentage of industrialized activity in the sewershed suggest that cadmium in products may be the primary source of releases to the aquatic environment
- Waste management facilities and wastewater treatment facilities receive cadmium from industrial and residential sources
- Wastewater is the primary source of cadmium releases to water and the amount of cadmium reported to be received from industrial facilities is much less than recorded cadmium releases, suggesting substantial input from products or non-NPRI reporting industrial activities
- No trends in releases from wastewater facilities or amount of cadmium disposed of by wastewater treatment facilities may suggest that residential inputs from products have remain unchanged
- Hazardous waste landfills receive a lot of cadmium in waste from industrial activities, but report only small amounts of cadmium releases
- More cadmium is being transferred to specialized hazardous waste treatment facilities. This may suggest better management of hazardous waste containing cadmium where treatment reduces leaching potential and bioavailability
Indicator B3: Number and proportion of facilities implementing Best Available Technologies/Best Environmental Practices (BAT/BEP)
Data source(s)
- Consultations with ECCC staff on sector implementation rates of BAT/BEP guidelines or Codes of Practice
- Instrument performance reports
- Reports from industry, academic, provincial/territorial or other sources, where available
Rationale for inclusion
- The level of implementation of BAT/BEP will show whether industrial facilities are taking action to minimize releases to the environment
Result
- The implementation of federal guidelines, Codes of Practice and other voluntary measures are not typically tracked
- Reporting for the base metals smelting and refining sector suggests that most facilities are implementing the Code of Practice which includes BAT/BEP
- Reports from the iron and steel industry indicated that implementation of the Codes of Practice varied widely between facilities, but a follow up survey found most facilities conformed to the Code which includes BAT/BEP
Limitations and considerations
- The government does not collect information on implementation of measures in voluntary guidelines, Codes of Practice, or older pollution prevention planning notices
Conclusion and recommendations
- Integrating the implementation of guidelines and Codes of Practice into performance agreements or P2 notices provides key data for risk management decisions
- Where Codes of Practice have been developed, it appears that they are being implemented by facilities but the extent of the implementation of the Code and its recommendations for BAT/BEP is unclear
- The Government should better track implementation of BAT/BEP to aid in assessment of whether releases to the environment are the lowest feasible
C. Indicators to assess risk communication efforts
Indicator C1: Number of communication materials published that discuss the risks of cadmium to the environment and/or the federal government’s cadmium-related risk management actions
Data source(s)
- Search of ECCC publications and social media posts
- Statistics on public access of communications for cadmium related information
- Web page views, social media metrics (likes, shares, comments etc.)
Rationale for inclusion
- Number of publications will show the level of effort to communicate risks and risk management to the public
- Statistics or metrics on access and engagement with published content will indicate whether the public is interested in this information and how effectively the content reached its intended audience
Result
- Only two relevant social media postings were found
- Social media metrics are not tracked
- Two webpages dedicated to cadmium were found in addition to the 1994 assessment report
- Primary cadmium webpage has more than 200 new page views per year, appears to be increasing
- Other information on multiple pollutants including cadmium was found in CESI reports, APEI report, PAWPIT and pages dedicated to specific risk management instruments
- Data is available through the Open Data Portal and inventory web pages
- Recent comments related to risk assessment of cadmium were received
Limitations and considerations
- Webpage data only available beginning in October 2019
Conclusion and recommendations
- Information on cadmium and risk management were spread across ECCC pages. Web pages need to be kept up to date and the Toxic Substances List Page for cadmium should be the hub for linking to other resources
- Newly developed interactive tools like PAWPIT, NPRI and CESI dashboards and maps can help to make it easier for the public to find information relevant areas important to them
- Environmental data is available online, but no analysis is available. Without knowledge, ability, equipment and time to analyze environmental data, it is not easy for the public to access meaningful information about contaminant levels in their environment
- The public does have an interest in cadmium in the environment. More efforts should be made to communicate work on the risk management of this substance and the success of these efforts should be tracked to allow for improvements as necessary
Status of implementation of recommendations from Strategic Options Reports
Base metals smelting
Recommendation #1 – release reduction targets and schedules: reduce total releases of CEPA substance from the base metal smelting sector by 80% from 1988 levels by the year 2008 and by 90% beyond 2008 through the application of technically and economically feasible methods.
Implemented: Yes
Comments: Cadmium releases in 1988 were 133 tonnes and were 20 tonnes in 2008, a reduction of 85%. Cadmium reductions exceeded 90% after 2010.
Recommendation #2 – environmental standards: develop Canada-wide environmental ambient air and water quality guidelines for substances of relevance to the base metal smelting sector; develop appropriate environmental source performance guidelines for discharges to water and air taking into account best available pollution prevention techniques and control technologies economically achievable for new and existing smelters no later than year 2000; develop protocols for measurement and reporting of releases; provide appropriate opportunities for stakeholder involvement in development of environmental guidelines and protocols.
Implemented: Yes
Comments: Canada-wide environmental quality guidelines developed for water by CCME and the 2006 Code of Practice recommended ambient air quality objectives.
Performance guidelines were developed by the Code of Practice published in 2006.
Protocols for measurement and reporting of releases developed through NPRI.
Stakeholders have opportunities to comment on environmental quality guidelines and were involved in development of Code of Practice. The public also had opportunities to comment on all federal risk management measures implemented for the sector.
Recommendation #3 – site-specific environmental management plans: develop and implement site-specific environmental management plans for each facility and evaluate the effectiveness of this plans in 2001.
Implemented: Yes
Comments: Pollution Prevention Planning Notices were required for each facility in 2006. The performance of the plans was evaluated through performance reporting.
Recommendation #4 – consistent data and reporting: develop and implement standard reference methods for release monitoring, quality assurance/quality control, and independent verification of the system for monitoring and reporting of data.
Implemented: Yes
Comments: Reference methods and reporting guidance were developed. Facility reports verified by Environment Canada.
- Hatch Associates Ltd., Guidance Document for Reporting Releases from the Base Metals Smelting Sector, prepared for Environment Canada, October 2001
- Environment Canada, Reference Methods for Source Testing: Measurement of Releases of Particulate from Stationary Sources, Report EPS 1/RM/8, December 1993
Recommendation #5 – Federal-Provincial cooperation: develop a coordinated approach that avoids duplication in the implementation of environmental measures for the sector.
Implemented: Yes
Comments: Federal approach was to set targets for reduction, but not to regulate implementation of environmental measures so as to avoid duplication and reduce regulatory burden. Performance agreements were developed under the Air Quality Management System, a collaborative approach between Federal and Provincial governments.
Recommendation #8 – research and development: undertake cooperative scientific research programs to characterize smelter releases, validate predictive models, investigate environmental behaviours and effects, and identify and develop pollution prevention opportunities and technologies.
Implemented: Yes
Comments: In the development of the Code of Practice for the sector, the Government commissioned several reports to collect information and assist in the development of environmental standards, best practices, and available pollution prevention opportunities and technologies. Additionally, Environment Canada held two public national workshops on the performance of the base metals sector and the development of environmental performance standards for the sector.
As part of the Performance Agreements developed, facilities agreed to:
- participate in a working group with representatives from federal and provincial governments, other companies in the base metals sector, and the Mining Association of Canada, with a particular focus on releases of key metals, fine particulate matter and fugitive particulate matter
- participate in bilateral discussions with Environment and Climate Change Canada to discuss reports and results and to identify possible methods to further reduce emissions; and
- report on progress towards implementing applicable recommendations in the Code of Practice
Working group activities such as regular meetings and bilateral discussions take place each year and will continue.
Recommendation #10 – public review: initiate a public review process to assess the implementation and effectiveness of the recommendations of the SOR in 2001 focusing on the management of CEPA substances released by BMSS to determine if further action is needed.
Implemented: No
Comments: No public review to assess the implementation of the SOR was completed, but reviews of risk management instruments were conducted and made available online.
Steel manufacturing
Recommendation #4 - metal emissions to air: reduce emissions of toxic metals through the adoption of a CCME Code of Practice by December 1998 that includes emission guidelines; standardized emissions measuring, monitoring and reporting practice; and best management practices for achieving continuous improvement in design, operation and maintenance of air pollution control systems. Additionally, source-specific targets and scheduled should be developed for two facilities.
Implemented: Yes
Comments: Codes of Practice were published in 2000 for both integrated and non-integrated steel mills which include guidelines and targets for emissions.
Recommendation #5 – metal effluents to water: reduce wastewater releases of toxic metals from non-integrated mills through the development and adoption of a CCME Code of Practice by December 1998 that includes effluent release guidelines; standardized effluent measuring, monitoring and reporting practices; and best management practices for achieving continuous improvement in the design, operation and maintenance of water pollution control systems. No recommendation was made for wastewater effluents from integrated mills since it was expected that facilities would already be implementing best available technologies and practices to control releases of metals by 1998.
Implemented: Yes
Comments: Codes of Practice were published in 2000 for both integrated and non-integrated steel mills which include guidelines and targets for effluent.
Recommendation #7 – emissions from sintering plants: develop an enhanced voluntary program to reduce emissions of dioxins and furans, arsenic, cadmium, lead and mercury at the Algoma Sintering Plant by December, 1997. This program would include emissions reductions targets and schedules for these substances and be consistent with the Toxic Substances Management Policy. It was also recommended that an emission management program be conducted at the Stelco Hilton Works Sintering Plant and that the results be reported to the Province of Ontario and Environment Canada.
Implemented: No
Comments: A Canada-wide Standard for Dioxins and Furans from iron sintering plants was published in 2003. The iron sintering plant closed in the mid 2000s and no further actions were implemented.
Recommendation #10 – pollution prevention plans: steel manufacturing sector facilities should prepare and implement pollution prevention plans.
Implemented: Yes
Comments: The Codes of Practice recommended pollution prevention plans be implemented by facilities. Subsequently, a Pollution Prevention Planning Notice entered into effect in 2017.
Recommendation #12 – ministerial review: the Government of Canada should develop a report on the implementation and effectiveness of the recommendations and relevant provincial toxics management programs that is submitted to the Ministers of Environment and Health by March 1999, so that regulatory action or further non-regulatory action can be taken, as appropriate.
Implemented: No
Comments: No report on the implementation and effectiveness of the recommendations and relevant provincial programs was developed. However, the 2003 report Environment Canada commissioned by Stratos Inc. included information on provincial toxic management programs and their status of implementation as well as the status of the implementation of the Codes of Practice for integrated and non-integrated steel mills.
Annex 2 – Supplemental information on cadmium in the environment
Passive air sampling
A small polyurethane foam (PUF) disk in a double-bowl housing is used to sample ambient air over the course of two months or more. This sampler design captures particulate matter less than 10 μm size, with most particles being smaller than 2.5 μm (Markovic et al., 2015). The collected particulate matter is then analyzed and estimates can be made to determine the average concentration of cadmium in the air over that time period. While this technique has been used for several years to measure organic contaminants in air, it has only recently been proven to also be effective for trace metals like cadmium (Gaga et al., 2019). This type of sampling offers several advantages over traditional methods in terms of cost, maintenance, ease of use and no need for electricity or infrastructure. However, passive sampling is semi-quantitative and it is not possible with the time-integrated samples to review data collected at a specific day or time.
Gaga et al. (2019) set up passive sampling devices at six locations in the Greater Toronto Area in spring, 2017. The results are reported as the mass of the cadmium captured per gram of PUF in the bar graphs in the figure below. In general, the highest concentrations for cadmium were found at the site near the Ontario Ministry of the Environment Conservation and Parks office building (MECP), which is influenced by emissions from highway traffic (Highways 401 and 400), and represents a location with one of the highest daily vehicle transit rates in North America. The second highest concentrations were measured at the Kennedy (KE) and Downsview (DV) locations, which are moderately impacted by traffic emissions and/or emissions from local industrial and residential sources. The next highest level was at the Burlington site (BUR), which is within a few kilometers of both industrial emissions and highway traffic. Ambient concentrations of cadmium were lowest at the two residential sites in North York (NY) and North Toronto (NT). Emissions at these two sites are expected to be from residential sources and local traffic. The corresponding air concentrations (not reported in Gaga et al. 2019) estimated using generic sampling rate of passive air sampler (4m3/day) are 0.55 (MECP), 0.36 (KE), 0.20 (DV), 0.13 (BU), 0.06 (NY) and 0.05 (NT) ng/m3 (listed on Figure A2-1)
In 2019, Environment and Climate Change Canada researchers measured trace metals at six sites that are part of the department’s Global Atmospheric Passive Sampling (GAPS) program. These sites are in Toronto, ON; Alert, NU; Whistler, BC; Fraserdale, ON; Ucluelet, BC; and Longwoods, ON. Aside from the urban Toronto site, and rural Longwoods site, the other sites are representative of remote background regions.
A full year (that is, a time integrated 1-year sample representing approximately 1500 m3 air) passive air samples collected under the GAPS program found that Longwoods, ON had the highest concentration (0.373 ng/m3), followed by Toronto, ON (0.129 ng/m3), Whistler, BC (0.006 ng/m3), Ucluelet, BC (0.005 ng/m3), and Fraserdale, ON (0.005 ng/m3). The Longwoods sight is in a rural location surrounded by forest and agricultural activities. Unfortunately, the sample from Alert, NU appears to have been contaminated and could not be considered for this analysis. The passive samplers show a large difference between the concentrations found in background sites compared with urban and rural areas.
Figure A2-1 Concentrations of trace elements in air from passive samplers in the Greater Toronto Area from Gaga et al. 2019

Long description
A map of the Greater Toronto Area showing the locations of the passive sampling study conducted by Gaga et al. and bar charts for gold, cadmium and uranium concentrations measured at each location in ng/g of PUF. The values listed in brackets are corresponding cadmium air concentration (ng/m3) for each site measured for the sampling period of 2 months (Feb-Mar, 2017).
Fresh water quality monitoring
| Site code | Number of samples | Number of exceedances | Percentage of exceedances | CESI classification | Pearse drainage area |
|---|---|---|---|---|---|
| MA05OB0001 | 143 | 13 | 9.09 | Agriculture | Assiniboine-Red |
| MA05OC0001 | 429 | 24 | 5.59 | Agriculture | Assiniboine-Red |
| SA05JM0014 | 160 | 0 | 0.00 | Agriculture | Assiniboine-Red |
| SA05MD0002 | 181 | 1 | 0.55 | Agriculture | Assiniboine-Red |
| US05NF0001 | 109 | 0 | 0.00 | Agriculture | Assiniboine-Red |
| AL06AD0001 | 169 | 3 | 1.78 | Agriculture | Churchill |
| SA06AF0001 | 117 | 2 | 1.71 | Reference | Churchill |
| SA06EA0003 | 42 | 0 | 0.00 | Mixed forestry/mining | Churchill |
| BC08ND0003 | 242 | 2 | 0.83 | Reference | Columbia |
| BC08NE0001 | 682 | 2 | 0.29 | Mixed forestry/mining | Columbia |
| BC08NE0029 | 163 | 0 | 0.00 | Mixed forestry/mining | Columbia |
| BC08NF0001 | 258 | 0 | 0.00 | Mixed forestry/mining | Columbia |
| BC08NH0005 | 277 | 3 | 1.08 | Mixed forestry/mining | Columbia |
| BC08NK0003 | 324 | 11 | 3.40 | Mixed forestry/mining | Columbia |
| BC08NN0021 | 254 | 0 | 0.00 | Mixed forestry/mining | Columbia |
| BC08KA0007 | 313 | 0 | 0.00 | Reference | Fraser-Lower mainland |
| BC08KE0010 | 372 | 0 | 0.00 | Mixed forestry/mining | Fraser-Lower mainland |
| BC08LE0004 | 356 | 10 | 2.81 | Mixed forestry/mining | Fraser-Lower mainland |
| BC08LF0001 | 280 | 4 | 1.43 | Mixed forestry/mining | Fraser-Lower mainland |
| BC08MC0001 | 357 | 44 | 12.32 | Mixed forestry/mining | Fraser-Lower mainland |
| BC08MF0001 | 322 | 35 | 10.87 | Mixed forestry/mining | Fraser-Lower mainland |
| BC08MH0027 | 408 | 0 | 0.00 | Populated | Fraser-Lower mainland |
| NW07OB0002 | 50 | 4 | 8.00 | Reference | Lower Mackenzie |
| NW10ED0001 | 68 | 17 | 25.00 | Mixed forestry/mining | Lower Mackenzie |
| NW10ED0002 | 76 | 18 | 23.68 | Mixed forestry/mining | Lower Mackenzie |
| NW10FB0006 | 69 | 0 | 0.00 | Mixed forestry/mining | Lower Mackenzie |
| NW10JC0001 | 33 | 2 | 6.06 | Reference | Lower Mackenzie |
| NW10KA0001 | 67 | 18 | 26.87 | Reference | Lower Mackenzie |
| NW10LA0003 | 64 | 15 | 23.44 | Reference | Lower Mackenzie |
| YT10AA0001 | 185 | 0 | 0.00 | Mixed forestry/mining | Lower Mackenzie |
| MA05KH0001 | 160 | 0 | 0.00 | Agriculture | Lower Saskatchewan-Nelson |
| SA05KH0002 | 162 | 1 | 0.62 | Agriculture | Lower Saskatchewan-Nelson |
| SA05LC0001 | 126 | 2 | 1.59 | Agriculture | Lower Saskatchewan-Nelson |
| NS01DC0001 | 110 | 0 | 0.00 | Populated | Maritime coastal |
| NS01DC0203 | 69 | 1 | 1.45 | Mixed forestry/mining | Maritime coastal |
| NS01DD0016 | 101 | 0 | 0.00 | Populated | Maritime coastal |
| NS01DL0009 | 15 | 2 | 13.33 | Reference | Maritime coastal |
| NS01DR0001 | 56 | 0 | 0.00 | Mixed forestry/mining | Maritime coastal |
| NS01EA0001 | 55 | 8 | 14.55 | Mixed forestry/mining | Maritime coastal |
| NS01EC0005 | 57 | 1 | 1.75 | Reference | Maritime coastal |
| NS01ED0005 | 268 | 1 | 0.37 | Mixed forestry/mining | Maritime coastal |
| NS01ED9111 | 15 | 0 | 0.00 | Reference | Maritime coastal |
| NS01EF0002 | 56 | 1 | 1.79 | Mixed forestry/mining | Maritime coastal |
| NS01EJ0001 | 102 | 0 | 0.00 | Populated | Maritime coastal |
| NS01EJ0157 | 111 | 0 | 0.00 | Populated | Maritime coastal |
| NS01EO0001 | 56 | 0 | 0.00 | Mixed forestry/mining | Maritime coastal |
| NS01FB0001 | 57 | 1 | 1.75 | Mixed forestry/mining | Maritime coastal |
| NS01FC0004 | 56 | 5 | 8.93 | Reference | Maritime coastal |
| PE01CB0143 | 42 | 0 | 0.00 | Agriculture | Maritime coastal |
| NF02XA0001 | 53 | 3 | 5.66 | Reference | Newfoundland-Labrador |
| NF02YE0005 | 66 | 0 | 0.00 | Reference | Newfoundland-Labrador |
| NF02YG0001 | 73 | 0 | 0.00 | Reference | Newfoundland-Labrador |
| NF02YJ0004 | 104 | 0 | 0.00 | Mixed forestry/mining | Newfoundland-Labrador |
| NF02YL0012 | 79 | 0 | 0.00 | Reference | Newfoundland-Labrador |
| NF02YM0003 | 45 | 3 | 6.67 | Mixed forestry/mining | Newfoundland-Labrador |
| NF02YM0004 | 47 | 0 | 0.00 | Reference | Newfoundland-Labrador |
| NF02YN0001 | 65 | 0 | 0.00 | Reference | Newfoundland-Labrador |
| NF02YO0107 | 69 | 44 | 63.77 | Mixed forestry/mining | Newfoundland-Labrador |
| NF02YO0121 | 58 | 1 | 1.72 | Populated | Newfoundland-Labrador |
| NF02YQ0006 | 39 | 2 | 5.13 | Mixed forestry/mining | Newfoundland-Labrador |
| NF02YQ0030 | 84 | 0 | 0.00 | Mixed forestry/mining | Newfoundland-Labrador |
| NF02YR0001 | 38 | 0 | 0.00 | Reference | Newfoundland-Labrador |
| NF02YS0011 | 64 | 1 | 1.56 | Reference | Newfoundland-Labrador |
| NF02ZK0005 | 85 | 1 | 1.18 | Reference | Newfoundland-Labrador |
| NF02ZL0029 | 70 | 0 | 0.00 | Reference | Newfoundland-Labrador |
| NF02ZM0009 | 73 | 1 | 1.37 | Populated | Newfoundland-Labrador |
| NF02ZM0178 | 95 | 4 | 4.21 | Populated | Newfoundland-Labrador |
| NF02ZM0181 | 100 | 3 | 3.00 | Populated | Newfoundland-Labrador |
| NF03NF0013 | 52 | 6 | 11.54 | Reference | Newfoundland-Labrador |
| NF03OC0012 | 54 | 6 | 11.11 | Reference | Newfoundland-Labrador |
| NF03OE0001 | 56 | 4 | 7.14 | Mixed forestry/mining | Newfoundland-Labrador |
| NF03OE0030 | 64 | 5 | 7.81 | Reference | Newfoundland-Labrador |
| NF03PB0025 | 56 | 6 | 10.71 | Reference | Newfoundland-Labrador |
| NF03QC0001 | 46 | 6 | 13.04 | Reference | Newfoundland-Labrador |
| AL05DA0001 | 177 | 0 | 0.00 | Reference | North Saskatchewan |
| AL05EF0003 | 180 | 15 | 8.33 | Agriculture | North Saskatchewan |
| BC08NL0005 | 403 | 8 | 1.99 | Mixed forestry/mining | Okanagan-Similkameen |
| BC08NM0001 | 203 | 0 | 0.00 | Populated | Okanagan-Similkameen |
| QU02LB9001 | 157 | 6 | 3.82 | Mixed forestry/mining | Ottawa |
| AK08DC0001 | 285 | 139 | 48.77 | Mixed forestry/mining | Pacific coastal |
| BC08EF0001 | 323 | 14 | 4.33 | Mixed forestry/mining | Pacific coastal |
| BC08GA0010 | 361 | 1 | 0.28 | Reference | Pacific coastal |
| BC08HA0018 | 379 | 1 | 0.26 | Populated | Pacific coastal |
| BC08HB0019 | 389 | 3 | 0.77 | Mixed forestry/mining | Pacific coastal |
| BC08HD0004 | 421 | 0 | 0.00 | Mixed forestry/mining | Pacific coastal |
| AL07AA0015 | 58 | 0 | 0.00 | Reference | Peace-Athabasca |
| AL07AA0023 | 61 | 0 | 0.00 | Reference | Peace-Athabasca |
| AL05AK0001 | 177 | 14 | 7.91 | Agriculture | South Saskatchewan |
| AL05BA0011 | 172 | 0 | 0.00 | Reference | South Saskatchewan |
| AL05BE0013 | 175 | 0 | 0.00 | Reference | South Saskatchewan |
| AL05CK0001 | 179 | 26 | 14.53 | Populated | South Saskatchewan |
| QU02NG3020 | 111 | 3 | 2.70 | Reference | St. Lawrence |
| QU02OB9004 | 132 | 10 | 7.58 | Populated | St. Lawrence |
| QU02OD9009 | 132 | 13 | 9.85 | Populated | St. Lawrence |
| QU02PH9024 | 156 | 3 | 1.92 | Populated | St. Lawrence |
| MA05PF0022 | 90 | 0 | 0.00 | Mixed forestry/mining | Winnipeg |
| YT09AB0008 | 155 | 1 | 0.65 | Mixed forestry/mining | Yukon |
| YT09DD0008 | 150 | 125 | 83.33 | Reference | Yukon |
| YT09EA0001 | 139 | 7 | 5.04 | Mixed forestry/mining | Yukon |
Fish
| Waterbody | Station | Species | Average Cd (mg/kg) | Min Cd (mg/kg) | Max Cd (mg/kg) | SD Cd |
|---|---|---|---|---|---|---|
| Columbia River, BC* | N/A | Rainbow trout | 0.0393 | 0.0116 | 0.0778 | 0.0191 |
| Columbia River, BC* | N/A | Walleye | 0.0237 | 0.0012 | 0.0574 | 0.0108 |
| Frederick Lake, BC | N/A | Dolly varden | 0.0328 | 0.0187 | 0.0564 | 0.0154 |
| Frederick Lake, BC | N/A | Prickly sculpin | 0.0619 | N/A | N/A | N/A |
| Frederick Lake, BC | N/A | Sculpin Sp. | 0.0712 | N/A | N/A | N/A |
| Frederick Lake, BC | N/A | Threespine stickleback | 0.0775 | N/A | N/A | N/A |
| Frederick Lake, BC | N/A | Cutthroat trout | 0.0220 | 0.0106 | 0.0576 | 0.0106 |
| Salsbury Lake, BC | N/A | Rainbow trout | 0.0668 | 0.0282 | 0.3480 | 0.0716 |
| Kusawa Lake, YK* | N/A | Lake trout | 0.0184 | 0.0065 | 0.0781 | 0.0116 |
| Kusawa Lake, YK* | N/A | Round whitefish | 0.0368 | 0.0213 | 0.0632 | 0.0114 |
| Great Bear Lake, NWT* | N/A | Lake trout | 0.0052 | 0.0017 | 0.0190 | 0.0040 |
| Buffalo Lake, AB | N/A | Northern pike | 0.0011 | 0.0004 | 0.0017 | 0.0004 |
| Buffalo Lake, AB | N/A | White sucker | 0.0014 | 0.0009 | 0.0019 | 0.0007 |
| Cold Lake, AB* | N/A | Lake trout | 0.0023 | 0.0007 | 0.0313 | 0.0047 |
| Forestburg Reservoir, AB | N/A | Northern pike | 0.0020 | 0.0014 | 0.0027 | 0.0006 |
| Forestburg Reservoir, AB | N/A | White sucker | 0.0030 | 0.0019 | 0.0046 | 0.0010 |
| Lake Athabasca, AB* | N/A – combined | Lake trout | 0.0054 | 0.0011 | 0.0277 | 0.0047 |
| Lake Athabasca, AB* | East | Lake trout | 0.0020 | 0.0011 | 0.0060 | 0.0008 |
| Lake Athabasca, AB* | West | Lake trout | 0.0087 | 0.0036 | 0.0277 | 0.0046 |
| Boundary Reservoir, SK | N/A | White sucker | 0.0091 | 0.0040 | 0.0193 | 0.0048 |
| Boundary Reservoir, SK | N/A | Yellow perch | 0.0040 | 0.0034 | 0.0051 | 0.0010 |
| Granite Lake, SK | N/A | White sucker | 0.0326 | 0.0139 | 0.0694 | 0.0176 |
| Lake Diefenbaker, SK* | N/A | Walleye | 0.0041 | 0.0009 | 0.0080 | 0.0014 |
| Lake La Loche, SK | N/A | Lake whitefish | 0.0031 | 0.0011 | 0.0091 | 0.0023 |
| Reindeer Lake, SK* | N/A | Lake trout | 0.0022 | 0.0012 | 0.0043 | 0.0007 |
| Phantom Lake, MB | N/A | Lake whitefish | 0.1100 | 0.0410 | 0.2480 | 0.0604 |
| Phantom Lake, MB | N/A | Northern pike | 0.0157 | 0.0063 | 0.0472 | 0.0116 |
| Phantom Lake, MB | N/A | Round whitefish | 0.0554 | 0.0079 | 0.1170 | 0.0329 |
| Lake Winnipeg, MB* | North basin | Walleye | 0.0040 | 0.0025 | 0.0061 | 0.0010 |
| Lake Winnipeg, MB* | South basin | Lake whitefish | 0.0096 | 0.0089 | 0.0103 | 0.0010 |
| Lake Winnipeg, MB* | South basin | Sauger | 0.0041 | 0.0026 | 0.0068 | 0.0012 |
| Lake Winnipeg, MB* | South basin | Walleye | 0.0062 | 0.0035 | 0.0172 | 0.0023 |
| Lake Winnange, ON | N/A | Cisco | 0.0150 | 0.0096 | 0.0185 | 0.0027 |
| Lake Winnange, ON | N/A | Lake trout | 0.0108 | 0.0060 | 0.0212 | 0.0043 |
| Lake Erie, ON* | East | Lake trout | 0.0096 | 0.0042 | 0.0278 | 0.0042 |
| Lake Erie, ON* | East | Rainbow smelt | 0.0458 | 0.0203 | 0.0658 | 0.0135 |
| Lake Erie, ON* | West | Emerald shiner | 0.0781 | 0.0509 | 0.1260 | 0.0267 |
| Lake Erie, ON* | West | Rainbow smelt | 0.0449 | 0.0168 | 0.0829 | 0.0196 |
| Lake Erie, ON* | West | Round goby | 0.0732 | N/A | N/A | N/A |
| Lake Erie, ON* | West | Trout perch | 0.1036 | 0.0891 | 0.1180 | 0.0204 |
| Lake Erie, ON* | West | Walleye | 0.0254 | 0.0094 | 0.1010 | 0.0154 |
| Lake Erie, ON* | West | Yellow perch | 0.0569 | 0.0432 | 0.0859 | 0.0130 |
| Lake Huron, ON* | Goderich | Bloater | 0.0686 | 0.0187 | 0.1370 | 0.0414 |
| Lake Huron, ON* | Goderich | Deepwater sculpin | 0.0247 | 0.0203 | 0.0295 | 0.0027 |
| Lake Huron, ON* | Goderich | Lake trout | 0.0092 | 0.0021 | 0.0332 | 0.0059 |
| Lake Huron, ON* | Goderich | Rainbow smelt | 0.0203 | 0.0141 | 0.0301 | 0.0050 |
| Lake Huron, ON* | Goderich | Round goby | 0.0326 | 0.0311 | 0.0341 | 0.0021 |
| Lake Huron, ON* | North Channel | Lake trout | 0.0072 | 0.0033 | 0.0450 | 0.0056 |
| Lake Huron, ON* | North Channel | Rainbow smelt | 0.0456 | 0.0206 | 0.0611 | 0.0108 |
| Lake Huron, ON* | Owen Sound | Deepwater sculpin | 0.0470 | 0.0370 | 0.0611 | 0.0118 |
| Lake Huron, ON* | Owen Sound | Lake trout | 0.0091 | 0.0028 | 0.0280 | 0.0059 |
| Lake Huron, ON* | Owen Sound | Rainbow smelt | 0.0437 | 0.0283 | 0.0639 | 0.0123 |
| Lake Ontario, ON* | Central basin | Alewife | 0.0548 | 0.0438 | 0.0740 | 0.0118 |
| Lake Ontario, ON* | Central basin | Lake trout | 0.0063 | 0.0016 | 0.0353 | 0.0046 |
| Lake Ontario, ON* | Central basin | Rainbow smelt | 0.0176 | 0.0089 | 0.0252 | 0.0052 |
| Lake Ontario, ON* | Central basin | Slimy sculpin | 0.0598 | 0.0433 | 0.0727 | 0.0135 |
| Lake Ontario, ON* | Eastern basin | Lake trout | 0.0051 | 0.0017 | 0.0119 | 0.0023 |
| Lake Ontario, ON* | Eastern basin | Rainbow smelt | 0.0159 | 0.0096 | 0.0263 | 0.0048 |
| Lake Ontario, ON* | Eastern basin | Round goby | 0.0327 | 0.0272 | 0.0381 | 0.0039 |
| Lake Ontario, ON* | Niagara-on-the Lake | Alewife | 0.0602 | 0.0470 | 0.0693 | 0.0091 |
| Lake Ontario, ON* | Niagara-on-the Lake | Lake trout | 0.0053 | 0.0015 | 0.0118 | 0.0024 |
| Lake Ontario, ON* | Niagara-on-the Lake | Rainbow smelt | 0.0173 | 0.0061 | 0.1240 | 0.0234 |
| Lake Ontario, ON* | Niagara-on-the Lake | Round goby | 0.0139 | 0.0083 | 0.0226 | 0.0040 |
| Lake Ontario, ON* | Port Credit | Lake trout | 0.0051 | 0.0012 | 0.0111 | 0.0019 |
| Lake Ontario, ON* | Port Credit | Rainbow smelt | 0.0177 | 0.0070 | 0.0330 | 0.0090 |
| Lake Ontario, ON* | Port Credit | Slimy sculpin | 0.0717 | 0.0522 | 0.0847 | 0.0172 |
| Lake Superior, ON* | Marathon | Deepwater sculpin | 0.0625 | 0.0542 | 0.0690 | 0.0061 |
| Lake Superior, ON* | Marathon | Lake trout | 0.0215 | 0.0031 | 0.0697 | 0.0172 |
| Lake Superior, ON* | Marathon | Pygmy whitefish | 0.1310 | |||
| Lake Superior, ON* | Marathon | Rainbow smelt | 0.0397 | 0.0121 | 0.0528 | 0.0143 |
| Lake Superior, ON* | Thunder Bay | Bloater | 0.0379 | 0.0270 | 0.0599 | 0.0128 |
| Lake Superior, ON* | Thunder Bay | Deepwater sculpin | 0.0282 | 0.0225 | 0.0345 | 0.0047 |
| Lake Superior, ON* | Thunder Bay | Lake trout | 0.0146 | 0.0068 | 0.0555 | 0.0080 |
| Lake Superior, ON* | Thunder Bay | Rainbow smelt | 0.0636 | 0.0359 | 0.0974 | 0.0178 |
| Lake Superior, ON* | Whitefish | Cisco | 0.1620 | |||
| Lake Superior, ON* | Whitefish | Deepwater sculpin | 0.0945 | 0.0710 | 0.1270 | 0.0240 |
| Lake Superior, ON* | Whitefish | Lake trout | 0.0216 | 0.0084 | 0.0583 | 0.0112 |
| Lake Superior, ON* | Whitefish | Rainbow smelt | 0.0824 | 0.0107 | 0.1260 | 0.0253 |
| Lac Edouard, QC | N/A | Brook trout | 0.0412 | 0.0122 | 0.0794 | 0.0181 |
| Lac Edouard, QC | N/A | Brown bullhead | 0.0605 | 0.0284 | 0.1200 | 0.0235 |
| Lac Edouard, QC | N/A | Common shiner | 0.0405 | 0.0315 | 0.0478 | 0.0060 |
| Lac Edouard, QC | N/A | Creek Chub | 0.1420 | N/A | N/A | N/A |
| Lac Edouard, QC | N/A | Cyprinidae | 0.0189 | N/A | N/A | N/A |
| Lac Edouard, QC | N/A | Lake trout | 0.0460 | 0.0165 | 0.0822 | 0.0147 |
| Lac Edouard, QC | N/A | Pearl dace | 0.0632 | N/A | N/A | N/A |
| Lac Edouard, QC | N/A | Rainbow smelt | 0.0504 | 0.0466 | 0.0541 | 0.0053 |
| Lac Edouard, QC | N/A | Shiner species | 0.0984 | 0.0702 | 0.1280 | 0.0236 |
| Lac Memphrémagog, QC | N/A | Lake trout | 0.0014 | 0.0005 | 0.0027 | 0.0008 |
| Lac Ouescapis, QC | N/A | Emerald shiner | 0.0556 | 0.0488 | 0.0668 | 0.0089 |
| St. Lawrence River, QC* | Cap-Santé | Walleye | 0.0060 | 0.0026 | 0.0140 | 0.0027 |
| St. Lawrence River, QC* | Cap-Santé | Yellow perch | 0.0052 | 0.0025 | 0.0106 | 0.0031 |
| St. Lawrence River, QC | St. Nicholas | Walleye | 0.0144 | 0.0010 | 0.4080 | 0.0656 |
| Lower Salmon River, NB | N/A | Chain pickerel | 0.0060 | 0.0031 | 0.0117 | 0.0023 |
| Lower Salmon River, NB | N/A | Lake chub | 0.0150 | 0.0107 | 0.0210 | 0.0038 |
| Lower Salmon River, NB | N/A | White perch | 0.0875 | 0.0391 | 0.1600 | 0.0470 |
| Lower Salmon River, NB | N/A | Yellow perch | 0.0303 | 0.0236 | 0.0357 | 0.0055 |
| Kejimkujik Lake, NS* | N/A | Brook trout | 0.0341 | 0.0159 | 0.0647 | 0.0110 |
| Kejimkujik Lake, NS* | N/A | Shiner species | 0.1077 | 0.1030 | 0.1110 | 0.0042 |
| Kejimkujik Lake, NS* | N/A | White perch | 0.0656 | 0.0336 | 0.1630 | 0.0293 |
| Kejimkujik Lake, NS* | N/A | Yellow perch | 0.0378 | 0.0130 | 0.0960 | 0.0225 |
| Loon Lake, NS | N/A | Brook trout | 0.0324 | 0.0266 | 0.0415 | 0.0080 |
| Lake Champlain, NY | N/A | Lake trout | 0.0014 | 0.0008 | 0.0020 | 0.0004 |
* Current monitoring sites.
| Lake | Station | Species | Years | Equation | R2 | p |
|---|---|---|---|---|---|---|
| Lake Superior | Thunder Bay | Lake trout | 2007 to 2018 | Log(Cd Trout) = 64.42 - 0.034*Year | 0.23 | 0.34 |
| Lake Superior | Thunder Bay | Rainbow smelt | 1983 to 2018 | Log(Cd Smelt) = -24.59 + 0.011*Year | 0.23 | 0.09 |
| Lake Superior | Whitefish Bay | Lake trout | 2008 to 2018 | Cd Trout = -0.046 + 0.00003*Year | 0.01 | 0.75 |
| Lake Superior | Whitefish Bay | Rainbow smelt | 1983 to 2018 | Cd Smelt = -1.59 + 0.0008*Year | 0.15 | 0.12 |
| Lake Huron | North Channel | Rainbow smelt | 1991 to 2018 | Log(Cd Smelt) = 113.50 - 0.058*Year | 0.58 | 0.003 |
| Lake Huron | Georgian Bay | Rainbow smelt | 1979 to 2017 | Log(Cd Smelt) = 23.84 - 0.013*Year | 0.20 | 0.15 |
| Lake Huron | Goderich | Lake trout | 2001 to 2018 | Log(Cd trout) = 206.02 - 0.105*Year | 0.63 | 0.003 |
| Lake Huron | Goderich | Rainbow smelt | 1991 to 2018 | Log(Cd smelt) = 102.88 - 0.053*Year | 0.65 | 0.0002 |
| Lake Huron | Goderich | Deepwater sculpin | 1988 to 2018 | Cd Sculpin = 1.04 - 0.0005*Year | 0.16 | 0.21 |
| Lake Erie | Western Erie | Walleye | 2009 to 2016 | Cd walleye = -2.49 + 0.001*Year | 0.36 | 0.12 |
| Lake Erie | Western Erie | Rainbow smelt | 1978 to 2014 | Cd smelt = 2.43 - 0.0012*Year | 0.30 | 0.05 |
| Lake Erie | Eastern Erie | Lake trout | 2006 to 2014 | Log(Cd trout) = 129.68 - 0.067*Year | 0.57 | 0.018 |
| Lake Erie | Eastern Erie | Rainbow smelt | 1978 to 1999 | Log(Cd smelt) = -32.26 + 0.015*Year | 0.25 | 0.12 |
| Lake Erie | Eastern Erie | Rainbow smelt | 2006 to 2013 | Log(Cd smelt) = 118.56 - 0.060*Year | 0.26 | 0.01 |
| Lake Ontario | NOTL | Lake trout | 2006 to 2018 | Log(Cd Trout) = 71.25 - 0.038*Year | 0.21 | 0.13 |
| Lake Ontario | NOTL | Rainbow smelt | 1978 to 2018 | Log(Cd smelt) = 34.88 - 0.019*Year | 0.26 | 0.007 |
| Lake Ontario | Western Ontario | Lake trout | 2006 to 2018 | Log(Cd Trout) = -48.05 + 0.021*Year | 0.10 | 0.33 |
| Lake Ontario | Western Ontario | Rainbow smelt | 1978 to 2018 | Log(Cd Smelt) = 23.26 - 0.013*Year | 0.10 | 0.11 |
| Lake Ontario | Central Ontario | Lake trout | 2006 to 2018 | Log(Cd Trout) = 36.15 - 0.021*Year | 0.09 | 0.40 |
| Lake Ontario | Central Ontario | Rainbow smelt | 1978 to 2018 | Log(Cd Smelt) = 31.91 - 0.018*Year | 0.24 | 0.02 |
| Lake Ontario | Central Ontario | Alewife | 1985 to 2017 | Log(Cd Alewife) = -55.61 + 0.026*Year | 0.20 | 0.13 |
| Lake Ontario | Central Ontario | Slimy sculpin | 1982 to 2018 | Log(Cd Sculpin) = -5.17 + 0.001*Year | 0.001 | 0.89 |
| Lake Ontario | Eastern Ontario | Lake trout | 2006 to 2015 | Log(Cd trout) = 62.10 - 0.033*Year | 0.24 | 0.15 |
| Lake Ontario | Eastern Ontario | Rainbow smelt | 1978 to 2012 | Cd smelt = 1.28 - 0.0006*Year | 0.56 | <0.001 |
| Lake Ontario | Eastern Ontario | Slimy sculpin | 1978 to 2006 | Log(Cd sculpin) = 130.01 - 0.067*Year | 0.73 | <0.001 |
Wildlife
| Reference number | Species | Location | Collection year(s) | Tissue | Sex | Mean Cd in ppm (mean type) |
DW converted value (ppm) |
n |
|---|---|---|---|---|---|---|---|---|
| 1 | Harp seal | Pangnirtung, NU | 1999 | Liver | na | 24.60 (geometric, dw) | na | 18 |
| 1 | Harp seal | Pangnirtung, NU | 1999 | Kidney | na | 89.90 (geometric, dw) | na | 18 |
| 2 | Arctic hare | Yellowknife, NT | 2016 | Liver | na | 0.49 (arithmetic, ww) | 1.96 | 10 |
| 2 | Arctic hare | Yellowknife, NT | 2016 | Kidney | na | 10.80 (arithmetic, ww) | 43.20 | 10 |
| 2 | Arctic hare | Yellowknife, NT | 2016 | Liver | na | 0.20 (arithmetic, ww) | 0.80 | 10 |
| 2 | Arctic hare | Yellowknife, NT | 2016 | Kidney | na | 2.98 (arithmetic, ww) | 11.92 | 10 |
| 3 | Arctic hare | Arctic Bay, NU | na | Liver | na | 0.58 (arithmetic, ww) | 2.32 | 7 |
| 3 | Arctic hare | Arctic Bay, NU | na | Kidney | na | 0.78 (arithmetic, ww) | 3.10 | 3 |
| 3 | Arctic hare | Arctic Bay, NU | na | Liver | na | 0.01 (arithmetic, ww) | 0.04 | 3 |
| 3 | Arctic hare | Arctic Bay, NU | na | Kidney | na | 0.02 (arithmetic, ww) | 0.06 | 2 |
| 4 | Lesser scaup | Erickson, MB | 2000 | Liver | F | 1.11 (geometric, dw) | na | 20 |
| 5 | Ring-billed gull | Montreal, QC | 2011, 2012, 2016 | Liver | M | 2.27 (arithmetic, dw) | na | 45 |
| 5 | Ring-billed gull | Montreal, QC | 2011, 2012, 2016 | Liver | F | 2.66 (arithmetic, dw) | na | 42 |
| 6 | Ringed seal | Sachs Harbour, NT | 2007–2011 | Liver | na | 4.31 (arithmetic, ww) | 14.96 | 9 |
| 6 | Ringed seal | Ulukhaktok, NU | 2010 | Liver | na | 6.24 (arithmetic, ww) | 21.65 | 16 |
| 6 | Ringed seal | Gjoa Haven, NU | 2008–2009 | Liver | na | 1.97 (arithmetic, ww) | 6.84 | 9 |
| 6 | Ringed seal | Resolute, NU | 2007–2011 | Liver | na | 6.91 (arithmetic, ww) | 23.98 | 33 |
| 6 | Ringed seal | Arviat, NU | 2007–2011 | Liver | na | 21.50 (arithmetic, ww) | 74.61 | 66 |
| 6 | Ringed seal | Inukjuaq, QC | 2007 | Liver | na | 13.10 (arithmetic, ww) | 45.46 | 5 |
| 6 | Ringed seal | Arctic Bay, NU | 2009 | Liver | na | 4.86 (arithmetic, ww) | 16.86 | 9 |
| 6 | Ringed seal | Grise Fjord, NU | 2008 | Liver | na | 6.76 (arithmetic, ww) | 23.46 | 7 |
| 6 | Ringed seal | Pond Inlet, NU | 2009 | Liver | na | 9.06 (arithmetic, ww) | 31.44 | 4 |
| 6 | Ringed seal | Nachvak Fjord, NL | 2008–2009 | Liver | na | 17.60 (arithmetic, ww) | 61.07 | 19 |
| 6 | Ringed seal | Anaktalak Bay, NL | 2008 | Liver | na | 14.30 (arithmetic, ww) | 49.62 | 4 |
| 6 | Ringed seal | Sachs Harbour, NT | 2007–2011 | Liver | na | 2.37 (arithmetic, ww) | 8.22 | 31 |
| 6 | Ringed seal | Ulukhaktok, NU | 2010 | Liver | na | 5.61 (arithmetic, ww) | 19.47 | 4 |
| 6 | Ringed seal | Gjoa Haven, NU | 2008–2009 | Liver | na | 3.10 (arithmetic, ww) | 10.76 | 12 |
| 6 | Ringed seal | Resolute, NU | 2007–2011 | Liver | na | 3.89 (arithmetic, ww) | 13.50 | 61 |
| 6 | Ringed seal | Arviat, NU | 2007–2011 | Liver | na | 13.80 (arithmetic, ww) | 47.89 | 58 |
| 6 | Ringed seal | Inukjuaq, QC | 2007 | Liver | na | 13.80 (arithmetic, ww) | 47.89 | 13 |
| 6 | Ringed seal | Arctic Bay, NU | 2009 | Liver | na | 2.75 (arithmetic, ww) | 9.54 | 9 |
| 6 | Ringed seal | Grise Fjord, NU | 2008 | Liver | na | 3.25 (arithmetic, ww) | 11.28 | 13 |
| 6 | Ringed seal | Pond Inlet, NU | 2009 | Liver | na | 4.11 (arithmetic, ww) | 14.26 | 12 |
| 6 | Ringed seal | Pangnirtung, NU | 2011 | Liver | na | 7.38 (arithmetic, ww) | 25.61 | 14 |
| 6 | Ringed seal | Nachvak Fjord, NL | 2008–2011 | Liver | na | 8.64 (arithmetic, ww) | 29.98 | 6 |
| 6 | Ringed seal | Anaktalak Bay, NL | 2008–2009 | Liver | na | 2.76 (arithmetic, ww) | 9.58 | 7 |
| 7 | Dovekie | Baffin Bay, NU | 1998 | Liver | na | 5.78 (arithmetic, ww) | 19.42 | 9 |
| 7 | Black-legged kittiwake | Baffin Bay, NU | 1998 | Liver | na | 8.62 (arithmetic, ww) | 28.96 | 10 |
| 7 | Black guillemot | Baffin Bay, NU | 1998 | Liver | na | 6.82 (arithmetic, ww) | 22.92 | 10 |
| 7 | Thick-billed murre | Baffin Bay, NU | 1998 | Liver | na | 12.84 (arithmetic, ww) | 43.14 | 10 |
| 7 | Ivory gull | Baffin Bay, NU | 1998 | Liver | na | 4.95 (arithmetic, ww) | 16.63 | 2 |
| 7 | Northern fulmar | Baffin Bay, NU | 1998 | Liver | na | 21.84 (arithmetic, ww) | 73.38 | 10 |
| 7 | Glaucous gull | Baffin Bay, NU | 1998 | Liver | na | 4.80 (arithmetic, ww) | 16.13 | 9 |
| 7 | Thayer's gull | Baffin Bay, NU | 1998 | Liver | na | 1.77 (ww) | 5.95 | 1 |
| 7 | Ringed seal | Baffin Bay, NU | 1998 | Liver | na | 6.16 (arithmetic, ww) | 21.38 | 9 |
| 8 | Ringed seal | Holman, NU | 2001 | Liver | na | 6.65 (arithmetic, ww) | 23.08 | 25 |
| 8 | Ringed seal | Holman, NU | 2001 | Kidney | na | 30.44 (arithmetic, ww) | 138.50 | 25 |
| 9 | Surf scoter | Southern coast, BC | 1998 to 2001 | Kidney | na | 17.84 (geometric, dw) | na | 72 |
| 10 | Mink | Various YT | 2001 to 2003 | Kidney | na | 0.22 (arithmetic, ww) | 0.88 | 39 |
| 11 | Beaver | Mackenzie River delta, NT | 1998 to 2001 | Liver | na | 10.00 (arithmetic, dw) | na | na |
| 11 | Beaver | Mackenzie River delta, NT | 1998 to 2001 | Kidney | na | 55.00 (arithmetic, dw) | na | na |
| 11 | Beaver | Slave River delta, NT | 1998 to 2001 | Liver | na | 6.60 (arithmetic, dw) | na | na |
| 12 | Moose | Various YT | 1994 to 2001 | Kidney | na | 28.11 (arithmetic, ww) | 85.18 | 384 |
| 12 | Moose | Various YT | 1994 to 1995 | Liver | na | 4.94 (arithmetic, ww) | 22.25 | 56 |
| 13 | Barren-ground caribou | Baffin Island herd, NU | 1991 to 2016 | Kidney | M | 16.90 (geometric, dw) | na | 16 |
| 13 | Barren-ground caribou | Bathurst herd, NT, NU | 1991 to 2016 | Kidney | M | 10.10 (geometric, dw) | na | 35 |
| 13 | Barren-ground caribou | Beverly herd, NT, NU, SK | 1991 to 2016 | Kidney | M | 27.10 (geometric, dw) | na | 16 |
| 13 | Barren-ground caribou | Bluenose East herd, NT, NU | 1991 to 2016 | Kidney | M | 22.80 (geometric, dw) | na | 22 |
| 13 | Barren-ground caribou | Cape Bathurst herd, NT | 1991 to 2016 | Kidney | M | 31.50 (geometric, dw) | na | 11 |
| 13 | Barren-ground caribou | Porcupine herd, YT, NT, AB | 1991 to 2016 | Kidney | M | 25.90 (geometric, dw) | na | 260 |
| 13 | Barren-ground caribou | Qamanirjuaq herd, NU, MB, SK | 1991 to 2016 | Kidney | M | 12.40 (geometric, dw) | na | 61 |
| 13 | Barren-ground caribou | Baffin Island herd, NU | 1991 to 2016 | Kidney | F | 20.40 (geometric, dw) | na | 27 |
| 13 | Barren-ground caribou | Bathurst herd, NT, NU | 1991 to 2016 | Kidney | F | 24.80 (geometric, dw) | na | 73 |
| 13 | Barren-ground caribou | Beverly herd, NT, NU, SK | 1991 to 2016 | Kidney | F | 39.80 (geometric, dw) | na | 51 |
| 13 | Barren-ground caribou | Bluenose East herd, NT, NU | 1991 to 2016 | Kidney | F | 51.80 (geometric, dw) | na | 16 |
| 13 | Barren-ground caribou | Porcupine herd, YT, NT, AB | 1991 to 2016 | Kidney | F | 39.10 (geometric, dw) | na | 249 |
| 13 | Barren-ground caribou | Qamanirjuaq herd, NU, MB, SK | 1991 to 2016 | Kidney | F | 21.70 (geometric, dw) | na | 69 |
| 14 | Tree swallow nestling | Fort McMurray, AB | 2012 | Liver | na | 0.02 (arithmetic, ww) | 0.06 | 15 |
| 14 | Tree swallow nestling | Fort McMurray, AB | 2012 | Liver | na | 0.01 (arithmetic, ww) | 0.02 | 23 |
| 14 | Tree swallow nestling | Fort McMurray, AB | 2013 | Liver | na | 0.04 (arithmetic, ww) | 0.13 | 25 |
| 14 | Tree swallow nestling | Fort McMurray, AB | 2013 | Liver | na | 0.02 (arithmetic, ww) | 0.06 | 27 |
| 14 | Tree swallow nestling | Fort McMurray, AB | 2012 | Kidney | na | 0.02 (arithmetic, ww) | 0.10 | 16 |
| 14 | Tree swallow nestling | Fort McMurray, AB | 2012 | Kidney | na | 0.01 (arithmetic, ww) | 0.03 | 20 |
| 14 | Tree swallow nestling | Fort McMurray, AB | 2013 | Kidney | na | 0.05 (arithmetic, ww) | 0.23 | 25 |
| 14 | Tree swallow nestling | Fort McMurray, AB | 2013 | Kidney | na | 0.03 (arithmetic, ww) | 0.13 | 28 |
| 15 | Arctic fox | Arviat, NU | 2001 | Kidney | na | 1.08 (arithmetic, ww) | 4.32 | 50 |
| 15 | Wolverine | Kugluktuk, NU | 1998 to 1999 | Kidney | na | 0.67 (arithmetic, ww) | 2.68 | 12 |
| 15 | Arctic fox | Ulukhaqtuuq, NT | 2000 | Liver | na | 0.21 (arithmetic, ww) | 0.84 | 6 |
| 15 | Arctic fox | Arviat, NU | 2001 | Liver | na | 0.18 (arithmetic, ww) | 0.72 | 36 |
| 15 | Wolverine | Kugluktuk, NU | 1998 to 1999 | Liver | na | 0.10 (arithmetic, ww) | 0.40 | 7 |
| 16 | Grey wolf | Various NT | 2005 to 2008 | Kidney | M | 0.84 (arithmetic, ww) | 3.36 | 17 |
| 16 | Grey wolf | Various NT | 2005 to 2008 | Kidney | F | 0.91 (arithmetic, ww) | 3.64 | 19 |
| 17 | Moose | Various BC | 2001 | Liver | na | 2.31 (arithmetic, ww) | 10.41 | 17 |
| 17 | Moose | Various BC | 2001 | Kidney | na | 7.59 (arithmetic, ww) | 23.00 | 6 |
| 18 | White-tailed deer | Various BC | 2008 to 2009 | Liver | na | 0.18 (arithmetic, ww) | 0.81 | 3 |
| 18 | Moose | Various BC | 2008 to 2009 | Kidney | na | 14.10 (arithmetic, ww) | 42.73 | 5 |
| 18 | Moose | Various BC | 2008 to 2009 | Liver | na | 2.85 (arithmetic, ww) | 12.84 | 7 |
| 19 | Moose | Southern Mackenzie Mountains, NT | 2012 to 2013 | Kidney | na | 48.30 (arithmetic, ww) | 146.36 | 32 |
| 19 | Mountain caribou | Southern Mackenzie Mountains, NT | 2012 to 2013 | Kidney | na | 13.90 (arithmetic, ww) | 42.12 | 26 |
| 19 | Dall's sheep | Southern Mackenzie Mountains, NT | 2012 to 2013 | Kidney | na | 2.53 (arithmetic, ww) | 7.67 | 59 |
| 19 | Mountain goat | Southern Mackenzie Mountains, NT | 2012 to 2013 | Kidney | na | 5.78 (arithmetic, ww) | 17.52 | 13 |
| 20 | Common eider | Table Bay, NL | 2008 | Liver | F | 39.64 (arithmetic, dw) | na | 10 |
| 20 | Common eider | East Bay, NU | 2008 | Liver | F | 49.63 (arithmetic, dw) | na | 10 |
| 20 | Common eider | Tern Island, NU | 2008 | Liver | F | 44.73 (arithmetic, dw) | na | 10 |
| 21 | Ring-billed gull | Qikiqtarjuaq, NU | 2001 | Liver | na | 7.30 (geometric, dw) | na | 8 |
| 21 | Common eider | Qikiqtarjuaq, NU | 2001 | Liver | na | 10.80 (geometric, dw) | na | 8 |
| 21 | Northern fulmar | Qikiqtarjuaq, NU | 2001 | Liver | na | 5.80 (geometric, dw) | na | 2 |
| 21 | Glaucous gull | Qikiqtarjuaq, NU | 2001 | Liver | na | 25.00 (dw) | na | 1 |
| 21 | Ringed seal | Qikiqtarjuaq, NU | 2001 | Liver | na | 26.60 (geometric, dw) | na | 2 |
| 22 | Mink | Walpole I./St. Clair River, ON | 1998 to 2006 | Liver | na | 0.21 (arithmetic, dw) | na | 10 |
| 22 | Mink | Lake St. Clair, ON | 1998 to 2006 | Liver | na | 0.23 (arithmetic, dw) | na | 4 |
| 22 | Mink | Detroit River, ON | 1998 to 2006 | Liver | na | 0.58 (arithmetic, dw) | na | 13 |
| 22 | Mink | Western Lake Erie, ON | 1998 to 2006 | Liver | na | 0.25 (arithmetic, dw) | na | 18 |
| 22 | Mink | Long Point, ON | 1998 to 2006 | Liver | na | 0.09 (arithmetic, dw) | na | 6 |
| 22 | Mink | Eastern Lake Erie, ON | 1998 to 2006 | Liver | na | 0.93 (arithmetic, dw) | na | 11 |
| 22 | Mink | Inland Erie, ON | 1998 to 2006 | Liver | na | 0.48 (arithmetic, dw) | na | 8 |
| 22 | Mink | Niagara River, ON | 1998 to 2006 | Liver | na | 0.32 (arithmetic, dw) | na | 14 |
| 22 | Mink | Hamilton Harbour, ON | 1998 to 2006 | Liver | na | 0.20 (arithmetic, dw) | na | 6 |
| 22 | Mink | Bay of Quinte, ON | 1998 to 2006 | Liver | na | 0.15 (arithmetic, dw) | na | 8 |
| 22 | Mink | Kingston, ON | 1998 to 2006 | Liver | na | 0.15 (arithmetic, dw) | na | 5 |
| 22 | Mink | Cornwall, ON | 1998 to 2006 | Liver | na | 0.17 (arithmetic, dw) | na | 23 |
| 22 | Mink | Inland Ontario, ON | 1998 to 2006 | Liver | na | 0.16 (arithmetic, dw) | na | 8 |
| 23 | Moose | Janvier, AB | 2012 | Kidney | F | 16.22 (arithmetic, ww) | 49.14 | 13 |
| 23 | Moose | Janvier, AB | 2012 | Liver | F | 3.54 (arithmetic, ww) | 15.94 | 13 |
| 23 | Moose | Janvier, AB | 2012 | Kidney | M | 7.68 (arithmetic, ww) | 23.28 | 13 |
| 23 | Moose | Janvier, AB | 2012 | Liver | M | 1.63 (arithmetic, ww) | 7.32 | 13 |
| 23 | Moose | Kinuso, AB | 2014 | Kidney | F | 20.38 (arithmetic, ww) | 61.74 | 4 |
| 23 | Moose | Kinuso, AB | 2014 | Liver | F | 2.14 (arithmetic, ww) | 9.65 | 3 |
| 23 | Moose | Kinuso, AB | 2014 | Kidney | M | 7.14 (arithmetic, ww) | 21.64 | 10 |
| 23 | Moose | Kinuso, AB | 2014 | Liver | M | 1.59 (arithmetic, ww) | 7.15 | 10 |
| 23 | Moose | Cold Lake, AB | 2016 | Kidney | F | 3.44 (arithmetic, ww) | 10.42 | 3 |
| 23 | Moose | Cold Lake, AB | 2016 | Liver | F | 0.82 (arithmetic, ww) | 3.67 | 3 |
| 23 | Moose | Cold Lake, AB | 2016 | Kidney | M | 5.10 (arithmetic, ww) | 15.45 | 6 |
| 23 | Moose | Cold Lake, AB | 2016 | Liver | M | 0.94 (arithmetic, ww) | 4.22 | 6 |
| 24 | Muskrat | Sudbury, ON | na | Liver | na | 0.44 (arithmetic, dw) | na | 23 |
| 24 | Muskrat | Sudbury, ON | na | Kidney | na | 1.81 (arithmetic, dw) | na | 23 |
| 24 | Muskrat | North Bay, ON | na | Liver | na | 0.25 (arithmetic, dw) | na | 10 |
| 24 | Muskrat | North Bay, ON | na | Kidney | na | 0.88 (arithmetic, dw) | na | 10 |
| 25 | Arctic hare | Dubawnt River, NU | 2003 | Liver | na | 4.58 (arithmetic, dw) | na | 9 |
| 25 | Arctic hare | Dubawnt River, NU | 2003 | Kidney | na | 106.60 (arithmetic, dw) | na | 9 |
| 25 | Arctic hare | Dubawnt River, NU | 2003 | Liver | na | 0.20 (arithmetic, dw) | na | 7 |
| 25 | Arctic hare | Dubawnt River, NU | 2003 | Kidney | na | 1.73 (arithmetic, dw) | na | 7 |
| 26 | Lesser scaup | Yellowknife, NT | 2004 to 2005 | Kidney | M | 9.20 (geometric, dw) | na | 39 |
| 27 | White-tailed deer | Various NS | 2000 to 2002 | Liver | na | 1.10 (geometric, dw) | na | 54 |
| 27 | Moose | Various NS | 2000 to 2002 | Liver | na | 5.80 (geometric, dw) | na | 48 |
| 27 | Moose | Various NS | 2000 to 2002 | Kidney | na | 60.40 (geometric, dw) | na | 21 |
| 28 | Caribou | Sheshatshit & Utshimassit, NL | 2001 | Kidney | na | 6.50 (geometric, ww) | 19.70 | 27 |
| 29 | Arctic tern | Nasaruvaalik Island, NU | 2007 | Liver | na | 14.40 (geometric, dw) | na | 41 |
| 30 | Black guillemot | Baffin Bay/Davis Strait, NU | 2018 | Liver | na | 10.34 (arithmetic, dw) | na | 28 |
| 30 | Black-legged kittiwake | Baffin Bay/Davis Strait, NU | 2018 | Liver | na | 16.07 (arithmetic, dw) | na | 18 |
| 30 | Northern fulmar | Baffin Bay/Davis Strait, NU | 2018 | Liver | na | 15.13 (arithmetic, dw) | na | 29 |
| 30 | Thick-billed murre | Baffin Bay/Davis Strait, NU | 2018 | Liver | na | 33.56 (arithmetic, dw) | na | 29 |
| 31 | Ringed seal | Sachs Harbour, NT | 2001 | Liver | na | 2.73 (arithmetic, ww) | 9.47 | 25 |
| 31 | Ringed seal | Holman, NU | 2001 | Liver | na | 6.07 (arithmetic, ww) | 21.06 | 25 |
| 31 | Ringed seal | Arctic Bay, NU | 2000 | Liver | na | 5.97 (arithmetic, ww) | 20.72 | 25 |
| 31 | Ringed seal | Grise Fjord, NU | 1998 | Liver | na | 6.73 (arithmetic, ww) | 23.35 | 20 |
| 31 | Ringed seal | Pond Inlet, NU | 2000 | Liver | na | 12.50 (arithmetic, ww) | 43.38 | 25 |
| 31 | Ringed seal | Sachs Harbour, NT | 2001 | Kidney | na | 11.00 (arithmetic, ww) | 50.05 | 24 |
| 31 | Ringed seal | Arctic Bay, NU | 2000 | Kidney | na | 25.10 (arithmetic, ww) | 114.21 | 25 |
| 31 | Ringed seal | Grise Fjord, NU | 1998 | Kidney | na | 22.50 (arithmetic, ww) | 102.38 | 20 |
| 31 | Ringed seal | Pond Inlet, NU | 2000 | Kidney | na | 32.20 (arithmetic, ww) | 146.51 | 23 |
| 32 | Caribou | Leaf River, QC | 1994 to 1996 | Liver | na | 1.18 (arithmetic, ww) | 5.32 | 176 |
| 32 | Caribou | Leaf River, QC | 1994 to 1996 | Kidney | na | 8.93 (arithmetic, ww) | 27.06 | 177 |
| 32 | Caribou | Leaf River, QC | 1994 to 1996 | Liver | na | 1.16 (arithmetic, ww) | 5.23 | 84 |
| 32 | Caribou | Leaf River, QC | 1994 to 1996 | Kidney | na | 6.73 (arithmetic, ww) | 20.39 | 86 |
| 32 | Caribou | George River-Torngat Mountains, QC | 1994 to 1996 | Liver | na | 0.94 (arithmetic, ww) | 4.23 | 28 |
| 32 | Caribou | George River-Torngat Mountains, QC | 1994 to 1996 | Kidney | na | 5.23 (arithmetic, ww) | 15.85 | 27 |
| 32 | Caribou | George River-Torngat Mountains, QC | 1994 to 1996 | Liver | na | 0.84 (arithmetic, ww) | 3.78 | 19 |
| 32 | Caribou | George River-Torngat Mountains, QC | 1994 to 1996 | Kidney | na | 3.93 (arithmetic, ww) | 11.91 | 19 |
| 33 | Willow ptarmigan | Kuujjuaq, QC | 1997 to 1998 | Kidney | M | 152.10 (arithmetic, dw) | na | 8 |
| 33 | Willow ptarmigan | Kuujjuaq, QC | 1997 to 1998 | Kidney | F | 123.20 (arithmetic, dw) | na | 14 |
| 33 | Willow ptarmigan | Kuujjuaq, QC | 1997 to 1998 | Kidney | na | 133.70 (arithmetic, dw) | na | 22 |
| 33 | Willow ptarmigan | Kuujjuaq, QC | 1997 to 1998 | Kidney | M | 213.90 (arithmetic, dw) | na | 12 |
| 33 | Willow ptarmigan | Kuujjuaq, QC | 1997 to 1998 | Kidney | F | 225.80 (arithmetic, dw) | na | 13 |
| 33 | Willow ptarmigan | Kuujjuaq, QC | 1997 to 1998 | Kidney | na | 220.10 (arithmetic, dw) | na | 25 |
| 33 | Willow ptarmigan | Kuujjuaq, QC | 1997 to 1998 | Liver | M | 19.10 (arithmetic, dw) | na | 8 |
| 33 | Willow ptarmigan | Kuujjuaq, QC | 1997 to 1998 | Liver | F | 20.50 (arithmetic, dw) | na | 14 |
| 33 | Willow ptarmigan | Kuujjuaq, QC | 1997 to 1998 | Liver | na | 20.00 (arithmetic, dw) | na | 22 |
| 33 | Willow ptarmigan | Kuujjuaq, QC | 1997 to 1998 | Liver | M | 32.70 (arithmetic, dw) | na | 12 |
| 33 | Willow ptarmigan | Kuujjuaq, QC | 1997 to 1998 | Liver | F | 29.20 (arithmetic, dw) | na | 13 |
| 33 | Willow ptarmigan | Kuujjuaq, QC | 1997 to 1998 | Liver | na | 30.90 (arithmetic, dw) | na | 25 |
| 33 | Rock ptarmigan | Kuujjuaq, QC | 1997 to 1998 | Kidney | M | 25.60 (arithmetic, dw) | na | 9 |
| 33 | Rock ptarmigan | Kuujjuaq, QC | 1997 to 1998 | Kidney | F | 34.40 (arithmetic, dw) | na | 8 |
| 33 | Rock ptarmigan | Kuujjuaq, QC | 1997 to 1998 | Kidney | na | 29.70 (arithmetic, dw) | na | 17 |
| 33 | Rock ptarmigan | Kuujjuaq, QC | 1997 to 1998 | Kidney | M | 58.80 (arithmetic, dw) | na | 8 |
| 33 | Rock ptarmigan | Kuujjuaq, QC | 1997 to 1998 | Kidney | F | 120.00 (arithmetic, dw) | na | 8 |
| 33 | Rock ptarmigan | Kuujjuaq, QC | 1997 to 1998 | Kidney | na | 89.40 (arithmetic, dw) | na | 16 |
| 33 | Rock ptarmigan | Kuujjuaq, QC | 1997 to 1998 | Liver | M | 5.58 (arithmetic, dw) | na | 9 |
| 33 | Rock ptarmigan | Kuujjuaq, QC | 1997 to 1998 | Liver | F | 4.10 (arithmetic, dw) | na | 8 |
| 33 | Rock ptarmigan | Kuujjuaq, QC | 1997 to 1998 | Liver | na | 4.90 (arithmetic, dw) | na | 17 |
| 33 | Rock ptarmigan | Kuujjuaq, QC | 1997 to 1998 | Liver | M | 7.90 (arithmetic, dw) | na | 8 |
| 33 | Rock ptarmigan | Kuujjuaq, QC | 1997 to 1998 | Liver | F | 9.20 (arithmetic, dw) | na | 8 |
| 33 | Rock ptarmigan | Kuujjuaq, QC | 1997 to 1998 | Liver | na | 8.50 (arithmetic, dw) | na | 16 |
| 34 | Deer mouse | Athabasca, AB | 2014 | Kidney | na | 0.08 (geometric, ww) | 0.30 | 17 |
| 34 | Deer mouse | Athabasca, AB | 2014 | Kidney | na | 0.04 (geometric, ww) | 0.15 | 10 |
| 34 | Meadow vole | Athabasca, AB | 2014 | Kidney | na | 0.10 (geometric, ww) | 0.38 | 4 |
| 34 | Meadow vole | Athabasca, AB | 2014 | Kidney | na | 0.03 (geometric, ww) | 0.13 | 9 |
| 35 | Polar bear | Beaufort Sea, NT/YT | 2007 | Liver | na | 0.59 (geometric, ww) | 1.87 | 38 |
| 35 | Polar bear | Lancanster/Jones Sound, NU | 2007 to 2008 | Liver | na | 0.49 (geometric, ww) | 1.54 | 13 |
| 35 | Polar bear | Baffin Bay, NU | 2007 to 2008 | Liver | na | 0.91 (geometric, ww) | 2.87 | 14 |
| 35 | Polar bear | Davis Strait, NU | 2008 | Liver | na | 0.82 (geometric, ww) | 2.60 | 8 |
| 36 | Polar bear | East Baffin Is, NU | 2002 | Liver | na | 0.62 (arithmetic, ww) | 1.97 | 13 |
| 36 | Polar bear | Lancaster Sound, NU | 2002 | Liver | na | 0.87 (arithmetic, ww) | 2.76 | 13 |
| 36 | Polar bear | Northern Baffin Is, NU | 2002 | Liver | na | 1.02 (arithmetic, ww) | 3.23 | 12 |
| 36 | Polar bear | Southeast Beaufort Sea, NT | 2002 | Liver | na | 0.35 (arithmetic, ww) | 1.11 | 11 |
| 37 | Common loon | Long Point, ON | 2005 | Liver | F | 3.11 (geometric, dw) | na | 18 |
| 37 | Common loon | Long Point, ON | 2005 | Liver | F | 1.36 (geometric, dw) | na | 11 |
| 37 | Common loon | Long Point, ON | 2005 | Liver | M | 1.07 (geometric, dw) | na | 18 |
| 37 | Common loon | Long Point, ON | 2005 | Liver | M | 0.94 (geometric, dw) | na | 6 |
| 38 | Beaver | Simcoe County, ON | 2014, 2017, 2018 | Liver | na | 2.90 (arithmetic, dw) | na | 5 |
| 38 | Beaver | Simcoe County, ON | 2014, 2017, 2018 | Kidney | na | 13.30 (arithmetic, dw) | na | 5 |
| 39 | Moose | Wollaston, SK | 1995 to 2002 | Liver | na | 0.62 (geometric, ww) | 2.80 | 9 |
| 39 | Moose | Hudson Bay, SK | 1995 to 2002 | Liver | na | 1.00 (geometric, ww) | 4.52 | 9 |
| 39 | Moose | Meadow Lake, SK | 1995 to 2002 | Liver | na | 0.91 (geometric, ww) | 4.08 | 21 |
| 40 | Harbour seal | Sandy Island, NL | 2001 | Liver | na | 0.15 (arithmetic, ww) | 0.51 | 6 |
| 40 | Harbour seal | Burgeo/Rose Blanche, NL | 2001 | Liver | na | 0.18 (arithmetic, ww) | 0.62 | 3 |
| 40 | Harbour seal | Placentia Bay, NL | 2001 | Liver | na | 9.60 (arithmetic, ww) | 33.29 | 27 |
| 40 | Harbour seal | Chance Cove/Renews, NL | 2001 | Liver | na | 1.60 (arithmetic, ww) | 5.57 | 5 |
| 40 | Harbour seal | St. Pauls, NL | 2001 | Liver | na | 0.63 (arithmetic, ww) | 2.18 | 25 |
| 40 | Harbour seal | Sandy Island, NL | 2001 | Kidney | na | 0.34 (arithmetic, ww) | 1.55 | 6 |
| 40 | Harbour seal | Burgeo/Rose Blanche, NL | 2001 | Kidney | na | 0.25 (arithmetic, ww) | 1.14 | 3 |
| 40 | Harbour seal | Placentia Bay, NL | 2001 | Kidney | na | 20.25 (arithmetic, ww) | 92.15 | 27 |
| 40 | Harbour seal | Chance Cove/Renews, NL | 2001 | Kidney | na | 6.82 (arithmetic, ww) | 31.01 | 5 |
| 40 | Harbour seal | St. Pauls, NL | 2001 | Kidney | na | 1.56 (arithmetic, ww) | 7.11 | 25 |
| 41 | Greater scaup | Hamilton Harbour, ON | 2006 to 2007 | Liver | na | 3.38 (arithmetic, dw) | na | na |
| 41 | Greater scaup | Hamilton Harbour, ON | 2006 to 2007 | Liver | na | 1.25 (arithmetic, dw) | na | na |
Reference number corresponds to references list following Table A2-6, mean type refers to calculation method based on dry weight (dw) or wet weight (ww) values, na – information not available, n – number of samples.
| Source | Species | Location | Collection year(s) | Tissue | Sex | Mean Cd (ppm) | DW converted value (ppm) | n |
|---|---|---|---|---|---|---|---|---|
| Chételat, J. (ECCC) | Common eider | Chisasibi, QC | 2017 | Liver | na | 33.27 | na | 3 |
| Chételat, J. (ECCC) | Common eider | Inukjuak, QC | 2016 | Liver | na | 16.52 | na | 4 |
| Chételat, J. (ECCC) | Common eider | Kuujjuaraapik, QC | 2014 to 2016 | Liver | na | 7.01 | na | 24 |
| Chételat, J. (ECCC) | Common eider | Sanikiluaq, NU | 2015 to 2016 | Liver | na | 17.26 | na | 16 |
| Chételat, J. (ECCC) | Common eider | Umiujaq, QC | 2015 to 2016 | Liver | na | 17.98 | na | 16 |
| Eng, M., Burgess, N. (ECCC) | Surf scoter | Northern Labrador, NL | 2005 | Liver | na | 2.47 | na | 11 |
| Eng, M., Burgess, N. (ECCC) | Surf scoter | Northern Labrador, NL | 2005 | Liver | na | 1.18 | na | 9 |
| Eng, M., Burgess, N. (ECCC) | Surf scoter | Northern Labrador, NL | 2005 | Liver | na | 1.89 | na | 20 |
| Eng, M., Burgess, N. (ECCC) | Common tern | Belledune, NB | 2010 | Liver | na | 1.86 | na | 7 |
| Eng, M., Burgess, N. (ECCC) | Northern fulmar | Sable Island, NS | 2005 | Liver | na | 27.03 | na | 14 |
| Eng, M., Burgess, N. (ECCC) | Northern fulmar | Sable Island, NS | 2005 | Liver | na | 20.98 | na | 21 |
| Eng, M., Burgess, N. (ECCC) | Northern fulmar | Sable Island, NS | 2005 | Liver | na | 23.19 | na | 36 |
| Eng, M., Burgess, N. (ECCC) | Common loon | Eastern Canada, NB, NS, PEI | 1998 to 2001 | Liver | na | 6.66 | na | 39 |
| Eng, M., Burgess, N. (ECCC) | Black scoter | Restigouche River, NB | 2004 | Liver | M | 4.79 | na | 11 |
| Eng, M., Burgess, N. (ECCC) | Oldsquaw | Eastern Canada, NL, NS | 1999-2000 | Liver | na | 2.77 | na | 32 |
| Eng, M., Burgess, N. (ECCC) | Common eider | Eastern Canada, NB, NL, NS | 1998 to 2000 | Liver | na | 5.56 | na | 52 |
| Eng, M., Burgess, N. (ECCC) | Black scoter | Various NS | 1999 to 2000 | Liver | na | 1.80 | na | 17 |
| Eng, M., Burgess, N. (ECCC) | Surf scoter | Various NS | 1999 to 2000 | Liver | na | 0.91 | na | 21 |
| Eng, M., Burgess, N. (ECCC) | White-winged scoter | Various NS | 1999 | Liver | na | 2.73 | na | 9 |
| Eng, M., Burgess, N. (ECCC) | Common goldeneye | Pictou Harbour, NS | 1999 to 2000 | Liver | na | 4.00 | na | 10 |
| Gurney, K., Wayland, M. (ECCC) | Common eider | Sanikiluaq, NU | 1997 | Kidney | F | 91.56 | na | 10 |
| Gurney, K., Wayland, M. (ECCC) | Common eider | Sanikiluaq, NU | 1997 | Liver | F | 18.54 | na | 10 |
| Gurney, K., Wayland, M. (ECCC) | Common eider | Southampton Is., NU | 1997 to 2000 | Kidney | na | 139.98 | na | 73 |
| Gurney, K., Wayland, M. (ECCC) | Common eider | Southampton Is., NU | 1997 to 2000 | Liver | na | 11.05 | na | 13 |
| Gurney, K., Wayland, M. (ECCC) | Common eider | Ulukhaktok, NU | 1997 | Kidney | F | 121.38 | na | 10 |
| Gurney, K., Wayland, M. (ECCC) | Common eider | Ulukhaktok, NU | 1997 | Liver | F | 16.51 | na | 10 |
| Gurney, K., Wayland, M. (ECCC) | King eider | Ulukhaktok, NU | 1997 | Kidney | F | 125.34 | na | 10 |
| Gurney, K., Wayland, M. (ECCC) | King eider | Ulukhaktok, NU | 1997 | Liver | F | 24.71 | na | 10 |
| Gurney, K., Wayland, M. (ECCC) | King eider | Southampton Is., NU | 1997 | Kidney | na | 165.30 | na | 10 |
| Gurney, K., Wayland, M. (ECCC) | King eider | Southampton Is., NU | 1997 | Liver | na | 30.84 | na | 10 |
| Letcher, R. (ECCC) | Polar bear | West Hudson Bay, MB, NU | 2012, 2016 | Liver | na | 3.59 | na | 21 |
| Letcher, R. (ECCC) | Polar bear | South Hudson Bay, NU | 2013, 2017 | Liver | na | 2.39 | na | 33 |
| Loseto, L. (DFO) | Beluga | Hendrickson Island, NT | 1994 to 1996, 2001 to 2003 | Liver | na | 2.42 (ww) | 8.66 | 132 |
| Loseto, L. (DFO) | Beluga | Hendrickson Island, NT | 1994 to 1996, 2001 | Kidney | na | 9.81 (ww) | 41.30 | 90 |
| Thomas, P. (ECCC) | Fisher | Northern AB | 2012 to 2015 | Liver | na | 0.43 | na | 63 |
| Thomas, P. (ECCC) | Marten | Northern AB | 2012 to 2015 | Liver | na | 1.11 | na | 120 |
| Thomas, P. (ECCC) | Mink | Northern AB | 2012 to 2018 | Liver | na | 0.19 | na | 67 |
| Thomas, P. (ECCC) | Muskrat | Northern AB | 2013 to 2017 | Liver | na | 0.10 | na | 32 |
| Thomas, P. (ECCC) | Otter | Northern AB | 2012 to 2018 | Liver | na | 0.05 | na | 157 |
(arithmetic mean (dry weight unless noted as wet weight (ww)), na – information not available, n – number of samples)
| Animal type | Tissue | Conversion Factor | Reference |
|---|---|---|---|
| Seabirds | Liver | 3.36 | Dietz et al., 1996 a |
| Seabirds | Kidney | 4.02 | Dietz et al., 1996 a |
| Seals | Liver | 3.47 | Dietz et al., 1996 a |
| Seals | Kidney | 4.55 | Dietz et al., 1996 a |
| Whales | Liver | 3.57 | Dietz et al., 1996 a |
| Whales | Kidney | 4.21 | Dietz et al., 1996 a |
| Polar Bear | Liver | 3.17 | Dietz et al., 1996 a |
| Terrestrial mammals excluding ungulates | Liver | 4.00 | Eccles et al., 2017 b |
| Terrestrial mammals excluding ungulates | Kidney | 4.00 | Eccles et al., 2017 b |
| Ungulates | Liver | 4.50 | Gamberg et al., 2016 c |
| Ungulates | Kidney | 3.03 | Gamberg et al., 2016 c |
| Terrestrial birds | Liver | 3.06 | Scanlon, P.F., 1982 d |
| Terrestrial birds | Kidney | 4.27 | Scanlon, P.F., 1982 d |
a Dietz, R., Riget, F. and Johansen, P. (1996). Lead, cadmium, mercury and selenium in Greenland marine animals. Science of the Total Environment, 186(1-2), 67-93.
b Eccles, K. M., Thomas, P. J. and Chan, H. M. (2017). Predictive meta‐regressions relating mercury tissue concentrations of freshwater piscivorous mammals. Environmental toxicology and chemistry, 36(9), 2377-2384.
c Gamberg, M., Cuyler, C. and Wang, X. (2016). Contaminants in two West Greenland caribou populations. Science of the Total Environment, 554, 329-336.
d Scanlon, P. F. (1982). Wet and dry weight relationships of mallard (Anas platyrhynchos) tissues. Bulletin of environmental contamination and toxicology, 29(5), 615-617.
References for Table A2-4
1) Agusa, T., Nomura, K., Kunito, T., Anan, Y., Iwata, H., & Tanabe, S. (2011). Accumulation of trace elements in harp seals (Phoca groenlandica) from Pangnirtung in the Baffin Island, Canada. Marine Pollution Bulletin, 63(5–12), 489–499.
2) Amuno, S., Jamwal, A., Grahn, B., & Niyogi, S. (2018). Chronic arsenicosis and cadmium exposure in wild snowshoe hares (Lepus americanus) breeding near Yellowknife, Northwest Territories (Canada), part 1: Evaluation of oxidative stress, antioxidant activities and hepatic damage. Science of the Total Environment, 618, 916–926.
3) Amuno, S., Niyogi, S., Amuno, M., & Attitaq, J. (2016). Heavy metal bioaccumulation and histopathological alterations in wild Arctic hares (Lepus arcticus) inhabiting a former lead-zinc mine in the Canadian high Arctic: A preliminary study. Science of the Total Environment, 556, 252–263.
4) Anteau, M. J., Afton, A. D., Custer, C. M., & Custer, T. W. (2007). Relationships of cadmium, mercury, and selenium with nutrient reserves of female lesser scaup (Aythya affinis) during winter and spring migration. Environmental Toxicology and Chemistry, 26(3), 515–520.
5) Brown, L., Rosabal, M., Sorais, M., Poirier, A., Widory, D., & Verreault, J. (2019). Habitat use strategy influences the tissue signature of trace elements including rare earth elements in an urban-adapted omnivorous bird. Environmental Research, 168, 261–269.
6) Brown, T. M., Fisk, A. T., Wang, X., Ferguson, S. H., Young, B. G., Reimer, K. J., & Muir, D. C. G. (2016). Mercury and cadmium in ringed seals in the Canadian Arctic: Influence of location and diet. Science of the Total Environment, 545–546, 503–511.
7) Campbell, L. M., Norstrom, R. J., Hobson, K. A., Muir, D. C. G., Backus, S., & Fisk, A. T. (2005). Mercury and other trace elements in a pelagic Arctic marine food web (Northwater Polynya, Baffin Bay). Science of the Total Environment, 351–352, 247–263.
8) Dehn, L. A., Sheffield, G. G., Follmann, E. H., Duffy, L. K., Thomas, D. L., Bratton, G. R., … O’Hara, T. M. (2005). Trace elements in tissues of phocid seals harvested in the Alaskan and Canadian Arctic: Influence of age and feeding ecology. Canadian Journal of Zoology, 83(5), 726–746.
9) Elliott, J. E., Harris, M. L., Wilson, L. K., Smith, B. D., Batchelor, S. P., & Maguire, J. (2007). Butyltins, trace metals and morphological variables in surf scoter (Melanitta perspicillata) wintering on the south coast of British Columbia, Canada. Environmental Pollution, 149(1), 114–124.
10) Gamberg, M., Boila, G., Stern, G., & Roach, P. (2005). Cadmium, mercury and selenium concentrations in mink (Mustela vison) from Yukon, Canada. Science of the Total Environment, 351–352, 523–529.
11) Gamberg, M., Braune, B., Davey, E., Elkin, B., Hoekstra, P. F., Kennedy, D., … Zeeb, B. (2005). Spatial and temporal trends of contaminants in terrestrial biota from the Canadian Arctic. Science of the Total Environment, 351–352, 148–164.
12) Gamberg, M., Palmer, M., & Roach, P. (2005). Temporal and geographic trends in trace element concentrations in moose from Yukon, Canada. Science of the Total Environment, 351–352, 530–538.
13) Gamberg, M., Pratte, I., Brammer, J., Cuyler, C., Elkin, B., Gurney, K., … Provencher, J. F. (2020). Renal trace elements in barren-ground caribou subpopulations: Temporal trends and differing effects of sex, age and season. Science of the Total Environment, 724.
14) Godwin, C. M., Smits, J. E. G., & Barclay, R. M. R. (2016). Metals and metalloids in nestling tree swallows and their dietary items near oilsands mine operations in Northern Alberta. Science of the Total Environment, 562, 714–723.
15) Hoekstra, P. F., Braune, B. M., Elkin, B., Armstrong, F. A. J., & Muir, D. C. G. (2003). Concentrations of selected essential and non-essential elements in arctic fox (Alopex lagopus) and wolverines (Gulo gulo) from the Canadian Arctic. Science of the Total Environment, 309(1–3), 81–92.
16) Hoffmann, S. R., Blunck, S. A., Petersen, K. N., Jones, E. M., Koval, J. C., Misek, R., … Harper, R. G. (2010). Cadmium, copper, iron, and zinc concentrations in kidneys of grey wolves, Canis lupus, from Alaska, Idaho, Montana (USA) and the Northwest Territories (Canada). Bulletin of Environmental Contamination and Toxicology, 85(5), 481–485.
17) Jin, A., & Joseph-Quinn, K. M. (2004). Consumption guideline for cadmium in moose meat in northern British Columbia, Canada. International Journal of Circumpolar Health, 63 Suppl 2, 169–173.
18) Laird, B. D., & Chan, H. M. (2013). Bioaccessibility of metals in fish, shellfish, wild game, and seaweed harvested in British Columbia, Canada. Food and Chemical Toxicology, 58, 381–387.
19) Larter, N. C., Macdonald, C. R., Elkin, B. T., Wang, X., Harms, N. J., Gamberg, M., & Muir, D. C. G. (2016). Cadmium and other elements in tissues from four ungulate species from the Mackenzie Mountain region of the Northwest Territories, Canada. Ecotoxicology and Environmental Safety, 132, 9–17.
20) Mallory, M. L., Braune, B. M., Robertson, G. J., Gilchrist, H. G., Mallory, C. D., Forbes, M. R., & Wells, R. (2014). Increasing cadmium and zinc levels in wild common eiders breeding along Canada’s remote northern coastline. Science of the Total Environment, 476–477, 73–78.
21) Mallory, M. L., Wayland, M., Braune, B. M., Drouillard, K. G. (2004). Trace elements in marine birds, arctic hare and ringed seals breeding near Qikiqtarjuaq, Nunavut, Canada. Marine Pollution Bulletin, 46, 135-141.
22) Martin, P. A., McDaniel, T. V., Hughes, K. D., & Hunter, B. (2011). Mercury and other heavy metals in free-ranging mink of the lower Great Lakes basin, Canada, 1998-2006. Ecotoxicology, 20(7), 1701–1712.
23) McAuley, C., Dersch, A., Mouille-Malbeuf, S., Koppe, B., & Sowan, D. (2018). Cadmium tissue concentrations in kidney, liver and muscle in moose (Alces alces) from First Nations Communities in northern Alberta. Frontiers in Sustainable Food Systems, 2.
24) Parker, G. H. (2004). Tissue metal levels in Muskrat (Ondatra zibethica) collected near the Sudbury (Ontario) ore-smelters; prospects for biomonitoring marsh pollution. Environmental Pollution, 129(1), 23–30.
25) Pedersen, S., & Lierhagen, S. (2006). Heavy metal accumulation in Arctic hares (Lepus arcticus) in Nunavut, Canada. Science of the Total Environment, 368(2–3), 951–955.
26) Pollock, B., & Machin, K. L. (2008). Effects of cadmium, mercury, and selenium on reproductive indices in male lesser scaup (Aythya affinis) in the western boreal forest. Archives of Environmental Contamination and Toxicology, 54(4), 730–739.
27) Pollock, B., Roger, E. (2007). Trace elements status of moose and white-tailed deer in Nova Scotia. Alces, 43, 61-77.
28) Pollock, B., Penashue, B., McBurney, S., Vanleeuwen, J., Daoust, P.Y., Burgess, N. M. and Tasker, A. R. (2009). Liver parasites and body condition in relation to environmental contaminants in caribou (Rangifer tarandus) from Labrador, Canada. Arctic, 62, 1-12.
29) Provencher, J. F., Braune, B. M., Gilchrist, H. G., Forbes, M. R., & Mallory, M. L. (2014). Trace element concentrations and gastrointestinal parasites of Arctic terns breeding in the Canadian High Arctic. Science of the Total Environment, 476–477, 308–316.
30) Provencher, J. F., Thomas, P. J., Pauli, B., Braune, B. M., Franckowiak, R. P., Gendron, M., … Mallory, M. L. (2020). Polycyclic aromatic compounds (PACs) and trace elements in four marine bird species from northern Canada in a region of natural marine oil and gas seeps. Science of the Total Environment, 744.
31) Riget, F., Muir, D., Kwan, M., Savinova, T., Nyman, M., Woshner, V., & O’Hara, T. (2005). Circumpolar pattern of mercury and cadmium in ringed seals. Science of the Total Environment, 351–352, 312–322.
32) Robillard, S., Beauchamp, G., Paillard, G., & Bélanger, D. (2002). Levels of cadmium, lead, mercury and 137caesium in caribou (Rangifer tarandus) tissues from northern Québec Arctic, 1-9.
33) Rodrigue, J., Champoux, L., Leclair, D., & Duchesne, J. F. (2007). Cadmium concentrations in tissues of willow ptarmigan (Lagopus lagopus) and rock ptarmigan (Lagopus muta) in Nunavik, Northern Québec. Environmental Pollution, 147(3), 642–647.
34) Rodríguez-Estival, J., & Smits, J. E. G. (2016). Small mammals as sentinels of oil sands related contaminants and health effects in northeastern Alberta, Canada. Ecotoxicology and Environmental Safety, 124, 285–295.
35) Routti, H., Letcher, R. J., Born, E. W., Branigan, M., Dietz, R., Evans, T. J., … Sonne, C. (2011). Spatial and temporal trends of selected trace elements in liver tissue from polar bears (Ursus maritimus) from Alaska, Canada and Greenland. Journal of Environmental Monitoring, 13(8), 2260–2267.
36) Rush, S. A., Borgå, K., Dietz, R., Born, E. W., Sonne, C., Evans, T., … Fisk, A. T. (2008). Geographic distribution of selected elements in the livers of polar bears from Greenland, Canada and the United States. Environmental Pollution, 153(3), 618–626.
37) Schummer, M. L., Petrie, S. A., Badzinski, S. S., Chen, Y. W., & Belzile, N. (2012). Hepatic concentrations of inorganic contaminants and their relationships with nutrient reserves in autumn-migrant common loons at Lake Erie. Archives of Environmental Contamination and Toxicology, 62(4), 704–713.
38) Shotyk, W., Bicalho, B., Dergousoff, M., Grant-Weaver, I., Hood, G., Lund, K., & Noernberg, T. (2019). A geochemical perspective on the natural abundance of trace elements in beaver (Castor canadensis) from a rural region of southern Ontario, Canada. Science of the Total Environment, 672, 40–50.
39) Thomas, P., Irvine, J., Lyster, J., & Beaulieu, R. (2005). Radionuclides and trace metals in canadian moose near uranium mines: comparison of radiation doses and food chain transfer with cattle and caribou. Health Physics, 88(5), 423–438.
40) Veinott, G., & Sjare, B. (2006). Mercury, cadmium, selenium, and seven other elements in the muscle, renal, and hepatic tissue of harbor seals (Phoca vitulina) from Newfoundland and Labrador, Canada. Bulletin of Environmental Contamination and Toxicology, 77(4), 597–607.
41) Ware, L. L., Petrie, S. A., Badzinski, S. S., & Bailey, R. C. (2011). Selenium concentrations in greater scaup and Dreissenid mussels during winter on western Lake Ontario. Archives of Environmental Contamination and Toxicology, 61(2), 292–299.
Annex 3 – Federal risk management initiatives relevant to the evaluation
Base metals smelting
Code of Practice for Base Metal Smelters and Refineries
Description: Describes operational activities and associated environmental concerns of the base metals smelting sector. It issues recommendations to improve environmental performance, including the development and implementation of environmental management systems and the prevention and control of atmospheric emissions, wastewater effluents, and wastes. These recommended practices may be used as requirements for new facilities and as goals for continual improvements for existing facilities.
Applies to a sector of concern: Yes
Contributes to reducing releases/levels in the environment: Yes
Rationale for inclusion: According to PSL Assessment, NPRI and APEI, base metals smelting is a major contributor to cadmium releases; Code of Practice linked to SOP issue table for base metals smelting.
Targets/objective achieved: None set
Applies to primary release pathway: Yes
Comments/additional information: No reporting requirements are in place under the Code of Practice, but reports from most facilities have been collected since 2006 under the P2 Notice.
Between 2006 and 2018, the 11 base metals smelting facilities fully implemented more than 80% of applicable recommendations. In 2021, reports submitted as part of the Performance Agreements indicate that, on average, all facilities fully implemented 95% of applicable recommendations, including 3 facilities that implemented 100% of their applicable recommendations.
Pollution Prevention Plan for Base Metal Smelters and Refineries and Zinc Plants
Description: Base metals smelters and refineries and zinc plants must prepare and implement Pollution Prevention Plans for specified toxic substances. The objective was to avoid or minimize the creation and release of pollutants and waste and to reduce the overall risk to the environment or human health.
Applies to a sector of concern: Yes
Contributes to reducing releases/levels in the environment: Yes
Rationale for inclusion: According to PSL Assessment, NPRI and APEI, base metals smelting is a major contributor to cadmium releases; Code of Practice linked to SOP issue table for base metals smelting.
Targets/objective achieved: Yes
Applies to primary release pathway: Yes
Comments/additional information: From 2005 to 2018, there was an 89% decrease (28 tonnes) in cadmium emissions and an overall metals reduction of 93% since 1988, exceeding the recommendations set out in the Strategic Options Report. The final performance report of the P2 Notice indicated that total emissions of metals were reduced by 7 facilities but two facilities increased their total metal emissions when compared to 2005 levels.
Performance Agreement for Base Metals Smelters and Refineries
Description: The agreements have been negotiated between Environment and Climate Change Canada (ECCC) and 5 base metal smelting and refining companies, operating 11 facilities in total. Among other commitments, the participating companies agreed to further reducing emissions of metals and particulate matter and continue implementing the applicable recommendations in the Environmental Code of Practice for Base Metals Smelters and Refineries.
Applies to a sector of concern: Yes
Contributes to reducing releases/levels in the environment: Unknown
Rationale for inclusion: According to PSL Assessment, NPRI and APEI, base metals smelting is a major contributor to cadmium releases; linked to SOP issue table for base metals smelting
Targets/objective achieved: In progress
Applies to primary release pathway: Yes
Comments/additional information: Reports showed that the eight facilities with a due date of January 5, 2018, met their particulate matter intensity targets. Annual reports for the 2019 calendar year showed all 11 facilities met their targets. The 2018 Performance Agreements are still being implemented. Progress towards reducing emissions, including metals such as cadmium, will be evaluated upon their completion in 2025.
Iron & steel manufacturing
Environmental Code of Practice for Integrated Steel Mills
Description: This Code of Practice recommends best practices to control and minimize the releases of certain toxic substances from integrated steel mills. It also recommends air emission limits and effluent quality guidelines.
Applies to a sector of concern: Yes
Contributes to reducing releases/levels in the environment: No
Rationale for inclusion: Linked to SOP for steel manufacturing; targets PM and sets a guideline for cadmium in effluent.
Targets/objective achieved: None set
Applies to primary release pathway: Yes
Comments/additional information: No reporting requirements are in place under the Code of Practice. Release inventory data suggest no change in cadmium releases from this sector.
Environmental Code of Practice for Non-Integrated Steel Mills
Description: The Code identifies good environmental protection practices for various production processes and operations of a non-integrated steel plant, with air emission and water effluent considerations as the highest priorities. It also includes multimedia and other considerations consistent with a comprehensive and life cycle approach to environmental protection. The overall objective of the Code is to identify minimum environmental performance standards for new non-integrated steel mills and to provide a set of environmental performance goals for existing mills to achieve through continual improvement over time.
Applies to a sector of concern: Yes
Contributes to reducing releases/levels in the environment: No
Rationale for inclusion: Linked to SOP for steel manufacturing; targets PM and sets a guideline for cadmium in effluent.
Targets/objective achieved: None set
Applies to primary release pathway: Yes
Comments/additional information: No reporting requirements are in place under the Code of Practice. Release inventory data suggest no change in cadmium releases from this sector.
Iron, Steel, and Ilmenite Sector: Code of Practice
Description: This Code of Practice recommends best practices to control and limit fugitive air emissions of total particulate matter and volatile organic compounds from facilities in the iron, steel, and ilmenite sectors.
Applies to a sector of concern: Yes
Contributes to reducing releases/levels in the environment: No
Rationale for inclusion: Linked to SOP for steel manufacturing; targets PM from a sector that emits cadmium to the air.
Targets/objective achieved: None set
Applies to primary release pathway: Yes
Comments/additional information: No reporting requirements are in place under the Code of Practice. Release inventory data suggest no change in cadmium releases from this industry.
Iron, Steel, and Ilmenite Sector: P2 Notice
Description: Achieve and maintain the BLIERs air emission targets and implement best practices to reduce fugitive volatile organic compounds emissions, where appropriate and practicable.
Applies to a sector of concern: Yes
Contributes to reducing releases/levels in the environment: Unlikely
Rationale for inclusion: While PM isn't targeted explicitly in the P2 Notice, the Code of Practice is a factor to consider in developing a P2 plan. One of the facilities mentioned in the Notice is among the top 20 cadmium emitters (median of releases to air) according to NPRI since 2004. The iron and steel sector is consistently in the top 8 sectors for cadmium emissions since 2002.
Targets/objective achieved: In progress
Applies to primary release pathway: Yes
Comments/additional information: Preliminary results of the progress report expected to be available in 2022. Release inventory data suggest no change in cadmium releases from this industry.
Mining and minerals processing
Metal and Diamond Mining Effluent Regulations (Fisheries Act)
Description: The MDMER authorize the deposit of effluent into fish-frequented waters. All effluent must meet the concentration-based limits for arsenic, copper, cyanide, lead, nickel, zinc, suspended solids, radium 226, and un-ionized ammonia. The effluent must also have a pH that is between a minimum and maximum level, and it must not be acutely lethal. The MDMER specify various requirements such as carrying out effluent sampling, reporting and environmental effects monitoring.
Applies to a sector of concern: No
Contributes to reducing releases/levels in the environment: Unknown
Rationale for inclusion: Mining accounts for the third-highest sector for cadmium releases to water (after wastewater and pulp and paper) according to NPRI. Non-metal mining cadmium release rates reported to the NPRI are minimal.
Targets/objective achieved: In progress
Applies to primary release pathway: No
Comments/additional information: MDMER does not set limits for cadmium releases but does control toxicity via acute lethality tests and cadmium concentrations are recorded in effluent characterization reports. Uncertainty about NPRI data on mining is because integrated mining/processing facilities can change their reporting codes from year to year.
Environmental Code of Practice for Metal Mines
Description: Describes operational activities and associated environmental concerns of the metal mining sector. The document applies to the complete life cycle of mining, from exploration to mine closure, and environmental management practices are recommended to mitigate identified environmental concerns. The recommended practices in the Code include the development and implementation of environmental management tools, the management of wastewater and mining wastes, and the prevention and control of environmental releases to air, water and land.
Applies to a sector of concern: No
Contributes to reducing releases/levels in the environment: No
Rationale for inclusion: According to NPRI, mining accounts for the second highest sector for overall releases of cadmium since 2002 (not including disposals). In 2017 it was the second highest sector for releases to air and land and third highest for water
Targets/objective achieved: None set
Applies to primary release pathway: Yes
Comments/additional information: No reporting requirements are in place under the Code of Practice. Uncertainty about NPRI data on mining is because integrated mining/processing facilities can change their reporting codes from year to year.
Cement
CCME National Guidelines for the Use of Hazardous and Non-hazardous Wastes as Supplementary Fuels in Cement Kilns
Description: Specifies metal emission guidelines for Class III Metals (mercury, cadmium, and thallium) of 0.15 mg/m3.
Applies to a sector of concern: No
Contributes to reducing releases/levels in the environment: No
Rationale for inclusion: Sets emission guidelines for metals, including cadmium.
Targets/objective achieved: None set
Applies to primary release pathway: Yes
Comments/additional information: No reporting requirements are in place under voluntary guidelines. Cadmium emissions have declined from this sector over time, although this is likely related to other efforts to reduce emissions of nitrous oxides and greenhouse gases and are not related to the guidelines.
Pulp and paper
Pulp and Paper Effluent Regulations
Description: The Pulp and Paper Effluent Regulations (the regulations) were developed under the Fisheries Act in 1971 to govern the discharge of deleterious substances into waters frequented by fish. The regulations were designed to encourage mills to modify their processes in order to improve water quality and protect fish, fish habitat and the use of fisheries resources. They set limits on the amounts of total suspended solids and biochemical oxygen demanding matter, and prohibit deposits of acutely lethal effluent.
Applies to a sector of concern: No
Contributes to reducing releases/levels in the environment: Unknown
Rationale for inclusion: Pulp and paper sector is a significant contributor to cadmium releases to water according to NPRI (second largest after wastewater). PAWPIT estimates for NRKW/SRKW/Chinook spatial extent indicate the second largest sources of cadmium releases are pulp and paper effluent and surface runoff.
Targets/objective achieved: No
Applies to primary release pathway: Yes
Comments/additional information: The regulations have been effective at reducing acute toxicity of effluent but have not been fully successful in mitigating the sublethal toxicity of effluent or receiving environment impacts. Proposed measures to require characterization and water quality monitoring studies will be important to informing risk management for the sector and contribute to future performance measurement evaluations for a number of substances, including cadmium.
Electric power generation
New Source Emission Guidelines for Thermal Electricity Generation
Description: Set emission limit targets for new fossil fuel-fired electricity generating units.
Applies to a sector of concern: Yes
Contributes to reducing releases/levels in the environment: No
Rationale for inclusion: Linked to SOP issue table on electricity generation; coal combustion is a contributor to cadmium emissions as cadmium is present in PM.
Targets/objective achieved: Unknown
Applies to primary release pathway: Yes
Comments/additional information: No reporting requirements are in place under voluntary guidelines. No observed reduction in cadmium releases from the sector following the introduction of the guidelines.
Reduction of Carbon Dioxide Emissions from Coal-fired Generation of Electricity Regulations
Description: These regulations set a stringent performance standard for new coal-fired electricity generation units and those that have reached the end of their useful life.
Applies to a sector of concern: Yes
Contributes to reducing releases/levels in the environment: Yes
Rationale for inclusion: Linked to SOP issue table on electricity generation; coal combustion is a contributor to cadmium emissions as cadmium is present in PM.
Targets/objective achieved: In progress
Applies to primary release pathway: Yes
Comments/additional information: More data are needed to evaluate the success of these regulations. Emissions from this sector will continue to be monitored through reporting required under the National Pollutant Release Inventory, and the Air Pollutants Emissions Inventory will be kept updated for coal-fired electric power generation until this activity is phased out in Canada. Early data suggest that reductions in cadmium emissions from coal-fired electricity generating facilities have been realized since 2012.
Waste
CCME National Guidelines for Hazardous Waste Landfills
Description: The guidelines are intended to provide a reference on the basic design, operating, and performance requirements for use by the various federal, provincial, and territorial regulatory agencies and designers, owners, and operators of engineered hazardous waste landfill facilities in Canada. They do not set thresholds for concentrations of contaminants in waste or in leachate, rather they recommend performance criteria for regulating authorities to consider in municipal or provincial permitting and reporting programmes.
Applies to a sector of concern: Yes
Contributes to reducing releases/levels in the environment: Yes
Rationale for inclusion: Waste is a source of concern in PSL Assessment.
Targets/objective achieved: None set
Applies to primary release pathway: Yes
Comments/additional information: No reporting requirements are in place under voluntary guidelines. According to NPRI data, since 2006, there has been more cadmium waste disposed of in hazardous waste landfills and/or transferred offsite for treatment prior to final disposal, but reported releases to the environment have remained stable or decreased slightly.
Export and Import of Hazardous Wastes and Hazardous Recyclable Materials Regulations
Description: These regulations under CEPA control the cross-border movement of hazardous waste and hazardous recyclable materials. These regulations help ensure that hazardous wastes and hazardous recyclable materials crossing international borders are characterized and managed properly in accordance with international law.
Applies to a sector of concern: Yes
Contributes to reducing releases/levels in the environment: Unknown
Rationale for inclusion: Waste is a source of concern in PSL Assessment; cadmium is considered hazardous under the regulations. It can be found in schedule 6, (Hazardous Constituents Controlled Under Leachate Test and Regulated Limits) of these regulations (Item 12); regulations will help to inform on management of cadmium waste.
Targets/objective achieved: None set
Applies to the primary release pathway: No
Comments/additional information: Repealed by Cross-border Movement of Hazardous Waste and Hazardous Recyclable Materials Regulations.
Interprovincial Movement of Hazardous Waste Regulations
Description: These regulations apply to the movement of hazardous waste and hazardous recyclable materials that are transported in Canada across a provincial or territorial border.
Applies to a sector of concern: Yes
Contributes to reducing releases/levels in the environment: Unknown
Rationale for inclusion: Waste is a source of concern in PSL Assessment. Cadmium is considered hazardous under the regulations. Regulations will help to inform on management of cadmium waste.
Targets/objective achieved: None set
Applies to the primary release pathway: No
Comments/additional information: Repealed by Cross-border Movement of Hazardous Waste and Hazardous Recyclable Materials Regulations
Cross-border Movement of Hazardous Waste and Hazardous Recyclable Materials Regulations
Description: These regulations aim to ensure that shipments of hazardous waste and hazardous recyclable material crossing Canada's international and interprovincial or territorial borders reach the intended destination to reduce releases of contaminants to the environment in Canada and abroad.
Applies to a sector of concern: Yes
Contributes to reducing releases/levels in the environment: Unknown
Rationale for inclusion: Waste is a source of concern in PSL Assessment. Cadmium is considered hazardous under the regulations. Regulations will help to inform on management of cadmium waste.
Targets/objective achieved: In progress
Applies to the primary release pathway: No
Comments/additional information: None
Canada-wide Approach for the Management of Wastewater Biosolids
Description: The Approach outlines the beneficial use and sound management of municipal biosolids, municipal sludge, and treated septage as valuable sources of nutrients, organic matter, and energy.
Applies to a sector of concern: Yes
Contributes to reducing releases/levels in the environment: Yes
Rationale for inclusion: Land application of sewage sludge identified as a source of concern in PSL Assessment.
Targets/objective achieved: None set
Applies to the primary release pathway: Yes
Comments/additional information: No reporting requirements are in place under voluntary guidelines.
Fertilizers Act and Regulations
Description: All fertilizers or supplements (non-nutrient soil amendments) sold in or imported into Canada are regulated under the Fertilizers Act (FzA) and Regulations
Applies to a sector of concern: Yes
Contributes to reducing releases/levels in the environment: Yes
Rationale for inclusion: Land application of sewage sludge identified as a source of concern in PSL Assessment.
Targets/objective achieved: In progress
Applies to the primary release pathway: Yes
Comments/additional information: Administered by CFIA and is therefore out of the scope of ECCC’s risk management approach. It is important to note that production, use (including land application), disposal, or non-sale distribution (for example, given away) of fertilizers and supplements, including biosolids products, do not fall under the purview of the FzA. The CFIA only regulates the actual sale or import. The 2013 evaluation of the fertilizers program reported an average of 77% compliance with the metals and lesser nutrient content of fertilizers inspected between 2009 and 2012. It is too early to report on progress made following 2020 amendments.
Industrial releases from multiple sectors
Accelerated Reduction / Elimination of Toxics (ARET) Program
Description: In 1994, the ARET program challenged selected Canadian companies, institutions, government departments, and agencies to voluntarily reduce or eliminate their emissions of ARET substances by the year 2000. Participants were asked to choose a base year after 1987 from which they would make their reductions, and to outline their commitments in a publicly accessible action plan.
Applies to a sector of concern: Yes
Contributes to reducing releases/levels in the environment: No
Rationale for inclusion: Cadmium was one of the substances targeted and reported on by the program; considered in SOP issue table report and recommendations for electric power generation.
Targets/objective achieved: Yes
Applies to the primary release pathway: Yes
Comments/additional information: Independent evaluations of the program showed limited success given reductions were mostly achieved before 1994.
Multi-pollutant Emission Reduction Strategies
Description: Ministers of the Environment agreed to a list of actions aimed at reducing pollutant emissions contributing to particulate matter and ozone. The actions included the development of comprehensive multi-pollutant emission reduction strategies (MERS) for key industrial sectors. This approach was taken in an effort to pursue integrated solutions to the problems of smog, acid rain, toxic release and climate change.
Applies to a sector of concern: Yes
Contributes to reducing releases/levels in the environment: Unknown
Rationale for inclusion: Several of the sectors identified for the development of a MERS are also sectors of concern for cadmium releases to air, including electric power generation, base metals smelting, and iron and steel.
Targets/objective achieved: Unknown
Applies to the primary release pathway: Yes
Comments/additional information: None
Base Level Industrial Emissions Requirements
Description: Ministers of the Environment agreed that all significant industrial sources in Canada should meet a good base level of performance. Base-level Industrial Emissions Requirements (BLIERs) were developed with this principle in mind. BLIERs are quantitative or qualitative emissions requirements proposed for new and existing major industrial sectors and some equipment types. BLIERs are focused on nitrogen oxides (NOx), sulfur dioxide (SO2), volatile organic compounds (VOCs), and particulate matter (PM). They are not designed to be the sole instrument used to improve air quality but to support existing policy frameworks at federal and provincial or territorial levels.
Applies to a sector of concern: Yes
Contributes to reducing releases/levels in the environment: Unknown
Rationale for inclusion: Cadmium may be a component of particulate matter released from some industrial sources. The sectors with BLIERs that are relevant to cadmium risk management based on the PSL Assessment or on the quantity of cadmium releases to air reported to NPRI and estimates by APEI are: base metal smelting, cement, and iron, steel, and ilmenite.
Targets/objective achieved: Partially
Applies to the primary release pathway: Yes
Comments/additional information: Performance measurement is ongoing.
Agreements
Canada Ontario Water Quality Agreement
Description: An agreement between the governments of Canada and Ontario to promote a healthy, prosperous, and sustainable Great Lakes Basin ecosystem for current and future generations. COA 1994 identified a group of chemicals in the Great Lakes Basin that were of concern and outlined actions to reduce and prevent releases.
Applies to a sector of concern: Yes
Contributes to reducing releases/levels in the environment: Yes
Rationale for inclusion: Considered in policy context of SOP issue tables; cadmium was identified as a substance of concern in the agreement; Performance measurement has been completed on the agreement and includes progress made on cadmium in the Great Lakes Basin.
Targets/objective achieved: In progress
Applies to the primary release pathway: Yes
Comments/additional information: Cadmium concentrations had decreased but continued to exceed the water quality and sediment guidelines set by the CCME and the Province of Ontario. Concentrations in fish were below provincial consumption guidelines. Cadmium concentrations in the air in the Great Lakes Basin were also examined and found to be lower than the Ontario Ambient Air Criterion. Remediation activities were implemented under the Canada-Ontario Agreement that serves to manage and clean up contamination from cadmium and other chemicals at Areas of Concern and as components of Lakewide Action and Management Plans.
UNECE Convention on Long Range Transboundary Air Pollutants – Heavy Metals Protocol
Description: The Executive Body adopted the Protocol on Heavy Metals in Aarhus (Denmark) on 24 June 1998. It targets 3 particularly harmful metals: cadmium, lead, and mercury. Parties are to reduce their emissions for these 3 metals below their levels in 1990 (or an alternative year between 1985 and 1995). The Protocol aims to cut emissions from industrial sources (iron and steel industry, non-ferrous metal industry), combustion processes (power generation, road transport), and waste incineration.
Applies to a sector of concern: No
Contributes to reducing releases/levels in the environment: Yes
Rationale for inclusion: The Heavy Metals Protocol was adopted after the 1994 Assessment, and many of the Strategic Options Process issue tables; however, the potential adoption was considered in the policy context for the issue tables. Cadmium is one of 3 metals targeted in the agreement; evidence from source apportionment indicates that cadmium is entering Canada through transportation of airborne particulate matter originating in the US (also a Party to the agreement).
Targets/objective achieved: In progress
Applies to the primary release pathway: Yes
Comments/additional information: Canada met its commitments to reduce emissions of heavy metals in 2008. Globally, efforts are ongoing to reduce emissions of these metals in developing countries and countries with economies in transition.