
Bird conservation strategy for Region 12: Ontario and Manitoba boreal hardwood transition, chapter 1
Section 1: Summary of results - All Birds, All Habitats
Element 1: Priority species assessment
Bird Conservation Strategies identify “priority species” from all regularly occurring bird species in each BCR subregion (see Appendix 1). Species that are vulnerable due to population size, distribution, population trend, abundance and threats are included as priorities because of their “conservation concern.” Some widely distributed and abundant “stewardship” species are also included. Stewardship species are included because they typify the national or regional avifauna and/or because they have a large proportion of their range and/or continental population in the subregion; many of these species have some conservation concern, while others may not require specific conservation effort at this time. Species of management interest are also included as priority species when they are at (or above) their desired population objectives and require ongoing management because of their socio-economic importance as game species or because of their impacts on other species or habitats (see Appendix 2).
The purpose of the prioritization exercise is to focus implementation efforts on the species and issues of greatest significance to Ontario’s avifauna. As with any priority-setting exercise, some important species may be excluded; however, the issues of importance to any excluded species are usually captured by addressing the threats identified for species that are included on the priority list. With this in mind, species present in the region only as migrants were included as priority species only when their inclusion introduced new regional conservation issues, such as the protection of migratory staging sites. Otherwise, the BCR 12 ON strategy relies on conservation actions arising from threats to other priority species to address more general conservation concerns for migrants. Tables 2, 3 and 4 outline the priority species in BCR 12 ON, the relative breakdown by bird group, and the reasons for priority status.
A total of 260 bird species occur regularly in the region, 100 of which were assessed as priority species, including 24 species assessed by Committee on the Status of Endangered Wildlife in Canada (COSEWIC) as “at risk,” 18 listed under the federal Species at Risk Act (SARA), and 23 species noted as species at risk in Ontario (as of November 2013; Ontario Ministry of Natural Resources 2013a). Landbirds show the greatest diversity in BCR 12 ON, representing nearly 66% of the candidate species list (Table 3). A large number of landbird species are uncommon or non-breeders in the region; only 36% qualified for priority status. Still, a majority of the priority species in BCR 12 ON are landbirds (61 species or 61%; Table 3). By comparison, waterbirds and waterfowl show lower diversity, but a higher proportion of these species qualified for priority status (52% and 55% respectively). The diversity of breeding shorebirds in the region is low, and although coastal beaches of the Great Lakes, wetlands and other habitats in BCR 12 ON are used by migrant shorebirds, few concentrate in large numbers within this region during migration. Only 7 shorebird species qualified for priority status, including 6 breeders and 1 migrant, the endangered rufa Red Knot.
Note: All assessments, listings and designations are current to November 2013. A species can be on the priority list for more than one reason.
| Priority Birds | Priority Species | Population Objective | COSEWICa | SARAb | SAROc | Regional/ Subregional Concernd |
Regional/ Subregional Stewardshipe |
National/ Continental Concern |
National/ Continental Stewardship |
|---|---|---|---|---|---|---|---|---|---|
| Landbirds | American Kestrel | Increase | - | - | - | Y | - | - | - |
| Landbirds | Bald Eagle | Recovery objectivef | - | - | SC | Y | - | - | Y |
| Landbirds | Bank Swallow | Increase | T | - | - | Y | - | - | - |
| Landbirds | Barn Swallow | Recovery objective | T | - | T | Y | - | - | - |
| Landbirds | Bay-breasted Warbler | Increase | - | - | - | Y | - | Y | - |
| Landbirds | Belted Kingfisher | Increase | - | - | - | - | Y | - | - |
| Landbirds | Black-billed Cuckoo | Increase | - | - | - | - | Y | - | - |
| Landbirds | Blackburnian Warbler | Maintain current | - | - | - | - | Y | Y | Y |
| Landbirds | Black-throated Blue Warbler | Maintain current | - | - | - | - | Y | - | - |
| Landbirds | Black-throated Green Warbler | Maintain current | - | - | - | - | Y | Y | Y |
| Landbirds | Bobolink | Recovery objective | T | - | T | Y | - | Y | - |
| Landbirds | Broad-winged Hawk | Maintain current | - | - | - | - | Y | - | - |
| Landbirds | Brown Thrasher | Increase | - | - | - | Y | - | - | Y |
| Landbirds | Canada Warbler | Recovery objectivef | T | T | SC | Y | Y | Y | - |
| Landbirds | Cerulean Warbler | Recovery objective | E | SC | T | Y | - | Y | - |
| Landbirds | Chestnut-sided Warbler | Maintain current | - | - | - | - | Y | Y | Y |
| Landbirds | Chimney Swift | Recovery objectivef | T | T | T | Y | - | Y | - |
| Landbirds | Cliff Swallow | Increase | - | - | - | Y | - | - | - |
| Landbirds | Common Nighthawk | Recovery objectivef | T | T | SC | Y | - | Y | - |
| Landbirds | Common Yellowthroat | Maintain current | - | - | - | - | Y | - | - |
| Landbirds | Connecticut Warbler | Increase | - | - | - | Y | - | Y | Y |
| Landbirds | Eastern Towhee | Increase | - | - | - | Y | - | Y | Y |
| Landbirds | Eastern Whip-poor-will | Recovery objectivef | T | T | T | Y | - | Y | - |
| Landbirds | Eastern Wood-Pewee | Increase | SC | - | - | Y | - | - | - |
| Landbirds | Evening Grosbeak | Increase | - | - | - | Y | - | - | - |
| Landbirds | Field Sparrow | Assess/ Maintain |
- | - | - | Y | - | - | - |
| Landbirds | Golden-winged Warbler | Recovery objectivef | T | T | SC | Y | Y | Y | - |
| Landbirds | Gray Catbird | Increase | - | - | - | Y | - | - | - |
| Landbirds | Great Gray Owl | Assess/ Maintain |
- | - | - | Y | - | - | - |
| Landbirds | Kirtland's Warbler | Recovery objective | E | E | E | Y | Y | Y | - |
| Landbirds | Least Flycatcher | Increase | - | - | - | - | Y | - | - |
| Landbirds | Loggerhead Shrike (migrans) | Recovery objective | E | E | E | Y | - | Y | - |
| Landbirds | Louisiana Waterthrush | Recovery objective | SC | SC | SC | Y | - | Y | Y |
| Landbirds | Mourning Warbler | Increase | - | - | - | - | Y | Y | Y |
| Landbirds | Nashville Warbler | Maintain current | - | - | - | - | Y | - | Y |
| Landbirds | Northern Flicker | Increase | - | - | - | Y | - | - | - |
| Landbirds | Northern Goshawk | Assess/ Maintain |
- | - | - | Y | - | - | - |
| Landbirds | Northern Rough-winged Swallow | Increase | - | - | - | Y | - | - | - |
| Landbirds | Olive-sided Flycatcher | Recovery objectiveRecovery objectivef | T | T | SC | Y | - | Y | - |
| Landbirds | Peregrine Falcon (anatum/tundrius) |
Recovery objective | SC | SC | SC | Y | - | Y | - |
| Landbirds | Prairie Warbler | Assess/ Maintain |
- | - | - | Y | - | Y | - |
| Landbirds | Purple Finch | Increase | - | - | - | Y | - | - | - |
| Landbirds | Purple Martin | Increase | - | - | - | Y | - | - | - |
| Landbirds | Red Crossbill | Increase | - | - | - | Y | - | - | - |
| Landbirds | Red-headed Woodpecker | Recovery objectivef | T | T | SC | Y | - | Y | - |
| Landbirds | Red-shouldered Hawk | Assess/Maintain | - | - | - | Y | - | - | Y |
| Landbirds | Rose-breasted Grosbeak | Increase | - | - | - | - | Y | - | - |
| Landbirds | Ruby-crowned Kinglet | Increase | - | - | - | Y | - | - | - |
| Landbirds | Ruffed Grouse | Maintain current | - | - | - | - | Y | - | - |
| Landbirds | Rusty Blackbird | Recovery objectivef | SC | SC | - | Y | - | Y | - |
| Landbirds | Sedge Wren | Maintain current | - | - | - | - | Y | - | - |
| Landbirds | Short-eared Owl | Recovery objectivef | SC | SC | SC | Y | - | Y | - |
| Landbirds | Song Sparrow | Increase | - | - | - | Y | - | - | - |
| Landbirds | Swamp Sparrow | Maintain current | - | - | - | - | Y | Y | Y |
| Landbirds | Tennessee Warbler | Increase | - | - | - | Y | - | - | Y |
| Landbirds | Tree Swallow | Increase | - | - | - | Y | - | - | - |
| Landbirds | Veery | Increase | - | - | - | Y | Y | - | - |
| Landbirds | Vesper Sparrow | Increase | - | - | - | Y | - | - | - |
| Landbirds | White-throated Sparrow | Maintain current | - | - | - | - | Y | Y | Y |
| Landbirds | Wood Thrush | Maintain current | T | - | - | Y | - | Y | - |
| Landbirds | Yellow-bellied Sapsucker | Maintain current | - | - | - | - | Y | - | Y |
| Shorebirds | American Woodcock | Increase | - | - | - | Y | - | Y | - |
| Shorebirds | Killdeer | Increase | - | - | - | Y | - | Y | - |
| Shorebirds | Piping Plover (circumcinctus) | Recovery objective | E | E | E | Y | - | Y | - |
| Shorebirds | Red Knot (rufa) |
Migrant (no BCR 12 ON population objective) |
E | E | E | Y | - | Y | - |
| Shorebirds | Solitary Sandpiper | Assess/ Maintain |
- | - | - | Y | - | Y | - |
| Shorebirds | Spotted Sandpiper | Maintain current | - | - | - | Y | - | Y | - |
| Shorebirds | Wilson's Snipe | Assess/Maintain | - | - | - | Y | - | - | - |
| Waterbirds | American Coot | Maintain current | - | - | - | Y | - | - | - |
| Waterbirds | American White Pelican | Recovery objective | - | - | T | Y | - | Y | - |
| Waterbirds | Black Tern | Recovery objective | - | - | SC | Y | - | Y | - |
| Waterbirds | Black-crowned Night-Heron | Assess/Maintain | - | - | - | Y | - | - | - |
| Waterbirds | Caspian Tern | Increase | - | - | - | Y | - | - | - |
| Waterbirds | Common Gallinule | Assess/Maintain | - | - | - | Y | - | - | - |
| Waterbirds | Common Tern | Maintain current | - | - | - | Y | - | Y | - |
| Waterbirds | Great Black-backed Gull | Assess/Maintain | - | - | - | Y | - | - | - |
| Waterbirds | Green Heron | Increase | - | - | - | Y | - | - | - |
| Waterbirds | Herring Gull | Maintain current | - | - | - | Y | - | Y | - |
| Waterbirds | Horned Grebe (western population) | Recovery objectivef | SC | - | SC | Y | - | Y | - |
| Waterbirds | Least Bittern | Recovery objective | T | T | T | Y | - | Y | - |
| Waterbirds | Red-necked Grebe | Assess/Maintain | - | - | - | Y | - | - | - |
| Waterbirds | Sandhill Crane | Assess/Maintain | - | - | - | Y | - | - | - |
| Waterbirds | Yellow Rail | Recovery objective | SC | SC | SC | Y | - | Y | - |
| Waterfowl | Waterfowl | - | - | - | - | - | - | - | |
| Waterfowl | American Black Duck | Increase | - | - | - | Y | - | Y | - |
| Waterfowl | Black Scoter | Migrant (no BCR 12 ON population objective) |
- | - | - | Y | - | Y | - |
| Waterfowl | Bufflehead | Maintain current | - | - | - | Y | - | - | - |
| Waterfowl | Canada Goose (Southern James Bay population) | Migrant (no BCR 12 ON population objective) |
- | - | - | Y | - | Y | - |
| Waterfowl | Canada Goose (Eastern Temperate-breeding population)g | Decrease | - | - | - | Y | - | - | - |
| Waterfowl | Common Goldeneye | Maintain current | - | - | - | Y | - | Y | - |
| Waterfowl | Common Merganser | Maintain current | - | - | - | Y | - | - | - |
| Waterfowl | Greater Scaup | Migrant (no BCR 12 ON population objective) |
- | - | - | Y | - | - | - |
| Waterfowl | Green-winged Teal | Maintain current | - | - | - | Y | - | - | - |
| Waterfowl | Hooded Merganser | Maintain current | - | - | - | Y | - | - | - |
| Waterfowl | Lesser Scaup | Migrant (no BCR 12 ON population objective) |
- | - | - | Y | - | Y | - |
| Waterfowl | Long-tailed Duck | Migrant (no BCR 12 ON population objective) |
- | - | - | Y | - | Y | - |
| Waterfowl | Mallard | Maintain current | - | - | - | Y | - | Y | - |
| Waterfowl | Ring-necked Duck | Maintain current | - | - | - | Y | - | - | - |
| Waterfowl | Surf Scoter | Migrant (no BCR 12 ON population objective) |
- | - | - | Y | - | Y | - |
| Waterfowl | White-winged Scoter | Migrant (no BCR 12 ON population objective) |
- | - | - | Y | - | Y | - |
| Waterfowl | Wood Duck | Maintain current | - | - | - | Y | - | - | - |
a Assessed by COSEWIC as E, Endangered; T, Threatened; SC, Special Concern.
b Species listed on Schedule 1 of SARA as E, Endangered; T, Threatened; SC, Special Concern (Species at Risk Public Registry 2013).
c Species listed as E, Endangered; T, Threatened; SC, Special Concern on the SARO List (Ontario Ministry of Natural Resources 2013a).
d Regional refers to BCR-wide (i.e. all jurisdictional data were used for the entire BCR) while Subregional refers to the Ontario portion of the BCR only (i.e. Ontario BCR data were used).
e Only the landbird group distinguishes stewardship species from other priority species (see Panjabi et al. 2005).
f This species is listed under the federal SARA, and/or the provincial Endangered Species Act 2007; however,its federal or provincial recovery documents have not yet been finalized.
g A species of management interest due to its very high abundance.
| Bird Group | Number of Species | Percent of Total Number of Species | Number of Priority Species | Percent Listed as Priority by Bird Group | Percent of Total Number of Priority Species |
|---|---|---|---|---|---|
| Landbird | 171 | 66% | 61 | 36% | 61% |
| Shorebird | 29 | 11% | 7 | 24% | 7% |
| Waterbird | 29 | 11% | 15 | 52% | 15% |
| Waterfowl | 31 | 12% | 17 | 55% | 17% |
| Total | 260 | 100% | 100 | - | 100% |
Note: All assessments, listings and designations are current to November 2013.
| Priority Listingh | Landbird | Shorebird | Waterbird | Waterfowl |
|---|---|---|---|---|
| COSEWICi | 19 | 2 | 3 | 0 |
| SARAj | 14 | 2 | 2 | 0 |
| SAROk | 16 | 2 | 5 | 0 |
| National/Continental Concern | 26 | 6 | 7 | 9 |
| National/Continental Stewardshipl | 15 | Not Available (N/A) | N/A | N/A |
| Regional/Subregional Concernm | 44 | 7 | 15 | 17 |
| Regional/Subregional Stewardship | 21 | N/A | N/A | N/A |
| Management Interestn | 0 | 0 | 0 | 1 |
h A single species can be on the priority list for more than one reason.
i Assessed by COSEWIC as Endangered, Threatened or Special Concern.
j Species listed on Schedule 1 of SARA as Endangered, Threatened or Special Concern).
k Species listed as Endangered, Threatened or Special Concern on the SARO List.
l Only the landbird group distinguishes stewardship species from other priority species (see Panjabi et al. 2005).
m Regional refers to BCR-wide (i.e. all jurisdictional data were used for the entire BCR) while Subregional refers to the Ontario portion of the BCR only (i.e. Ontario BCR data were used).
n A species of management interest due to its very high abundance.
Element 2: Habitats important to priority species
Identifying the broad habitat requirements for each priority species within the BCR allowed species to be grouped by shared habitat-based conservation issues and actions (see Element 2 in Appendix 2 for details on how species were assigned to standard habitat categories). If many priority species associated with the same habitat class face similar conservation issues, then conservation action in that habitat class may support populations of several priority species. BCR strategies use a modified version of the standard land cover classes (Land Cover Classification System, LCCS) developed by the United Nations (Food and Agriculture Organization 2000) to categorize habitats, and species were often assigned to more than one habitat class.
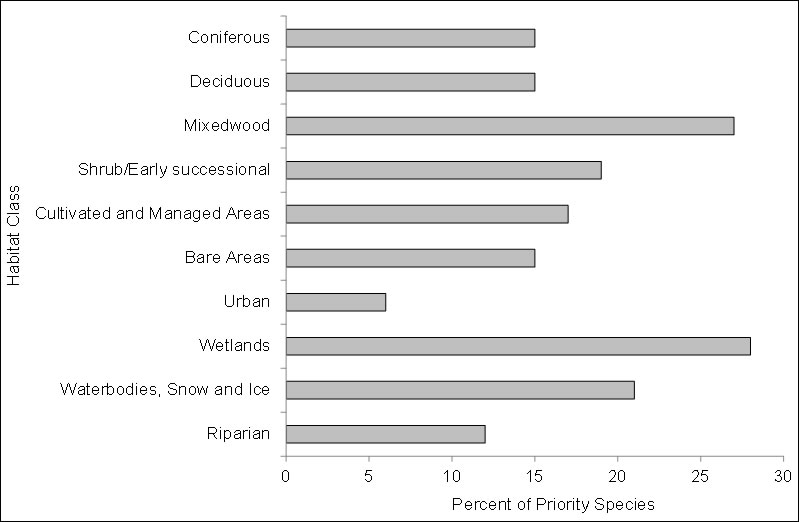
Priority species varied widely in their use of 10 habitat types in BCR 12 ON (Figure 4). Wetlands were used by the greatest number of priority species (28%), while mixed, deciduous and coniferous forests were a preferred habitat type for 27%, 15% and 15% of priority species, respectively. Waterbodies, including the Great Lakes, were used extensively by 21% of priority species, followed by shrub and early successional habitats, which were used by 19%.
Figure 4. Percent of priority species that are associated with each habitat type in BCR 12 ON.
Note: The total exceeds 100% because each species may use more than one habitat.
Long description for Figure 4
A horizontal bar graph indicating the percent of priority species (x axis) that are associated with each habitat type (y axis: shrub/early successional; lichens/mosses; herbaceous; bare areas; wetlands; waterbodies, snow and ice; coastal (above high tide); and riparian) in BCR 3 Newfoundland and Labrador Region. Note: The total exceeds 100% because each species may be assigned to more than one habitat.
| Habitat Class | Percent |
|---|---|
| Coniferous | 13 |
| Deciduous | 15 |
| Mixedwood | 27 |
| Shrub/Early successional | 19 |
| Cultivated and Managed Areas | 17 |
| Bare Areas | 15 |
| Urban (Artificial Surfaces and Bare Areas) | 6 |
| Wetlands | 28 |
| Waterbodies, Snow and Ice | 21 |
| Riparian | 12 |
Element 3: Population objectives
Population objectives allow us to measure and evaluate conservation success. The objectives in this strategy are assigned to categories and are based on a quantitative or qualitative assessment of species’ population trends. If the population trend of a species is unknown, the objective is set as “assess and maintain,” and a monitoring objective is given (see Appendix 2). For any species listed under SARA or under provincial/territorial endangered species legislation, Bird Conservation Strategies defer to population objectives in available Recovery Strategies and Management Plans. If recovery documents are not yet available, interim breeding population objectives are provided by species, by habitat in Section 2. When recovery objectives are available, they will replace the interim objectives. For more details on methodology, refer to Appendix 2. The ultimate measure of conservation success will be the extent to which population objectives have been reached within the timeframes set by national and continental bird conservation plans.
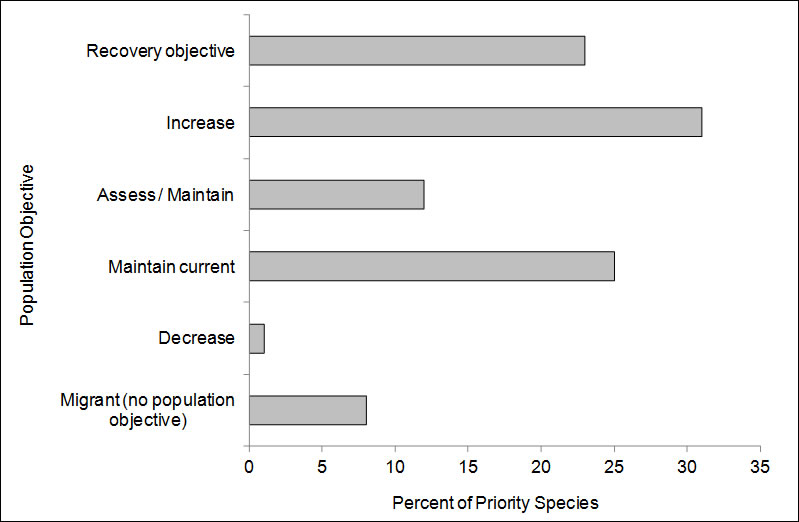
BCR 12 ON has good coverage by several large-scale bird surveys such as the Breeding Bird Survey, the Christmas Bird Count, the Ontario Breeding Bird Atlas, the Ontario Shorebird Survey, the Eastern Waterfowl Survey, the Great Lakes Marsh Monitoring Program and the Great Lakes Colonial Waterbird Monitoring Surveys. Consequently, in contrast to some other BCRs in Canada, data exist to evaluate the population status for a majority of species. For a large number of priority species (31%), monitoring data suggested declines with sufficient certainty to support an objective of increasing population size. Maintaining populations at current levels was the objective for 25% of the priority species in BCR 12 ON, while only 12% were assigned a population objective of Assess/Maintain because monitoring data was insufficient to propose an objective (Figure 5).
Population objectives relating to species recovery were assigned to 23% of priority species, though many have interim objectives as mentioned above. In contrast, populations were sufficiently elevated to warrant a reduction in population size for only a single priority species: the Canada Goose, Eastern Temperate-breeding population. Priority species that were identified as migrating through BCR 12 ON were not assigned an objective (8%), as those were set in other BCR strategies covering the breeding range of these species (Figure 5).
Figure 5. Percent of priority species that are associated with each habitat type in BCR 12 ON.
Long description for Figure 5
A horizontal bar graph indicating the percent of priority species (x axis) that are associated with each population objective (y axis; recovery objective, increase, assess/maintain, maintain current, decrease, migrant) in BCR 12 Ontario Region.
| Population Objective | Percent |
|---|---|
| Recovery objective | 23 |
| Increase | 31 |
| Assess / Maintain | 12 |
| Maintain current | 25 |
| Decrease | 1 |
| Migrant (no population objective) | 8 |
Element 4: Threat assessment for priority species
Bird population trends are driven by factors that negatively affect either their reproduction or survival during any point in their annual life cycle. Threats that can reduce survival include, for example, reduced food availability at migratory stopovers or exposure to toxic compounds. Examples of threats that can reduce reproductive success may include high levels of nest predation or reduced quality or quantity of breeding habitat.
The threats assessment process (which is based on the methods described in Salafsky et al. 2008; see Appendix 2) identifies threats believed to have a population-level effect on individual priority species. These threats are assigned a relative magnitude (Low, Medium, High, Very High), based on their scope (the proportion of the species’ range within the subregion that is impacted) and severity (the relative impact on the priority species’ population). This allows us to target conservation actions towards threats with the greatest effects on suites of species or in broad habitat classes. Some well-known conservation issues may not be identified in the literature as significant threats to populations of an individual priority species and therefore may not be captured in the threat assessment. However, they merit attention in conservation strategies because of the large numbers of individual birds affected in many regions of Canada. Usually these issues transcend habitat types and are considered “widespread,” and these issues are addressed in a separate section (see Section 3: Widespread Issues), but unlike other threats, they are not ranked (e.g., climate change and severe weather; threat category 11).
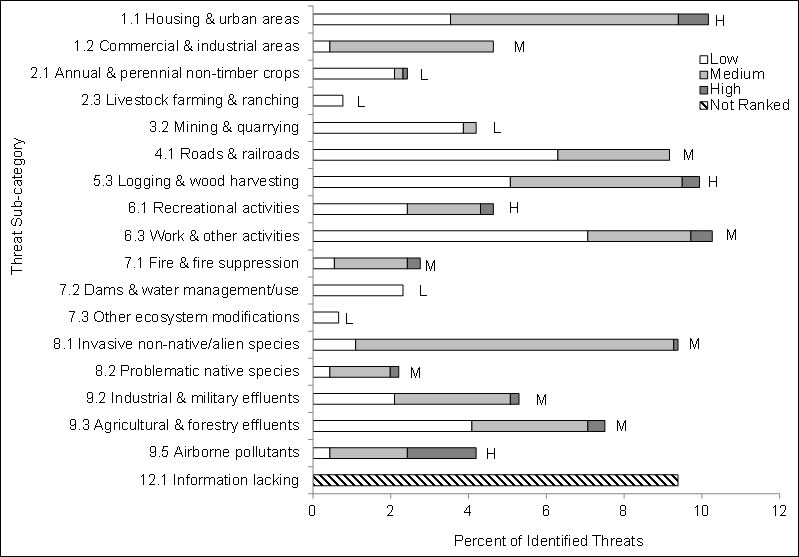
In BCR 12 ON, threat category 12 “other direct threats” and sub-category 12.1 “Information lacking” was used to identify priority species that lack adequate biological or demographic information required for population conservation and management. Using this category in this manner facilitated the development of targeted research and monitoring conservation actions to address knowledge gaps for these species, but unlike the other threats, they were not ranked (Figure 6).
A large number and diversity of anthropogenic threats and other conservation issues facing priority species in the various habitats of BCR 12 ON were identified (Fig. 6 and Table 5). Major threats to priority species relate to habitat loss and degradation from a variety of sources including residential and commercial development (threat category 1), biological resource use (category 5), pollution (category 9), and human disturbance (category 6). Within BCR 12 ON, threats related to climate change and severe weather (category 11) were considered to be widespread and as such are addressed in the Widespread Issues section of this strategy.
Cumulative effects of threats to priority species
For several of the threats identified in this strategy, the long-term effects are equal to or greater than the sum of the effects of the individual threats. There is no standardized method for assessing these “cumulative effects.” The threat ranking and roll-up procedures (Table 5; Appendix 2) demonstrate the sum of effects for threats within and among threat categories, and are useful for identifying the most important threats within a habitat class. These procedures also identify whether a large number of low-level threats may be affecting a species. However, it is important to consider that threats might interact in unanticipated ways, or that in aggregate, threats might exceed some ecological threshold to produce cumulative effects of an unanticipated magnitude. Cumulative impact studies assessing population responses to multiple stressors are an important tool to better understand the long-term consequences of some of the threats described in this strategy.
Threats to priority species while they are outside Canada during the non-breeding season were also assessed and are presented in the section Threats Outside Canada.
Figure 6. Percent of priority species that are associated with each habitat type in BCR 12 ON.
Note: Each bar represents the percent of the total number of threats identified in each threat sub-category in BCR 12 ON (for example, if 100 threats were identified in total for all priority species in BCR 12 ON, and 10 of those threats were in the category 9.5 Airborne pollutants, the bar on the graph would represent this as 10%). Shading in the bars (H = high, M = medium and L = low) represents the magnitude of the threats in each threat sub-category in the BCR. The bars are divided to show the distribution of Low (L), Medium (M) and High (H) rankings of individual threats within each threat sub-category. For example, the same threat may have been ranked H for one species and L for another; the shading illustrates the proportion of L, M and H rankings in the sub-category). The overall rolled up magnitude of the sub-threat is shown at the end of each bar (also presented in Table 5). Threat sub-category 12.1 Information lacking was not ranked. See Element 4 in Appendix 2 for details on how magnitude was assessed).
Long description for Figure 6
A horizontal bar graph indicating the percent of identified threats to priority species (x axis) within BCR 12 Ontario Region by threat subcategory (y axis; Recreational activities, Roads and railroads, etc.).
Each bar represents the percent of the total number of threats identified in each sub-threat category in BCR 12 ON (for example, if 100 threats were identified in total for all priority species in BCR 12 ON, and 10 of those threats were in the category 1.1 "Housing and urban areas", the bar on the graph would represent this as 10%). Shading in the bars (NR = not ranked, H = high, M = medium and L = low) represents the rolled-up magnitude of all threats in each threat subcategory in the BCR.
| Threat Sub-category | L | M | H | NR |
|---|---|---|---|---|
| 1.1 Housing and urban areas | 3.47 | 5.94 | 0.78 | - |
| 1.2 Commercial and industrial areas | 0.45 | 4.26 | - | - |
| 2.1 Annual and perennial non-timber crops | 2.13 | 0.22 | 0.11 | - |
| 2.3 Livestock farming and ranching | 0.78 | - | - | - |
| 3.2 Mining and quarrying | 3.92 | 0.34 | - | - |
| 4.1 Roads and railroads | 6.27 | 2.91 | - | - |
| 5.3 Logging and wood harvesting | 4.93 | 4.48 | 0.45 | - |
| 6.1 Recreational activities | 2.46 | 1.9 | 0.34 | - |
| 6.3 Work and other activities | 7.17 | 2.69 | 0.56 | - |
| 7.1 Fire and fire suppression | 0.56 | 1.68 | 0.34 | - |
| 7.2 Dams and water management/use | 2.35 | - | - | - |
| 7.3 Other ecosystem modifications | 0.67 | - | - | - |
| 8.1 Invasive non-native/alien species | 1.01 | 8.29 | 0.11 | - |
| 8.2 Problematic native species | 0.45 | 1.57 | 0.22 | - |
| 9.2 Industrial and military effluents | 2.13 | 3.02 | 0.22 | - |
| 9.3 Agricultural and forestry effluents | 4.03 | 3.02 | 0.45 | - |
| 9.5 Airborne pollutants | 0.45 | 2.02 | 1.79 | - |
| 12.1 Information lacking | - | - | - | 9.07 |
Table 5. Relative magnitude of identified threats to priority species within BCR 12 ON by threat category and broad habitat class. Accessible Version of Table 5.
Element 5: Conservation objectives
Conservation objectives were designed to address threats and information gaps that were identified for priority species. They describe the environmental conditions and research and monitoring that are thought to be necessary for progress towards population objectives and to understand underlying conservation issues for priority bird species. As conservation objectives are reached, they will collectively contribute to achieving population objectives. Whenever possible, conservation objectives were developed to benefit multiple species and/or respond to more than one threat (see Appendix 2).
For BCR 12 ON, many conservation objectives identified relate to ensuring an adequate supply and quality of habitat (conservation objective category 1; Figure 7). Included in these objectives are the maintenance of the full range of naturally occurring habitat types, maintaining the quality of existing habitats, and retaining important features on the landscape (e.g., standing dead snags for cavity nesting birds). Also important is the need to manage individual species (category 3). Most of the objectives in this category relate to the prevention and control of invasive and exotic species as well as the development and/or implementation of recovery strategies and management plans for species at risk in BCR 12 ON. Another frequently identified conservation objective category reflects the need to improve understanding of factors causing population declines of priority species, as well as enhancing population/demographic and habitat monitoring across the BCR (category 7). Other objectives address the need to reduce human disturbance of priority species (category 4), ensure adequate food supply through the maintenance of natural food webs and prey sources (category 5), and to reduce mortality (and/or sub-lethal effects) through reductions in pesticide (including herbicide) use across the BCR (category 2).
Figure 7. Percent of all conservation objectives assigned to each conservation objective category in Ontario BCR 12 ON.
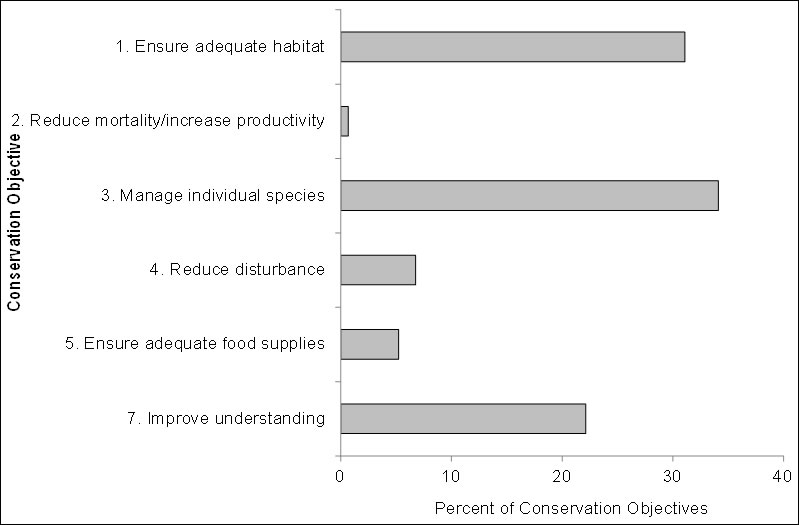
Long description for Figure 7
A horizontal bar graph indicating the percent of all conservation objectives (x axis) assigned to each conservation objective category (y axis; Ensure adequate habitat, Reduce disturbance, etc.) in BCR 12 Ontario Region.
| Conservation Objective | Percent |
|---|---|
| 1. Ensure adequate habitat | 31.16 |
| 2. Reduce mortality/increase productivity | 0.68 |
| 3. Manage individual species | 33.9 |
| 4. Reduce disturbance | 6.85 |
| 5. Ensure adequate food supplies | 5.31 |
| 7. Improve understanding | 22.09 |
Element 6: Recommended actions
Recommended actions indicate on-the-ground activities that will help to achieve the conservation objectives (Figure 8). Actions are strategic rather than highly detailed and prescriptive (see Appendix 2). Whenever possible, recommended actions benefit multiple species, and/or respond to more than one threat. Recommended actions defer to or support those provided in recovery documents for species at risk at the federal, provincial or territorial level, and will usually be more general than those developed for individual species. However, for detailed recommendations for species at risk, readers should consult published federal recovery documents (Species at Risk Public Registry 2013) or provincial recovery documents (Ontario Ministry of Natural Resources 2013b). Similarly, a number of landbird species included in this strategy are stewardship species as defined by Partners In Flight (Rich et al. 2004). These are species with stable populations or for which no specific conservation issues have been identified, but which depend on BCR 12 ON to such an extent that the region has a high responsibility for their protection. These species may not appear prominently in the threats, objectives and actions described herein, but should benefit from the implementation of recommended actions that target multiple species.
A majority of conservation objectives were related to the protection or restoration of habitats, and accordingly, the more specific conservation actions also relate to this theme. Recommended actions are diverse in their approach (Figure 8) and include developing and implementing effective policies and regulations (action sub-category 5.2), promoting the development and use of BMPs (sub-category 5.3), undertaking actions to promote awareness of issues (sub-category 4.3), improving the scientific knowledge that underlies management decisions (sub-category 8.1), improving monitoring to track the effectiveness of conservation activities (sub-category 8.2), and restoring habitat and natural processes (sub-category 2.3), driven in part by the role of fire suppression and logging practices in altering natural cycles.
Figure 8. Percent of recommended actions assigned to each sub-category in BCR 12 ON.
Note: "Research" and "Monitoring" actions refer to specific individual species where information is required to support conservation and management. For a discussion of broad-scale research and monitoring requirements, see the section on Research and Population Monitoring Needs (Section 3).
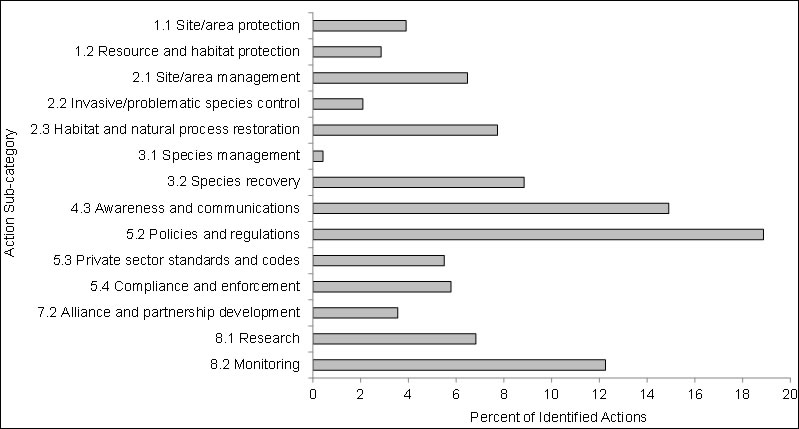
Long description for Figure 8
A horizontal bar graph indicating the percent of recommended action (x axis) assigned to each sub-category of recommended actions (y axis; Site/area protection, Species management, etc.) in BCR 12 Ontario Region.
| Conservation Action | Percent |
|---|---|
| 1.1 Site/area protection | 3.85 |
| 1.2 Resource and habitat protection | 2.82 |
| 2.1 Site/area management | 6.4 |
| 2.2 Invasive/problematic species control | 2.06 |
| 2.3 Habitat and natural process restoration | 7.64 |
| 3.1 Species management | 0.41 |
| 3.2 Species recovery | 8.47 |
| 4.3 Awareness and communications | 14.59 |
| 5.2 Policies and regulations | 18.51 |
| 5.3 Private sector standards and codes | 5.44 |
| 5.4 Compliance and enforcement | 5.71 |
| 7.2 Alliance and partnership development | 5.37 |
| 8.1 Research | 6.68 |
| 8.2 Monitoring | 12.04 |