
Bird conservation strategy for Region 8: Prairie and Northern boreal softwood shield, section 1
Table of Contents
Section 1: Summary of Results - All Birds, All Habitats
Element 1: Priority species assessment
These Bird Conservation Strategies identify “priority species” from all regularly occurring bird species in each BCR subregion. Species that are vulnerable due to population size, distribution, population trend, abundance and threats are included because of their “conservation concern.” Some widely distributed and abundant “stewardship” species are also included. Stewardship species are included because they typify the national or regional avifauna and/or because they have a large proportion of their range and/or continental population in the subregion; many of these species have some conservation concern, while others may not require specific conservation effort at this time. Species of management concern are also included as priority species when they are at (or above) their desired population objectives but require ongoing management because of their socio-economic importance as game species or because of their impacts on other species or habitats.
The purpose of the prioritization exercise is to focus implementation efforts on the issues of greatest significance for Canadian avifauna. Table 1 provides a full list of all priority species and their reason for inclusion. Tables 2 and 3 summarize the number of priority species in BCR 8 PNR Boreal Softwood Shield by bird group and by the reason for priority status.
Within BCR 8 PNR, 215 species of birds are known to occur, and of these, 67 have been identified as priority species based on their distribution and abundance, their threats, their federal and provincial status, their inclusion in regional and continental conservation/ stewardship plans or based on expert opinion (Table 1). Of the 4 bird groups (landbirds, shorebirds, waterbirds and waterfowl), landbirds comprise 152 of the 215 species in the region. While they represent 57% of all priority species, only 25% of the landbirds present were identified as priority species (Table 2). Both shorebirds and waterbirds had half or more of their species listed as priority (Table 2), but the lower number of species means that they represent a much smaller proportion of the total list. Priority landbirds were identified primarily as Stewardship species using continental methods with regional data or because of General Status (GS) ranks, while priority shorebirds, waterbirds and waterfowl were identified largely through continental or regional bird group plans (Table 3).
Table 1. Priority species in BCR 8 PNR, population objective and the reason for priority status. Accessible Version of Table 1
| Bird Group | Total Species | Total Priority Species | Percent Listed as Priority | Percent of Priority List |
|---|---|---|---|---|
| Landbird | 152 | 38 | 25% | 57% |
| Shorebird | 12 | 6 | 50% | 9% |
| Waterbird | 24 | 14 | 58% | 21% |
| Waterfowl | 27 | 9 | 33% | 13% |
| Total | 215 | 67 | 31% | 100% |
| Reason for Priority Listinga | Landbirds | Shorebirds | Waterbirds | Waterfowl |
|---|---|---|---|---|
| Federal SARA listedb | 7 | 0 | 1 | 0 |
| COSEWICc | 9 | 0 | 2 | 0 |
| Provincially listedd | 2 | 0 | 0 | 0 |
| Continental/Regional Concerne | 2 | 6 | 12 | 9 |
| Stewardshipf | 14 | 0 | 0 | 0 |
| NAWMPg | 0 | 0 | 0 | 9 |
| GSh | 19 | 1 | 7 | 3 |
| Expert Opinioni | 1 | 0 | 1 | 0 |
a A single species can be on the priority list for more than one reason. Note that not all reasons for inclusion apply to every bird group (indicated by “-”).
b Species listed on Schedule 1 of the Species at Risk Act (SARA) as Endangered, Threatened or Special Concern.
c COSEWIC indicates species assessed by the Committee on the Status of Endangered Wildlife in Canada as Endangered, Threatened or Special Concern.
d Provincial Status = species legally protected under provincial/territorial legislation: Alberta’s Wildlife Act; Saskatchewan’s The Wildlife Act; Manitoba’s The Endangered Species Act.
e Cont./Reg. Concern = Continental or Regional Conservation Concern; species of concern identified by bird group protocols using continental (shorebirds and waterbirds) or BCR-specific (landbirds) data.
f Stewardship = landbirds identified as stewardship species using BCR-specific data.
g NAWMP = North American Waterfowl Management Plan (2004); the regional breeding or non-breeding need in Waterfowl Conservation Region 8.1 (where both values were available, we report the highest; waterfowl only).
h GS = species with a provincial/territorial General Status rank ≤3 (At Risk, May Be At Risk or Sensitive).
i Expert Opinion = species added based on expert knowledge.
Element 2: Habitats important to priority species
Identifying the broad habitat requirements for each priority species within the BCR allowed species to be grouped by shared habitat-based conservation issues and actions. If many priority species associated with the same habitat face similar conservation issues, then conservation action in that habitat may support populations of several priority species. BCR strategies use a modified version of the standard land cover classes developed by the United Nations (Food and Agricultural Organization 2000) to categorize habitats, and species were often assigned to more than one habitat class.
Within BCR 8 PNR, the most important habitat type for priority species are wetlands, followed by the various woody habitat types (mixed wood, deciduous, coniferous, shrub/early successional; Figure 3). These habitat types are also of particular importance for targeted conservation actions, as they will have the greatest potential benefit for priority species.
Figure 3. Percent of priority species that are associated with each habitat class in BCR 8 PNR.

Text Description for Figure 3
A horizontal bar graph indicating the percent of priority species (x axis) that are associated with each habitat type (y axis: coniferous, deciduous, mixed, shrub/early successional, herbaceous, cultivated and managed areas, urban, wetlands, waterbodies and bare areas) in BCR 8 Prairie and Northern Region.
Note: The total exceeds 100% because each species may be assigned to more than one habitat.
| Habitat Class | Percent |
|---|---|
| Coniferous | 31.34 |
| Deciduous | 34.33 |
| Mixed | 44.78 |
| Shrub/Early Successional | 34.33 |
| Herbaceous | 25.37 |
| Cultivated and Managed Areas | 26.87 |
| Urban | 11.94 |
| Wetlands | 61.19 |
| Waterbodies | 37.31 |
| Bare Areas | 13.43 |
Element 3: Population objectives

Canada Warbler photo: © William H. Majoros
Population objectives allow us to measure and evaluate conservation success. The objectives in this strategy are assigned to categories and are based on a quantitative or qualitative assessment of species’ population trends. If the population trend of a species is unknown, the objective is set as “assess and maintain,” and a monitoring objective is given. For any species listed under the Species at Risk Act (SARA) or under provincial/territorial endangered species legislation, Bird Conservation Strategies defer to population objectives in available Recovery Strategies and Management Plans. The ultimate measure of conservation success will be the extent to which population objectives have been reached over the next 40 years. Population objectives do not currently factor in feasibility of achievement, but are held as a standard against which to measure progress.
The majority of species within BCR 8 PNR had a population objective of “assess/maintain,” reflecting both the general lack of information about many species within this BCR, and that many populations within the region are currently at desired population levels because of a relatively pristine landscape with few threats and impacts (Figure 4). There are 11 species (mostly landbirds) that have been assessed by COSEWIC as at risk, 9 of which are listed on Schedule 1 of SARA. Recovery planning initiatives are ongoing for these listed species. Roughly one-third of the species had population objectives to increase by 50% or 100%, which were proportionally distributed amongst the 4 bird groups. Most species with objectives to increase populations were migratory in nature and are likely limited by factors found outside BCR 8 PNR. Conservation actions should be prioritized according to potential benefits for species whose population objectives are to increase their abundance.
Figure 4. Percent of priority species that are associated with each habitat class in BCR 8 PNR.
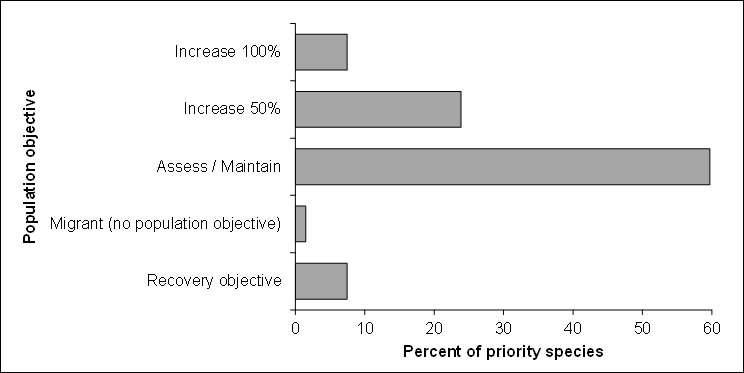
Text Description for Figure 4
A horizontal bar graph indicating the percent of priority species (x axis) that are associated with each population objective (y axis; increase 100%, increase 50%, assess/maintain, migrant, recovery objective) in BCR 8 Prairie and Northern Region.
| Population objective | Percent |
|---|---|
| Increase 100% | 7.46 |
| Increase 50% | 23.88 |
| Assess / Maintain | 59.7 |
| Migrant (no population objective) | 1.49 |
| Recovery objective | 7.46 |
Element 4: Threat assessment for priority species
The threats assessment process identifies threats believed to have a population-level effect on individual priority species. These threats are assigned a relative magnitude (Low, Medium, High, Very High), based on their scope (the proportion of the species’ range within the subregion that is impacted) and severity (the relative impact on the priority species’ population). This allows us to target conservation actions towards threats with the greatest effects on suites of species or in broad habitat classes. Some well-known conservation issues (such as predation by domestic cats or climate change) may not be identified in the literature as significant threats to populations of an individual priority species and therefore may not be captured in the threat assessment. However, they merit attention in conservation strategies because of the large numbers of individual birds affected in many regions of Canada. We have incorporated them in a separate section on Widespread Issues, but, unlike other threats, they are not ranked.
Overall, the threats identified for priority species in this BCR were of low magnitude at both the threat category and threat sub-category levels (Figure 5; Table 4). This reflects the relatively pristine state of this region due to its remoteness and lack of human habitation and disturbance. Logging and wood harvesting activities (threat sub-category 5.3) represented the most frequently identified threat to priority species, due to the extent of forests and the large scale of forestry activities in BCR 8 PNR; however, none of the threats in this sub-category had sufficient impacts to priority species to be given a threat magnitude above low. While control of superabundant food sources associated with these forests, such as spruce budworm outbreaks, can represent an issue for some bird populations, there are no extensive spray programs within BCR 8 PNR.
Numerous industrial developments within and outside BCR 8 PNR release environmental contaminants, including effluents and airborne pollutants, but these do not currently constitute a threat to bird populations here. Early signs of increasing ecosystem acidification of PNR BCR 8 have been documented in the western extent due to long-range transport of pollutants from oil sands development upwind of the region (Jeffries et al. 2010, Government of Saskatchewan 2013, Turcotte et al. in prep.). Acidification can alter the structure and function of aquatic and terrestrial ecosystems and has been previously linked to decreases in calcium availability and invertebrate abundance, both of which can impact on bird populations and communities (Hames et al. 2002, Pabian and Brittingham 2011, Pabian and Brittingham 2012), and thus pollution as a threat (sub-category 9.5 Airborne Pollutants) merits reassessment in future updates.
Figure 5. Percent of identified threats to priority species within BCR 8 PNR by threat sub-category.
Note: Each bar represents the percent of the total number of threats identified in each threat sub-category in BCR 8 PNR (for example, if 100 threats were identified in total for all priority species in BCR 8 PNR, and 10 of those threats were in the category 6.3 Work and other activities, the bar on the graph would represent this as 10%). Shading in the bars (M = medium and L = low) represents the rolled-up magnitude of all threats in each threat sub-category in the BCR.
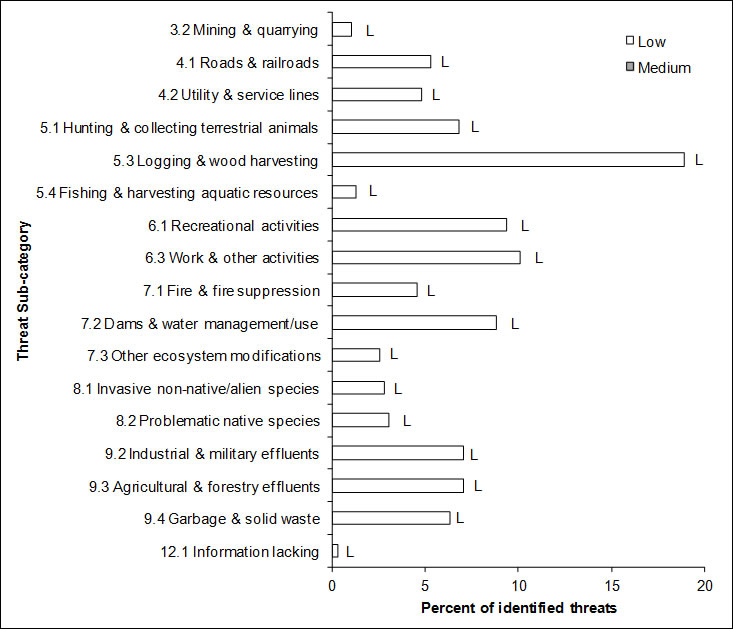
Text Description for Figure 5
A horizontal bar graph indicating the percent of identified threats to priority species (x axis) within BCR 8 Prairie and Northern Region by threat subcategory (y axis; Recreational Activities, Logging and wood harvesting, etc.).
Each bar represents the percent of the total number of threats identified in each sub-threat category in BCR 8 PNR (for example, if 100 threats were identified in total for all priority species in BCR 8 PNR, and 10 of those threats were in the category 1.1 “Housing and urban areas”, the bar on the graph would represent this as 10%). Shading in the bars (VH = very high, H = high, M = medium and L = low) represents the rolled-up magnitude of all threats in each threat subcategory in the BCR.
| Threat sub-category | L | M | H | VH |
|---|---|---|---|---|
| 1.2 Commercial and industrial areas | 8.76 | - | - | - |
| 3.2 Mining and quarrying | 0.9 | - | - | - |
| 4.1 Roads and railroads | 4.72 | - | - | - |
| 4.2 Utility and service lines | 4.27 | - | - | - |
| 5.1 Hunting and collecting terrestrial animals | 6.07 | - | - | - |
| 5.3 Logging and wood harvesting | 16.85 | - | - | - |
| 5.4 Fishing and harvesting aquatic resources | 1.12 | - | - | - |
| 6.1 Recreational activities | 8.31 | - | - | - |
| 6.3 Work and other activities | 8.99 | - | - | - |
| 7.1 Fire and fire suppression | 4.04 | - | - | - |
| 7.2 Dams and water management/use | 7.87 | - | - | - |
| 7.3 Other ecosystem modifications | 2.25 | - | - | - |
| 8.1 Invasive non-native/alien species | 2.47 | - | - | - |
| 8.2 Problematic native species | 2.7 | 1.35 | - | - |
| 9.2 Industrial and military effluents | 6.29 | - | - | - |
| 9.3 Agricultural and forestry effluents | 6.29 | - | - | - |
| 9.4 Garbage and solid waste | 5.62 | - | - | - |
| 12.1 Information lacking | 0.22 | - | - | - |
Note: Overall ranks were generated through a roll-up procedure described in Kennedy et al. (2012). L and M represent Low and Medium Magnitude threats, respectively. Blank cells indicate that no priority species had threats identified in the threat category/habitat combination.
Table 4. Relative magnitude of identified threats to priority species within BCR 8 PNR by threat category and broad habitat class. Accessible Version of Table 4
Element 5: Conservation objectives

Wilson’s Snipe Photo: © Cephas
Conservation objectives were designed to address threats and information gaps that were identified for priority species. They describe the environmental conditions and research and monitoring that are thought to be necessary for progress towards population objectives and to understand underlying conservation issues for priority bird species. As conservation objectives are reached, they will collectively contribute to achieving population objectives. Whenever possible, conservation objectives were developed to benefit multiple species, and/or respond to more than one.
For BCR 8 PNR, no threats identified for individual species were assessed at a magnitude of “medium” or greater. Therefore no specific conservation objectives or associated actions are presented, as per Kennedy et al. (2012).
Element 6: Recommended actions

California Gull photo: © Alan Vernon
Recommended actions indicate on-the-ground activities that will help to achieve the conservation objectives (Figure 7). Actions are strategic rather than highly detailed and prescriptive. Whenever possible, recommended actions benefit multiple species, and/or respond to more than one threat. Recommended actions defer to or support those provided in recovery documents for species at risk at the federal, provincial or territorial level, but will usually be more general than those developed for individual species.
For BCR 8 PNR no threats identified for individual species were assessed at a magnitude of “medium” or greater. Therefore no specific conservation objectives or associated actions were developed as per Kennedy et al. (2012). Many of the threats facing priority bird species in BCR 8 PNR are not well understood; this may be due to inadequate monitoring for most species, which leads to uncertainty in BCR population trends, or a lack of evidence establishing causative relationships between human activities and population declines.
These knowledge gaps will often be best addressed using an adaptive management approach, which iteratively employs management actions as scientific experiments to test specific hypotheses to inform future management decisions (Walters et al. 1992). As the dominant habitat types within BCR 8 PNR are forests, beneficial management practices for forest ecosystems will help to maintain breeding habitat for many bird species.