
Canadian Protected Areas Status Report 2012 to 2015: chapter 1
Chapter 1: Extent and Growth of Canada’s Protected Areas
- Extent and growth
- Governance of Canada’s protected areas
- Ecological representativeness
- International Union for the Conservation of Nature management categories
- International perspective (2014)
Protected areas play a critical role in Canada’s efforts to conserve nature. They protect important parts of Canada’s ecosystems, maintain essential ecosystem services, safeguard habitat and provide opportunities for tourism, recreation, and connections with nature. This first chapter provides an overview of the status of protected areas nationally including the growth of terrestrial and marine protected areas from 2012 to 2015. Information is also provided on the distribution of protected areas by biome (terrestrial and marine), on the ecological representativeness of Canada’s protected areas, and on the distribution of protected areas by governance regime and management approach according to International Union for the Conservation of Nature’s classification. A brief overview of how Canada’s protected areas network compares internationally is also presented.
Source: Canadian Council on Ecological Areas Conservation Areas Reporting and Tracking System (CARTS) (2016). Data are current as of 31 December, 2015.
Long description for Map 1
The map shows the distribution and size of terrestrial (land and freshwater) protected areas and marine protected areas in 2015.
Extent and growth
At the end of 2015, 10.6% (1.05 million km2) of Canada's terrestrial area (including both land and freshwater) and 0.90% (51 thousand km2)Footnote1 of its marine territory were recognized as protected (Figure 1). This is an increase from the previous report ( 2011), when 9.8% of Canada’s terrestrial area and 0.88% of its marine area were recognized as protected.
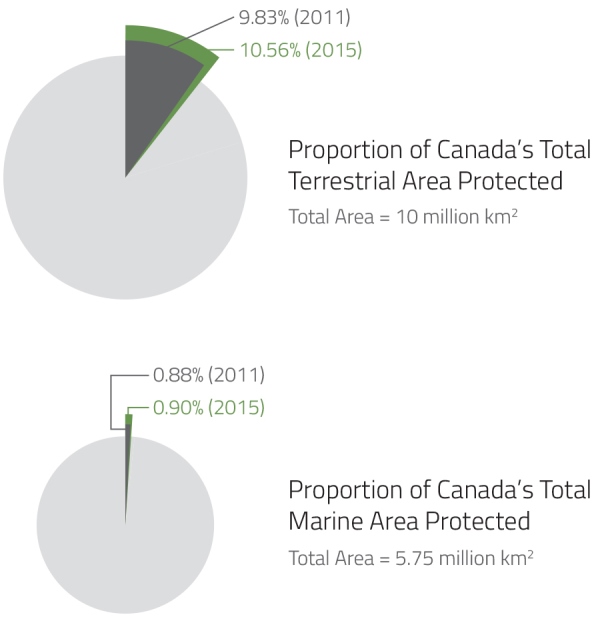
Note: Percent coverage is based on a total terrestrial area for Canada of 9 984 670 km2 and an estimated marine area of approximately 5 750 000 km2
Long description for Figure 1
The figure shows a representation of Canada's total terrestrial area and total marine area along with the proportions of each that were protected in 2011 and 2015. It shows that in 2011, 9.38% of Canada's total terrestrial area was protected. This number increased to 10.56% in 2015. For Canada's marine protected areas, 0.88% were protected in 2011, while 0.90% were protected in 2015.
Data for Figure 1
| - | Area protected in 2011 (km2) | Proportion of total area in 2011 (%) | Area Protected in 2015 (km2) | Proportion of total area in 2015 (%) |
|---|---|---|---|---|
| Terrestrial area protected (km2) | 981 496 | 9.83 | 1 054 057 | 10.56 |
| Marine area protected (km2) | 50 849 | 0.88 | 51 499 | 0.90 |
Since the end of 2011, approximately 72 560 km2 of terrestrial area, and 650 km2 of marine area have been added. This represents a growth of 7.4% in the extent of terrestrial protected areas and an increase of 1.3% in the extent of marine protected areas over this four-year period (Figure 2).
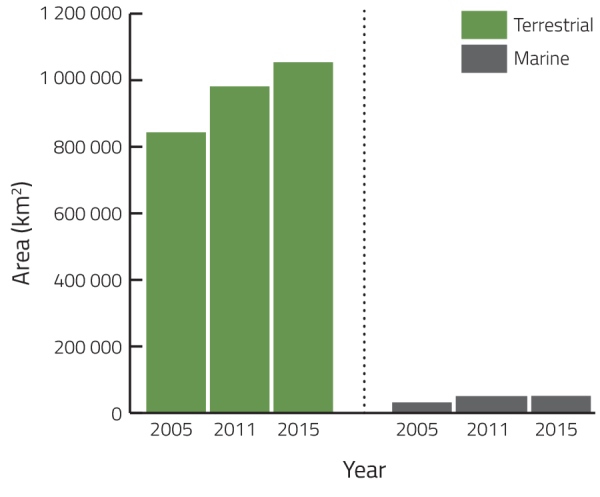
Long description for Figure 2
The bar graph shows the area protected in square kilometers in both the marine and terrestrial biomes in Canada in 2006, 2011 and 2015.
Data for Figure 2
| Biome | Year | Area protected (km2) |
|---|---|---|
| Terrestrial | 2006 | 836 026 |
| Terrestrial | 2011 | 981 496 |
| Terrestrial | 2015 | 1 054 057 |
| Marine | 2006 | 31 571 |
| Marine | 2011 | 50 849 |
| Marine | 2015 | 51 499 |
At the end of 2015, there were over 7 100 terrestrial protected areas in Canada, up from 4 660 terrestrial protected areas at the end of 2011, and 740 marine protected areas, up from 723 in 2011. This reflects a total of 2 446 new terrestrial protected areas and 17 marine protected areas added to Canada’s protected areas network since 2011.
It is important to note that at the present time the majority of Canada’s marine protected areas are in fact the marine portions of terrestrial protected areas. Queen Maude Gulf Migratory Bird Sanctuary is a good example. This 62 000 km2 protected area includes 6 553 km2 of marine habitat. The legislation that protects the area (in this case, the Migratory Bird Convention Act) does not include powers specific to the marine environment. Canada’s current approach to accounting for marine protected areas includes those portions of terrestrial protected areas that fall in the marine environment, so the marine area is treated the same as the terrestrial area without specific consideration of activities in the marine water column.
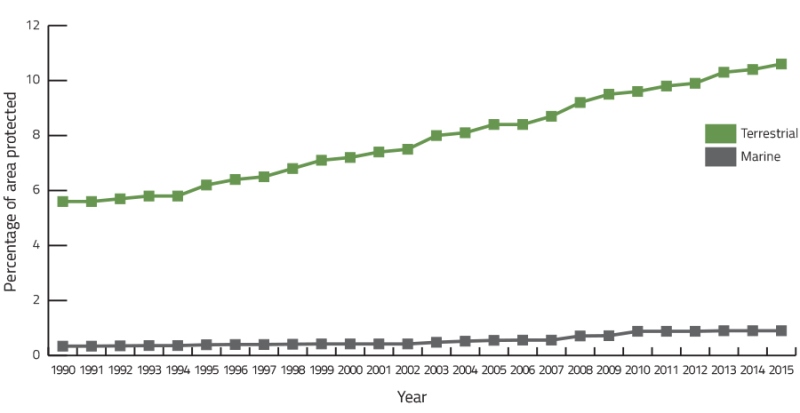
While the overall area protected has increased since 2011, the annual growth rate of terrestrial protected areas in Canada slowed during this time to an average of 1.8% growth per year from 2012 to 2015. This is down from an average of 2.7% growth per year in the period from 2006 to 2011 and 3.2% growth per year reported between 2000 and 2005. During the 2012 to 2015 time period, the average annual growth rate for marine protected areas was 0.3%; a decrease from the average annual growth rates from 2006 to 2011 (8.8% growth per year) and from 2000 to 2005 (5.6% growth per year).
Source: Environment and Climate Change Canada (2016) Canadian Environmental Sustainability Indicators: Canada's Protected Areas.
Long description for Figure 3
The upper line of the chart shows the percentage of terrestrial area that has been recognized as protected in Canada between 1990 and 2014. The lower line of the graph shows the percentage of marine area protected between 1990 and 2014.
Data for Figure 3
| Year | Terrestrial area protected (km2)a | Percentage of terrestrial area protected | Marine area protected (km2) | Percentage of marine area protected |
|---|---|---|---|---|
| 1990 | 554 229 | 5.6 | 19 750 | 0.34 |
| 1991 | 554 732 | 5.6 | 19 769 | 0.34 |
| 1992 | 570 017 | 5.7 | 20 194 | 0.35 |
| 1993 | 580 245 | 5.8 | 20 428 | 0.36 |
| 1994 | 583 750 | 5.8 | 20 433 | 0.36 |
| 1995 | 623 574 | 6.2 | 22 201 | 0.39 |
| 1996 | 641 185 | 6.4 | 23 062 | 0.40 |
| 1997 | 653 165 | 6.5 | 23 078 | 0.40 |
| 1998 | 683 564 | 6.8 | 23 813 | 0.41 |
| 1999 | 706 404 | 7.1 | 24 046 | 0.42 |
| 2000 | 716 187 | 7.2 | 24 145 | 0.42 |
| 2001 | 739 230 | 7.4 | 24 176 | 0.42 |
| 2002 | 747 347 | 7.5 | 24 380 | 0.42 |
| 2003 | 799 774 | 8.0 | 27 735 | 0.48 |
| 2004 | 809 520 | 8.1 | 30 134 | 0.52 |
| 2005 | 836 026 | 8.4 | 31 571 | 0.55 |
| 2006 | 843 432 | 8.4 | 31 931 | 0.56 |
| 2007 | 869 789 | 8.7 | 32 124 | 0.56 |
| 2008 | 921 226 | 9.2 | 41 018 | 0.71 |
| 2009 | 949 615 | 9.5 | 41 573 | 0.72 |
| 2010 | 957 149 | 9.6 | 50 761 | 0.88 |
| 2011 | 981 496 | 9.8 | 50 849 | 0.88 |
| 2012 | 993 132 | 9.9 | 50 851 | 0.88 |
| 2013 | 1 026 893 | 10.3 | 51 499 | 0.90 |
| 2014 | 1 033 743 | 10.4 | 51 499 | 0.90 |
| 2015 | 1 054 057 | 10.6 | 51 499 | 0.90 |
a The extent of protected areas presented here were recalculated at the end of 2015 using the latest information available. Methodologies for measuring and mapping are constantly evolving. The analysis for the data reported used the latest information available. As a result, there may be discrepancies between this data and that reported in previous editions of the Canadian Protected Areas Status Report.
Protected areas have been established across the country and can be found in each of the provinces and territories as well as in all three oceans (Figure 4). Their distribution varies however and the southern regions of Canada have a higher concentration of small protected areas while protected areas in the north are larger and more widely dispersed (Map 1).
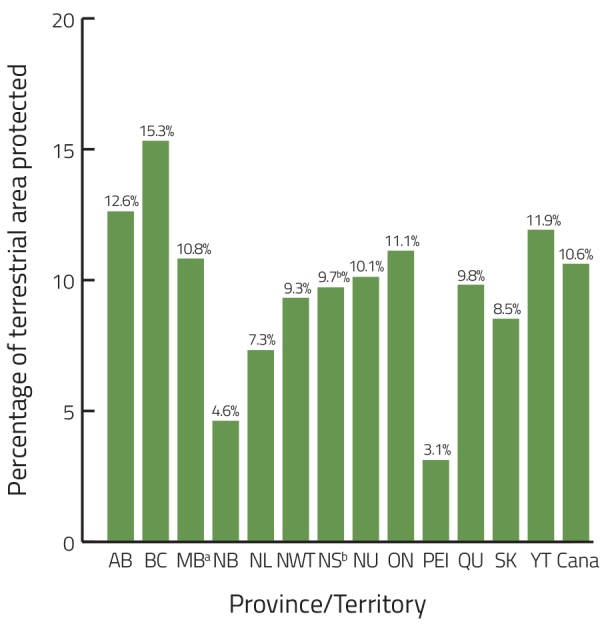
Long description for Figure 4
The column chart shows the percentage of terrestrial (land and freshwater) area protected in each province and territory in 2015, ranging from 3.1% to 15.3%. British Columbia, Alberta and Yukon have the largest proportions of protected area. New Brunswick, Newfoundland and Labrador, and Prince Edward Island have the lowest proportions of protected area.
| Province or territory | Protected area (km2) | Percentage of terrestrial area of the province or territory protected (%) |
|---|---|---|
| Alberta | 83 141 | 12.6 |
| British Columbia | 144 813 | 15.3 |
| Manitobaa | 70 087 | 10.8 |
| New Brunswick | 3 378 | 4.6 |
| Newfoundland and Labrador | 29 420 | 7.3 |
| Northwest Territories | 125 646 | 9.3 |
| Nova Scotiab | 5 366 | 9.7c |
| Nunavut | 211 996 | 10.1 |
| Ontario | 119 476 | 11.1 |
| Prince Edward Island | 175 | 3.1 |
| Quebec | 147 775 | 9.8 |
| Saskatchewan | 55 468 | 8.5 |
| Yukon | 57 358 | 11.9 |
| Canadac | 1 054 057 | 10.6 |
Source: Environment and Climate Change Canada (2016) Canadian Environmental Sustainability Indicators: Canada's Protected Areas.
Notes:
a These calculations do not include 1 052 km2 protected in nine sites in Manitoba at the end of 2015.
b In late December 2015, Nova Scotia designated through Orders in Council additional lands which will take the province to about 12.1%, according to Conservation Areas Reporting and Tracking System standards, but these areas, amounting to about 2.4% of the province, do not come into legal effect until their survey plans are signed and deposited in the Crown Land Information Centre, expected sometime in 2016. In the meantime, they are managed under interim policies and procedures to maintain their natural character, and are reported as "Interim" in the Conservation Areas Reporting and Tracking System. Also, Nova Scotia currently internally counts certain privately conserved areas as protected areas amounting to about 0.2% of the province. These areas are not reported to Conservation Areas Reporting and Tracking System because they are not protected from mineral or oil & gas development.
c Total is not equal to the sum of figures above. The national terrestrial area has been adjusted to account for areas with protection by multiple jurisdictions. To more accurately estimate the overall area protected within Canada, overlaps have been removed before calculating the national totals.
Governance of Canada’s protected areas
Protected areas can be governed under various regimes. The International Union for Conservation of Nature has developed a governance classification scheme which enables reporting agencies to classify their protected areas using standardized governance types. The governance type assigned to a protected area indicates who holds authority, responsibility and accountability over key management decisions affecting a given protected area. 2015 was the first year that government protected organisations in Canada classified their protected areas according to governance type. This is the first report in the series in which governance results are based on official governance classifications provided by protected areas organisations. Previous reports interpreted governance types based on information about ownership. It is important to note that, as the collection of this data is relatively new, the results may not yet be comprehensive and accuracy will continue to improve with time.
There are four broad types of governance, three of which include sub-categories.
- Governance by government (including the sub-categories: Federal or national ministry or agency; Provincial or territorial ministry or agency);
- Shared governance;
- Private governance (including the sub-categories: Individual landowners; Non-profit organisations; For-profit organisations); and,
- Governance by Indigenous Peoples and local communities (including the sub-categories Indigenous Peoples; Community conserved areas).
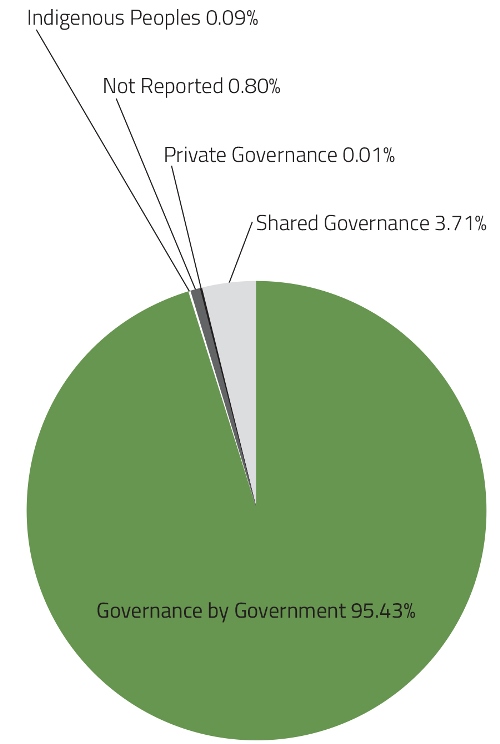
Long description for Figure 5
The pie chart shows the proportion of area (terrestrial and marine) protected by each governance type. The governance types represented are governance by government, Indigenous Peoples, not reported, private governance and shared governance.
Data for Figure 5
| Governance type | Percent of all protected area in Canada (%) |
|---|---|
| Governance by Government | 95.43 |
| Indigenous Peoples | 0.09 |
| Not Reported | 0.80 |
| Private Governance | 0.01 |
| Shared Governance | 3.71 |
Governance by government
Ninety five percent of Canada’s protected areas are governed by federal, provincial or territorial governments (Figure 5). Of that, the federal government administers or jointly administers 45% (approximately 469 000 km2) of Canada’s terrestrial area protected. Parks Canada and Environment and Climate Change Canada are responsible for the majority of federal terrestrial protected areas. In addition, the National Capital Commission is responsible for the management of Gatineau Park, and Indigenous and Northern Affairs Canada is responsible for the management of the Nunavut portion of the Thelon Game Sanctuary. The provinces and territories administer or jointly administer 55% (approximately 578 500 km2) of terrestrial areas protected (see Chapter 5 for details).
The federal government administers or jointly administers over 80% (approximately 43 000 km2) of Canada’s marine area protected. This area is managed by three organizations: Parks Canada, Environment and Climate Change Canada and Fisheries and Oceans Canada. The provinces and territories administer or jointly administer roughly 20% (approximately 10 000 km2).
Occasionally, responsibility for protected areas is transferred between governments. As of the end of 2015, a total of 9 095 km2 of land previously managed by Agriculture and Agri-Food Canada as community pastures (locally known as the Prairie Farm Rehabilitation Administration, or PFRA pasture program) was in transition between the federal government and provincial governments, as decisions about the future management of these areas are being taken. This program ended in 2012. In this report, approximately 7 400 km2 of community pastures in Saskatchewan are considered protected area but are categorized as “In transition” between federal and provincial governments with respect to governance. This area is included in the amount of area protected in Saskatchewan, but it is not reported as area under either federal or provincial administration. Most of the remaining 1 700 km2 of community pastures, outside of Saskatchewan, is not currently reported as protected. These figures are based on information available on December 31, 2015 and are subject to change as decisions regarding these areas are taken.
Shared governance
Shared governance refers to collaboration between different levels of government or between at least one government organisation, whether federal, provincial or territorial and an Indigenous government or community, a municipality, a property owner, or a land trust, in which partners share the authority by making decisions collectively, whether through the establishment of a governance body or other cooperative and co-management mechanismsFootnote2. While many of Canada’s protected areas involve collaboration between organisations, only a portion of these are officially classified under shared governance by federal, provincial and territorial protected areas organisations. Over 40 000 km2 of terrestrial and marine protected area across six provinces and three territories are administered through shared governance arrangements. These consist mostly of protected areas that are co-managed by federal, provincial or territorial governments and Indigenous governments or communities. Recent additions in the shared governance category include:
- Two new protected areas covering a total of 3 695 km2 on the east side of Lake Winnipeg which were established, in 2012, under shared governance agreements between Manitoba and Little Grand Rapids First Nation, and between Manitoba and Pauingassi First Nation as Traditional Use Planning Areas.
- The province of Nova Scotia set aside land to establish two new Wilderness Areas in collaboration with Nova Scotia Nature Trust, in 2015, protecting an area of approximately 32 km2.
Private governance
Private conservation areas make an important contribution to Canada’s system of protected areas; often protecting sensitive and significant natural habitat in otherwise developed or converted privately owned landscapes. Private conservation areas appear almost exclusively in southern Canada.
Protected areas that fall under the private governance type include areas that are governed by individual landowners and non-governmental organisations. Private conservation areas can include lands owned in fee-simple by conservation organisations (land trusts) as well as conservation easements, covenants, servitudes, leases, or other arrangements.
Three provinces currently report a total of approximately 140 km2 of protected areas under private governance (Manitoba, New Brunswick, Prince Edward Island); further details on these provinces are reported in Chapter 5. While privately held protected areas occur in other parts of the country, some provinces classify these under shared or other governance regimes. A comprehensive national inventory of private conservation areas is currently being developed for Canada (see Chapter 2 for more information on protecting private lands).
Governance by Indigenous Peoples and local communities
This designation is used for protected areas where the management authority and responsibility are held by Indigenous Peoples and/or local communities. Indigenous Peoples of Canada have contributed to the establishment of tens of thousands of square kilometres of protected areas through modern land-claim agreements and treaty negotiation. As noted above, most of these protected areas are managed under shared governance or governance by government. The exception to this is Wehexlaxodıale, covering an area of 976 km2 in Northwest Territories, which was established in 2013 through the Tłįchǫ Land Use Plan Act, and is governed by the Tłįchǫ Government.
Ecological representativeness
Canada’s diverse ecological makeup can be divided into 18 terrestrial ecozones (Table 2, Map 2), 12 marine ecozonesFootnote3 (Table 3, Map 2), and 1 freshwater ecozoneFootnote4. All of Canada’s ecozones are partly protected; however, the proportion of protection within each ecozone varies widely, from less than 1% in the Arctic Basin, Newfoundland-Labrador Shelves, Scotian Shelf, Hudson Bay Complex and Arctic Archipelago to over 20% in the Arctic Cordillera, Pacific Maritime and Tundra Cordillera ecozones.
Terrestrial ecozones
- At the end of 2015, the majority of Canada’s terrestrial ecozones (16 out of 18), primarily in the north and west of the country, had at least 5% of their area conserved by protected areas. While less than half of the terrestrial ecozones (seven out of 18) had over 10% of their area conserved by protected areas. These proportions are identical to those from 2011.
- As in 2011, two terrestrial ecozones (Mixedwood Plains and Atlantic Highlands) had less than 5% of their area protected in 2015 although there has been a small expansion of coverage in both.
- The area protected has increased in 72% of Canada’s terrestrial ecozones (13 out of 18) since 2011. The largest increase was in the Taiga Shield ecozone, which increased from 5.4% to 8% protected.
Marine and Great Lakes ecozones
- Marine ecozones experienced less protected area growth than terrestrial ecozones, with only one ecozone showing an increase. Gulf of Saint Lawrence increased from 1.6% in 2011 to 1.9% protected at the end of 2015.
- Out of the 12 marine ecozones, five (42%) had less than 1% of their area protected in 2015. One marine ecozone (Northern Shelf) had over 5% of its area protected.
- Over 13% of the Great Lakes ecozone was protected.
| Ecozone | Ecozone area (km2) | Area Protected in 2015 (km2) | Percent of ecozone protected in 2011 (%) | Percent of ecozone protected in 2015 (%) | Change in percent protected from 2011 to 2015 (%) |
|---|---|---|---|---|---|
| Arctic Cordillera | 233 618 | 53 699 | 23.0 | 23.0 | 0 |
| Atlantic Highlands | 93 017 | 3 552 | 3.3 | 3.8 | 0.5 |
| Atlantic Maritime | 110 590 | 7 712 | 5.9 | 7.0 | 1.1 |
| Boreal Cordillera | 557 937 | 97 311 | 15.6 | 17.4 | 1.9 |
| Boreal Plains | 779 471 | 58 048 | 7.5 | 7.5 | >-0.1g |
| Boreal Shield | 1 897 362 | 183 766 | 9.0 | 9.7 | 0.7 |
| Hudson Plains | 350 693 | 43 774 | 12.5 | 12.5 | 0 |
| Mixedwood Plains | 116 206 | 2 092 | 1.7 | 1.8 | 0.1 |
| Montane Cordillera | 437 761 | 80 006 | 18.2 | 18.3 | <0.1 |
| Northern Arctic | 1 481 480 | 106 291 | 6.4 | 7.2 | 0.7 |
| Pacific Maritime | 216 942 | 52 449 | 23.9 | 24.2 | 0.3 |
| Prairies | 465 990 | 27 253 | 6.1 | 5.9 | >-0.3g |
| Semi-Arid Plateaux | 56 434 | 5 263 | 9.2 | 9.3 | 0.1 |
| Southern Arctic | 957 139 | 150 760 | 15.7 | 15.8 | <0.1 |
| Taiga Cordillera | 231 161 | 19 302 | 8.0 | 8.4 | 0.4 |
| Taiga Plains | 554 014 | 38 160 | 6.9 | 6.9 | <0.1 |
| Taiga Shield | 1 322 786 | 105 763 | 5.4 | 8.0 | 2.7 |
| Tundra Cordillera | 28 980 | 7 159 | 24.7 | 24.7 | 0 |
Notes
e Increases shown in the ecozone tables reflect only new protected areas established during the 2012-2015 timeframe and do not include expansions of protected areas that existed prior to 2012.
f Ecozone totals do not include 1 052 km2 protected in nine sites in Manitoba at the end of 2015: six sites in the Boreal Shield Ecozone (106 km²), two sites in the Boreal Plain Ecozone (941 km2), and one site in the Prairie Ecozone (5 km2).
g Negative change is due to transfer of land previously protected under the administration of Agriculture and Agri Food Canada (Prairie Farm Rehabilitation Administration) in Manitoba that was in progress between 2011 and 2015.
| Ecozone | Ecozone area (km2) | Area Protected in 2015 (km2) | Percent of ecozone protected in 2011 (%) | Percent of ecozone protected in 2015 (%) | Change in percent protected from 2011 to 2015 (%) |
|---|---|---|---|---|---|
| Arctic Archipelago | 268 792 | 2 267 | 0.8 | 0.8 | 0 |
| Arctic Basin | 752 053 | 165 | <0.1 | <0.1 | 0 |
| Eastern Arctic | 782 636 | 8 656 | 1.1 | 1.1 | 0 |
| Gulf of Saint Lawrence | 246 648 | 4 688 | 1.6 | 1.9 | 0.3 |
| Hudson Bay Complex | 1 244 670 | 8 857 | 0.7 | 0.7 | 0 |
| Newfoundland-Labrador Shelves | 1 054 240 | 215 | <0.1 | <0.1 | 0 |
| Northern Shelf i | 101 663 | 7 141 | 7 | 7 | 0 |
| Offshore Pacific | 315 724 | 6 200 | 2 | 2 | 0 |
| Scotian Shelf | 416 296 | 2 399 | 0.6 | 0.6 | 0 |
| Southern Shelf | 28 158 | 783 | 2.8 | 2.8 | 0 |
| Strait of Georgia | 8 969 | 425 | 4.7 | 4.7 | 0 |
| Western Arctic | 539 807 | 9 697 | 1.8 | 1.8 | 0 |
| Great Lakesj | 88 250 | 11 672 | 13.2 | 13.2 | 0 |
h Increases shown in the ecozone tables reflect only new protected areas established during the 2012-2015 timeframe and do not include expansions of protected areas that existed prior to 2012.
i As noted, expansions of protected areas existing prior to 2012 are not reflected in the ecozone tables. As a result, marine foreshore additions of 1 535 km2 to nine Haida Gwaii conservancies and 227 km2 to four conservancies on the Central Coast are not included.
j The Great Lakes totals are not included when calculating Canada's total marine coverage.
Source: Environment and Climate Change Canada (2016) Canadian Environmental Sustainability Indicators: Canada's Protected Areas.
Long description for Map 2
The map shows Canadian ecozones including terrestrial, marine and the Great Lakes. The marine ecozones shown on the map are Strait of Georgia, Southern Shelf, Offshore Pacific, Northern Shelf, Arctic Basin, Western Arctic, Arctic Archipelago, Eastern Arctic, Hudson Bay Complex, Newfoundland-Labrador Shelves, Scotian Shelf and Gulf of Saint Lawrence. The terrestrial ecozones shown are Arctic Cordillera, Northern Arctic, Southern Arctic, Taiga Plains, Taiga Shield, Boreal Shield, Atlantic Maritime, Mixedwood Plains, Boreal Plains, Prairies, Montane Cordillera, Pacific Maritime, Boreal Cordillera, Taiga Cordillera, Hudson Plains, Tundra Cordillera, Atlantic Highlands and Semi-Arid Plateaux. The percentage of each ecozone that is protected is also shown on the map. These percentages are broken down into range categories. For marine, these are broken down as 0 to 0.5%, 0.6 to 1.0%, 1.1 to 2.0%, 2.1 to 4.0% and 4.1 to 8.0%. The percent range categories for the terrestrial ecozones are 0 to 4.0%, 4.1 to 8.0%, 8.1 to 12.0%, 12.1 to 16.0%, 16.1 to 20.0% and 20.1 to 25.0%.
International Union for the Conservation of Nature management categories
Canada uses the International Union for Conservation of Nature’s classification of management categories for protected areas (Figure 6). These categories help to describe the type of protected area according to stated management intent. Government protected areas organizations classify their protected areas in the Conservation Areas Reporting and Tracking System into one of the following management categories:
- Ia
- Strict Nature Reserve
- Ib
- Wilderness Area
- II
- National Park
- III
- Natural Monument or Feature
- IV
- Habitat/Species Management Area
- V
- Protected Landscape/Seascape
- VI
- Protected Area with Sustainable Use of Natural Resources
Long description for Map 3
A map of all of Canada's protected areas, which divides each protected area according to one of eight categories as defined by the International Union for Conservation of Nature . These eight categories shown in the map legend are: Category Ia, Category Ib, Category II, Category III, Category IV, Category V, Category VI, and Unclassified.
Source: Conservation Areas Reporting and Tracking System (CARTS).
For terrestrial protected areas:
- The vast majority (95% by area) of Canada’s terrestrial protected area falls into categories Ia to IV; categories that tend to focus on maintaining natural conditions.
- Category II areas make up 62%, the largest proportion of terrestrial protected area. The protected areas in this category are primarily comprised of large national, provincial and territorial parks and conservation areas. Public access and recreation tend to be permitted.
- The second largest proportion of terrestrial protected area, with 29%, is classified as category Ib. These include a number of large federal Migratory Bird Sanctuaries as well as provincial and territorial parks. Management of these areas is focused on maintaining natural conditions. Public access may be permitted however built infrastructure tends to be minimized.
- The remaining protected areas fall into one of the other categories or have not yet been classified.
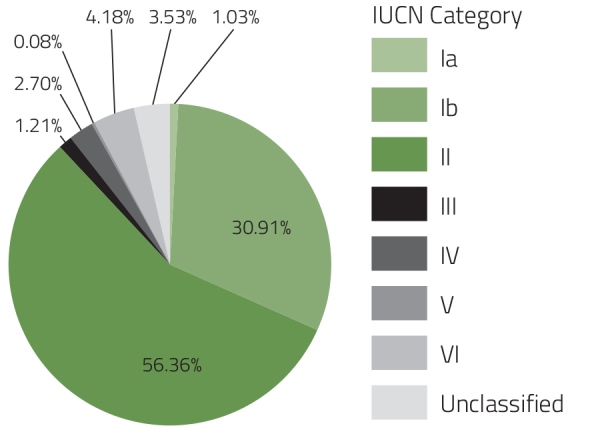
For marine protected areas:
- Seventy percent of the marine area protected in Canada is classified in categories Ia to IVFootnote5.
- The highest proportion of marine protected area (36% by area) is classified as Ib.
- The second most extensive category (28% by area) is Category II.
- The remaining protected areas fall into one of the other categories or have not yet been classified.
Note: Data has not been corrected to account for overlaps: a small number of individual protected areas managed by multiple jurisdictions may be classified in two different categories.
Long description for Figure 6
The pie chart shows the breakdown of Canadian protected areas according to the International Union for the Conservation of Nature categories. The categories represented are Ia, Ib, II, III, IV, V, VI and Unclassified.
Data for Figure 6
| IUCN Category | Area (km2) | Percentage of the Total |
|---|---|---|
| Ia | 11 620 | 1.03% |
| Ib | 348 627 | 30.91% |
| II | 635 782 | 56.36% |
| III | 13 664 | 1.21% |
| IV | 30 464 | 2.70% |
| V | 852 | 0.08% |
| VI | 47 151 | 4.18% |
| Unclassified | 39 856 | 3.53% |
h These calculations do not include 1 052km2 protected in nine sites in Manitoba at the end of 2015.
International perspective (2014)
At the end of 2014, the most recent year with global data available, 15.4% of global terrestrial and freshwater area (20.7 million km2), 8.4% of marine areas within national jurisdiction (0-200 nautical miles), and 3.4% of oceans globally were classified as protected.Footnote6
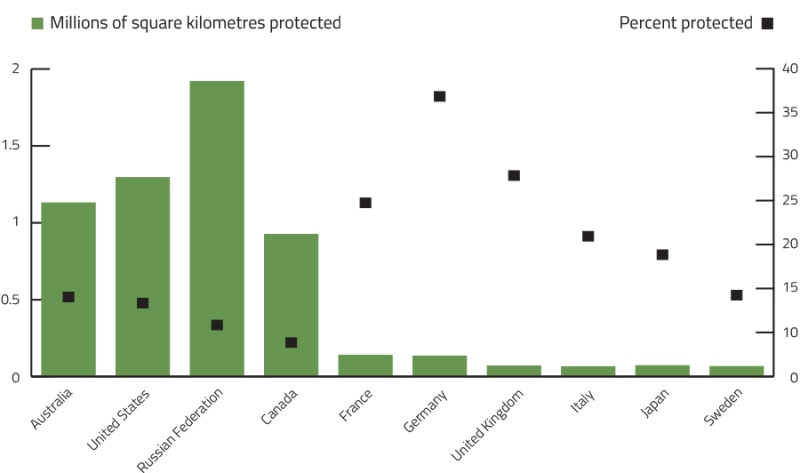
In a comparison of 10 countries, based on 2014 data from the World Database on Protected Areas (Figure 7):
- Canada ranked 4th of 10 countries with respect to the total terrestrial area protected, behind the Russian Federation, United States and Australia.
- Canada ranked 10th out of 10 countries with respect to the percent of terrestrial area protected.
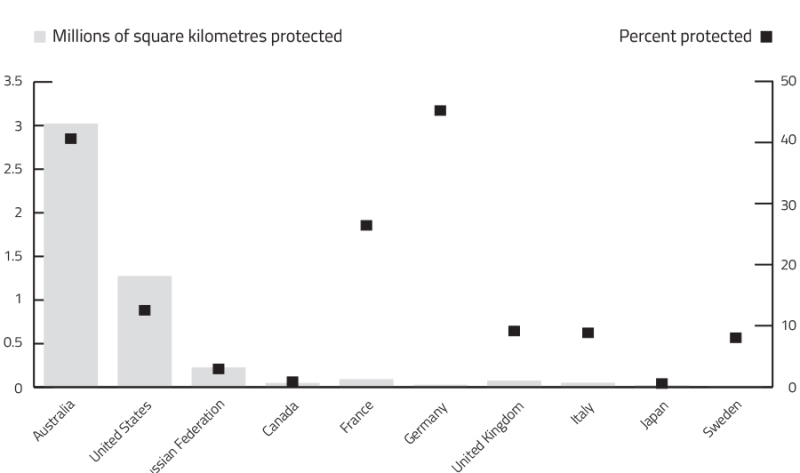
- Canada ranked 7th out of 10 countries with respect to the total marine area protected.
- Canada ranked 9th out of 10 countries with respect to percent coverage of their marine territory that is protected.
Results for Canada are shown here using international data sources only which are not as current or complete as the national data for Canada presented elsewhere in the Protected Areas Status Report. However, the information does provide a basis for comparisons among countries. Selected countries in the comparison are the G7, Australia (the population, population density and territorial extent of which are similar to Canada's), Russian Federation (a large northern country like Canada) and Sweden (which has a similar climate).
Source: Environment and Climate Change Canada (2015) Canadian Environmental Sustainability Indicators: Global Trends in Protected Areas.
Long description for Figure 7
The upper bar graph shows the total terrestrial area protected and the percentage of terrestrial area protected for 10 selected countries (Australia, the United States, the Russian Federation, Canada, France, Germany, the United Kingdom, Italy, Japan, and Sweden). In 2014, Canada ranked fourth in this set for total terrestrial area protected with 925 thousand square kilometres protected (9.4%). The lower bar graph shows the total marine area protected and the percentage of marine area protected for the same set of countries. Marine areas include territorial seas and exclusive economic zones. In 2014, Canada was seventh in the set for total marine area protected with 46 thousand square kilometres (0.8%) protected.
Data for Figure 7
| Country | Terrestrial area (km2) | Terrestrial area protected (km2) | Terrestrial percentage protected (%) | Marine area (km2) | Marine area protected (km2) | Marine percentage protected (%) |
|---|---|---|---|---|---|---|
| Australia | 7 722 000 | 1 130 000 | 14.6 | 7 438 000 | 3 018 000 | 40.6 |
| United States | 9 337 000 | 1 294 000 | 13.9 | 10 201 000 | 1 271 000 | 12.5 |
| Russian Federation | 16 884 000 | 1 919 000 | 11.4 | 7 573 000 | 222 000 | 2.9 |
| Canada | 9 866 000 | 925 000 | 9.4 | 5 699 000 | 46 000 | 0.8 |
| France | 549 000 | 139 000 | 25.3 | 334 000 | 88 000 | 26.4 |
| Germany | 358 000 | 134 000 | 37.4 | 56 000 | 25 000 | 45.2 |
| United Kingdom | 246 000 | 70 000 | 28.4 | 776 000 | 71 000 | 9.1 |
| Italy | 301 000 | 65 000 | 21.5 | 540 000 | 47 000 | 8.8 |
| Japan | 374 000 | 72 000 | 19.4 | 4 041 000 | 20 000 | 0.5 |
| Sweden | 449 000 | 66 000 | 14.8 | 155 000 | 12 000 | 8.0 |
| Global (excluding Antarctica, disputed territories and Inland Seas)i | 134 654 000 | 20 706 000 | 15.4 | 360 634 000 | 12 302 000 | 3.4 |
| Global total (no exclusions) | 148 599 000 | 20 713 000 | 13.9 | 361 995 000 | 12 347 000 | 3.4 |
Note: National marine areas include marine waters from coastline to the outer limit of the exclusive economic zone. National terrestrial areas include inland freshwater areas. The Aral Sea, Caspian Sea and the Great Lakes are excluded from all area calculations on the basis of disputed boundaries. Data from the World Database on Protected Areas are used here to ensure consistency among countries (World Database on Protected Areas 2014).
i The global total excluding Antarctica, disputed territories, Great Lakes, Aral Sea and Caspian Sea, is the officially published global figure of International Union for the Conservation of Nature and United Nations Environment Program-World Conservation Monitoring Centre for 2014. It is calculated as an indicator of national efforts towards achieving global targets of biodiversity protection set by the United Nations Convention on Biological Diversity and the United Nations Millennium Development Goals. These targets cover jurisdictional areas only. Antarctica is protected in full by the Antarctic Treaty; therefore it is considered by some to be entirely protected, and by others to be unprotected. Antarctica is not included in the global figure as it cannot be attributed to any territorial biodiversity protection effort and is therefore not included under the jurisdictional clause of the United Nations Convention on Biological Diversity.