
Health Canada Quarterly Financial Report - For the quarter ended December 31, 2019
Table of Contents
- Introduction
- Basis of Presentation
- Highlights of Fiscal Quarter and Fiscal Year-to-Date Results
- Risks and Uncertainties
- Significant Changes in Relation to Operations, Personnel and Programs
- Statement of Authorities (unaudited)
- Departmental Budgetary Expenditures by Standard Object (unaudited)
Introduction
Health Canada is the federal department responsible for helping Canadians maintain and improve their health. In keeping with the Department’s commitment to making this country’s population among the healthiest in the world as measured by longevity, lifestyle and effective use of the public health care system, its main responsibilities are as a regulator, a service provider, a catalyst for innovation, a funder, and an information provider. A summary of Health Canada’s programs may be found in Part II of the Main Estimates. Health Canada administers the Canada Health Act which embodies national principles to ensure a universal and equitable publicly-funded health care system.
This quarterly financial report has been prepared by management as required by section 65.1 of the Financial Administration Act in the form and manner prescribed by the Treasury Board, and should be read in conjunction with the Main Estimates and Supplementary Estimates A.
This quarterly report has not been subject to an external audit or review.
Basis of Presentation
This quarterly report has been prepared by management using an expenditure basis of accounting. The accompanying Statement of Authorities includes the Department's spending authorities granted by Parliament, and those used by the Department consistent with the Main Estimates and Supplementary Estimates A for the 2019-2020 fiscal year. This quarterly report has been prepared using a special purpose financial reporting framework designed to meet financial information needs with respect to the use of spending authorities.
The authority of Parliament is required before money can be spent by the Government. Approvals are given in the form of annually approved limits through appropriation acts, or through legislation in the form of statutory spending authority for specific purposes.
The Department uses the full accrual method of accounting to prepare and present its annual departmental financial statements that are part of the departmental results reporting process. However, the spending authorities voted by Parliament remain on an expenditure basis.
Highlights of Fiscal Quarter and Fiscal Year-to-Date Results
This quarterly financial report reflects the results of the current fiscal period in comparison to the authorities provided in the Main Estimates and Supplementary Estimates A for fiscal year 2019-2020, as well as budget adjustments approved by Treasury Board up to December 31, 2019.
- Significant Changes to Authorities
The following graph provides a comparison of net budgetary authorities available for spending at the end of each quarter of the current and previous fiscal years.
Figure 1.
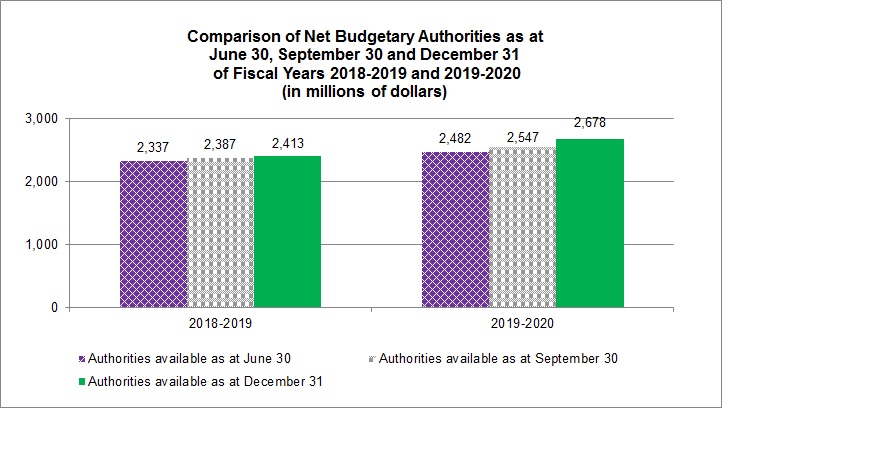
Figure 1 - Text Description
Comparison of Net Budgetary Authorities as at June 30, September 30 and December 31 of Fiscal Years 2018-2019 and 2019-2020
Bar chart showing a comparison of net budgetary authorities as at June 30, September 30 and December 31 of fiscal years 2018-2019 and 2019-2020 in millions of dollars.
2018-2019 Net budgetary authorities as at June 30 = 2,337; 2018-2019 Net budgetary authorities as at September 30 = 2,387; 2018-2019 Net budgetary authorities as at December 31 = 2,413; 2019-2020 Net budgetary authorities at June 30 = 2,482; 2019-2020 Net budgetary authorities as at September 30 = 2,547; 2019-2020 Net budgetary authorities as at December 31 = 2,678.
The following table provides a comparison of total authorities available by vote at the end of the third quarter of the current and previous fiscal years.
| Authorities available (in millions of dollars) |
2018-2019 | 2019-2020 | Variance |
|---|---|---|---|
| Vote 1 – Operating expenditures | 807 | 925 | 118 |
| Vote 5 – Capital expenditures | 29 | 23 | (6) |
| Vote 10 – Grants and contributions | 1,396 | 1,556 | 160 |
| Statutory | 181 | 174 | (7) |
| Total authorities | 2,413 | 2,678 | 265 |
Total authorities available for spending at the end of the third quarter of fiscal year 2019-2020 were $2,678 million as compared with $2,413 for 2018-2019, representing a net increase of $265 million, or 11%. This increase is primarily attributable to the following:
- $250.0 million increase in funding for Strengthening Canada's Home and Community Care and Mental Health and Addiction Services Initiative;
- $70.0 million increase in funding for out-of-court settlements;
- $31.1 million increase in funding for continuing to legalize and strictly regulate cannabis;
- $25.5 million increase in funding for compensation related to collective agreements;
- $25.0 million increase in funding to Canada Health Infoway Inc. for advancing digital health innovation;
- $21.4 million increase in funding for Bringing Innovation to Regulations; and,
- $7.9 million increase in funding to the Canadian Partnership Against Cancer.
The increases noted above are partially offset by the following decreases:
- $135.5 million in funding, primarily for contributions related to opioids that were distributed to provinces and territories through the one-time Emergency Treatment Fund in 2018-2019, to increase the availability of treatment services for substance use disorder in their jurisdictions;
- $20.0 million in statutory spending authority for disbursements pursuant to section 103 of the Patent Act; and,
- $13.5 million in sunsetting funding for maintaining and upgrading federal infrastructure assets.
The fluctuations in authorities available for spending are most notable in the following standard objects: personnel; professional and special services; repair and maintenance; transfer payments; and other subsidies and payments.
- Significant Changes in Year-to-Date Expenditures
The following graph provides a comparison of net budgetary authorities and year-to-date spending by quarter for the current and previous fiscal years.
Figure 2.
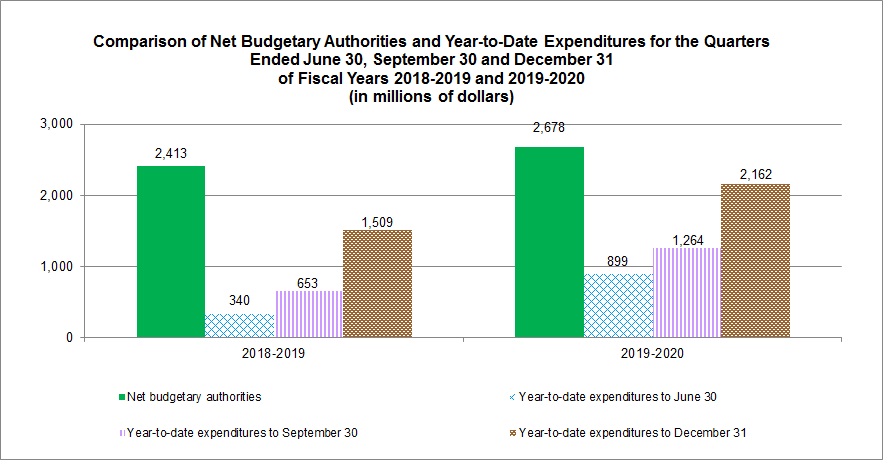
Figure 2 - Text Description
Comparison of Net Budgetary Authorities and Year-to-Date Expenditures for the Quarters Ended June 30, September 30 and December 31 of Fiscal Years 2018-2019 and 2019-2020
Bar chart showing a comparison of net budgetary authorities and year-to-date expenditures for the quarters ended June 30, September 30 and December 31 of fiscal years 2018-2019 and 2019-2020 in millions of dollars.
2018-2019 Net budgetary authorities = 2,413; 2018-2019 Year-to-date expenditures to June 30 = 340; 2018-2019 Year-to-date expenditures to September 30 = 653; 2018-2019 Year-to-date expenditures to December 31 = 1,509; 2019-2020 Net budgetary authorities = 2,678; 2019-2020 Year-to-date expenditures to June 30 = 899; 2019-2020 Year-to-date expenditures to September 30 = 1,264; 2019-2020 Year-to-date expenditures to December 31 = 2,162.
The following table provides a comparison of year-to-date spending by vote at the end of the third quarter of the current and previous fiscal years.
| Year-to-date expenditures (in millions of dollars) |
2018-2019 | 2019-2020 | Variance |
|---|---|---|---|
| Vote 1 – Operating expenditures | 557 | 669 | 112 |
| Vote 5 – Capital expenditures | 9 | 9 | - |
| Vote 10 – Grants and contributions | 840 | 1,372 | 532 |
| Statutory | 103 | 112 | 9 |
| Total year-to-date expenditures | 1,509 | 2,162 | 653 |
At the end of the third quarter of 2019-2020, total budgetary expenditures were $2,162 million compared with $1,509 million reported for the same period of 2018-2019, representing an increase of $653 million or 43%.
Year-to-date net operating expenditures have increased by approximately $112 million or 20% when compared to the third quarter of 2018-2019. The significant variances in operating expenditures are as follows:
- $38.9 million increase in personnel expenditures, primarily due to annual salary increments for inflation and step increases, retroactive salary payments from signed collective agreements, and increase in the number of personnel supporting the continued growth in the cannabis, controlled substances and opioid programs;
- $92.3 million increase in other subsidies and payments, mainly due to a legal settlement, and additional one-time ex gratia payments for approved survivors under the recently approved Canadian Thalidomide Survivors Support Program; and,
- $8.4 million increase in revenues, which results in a decrease in net operating expenditures, mainly the result of a change in timing of cash receipts for licensing applications, which can vary from year to year. There was also a reclassification of drug and medical device establishment licensing fees from rights and privileges revenues to revenues from services of a regulatory nature resulting in a variation between these categories.
There was an increase in Vote 10 – Grants and contributions year-to-date expenditures of $532 million or 63%, resulting from the following offsetting factors:
- $525.5 million increase in payments for Home Care and Mental Health Services;
- $39.9 million increase from the timing of contribution payments made to the Canada Health Infoway Inc.;
- $21.4 million increase from the timing of payments to support the Canadian Partnership Against Cancer;
- $55.5 million decrease from a one-time transfer payment made in 2018-2019 to provinces and territories for the purpose of emergency treatment funding relating to problematic substance use and the opioid crisis to help reduce opioid-related harms and deaths; and,
- $15.0 million decrease from the timing of payments to Brain Canada.
Statutory year-to-date expenditures have increased by $9 million or 9% from $103 million in 2018-2019 to $112 million in 2019-2020 that is mainly comprised of the following offsetting components:
- $21.5 million increase related to the timing of allocation of expenditures incurred as part of the Shared Services Partnership with the Public Health Agency of Canada against statutory authorities;
- $4.2 million increase in statutory payments made to Canada Health Infoway Inc., which are disbursed in accordance with the organization’s cash flow needs; and,
- $20.0 million decrease for a statutory payment made in the prior year pursuant to section 103 of the Patent Act.
- Quarterly Variances
The following graph presents a comparison of quarterly spending by quarter and by fiscal year.
Figure 3.
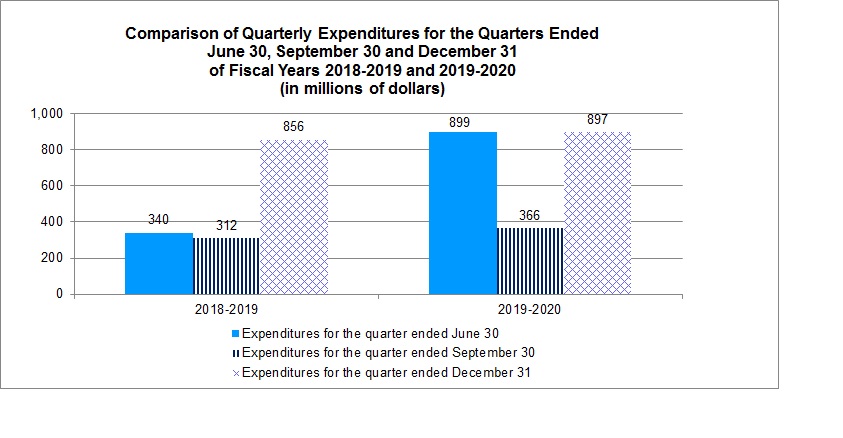
Figure 3 - Text Description
Comparison of Quarterly Expenditures for the Quarters Ended June 30, September 30 and December 31 of Fiscal Years 2018-2019 and 2019-2020
Bar chart showing a comparison of quarterly expenditures for the quarters ended June 30, September 30 and December 31 of fiscal years 2018-2019 and 2019-2020 in millions of dollars.
2018-2019 Expenditures for the quarter ended June 30 = 340; 2018-2019 Expenditures for the quarter ended September 30 = 312; 2018-2019 Expenditures for the quarter ended December 31 = 856; 2019-2020 Expenditures for the quarter ended June 30 = 899; 2019-2020 Expenditures for the quarter ended September 30 = 366; 2019-2020 Expenditures for the quarter ended December 31 = 897.
Expenditures in the third quarter of fiscal year 2019-2020 were $897 million compared with $856 million for the third quarter of 2018-2019, representing an increase of $41 million or 5% in quarterly spending.
The increase in quarterly spending is due primarily to:
- $28.0 million increase in personnel costs resulting primarily from annual salary increments for inflation and step increases, retroactive salary payments from signed collective agreements, increase in the number of personnel supporting the continued growth in the cannabis, controlled substances and opioid programs, and timing of allocation of expenditures incurred as part of the Shared Services Partnership with the Public Health Agency of Canada against statutory authorities; and,
- $25.9 million increase in grants and contributions resulting from:
- timing differences on payments, including:
- $39.9 million increase for Canada Health Infoway Inc.;
- $28.4 million increase for Contribution to the Canadian Partnership Against Cancer;
- $19.9 million increase to support the Territorial Health Investment Fund;
- $10.1 million increase to support Brain Canada; and,
- $7.1 million decrease for the Contribution to the Canadian Foundation for Health Improvement.
- $57.2 million decrease from a one-time transfer payment made in 2018-2019 to provinces and territories for the purpose of emergency treatment funding relating to problematic substance use and the opioid crisis.
- timing differences on payments, including:
Risks and Uncertainties
Health Canada is dedicated to enhancing the health and well-being of Canadians. It operates in a dynamic and complex environment characterized by internal and external drivers of change, which could potentially be disruptive to the Department’s ability to achieve its objectives (e.g., new innovative products, technologies, substances, foods and emerging product categories, evolving relationships between various levels of government, unforeseen health crises, scientific and technological change, shifting expectations around government service delivery and digital modernization, and cybersecurity threats).
Health Canada recognizes that successfully fulfilling its mandate is directly related to effective management of risk. Sound risk management equips the Department to respond proactively to change and uncertainty by using risk-based information to support effective decision-making. Additionally, it can lead to more effective service delivery, better project management, an increase in value for money, and, ultimately, better results for Canadians.
As a result, the Department employs integrated risk management tools, including the development of a Corporate Risk Profile and monitoring of risk management strategies, to proactively and systematically recognize, understand, accommodate and capitalize on new challenges and opportunities, with a focus on results. In addition, the Department has appropriate internal control systems in place, proportionate to the risks being managed.
Prudent management within a constrained fiscal environment is required to manage potential impacts on departmental programs and services. Health Canada continues to manage through effective engagement across the Department, a sound governance structure, as well as long-term planning. The Department’s executive-level committee on Finance, Investment Planning and Transformation recommends overall direction for financial management and control, and ensures alignment of investments with departmental strategies and transformation initiatives.
Program expenditures experience natural fluctuations from year to year depending on a variety of factors beyond program control (e.g., emerging health events and novel drug therapies), thus creating risk. Enhanced monitoring of expenditures is undertaken, including assessment of expenditures against projected spending as well as previous years’ trends and available resources to manage these risks. Cost management and planning are also in place and are reported regularly to senior management for decision-making.
Significant Changes in Relation to Operations, Personnel and Programs
Ms. Patty Hajdu was appointed Minister of Health in November 2019.
There have been no other significant changes in relation to operations, personnel and programs during this quarter.
Approved by:
Original signed by Stephen Lucas
Stephen Lucas
Deputy Minister
Ottawa, Canada
Date: February 23, 2020
Original signed by Edward de Sousa for
Randy Larkin
Assistant Deputy Minister and
Chief Financial Officer
Ottawa, Canada
Date: February 14, 2020
Statement of Authorities (unaudited)
| Authority | Total available for use for the year ending March 31, 2020Footnote * | Used during the quarter ended December 31, 2019 | Year-to-date used at quarter-end |
|---|---|---|---|
| Vote 1 – Operating expenditures | 925,358 | 226,783 | 668,426 |
| Vote 5 – Capital expenditures | 22,857 | 4,474 | 9,365 |
| Vote 10 – Grants and contributions | 1,556,438 | 620,892 | 1,371,751 |
| Footnote (S) Contributions to employee benefit plans | 111,200 | 26,399 | 79,196 |
| Footnote (S) Minister of Health – Salary and motor car allowance | 88 | 22 | 66 |
| Footnote (S) Spending of proceeds from the disposal of surplus Crown assets | 119 | - | - |
| Footnote (S) Refunds of amounts credited to revenues in previous years | 59 | - | 59 |
| Footnote (S) Canada Health Infoway Inc. | 10,131 | - | 10,131 |
| Footnote (S) Collection Agency Fees | 23 | 5 | 23 |
| Footnote (S) Spending of revenues pursuant to section 4.2 of the Department of Health Act | 51,463 | 18,447 | 22,487 |
| Total authorities | 2,677,736 | 897,022 | 2,161,504 |
|
|||
| Authority | Total available for use for the year ending March 31, 2019Footnote * | Used during the quarter ended December 31, 2018 | Year-to-date used at quarter-end |
|---|---|---|---|
| Vote 1 – Operating expenditures | 807,319 | 230,012 | 556,797 |
| Vote 5 – Capital expenditures | 28,944 | 5,648 | 8,814 |
| Vote 10 – Grants and contributions | 1,396,133 | 594,954 | 839,931 |
| Footnote (S) Contributions to employee benefit plans | 102,430 | 25,349 | 76,046 |
| Footnote (S) Minister of Health – Salary and motor car allowance | 86 | 21 | 64 |
| Footnote (S) Spending of proceeds from the disposal of surplus Crown assets | 478 | 17 | 62 |
| Footnote (S) Refunds of amounts credited to revenues in previous years | 3 | - | 3 |
| Footnote (S) Canada Health Infoway Inc. | 5,937 | - | 5,937 |
| Footnote (S) Payments in connection with the Patent Act (Patented medicines) | 20,000 | - | 20,000 |
| Footnote (S) Spending of revenues pursuant to section 4.2 of the Department of Health Act | 51,463 | - | 1,001 |
| Total authorities | 2,412,793 | 856,001 | 1,508,655 |
|
|||
Departmental Budgetary Expenditures by Standard Object (unaudited)
| Standard Object | Planned expenditures for the year ending March 31, 2020 | Expended during the quarter ended December 31, 2019 | Year-to-date used at quarter-end |
|---|---|---|---|
| Expenditures: | |||
| Personnel | 899,077 | 241,882 | 609,424 |
| Transportation and communications | 26,035 | 5,216 | 11,215 |
| Information | 26,766 | 7,100 | 15,659 |
| Professional and special services | 148,529 | 37,104 | 96,741 |
| Rentals | 22,140 | 6,370 | 12,526 |
| Repair and maintenance | 17,846 | 4,260 | 8,063 |
| Utilities, materials and supplies | 29,024 | 4,930 | 11,453 |
| Acquisition of land, buildings and works | - | 907 | 3,896 |
| Acquisition of machinery and equipment | 27,525 | 4,583 | 9,060 |
| Transfer payments | 1,566,569 | 620,892 | 1,381,881 |
| Other subsidies and payments | 73,847 | 803 | 96,011 |
| Total gross budgetary expenditures | 2,837,358 | 934,047 | 2,255,929 |
| Less revenues netted against expenditures: | |||
| Rights and privileges | 28,689 | 10,027 | 12,505 |
| Services non-regulatory | 30,386 | 5,737 | 18,907 |
| Services regulatory | 100,547 | 15,664 | 57,304 |
| Services to other government departments | - | 5,597 | 5,709 |
| Total revenues netted against expenditures | 159,622 | 37,025 | 94,425 |
| Total net budgetary expenditures | 2,677,736 | 897,022 | 2,161,504 |
| Standard Object | Planned expenditures for the year ending March 31, 2019 | Expended during the quarter ended December 31, 2018 | Year-to-date used at quarter-end |
|---|---|---|---|
| Expenditures: | |||
| Personnel | 805,000 | 213,898 | 554,794 |
| Transportation and communications | 24,491 | 7,701 | 13,889 |
| Information | 32,754 | 8,994 | 14,245 |
| Professional and special services | 167,419 | 40,532 | 98,684 |
| Rentals | 19,940 | 5,180 | 8,948 |
| Repair and maintenance | 34,347 | 5,198 | 10,412 |
| Utilities, materials and supplies | 31,032 | 4,845 | 11,389 |
| Acquisition of land, buildings and works | - | 2,857 | 4,109 |
| Acquisition of machinery and equipment | 28,944 | 4,469 | 8,760 |
| Transfer payments | 1,422,070 | 594,953 | 865,867 |
| Other subsidies and payments | 4,072 | 760 | 3,628 |
| Total gross budgetary expenditures | 2,570,069 | 889,387 | 1,594,725 |
| Less revenues netted against expenditures: | |||
| Rights and privileges | 62,530 | 13,151 | 30,814 |
| Services non-regulatory | 30,385 | 4,524 | 16,145 |
| Services regulatory | 64,361 | 13,718 | 36,999 |
| Services to other government departments | - | 1,993 | 2,112 |
| Total revenues netted against expenditures | 157,276 | 33,386 | 86,070 |
| Total net budgetary expenditures | 2,412,793 | 856,001 | 1,508,655 |
Page details
- Date modified: