
Health Canada Quarterly Financial Report - For the quarter ended September 30, 2017
Table of Contents
- Introduction
- Basis of Presentation
- Highlights of Fiscal Quarter and Fiscal Year to Date Results
- Risks and Uncertainties
- Significant Changes in Relation to Operations, Personnel and Programs
- Statement of Authorities (Unaudited)
- Departmental Budgetary Expenditures by Standard Object (Unaudited)
Introduction
Health Canada is the federal department responsible for helping Canadians maintain and improve their health. In keeping with the Department's commitment to making this country's population among the healthiest in the world as measured by longevity, lifestyle and effective use of the public health care system, its main responsibilities are as a regulator, a service provider, a catalyst for innovation, a funder, and an information provider. A summary of Health Canada's programs may be found in Part II of the Main Estimates. Health Canada administers the Canada Health Act which embodies national principles to ensure a universal and equitable publicly-funded health care system.
This quarterly financial report has been prepared by management as required by section 65.1 of the Financial Administration Act in the form and manner prescribed by the Treasury Board, and should be read in conjunction with the Main Estimates and Supplementary Estimates A.
This quarterly report has not been subject to an external audit or review.
Basis of Presentation
This quarterly report has been prepared by management using an expenditure basis of accounting and using a special purpose financial reporting framework designed to meet financial information needs with respect to the use of spending authorities. The accompanying Statement of Authorities presents the spending authorities granted to Health Canada by Parliament and those used by the Department consistent with the Main Estimates and Supplementary Estimates for the 2017-2018 fiscal year.
The authority of Parliament is required before any money can be spent by the Government. Such authorities are given in the form of annually-approved limits through appropriation acts or through legislation in the form of statutory spending authority for specific purposes.
As part of the departmental performance reporting process, Health Canada prepares its annual departmental financial statements on a full accrual basis in accordance with Treasury Board accounting policies, which are based on Canadian public sector accounting standards. The spending authorities voted by Parliament remain on an expenditure basis.
Highlights of Fiscal Quarter and Fiscal Year to Date Results
This quarterly financial report reflects the results of the current fiscal period in comparison to the authorities provided in the combination of the Main Estimates and Supplementary Estimates A for fiscal year 2017-2018, as well as budget adjustments approved by Treasury Board up to September 30, 2017.
A. Significant Changes to Authorities
The following graph provides a comparison of net budgetary authorities available for spending at the end of each quarter of the current and previous fiscal years.
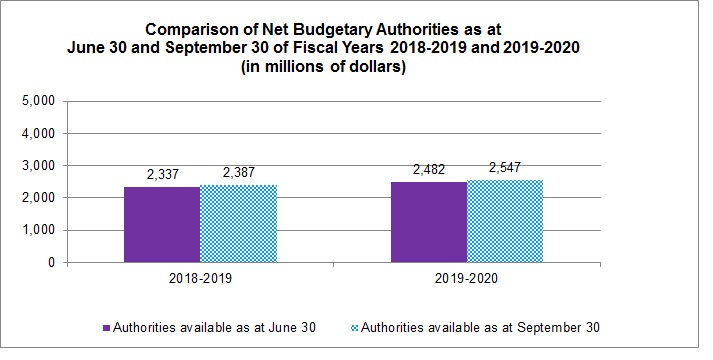
Comparison of Net Budgetary Authorities as at June 30 and September 30 of Fiscal Years 2016-2017 and 2017-2018
Bar chart showing a comparison of net budgetary authorities as at June 30 and September 30 of fiscal years 2016-2017 and 2017-2018 in millions of dollars.
2016-2017 Net budgetary authorities as at June 30 = 3,960; 2016-2017 Net budgetary authorities as at September 30 = 4,011; 2017-2018 Net budgetary authorities at June 30 = 4,357; 2017-2018 Net budgetary authorities as at September 30 = 4,420.
The following table provides a comparison of year to date authorities by vote at the end of the second quarter of the current and previous fiscal years.
| Authorities available (in millions of dollars) | 2016-2017 | 2017-2018 | Variance |
|---|---|---|---|
| Vote 1 - Operating expenditures | 1,869 | 2,012 | 143 |
| Vote 5 - Capital expenditures | 36 | 45 | 9 |
| Vote 10 - Grants and contributions | 1,887 | 2,165 | 278 |
| Statutory | 219 | 198 | (21) |
| Total authorities | 4,011 | 4,420 | 409 |
Year to date authorities available for spending in fiscal year 2017-2018 were $4,420 million at the end of the second quarter as compared with $4,011 million at the end of the second quarter of 2016-2017, representing a net increase of $409 million, or 10.2%. This increase is primarily attributable to the following:
- $154.9 million increase for Jordan's Principle - A Child-First Initiative interim reforms to enable access to social and health services and supports for First Nations children;
- $90.9 million increase for growth in First Nations and Inuit health programs and services;
- $58.2 million increase to continue to fulfill Canada's obligations under the Indian Residential Schools Settlement Agreement;
- $38.2 million increase to support infrastructure and programs for Indigenous early learning and child care;
- $29.0 million increase for Canada Health Infoway for the implementation of e-prescribing technology and telehomecare;
- $24.6 million increase to provide immediate and targeted mental wellness support to First Nations and Inuit;
- $21.2 million increase for the Canada Brain Research Fund;
- $19.9 million increase to maintain and upgrade federal infrastructure assets; and,
- $11.8 million increase in the Department's operating and capital budget carry-forwards.
The increases noted above are partially offset by the following decreases:
- $20.0 million decrease in funding for the Territorial Health Investment Fund as this program sunset in 2016-2017, but was renewed under Budget 2017 with funding expected later in 2017-2018;
- $12.0 million decrease in statutory spending authority for disbursements to Canada Health Infoway Inc.; and,
- $10.9 million decrease for Budget 2016 reductions in professional services, advertising and travel.
The fluctuations in authorities available for spending are most notable in the following standard objects: professional and special services; utilities, materials and supplies; acquisition of land, buildings and works; acquisition of machinery and equipment; and transfer payments.
B. Significant Changes in Year to Date Expenditures
The following graph provides a comparison of net budgetary authorities and year to date spending by quarter for the current and previous fiscal years.
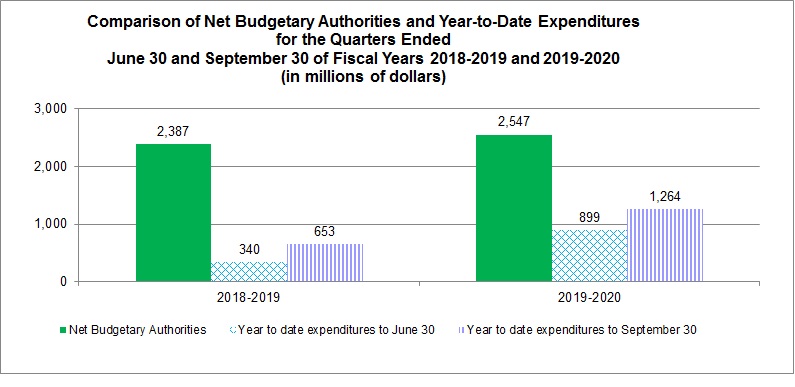
Comparison of Net Budgetary Authorities and Year to Date Expenditures for the Quarters Ended June 30 and September 30 of Fiscal Years 2016-2017 and 2017-2018
Bar chart showing a comparison of net budgetary authorities and year to date expenditures for the quarters ended June 30 and September 30 of fiscal years 2016-2017 and 2017-2018 in millions of dollars.
2016-2017 Net budgetary authorities = 4,011; 2016-2017 Year to date expenditures to June 30 = 1,216; 2016-2017 Year to date expenditures to September 30 = 2,059; 2017-2018 Net budgetary authorities = 4,420; 2017-2018 Year to date expenditures to June 30 = 1,273; 2017-2018 Year to date expenditures to September 30 = 2,248.
The following table provides a comparison of year to date spending by vote at the end of the second quarter of the current and previous fiscal years.
| Year to date expenditures (in millions of dollars) |
2016-2017 | 2017-2018 | Variance |
|---|---|---|---|
| Vote 1 - Operating expenditures | 816 | 923 | 107 |
| Vote 5 - Capital expenditures | 2 | 3 | 1 |
| Vote 10 - Grants and contributions | 1,125 | 1,235 | 110 |
| Statutory | 116 | 87 | (29) |
| Total year to date expenditures | 2,059 | 2,248 | 189 |
At the end of the second quarter of 2017-2018, total budgetary expenditures were $2,248 million compared with $2,059 million reported for the same period of 2016-2017, representing an increase of $189 million or 9.1%.
Year to date net operating expenditures have increased by approximately $107 million or 13.1% when compared to the second quarter of 2016-2017. The significant variances in operating expenditures reported by standard object are as follows:
- $65.6 million increase in personnel costs is primarily due to signing bonuses and retroactive salary payments resulting from the signing of collective agreements;
- $22.3 million increase in utilities, materials and supplies mainly for pharmaceuticals resulting from increases in demand under the Non-Insured Health Benefits program; and,
- $12.2 million increase in transportation and communications mainly due to increased Non-Insured Health Benefits program costs which are driven by demand from clients that resulted in higher airfare, land ambulance and accommodations costs.
There was an increase in Vote 10 - Grants and contributions year to date expenditures of $110 million or 9.8%, primarily due to:
- $118.9 million increase in disbursements for First Nations and Inuit health programs which includes:
- Non-Insured Health Benefit expenditures which are primarily demand-driven and can vary from year to year;
- Implementation of the British Columbia Tripartite Framework Agreement on First Nation Health Governance;
- Jordan's Principle - A Child-First Initiative; and,
- support for capital investments and community facilities operating and maintenance costs;
- $14.5 million increase in contributions to Canada Health Infoway;
- $7.4 million increase in contribution funding to support the Mental Health Commission of Canada; and,
- $6.8 million increase in contributions due to timing of disbursements to the Canada Brain Research Fund.
The increases noted above are partially offset by the following decreases:
- $15.1 million decrease in contributions due to timing of disbursements to the Canadian Partnership Against Cancer;
- $12.6 million decrease in disbursements for the Territorial Health Investment Fund as this program sunset in 2016-2017 but was renewed under Budget 2017 with funding expected later in 2017-2018; and,
- $8.5 million decrease in grant funding to support the Mental Health Commission of Canada.
Statutory year to date expenditures have decreased $29 million or 25.0% from $116 million in 2016-2017 to $87 million in 2017-2018, primarily due to a decrease in transfer payments made to Canada Health Infoway Inc. which are disbursed in accordance with the cash flow needs of that organization.
C. Quarterly Variances
The following graph presents a comparison of quarterly spending by quarter and by fiscal year.
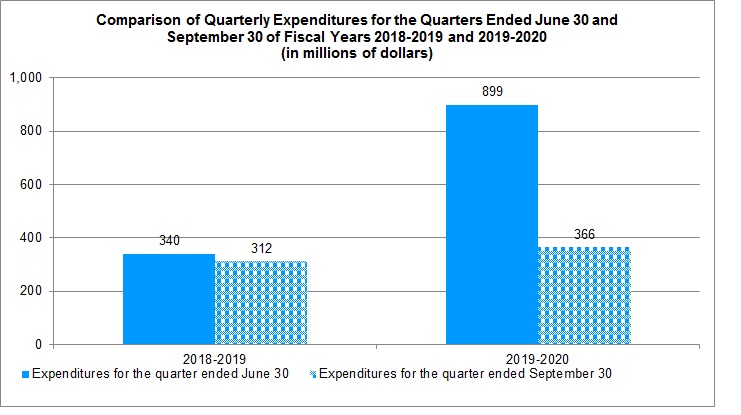
Comparison of Quarterly Expenditures for the Quarters Ended June 30 and September 30 of Fiscal Years 2016-2017 and 2017-2018
Bar chart showing a comparison of quarterly expenditures for the quarters ended June 30 and September 30 of fiscal years 2016-2017 and 2017-2018 in millions of dollars.
2016-2017 Expenditures for the quarter ended June 30 = 1,216; 2016-2017 Expenditures for the quarter ended September 30 = 843; 2017-2018 Expenditures for the quarter ended June 30 = 1,273; 2017-2018 Expenditures for the quarter ended September 30 = 974.
Expenditures in the second quarter of fiscal year 2017-2018 were $974 million compared with $843 million for the second quarter of 2016-2017, representing an increase of $131 million or 15.5% in quarterly spending.
The increase in quarterly spending is due primarily to:
- $43.0 million increase in personnel costs due to signing bonuses and retroactive salary payments resulting from the signing of collective agreements;
- $15.2 million increase in professional and special services comprised of the net impact of:
- expenditures related to the Non-Insured Health Benefits program which are demand-driven and can vary from period to period;
- timing differences in the invoicing of legal services expenditures by the Department of Justice; and,
- timing of expenditures to the Public Health Agency of Canada under the Shared Services Partnership Agreement.
- $36.8 million increase in utilities, materials and supplies for pharmaceutical and medical supply costs resulting from increases in demand and timing differences of payments under the Non-Insured Health Benefits program; and,
- $53.7 million increase in transfer payments related to the timing of disbursements and increased funding for contribution payments to First Nations and Inuit, Canada Brain Research Fund, and Canadian Partnership Against Cancer.
The increases noted above are partially offset by an increase of $36.3 million in revenues netted against expenditures relating to services of a non-regulatory nature mainly due to greater recovery of costs associated with the Non-Insured Health Benefits program as it is a demand-driven program and from growth in the costs of pharmaceutical drugs covered.
Risks and Uncertainties
Health Canada is dedicated to enhancing the health and well-being of Canadians and operates in a dynamic and complex environment characterized by internal and external drivers of change which could potentially be disruptive to the Departments ability to achieve its objectives (e.g. new innovative products, technologies, substances, foods and emerging product categories, evolving relationships between First Nations and Inuit and various levels of government, unforeseen health crises, scientific and technological change, and cyber security).
Health Canada recognizes that its success in fulfilling its mandate is directly related to the effective management of risk. Sound risk management equips the Department to respond proactively to change and uncertainty by using risk-based information to support effective decision-making, resource allocation, and, ultimately, better results for Canadians. Additionally, it can lead to more effective service delivery, better project management, and an increase in value for money.
As a result, the Department employs integrated risk management tools, including the development of an annual Corporate Risk Profile and monitoring of risk management strategies, to proactively and systematically recognize, understand, accommodate and capitalize on new challenges and opportunities, with a focus on results. In addition, the Department has appropriate internal control systems in place, proportionate to the risks being managed.
Prudent management within a constrained fiscal environment and declining carry forwards, is required to manage potential impacts on departmental programs and services. Health Canada continues to manage through effective engagement across the Department, a sound governance structure, as well as through the use of longer-term planning. The Department's executive-level committee on Finance, Investment Planning and Transformation recommends overall direction for financial management and control, and ensures alignment of investments with departmental strategies and transformation initiatives. Each branch is required to have a multi-year financial management plan that has been reviewed by this committee to confirm that it has a plan in place to address the financial context.
Program expenditures experience natural fluctuations from year to year depending on a variety of factors beyond program control (e.g. drug pricing, location of provincial and territorial health services), thus creating risk. Growth in the Non-Insured Health Benefits program is based on 5% growth on actual (annual) expenditures from the prior fiscal year. Enhanced monitoring of expenditures is undertaken, including assessment of expenditures against projected spending as well as previous years' trends and available resources to manage these risks. Cost management and planning are also in place and are reported regularly to senior management for decision making.
The government has announced that the provision of health care services to First Nations and Inuit will be transferred to Indigenous Services. This will represent a significant change, and the Department is already assessing how to manage any associated risks and uncertainties.
Also as announced in Budget 2017, Health Canada is engaged in a review of the Department's programs, operations, and resources. As part of the Treasury Board Policy on Results, the review is intended to take stock of the Department and its programs, ensure that Health Canada is well-aligned to deliver results, and examine options on how to make the best use of available resources.
Significant Changes in Relation to Operations, Personnel and Programs
Ms. Ginette Petitpas Taylor was appointed Minister of Health in August 2017.
There have been no other significant changes in relation to operations, personnel and programs during this quarter.
Approved by:
Original signed by Simon Kennedy
Simon Kennedy
Deputy Minister
Ottawa, Canada
Date: November 20, 2017
Original signed by Randy Larkin
Randy Larkin
Assistant Deputy Minister and Chief Financial Officer
Ottawa, Canada
Date: November 20, 2017
Statement of Authorities (Unaudited)
| Authority | Total available for use for the year ending March 31, 2018* | Used during the quarter ended September 30, 2017 | Year to date used at quarter-end |
|---|---|---|---|
| Vote 1 - Operating expenditures | 2,011,888 | 485,938 | 922,901 |
| Vote 5 - Capital expenditures | 44,858 | 2,183 | 2,584 |
| Vote 10 - Grants and contributions | 2,164,870 | 455,013 | 1,235,143 |
| (S) Contributions to employee benefit plans | 120,222 | 29,861 | 59,722 |
| (S) Minister of Health - Salary and motor car allowance | 84 | 28 | 49 |
| (S) Spending of proceeds from the disposal of surplus Crown assets | 185 | 40 | 42 |
| (S) Refunds of amounts credited to revenues in previous years | 130 | 51 | 130 |
| (S) Canada Health Infoway Inc. | 25,848 | - | 25,848 |
| (S) Collection agency fees | - | 1 | 1 |
| (S) Court awards | - | 1,185 | 1,185 |
| (S) Spending of revenues pursuant to section 4.2 of the Department of Health Act | 51,463 | - | - |
| Total authorities | 4,419,548 | 974,300 | 2,247,605 |
* Includes only Authorities available for use and granted by Parliament at quarter end (S) - Statutory Vote |
|||
| Authority | Total available for use for the year ending March 31, 2017* | Used during the quarter ended September 30, 2016 | Year to date used at quarter-end |
|---|---|---|---|
| Vote 1 - Operating expenditures | 1,868,807 | 393,381 | 815,802 |
| Vote 5 - Capital expenditures | 35,969 | 2,322 | 2,381 |
| Vote 10 - Grants and contributions | 1,887,055 | 401,132 | 1,125,036 |
| (S) Contributions to employee benefit plans | 129,095 | 31,341 | 62,682 |
| (S) Minister of Health - Salary and motor car allowance | 84 | 14 | 21 |
| (S) Spending of proceeds from the disposal of surplus Crown assets | 295 | 13 | 67 |
| (S) Refunds of amounts credited to revenues in previous years | 106 | 54 | 106 |
| (S) Canada Health Infoway Inc. | 37,878 | - | 37,878 |
| (S) Collection agency fees | 1 | - | 1 |
| (S) Transfer payments in connection with the Budget Implementation Act | 389 | 194 | 389 |
| (S) Spending of revenues pursuant to section 4.2 of the Department of Health Act | 51,463 | 14,834 | 14,834 |
| Total authorities | 4,011,142 | 843,285 | 2,059,197 |
* Includes only Authorities available for use and granted by Parliament at quarter end (S) - Statutory Vote |
|||
Departmental Budgetary Expenditures by Standard Object (Unaudited)
| Standard Object | Planned expenditures for the year ending March 31, 2018 | Expended during the quarter ended September 30, 2017 | Year to date used at quarter-end |
|---|---|---|---|
| Expenditures: | |||
| Personnel | 914,264 | 253,239 | 454,001 |
| Transportation and communications | 261,120 | 66,026 | 114,596 |
| Information | 17,295 | 1,453 | 2,741 |
| Professional and special services | 649,191 | 114,048 | 216,617 |
| Rentals | 10,115 | 5,772 | 7,079 |
| Repair and maintenance | 20,706 | 3,284 | 4,936 |
| Utilities, materials and supplies | 613,895 | 147,384 | 275,011 |
| Acquisition of land, buildings and works | 8,808 | 133 | 133 |
| Acquisition of machinery and equipment | 35,852 | 9,959 | 17,627 |
| Transfer payments | 2,190,717 | 455,012 | 1,260,990 |
| Other subsidies and payments | 3,472 | 7,230 | 9,578 |
| Total gross budgetary expenditures | 4,725,435 | 1,063,540 | 2,363,309 |
| Less revenues netted against expenditures: | |||
| Rights and privileges | 61,521 | 5,035 | 16,587 |
| Services non-regulatory | 181,435 | 73,683 | 76,674 |
| Services regulatory | 62,931 | 10,521 | 22,320 |
| Services to other government departments | - | 1 | 123 |
| Total revenues netted against expenditures | 305,887 | 89,240 | 115,704 |
| Total net budgetary expenditures | 4,419,548 | 974,300 | 2,247,605 |
| Standard Object | Planned expenditures for the year ending March 31, 2017 | Expended during the quarter ended September 30, 2016 | Year to date used at quarter-end |
|---|---|---|---|
| Expenditures: | |||
| Personnel | 903,657 | 210,271 | 399,226 |
| Transportation and communications | 271,048 | 55,386 | 102,350 |
| Information | 13,666 | 1,203 | 1,811 |
| Professional and special services | 515,093 | 98,815 | 214,574 |
| Rentals | 8,960 | 3,305 | 6,949 |
| Repair and maintenance | 24,246 | 3,594 | 4,972 |
| Utilities, materials and supplies | 597,930 | 110,570 | 252,746 |
| Acquisition of land, buildings and works | 24,773 | 584 | 607 |
| Acquisition of machinery and equipment | 11,142 | 8,529 | 15,244 |
| Transfer payments | 1,925,322 | 401,327 | 1,163,304 |
| Other subsidies and payments | 3,206 | 4,203 | 5,525 |
| Total gross budgetary expenditures | 4,299,043 | 897,787 | 2,167,308 |
| Less revenues netted against expenditures: | |||
| Rights and privileges | 57,573 | 7,389 | 15,139 |
| Services non-regulatory | 170,448 | 37,337 | 71,984 |
| Services regulatory | 59,880 | 9,633 | 20,845 |
| Services to other government departments | - | 143 | 143 |
| Total revenues netted against expenditures | 287,901 | 54,502 | 108,111 |
| Total net budgetary expenditures | 4,011,142 | 843,285 | 2,059,197 |
Page details
- Date modified: