
Canadian Substance Use Survey (CSUS): summary of results for 2023
Background
The Canadian Substance Use Survey (CSUS) (previously the Canadian Alcohol and Drugs Survey) is conducted every other year by Health Canada (HC). It aims to collect data from people living in Canada to identify the prevalence of and trends in alcohol and drug use. Data from CSUS are used to develop, implement, and evaluate strategies, policies, and programs surrounding alcohol and drug use in Canada. CSUS and its predecessors have been one of Health Canada's main sources of national substance use data since 2008.
CSUS has evolved over time. Initially, the Canadian Tobacco Use Monitoring Survey (CTUMS, 1999 - 2012) measured the use of tobacco and the Canadian Alcohol and Drug Use Monitoring Survey (CADUMS, 2008 - 2012) measured the use of alcohol and drugs. CTUMS and CADUMS were merged into the Canadian Tobacco, Alcohol and Drug Survey (CTADS) in 2013. CTADS was conducted every other year from 2013 to 2017. In 2019, HC separated CTADS into two surveys: the Canadian Alcohol and Drugs Survey (CADS), focused on alcohol and drug surveillance, and the Canadian Tobacco and Nicotine Survey (CTNS), focused on tobacco use and vaping. In 2023, CADS was renamed as CSUS following large methodological changes.
CSUS 2023 was conducted from May to December 2023.
Demographics
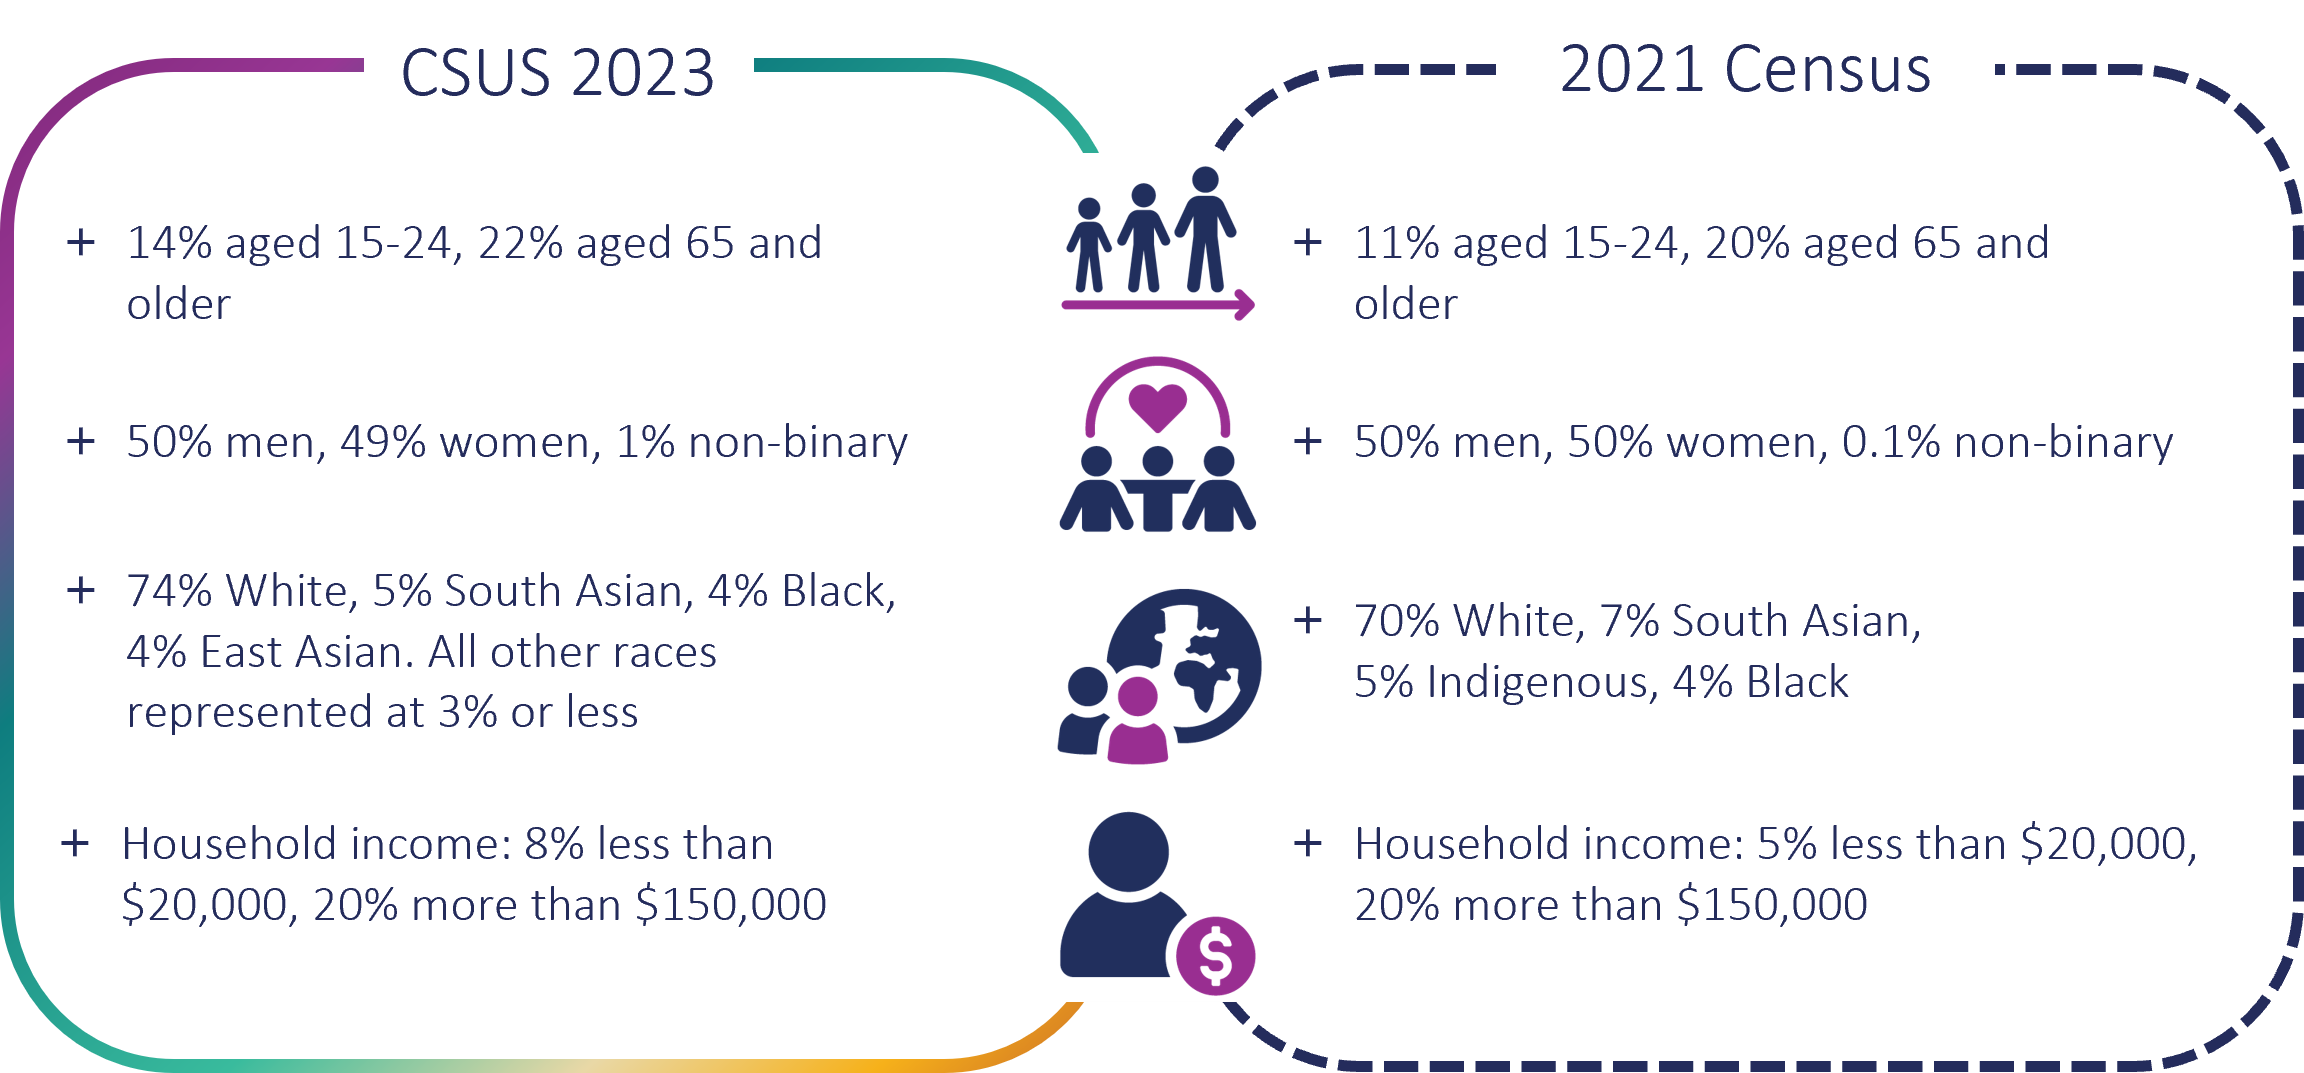
Figure 1: Descriptive text
A figure with two boxes side by side. The left side describes CSUS 2023 respondents: 14% aged 15 - 24, 22% aged 65 and older. 50% men, 49% women, 1% non-binary. 74% White, 5% South Asian, 4% Black, 4% East Asian. All other races represented at 3% or less. Household income: 8% less than $20,000, 20% more than $150,000.
On the right, the demographics of the 2021 census were: 11% aged 15 to 24, 20% aged 65 and older. 50% men, 50% women, 0.1% non-binary. 70% White, 7% South Asian, 5% Indigenous, 4% black. Household income: 5% less than $20,000, 20% more than $150,000.
Sampling redesign
The method for contacting respondents was changed between CADS 2019 and CSUS 2023. The purpose of the change was to capture more respondents, particularly those aged 15 to 24. Details on changes can be found in the Technical Notes. Due to these changes, we do not recommend comparing results. CSUS 2023 results are stand-alone.
The increased sample size allows us to highlight in this report differences in substance use between adult and youth/young adult populations. It also allows us to report differences in substance use between those with poor or fair self-rated mental health and those with very good or excellent self-rated mental health.
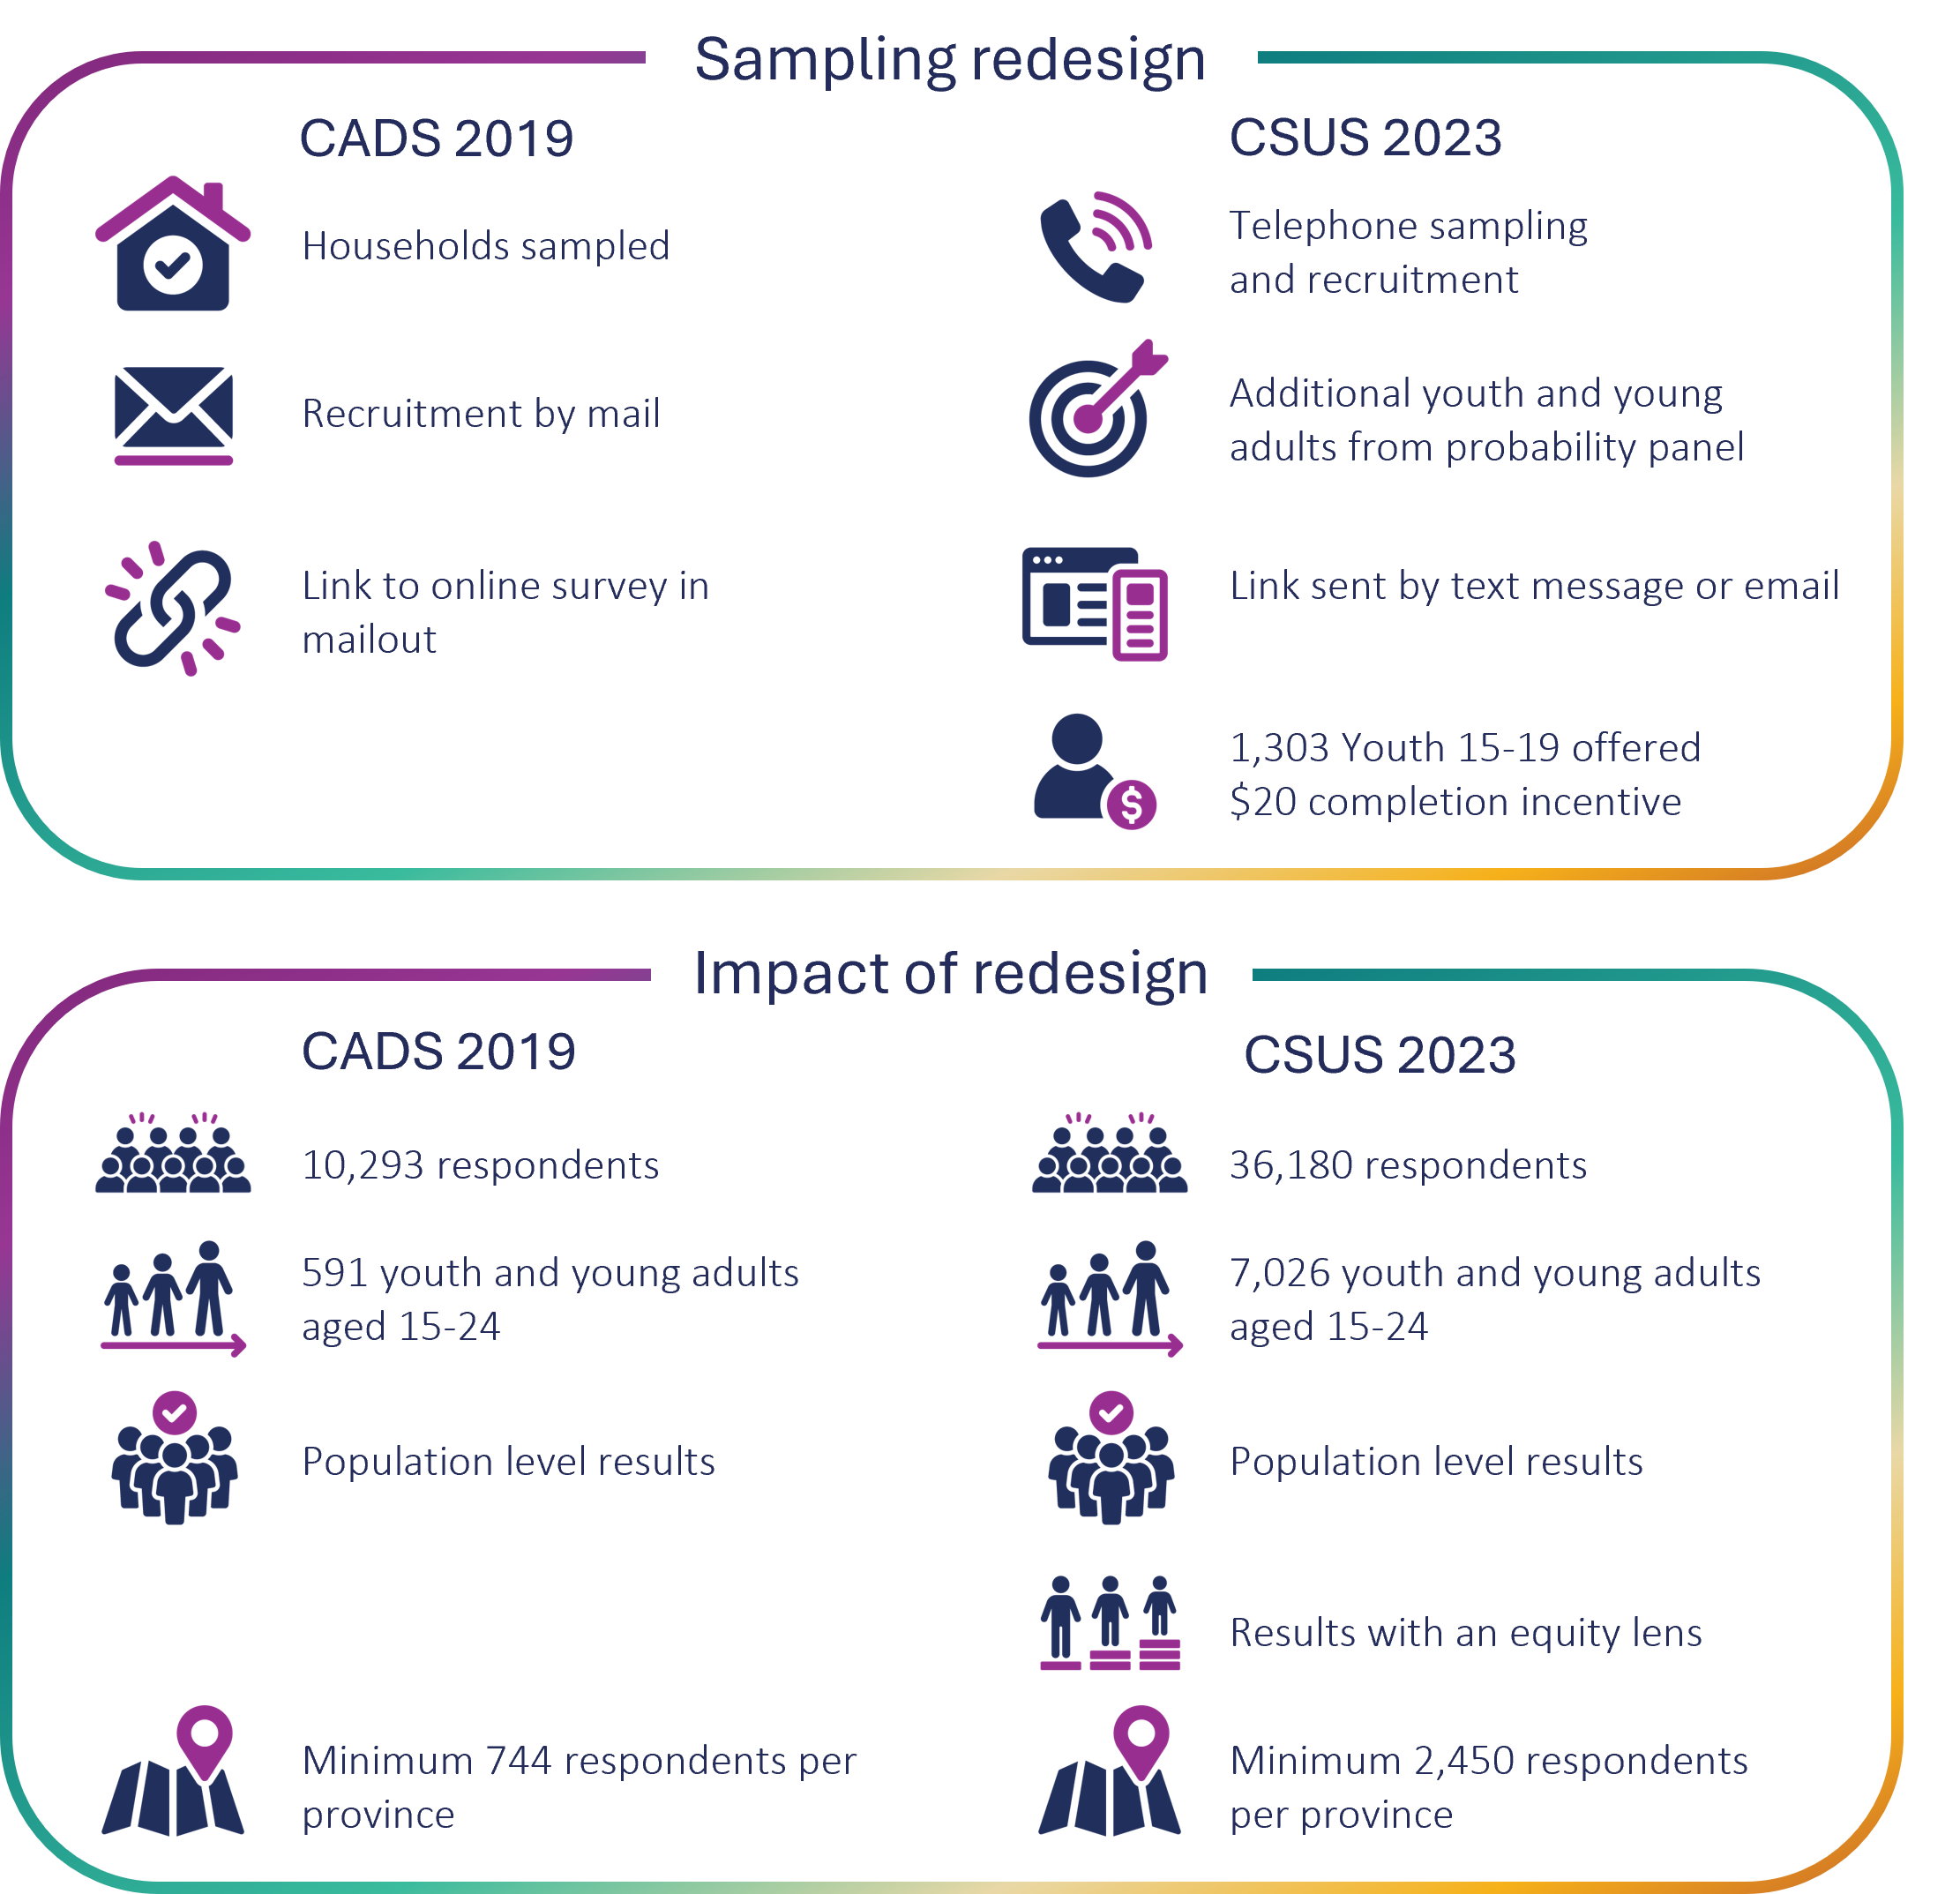
Figure 2: Descriptive text
A figure describing the sampling design and impacts of the redesign from CADS 2019 to CSUS 2023.
The sampling design in CADS 2019 had households sampled, recruitment by mail, and a link to an online survey included in the mailout.
In CSUS 2023, the design included: telephone sampling and recruitment, additional youth and young adults recruited from a probability panel, a link sent by text message or email, and 1303 youth aged 15 - 19 offered a $20 completion incentive.
For the impact of the redesign, in CADS 2019 there were 10,293 respondents and 36,180 in CSUS 2023.
In CADS 2019 there were 591 youth and young adults recruited aged 15 to 24. In CSUS 2023, there were 7026.
In CADS 2019 results were presented at the population level. In CSUS 2023, results are presented at the population level and with an equity lens.
In CADS 2019, there were a minimum of 744 respondents per province. In CSUS 2023, there were a minimum of 2450 respondents per province.
Substance use among the general population in Canada
Use of legal substances by the general population

Figure 3: Descriptive text
This figure shows the lifetime and past 12 month prevalences of use for the legal substances of interest. For cigarettes and vaping, the past 30 day use is displayed instead of past 12 months.
Lifetime prevalence of alcohol use: 90%
Past 12 month prevalence of alcohol use: 79%
Lifetime prevalence of cannabis use: 63%
Past 12 month prevalence of cannabis use: 32%
Lifetime prevalence of sedative use: 22%
Past 12 month prevalence of sedative use: 13%
Lifetime prevalence of opioid use: 30%
Past 12 month prevalence of opioid use: 13%
Lifetime prevalence of cigarette use: 51%
Past 30 day prevalence of cigarette use: 13%
Lifetime prevalence of vaping product use: 23%
Past 30 day prevalence of vaping product use: 10%
Lifetime prevalence of stimulant use: 10%
Past 12 month prevalence of stimulant use: 5%
Alcohol was the most commonly used substance of interest in the past 12 months, followed by cannabis, then sedatives, opioids, and cigarettes.
Most people who had used alcohol in their lifetime also used it in the past 12 months (88%).
Among those who had used other legal substances in their lifetime, the percentage who had used them in the past 12 months was: 60% for sedatives, 51% for cannabis, 43% for opioids, and 25% for cigarettes (past 30 days/lifetime).
Use of illegal substances by the general population

Figure 4: Descriptive text
This figure shows the lifetime and past 12 month prevalences of use for the illegal substances of interest.
Lifetime prevalence of any illegal substance use: 21%
Past 12 month of any illegal substance use: 8%
Lifetime prevalence of psychedelic use: 16%
Past 12 month prevalence of psychedelic use: 6%
Lifetime prevalence of cocaine or crack use: 12%
Past 12 month prevalence of cocaine or crack use: 3%
Lifetime prevalence of ecstasy or similar designer drug use: 9%
Past 12 month prevalence of ecstasy or similar designer drug use: 2%
Psychedelics were the most common illegal substance used, followed by cocaine or crack, and ecstasy or similar designer drugs.
Of those who had used any illegal substance in their lifetime, 38% did so in the past 12 months.
<1% used amphetamines or methamphetamines, dissociatives, nitrous oxide, salvia, inhalants, heroin, illegal fentanyl, or kratom in 2023.
Use of two or more substances in combination by the general population (polysubstance use)
Polysubstance use was measured as the use of any substance of interest at the same time or on the same occasion as using alcohol, cannabis, or prescription opioids.
The combinations used most frequently were alcohol when using cannabis (21%), cannabis when using alcohol (20%), and psychedelics when using alcohol (4%).
28% of people used two or more substances in combination or on the same occasion in the previous 12 months.
Substance use among youth and young adults in Canada
Use of legal substances by youth and young adults
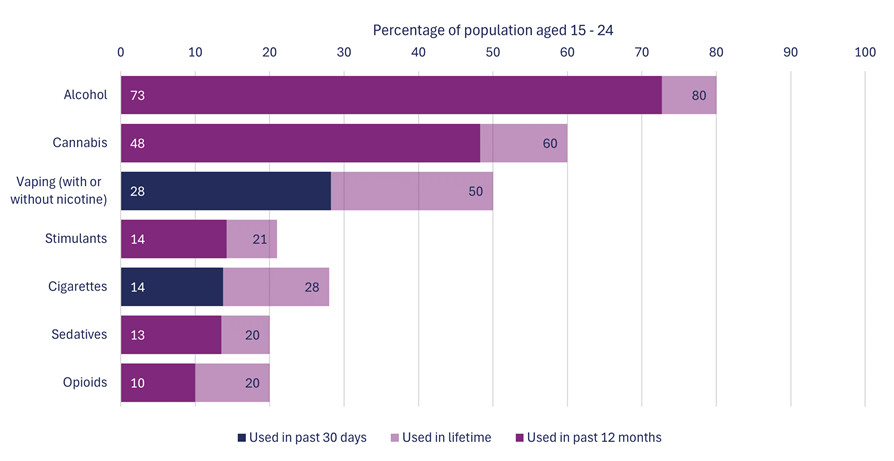
Figure 5: Descriptive text
This figure shows the lifetime and past 12 month prevalences of use for the legal substances of interest by youth and young adults aged 15 to 24. For cigarettes and vaping, the past 30 day use is displayed instead of past 12 months.
Lifetime prevalence of alcohol use: 80%
Past 12 month prevalence of alcohol use: 73%
Lifetime prevalence of cannabis use: 60%
Past 12 month prevalence of cannabis use: 48%
Lifetime prevalence of vaping product use: 50%
Past 30 day prevalence of vaping product use: 28%
Lifetime prevalence of stimulant use: 21%
Past 12 month prevalence of stimulant use: 14%
Lifetime prevalence of cigarette use: 28%
Past 30 day prevalence of cigarette use: 14%
Lifetime prevalence of sedative use: 20%
Past 12 month prevalence of sedative use: 13%
Lifetime prevalence of opioid use: 20%
Past 12 month prevalence of opioid use: 10%
In the past 12 months, youth and young adults were slightly less likely to have used alcohol (73%) or pharmaceutical opioids (10%) than adults (80% and 14%, respectively).
Youth and young adults were equally as likely as adults (13-14%) to have used sedatives in the past 12 months or have smoked a cigarette in the past 30 days (also 13-14%).
Youth and young adults were more likely to have used cannabis (48%), vape products (28% - past 30 days), and stimulants (14%) than adults (30%, 7%, and 4%, respectively).
While the majority of prescription opioids (94%), stimulants (82%), and sedatives (93%) were used for medical purposes, youth and young adults were 2-3 times more likely to have used these products for non-medical purposes than adults.
Use of illegal substances by youth and young adults
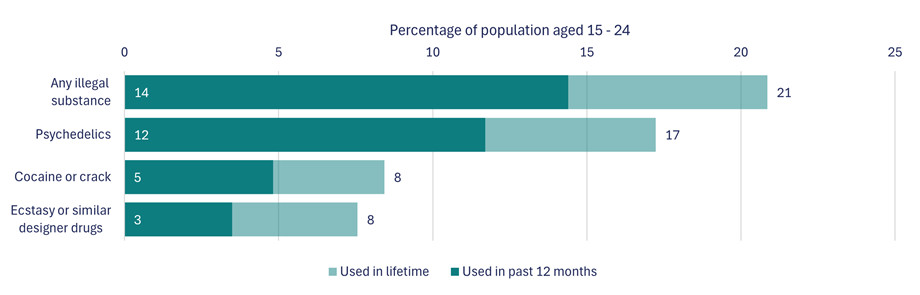
Figure 6: Descriptive text
This figure shows the lifetime and past 12 month prevalences of use for the illegal substances of interest by youth and young adults aged 15 to 24.
Lifetime prevalence of any illegal substance use: 21%
Past 12 month prevalence of any illegal substance use: 14%
Lifetime prevalence of psychedelic use: 17%
Past 12 month prevalence of psychedelic use: 12%
Lifetime prevalence of cocaine or crack use: 8%
Past 12 month prevalence of cocaine or crack use: 5%
Lifetime prevalence of ecstasy or similar designer drug use: 8%
Past 12 month prevalence of ecstasy or similar designer drug use: 3%
Youth and young adults were equally as likely to have used an illegal substance in their lifetime as adults (21%). They were also equally likely (16-17%) to have used psychedelics in their lifetime.
However, youth and young adults were more than twice as likely to have used psychedelics in the past 12 months than adults (5%). Accordingly, the 16% of adults who reported using psychedelics in their lifetime noted that, on average, their first use was at age 20-21.
Youth and young adults were more than twice as likely to have used an illegal drug in the past 12 months than adults – driven by use of psychedelics.
Use of 2 or more substances in combination by youth and young adults
The most common combinations were alcohol when using cannabis (36%), cannabis when using alcohol (35%), followed by psychedelics when using cannabis (8%) and psychedelics when using alcohol (7%).
42% of youth and young adults used two or more substances in combination or on the same occasion in the previous 12 months.
Mental health and substance use
18% of people reported that their mental health was poor or fair.
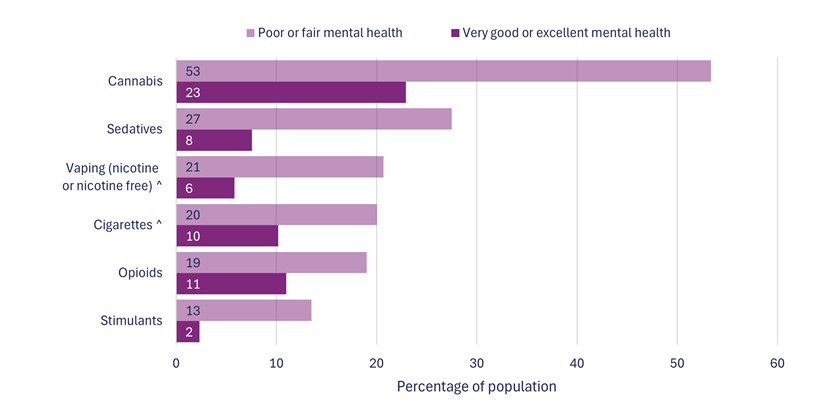
Figure 7: Descriptive text
This figure shows past 12 month prevalences of use for the legal substances of interest broken down by those rating their mental health as poor or fair compared to those rating their mental health as very good or excellent. For cigarettes and vaping, the past 30 day use is displayed instead of past 12 months.
Cannabis use in the past 12 months by those rating their mental health as poor or fair: 53%
Cannabis use in the past 12 months by those rating their mental health as very good or excellent: 23%
Sedative use in the past 12 months by those rating their mental health as poor or fair: 27%
Sedative use in the past 12 months by those rating their mental health as very good or excellent: 8%
Vaping product use in the past 30 days by those rating their mental health as poor or fair: 21%
Vaping product use in the past 30 days by those rating their mental health as very good or excellent: 6%
Cigarette use in the past 30 days by those rating their mental health as poor or fair: 20%
Cigarette use in the past 30 days by those rating their mental health as very good or excellent: 10%
Opioid use in the past 12 months by those rating their mental health as poor or fair: 19%
Opioid use in the past 12 months by those rating their mental health as very good or excellent: 11%
Stimulant use in the past 12 months by those rating their mental health as poor or fair: 13%
Stimulant use in the past 12 months by those rating their mental health as very good or excellent: 2%
^ Past 30 day prevalence of cigarette smoking and vaping, compared to past 12 months for other substances
Past 12 month prevalence of alcohol use did not vary by self-rated mental health (79%).
Excluding alcohol, legal substances were used by approximately twice as many people with poor or fair self-rated mental health than those with very good or excellent self-rated mental health.
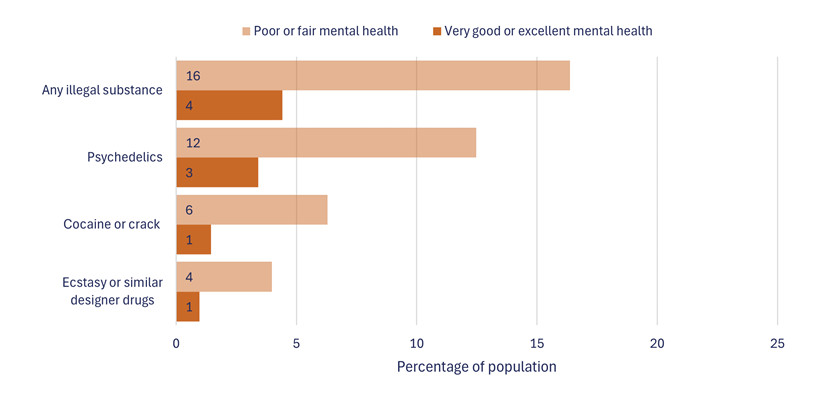
Figure 8 : Descriptive text
This figure shows past 12 month prevalences of use for the illegal substances of interest broken down by those rating their mental health as poor or fair compared to those rating their mental health as very good or excellent.
Any illegal substance use in the past 12 months by those rating their mental health as poor or fair: 16%
Any illegal substance use in the past 12 months by those rating their mental health as very good or excellent: 4%
Psychedelic use in the past 12 months by those rating their mental health as poor or fair: 12%
Psychedelic use in the past 12 months by those rating their mental health as very good or excellent: 3%
Cocaine or crack use in the past 12 months by those rating their mental health as poor or fair: 6%
Cocaine or crack use in the past 12 months by those rating their mental health as very good or excellent: 1%
Ecstasy or similar designer drug use in the past 12 months by those rating their mental health as poor or fair: 4%
Ecstasy or similar designer drug use in the past 12 months by those rating their mental health as very good or excellent: 1%
Those rating their mental health as poor or fair were 4 times more likely to have used any illegal substance in the past 12 months.
Full results available online.
These summary results show only a small portion of the data collected in CSUS 2023. All indicators are available on an online tool, which allows for disaggregation of indicators by many sociodemographic factors.
Also released alongside this report are Technical Notes, which detail changes in methodology. For the Technical Notes, 2023 questionnaire, and reports for previous iterations of CSUS, see the Canadian Substance Use Survey page.
For more information about the survey and the results, please send an e-mail to odss.bssd@hc-sc.gc.ca.
Endnote
Canadian Substance Use Survey – Summary of Results 2023. (2024) Government of Canada. Health Canada. Controlled Substances and Overdose Response Directorate, Office of Drug Research and Surveillance.