
Canadian Cannabis Survey 2023: Summary
On this page
Introduction
The Cannabis Act came into force on October 17, 2018 and provides legal access to cannabis and controls and regulates its production, distribution and sale. To evaluate the impact of the Cannabis Act, Health Canada collects data to better understand how Canadians view and use cannabis. These data also support development of policy and program initiatives, including public education and awareness activities.
Health Canada developed and implemented the Canadian Cannabis Survey (CCS), in anticipation of legalization, to obtain detailed information about the habits of people who use cannabis and behaviours relative to cannabis use over time.
The CCS started in 2017 and is conducted annually. It examines aspects of patterns of use, such as the quantities of cannabis consumed and the use of cannabis for medical purposes; The cannabis market, such as sources of cannabis and pricing; and issues of public safety, such as impaired driving. While core content remains consistent to allow for comparisons, survey content is reviewed annually and modified to address any identified gaps in the data.
The 2023 CCS included additional questions related to such issues as:
- reporting and occurrence of adverse reactions
- how people identify legal sources of cannabis
- knowledge of requirements for cannabis packaging
- assessment of problematic cannabis use
The 2023 CCS was also revised to remove redundancies. In previous survey cycles, most questions on cannabis use and related indicators were asked in two sections that inquired about cannabis use for non-medical and medical purposes, respectively. In the CCS 2023, the majority of these questions were replaced by a single question that referred to any cannabis use. Respondents were also asked about their reason for cannabis use in the past 12 months (non-medical purposes only, medical purposes only, both, or no cannabis use), to allow results to be disaggregated by medical versus non-medical use.
Results by theme
Results from the 2023 survey are presented by theme. The CCS has been conducted for 5 years since cannabis for non-medical purposes was legalized in Canada in October 2018. To document changes over time, comparisons to 2018 are presented. Note that for survey questions that were added to the survey in later cycles, findings from 2023 are compared to the first year in which the question was asked. Findings are also compared to the previous survey cycle (2022). Findings are unchanged from 2022 unless stated otherwise.
For key findings across Canada from the CCS 2018 to 2023, visit the Cannabis use for non-medical purposes among Canadians (aged 16+).
All reported increases and decreases in the text below are statistically significant changes (meaning that they are not likely to have occurred by chance alone). To improve readability, the words "statistically significant" will not be repeated. Similarly, at times the text will state that the proportion is "unchanged" or not different between groups, even though the numbers are not identical. This occurs when the difference between numbers is not statistically significant.
Definitions
- Cannabis use includes using cannabis in its dry form or when mixed or processed into another product, such as an edible, a concentrate, including hashish, a liquid, or other product.
- Cannabis use for non-medical purposes is defined as use for a range of non-medical reasons (such as, socially for enjoyment, pleasure, amusement or for spiritual, lifestyle and other non-medical reasons).
- Cannabis use for medical purposes is defined as use to treat a disease or disorder or to improve symptoms.
Detailed results tables have been published on the Library and Archives Canada website. A summary of the key results by theme is provided below.
In this section
- Knowledge, attitudes and opinions
- Cannabis use and products used
- Sources and purchasing
- Assessment of problematic cannabis use
- Other outcomes
- Driving and cannabis
- Cannabis for medical purposes
Knowledge, attitudes and opinions
Canadians were asked questions about their knowledge and opinions related to cannabis. Topics included:
- Knowledge and beliefs about harms related to cannabis
- Access to trustworthy information
- Exposure to health warning messages and public health messaging
- Exposure to advertisements or promotions of cannabis
- Social acceptability of cannabis and other substance use
- Perceived risk of using cannabis and other substances
- Identifying legal stores and websites
- Knowledge of cannabis packaging requirements
Knowledge/beliefs about harms related to cannabis
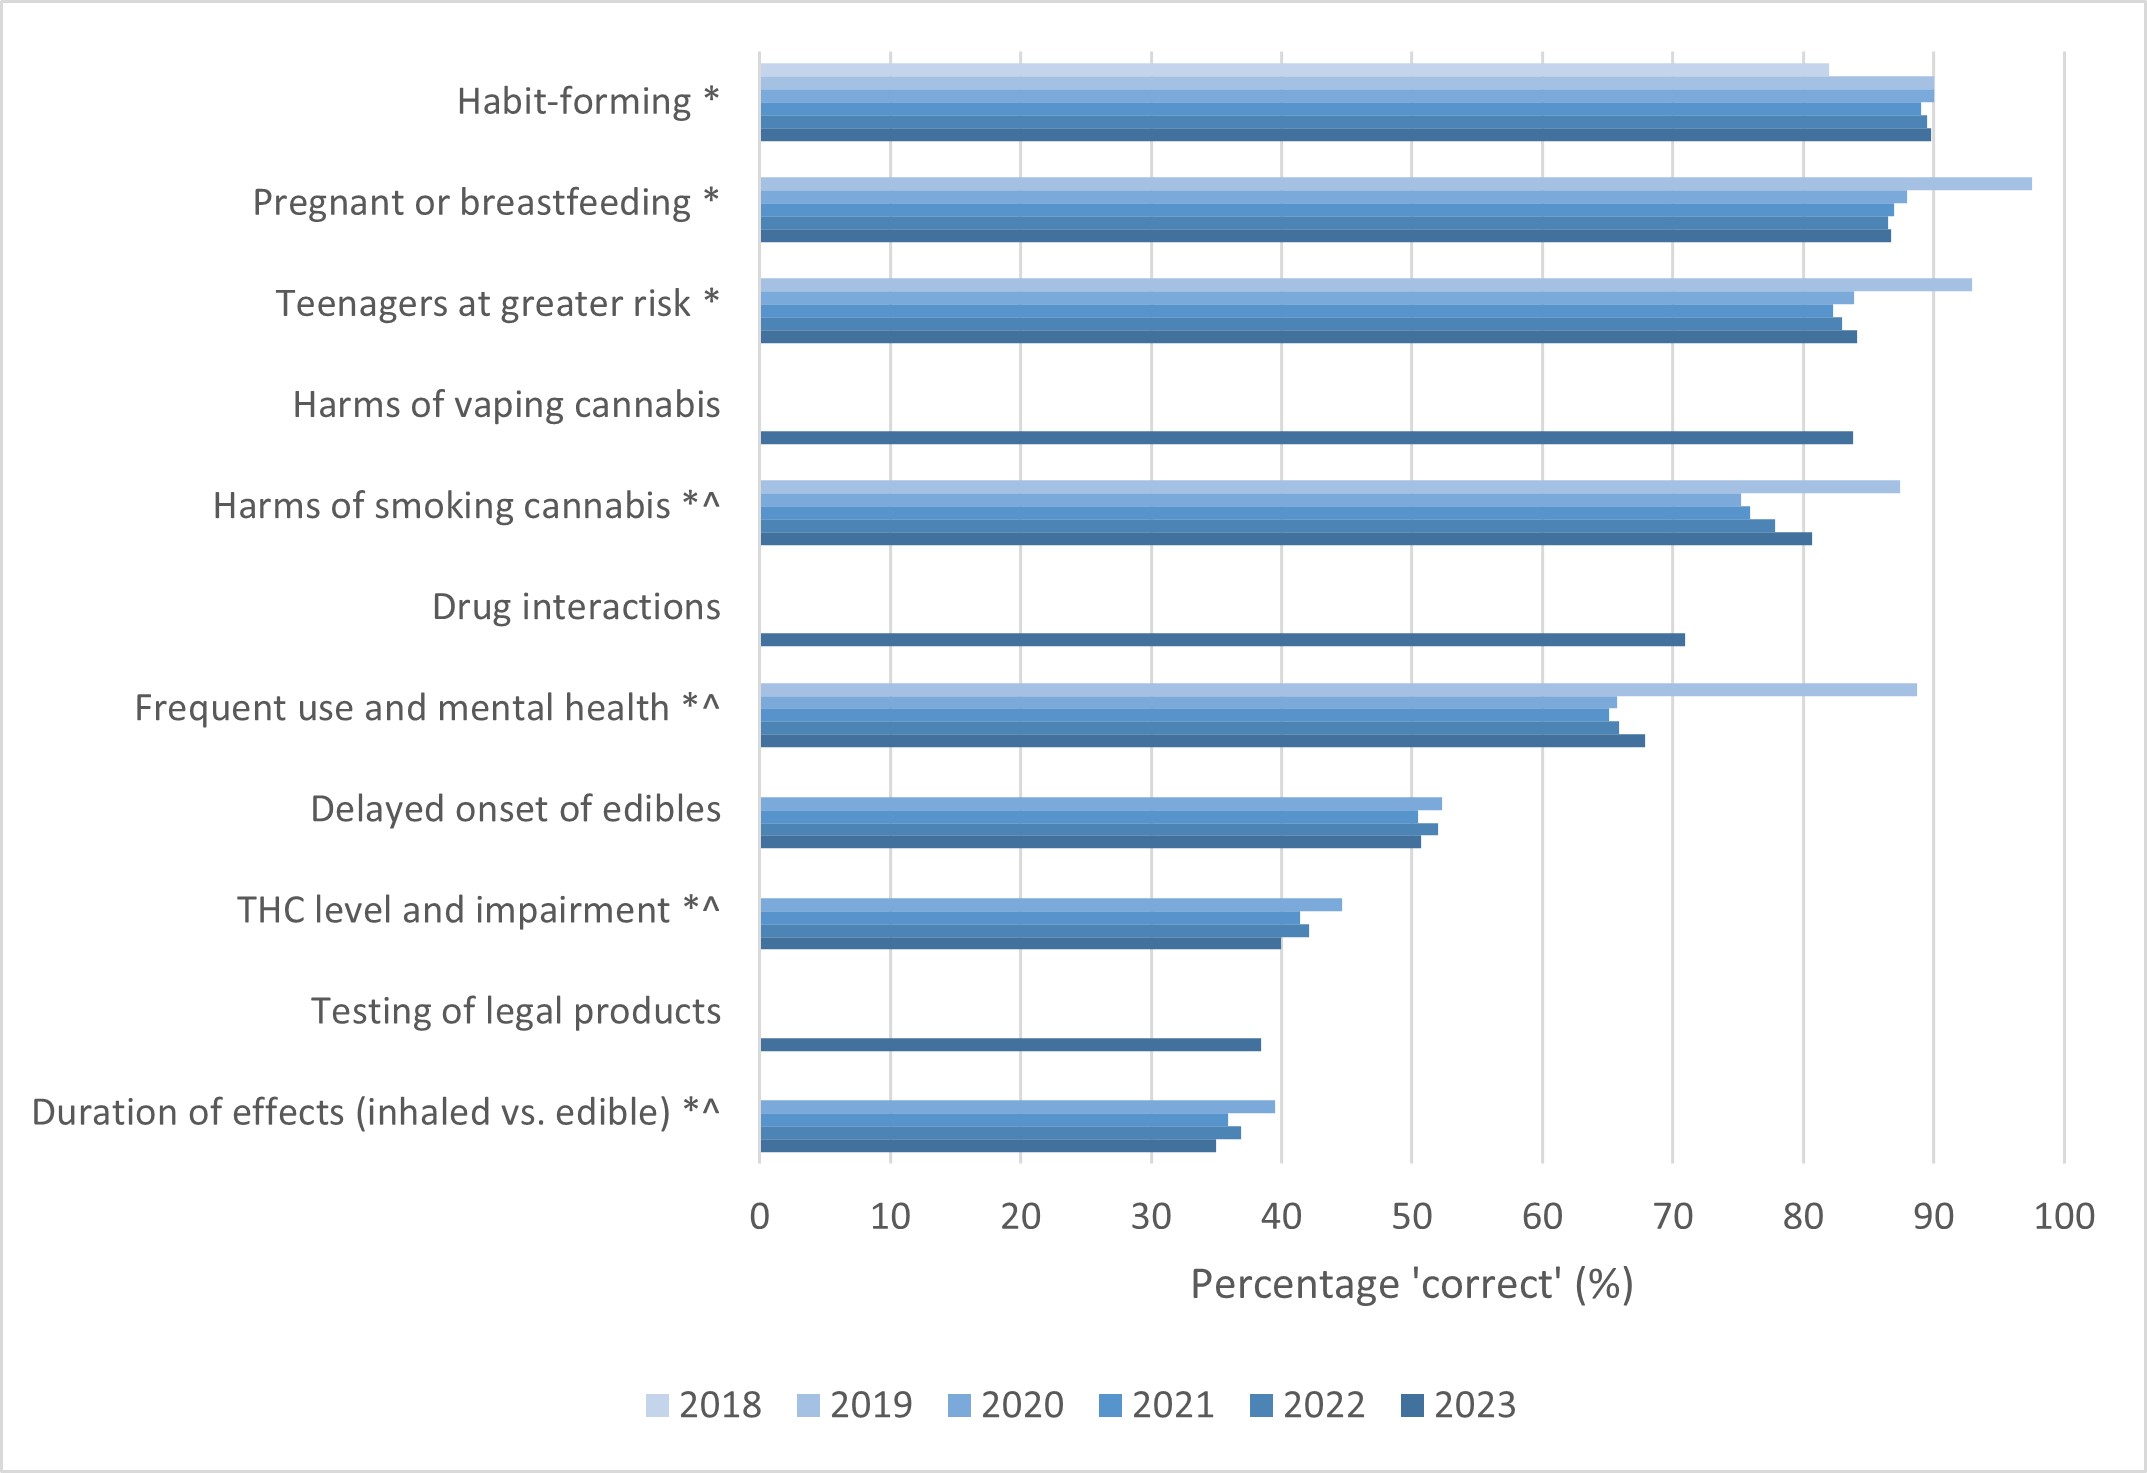
Canadians were asked a series of questions which assessed their knowledge and beliefs about harms related to cannabis. Changes over time are shown in Figure 1. In all years, over 80% of Canadians correctly identified that cannabis use can be habit-forming, that use while pregnant or breastfeeding can be harmful, that teenagers are at greater risk of harms from cannabis use, and that vaping cannabis can be harmful (added in 2023). In 2023, 68% believed that daily or almost daily cannabis use increases the risk of mental health problems. Approximately half of Canadians or fewer correctly identified that it could take 4 or more hours to feel the full effects of cannabis edibles or drinks, the association between THC levels and impairment, knew that legal cannabis products were tested for contaminants, and were aware of the longer duration of effects of edibles versus inhaled cannabis products.
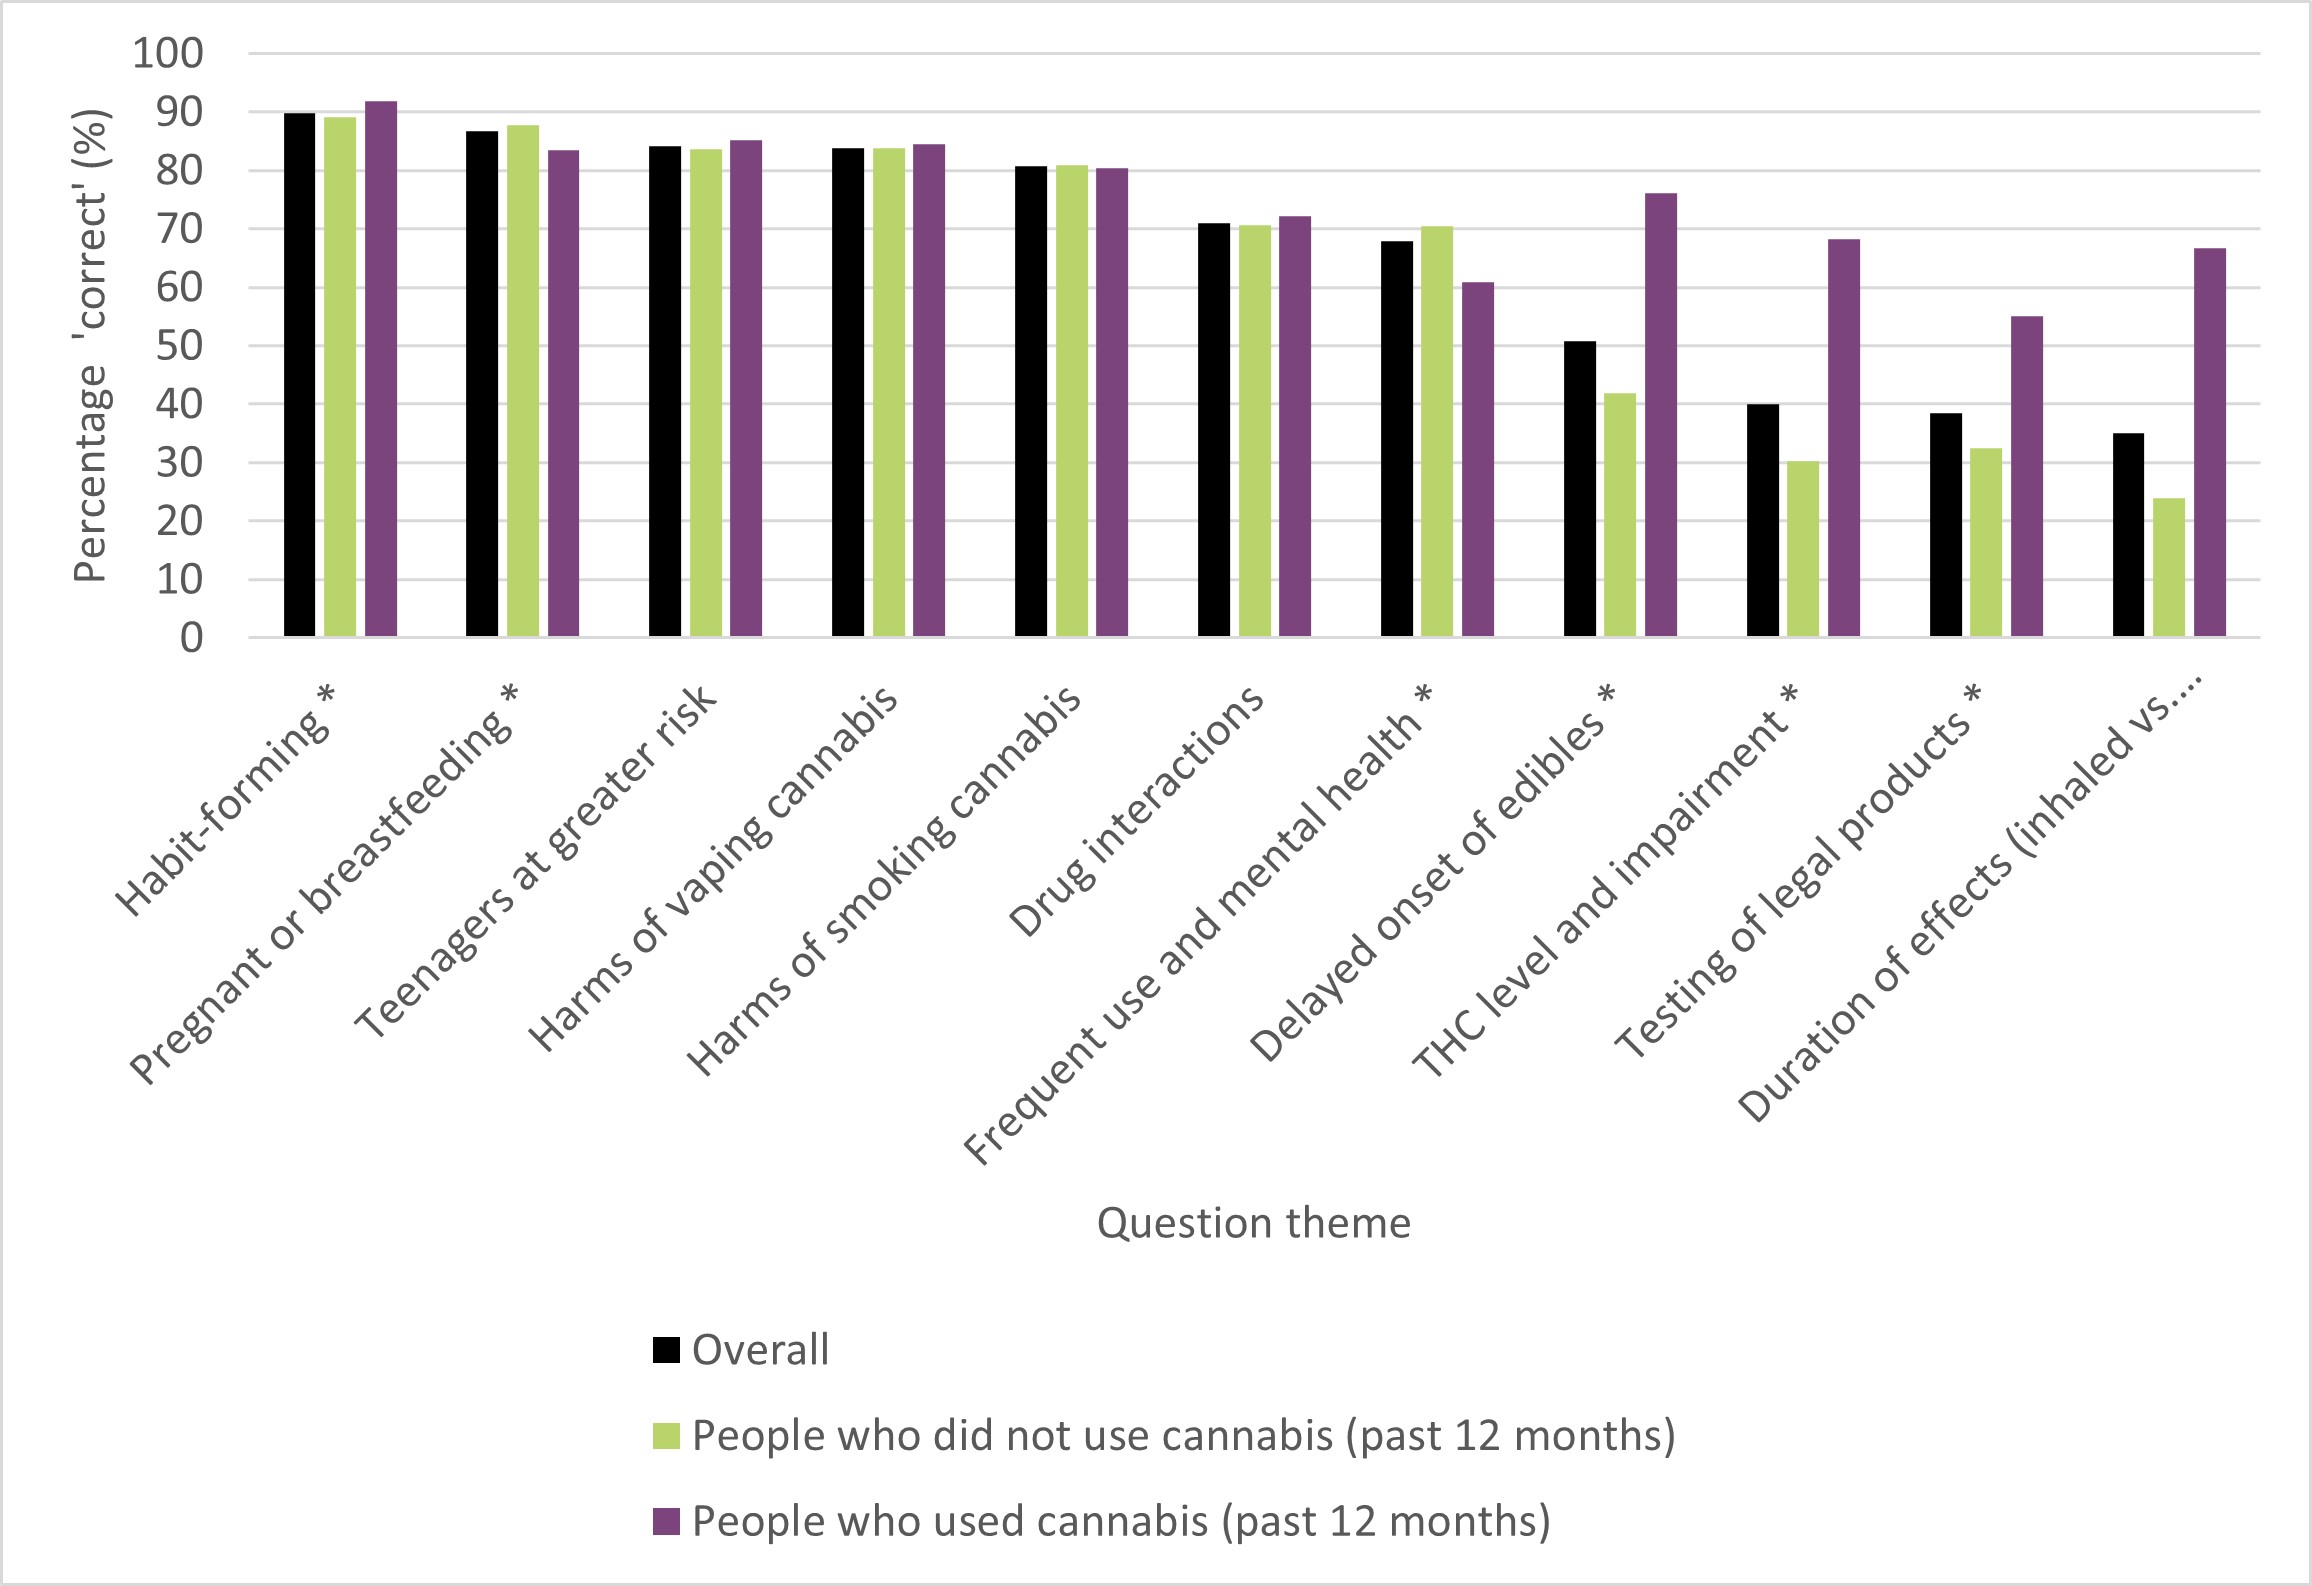
Knowledge and beliefs about cannabis-associated harms differed by cannabis use (Figure 2). Compared to those who had not used cannabis, those who had used cannabis in the past 12 months were more likely to acknowledge that cannabis can be habit-forming, were aware that the effects of edibles have a delayed onset, knew of the association between THC levels and impairment, knew that legal cannabis products are tested for contaminants, and were aware of the longer duration of effects of edibles versus inhaled cannabis products. On the other hand, those who had used cannabis in the past 12 months were less likely to acknowledge the harms associated with cannabis use while pregnant or breastfeeding or the risk of mental health issues associated with daily or almost daily cannabis use.
Figure 1. Knowledge or beliefs regarding cannabis-associated harmsFigure 1, Footnote 1, 2018 to 2023
- Figure 1 footnote 1
-
Question wording for Figures 1 and 2
The question wording have been abbreviated in Figures 1 and 2. Full question wording is listed below. Note that not all questions were asked in all survey years (see Figure 1).
- Habit-forming: Can using cannabis become habit forming for some people?
- Pregnant or breastfeeding+: Is it okay to use cannabis when pregnant or breastfeeding?
- Harms of vaping cannabis: Can cannabis vaping be harmful?
- Harms of smoking cannabis: Cannabis smoke can be harmful?
- Drug interactions: Can cannabis change the way other medications work in the body?
- Frequent use and mental health: Daily or almost daily cannabis use increases risk of mental health problems.
- Delayed onset of edibles: Can it take up to 4 hours to feel the full effects from eating or drinking cannabis?
- THC level and impairment +: Does consuming cannabis products with lower levels of THC lead to greater impairment?
- Testing of legal products: Are legal cannabis products tested for contaminants such as bacteria, moulds and pesticides?
- Duration of effects (inhaled vs. edible) +: Are the effects of inhaling cannabis longer-lasting than eating or drinking cannabis products?
+ 'No' was coded as 'correct' for these items ('Yes' and 'Don't know/not sure' were coded as 'incorrect'). For the remaining items, 'Yes' was coded as 'correct' ('No' and 'Don't know/not sure' were coded as 'incorrect').
- *
-
* Significantly different between 2018 (or first year question was asked) and 2023.
- ^
-
^ Significantly different between 2022 and 2023.
Figure 1 - Text Description
| Cannabis-associated harm | 2018 (%) |
2019 (%) |
2020 (%) |
2021 (%) |
2022 (%) |
2023 (%) |
|---|---|---|---|---|---|---|
| Habit-formingFigure 1 footnote * | 82 | 90 | 90 | 89 | 89 | 90 |
| Pregnant or breastfeedingFigure 1 footnote * | n/a | 98 | 88 | 87 | 86 | 87 |
| Teenagers at greater riskFigure 1 footnote * | n/a | 93 | 84 | 82 | 83 | 84 |
| Harms of vaping cannabis | n/a | n/a | n/a | n/a | n/a | 84 |
| Harms of smoking cannabisFigure 1 footnote *,Figure 1 footnote ^ | n/a | 87 | 75 | 76 | 78 | 81 |
| Drug interactions | n/a | n/a | n/a | n/a | n/a | 71 |
| Frequent use and mental healthFigure 1 footnote *,Figure 1 footnote ^ | n/a | 89 | 66 | 65 | 66 | 68 |
| Delayed onset of edibles | n/a | n/a | 52 | 50 | 52 | 51 |
| THC level and impairmentFigure 1 footnote *,Figure 1 footnote ^ | n/a | n/a | 45 | 41 | 42 | 40 |
| Testing of legal products | n/a | n/a | n/a | n/a | n/a | 38 |
| Duration of effects (inhaled vs. edible)Figure 1 footnote *,Figure 1 footnote ^ | n/a | n/a | 40 | 36 | 37 | 35 |
Figure 2: Knowledge or beliefs regarding cannabis-associated harmsFigure 2, Footnote 1, among those who had and had not consumed cannabis in the past 12 months, 2023
- Figure 2 footnote 1
-
Question wording for Figures 1 and 2
The question wording have been abbreviated in Figures 1 and 2. Full question wording is listed below. Note that not all questions were asked in all survey years (see Figure 1).
- Habit-forming: Can using cannabis become habit forming for some people?
- Pregnant or breastfeeding+: Is it okay to use cannabis when pregnant or breastfeeding?
- Harms of vaping cannabis: Can cannabis vaping be harmful?
- Harms of smoking cannabis: Cannabis smoke can be harmful?
- Drug interactions: Can cannabis change the way other medications work in the body?
- Frequent use and mental health: Daily or almost daily cannabis use increases risk of mental health problems.
- Delayed onset of edibles: Can it take up to 4 hours to feel the full effects from eating or drinking cannabis?
- THC level and impairment +: Does consuming cannabis products with lower levels of THC lead to greater impairment?
- Testing of legal products: Are legal cannabis products tested for contaminants such as bacteria, moulds and pesticides?
- Duration of effects (inhaled vs. edible) +: Are the effects of inhaling cannabis longer-lasting than eating or drinking cannabis products?
+ 'No' was coded as 'correct' for these items ('Yes' and 'Don't know/not sure' were coded as 'incorrect'). For the remaining items, 'Yes' was coded as 'correct' ('No' and 'Don't know/not sure' were coded as 'incorrect').
- *
-
* Significant differences between those who used cannabis in the past 12 months and those who had not used cannabis.
Figure 2 - Text Description
| Question theme | Overall (%) | People who did not use cannabis (past 12 months) (%) | People who used cannabis (past 12 months) (%) |
|---|---|---|---|
| Habit-formingFigure 2 footnote * | 90 | 89 | 92 |
| Pregnant or breastfeedingFigure 2 footnote * | 87 | 88 | 83 |
| Teenagers at greater risk | 84 | 84 | 85 |
| Harms of vaping cannabis | 84 | 84 | 84 |
| Harms of smoking cannabis | 81 | 81 | 80 |
| Drug interactions | 71 | 71 | 72 |
| Frequent use and mental health Figure 2 footnote * | 68 | 70 | 61 |
| Delayed onset of ediblesFigure 2 footnote * | 51 | 42 | 76 |
| THC level and impairmentFigure 2 footnote * | 40 | 30 | 68 |
| Testing of legal productsFigure 2 footnote * | 38 | 32 | 55 |
| Duration of effects (inhaled vs. edible)Figure 2 footnote * | 35 | 24 | 67 |
Access to trustworthy information
Starting in 2019, Canadians were asked if they felt they had access to enough trustworthy information about the health risks of cannabis use to make informed decisions. Sixty-nine percent (69%) reported somewhat or strongly agreeing that they had enough trustworthy information, a decrease compared to both 2019 and 2022 (71% and 72%, respectively). This was more common among those who used cannabis in the past 12 months (84%) than among those who had not used cannabis (63%).
Exposure to health warning messages
Starting in 2019, Canadians were asked if they had seen the health warning messages on cannabis products or packages or on Health Canada's website. In 2023, 32% reported they had seen the warnings (a decrease from 2019 but an increase from 2022), and a further 27% reported they were not sure. Among those who used cannabis in the past 12 months, 66% reported having seen the warnings, an increase over time from 58% in 2019.
Of those who had seen the warnings, over half (55%) reported that this had increased their knowledge of the harms related to cannabis use at least somewhat, unchanged from all previous cycles.Exposure to education campaigns, public health or safety messages
Starting in 2019, Canadians were asked if they had seen or heard education campaigns, public health or safety messages about cannabis in various locations in the past 12 months, and could select more than one location if they had seen or heard these messages in multiple locations. The most common locations selected in 2023 were TV or radio (27%), social media (14%), posters or billboards (13%), health care settings (13%) and inside or outside a legal cannabis store (7%). With the exception of TV or radio, those who used cannabis in the past 12 months were more likely to report having seen the messages in these locations than those who had not used cannabis. The number of Canadians who reported that they did not recall seeing any education campaigns or public health messages increased over time (from 24% in 2019 to 50% in 2023).
Starting in 2020, those who saw or heard education campaigns or public health messages were asked if the information was credible or believable. Of those who saw or heard these messages, 68% reported that the information was credible or believable, a decrease since 2020 (73%).
Exposure to cannabis advertisements or promotions
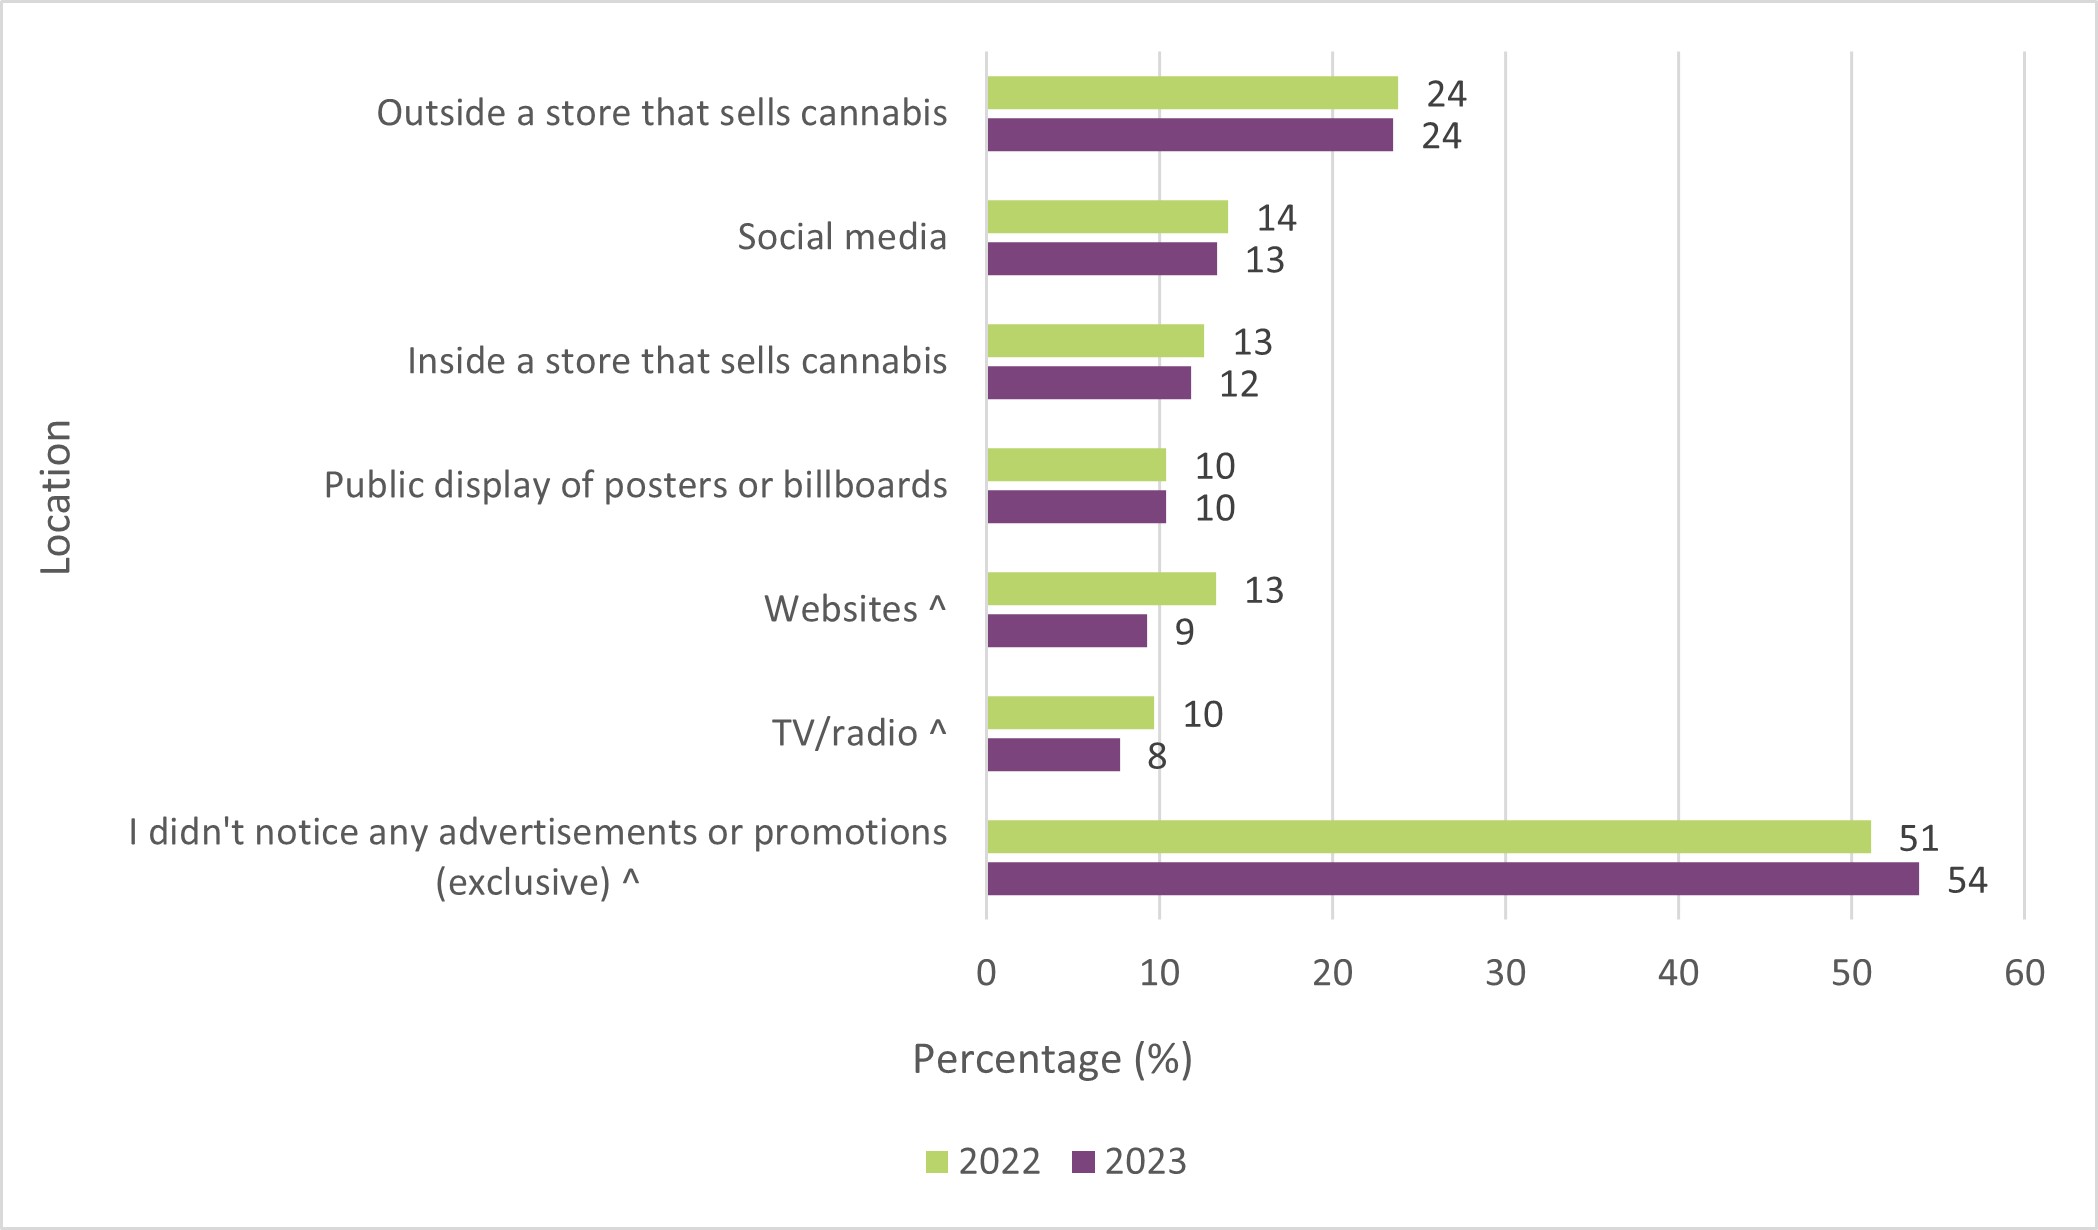
Starting in 2022, Canadians were asked if they had noticed or seen cannabis being advertised or promoted in various locations over the past 12 months. People could select more than one location if they had noticed these advertisements or promotions in multiple locations. As shown in Figure 3, over half had not noticed any cannabis advertisements (54%), an increase since 2022 (51%). Where seen, most were outside of stores that sell cannabis (24%).
Figure 3: LocationFigure 3, Footnote 1 of exposure to cannabis advertisements or promotions, among all Canadians, 2022 to 2023
- Figure 3 footnote 1
-
Multiple response options could be selected.
- Figure 3 footnote ^
-
^ Significant difference between 2022 and 2023.
Figure 3 - Text Description
| Location | 2022 (%) | 2023 (%) |
|---|---|---|
| I didn't notice any advertisement or promotions (exclusive) Footnote ^ | 51 | 54 |
| TV or radio Footnote ^ | 10 | 8 |
| Websites Footnote ^ | 13 | 9 |
| Public display of posters or billboards | 10 | 10 |
| Inside a store that sells cannabis | 13 | 12 |
| Social media | 14 | 13 |
| Outside a store that sells cannabis | 24 | 24 |
Social acceptability
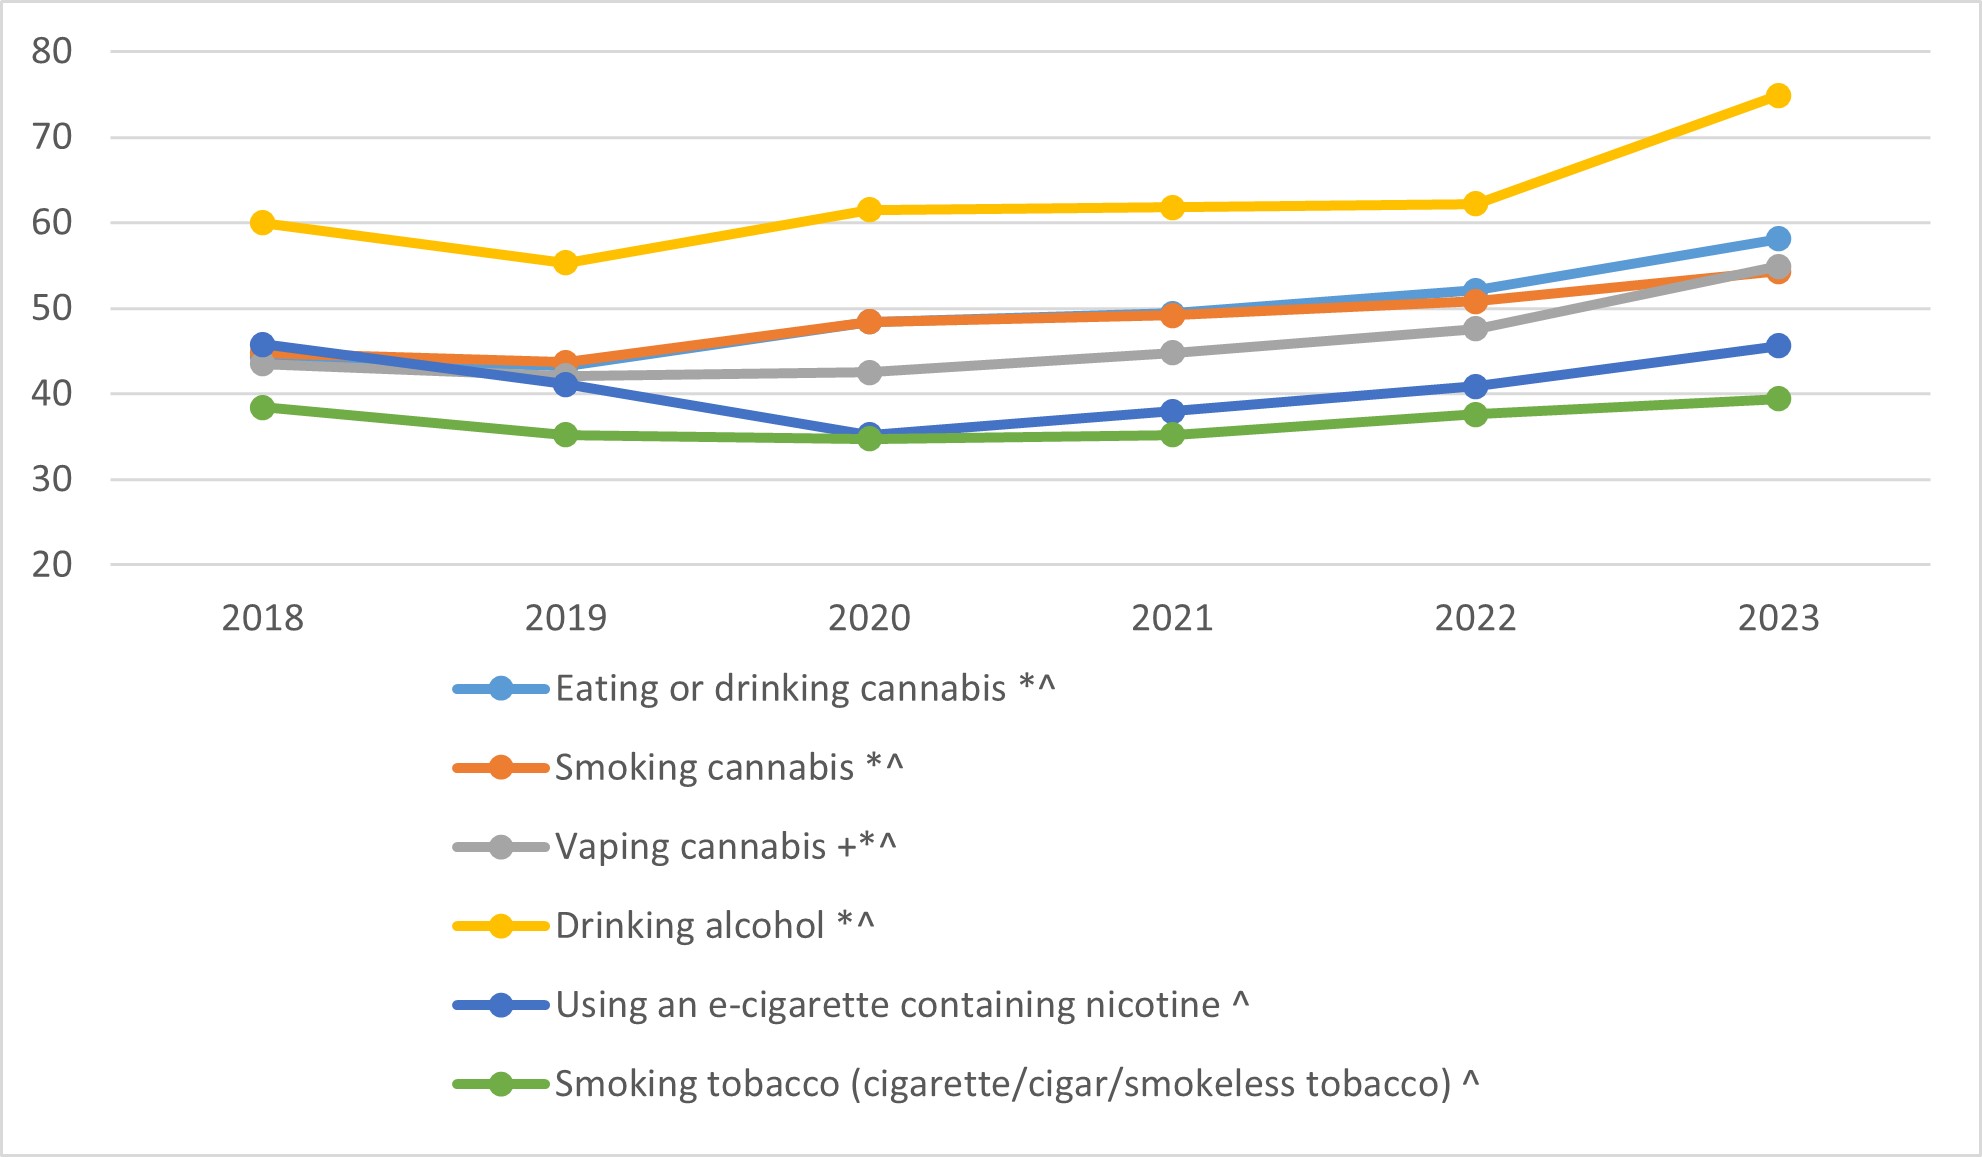
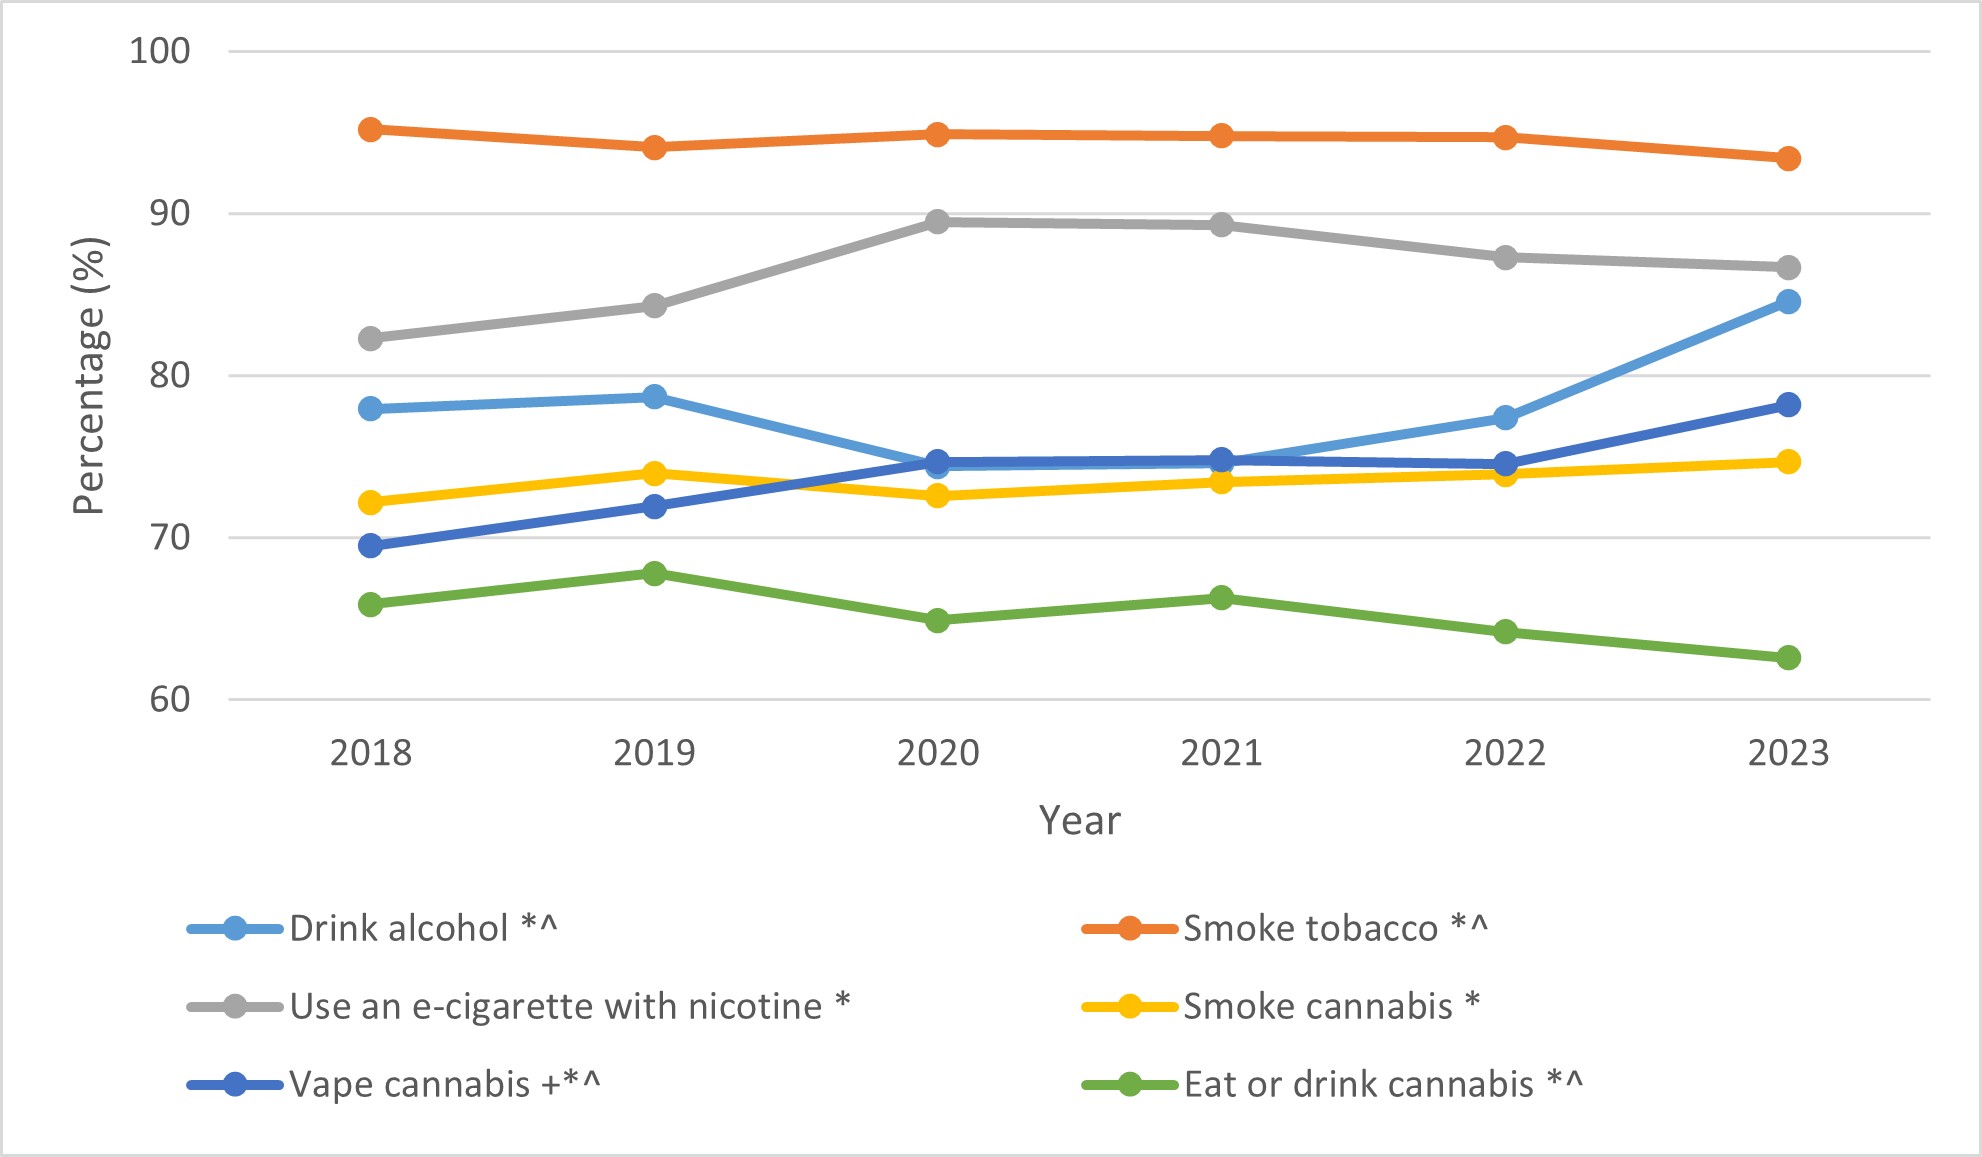
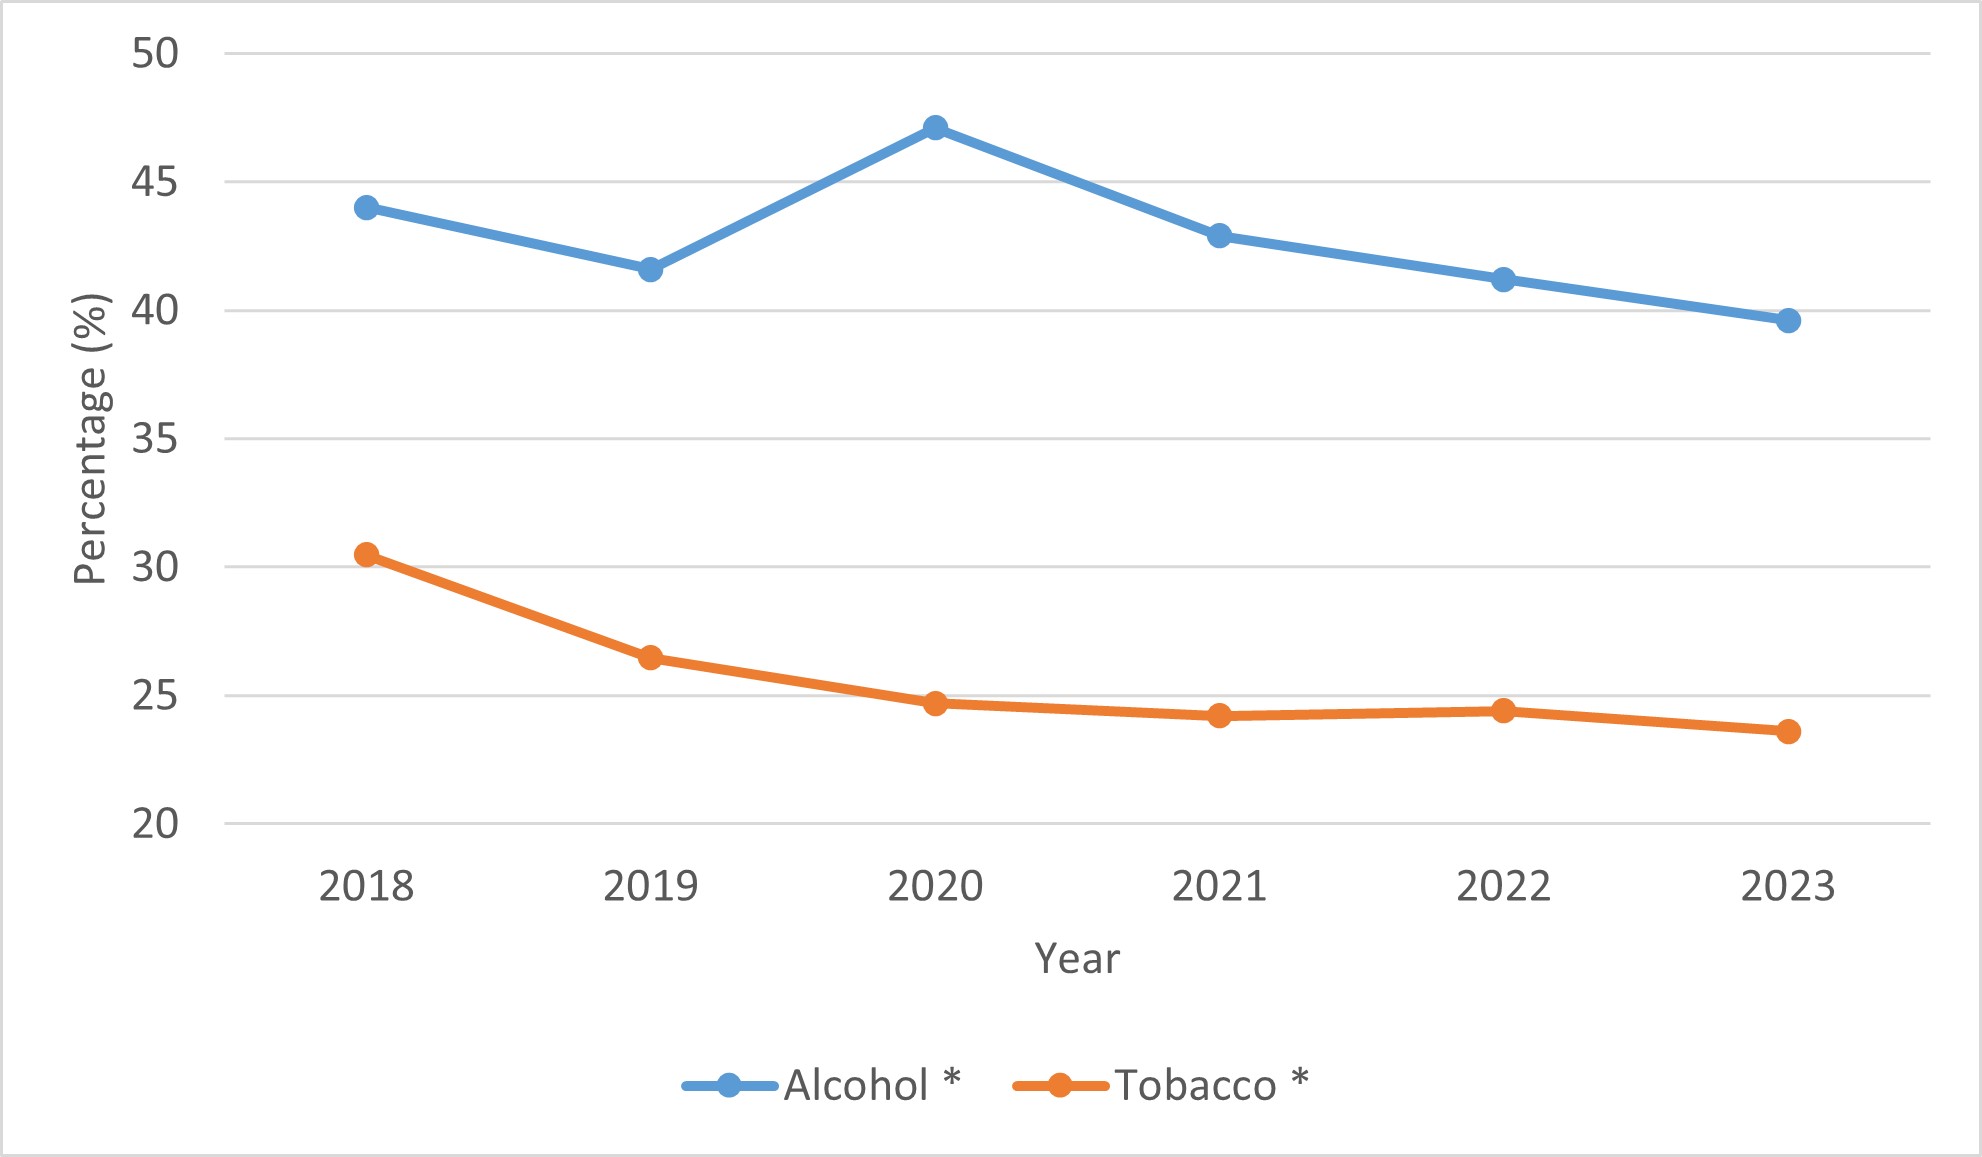
Starting in 2018, Canadians were asked about the social acceptability of regularly using various substances including cannabis. Of the proposed substances (alcohol, tobacco, e-cigarettes and cannabis), the most socially acceptable substance to use was alcohol, followed by cannabis and then e-cigarettes and tobacco (Figure 4). Social acceptability of regularly drinking alcohol (75%), eating or drinking cannabis (58%), vaping cannabisFootnote 1 (55%) and smoking cannabis (54%) has increased compared to 2018 (60%; 44%, 44%, and 45%, respectively). Social acceptability of using e-cigarettes with nicotine (46%) and smoking tobacco (39%) is unchanged compared to 2018 (46% and 38%, respectively). Perceived social acceptability of all substances was higher in 2023 compared to 2022. Note that in the 2023 cycle, the phrase 'for non-medical purposes' was removed from the questions on smoking, vaping and eating cannabis, which could have led to changes in social acceptability ratings, but these were also increasing prior to this change.
Figure 4: Social acceptabilityFigure 4 footnote 1 of using various products, among all Canadians, 2018 to 2023
- Figure 4 footnote 1
-
Social acceptability is defined as somewhat or completely socially acceptable.
- Figure 4 footnote +
-
+ In 2023, the data point for vaping combines two questions on vaping dried cannabis and liquid or solid cannabis extracts.
- Figure 4 footnote *
-
* Significant difference between 2018 and 2023.
- Figure 4 footnote ^
-
^ Significant difference between 2022 and 2023.
Figure 4 - Text Description
| Somewhat/completely socially acceptable | 2018 (%) |
2019 (%) |
2020 (%) |
2021 (%) |
2022 (%) |
2023 (%) |
|---|---|---|---|---|---|---|
| Eating or drinking cannabisFigure 4 footnote *,Figure 4 footnote ^ | 44 | 43 | 48 | 49 | 52 | 58 |
| Smoking cannabisFigure 4 footnote *,Figure 4 footnote ^ | 45 | 44 | 48 | 49 | 51 | 54 |
| Vaping cannabisFigure 4 footnote +,Figure 4 footnote *,Figure 4 footnote ^ | 44 | 42 | 43 | 45 | 48 | 55 |
| Drinking alcoholFigure 4 footnote *,Figure 4 footnote ^ | 60 | 55 | 61 | 62 | 62 | 75 |
| Using an e-cigarette containing nicotine Figure 4 footnote ^ | 46 | 41 | 35 | 38 | 41 | 46 |
| Smoking tobacco (cigarette/cigar/ smokeless tobacco) Figure 4 footnote ^ | 38 | 35 | 35 | 35 | 38 | 39 |
Social acceptability of regularly using alcohol, tobacco, e-cigarettes and cannabis was higher among people who indicated using cannabis in the past 12 months compared to those who did not report cannabis use.
Perceived risks of using various substances
Starting in 2018, Canadians were asked how much they thought a person risked harming themselves by using various substances regularly. Perceived risk was determined using a 4-point Likert scale, which had the following categories: no risk, slight risk, moderate risk, great risk and "don't know."
The majority of people perceived either a moderate or great risk for smoking tobacco (93%), using an e-cigarette with nicotine (87%), drinking alcohol (85%), vaping liquid or solid cannabis extracts (75%), smoking cannabis (75%), vaping dried cannabis (72%) and eating or drinking cannabis (63%). Compared to 2018, perception of moderate or great risk increased for regularly drinking alcohol (from 78%), using an e-cigarette (from 82%), smoking cannabis (from 72%), and vaping cannabisFootnote 1 (from 70%). Perceived moderate or great risk of smoking tobacco and eating or drinking cannabis decreased compared to 2018 (95% and 66%, respectively) (Figure 5).
Perceived risk of drinking alcohol and vaping cannabis was higher in 2023 compared to 2022, while perceived risk of smoking tobacco and eating or drinking cannabis was lower. Note that in the 2023 cycle, the phrase 'for non-medical purposes' was removed from the questions on smoking, vaping and eating cannabis, which may have led to changes in risk perception ratings.
Among those who used cannabis in the past 12 months, a smaller percentage perceived moderate or great risk from regularly using the aforementioned substances, compared to those who had not used cannabis, with the exception of smoking tobacco and drinking alcohol regularly. The difference in the percentage perceiving moderate or great risk was smaller for regularly using e-cigarettes with nicotine compared to regularly vaping, smoking, or eating or drinking cannabis.
Figure 5: Perceived risk of using various substances regularly, 2018 to 2023
- Figure 5 footnote +
-
+ In 2023, vaping cannabis combines two questions on vaping dried cannabis (72%) and liquid or solid cannabis extracts (75%).
- Figure 5 footnote *
-
* Significant difference between 2018 and 2023.
- Figure 5 footnote ^
-
^ Significant difference between 2022 and 2023.
Figure 5 - Text Description
| Moderate/great risk from regular use | 2018 (%) |
2019 (%) |
2020 (%) |
2021 (%) |
2022 (%) |
2023 (%) |
|---|---|---|---|---|---|---|
| Drink alcoholFigure 5 footnote *,Figure 5 footnote ^ | 78 | 79 | 74 | 75 | 77 | 85 |
| Smoke tobaccoFigure 5 footnote *,Figure 5 footnote ^ | 95 | 94 | 95 | 95 | 95 | 93 |
| Use an e-cigarette with nicotineFigure 5 footnote * | 82 | 84 | 90 | 89 | 87 | 87 |
| Smoke cannabisFigure 5 footnote * | 72 | 74 | 73 | 73 | 74 | 75 |
| Vape cannabisFigure 5 footnote +,Figure 5 footnote *,Figure 5 footnote ^ | 70 | 72 | 75 | 75 | 75 | 78 |
| Eat or drink cannabisFigure 5 footnote *,Figure 5 footnote ^ | 66 | 68 | 65 | 66 | 64 | 63 |
Identifying legal store and websites
New in 2023, Canadians were asked how they knew if a store or website selling cannabis was legal. Responses were open-ended text that was coded in themes. For both storefronts and websites the 3 most common themes were that it is provincially, territorially or government run (14% store, 7% website), a posted certification (8% store, 3% website), and based on the product, packaging and labelling of what is being sold (6% store, 1% website). For storefronts, 72% reported they did not consume cannabis or did not know how to identify a legal store. For websites this was even higher with 89% saying they do not order cannabis online or did not know how to identify a legal website.
Knowledge of cannabis packaging requirements
New in 2023, Canadians were asked to indicate what is required to be shown or present on legal cannabis packages. Not all of the options shown are required on legal packaging. This was done to gauge if people could pick out the correct options. People could also select a 'don't know' option. Overall, 54% reported they did not know what is required to be shown or present on legal cannabis packages. This was more common among those who did not use cannabis compared to those who consumed cannabis (72% and 16%, respectively). For the options that should have been selected 38% correctly indicated THC and CBD content, 32% indicated health warning messages, 28% indicated the standardized cannabis symbol, 28% indicated child resistant packaging and 17% indicated an excise stamp. Those who used cannabis were more likely to select each of these packaging requirements (78%, 63%, 60%, 62% and 40%, respectively) than those who did not use cannabis (21%, 18%, 14%, 13% and 7%, respectively).
Cannabis use and products used
Canadians who reported using cannabis were asked detailed questions about their use of cannabis. Topics included:
- Age of initiation of cannabis use
- Types of cannabis products used and frequency of use
- Typical THC to CBD (cannabidiol) levels of products
- Typical use in terms of amount used per use day
- Where cannabis is stored inside the home
Cannabis use for non-medical purposes
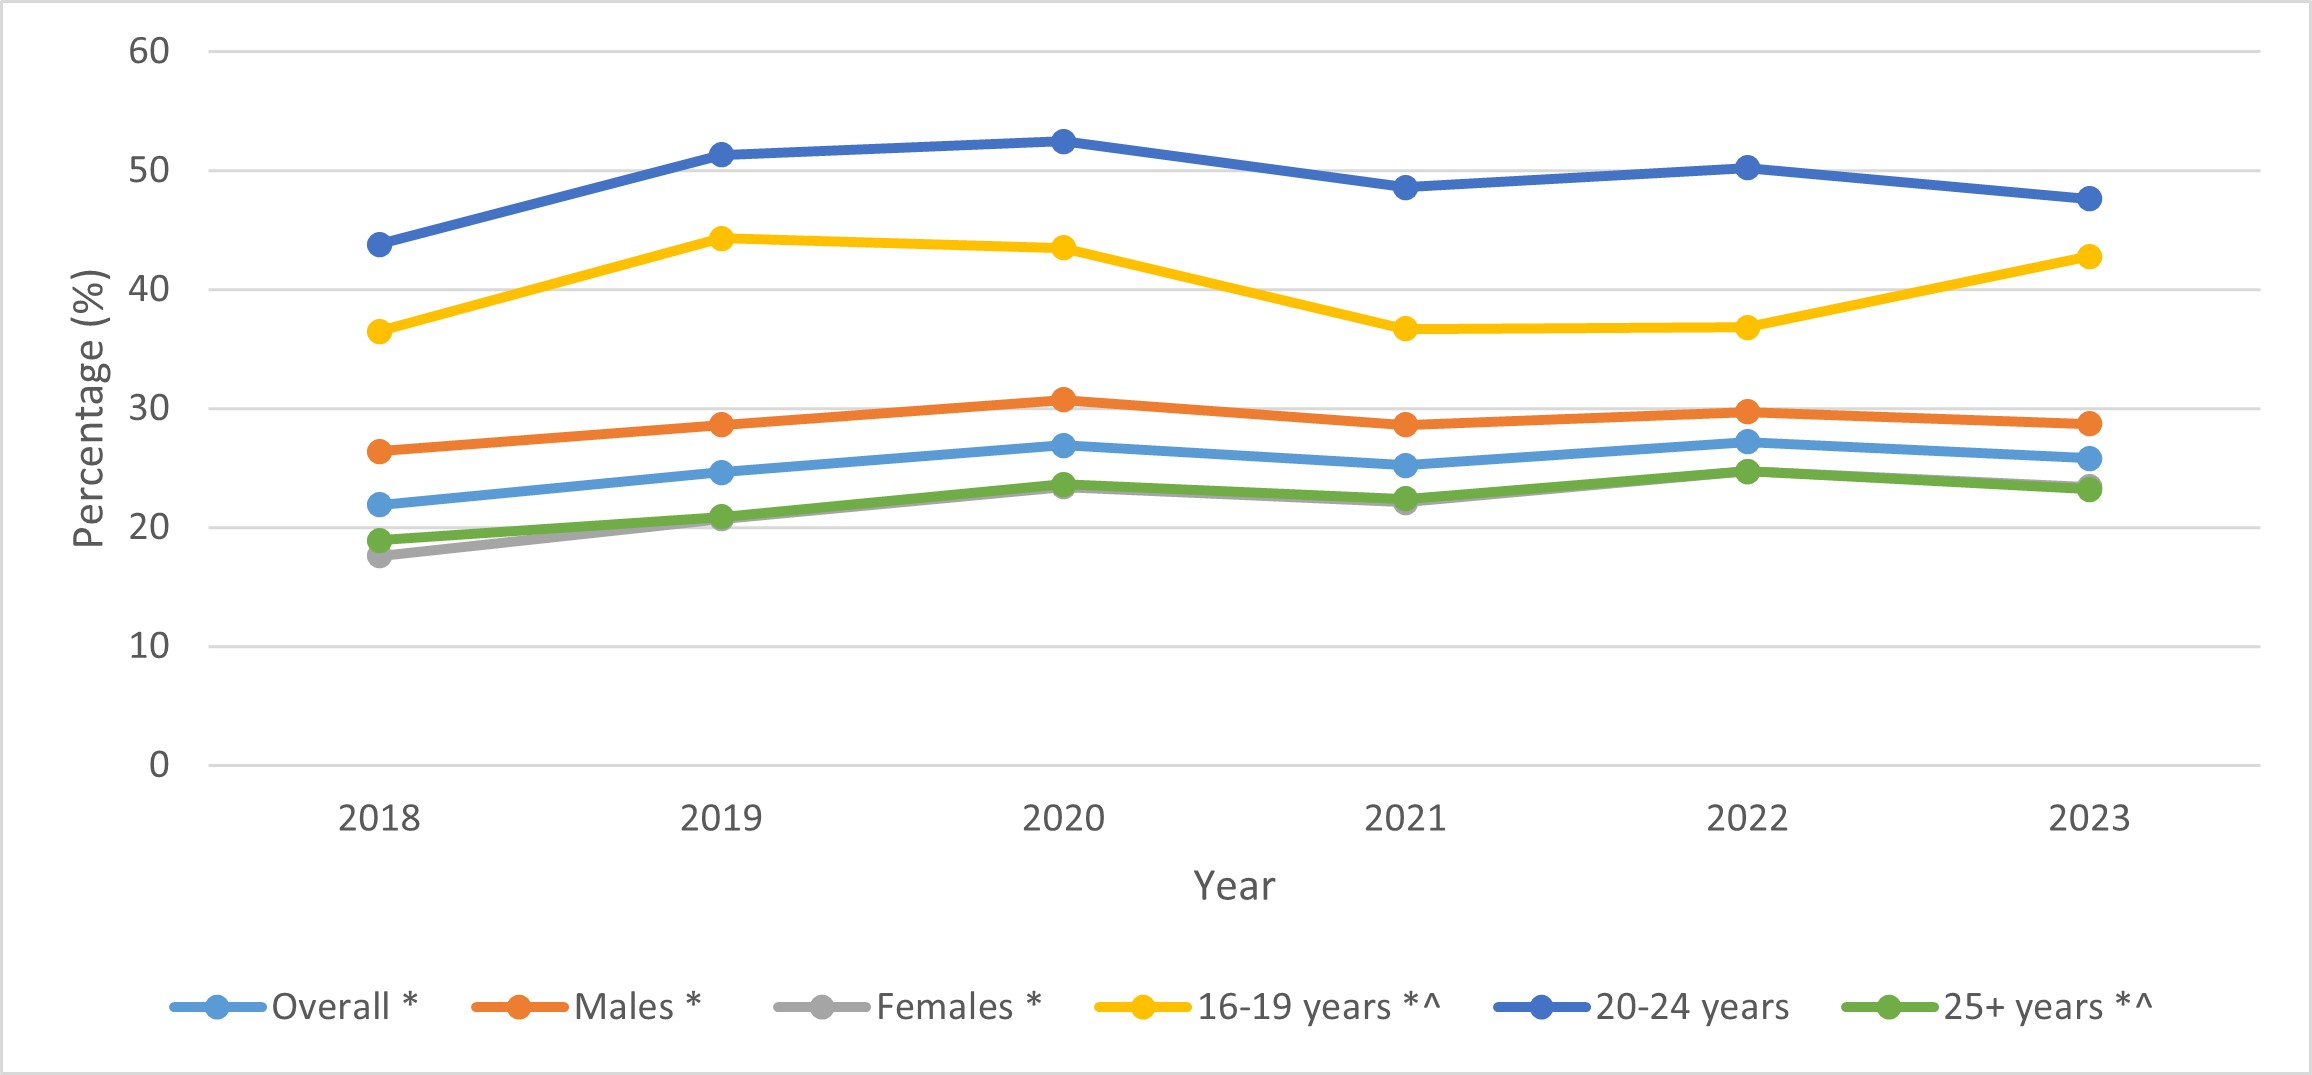
Starting in 2018, Canadians were asked about their cannabis use within the past 12 months. Twenty-six percent (26%) of people 16 years of age and older reported having used cannabis for non-medical purposes in the past 12 months, unchanged from the previous cycle (27%). Past 12-month cannabis use increased over time from 22% in 2018 (Figure 6). Note that due to the data collection methodology, the CCS may provide general population prevalence estimates for cannabis use that are higher than other Canadian surveys.
Past 12-month use for non-medical purposes in Canadians of various demographic groups
As in previous years, past 12-month cannabis use for non-medical purposes was highest among 20 to 24 year olds (48%), unchanged from 2018 and 2022 (Figure 6). This was followed by 16 to 19 year-olds (43%), up from both 2018 and 2022 (36% and 37%, respectively), and those 25 years and older (23%), up from 2018 but down from 2022 (19% and 25%, respectively).
Males (29%) reported a higher percentage of cannabis use for non-medical purposes in the past year than females (23%), both up from 2018 (26% and 19%, respectively).
Figure 6: Past 12-month cannabis use for non-medical purposes, by sex and age group, 2018 to 2023
- Figure 6 footnote *
-
* Significant difference between 2018 and 2023.
- Figure 6 footnote ^
-
^ Significant difference between 2022 and 2023.
Figure 6 - Text Description
| Demographic group | 2018 (%) |
2019 (%) |
2020 (%) |
2021 (%) |
2022 (%) |
2023 (%) |
|---|---|---|---|---|---|---|
| OverallFigure 6 footnote * | 22 | 25 | 27 | 25 | 27 | 26 |
| MalesFigure 6 footnote * | 26 | 29 | 31 | 29 | 30 | 29 |
| FemalesFigure 6 footnote * | 18 | 21 | 23 | 22 | 25 | 23 |
| 16 to 19 yearsFigure 6 footnote *,Figure 6 footnote ^ | 36 | 44 | 44 | 37 | 37 | 43 |
| 20 to 24 years | 44 | 51 | 52 | 49 | 50 | 48 |
| 25 years or olderFigure 6 footnote *,Figure 6 footnote ^ | 19 | 21 | 24 | 22 | 25 | 23 |
Similar to the patterns seen in 2018 and 2022, the proportion of people reporting cannabis use for non-medical purposes in the past 12 months was lower among people who identified as heterosexual or straight (23%) compared to those who identified as bisexual (56%), another sexuality (54%), or lesbian or gay (48%).
The proportion of people using cannabis in the past 12 months was 29% among people who were born in Canada, compared to people who were not born in Canada (17%). These same patterns were also seen in 2018 and 2022.
People who reported "going to school" as their main activity in the past week reported higher rates of past 12-month cannabis use (36%) compared to those who selected an activity other than "going to school" (25%). People who reported working at a job or business in the past week, or have a job or business from which they were on vacation, reported higher rates of past 12-month cannabis use, (30%) compared to those who did not work at a job or business (20%). This is consistent with the patterns seen in 2018 and 2022.
Those who reported having less than high school or a high school diploma as their highest level of education reported higher rates of past 12-month cannabis use (32%), compared to those with a post-graduate degree or diploma (21%) or other level of education (25%). This is similar to the patterns seen in 2018 and 2022.
Canadians were asked about their physical and mental health using a 5-point Likert scale, which had the following categories: excellent, very good, good, fair, and poor. Past 12-month cannabis use was highest among people who reported good, fair, and poor physical health (28%, 29%, and 28%, respectively), and lowest among those reporting excellent (23%) and very good (25%) physical health. For self-reported mental health, the percentage reporting past 12-month cannabis use increases as mental health ratings decrease: excellent (15%), very good (22%), good (29%), fair (42%), and poor (47%). This was similar to the pattern seen in previous cycles.
Age of initiation
People who reported ever using cannabis were asked about the age at which they first tried or started using cannabis. For comparability across survey cycles, average age was restricted to those who reported a starting age between 5 and 70 years old. The average age of starting cannabis use was 20.8, an increase from 18.9 years in 2018. Females were older than males when they first tried cannabis (21.0 and 20.5 years, respectively). Average age of initiation is highly dependent on the age range of the Canadians in a survey, as well as the distribution of Canadians within predetermined age groups. For the CCS, the age of initiation is higher among the largest age group of adults age 25 and older (21.3 years) compared to 16 to 19 year olds (15.7 years) and 20 to 24 year olds (17.5 years), resulting in a higher average age of initiation overall.
Frequency of cannabis use
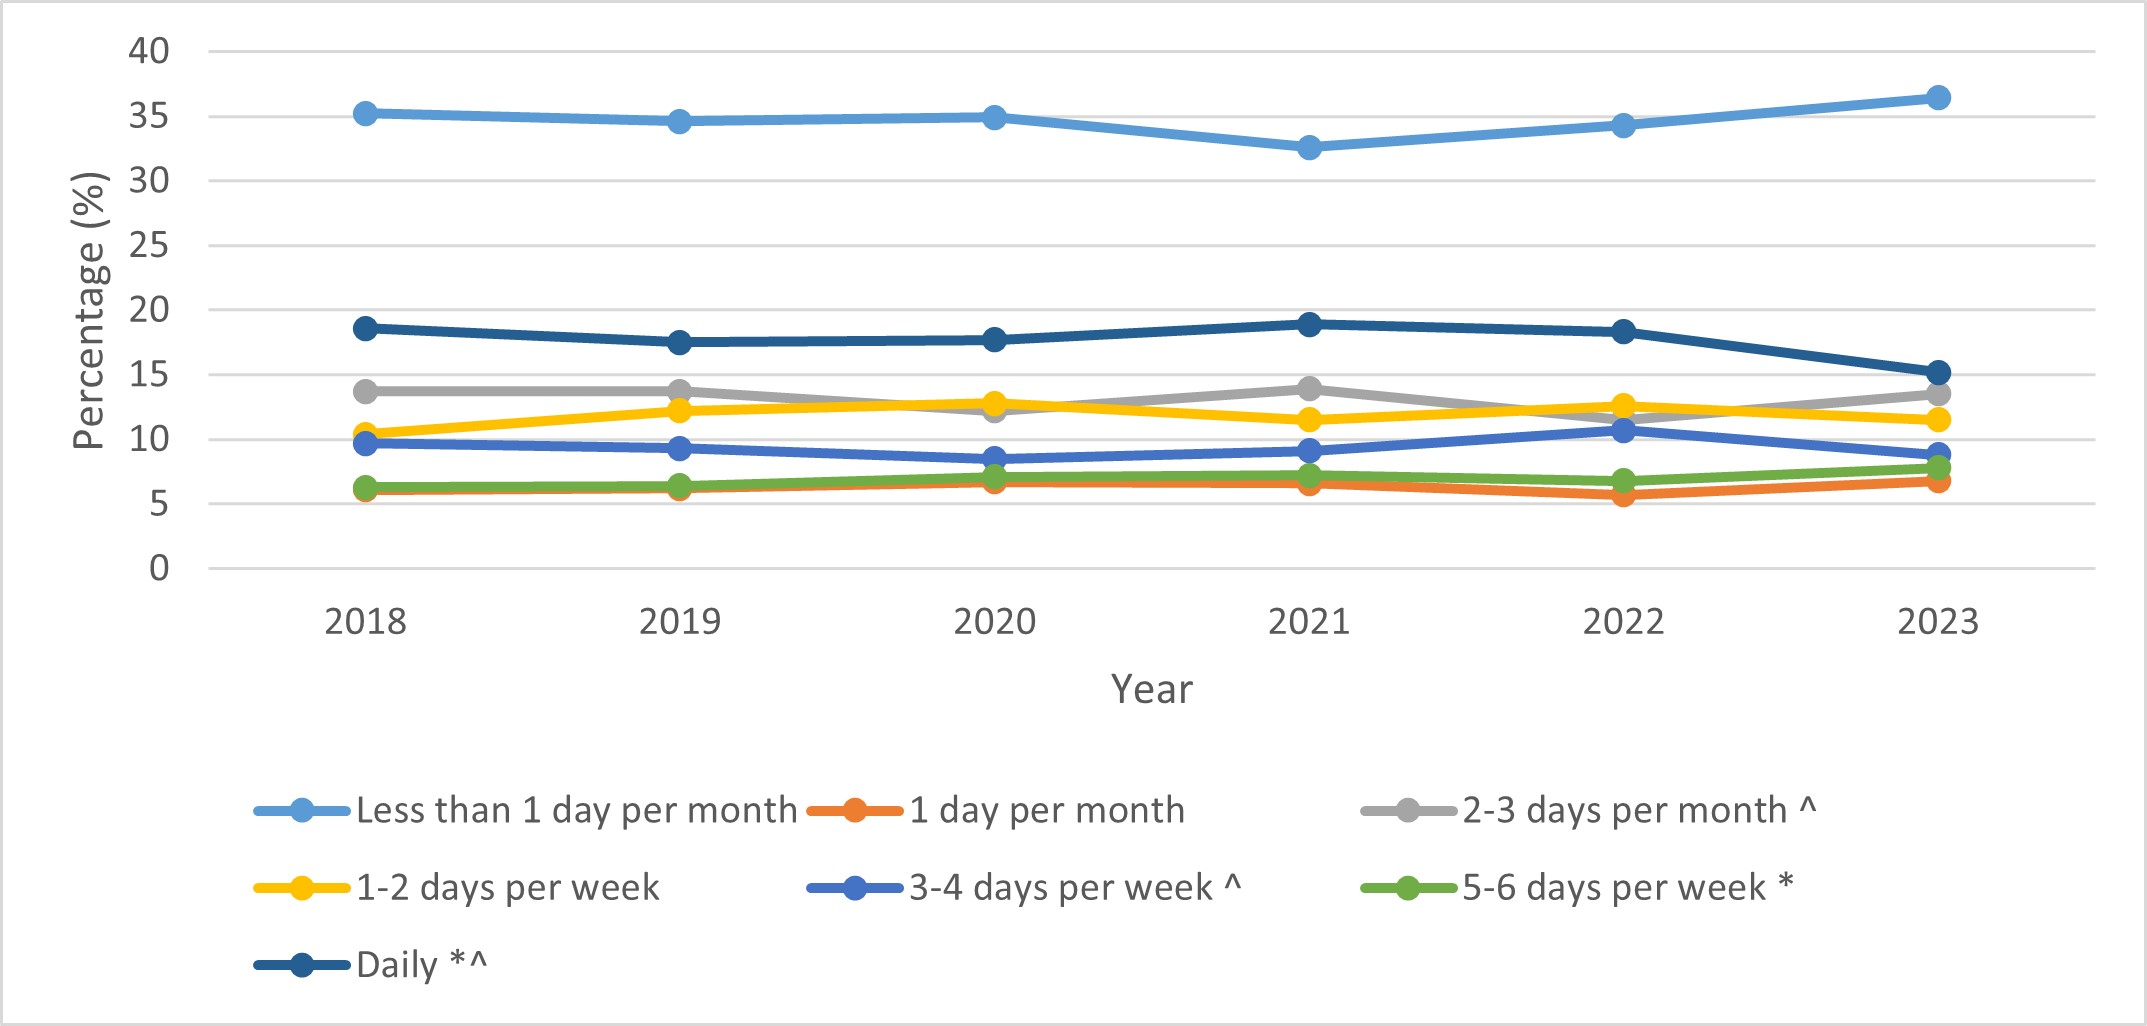
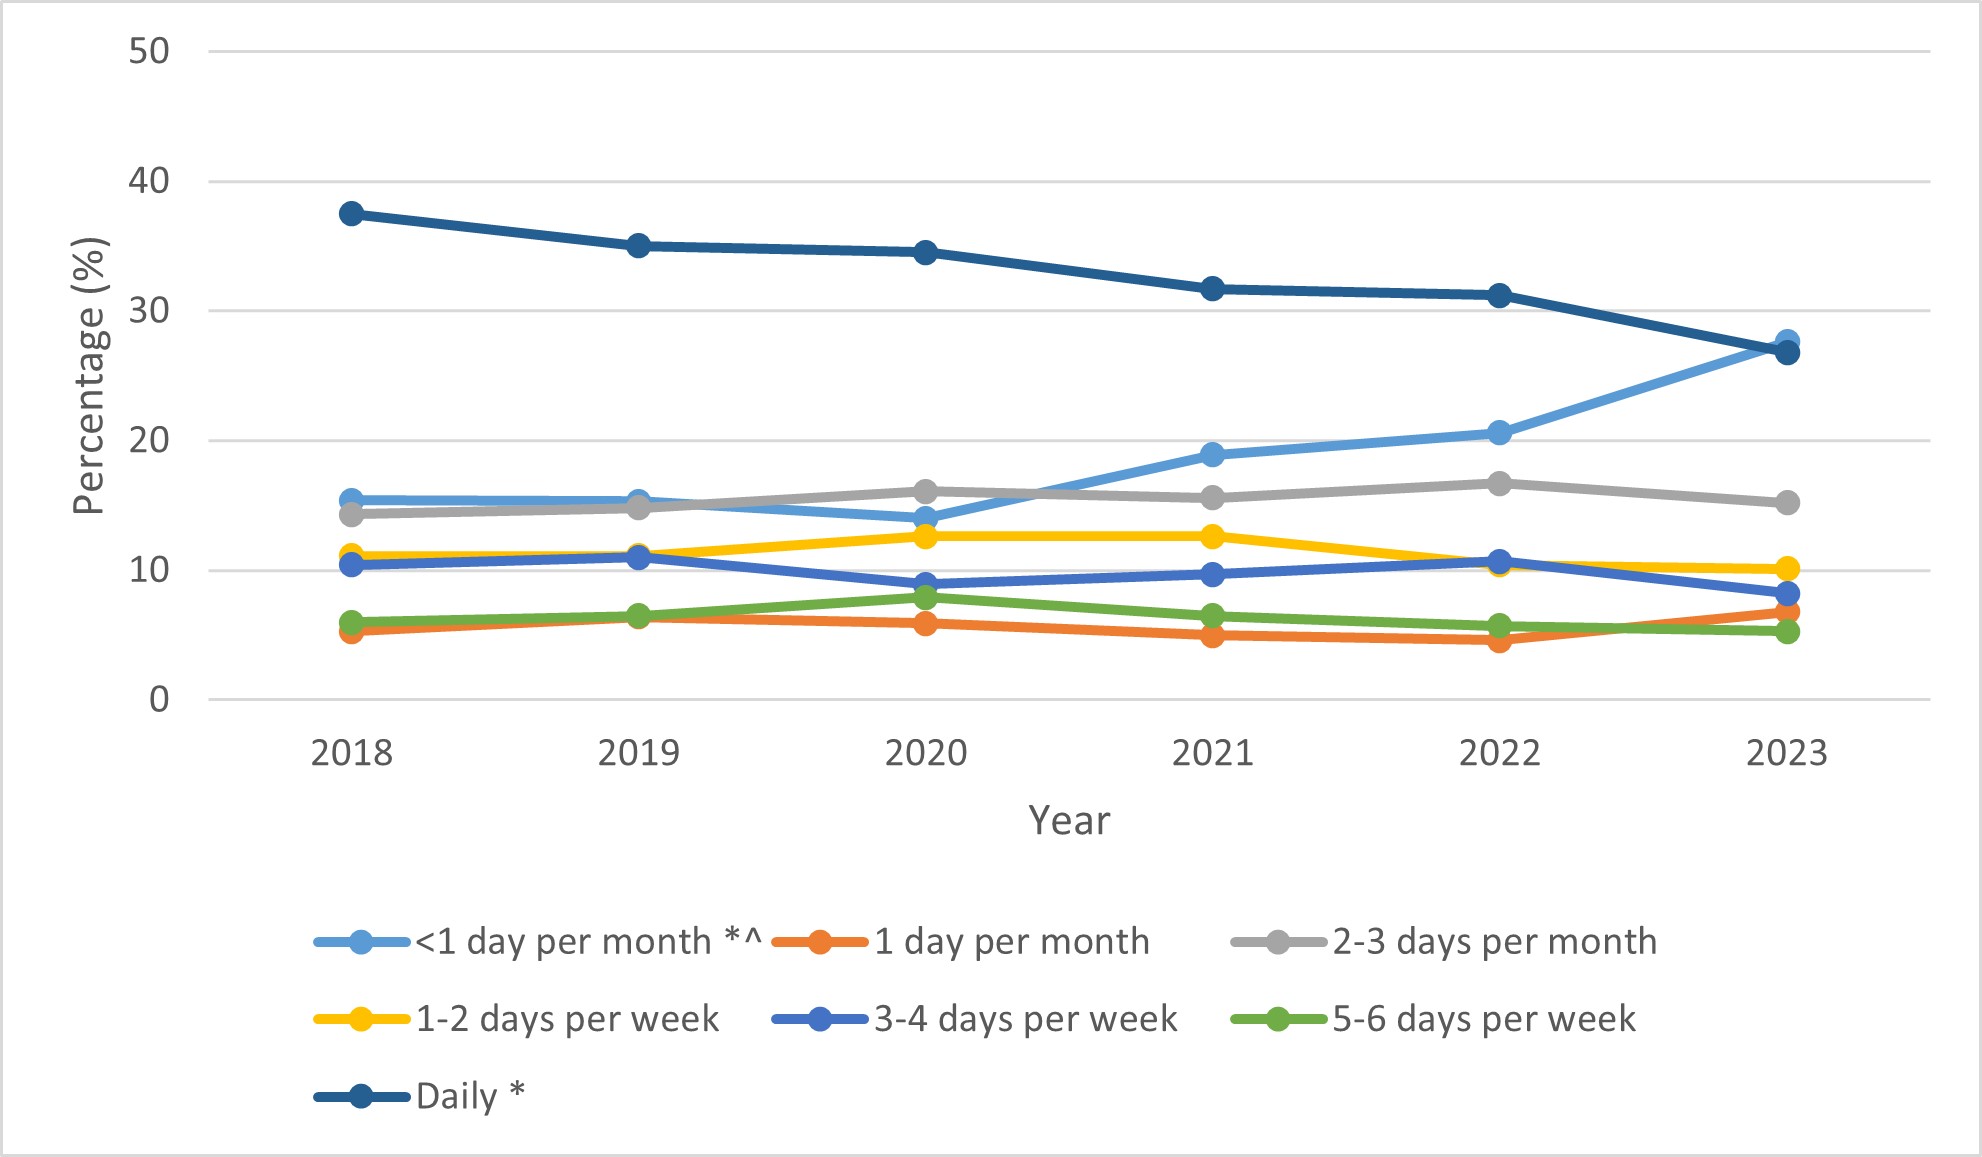
Canadians who reported using cannabis for non-medical purposes over the past 12 months were asked how frequently they used it. Over half (57%) reported using cannabis 3 days per month or less, and 15% reported daily cannabis use (Figure 7). Compared to the previous cycle in 2022, more people used cannabis 2 to 3 days per month, while fewer used 3 to 4 days per week or daily. Over the 6-year period, frequency of cannabis use was generally unchanged, with the exception that more people used cannabis 5 to 6 days per week and fewer used daily compared to 2018 (Figure 7).
Figure 7: Frequency of cannabis use for non-medical purposes among those who have used cannabis in the past 12 months, 2018 to 2023
- Figure 7 footnote *
-
* Significant difference between 2018 and 2023.
- Figure 7 footnote ^
-
^ Significant difference between 2022 and 2023.
Figure 7 - Text Description
| Frequency | 2018 (%) |
2019 (%) |
2020 (%) |
2021 (%) |
2022 (%) |
2023 (%) |
|---|---|---|---|---|---|---|
| Less than 1 day per month | 35 | 35 | 35 | 33 | 34 | 36 |
| 1 day per month | 6 | 6 | 7 | 7 | 6 | 7 |
| 2 to 3 days per monthFigure 7 footnote ^ | 14 | 14 | 12 | 14 | 12 | 14 |
| 1 to 2 days per week | 10 | 12 | 13 | 11 | 13 | 11 |
| 3 to 4 days per weekFigure 7 footnote ^ | 10 | 9 | 9 | 9 | 11 | 9 |
| 5 to 6 days per weekFigure 7 footnote * | 6 | 6 | 7 | 7 | 7 | 8 |
| DailyFigure 7 footnote *,Figure 7 footnote ^ | 19 | 18 | 18 | 19 | 18 | 15 |
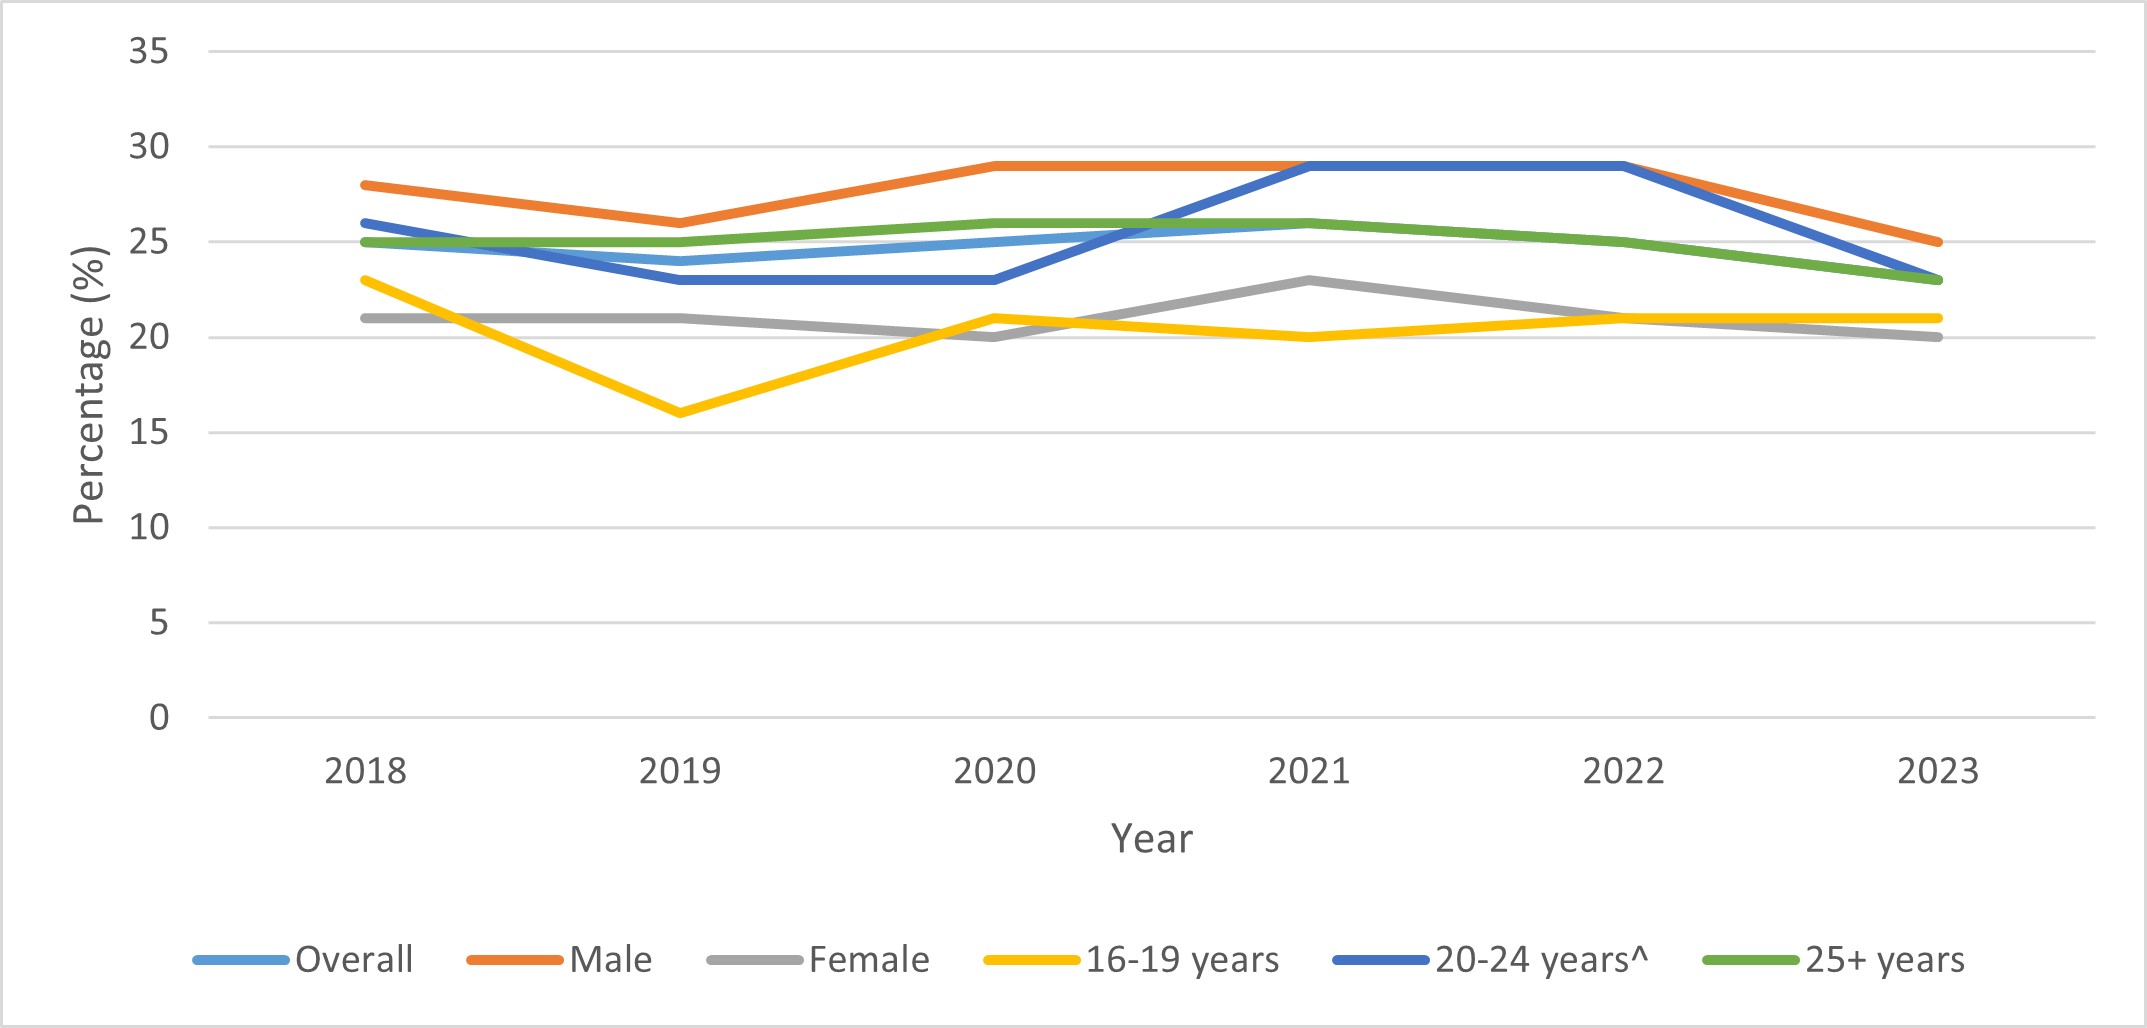
Overall, a greater percentage of males (25%) reported daily or almost daily (that is, 5 or more days per week) use compared to females (20%), who were more likely to report using less than 1 day per month (40%) compared to males (33%). There was no difference between age groups in the percentage who used less than 1 day per month or daily or almost daily. The percentage reporting daily or almost daily use by sex and age group is summarized in Figure 8.
Figure 8: Frequency of daily or almost daily (5 or more days per week) cannabis use among those who used cannabis in the past 12 months, by age group and sex, 2018 to 2023
- Figure 8 footnote ^
-
^ Significant difference between 2022 and 2023.
Figure 8 - Text Description
| Demographic group | 2018 (%) |
2019 (%) |
2020 (%) |
2021 (%) |
2022 (%) |
2023 (%) |
|---|---|---|---|---|---|---|
| Overall | 25 | 24 | 25 | 26 | 25 | 23 |
| Males | 28 | 26 | 29 | 29 | 29 | 25 |
| Females | 21 | 21 | 20 | 23 | 21 | 20 |
| 16 to 19 years | 23 | 16 | 21 | 20 | 21 | 21 |
| 20 to 24 yearsFigure 8 footnote ^ | 26 | 23 | 23 | 29 | 29 | 23 |
| 25 years or older | 25 | 25 | 26 | 26 | 25 | 23 |
Overall, 17% of Canadians age 16 years and older reported using cannabis in the past 30 days (up from 15% in 2018). Starting in 2020, people who used cannabis within the past 30 days were asked how many days they used cannabis in that time period. The average number of days was 14.4, unchanged from 2020.
Types of cannabis products used and frequency
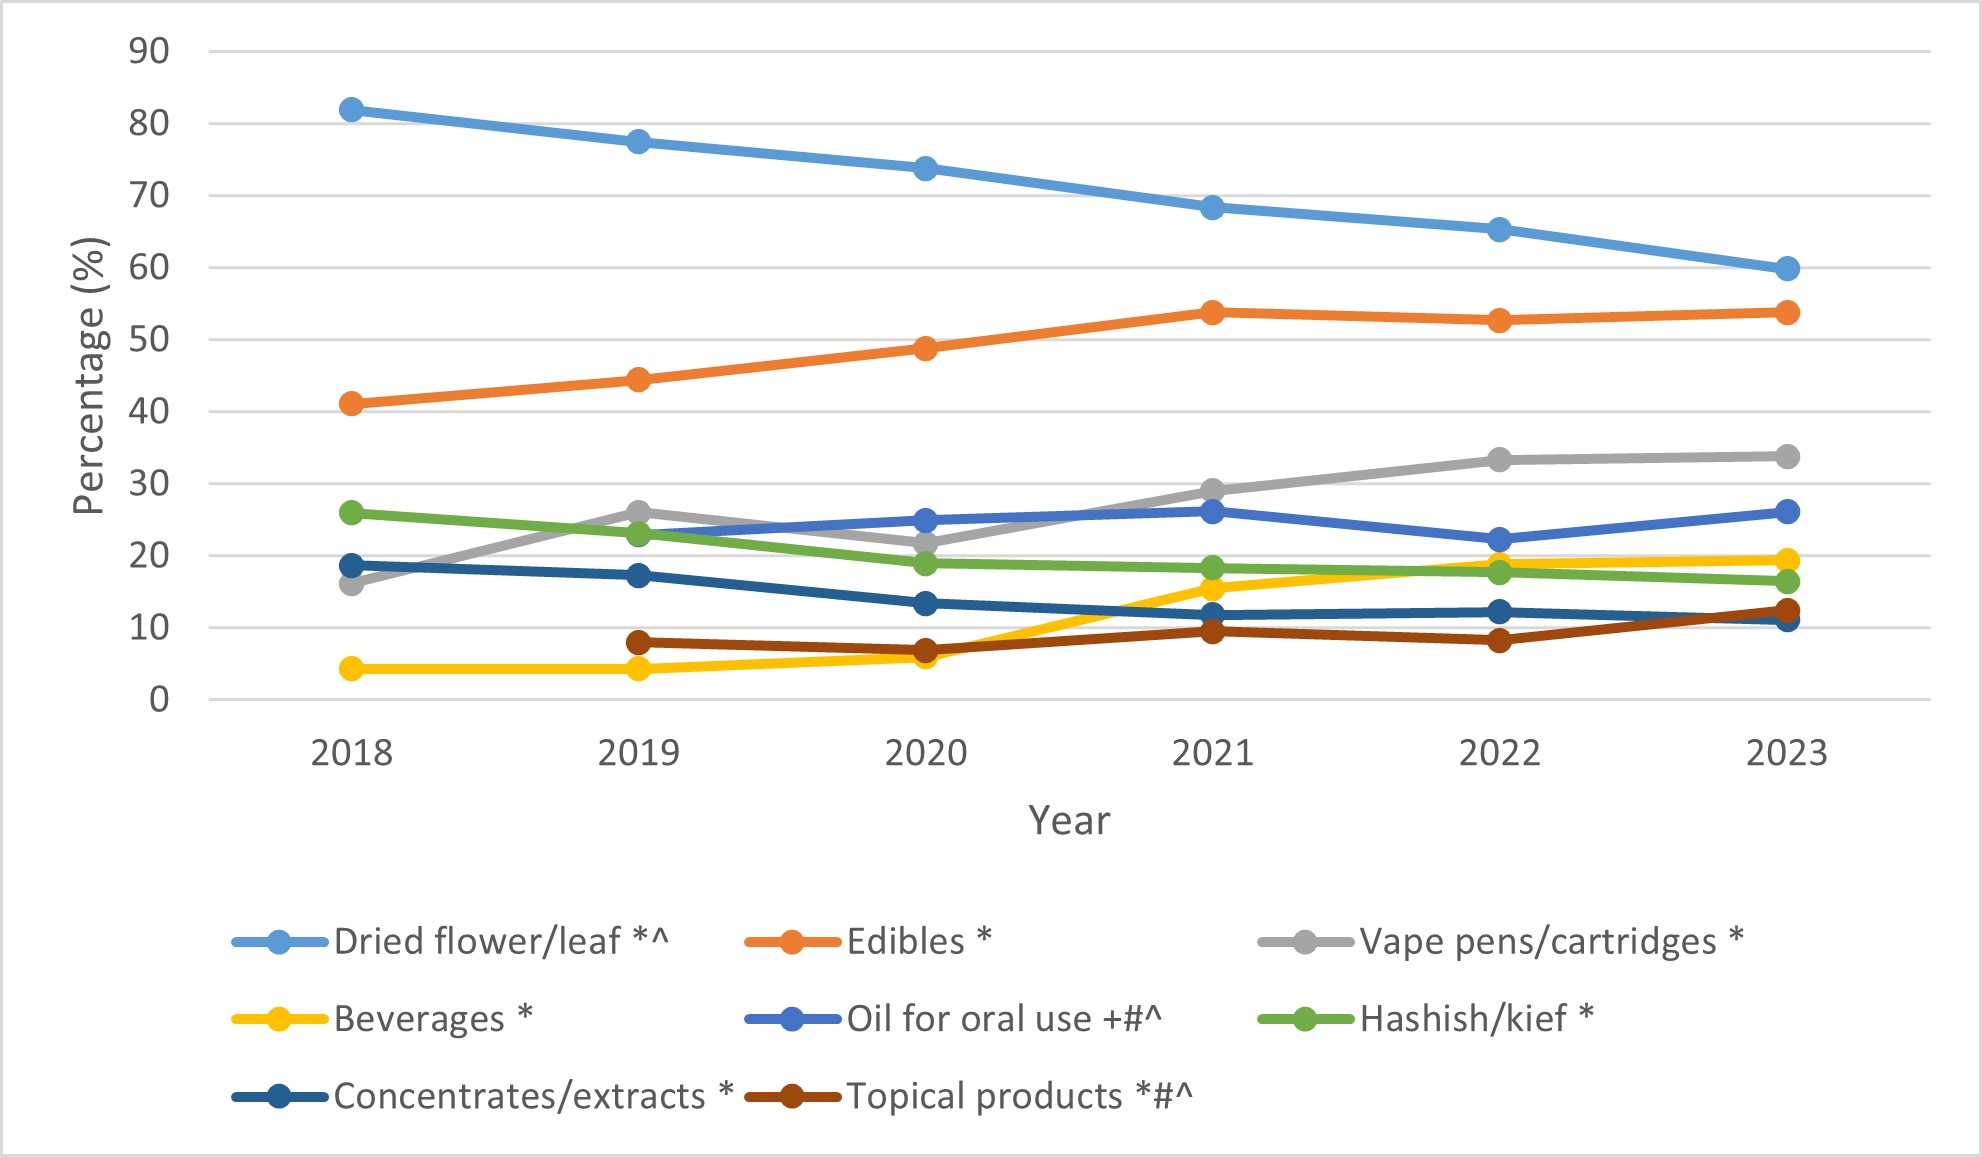
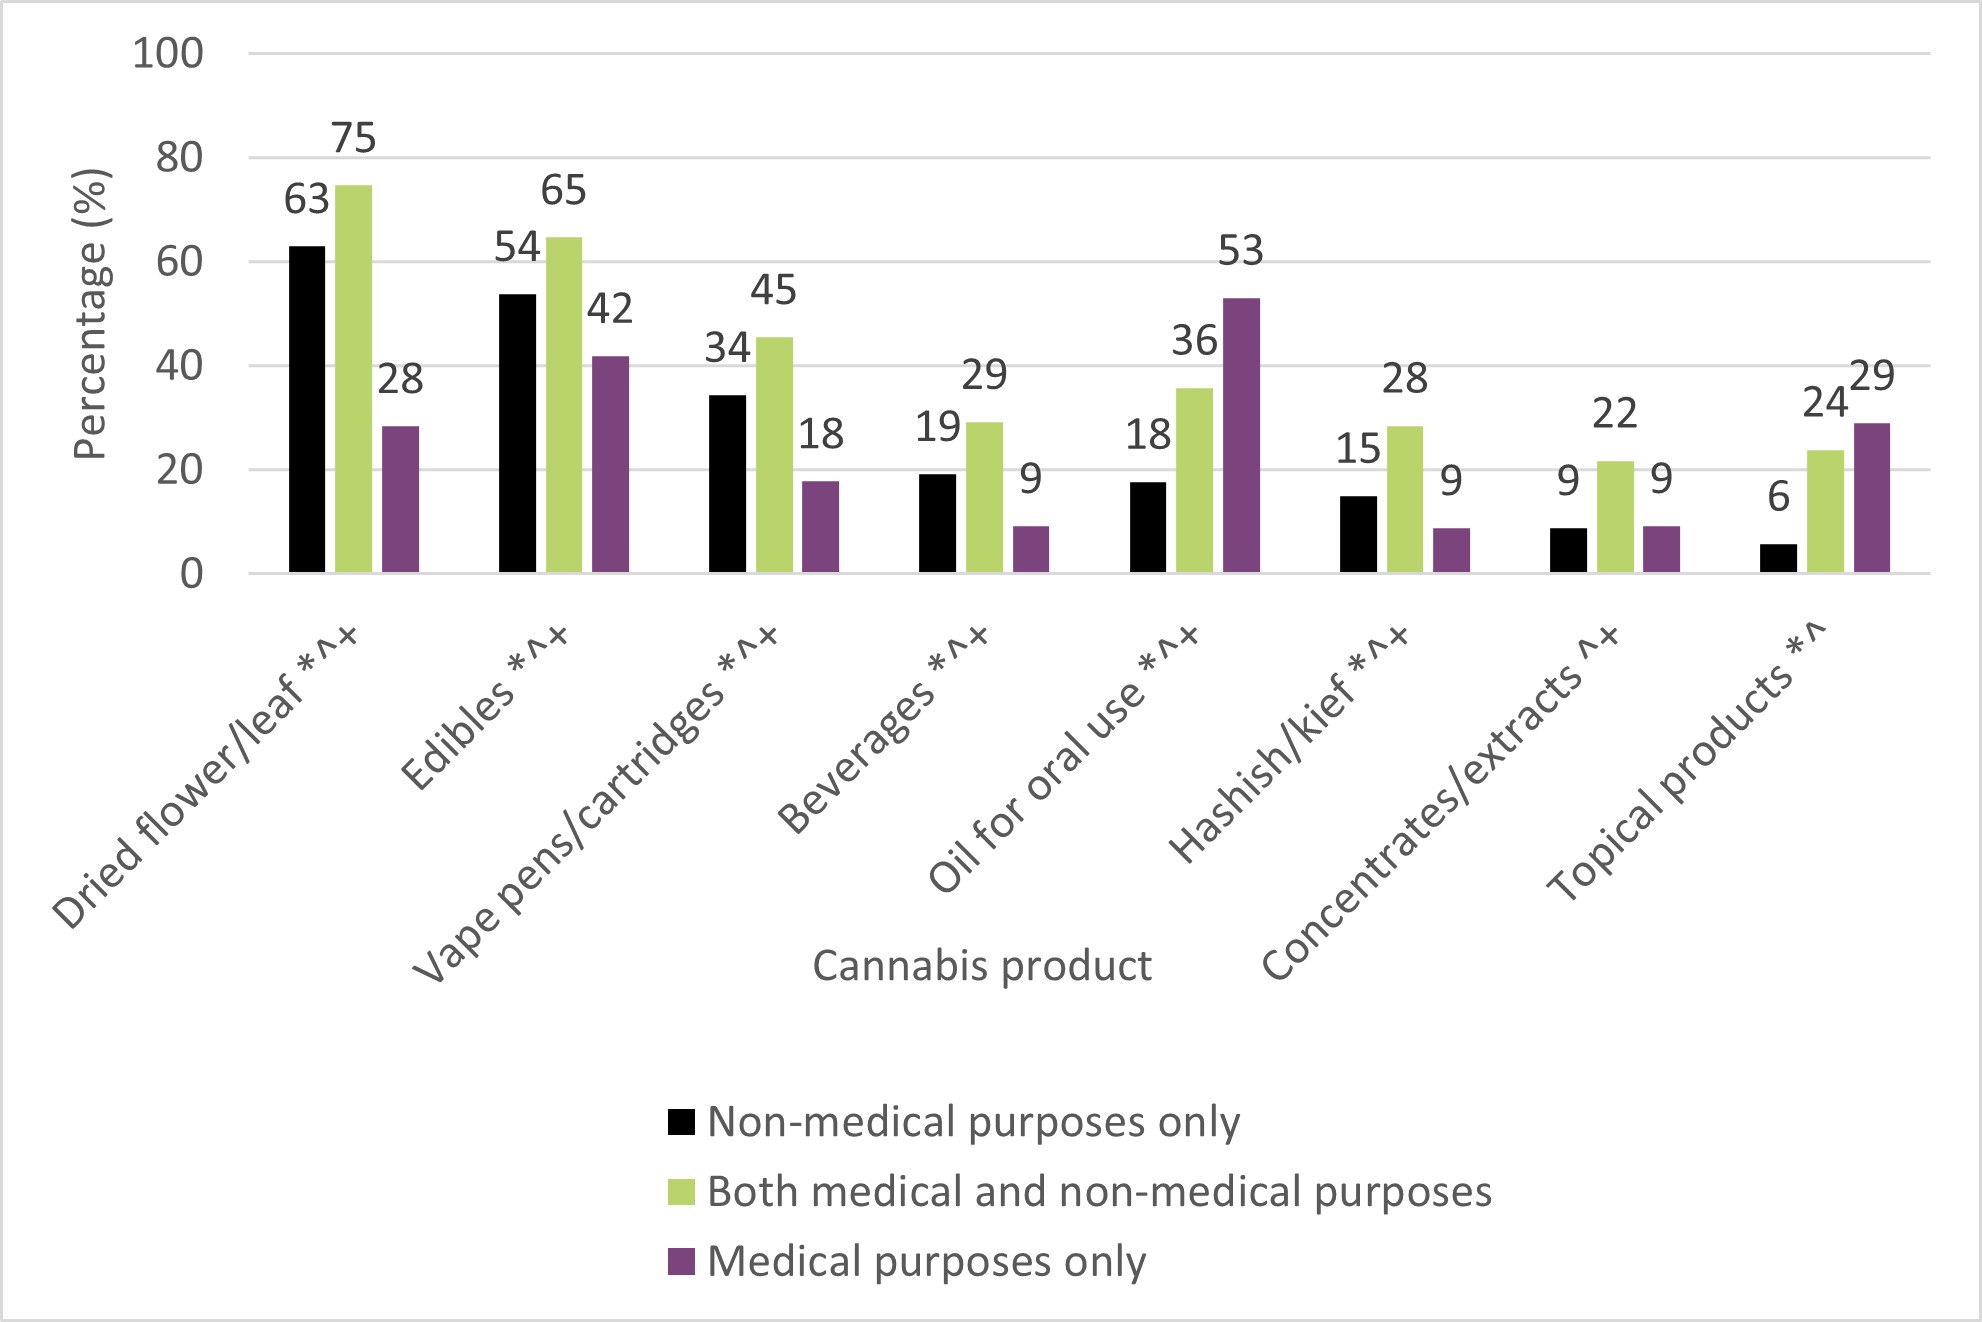
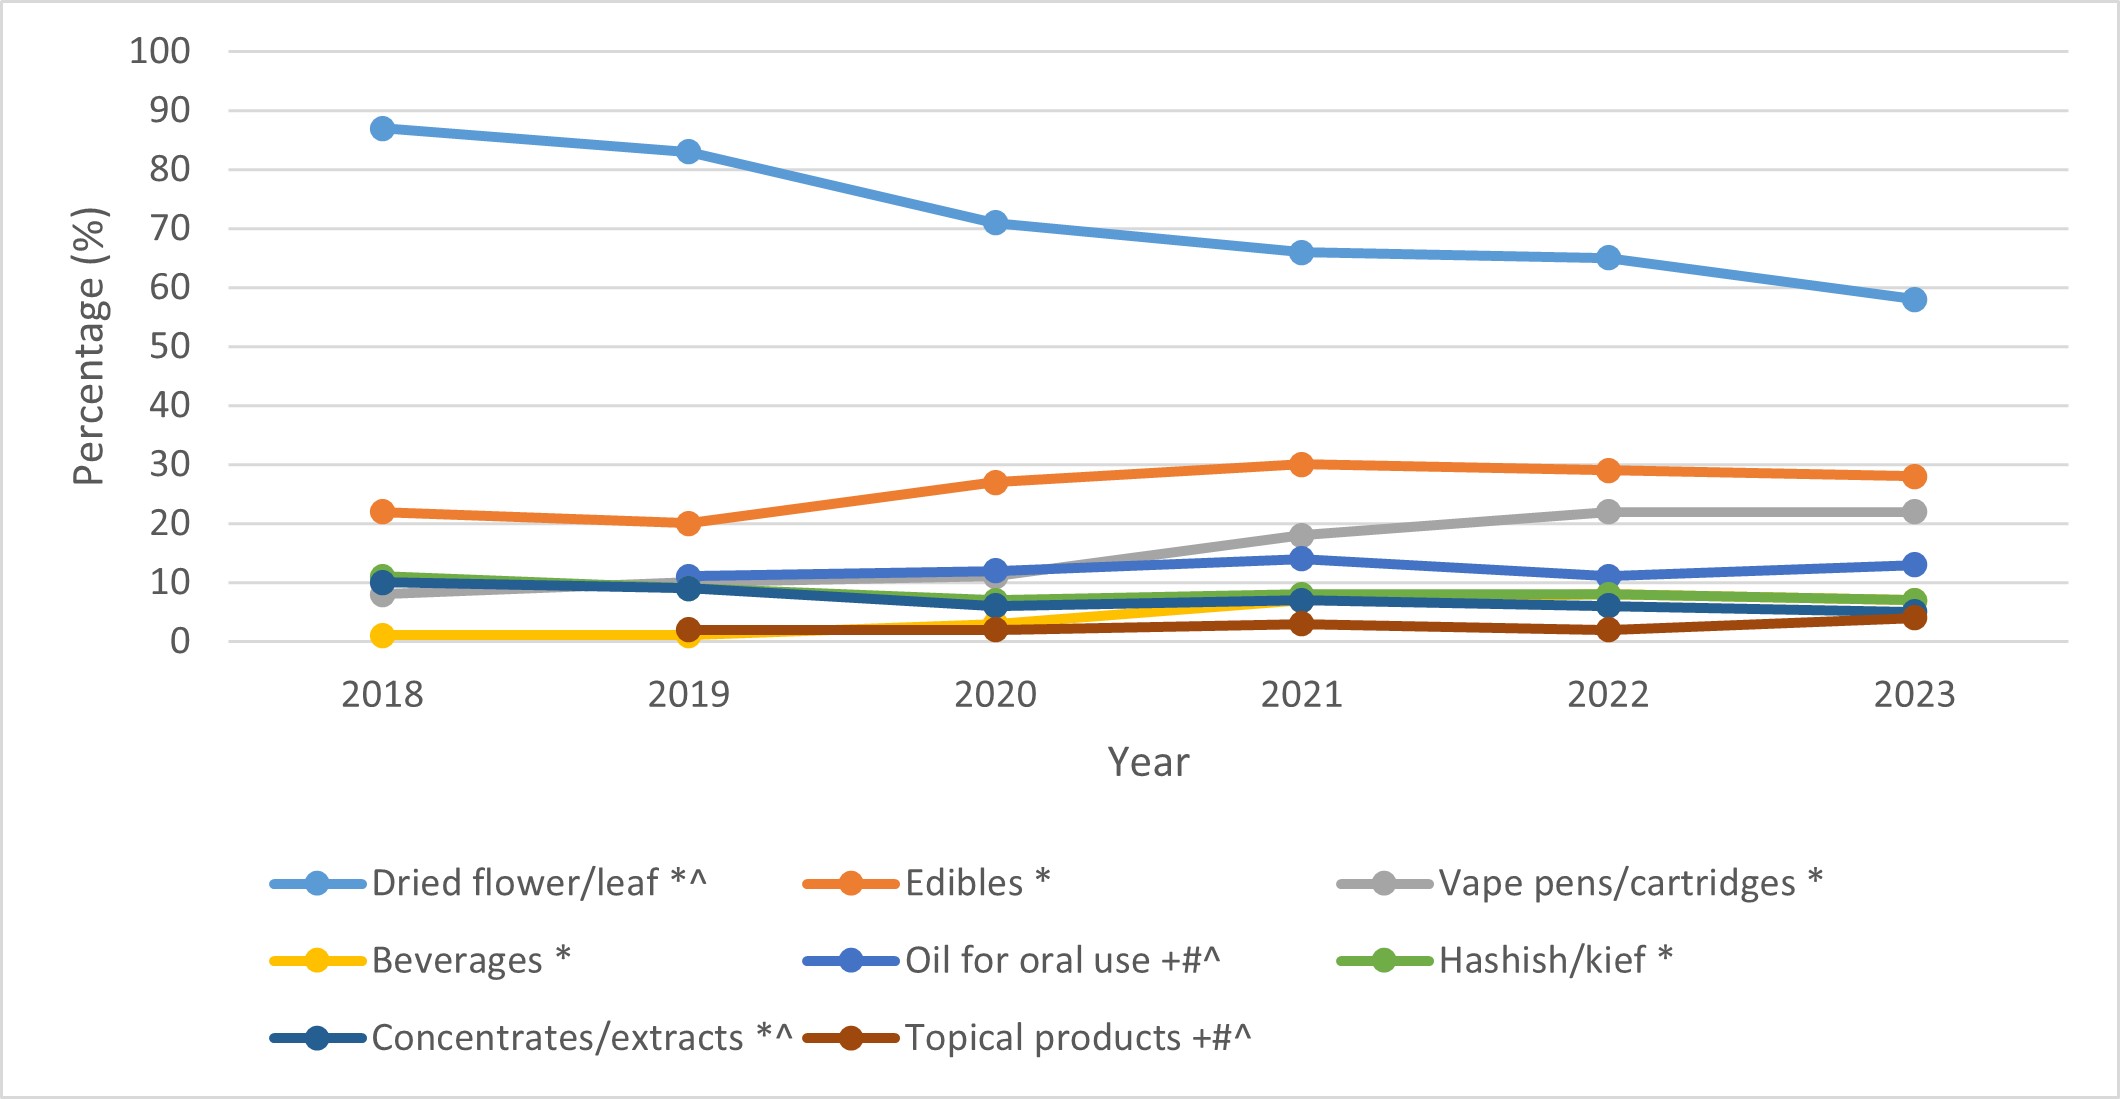
Canadians who used cannabis in the past 12 months were asked about the types of cannabis products they had used in the past 12 months. People could select more than one product. Changes in product use since 2018 are shown in Figure 9. The three most common product types used in 2023 were dried flower or leaf (60%; down from 2018 and 2022); edible cannabis (54%; up from 2018); and vape pens or cartridges (34%; up from 2018). This was followed by oil for oral use (26%; up from 2019 and 2022); beverages (19%; up from 2018); hashish or kief (16%; down from 2018); topical products (12%; up from 2019 and 2022); and concentrates or extracts (for example, wax, shatter or budder) (11%, down from 2018). Note that in 2023, the phrases 'for non-medical purposes' and 'for medical purposes' were removed from these questions; people who had used any form of cannabis were asked the same question. With the exception of concentrates or extracts, rates of use differed among those who used cannabis for medical versus non-medical purposes only (see Figure 10). This likely contributed to apparent changes in the use of dried flower or leaf, oil for oral use and topical products overall between 2022 and 2023.
Figure 9: Cannabis products usedFigure 9, Footnote 1 among people who used cannabis in the past 12 months, 2018 to 2023
- Figure 9 footnote 1
-
Multiple response options could be selected.
- Figure 9 footnote +
-
+ Not asked in 2018.
- Figure 9 footnote *
-
* Significant difference between 2018 and 2023.
- Figure 9 footnote #
-
# Significant difference between 2019 and 2023.
- Figure 9 footnote ^
-
^ Significant difference between 2022 and 2023.
Figure 9 - Text Description
| Product | 2018 (%) |
2019 (%) |
2020 (%) |
2021 (%) |
2022 (%) |
2023 (%) |
|---|---|---|---|---|---|---|
| Dried flower or leafFigure 9 footnote *,Figure 9 footnote ^ | 82 | 77 | 74 | 68 | 65 | 60 |
| EdiblesFigure 9 footnote * | 41 | 44 | 49 | 54 | 53 | 54 |
| Vape pens or cartridgesFigure 9 footnote * | 16 | 26 | 22 | 29 | 33 | 34 |
| Beverages Figure 9 footnote * | 4 | 4 | 6 | 16 | 19 | 19 |
| Oil for oral use Footnote +,Footnote #,Footnote ^ | n/a | 23 | 25 | 26 | 22 | 26 |
| Hashish or kiefFigure 9 footnote * | 26 | 23 | 19 | 18 | 18 | 16 |
| Concentrates or extractsFigure 9 footnote * | 19 | 17 | 13 | 12 | 12 | 11 |
| Topical productsFigure 9 footnote *,Figure 9 footnote #,Figure 9 footnote ^ | n/a | 8 | 7 | 10 | 8 | 12 |
Figure 10: Cannabis products usedFigure 10, Footnote 1 among those who had used cannabis in the past 12 months, by reason for use, 2023
- Figure 10 footnote 1
-
Multiple response options could be selected.
- Figure 10 footnote *
-
* Significant difference between non-medical purposes only and medical purposes only.
- Figure 10 footnote ^
-
^ Significant difference between non-medical purposes only and both.
- Figure 10 footnote +
-
+ Significant difference between medical purposes only and both.
Figure 10 - Text Description
| Product | Non-medical purposes only (%) | Both medical and non-medical purposes (%) | Medical purposes only (%) |
|---|---|---|---|
| Dried flower or leafFigure 10 footnote *,Figure 10 footnote ^,Figure 10 footnote + | 63 | 75 | 28 |
| EdiblesFigure 10 footnote *,Figure 10 footnote ^,Figure 10 footnote + | 54 | 65 | 42 |
| Vape pens or cartridgesFigure 10 footnote *,Figure 10 footnote ^,Figure 10 footnote + | 34 | 45 | 18 |
| Beverages Figure 10 footnote *,Figure 10 footnote ^,Figure 10 footnote + | 19 | 29 | 9 |
| Oil for oral use Figure 10 footnote *,Figure 10 footnote ^,Figure 10 footnote + | 18 | 36 | 53 |
| Hashish or kiefFigure 10 footnote *,Figure 10 footnote ^,Figure 10 footnote + | 15 | 28 | 9 |
| Concentrates or extractsFigure 10 footnote ^,Figure 10 footnote + | 9 | 22 | 9 |
| Topical productsFigure 10 footnote *,Figure 10 footnote ^ | 6 | 24 | 39 |
Canadians who had used each cannabis product in the past 12 months were also asked about the frequency at which they used the product, ranging from less than 1 day per month to daily. The most commonly reported frequency was less than 1 day per month for all products, ranging from 29% among those who used topical products to 58% among those who consumed cannabis beverages. The percentage who used cannabis products daily or almost daily ranged from 2% for cannabis beverages to 31% for dried flower or leaf (Figure 11).
Figure 11: Frequency of product use among people who used each cannabis product in the past 12 months, 2023
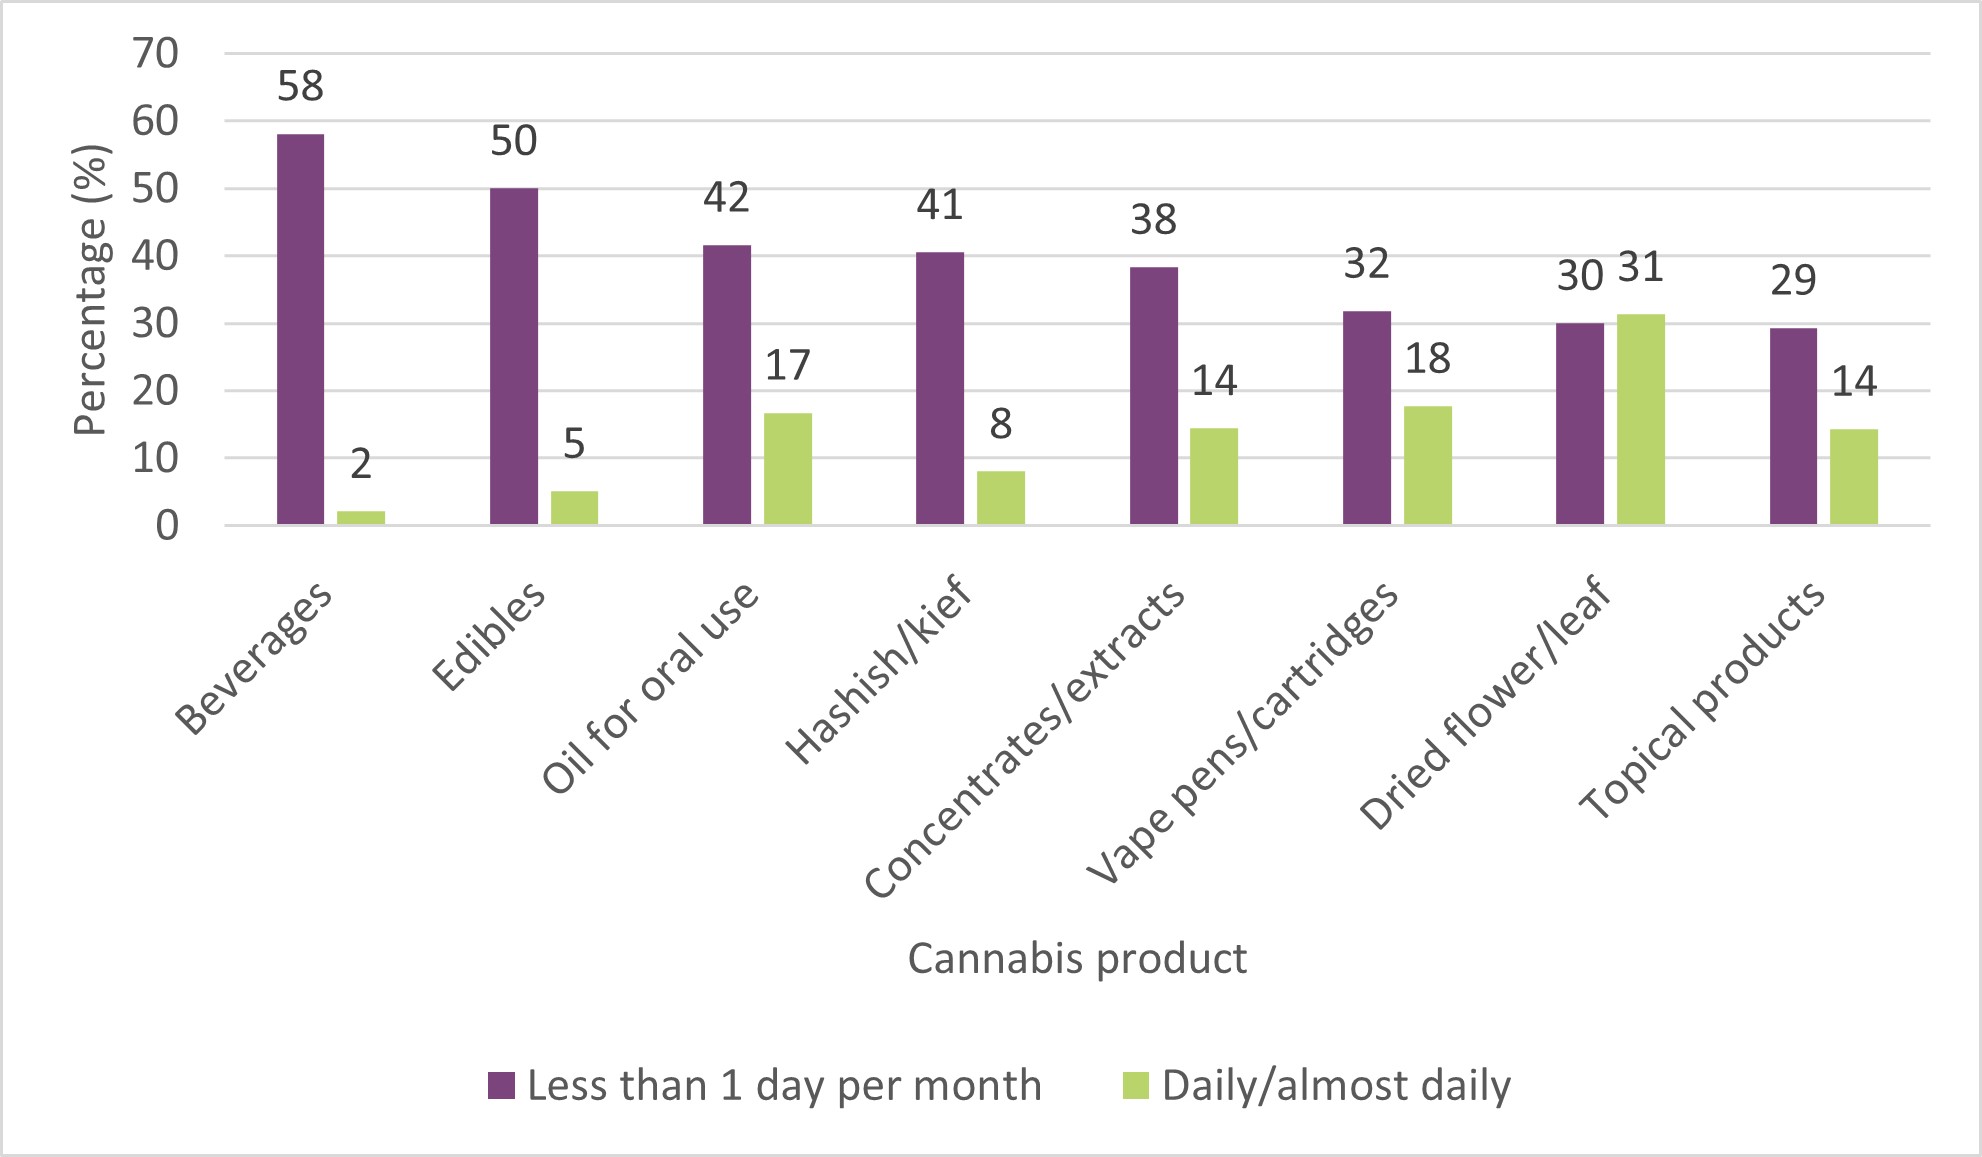
Figure 11 - Text Description
| Product | Less than 1 day per month (%) | Daily or almost daily (%) |
|---|---|---|
| Beverages | 58 | 2 |
| Edibles | 50 | 5 |
| Oil for oral use | 42 | 17 |
| Hashish or kief | 41 | 8 |
| Concentrates or extracts | 38 | 14 |
| Vape pens or cartridges | 32 | 18 |
| Dried flower or leaf | 30 | 31 |
| Topical products | 29 | 14 |
Average amount used on a typical use day
People who used cannabis in the past 12 months were asked about the average amount consumed on a typical day when they used cannabis. Of those who consumed dried flower or leaf, the average amount used was 0.9 grams (down from 2018 and 2022). Those who used edible cannabis consumed approximately 1.4 servings (up from 2018 and 2022). The average amount of cannabis oil for oral use consumed was 2.3 millilitres (up from 2018 and 2022). Of those who used each of the following products, the average amount consumed was 0.5 grams of hashish or kief and 0.3 grams of cannabis concentrate or extract. The units used to ask about vape pens and beverages were changed in 2023 so the amounts reported are not comparable to previous years. In 2023, people reported using an average of 10.3 puffs from a vape pen and 1.2 drinks when using beverages.
Note that in 2023, the phrases 'for non-medical purposes' and 'for medical purposes' were removed from these questions; people who had used cannabis for any reason were asked the same question. This may have contributed to the increase in the average amount of cannabis oil for oral use being reported. For dried flower or leaf a new response option ('1 or 2 puffs') was added. The addition of this lower response option may have contributed to the decrease in the average amount report for dried flower or leaf.
Home growing of cannabis and preparation of cannabis edibles or drinks
Canadians were asked if anyone had grown cannabis plants in or around their home in the past 12 months. Overall, 4% of Canadians and 10% of those who had used cannabis for non-medical purposes in the past 12 months reported that cannabis plants had been grown in or around their home, both down from 2020 and 2022. We also asked whether the person who was growing cannabis was authorized by Health Canada to grow for medical purposes for themselves or for another person. Twenty-one percent (21%, unchanged from 2022 – first year question was asked) indicated that the person growing did have an authorization. Among those who reported cannabis plants currently grown in or around their residence, the average number of plants was 3.4. We also asked about the number of plants that had been grown inside and outside the home in the past 12 months. The average number of plants grown outside was 3.1, and the number grown inside was 3.8. People who reported more than 25 plants were not included in the averages to allow for comparability to previous years.
Canadians were asked if anyone had prepared cannabis edibles or beverages in or around their home in the past 12 months. Overall, 6% reported preparing cannabis edibles or beverages in their home, down from 2020 and 2022. Among those who had used cannabis for non-medical purposes in the past 12 months, 15% reported preparing cannabis edibles or beverages in their home, down from 2020 (19%) and 2022 (18%). Among those who had used cannabis for medical purposes in the past 12 months, 18% reported preparing cannabis edibles or beverages in their home, down from 2020 (25%) and unchanged from 2022.
Relative levels of THC and CBD in cannabis products
Starting in 2019, people who used cannabis in the past 12 months were asked about the relative levels of THC and CBD in the cannabis products they typically use. Twenty-eight percent (28%) indicated higher THC and lower CBD, 15% indicated higher CBD and lower THC, 12% selected equal levels of THC and CBD, 7% selected THC only, 4% selected CBD only, 17% said they typically used a mix of these products, and less than 1% said 'other'. Sixteen percent (16%) indicated they did not know the relative levels of THC and CBD.
People who selected 'higher THC and lower CBD' or 'THC only' products were classified as using THC-predominant products and those who selected 'higher CBD and lower THC' or 'CBD only' products were classified as using CBD-predominant products. Thirty-five percent (35%) reported using THC-predominant products, down from 39% in 2022, and 20% reported using CBD-predominant products, up from both 2019 and 2022 (13% and 15%, respectively). Note that in 2023, the phrases 'for non-medical purposes' and 'for medical purposes' were removed from these questions. People who had used any form of cannabis were asked the same question, which could have contributed to changes from previous cycles.
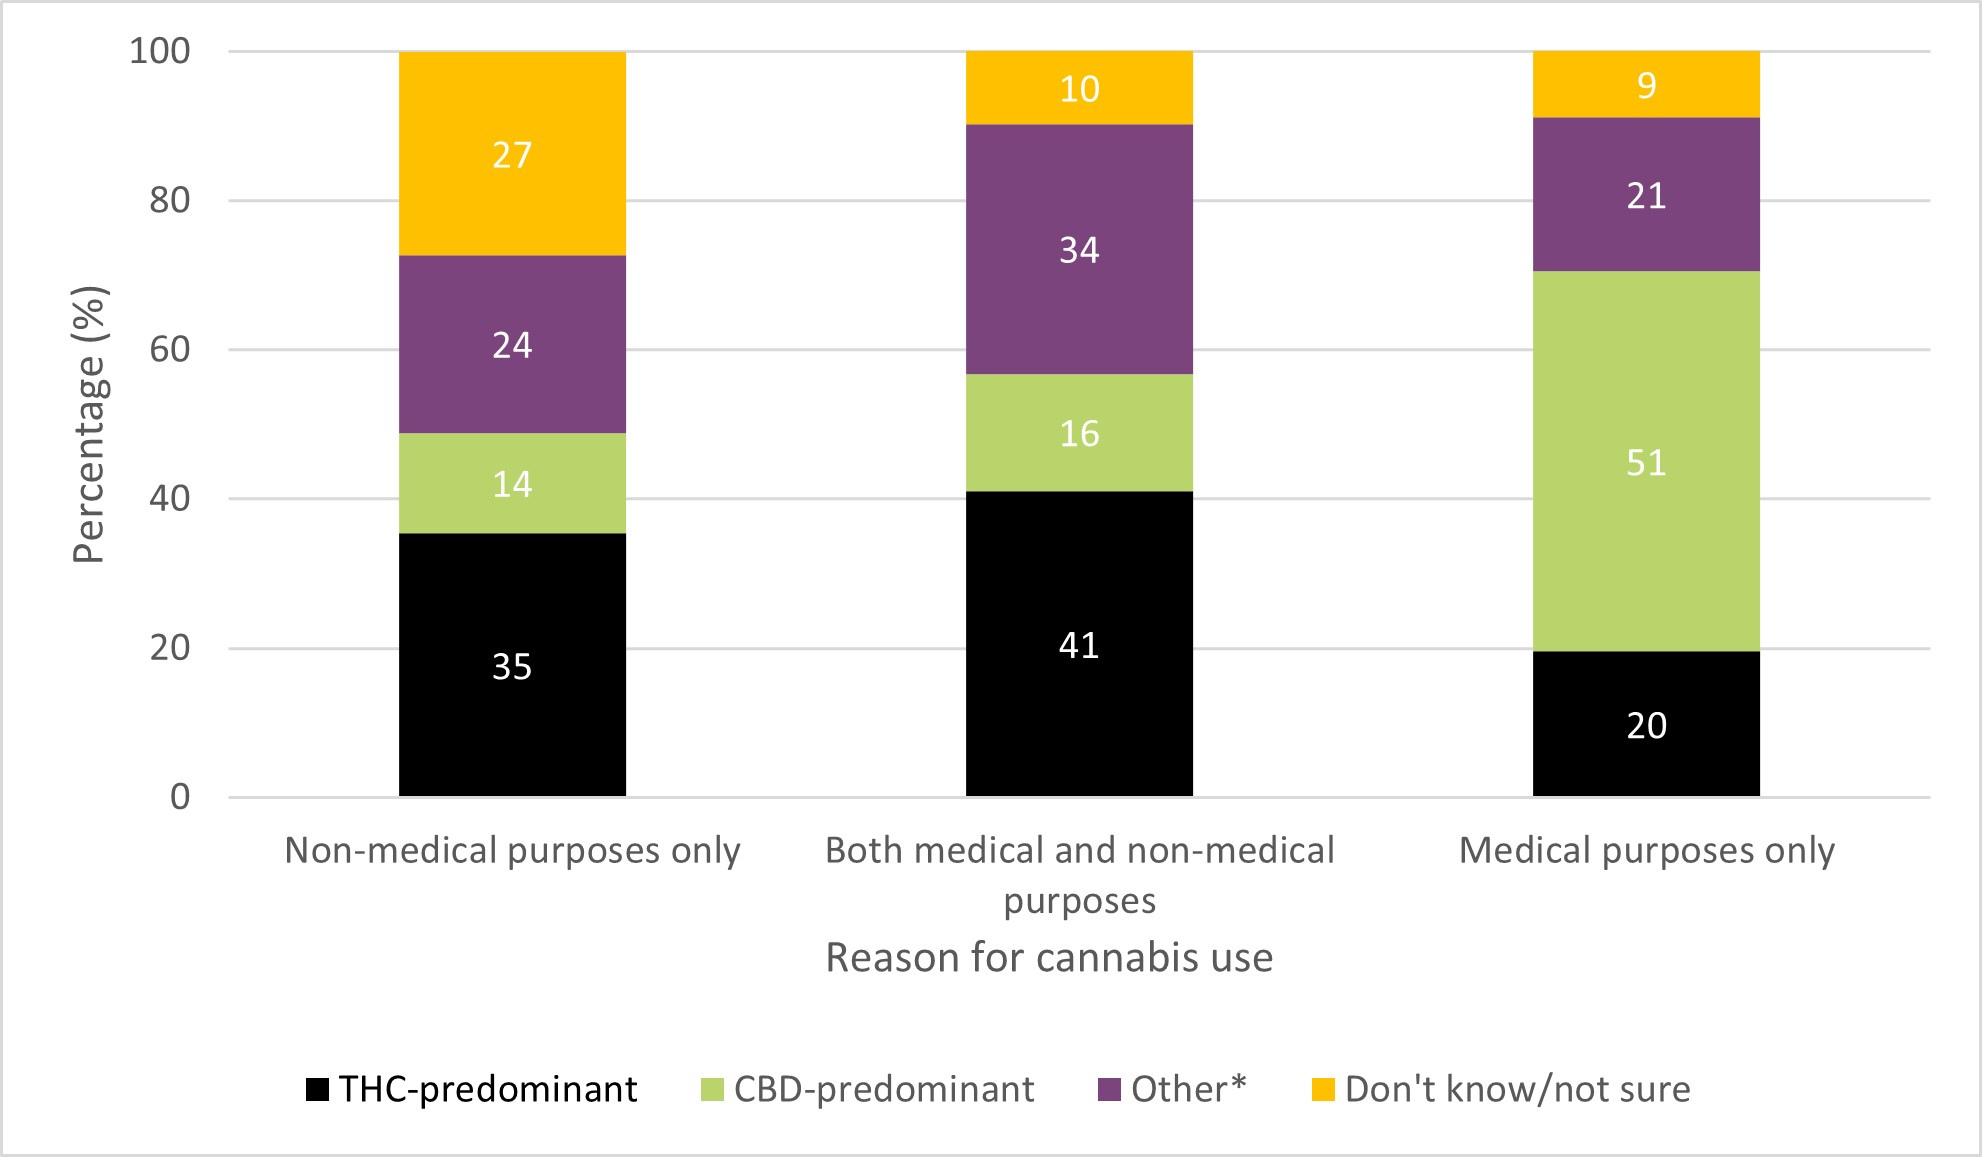
As shown in Figure 12, usual use of THC-predominant products was more common among those who used for both medical and non-medical purposes (41%) or for non-medical purposes only (35%) compared to medical purposes only (20%). Usual use of CBD-predominant products was more common among those who used for medical purposes only (51%) compared to those who used for both medical and non-medical purposes (16%) or for non-medical purposes only (14%). Usual use of other product types (including equal levels of THC and CBD; a mix of product types, and 'other') were more common among those who used for both medical and non-medical purposes (34%) compared to non-medical purposes only (24%) or medical purposes only (21%).
Not knowing the THC and CBD levels of one's cannabis products was more common among those who used for non-medical purposes only (27%) compared to those who used for both medical and non-medical purposes (10%) or medical purposes only (9%).
Figure 12: Usual THC and CBD levels of cannabis products used among those who used cannabis in the past 12 months, by reason for cannabis use
- Figure 12 footnote *
-
* Other responses include: Products with equal levels of THC and CBD; A mix of product types; and Other.
Figure 12 - Text Description
| Product type | Non-medical purposes only (%) | Both medical and non-medical purposes (%) | Medical purposes only (%) |
|---|---|---|---|
| THC-predominant | 35 | 41 | 20 |
| CBD-predominant | 14 | 16 | 51 |
| OtherFootnote * | 24 | 34 | 21 |
| Don't know/not sure | 27 | 10 | 9 |
Exposure to second-hand smoke or vapour
Starting in 2020, Canadians were asked about locations of exposure to second-hand cannabis smoke or vapour in the past 30 days. Overall, 57% reported exposure in any location (an increase from both 2020 and 2022). The most common location was in a public place (48%), followed by the home (20%), the workplace or school (8%), and a car (7%). Exposure to second-hand cannabis smoke was more common among people who used cannabis in the past 12 months than among people who did not.
Cannabis use with other substances
People who used cannabis in the past 12 months were asked how often they combined their cannabis use with other substances, by mixing or consuming at the same time. People could select more than one substance. As in previous cycles, alcohol (40%) was the substance most commonly used in combination with cannabis, followed by tobacco (24%) (Figure 13). The frequency of combining alcohol or tobacco with cannabis at a frequency of 'sometimes', 'often' or 'always' both decreased since 2018. The majority of Canadians who used cannabis in the past 12 months never combined cannabis with opioids (96%), sedatives (96%), stimulants (93%), or hallucinogens or dissociatives (90%).
Starting in 2023, Canadians who had used cannabis in the past 12 months were also asked if they took other medications or health products while using cannabis. People could select more than one medication. Thirty-six percent (36%) said they had taken no other medications while using cannabis. The top five medications selected were vitamins or natural health products (44%); psychiatric medications (22%); heart disease medications (13%); birth control or sexual or reproductive health medications (11%); and prescription gastrointestinal medications (10%).
Figure 13: Past 12 months, use of alcohol and tobaccoFigure 13, Footnote 1 in combinationFigure 13, Footnote 2 with cannabis, among people who used cannabis in the past 12 months, 2018 to 2023
- Figure 13 footnote 1
-
Multiple response options could be selected.
- Figure 13 footnote 2
-
"Combined" was defined as mixed or consumed at the same time 'sometimes', 'often', or 'always'.
- Figure 13 footnote *
-
* Significantly different between 2018 and 2023.
Figure 13 - Text Description
| Substance used in combination with cannabis | 2018 (%) |
2019 (%) |
2020 (%) |
2021 (%) |
2022 (%) |
2023 (%) |
|---|---|---|---|---|---|---|
| AlcoholTable 13, Footnote * | 44 | 42 | 47 | 43 | 41 | 40 |
| TobaccoTable 13, Footnote * | 30 | 26 | 25 | 24 | 24 | 24 |
Effects of cannabis use
Starting in 2019, people who used cannabis in the past 12 months were asked about the effects of their cannabis use on various aspects of their lives (Figure 14). In general, people report their cannabis use is more beneficial than harmful across all categories. The greatest percentage of people felt that cannabis use was somewhat or very beneficial for their quality of life (50%), followed by their mental health (43%).
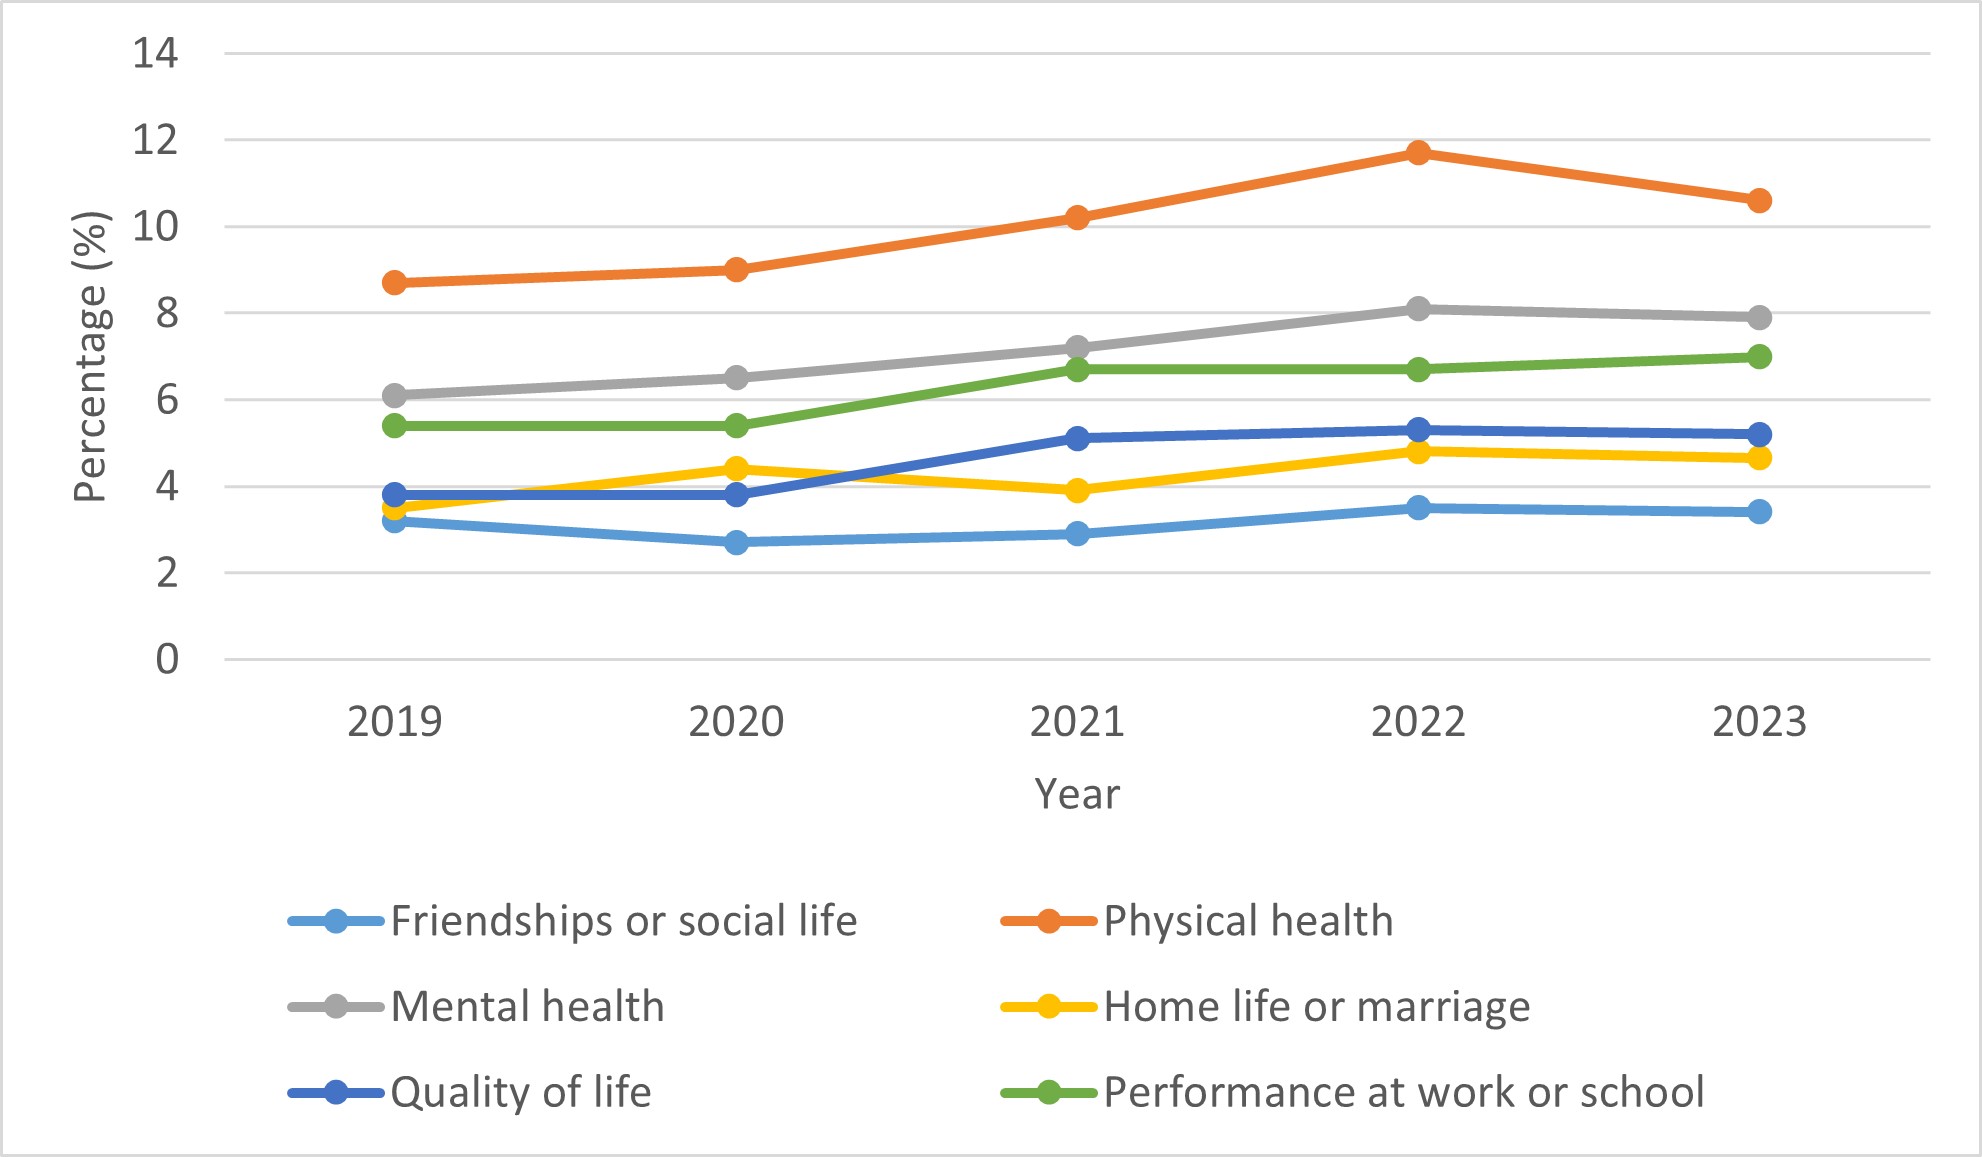
With the exception of physical health (11%), the percentage reporting somewhat to very harmful effects was 8% or less across all categories. As shown in Figure 15, with the exception of effect on friendships or social life, which did not change over time, the percentage of people who reported that their cannabis use had a somewhat or very harmful effect increased from 2019.
Figure 14: Past 12 months, effects of cannabis use, among people who used cannabis in the past 12 months, 2023
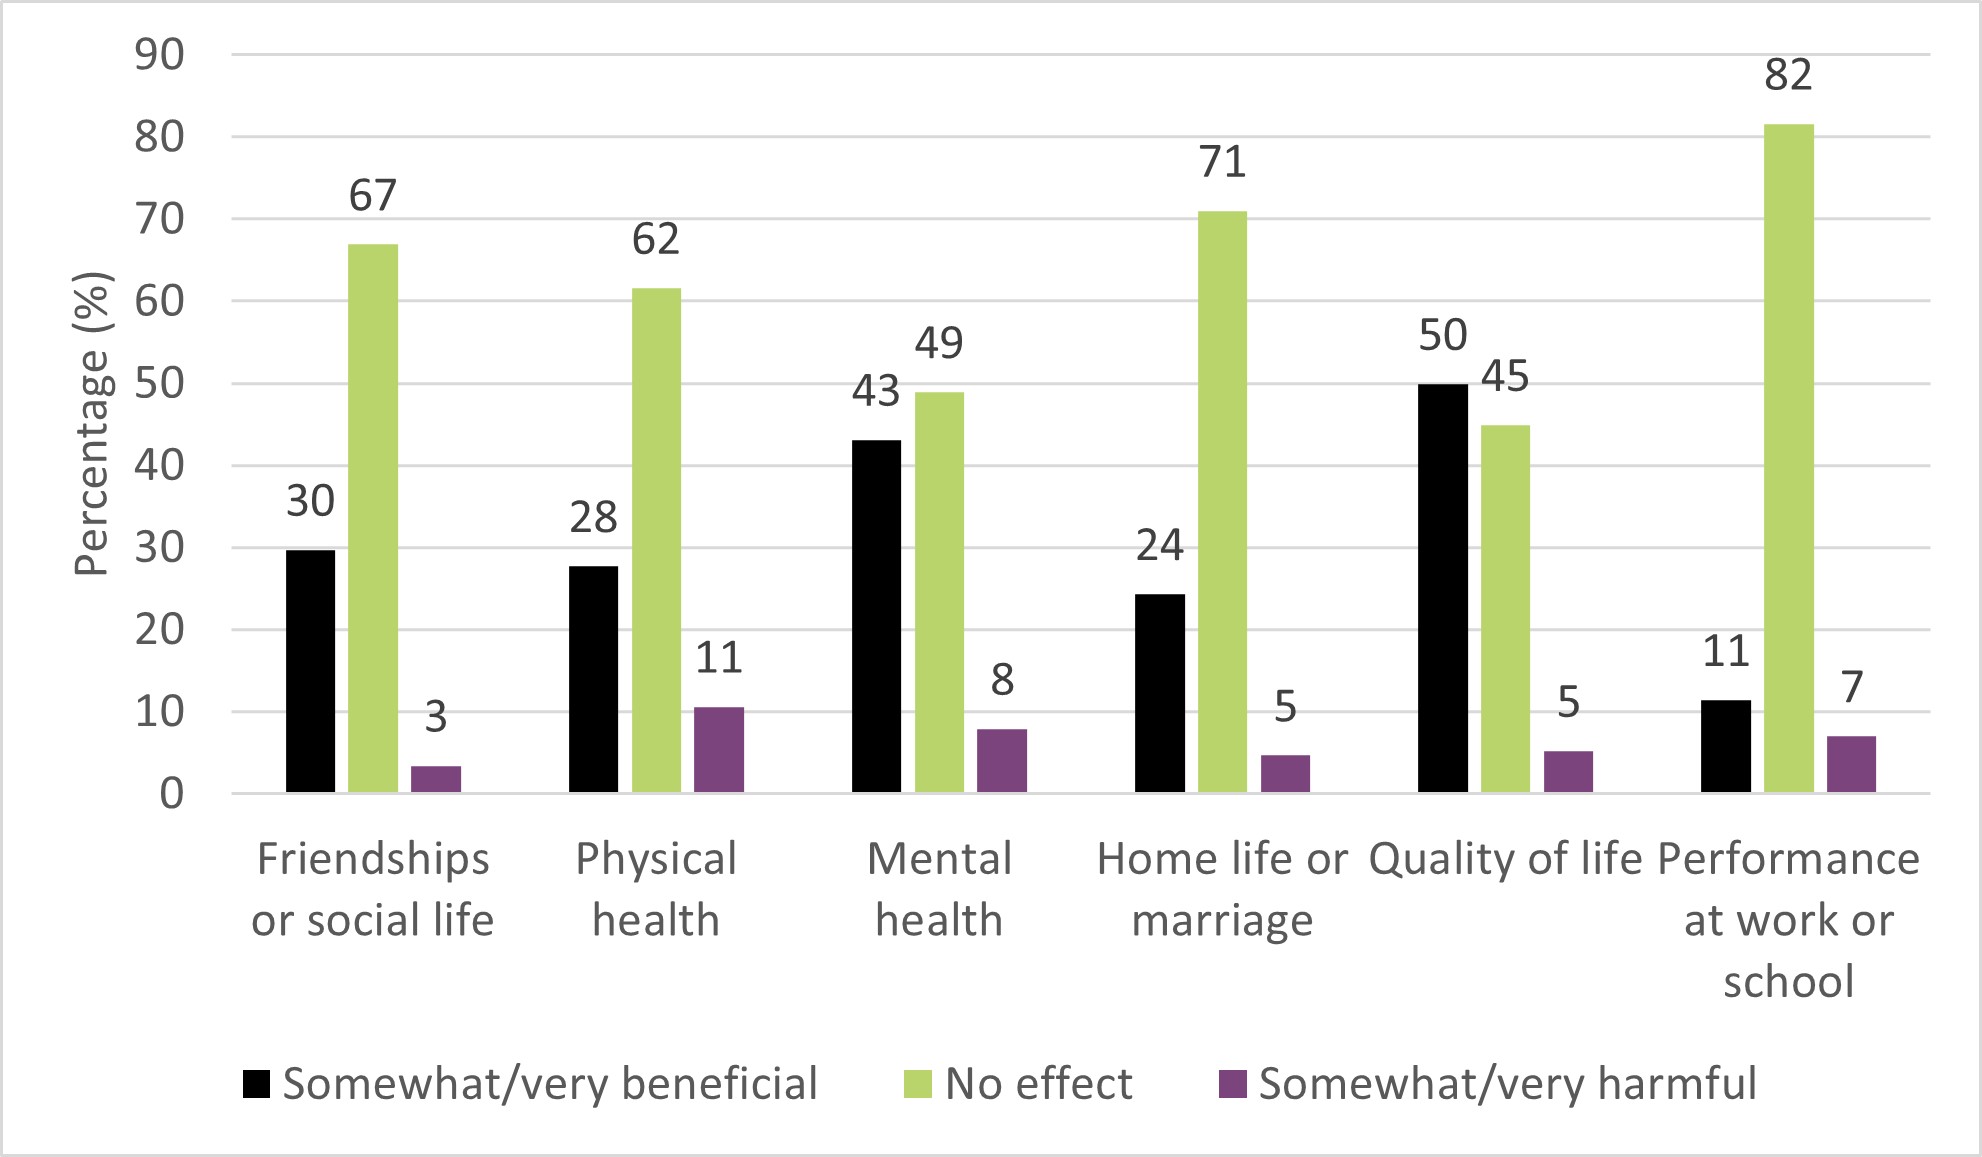
Figure 14 - Text Description
| Effect of cannabis use | Somewhat/very beneficial (%) | No effect (%) | Somewhat/very harmful (%) |
|---|---|---|---|
| Friendships or social life | 30 | 67 | 3 |
| Physical health | 28 | 62 | 11 |
| Mental health | 43 | 49 | 8 |
| Home life or marriage | 24 | 71 | 5 |
| Quality of life | 50 | 45 | 5 |
| Performance at work or school | 11 | 82 | 7 |
Figure 15: Percentage reporting that their cannabis use had a harmfulFigure 15, Footnote 1 effect on their lives, among people who used cannabis in the past 12 months, 2019 to 2023
- Figure 15 footnote 1
-
'Harmful' was defined as 'somewhat harmful' or 'very harmful'.
Figure 15 - Text Description
| Effect of cannabis use | 2019 (%) |
2020 (%) |
2021 (%) |
2022 (%) |
2023 (%) |
|---|---|---|---|---|---|
| Friendships or social life | 3 | 3 | 3 | 4 | 3 |
| Physical health | 9 | 9 | 10 | 12 | 11 |
| Mental health | 6 | 7 | 7 | 8 | 8 |
| Home life or marriage | 4 | 4 | 4 | 5 | 5 |
| Quality of life | 4 | 4 | 5 | 5 | 5 |
| Performance at work or school | 5 | 5 | 7 | 7 | 7 |
Where cannabis is stored inside the home
People who used cannabis in the past 12 months were asked about where they store cannabis inside the home. People could select more than one response. Among those with children under 18 years in the home, 76% stored their cannabis in a container, room or building that was childproof, locked or out of reach. One quarter (25%) stored their cannabis in an unlocked container, room or building, and 2% stored it in an 'other' location.
Sources and purchasing
Canadians who reported using cannabis were asked detailed questions about where they obtained their cannabis from, and their purchasing behaviour. Topics included:
- Sources used to obtain cannabis
- Average amount spent each month
- Type and frequency of cannabis products purchased or received
- Average price per unit of purchases
- Proportion of people who receive cannabis products for free
Sources used to obtain cannabis
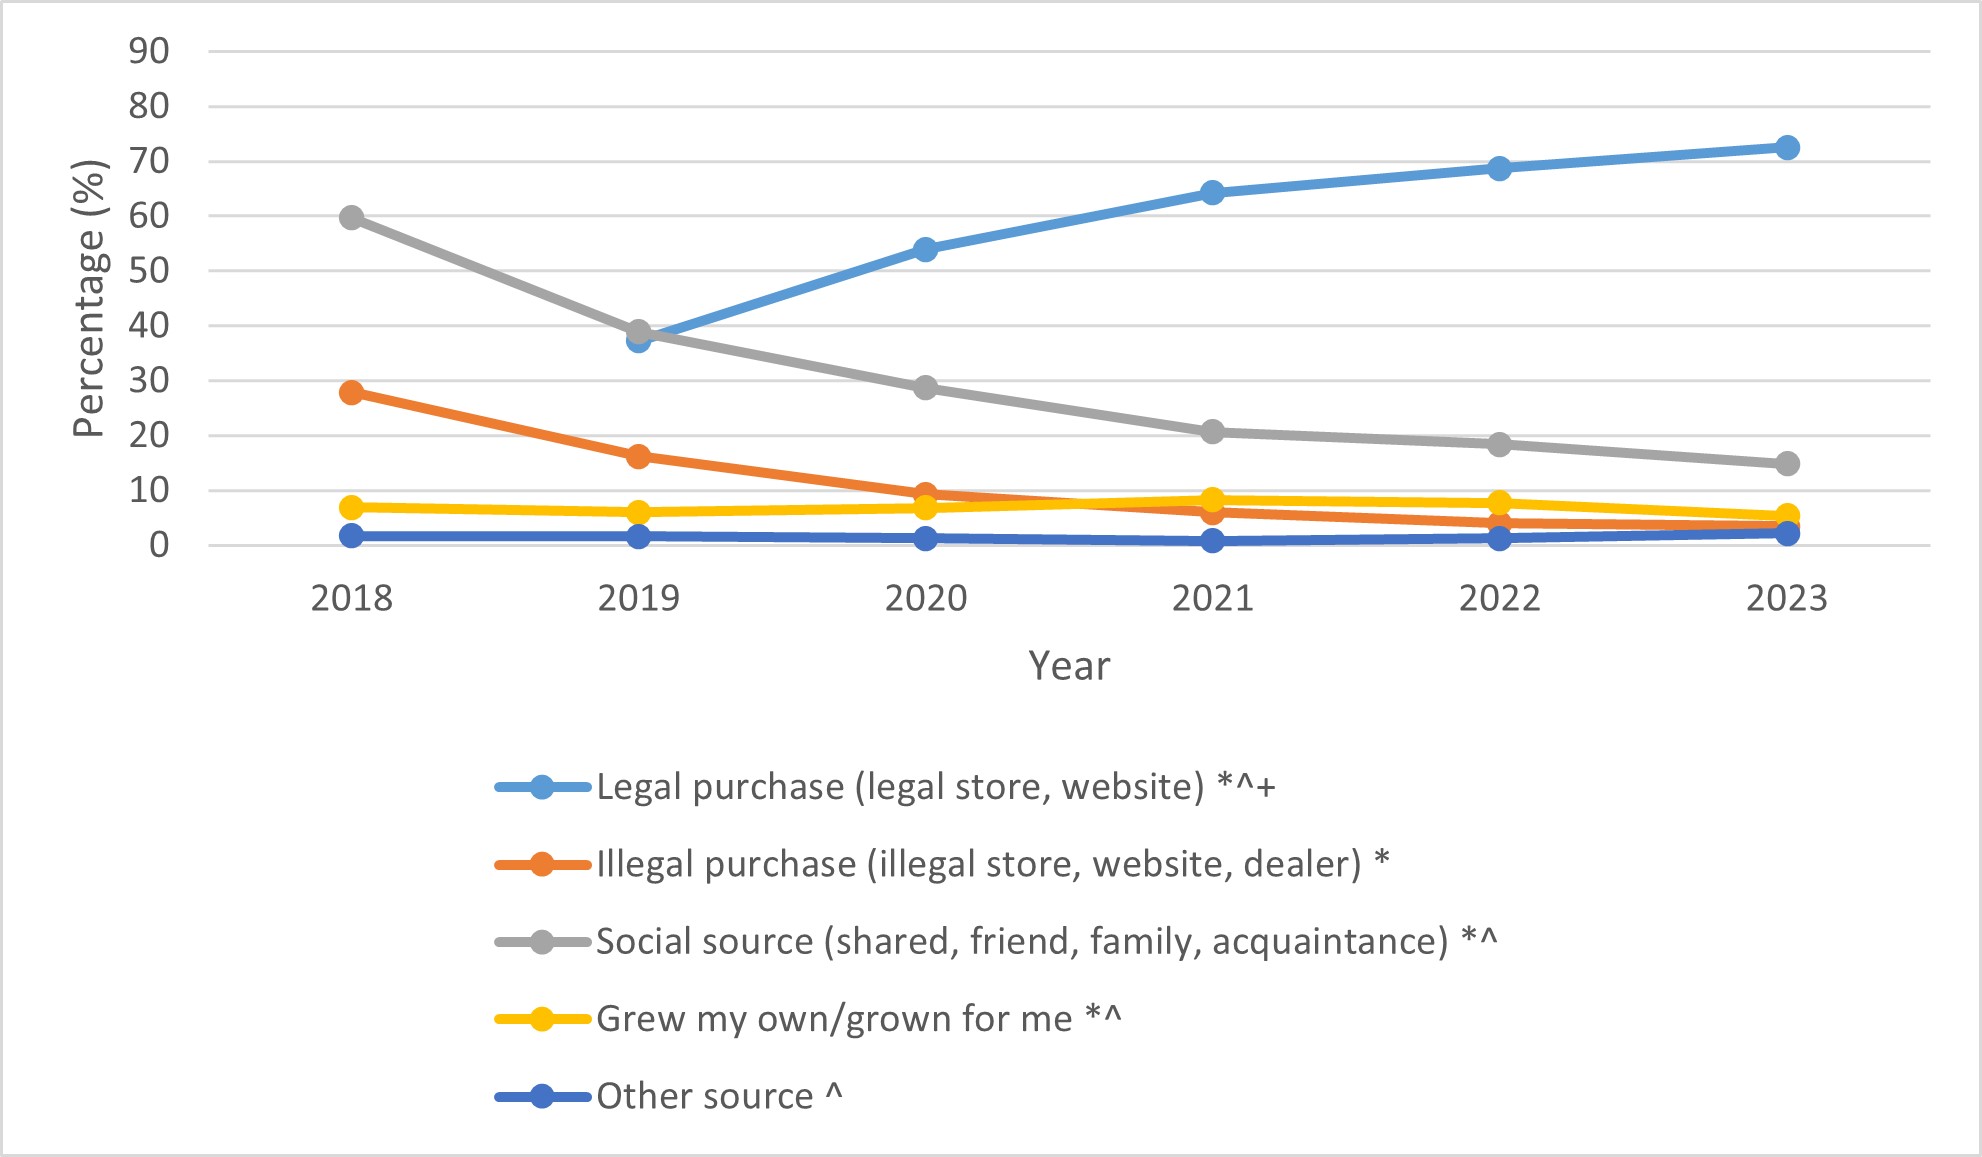
People who reported using cannabis in the past 12 months were asked where they usually obtained the cannabis from. Figure 16 displays the sources used to obtain cannabis over time. Almost three-quarters (73%) of people reported purchasing cannabis from a legal source (legal store or legal website), up from 2019 and 2022. Fifteen percent (15%) of people reported obtaining their cannabis from a social source (shared around a group of friends, from a friend, family member or acquaintance), and 5% reported growing their own cannabis or having it specifically grown for them; both represented a decrease from 2018 and 2022. Only 3% of people reported using an illegal purchase source (illegal store, illegal website or dealer), down from 2018. Two percent (2%) reported using another source, up from 2022 but unchanged from 2018; and 2% reported getting their cannabis from a storefront on a First Nations community (new in 2023).
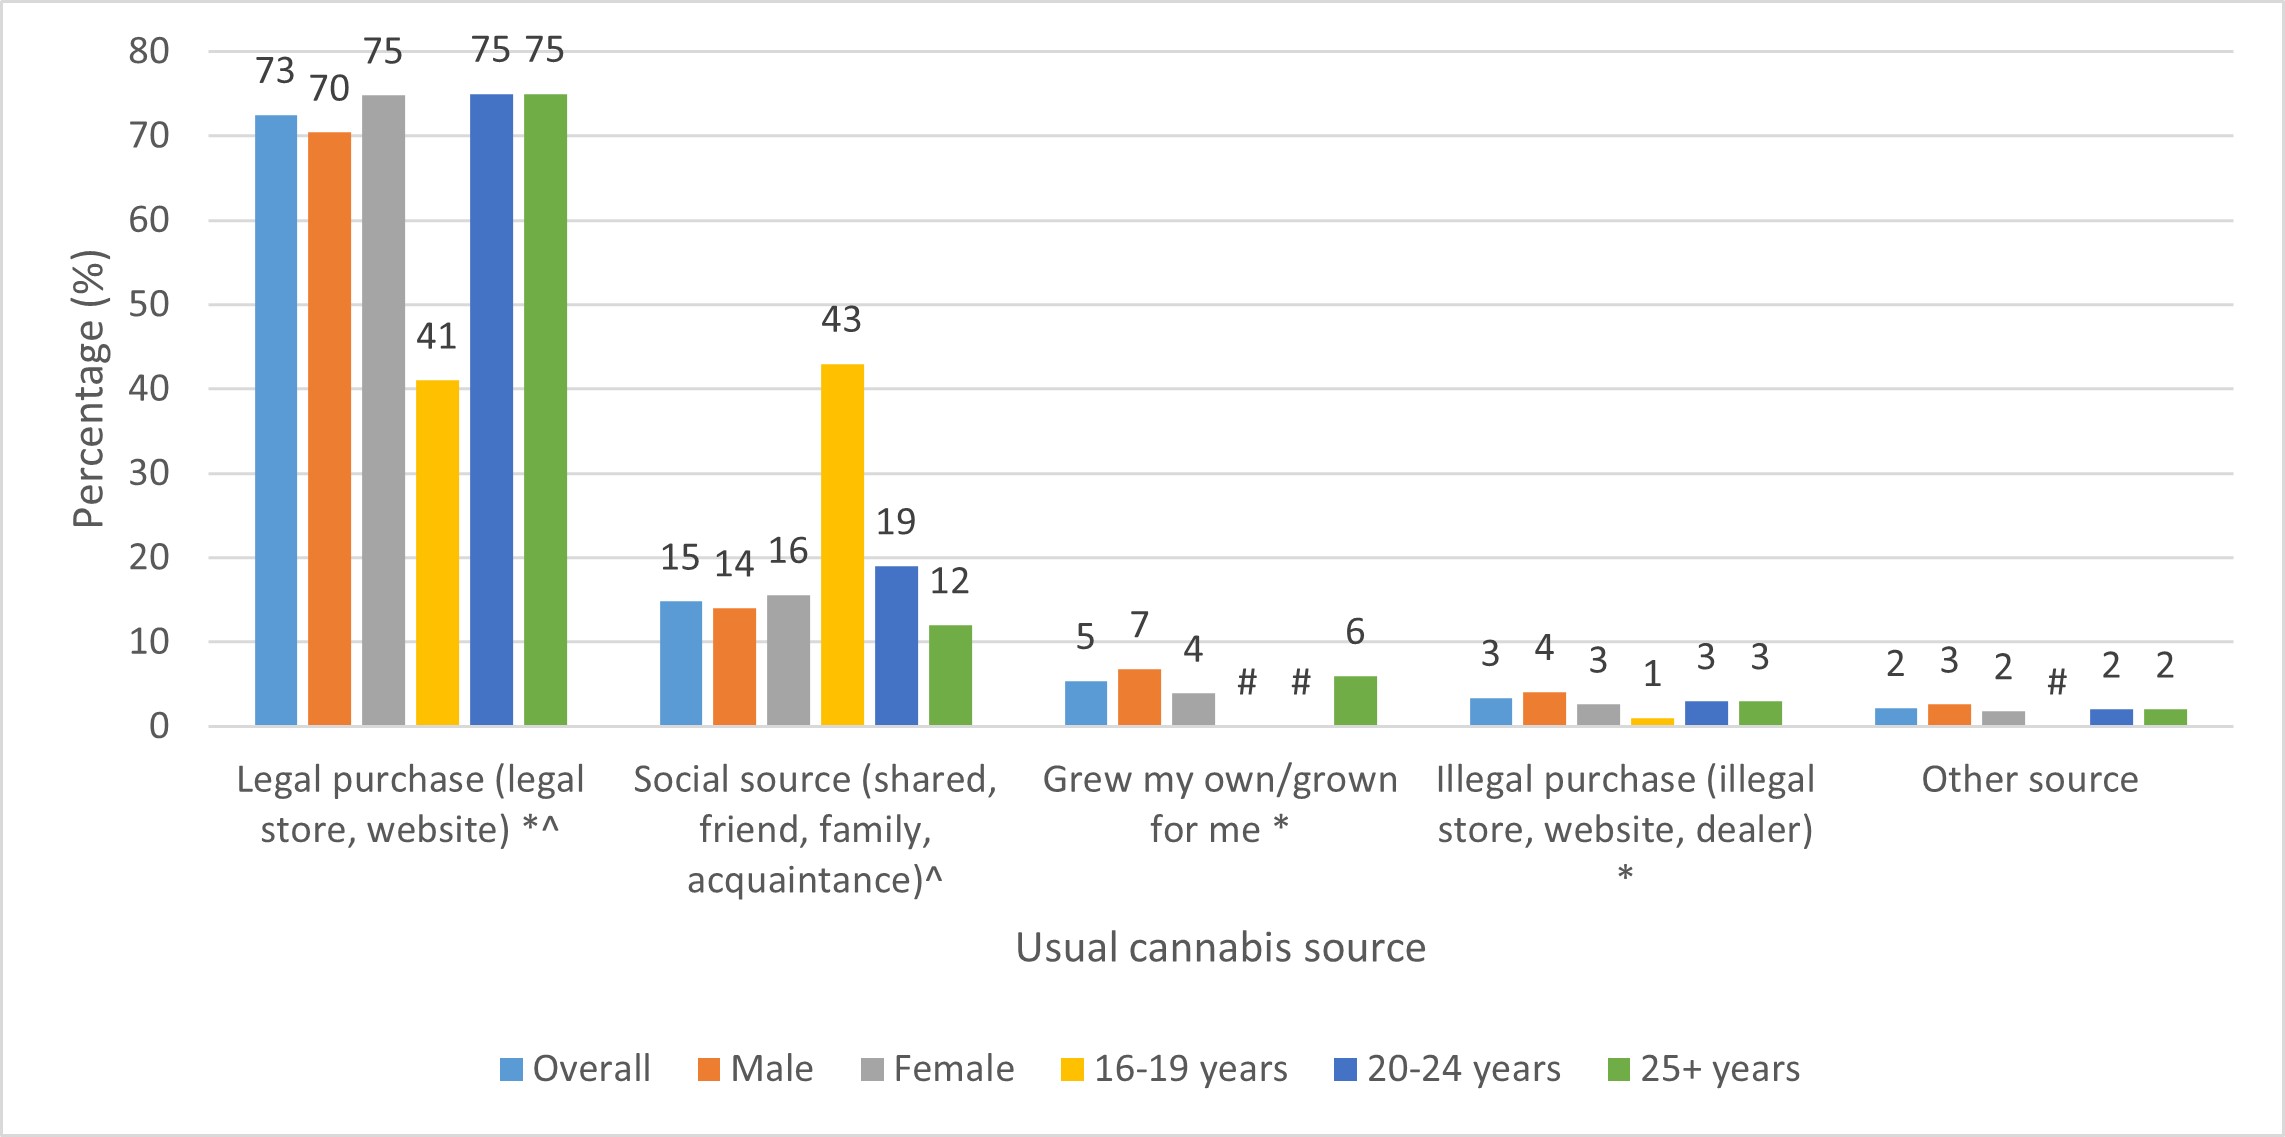
Figure 17 displays the sources used to obtain cannabis in 2023, by sex. Females were more likely to report purchasing cannabis from a legal source, whereas males were more likely to report purchasing cannabis from an illegal source, or growing their own or having it specifically grown for them. Youth (16 to 19) were less likely to obtain from a legal source than the 2 older age groups. This is likely because many of them are minors. Youth are more likely than older age groups to obtain cannabis from a social source.
Figure 16: Usual source of cannabis among people who used cannabis in the past 12 months, 2018 to 2023
- Figure 16 footnote *
-
* Significantly different between 2018 and 2023.
- Figure 16 footnote ^
-
^ Significantly different between 2022 and 2023.
- Figure 16 footnote +
-
+ For legal purchasing, differences were tested compared to 2019, after legalization of cannabis for non-medical purposes.
Figure 16 - Text Description
| Source of cannabis | 2018 (%) |
2019 (%) |
2020 (%) |
2021 (%) |
2022 (%) |
2023 (%) |
|---|---|---|---|---|---|---|
| Legal purchase (legal store, website)Footnote *,Footnote ^,Footnote + | n/a | 37 | 54 | 64 | 69 | 73 |
| Illegal purchase (illegal store, website, dealer)Footnote * | 26 | 16 | 9 | 6 | 4 | 3 |
| Social source (shared, friend, family, acquaintance)Footnote *,Footnote ^ | 60 | 39 | 29 | 21 | 18 | 15 |
| Grew my own or grown for meFootnote *,Footnote ^ | 7 | 6 | 7 | 8 | 8 | 5 |
| Other sourceFootnote ^ | 2 | 2 | 1 | 1 | 1 | 2 |
Figure 17: Usual source of cannabis among people who used cannabis in the past 12 months, by sex and age group, 2023
- Figure 17 footnote *
-
* Significantly different between males and females.
- Figure 17 footnote ^
-
^ Significantly different from youth (16 to 19 years).
- Figure 17 footnote #
-
# Suppressed due to small cell counts and/or high variability.
Figure 17 - Text Description
| Source of cannabis | Overall (%) |
Male (%) |
Female (%) |
16 to 19 years (%) |
20 to 24 years (%) |
25 years or older (%) |
|---|---|---|---|---|---|---|
| Legal purchase (legal store, website) Footnote *Footnote ^ | 73 | 70 | 75 | 41 | 75 | 75 |
| Social source (shared, friend, family, acquaintance) Footnote ^ | 15 | 14 | 16 | 43 | 19 | 12 |
| Grew my own or grown for me Footnote * | 5 | 7 | 4 | Footnote # | Footnote # | 6 |
| Illegal purchase (illegal store, website, dealer) Footnote * | 3 | 4 | 3 | 1 | 3 | 3 |
| Other source | 2 | 3 | 2 | # | 2 | 2 |
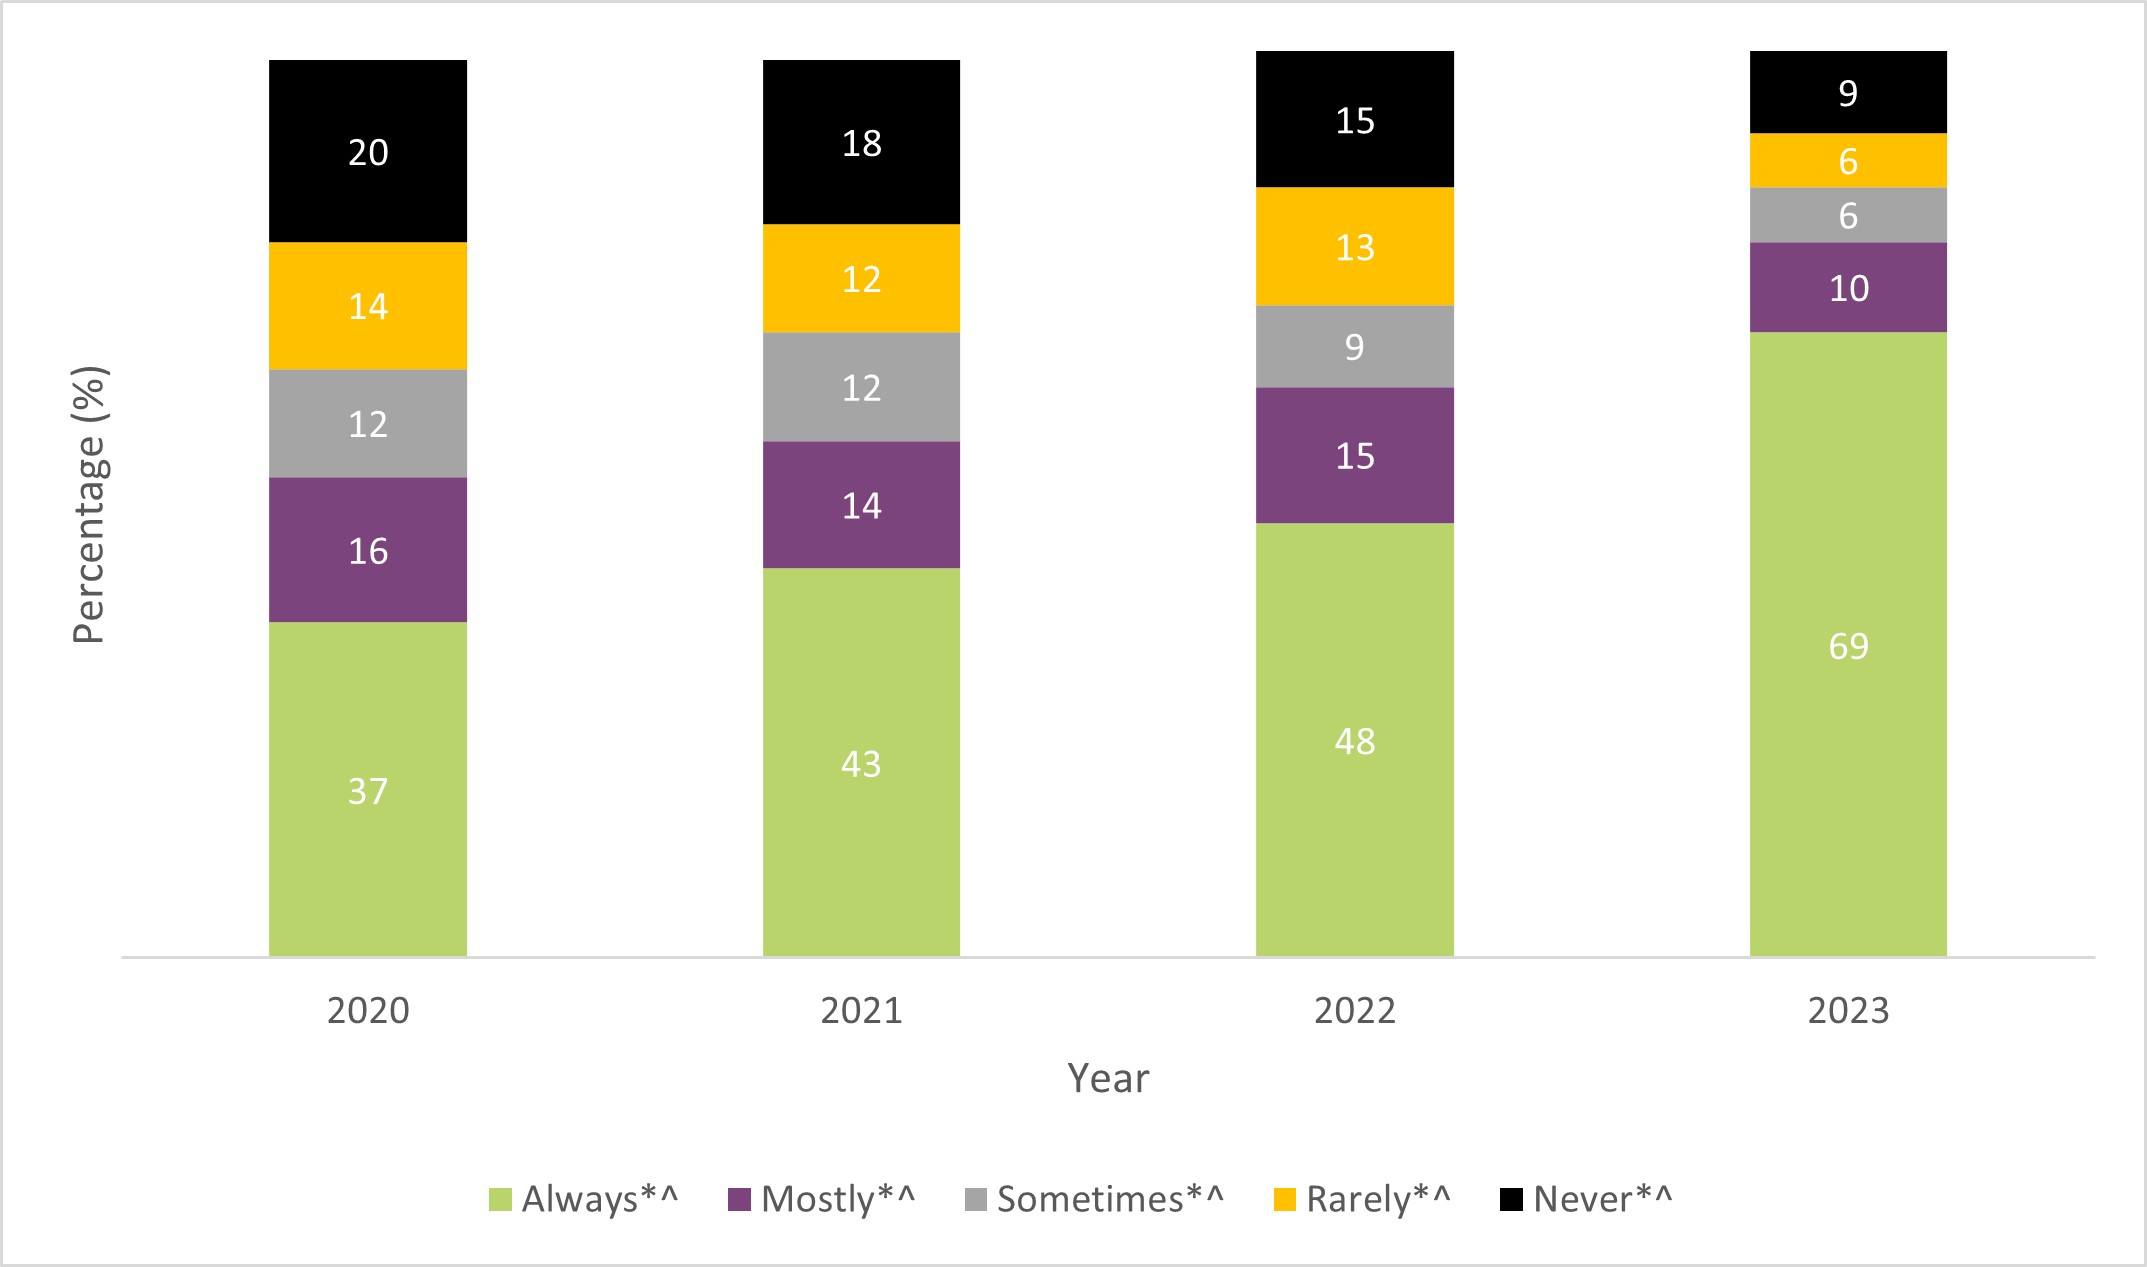
Starting in 2020, those who used cannabis in the past 12 months were asked how often they bought or received any cannabis from legal or licensed sources. In 2023, sixty-nine (69%) reported they 'always' obtain cannabis from a legal or licensed source, 10% responded 'mostly', 6% responded 'sometimes', 6% responded 'rarely', and 9% responded 'never'. The reported frequency of obtaining cannabis from a legal or licensed source has increased over time (Figure 18) and did not differ by sex.
Figure 18: Past 12 months, frequency of obtaining cannabis from a legal or licensed source among people who used cannabis in the past 12 months, 2020 to 2023
- Figure 18 footnote *
-
* Significantly different between 2020 and 2023.
- Figure 18 footnote ^
-
^ Significantly different between 2022 and 2023.
Figure 18 - Text Description
| Frequency | 2020 (%) |
2021 (%) |
2022 (%) |
2023 (%) |
|---|---|---|---|---|
| AlwaysFootnote *,Footnote ^ | 37 | 43 | 48 | 69 |
| MostlyFootnote *,Footnote ^ | 16 | 14 | 15 | 10 |
| SometimesFootnote *,Footnote ^ | 12 | 12 | 9 | 6 |
| RarelyFootnote *,Footnote ^ | 14 | 12 | 13 | 6 |
| NeverFootnote *,Footnote ^ | 20 | 18 | 15 | 9 |
People were also asked to rank which factors most influenced where they usually purchase their cannabis. The most commonly prioritized factors were price (42%), convenience (15%), and strength (9%). The 10 factors with the highest percentage of first priority rankings are shown in Figure 19.
Figure 19: Top 10 factors that most influenced from whom cannabis was obtained, among people who used cannabis in the past 12 months, 2023
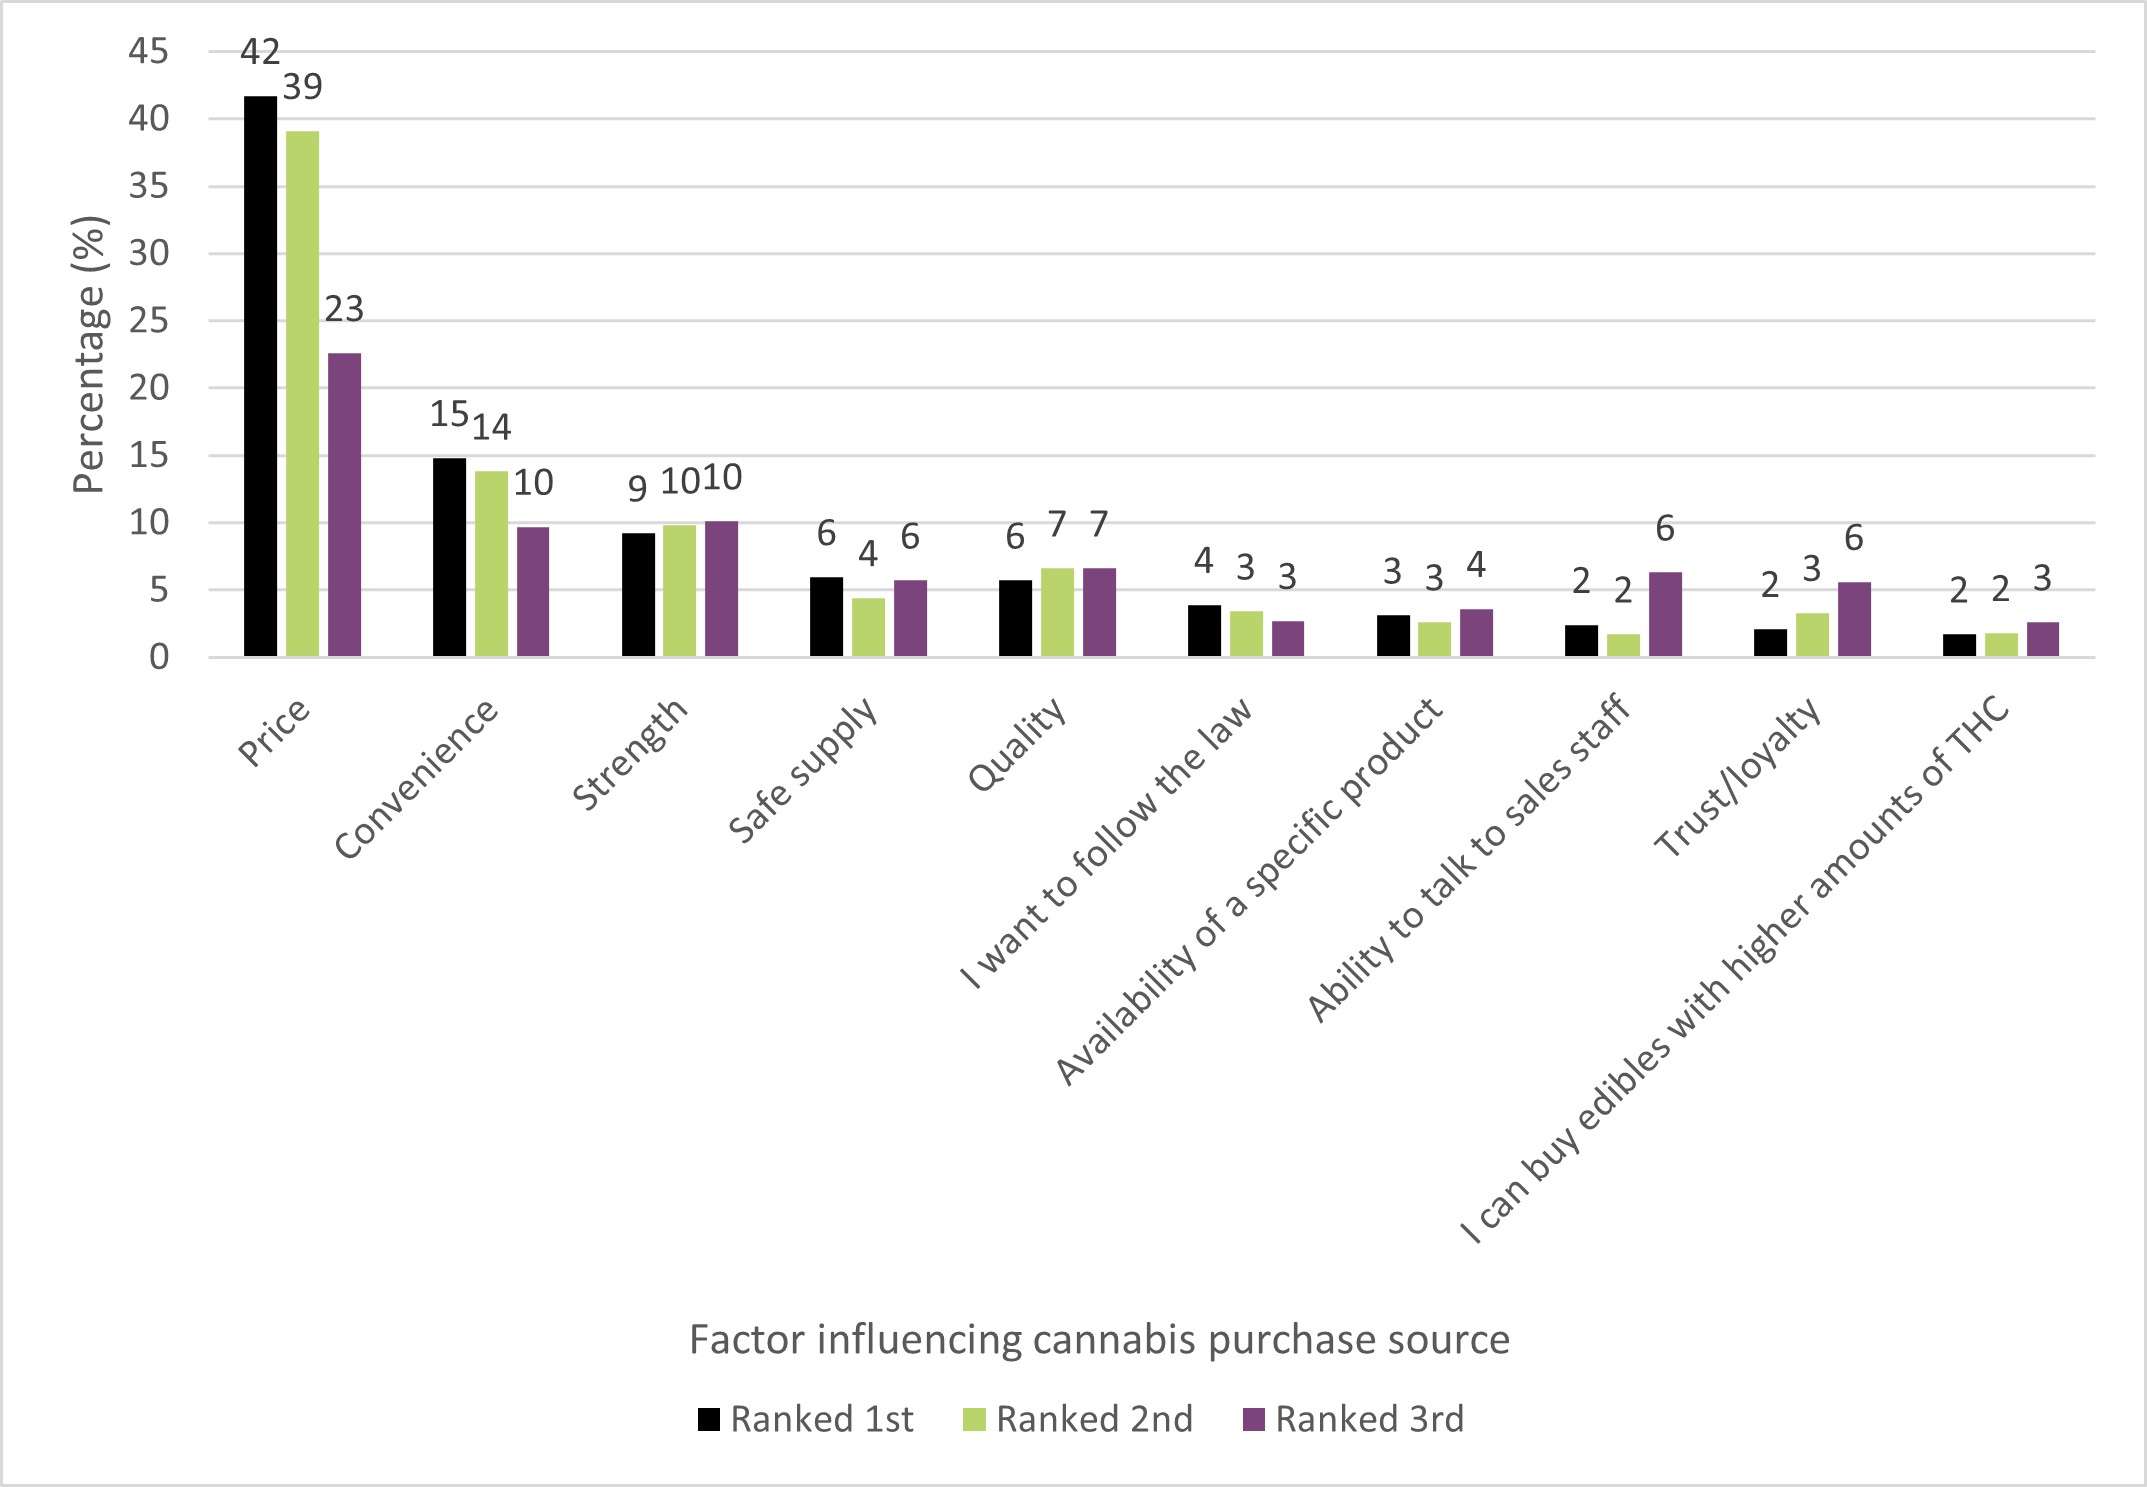
Figure 19 - Text Description
| Factor influencing cannabis purchase source | Ranked 1st (%) |
Ranked 2nd (%) |
Ranked 3rd (%) |
|---|---|---|---|
| Price | 42 | 39 | 23 |
| Convenience | 15 | 14 | 10 |
| Strength | 9 | 10 | 10 |
| Safe supply | 6 | 4 | 6 |
| Quality | 6 | 7 | 7 |
| I want to follow the law | 4 | 3 | 3 |
| Availability of a specific product | 3 | 3 | 4 |
| Ability to talk to sales staff | 2 | 2 | 6 |
| Trust or loyalty | 2 | 3 | 6 |
| I can buy edibles with higher amounts of THC | 2 | 2 | 3 |
Average amount spent on cannabis each month
People who used cannabis in the past 12 months indicated typically spending close to $63 on cannabis products each month, a decrease from $73 in 2018. On average, females reported spending less on cannabis than males ($58 vs. $68 per month).
Since 2020, Canadians were also asked about their spending at legal or illegal sources in a month. People reported spending approximately $54 to obtain cannabis from legal sources (a decrease from $65 in 2022), and $8 from illegal sources (a decrease from $47 in 2020 and from $19 in 2022). From 2020 to 2022, people who used cannabis in the past 30 days were asked about their spending in the past 30 days. In 2023, the question was changed and asked people who used in the past 12 months what they spend in an average month. This change could have contributed to the decrease however, spending at illegal sources has been on a downward trend since 2020.
Cannabis products bought or received, and at what frequency
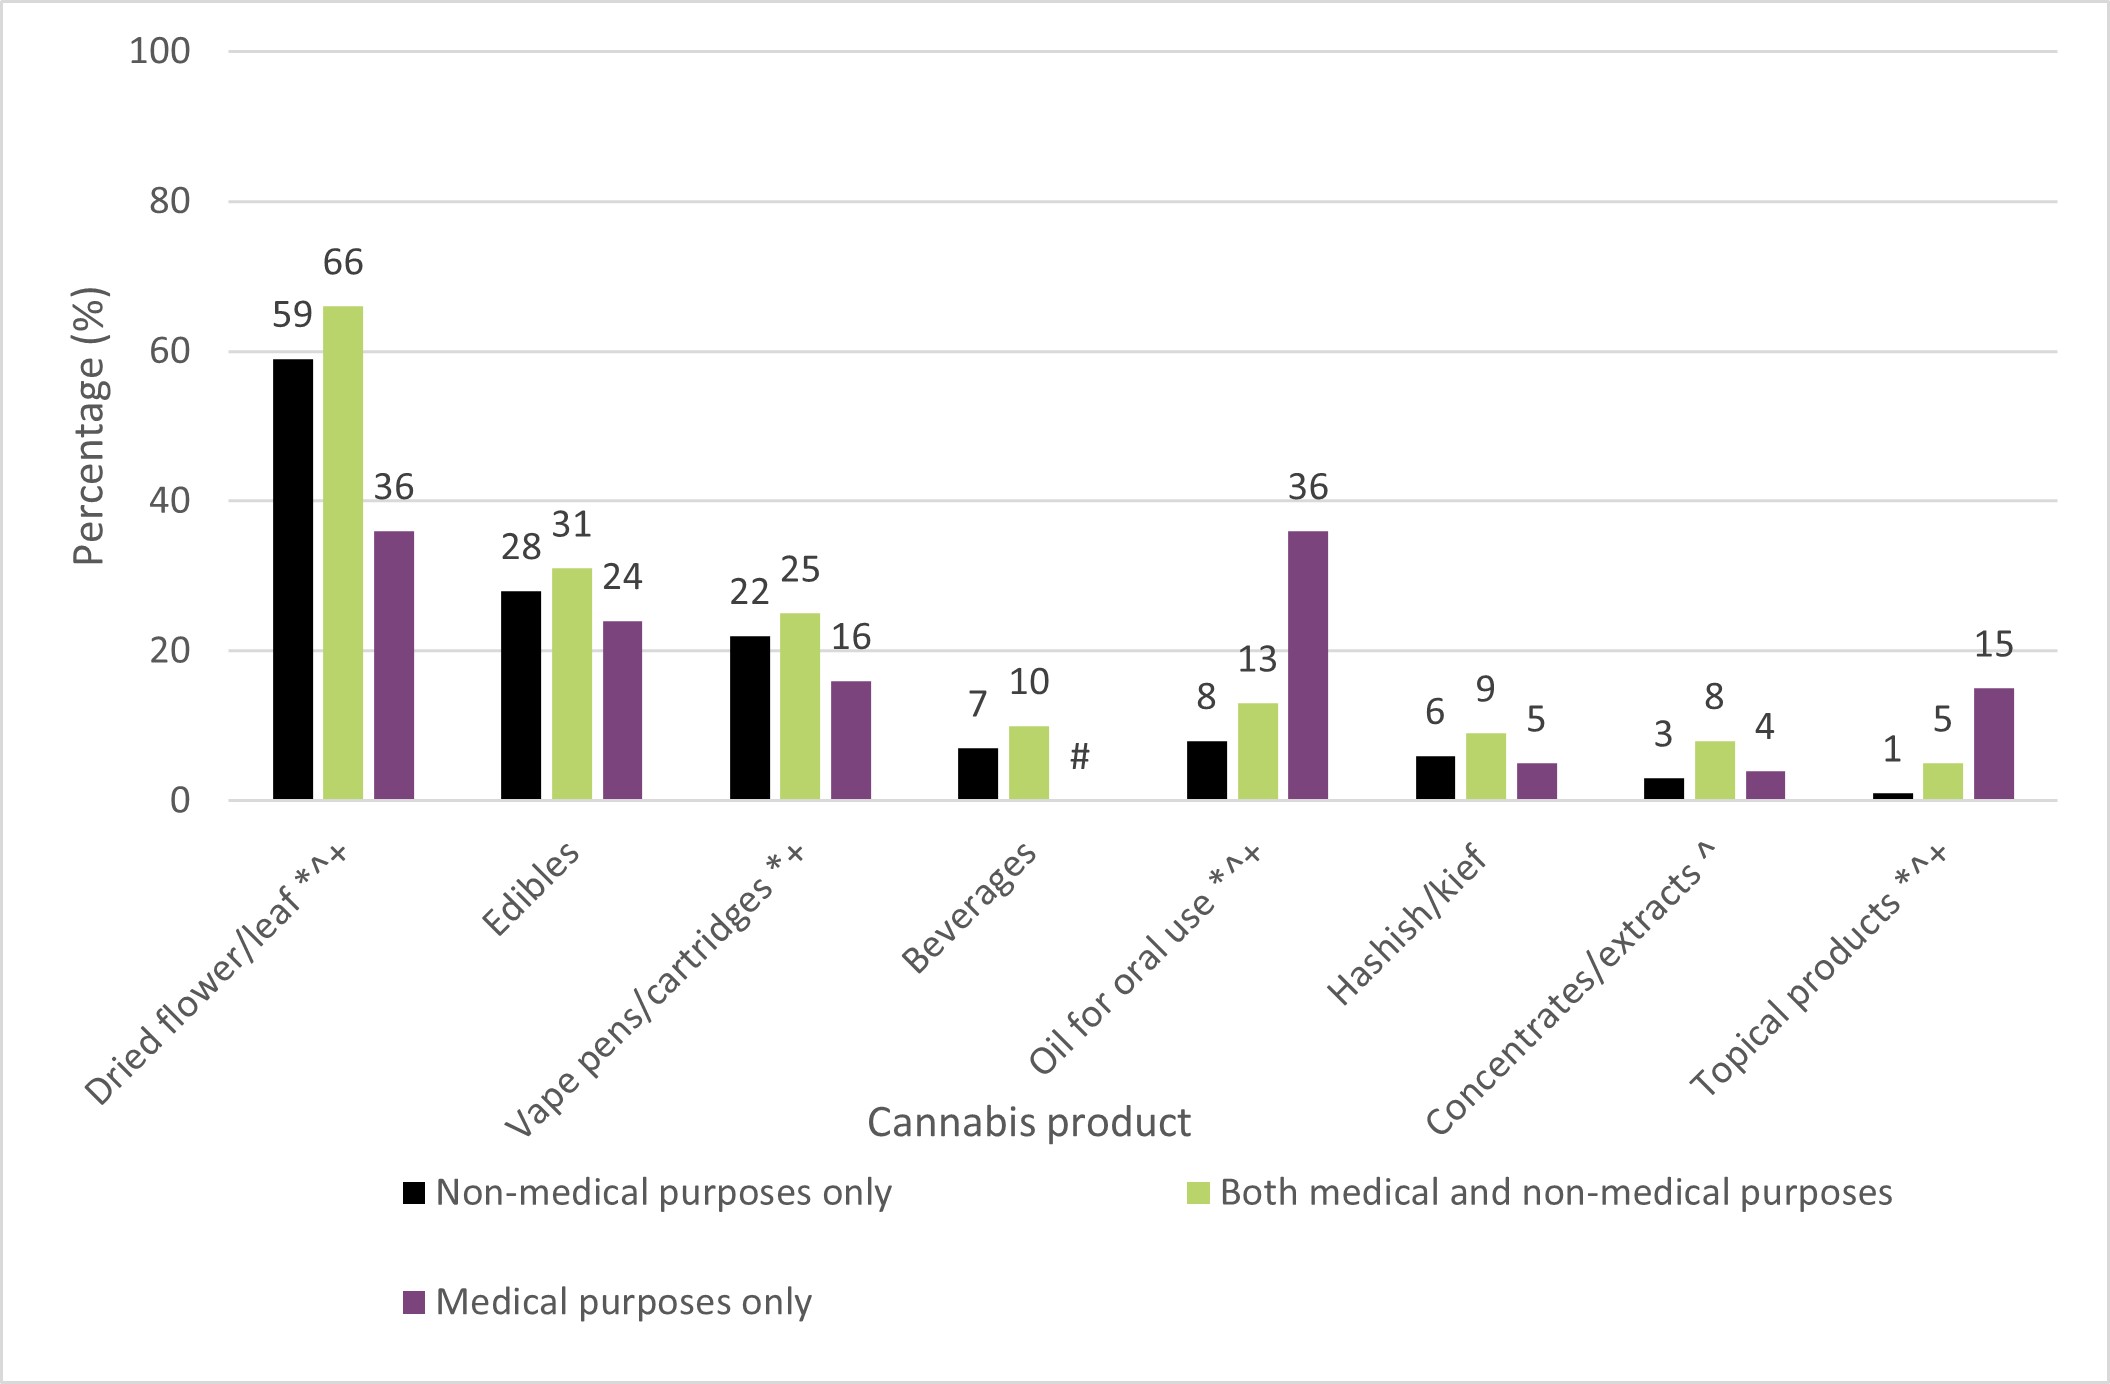
People who used cannabis in the past 30 days were asked about the cannabis products they bought or received and the frequency at which cannabis was obtained. People could select more than one product. Changes in products obtained since 2018 are shown in Figure 20. The most common response selected was buying or receiving dried flower or leaf (58%, down from 2018 and 2022), followed by edible cannabis (28%, up from 2018), vape pens (22%, up from 2018), and cannabis oil for oral use (13%, unchanged from 2018 and 2022). Less commonly obtained products included hashish or kief (7%, down from 2018), concentrates or extracts (5%, down from 2018 and 2022), cannabis beverages (7%, up from 2018), and topicals (4%, up from 2018 and 2022). For all products, the most common frequency of obtaining them was 1 day per month.
Note that in 2023, the phrases 'for non-medical purposes' and 'for medical purposes' were removed from these questions; people who had obtained cannabis were asked the same question. For dried flower, vape pens or cartridges, cannabis oil for oral use, and topical products, rates of obtaining these products differed among those who used cannabis for medical versus non-medical purposes only (see Figure 21).
Figure 20: Cannabis products obtainedFigure 20, Footnote 1 among people who used cannabis in the past 30 days, 2018 to 2023
- Figure 20 footnote 1
-
Multiple response options could be selected.
- Figure 20 footnote +
-
+ Not asked in 2018.
- Figure 20 footnote *
-
* Significant difference between 2018 and 2023.
- Figure 20 footnote #
-
# Significant difference between 2019 and 2023.
- Figure 20 footnote ^
-
^ Significant difference between 2022 and 2023.
Figure 20 - Text Description
| Product | 2018 (%) |
2019 (%) |
2020 (%) |
2021 (%) |
2022 (%) |
2023 (%) |
|---|---|---|---|---|---|---|
| Dried flower or leaf Note de bas de page *,Note de bas de page ^ | 87 | 83 | 71 | 66 | 65 | 68 |
| Edibles Note de bas de page * | 22 | 20 | 27 | 30 | 29 | 28 |
| Vape pens or cartridges Note de bas de page * | 8 | 10 | 11 | 18 | 22 | 22 |
| Beverages Note de bas de page * | 1 | 1 | 3 | 7 | 8 | 7 |
| Oil for oral use Note de bas de page *+,Note de bas de page #,Note de bas de page ^ | n/a | 11 | 12 | 14 | 11 | 13 |
| Hashish or kief Note de bas de page * | 11 | 9 | 7 | 8 | 8 | 7 |
| Concentrates or extracts Note de bas de page * | 10 | 9 | 6 | 7 | 6 | 6 |
| Topical products Note de bas de page *+,Note de bas de page #,Note de bas de page ^ | n/a | 2 | 2 | 4 | 2 | 4 |
Figure 21: Cannabis products obtainedFigure 21, Footnote 1 among those who had used cannabis in the past 30 days, by reason for use, 2023
- Figure 21 footnote 1
-
Multiple response options could be selected.
- Figure 21 footnote *
-
* Significant difference between non-medical purposes only and medical purposes only.
- Figure 21 footnote ^
-
^ Significant difference between non-medical purposes only and both.
- Figure 21 footnote +
-
+ Significant difference between medical purposes only and both.
- Figure 21 footnote #
-
# Supressed due to small sample and/or high variability.
Figure 21 - Text Description
| Product | Non-medical purposes only (%) |
Both medical and non-medical purposes (%) |
Medical purposes only (%) |
|---|---|---|---|
| Dried flower or leafFootnote *,Footnote ^,Footnote + | 59 | 66 | 36 |
| Edibles | 28 | 31 | 24 |
| Vape pens or cartridges Footnote *,Footnote + | 22 | 25 | 16 |
| Beverages | 7 | 10 | Footnote # |
| Oil for oral use Footnote *,Footnote ^,Footnote + | 8 | 13 | 36 |
| Hashish or kief | 6 | 9 | 5 |
| Concentrates or extracts Footnote ^ | 3 | 8 | 4 |
| Topical products Footnote *,Footnote ^,Footnote + | 1 | 5 | 15 |
The average amount obtained in the past 30 days varied by product type. On average, people who used cannabis in the past 30 days purchased or received 18 grams of dried flower or leaf, 8 servings of edibles (up from 2018), 1.3 cannabis cartridges or vape pens, 18 millilitres of cannabis oil for oral use, 3 beverages, 6 grams of concentrate, and 59 grams of topical lotions.
Average price per unit of purchases, by product type
People who purchased cannabis in the past 30 days reported the average price paid per unit, by product type. Over the past 30 days, people spent the most on cannabis cartridges or vape pens ($38.00 per cartridge, down from 2018) and concentrates and extracts ($31.98 per gram). The average price per unit for more frequently used product types was $8.14 per gram of dried flower or leaf and $5.35 per serving of edible cannabis (down from 2018). Note those who reported not paying and those who reported a value above the 99th percentile were excluded for the average price per unit.
Proportion of people who use cannabis and receive cannabis products for free
Of the Canadians who obtained cannabis in the past 30 days, some reported receiving cannabis products for free. Overall, 13% of Canadians obtained edible cannabis for free (down from 2018) and 12% obtained dried flower or leaf for free. Nine percent (9%) reported obtaining cannabis vape pens or cartridges for free.
Assessment of potentially problematic cannabis use
To examine potentially problematic use of cannabis, Canadians were asked if they had ever felt they needed or had ever received professional help for their cannabis use. They were also asked to complete 2 screening tools which were used to assess potentially problematic cannabis use. Females were also asked about use during pregnancy or while breastfeeding.
Professional help for cannabis use
Only 5% of people who had used cannabis more than once in their lifetime reported they felt they ever needed professional help (such as treatment or counselling) for their cannabis use (up from 4% in from 2018), and 2% had ever received professional help (unchanged from 2018).
Alcohol, Smoking and Substance Involvement Screening Test
People who had used cannabis in the past 3 or 12 months were asked a series of questions about their cannabis use, taken from the World Health Organization's Alcohol, Smoking and Substance Involvement Screening Test (ASSIST). Based on the results of the test, people who use substances are scored according to their apparent need for intervention ('no intervention', 'brief intervention' or 'more intensive intervention'). Only 3% of people who had used cannabis in the past 12 months scored in the category 'more intensive intervention needed', unchanged from 2018. This was higher among those who used for both medical and non-medical purposes (5%) than for non-medical purposes only (3%). The percentage among those who used for medical purposes only was unreportable due to small cell counts that did not allow for an estimate.
Severity of Dependence Scale
New in 2023, people who had used cannabis in the past 12 months were also asked a series of questions about how they feel about their cannabis use, taken from the Severity of Dependence Scale (SDS). The SDS was added to the survey as an alternative measure of potential problematic cannabis use. This was done as this scale does not include a question on frequency of use which is a criticism of many tools, especially when assessing people who are using cannabis for medical purposes. Additionally, the ASSIST tool used in past cycles has a large range for the 'brief intervention" category and those at the high end of that range may have impaired control.
People scoring 4 or higher on the SDS were considered to have 'impaired control' with regard to their cannabis use. Among Canadians who used cannabis in the past 12 months, 11% were considered to have impaired control. This was higher among those who used for both medical and non-medical purposes (16%) or non-medical purposes only (11%) than for medical purposes only (6%).
Pregnancy and breastfeeding
Starting in 2018, females aged 16 to 50 who had given birth in the past 5 years were asked about cannabis use during their last pregnancy. Overall, 93% did not use cannabis once they learned they were pregnant with their last child. Among those who breastfed, 91% did not use cannabis while breastfeeding their last child. The percentage reporting cannabis use while pregnant or breastfeeding has remained under 10% since 2018.
Other outcomes
Accidental consumption of cannabis in the home
Starting in 2022, Canadians were asked if anyone or any pets in their household had accidentally consumed cannabis (for example, eating or drinking something without knowing it contained cannabis). In 2023, 1% reported that accidental consumption had occurred, unchanged from 2022. Of those who reported accidental consumption in the home, 53% said it involved a pet, 25% said it involved themselves, and 21% said it involved an adult (multiple responses were allowed). Rates of accidental consumption among teenagers and children under 13 years old were not reportable due to small counts that did not allow for an estimate.
Adverse reactions
Starting in 2023, Canadians who had used cannabis in the past 12 months were asked if they had adverse or negative health effects from cannabis use. Seventy percent (70%) reported that they had experienced no adverse or negative health effects. This was higher among those who used for medical purposes only (84%) compared to those who used for non-medical purposes only (68%) and those who used for both purposes (64%). Overall, the top 5 adverse reactions or negative health effects selected were anxiety, panic or rapid heartbeat (14%), drowsiness or lethargy (12%), dissociation or depersonalization (6%), nausea or vomiting (5%), and headache (5%).
Thirty percent (30%) reported having experienced any adverse reaction or negative health effect in the past 12 months, which was higher among those who reported usually selecting THC-predominant products (34%) compared to those who usually selected CBD-predominant products (26%).
Driving and cannabis
People who used cannabis in the past 12 months were asked about their driving habits relative to cannabis use. People were also asked if they had ever been a passenger in a vehicle driven by someone who had consumed cannabis within 2 hours, and for their opinions on cannabis and driving. Note that for these questions, in 2023, respondents were asked about cannabis use in general rather than cannabis for medical and non-medical use separately.
People who operated a vehicle after using cannabis, and at what frequency
People who used cannabis in the past 12 months were asked about driving within 2 hours of smoking or vapourizing cannabis, and about driving within 4 hours of ingesting cannabis.
Twelve percent (12%) reported that they had driven within 2 hours of smoking or vapourizing cannabis in the past 12 months and 8% reported that they had driven within 4 hours of ingesting cannabis in the past 12 months. As shown in Figure 22, 17% of people who had used cannabis in the past 12 months reported driving within 2 hours of smoking or vaping cannabis and/or within 4 hours of ingesting cannabis, a decrease from 27% in 2018. Similar to previous years, a greater percentage of males reported this behaviour than females (19% vs. 14%, respectively) however this sex difference appears to be decreasing.
Figure 22: Past 12 months, driving a vehicle within 2 hours of smoking or vaping cannabis, and/or within 4 hours of ingesting cannabis, among people who used cannabis in the past 12 months, by sex, 2018 to 2023
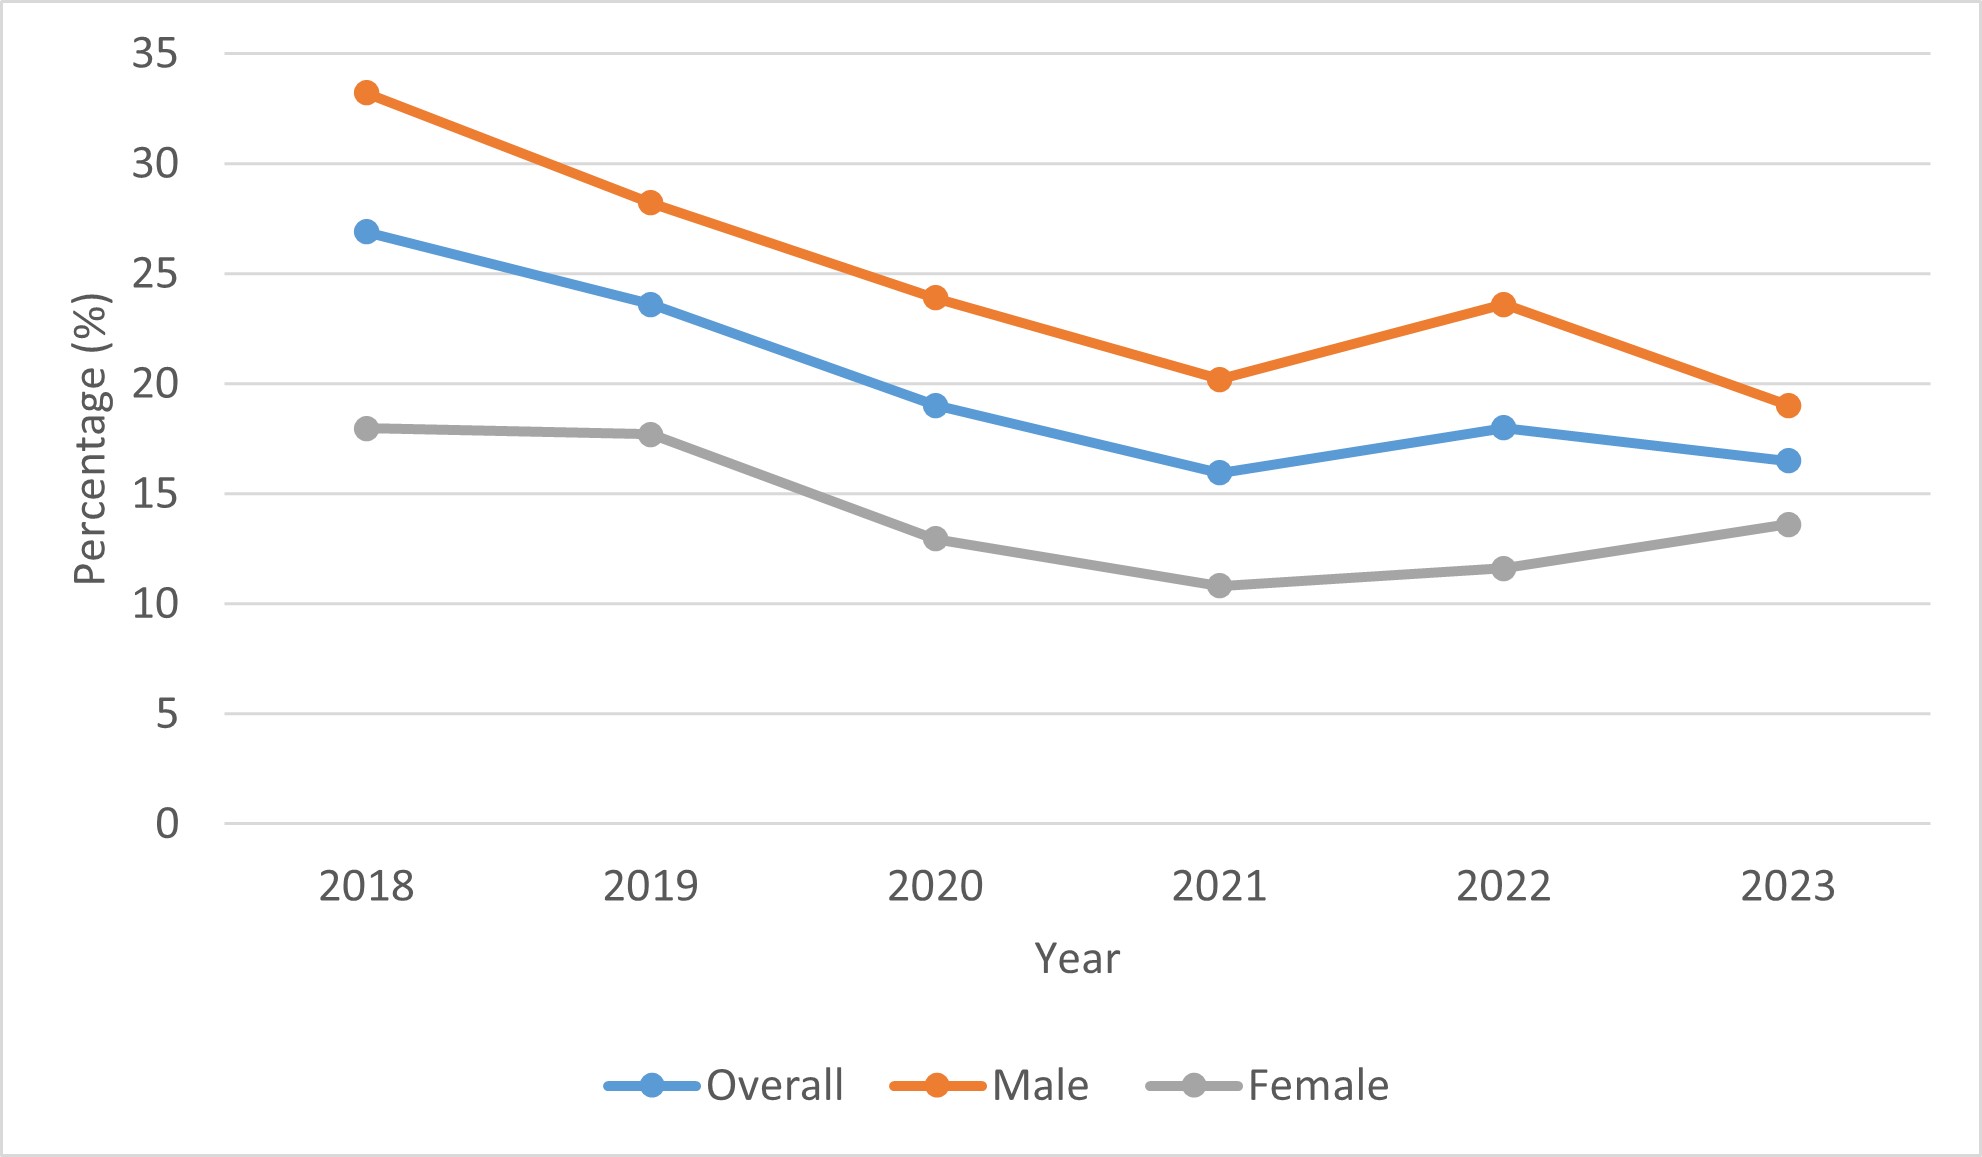
Figure 22 - Text Description
| Sex | 2018 | 2019 | 2020 | 2021 | 2022 | 2023 |
|---|---|---|---|---|---|---|
| Overall (%) | 27 | 24 | 19 | 16 | 18 | 17 |
| Male (%) | 33 | 28 | 24 | 20 | 24 | 319 |
| Female (%) | 16 | 16 | 13 | 11 | 12 | 14 |
People who were passengers in a vehicle driven by someone within 2 hours of using cannabis
Canadians were asked if they had ever been a passenger in a vehicle driven by someone who had used cannabis within the previous 2 hours. As shown in Figure 23, 9% of people reported that they had done so in the past 12 months (down from 13% in 2018). An additional 12% had done so more than 12 months ago, 71% had not done so, and 9% were not sure. In 2023, rates of engaging in this behaviour in the past 12 months did not differ between males and females (both 9%). However, it was more common among those who used cannabis themselves in the past 12 months (24%) compared to those who did not (4%).
Figure 23: Past 12 months, being a passenger in a vehicle with a driver who had used cannabis, all respondents, by sex, 2018 to 2023
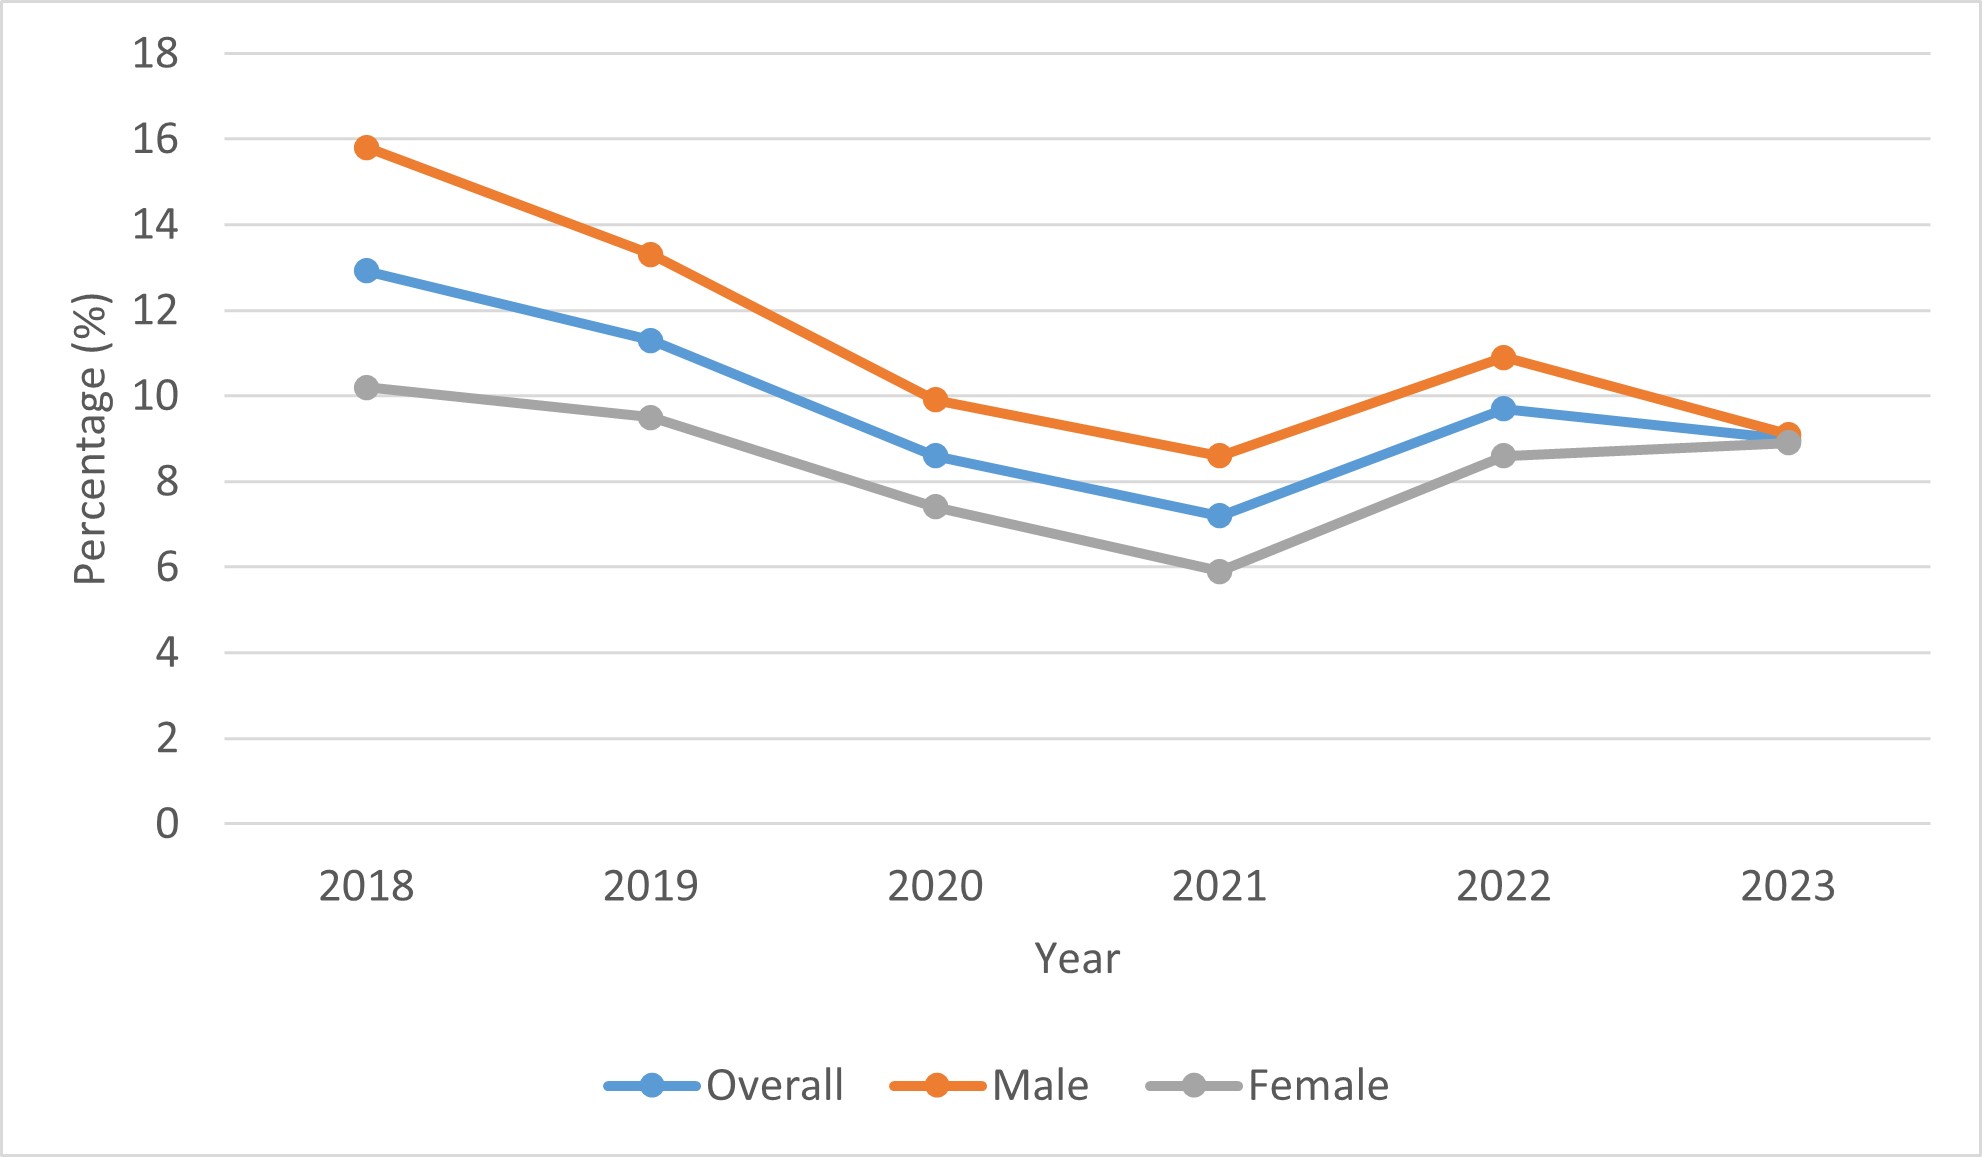
Figure 23 - Text Description
| Sex | 2018 | 2019 | 2020 | 2021 | 2022 | 2023 |
|---|---|---|---|---|---|---|
| Overall (%) | 13 | 11 | 9 | 7 | 10 | 0 |
| Male (%) | 16 | 13 | 10 | 9 | 11 | 9 |
| Female (%) | 10 | 10 | 7 | 6 | 9 | 9 |
Opinions on cannabis use and driving
People were asked whether the use of cannabis impairs one's ability to drive or operate a vehicle. Overall, 86% of people said 'yes', an increase from 2018 (81%) and 2022 (82%). Among those who have used cannabis in the past 12 months, 79% felt that cannabis use impairs one's ability to drive, up from 2018 and 2022 (61% and 76%). Thirteen percent (13%) responded that it depends, down from 2018 (22%) and unchanged from 2022, and 5% responded that it did not impair one's ability to drive, down from both 2018 and 2022 (12% and 7%).
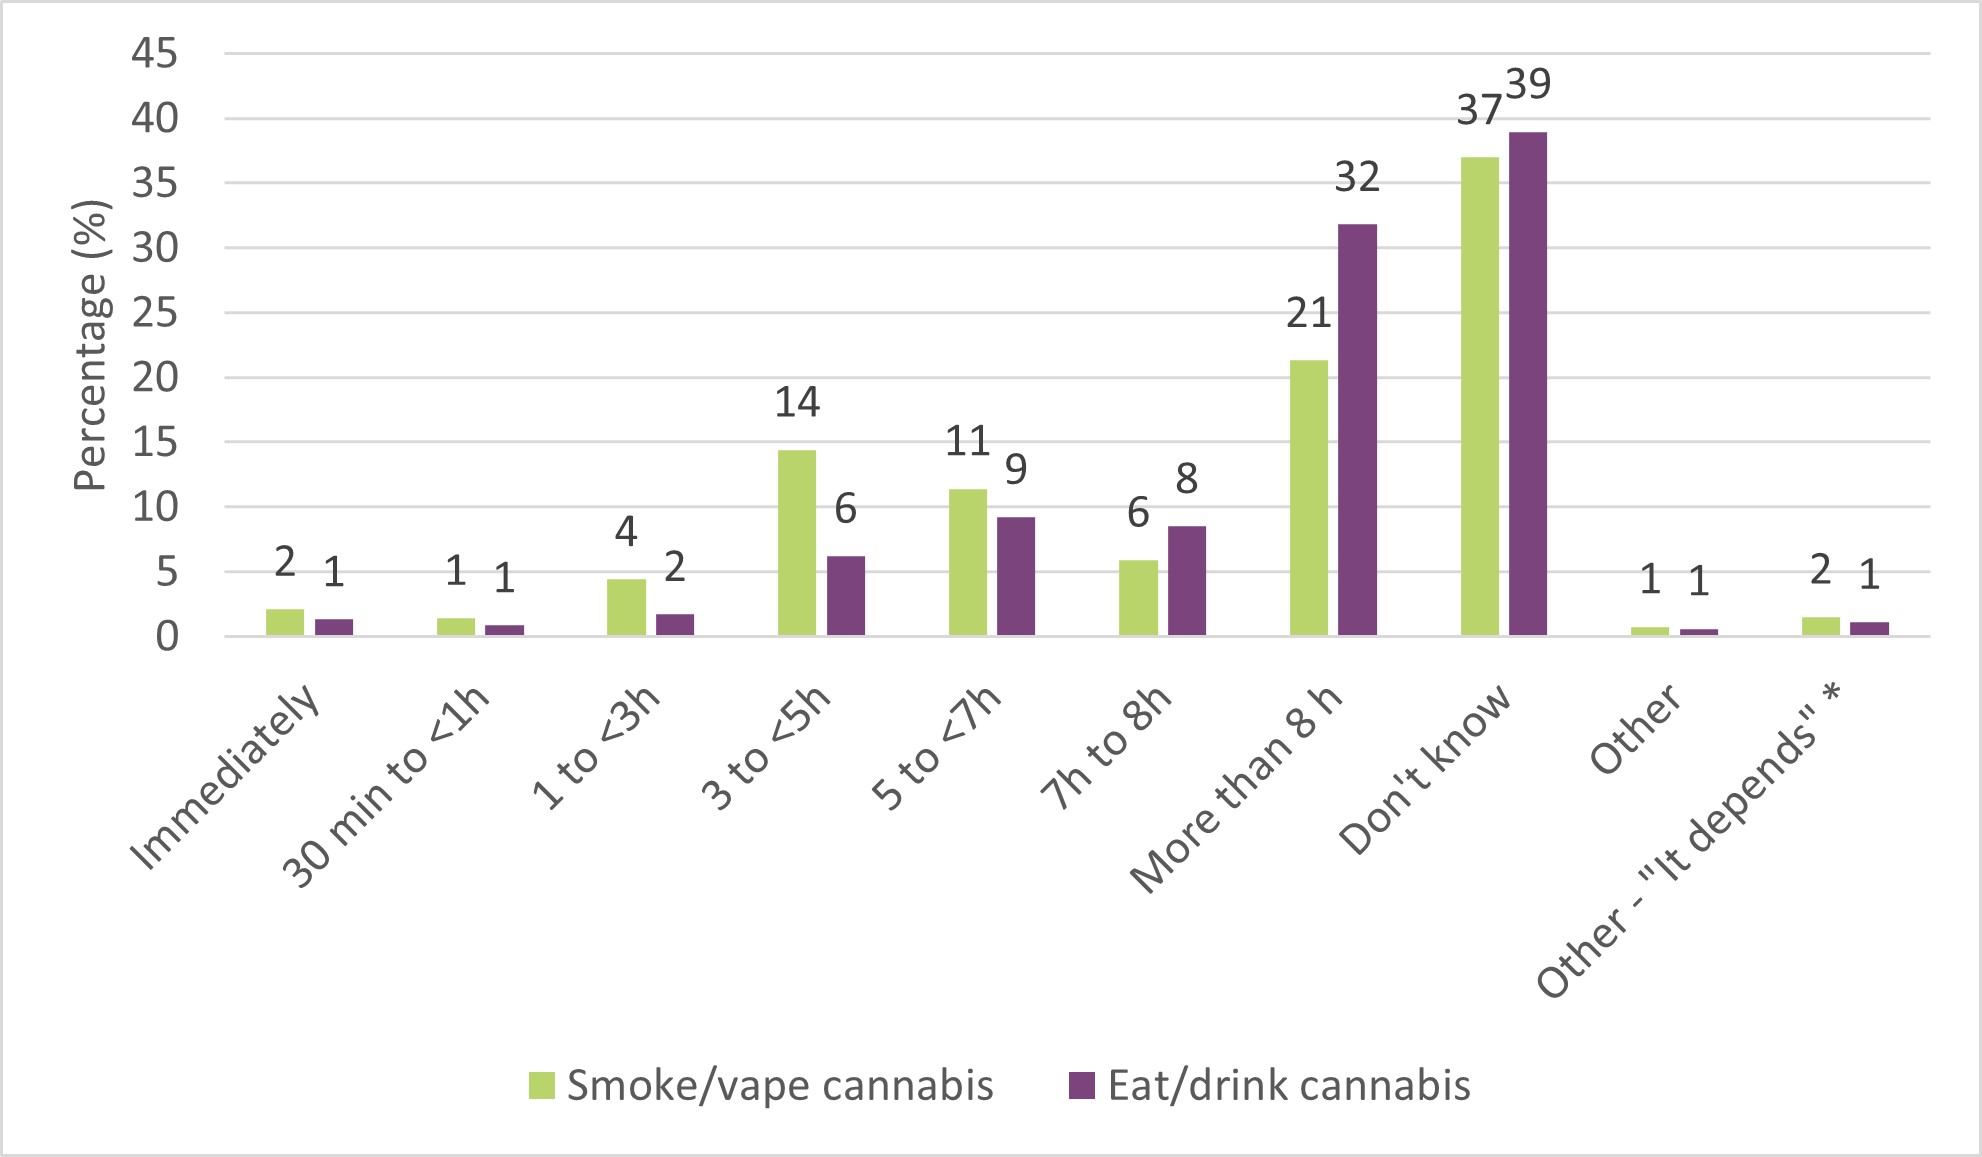
People were also asked their opinion on the time it takes until it is safe to drive after consuming cannabis. They were first asked when it would be safe to drive after inhaling (smoking or vaping) cannabis and then when it would be safe to drive after ingesting (eating or drinking) cannabis. Very few Canadians believed it was safe to drive immediately after inhaling (2%) or ingesting (1%) cannabis. The most common responses were "Don't know" and "More than 8 hours" (Figure 24).
Figure 24: Opinions on when it is safe to drive after consuming cannabis, all respondents
- Figure 24 footnote *
-
* The response "It depends" represents a common response entered in "Other- please specify".
Figure 24 - Text Description
| Time after consuming cannabis | Smoke or vape cannabis (%) |
Eat or drink cannabis (%) |
|---|---|---|
| Immediately | 2 | 1 |
| 30 minutes to 1 hour | 1 | 1 |
| 1 to 3 hours | 4 | 2 |
| 3 to 5 hours | 14 | 6 |
| 5 to 7 hours | 11 | 9 |
| 7 to 8 hours | 6 | 8 |
| More than 8 hours | 21 | 32 |
| Don't know | 37 | 39 |
| Other | 1 | 1 |
| Other - "It depends" Footnote * | 2 | 1 |
Opinions on likelihood of being caught driving under the influence
Canadians were asked how likely they thought it was that a person would be caught by police if they drove under the influence of alcohol or under the influence of cannabis. Likelihood was determined using a 5-point Likert scale, which had the following categories: not at all likely, not likely, somewhat likely, likely, and extremely likely.
Overall, most people thought it was "somewhat likely" that a person would be caught by police if they drove under the influence of alcohol (41%, up from 2018) or cannabis (37%, down from 2018 and 2022). Another 41% (down from 2018 and 2022) of people believed it was "likely" or "extremely likely" that a driver would be caught when driving under the influence of alcohol, compared to less than a quarter (24%, unchanged from 2018 and 2022) for driving under the influence of cannabis.
Cannabis for medical purposes
Cannabis use for medical purposes was defined in the CCS as cannabis used to treat a disease or disorder or improve symptoms. Ten percent (10%) of Canadians aged 16 years and older indicated that they used cannabis for medical purposes, a decrease from both 2018 and 2022 (both 13%). Note that in previous cycles, people who had used cannabis for medical purposes had the option to complete the medical cannabis section of the survey, whereas in 2023, questions on medical cannabis were shown to everyone who used cannabis for medical purposes. This change likely affected response rates for questions on cannabis use for medical purposes.
Starting in 2019, Canadians who had used cannabis for medical purposes were also asked to specify whether this use was with or without a medical document from a healthcare professional authorizing the use of cannabis for medical purposes. Eighteen percent (18%) said they did so with a document from a healthcare professional, down from both 2019 and 2022 (both 27%).
Frequency of cannabis use for medical purposes
People who used cannabis for medical purposes in the past 12 months were asked how often they typically did so. The most common frequency reported was less than 1 day per month (28%), up from 2018 and 2022, followed by daily (27%), down from 2018, and 2 to 3 days per month (15%), unchanged over time (Figure 25).
Figure 25: Frequency of cannabis use for medical purposes in the past 12 months, 2018 to 2023
- Figure 25 footnote *
-
* Significantly different between 2018 and 2023.
- Figure 25 footnote ^
-
^ Significantly different between 2022 and 2023.
Figure 25 - Text Description
| Frequency | 2018 (%) |
2019 (%) |
2020 (%) |
2021 (%) |
2022 (%) |
2023 (%) |
|---|---|---|---|---|---|---|
| Less than 1 day per month Footnote *,Footnote ^ | 15 | 15 | 14 | 19 | 21 | 28 |
| 1 day per month | 5 | 6 | 6 | 5 | 5 | 7 |
| 2 to 3 days per month | 14 | 15 | 16 | 16 | 17 | 15 |
| 1 to 2 days per week | 11 | 11 | 13 | 13 | 10 | 10 |
| 3 to 4 days per week | 10 | 11 | 9 | 10 | 11 | 8 |
| 5 to 6 days per week | 6 | 7 | 8 | 6 | 6 | 5 |
| Daily Footnote * | 37 | 35 | 35 | 32 | 31 | 27 |
Symptoms, diseases and disorders treated by cannabis for medical purposes
Canadians who had used cannabis for medical purposes in the past 12 months were asked which symptoms, diseases or disorders they used cannabis to treat. People could select all that applied. The most common symptoms selected were problems sleeping or insomnia (45%), chronic pain (33%), and anxiety (31%). Figure 26 shows the top 10 symptoms selected; the remaining response options were selected by 10% or fewer people.
Figure 26: : Symptoms, diseases and disorders treated by cannabis, among people who used cannabis for medical purposes in the past 12 months
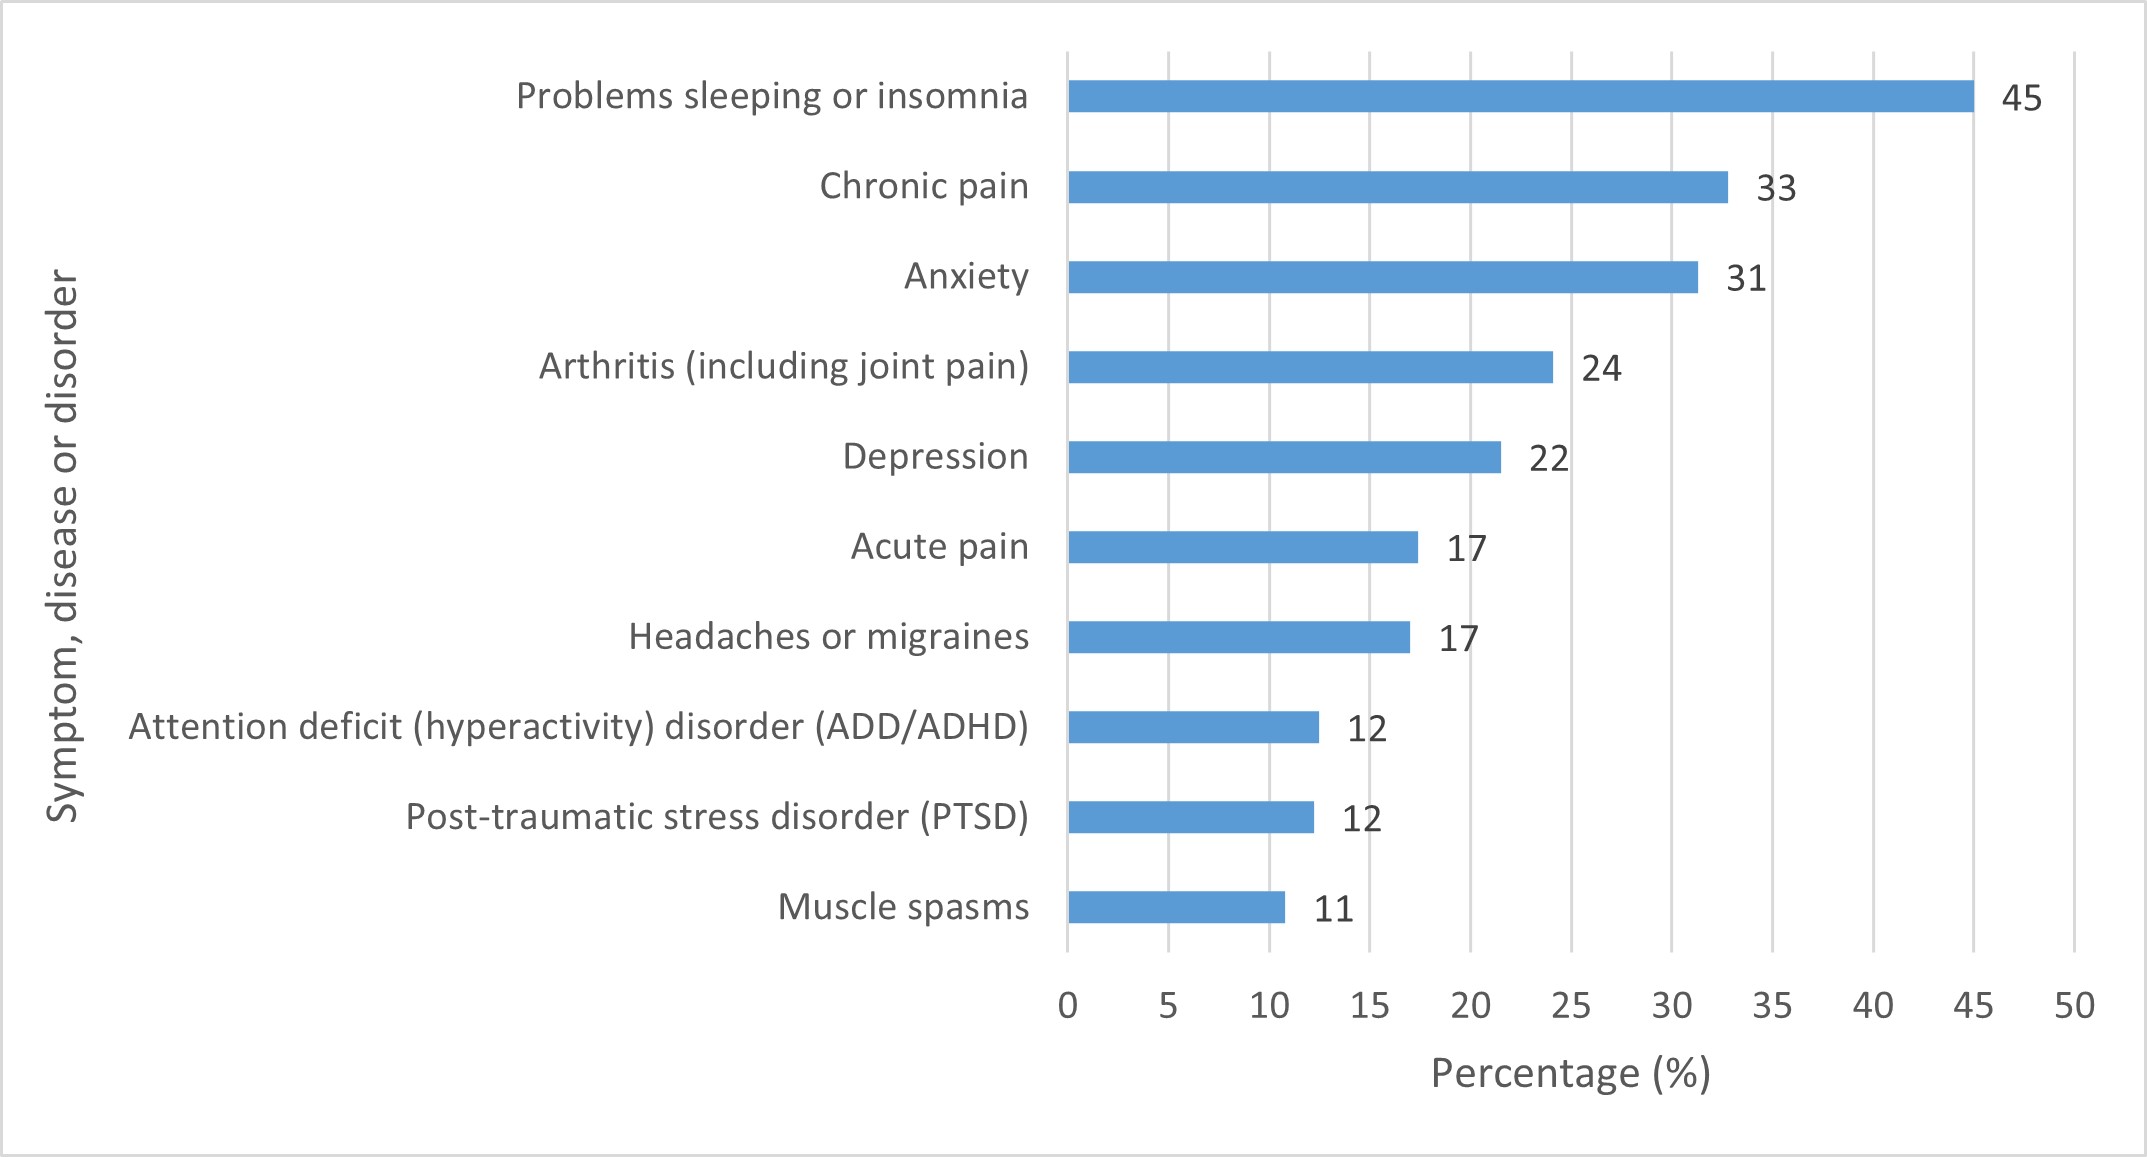
Figure 26 - Text Description
| Symptom, disease or disorder | Percentage (%) |
|---|---|
| Problems sleeping or insomnia | 45 |
| Chronic pain | 33 |
| Anxiety | 31 |
| Arthritis (including joint pain) | 24 |
| Depression | 22 |
| Acute pain | 17 |
| Headaches or migraines | 17 |
| Attention deficit (hyperactivity) disorder (ADD/ADHD) | 12 |
| Post-traumatic stress disorder (PTSD) | 12 |
| Muscle spasms | 11 |
Changes in use of other medications
Canadians who had used cannabis for medical purposes in the past 12 months were asked if cannabis use for medical purposes allowed them to decrease their use of other medications. Forty-four percent (44%) reported that cannabis use helped decrease their use of other medications, a decrease from both 2018 (68%) and 2022 (53%). Over a quarter (28%) reported that cannabis did not help them decrease their use of other medications, and 27% reported that the question was not applicable.
People who reported that their cannabis use for medical purposes allowed them to reduce the use of other medications were asked which medications they had been able to reduce. The five most common medications selected were non-opioid pain relievers such as acetaminophen (56%); anti-inflammatories such as ibuprofen (54%); opioid pain relievers (26%); sedatives (23%); and anti-depressants (16%).
Methods
The CCS uses a 2-step recruitment process. First, respondents are recruited by phone (landline or mobile) from lists of random telephone numbers. Respondents who pass a set of screening questions are then sent a link to an online survey, either by email or short message service (SMS) to their mobile phones. The average time to fill out the 2023 CCS was 25 minutes for respondents who reported using cannabis within the past 12 months and 14 minutes for respondents who reported that they had not used cannabis.
This summary presents survey findings from the 7th data collection cycle, which started May 2nd, 2023 and ended July 20th, 2023. Survey findings were weighted by province and territories, age groups, and sex at birth. Survey results are based on responses from 11,690 respondents aged 16 years and older across all provinces and territories. For additional details refer to the Methodological report published on the Library and Archives Canada website.
The CCS was designed to obtain a sufficient number of respondents from key sub-populations. To ensure statistical relevance of results and representativeness, minimum sample sizes were determined and met for these sub-populations. Of the responses received, approximately 3,160 were from people who indicated that they had used cannabis in the past 12 months for either non-medical or medical purposes. Table 1 summarizes the sample size represented by the survey.
| Province | Females | Males | 16-19 years | 20-24 years | 25 years or older |
Total |
|---|---|---|---|---|---|---|
| Canada | 6,010 | 5,680 | 732 | 1,401 | 9,557 | 11,690 |
| Newfoundland and Labrador | 235 | 177 | 23 | 31 | 358 | 412 |
| Prince Edward Island | 217 | 191 | 17 | 30 | 361 | 408 |
| Nova Scotia | 246 | 242 | 30 | 48 | 410 | 488 |
| New Brunswick | 244 | 233 | 18 | 46 | 413 | 477 |
| Quebec | 1,323 | 1,118 | 108 | 317 | 2,016 | 2,441 |
| Ontario | 1,586 | 1,616 | 262 | 562 | 2,378 | 3,202 |
| Manitoba | 249 | 243 | 27 | 35 | 430 | 492 |
| Saskatchewan | 291 | 268 | 37 | 50 | 472 | 559 |
| Alberta | 706 | 697 | 91 | 135 | 1,177 | 1,403 |
| British Columbia | 782 | 781 | 108 | 138 | 1,317 | 1,563 |
| TerritoriesTable 1 footnote 1 | 131 | 114 | 11 | 9 | 225 | 245 |
Considerations
When recruited, respondents were informed that the survey was about cannabis. This information may have created a participation bias in that those who use cannabis may have been more likely to complete the survey. For this and other methodological reasons, the CCS may provide prevalence estimates for cannabis use that are higher than other Canadian population-level surveys.
In 2023, the phrases 'for non-medical purposes' and 'for medical purposes' were removed from several survey questions; people who had used cannabis for any purpose in the past 12 months were asked the same questions. This served to significantly shorten the survey while still allowing responses to be disaggregated by cannabis use.
Health Canada monitors the prevalence of cannabis use among Canadians using several population surveys, including the Canadian Alcohol and Drugs Survey (CADS), the Canadian Community Health Survey (CCHS), and the Canadian Student Tobacco, Alcohol and Drugs Survey (CSTADS). CADS 2019 indicates that 21% of Canadians age 15 and older (or 6.4 million) had used cannabis in the previous 12 months (22% among age 15 to 19 years; 45% among age 20 to 24 years; and 19% among age 25 years and older). CCHS 2021 similarly indicates that 22% of Canadians aged 15 and older (or 6.8 million) had reported cannabis use in the previous 12 months. CSTADS 2021/22 indicates that 18% of students in grades 7 to 12 (approximately 383,000) had used cannabis in the previous 12 months.