
Cannabis topicals data: Production, inventory and sales
This page has been archived on the Web
Updated information can be found on Cannabis data overview: Inventory, sales and licensed area. Information identified as archived is provided for reference, research or recordkeeping purposes.
Definitions
- Cannabis topicals
- Products that include cannabis as an ingredient and that are intended for use on external body surfaces such as skin, hair, or nails.
- Packaged inventory
- Cannabis held in stock by a cultivator, processor, distributor, or retailer that is packaged for sale to consumers at the retail level.
- Packaged production
- The number of cannabis products resulting from unpackaged cannabis being placed into final packaging for sale to consumers at the retail level during the reporting period.
- Sales (medical)
- Cannabis products sold directly to medical clients by holders of a federal licence for medical sales.
- Sales (non-medical)
- Cannabis products sold directly in the Canadian retail market, online or in-person, by a provincially or territorially authorized distributor or retailer, for non-medical purposes.
The data on this page is also available on Open Government.
Cannabis topicals data
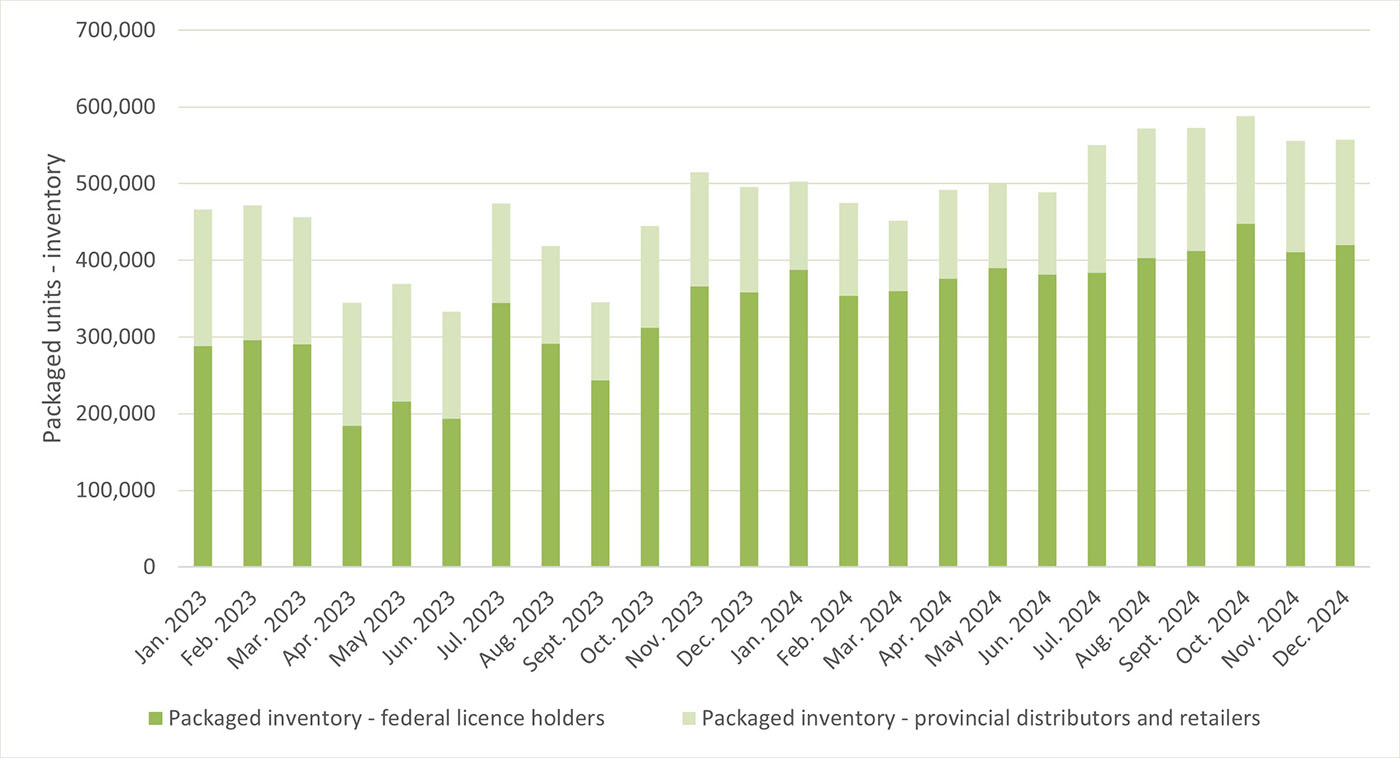
The data presented in this figure is available in Table 1.
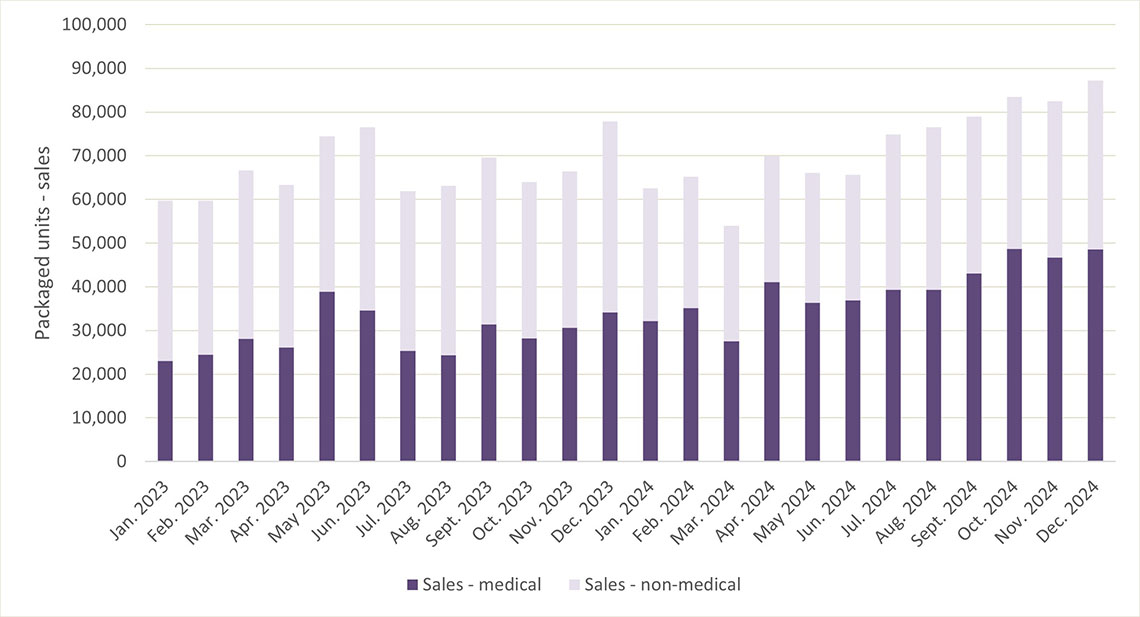
The data presented in this figure is available in Table 1.
| Year-Month | Packaged production | Packaged inventory | Sales | ||
|---|---|---|---|---|---|
| Federal licence holders | Provincial distributors and retailers | Medical | Non-Medical | ||
| 2024-12 | 140,757 | 420,420 | 136,865 | 48,602 | 38,569 |
| 2024-11 | 91,850 | 410,545 | 145,160 | 46,707 | 35,762 |
| 2024-10 | 79,307 | 447,795 | 139,980 | 48,664 | 34,752 |
| 2024-09 | 98,531 | 412,156 | 160,528 | 43,032 | 35,956 |
| 2024-08 | 142,281 | 403,598 | 168,064 | 39,307 | 37,241 |
| 2024-07 | 72,323 | 384,337 | 166,020 | 39,311 | 35,608 |
| 2024-06 | 80,495 | 381,783 | 106,668 | 36,961 | 28,690 |
| 2024-05 | 102,759 | 390,070 | 111,365 | 36,348 | 29,766 |
| 2024-04 | 104,927 | 376,548 | 115,306 | 41,074 | 28,849 |
| 2024-03 | 84,762 | 360,148 | 91,757 | 27,516 | 26,441 |
| 2024-02 | 77,413 | 354,290 | 120,309 | 35,200 | 30,035 |
| 2024-01 | 197,743 | 388,043 | 114,496 | 32,227 | 30,284 |
| 2023-12 | 87,220 | 358,546 | 137,060 | 34,149 | 43,729 |
| 2023-11 | 91,953 | 366,132 | 148,769 | 30,621 | 35,787 |
| 2023-10 | 67,575 | 312,356 | 132,402 | 28,215 | 35,812 |
| 2023-09 | 78,733 | 243,395 | 102,014 | 31,408 | 38,174 |
| 2023-08 | 60,927 | 291,614 | 127,019 | 24,327 | 38,831 |
| 2023-07 | 59,813 | 344,746 | 129,481 | 25,351 | 36,574 |
| 2023-06 | 46,045 | 193,836 | 139,602 | 34,643 | 41,921 |
| 2023-05 | 77,425 | 215,640 | 153,827 | 38,852 | 35,584 |
| 2023-04 | 59,589 | 184,170 | 160,614 | 26,165 | 37,107 |
| 2023-03 | 69,233 | 290,818 | 165,741 | 28,115 | 38,552 |
| 2023-02 | 72,203 | 295,835 | 176,078 | 24,425 | 35,297 |
| 2023-01 | 74,406 | 288,258 | 177,982 | 22,993 | 36,678 |
| 2022-12 | 87,220 | 318,170 | 190,972 | 24,148 | 56,901 |
| 2022-11 | 91,947 | 322,341 | 191,830 | 20,199 | 37,301 |
| 2022-10 | 67,576 | 323,713 | 192,035 | 15,505 | 36,391 |
| 2022-09 | 57,164 | 310,166 | 208,352 | 16,174 | 33,437 |
| 2022-08 | 55,890 | 299,935 | 223,108 | 13,243 | 40,509 |
| 2022-07 | 67,995 | 274,972 | 244,537 | 12,780 | 41,906 |
| 2022-06 | 72,002 | 292,235 | 240,688 | 13,392 | 44,270 |
| 2022-05 | 102,584 | 295,026 | 240,512 | 13,420 | 37,383 |
| 2022-04 | 59,831 | 266,818 | 258,026 | 12,616 | 36,216 |
| 2019-10 | 0 | 187 | 0 | 0 | 0 |
| 2019-11 | 0 | 10 | 1,095 | 0 | 0 |
| 2019-12 | 0 | 10 | 4,670 | 6 | 328 |
| 2020-01 | 0 | 10 | 4.443 | 0 | 279 |
| 2020-02 | 3,170 | 3,180 | 920 | 0 | 313 |
| 2020-03 | 32,458 | 23,536 | 2,798 | 0 | 202 |
| 2020-04 | 11,872 | 5,341 | 31,776 | 165 | 1,736 |
| 2020-05 | 45,791 | 24,402 | 24,690 | 237 | 6,068 |
| 2020-06 | 28,483 | 11,924 | 50,342 | 317 | 7,874 |
| 2020-07 | 44,336 | 25,242 | 56,222 | 415 | 10,030 |
| 2020-08 | 27,482 | 34,489 | 54,265 | 438 | 10,940 |
| 2020-09 | 35,794 | 29,107 | 69,625 | 553 | 11,003 |
| 2020-10 | 24,851 | 33,457 | 64,633 | 651 | 10,984 |
| 2020-11 | 45,201 | 49,006 | 64,242 | 653 | 9,287 |
| 2020-12 | 51,844 | 45,875 | 77,918 | 628 | 17,273 |
| 2021-01 | 63,687 | 67,189 | 73,378 | 368 | 18,590 |
| 2021-02 | 85,324 | 106,190 | 79,244 | 794 | 18,854 |
| 2021-03 | 150,581 | 209,113 | 113,914 | 3,318 | 23,614 |
| 2021-04 | 112,543 | 234,360 | 154,500 | 4,672 | 26,041 |
| 2021-05 | 119,948 | 298,963 | 145,672 | 5,332 | 28,574 |
| 2021-06 | 94,318 | 207,841 | 185,937 | 4,681 | 24,019 |
| 2021-07 | 80,954 | 311,305 | 202,222 | 5,600 | 28,200 |
| 2021-08 | 68,466 | 317,366 | 212,817 | 6,606 | 32,215 |
| 2021-09 | 73,991 | 320,494 | 209,826 | 7,380 | 32,333 |
| 2021-10 | 70,069 | 338,649 | 207,924 | 9,741 | 33,352 |
| 2021-11 | 101,474 | 285,696 | 253,080 | 12,869 | 33,446 |
| 2021-12 | 65,880 | 272,681 | 275,470 | 13,339 | 52,663 |
| 2022-01 | 78,860 | 236,373 | 286,600 | 12,431 | 33,269 |
| 2022-02 | 66,854 | 238,890 | 279,772 | 11,971 | 34,036 |
| 2022-03 | 96,509 | 279,209 | 273,868 | 14,795 | 35,227 |