
Bisphenol A (BPA) in Canadians
Download the alternative format
(PDF format, 390 KB, 12 pages)
Organization: Health Canada
Date published: 2021-12-14
Information on human biomonitoring of BPA in Canada with results from the Canadian Health Measures Survey.
On this page
Background
What is bisphenol A (BPA)?
BPA (CASRN 80-05-7) is a synthetic chemical used as a monomer to produce certain polycarbonate plastics and epoxy resins.
Where is BPA found?
Polycarbonate plastics and epoxy resins are widely used in consumer products. Examples include food and beverage containers, sporting and safety equipment, electronics, automotive parts and medical devices. BPA is also used in thermal paper coatings for receipts, prescription labels and airline tickets.
How are people exposed to BPA?
People are exposed to BPA mainly by eating food containing it. BPA migrates from food packaging and repeat-use polycarbonate plastic containers. Skin contact from handling thermal printing paper is considered an important secondary route of exposure.
How is BPA measured in people?
BPA is readily absorbed and undergoes extensive metabolism in the body. BPA and its metabolites are commonly measured in urine as total BPA. These measurements reflect recent exposure to BPA.
What are the potential health impacts of BPA?
Potential risks to human health from exposure to BPA include effects on the liver and kidneys. They also include potential effects on reproduction, development, neurodevelopment and behaviour. However, dietary exposure from food packaging is not expected to pose health risks to the general population, including newborns and young children.
What is the Government of Canada doing to lower human exposures to BPA?
BPA is identified as toxic under the Canadian Environmental Protection Act, 1999. Regulations under the Canada Consumer Product Safety Act prohibit the manufacture, advertisement, sale or import of baby bottles containing BPA. The Government of Canada continues to monitor and assess BPA.
Data sources
| Initiative | Target population |
|---|---|
| Canadian Health Measures Survey (CHMS) | General Canadian population living in the 10 provinces |
| First Nations Biomonitoring Initiative (FNBI) | First Nations people living on-reserve south of the 60° parallel |
| Maternal-Infant Research on Environmental Chemicals (MIREC) study | Pregnant women and their infants recruited from obstetric and prenatal clinics in 10 cities across Canada |
| U.S. National Health and Nutrition Examination Survey (NHANES) | General U.S. population |
This fact sheet presents nationally representative data from the CHMS. These data are compared with data from the FNBI, the MIREC study and the U.S. NHANES.
| Collection period | Age range (years) | Matrix | Biomarker |
|---|---|---|---|
| CHMS | |||
| 2007–2009 | 6 to 79 | Urine | Total BPA |
| 2009–2011 | 3 to 79 | Urine | Total BPA |
| 2012–2013 | 3 to 79 | Urine | Total BPA |
| 2014–2015 | 3 to 79 | Urine | Total BPA |
| 2016–2017 | 3 to 79 | Urine | Total BPA |
| 2018–2019 | 3 to 79 | Urine | Total BPA |
| FNBI | |||
| 2011 | 20+ | Urine | Total BPA |
| MIREC study | |||
| 2008–2011 | 18+ | Urine | Total BPA |
| U.S. NHANES | |||
| 2007–2008 | 6+ | Urine | Total BPA |
| 2009–2010 | 6+ | Urine | Total BPA |
| 2011–2012 | 6+ | Urine | Total BPA |
| 2013–2014 | 6+ | Urine | Total BPA |
| 2015–2016 | 3+ | Urine | Total BPA |
Results
Canadian population
This figure shows the geometric mean concentrations of BPA in urine (µg/L) in the Canadian population from the CHMS (2007–2019).

Figure 1: Text description
| Collection period | Geometric mean |
|---|---|
| 2007–2009 | 1.2 |
| 2009–2011 | 1.2 |
| 2012–2013 | 1.1 |
| 2014–2015 | 1.0 |
| 2016–2017 | 0.81 |
| 2018–2019 | 0.68 |
There was a statistically significant decreasing trend (P < 0.001) in BPA concentrations in the Canadian population aged 6 to 79. Concentrations declined by 43% between 2007–2009 and 2018–2019.
Canadian population, by age group
This figure shows the geometric mean concentrations of BPA in urine (µg/L) in the Canadian population by age group from the CHMS (2007–2019). BPA was measured in individuals aged 6 to 79 in 2007–2009. Concentrations were therefore not available (NA) for individuals aged 3 to 5.
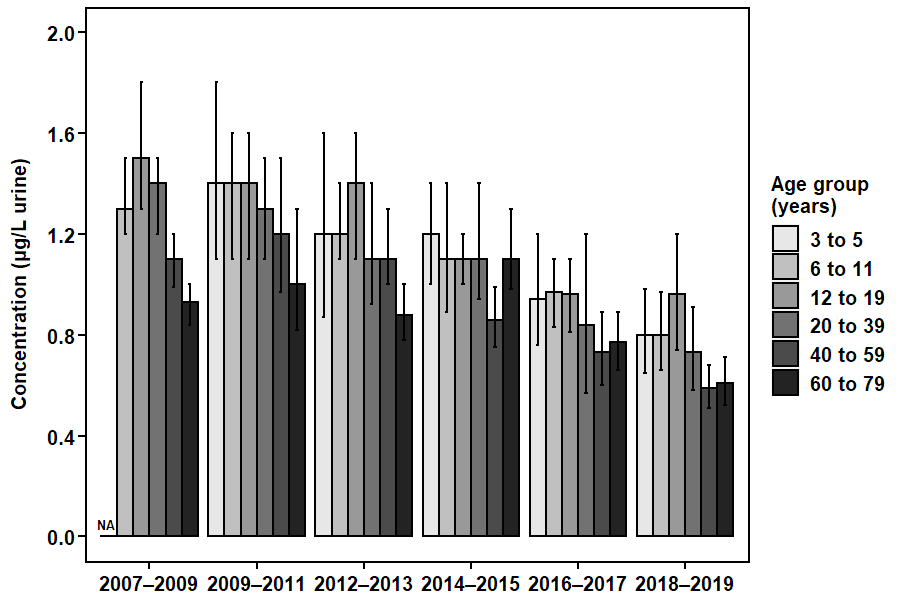
Figure 2: Text description
| Collection period | Age group (years) | Geometric mean |
|---|---|---|
| 2007–2009 | 3 to 5 | NA |
| 2007–2009 | 6 to 11 | 1.3 |
| 2007–2009 | 12 to 19 | 1.5 |
| 2007–2009 | 20 to 39 | 1.4 |
| 2007–2009 | 40 to 59 | 1.1 |
| 2007–2009 | 60 to 79 | 0.93 |
| 2009–2011 | 3 to 5 | 1.4 |
| 2009–2011 | 6 to 11 | 1.4 |
| 2009–2011 | 12 to 19 | 1.4 |
| 2009–2011 | 20 to 39 | 1.3 |
| 2009–2011 | 40 to 59 | 1.2 |
| 2009–2011 | 60 to 79 | 1.0 |
| 2012–2013 | 3 to 5 | 1.2 |
| 2012–2013 | 6 to 11 | 1.2 |
| 2012–2013 | 12 to 19 | 1.4 |
| 2012–2013 | 20 to 39 | 1.1 |
| 2012–2013 | 40 to 59 | 1.1 |
| 2012–2013 | 60 to 79 | 0.88 |
| 2014–2015 | 3 to 5 | 1.2 |
| 2014–2015 | 6 to 11 | 1.1 |
| 2014–2015 | 12 to 19 | 1.1 |
| 2014–2015 | 20 to 39 | 1.1 |
| 2014–2015 | 40 to 59 | 0.86 |
| 2014–2015 | 60 to 79 | 1.1 |
| 2016–2017 | 3 to 5 | 0.94 |
| 2016–2017 | 6 to 11 | 0.97 |
| 2016–2017 | 12 to 19 | 0.96 |
| 2016–2017 | 20 to 39 | 0.84 |
| 2016–2017 | 40 to 59 | 0.73 |
| 2016–2017 | 60 to 79 | 0.77 |
| 2018–2019 | 3 to 5 | 0.80 |
| 2018–2019 | 6 to 11 | 0.80 |
| 2018–2019 | 12 to 19 | 0.96 |
| 2018–2019 | 20 to 39 | 0.73 |
| 2018–2019 | 40 to 59 | 0.59 |
| 2018–2019 | 60 to 79 | 0.61 |
Concentrations of BPA were similar across age groups in the Canadian population in the most recent collection period (2018–2019).
Canadian population, by sex
This figure shows the geometric mean concentrations of BPA in urine (µg/L) in the Canadian population by sex from the CHMS (2007–2019).

Figure 3: Text description
| Collection period | Sex | Geometric mean |
|---|---|---|
| 2007–2009 | Females | 1.1 |
| 2007–2009 | Males | 1.3 |
| 2009–2011 | Females | 1.2 |
| 2009–2011 | Males | 1.3 |
| 2012–2013 | Females | 1.0 |
| 2012–2013 | Males | 1.2 |
| 2014–2015 | Females | 0.92 |
| 2014–2015 | Males | 1.2 |
| 2016–2017 | Females | 0.78 |
| 2016–2017 | Males | 0.84 |
| 2018–2019 | Females | 0.60 |
| 2018–2019 | Males | 0.77 |
Concentrations of BPA were similar between females and males in the Canadian population in the most recent collection period (2018–2019).
Comparison of the general population and First Nations on-reserve population in Canada
This figure shows the geometric mean concentrations of BPA in urine (µg/L) in the general population aged 20 to 79 from the CHMS (2009–2011) and First Nations on-reserve population aged 20 and older from the FNBI (2011).
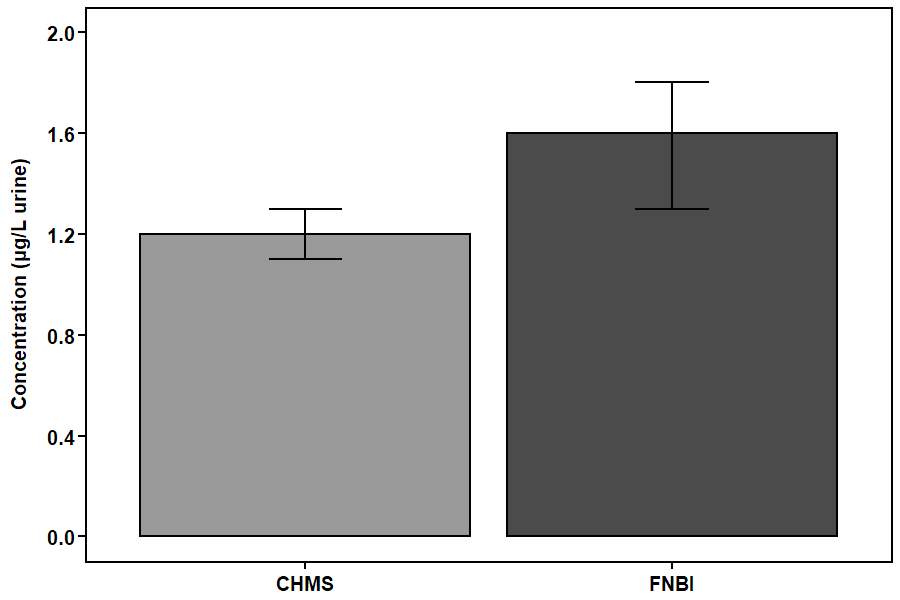
Figure 4: Text description
| Biomonitoring initiative | Geometric mean |
|---|---|
| CHMS | 1.2 |
| FNBI | 1.6 |
Concentrations of BPA were higher in the First Nations on-reserve population than in the general population in Canada.
Comparison of women of child-bearing age and pregnant women in Canada
This figure shows the geometric mean concentrations of BPA in urine (µg/L) for women of child-bearing age (18 to 49) in the general population from the CHMS (2009–2011) and for women in the first trimester of pregnancy from the MIREC study (2008–2011).
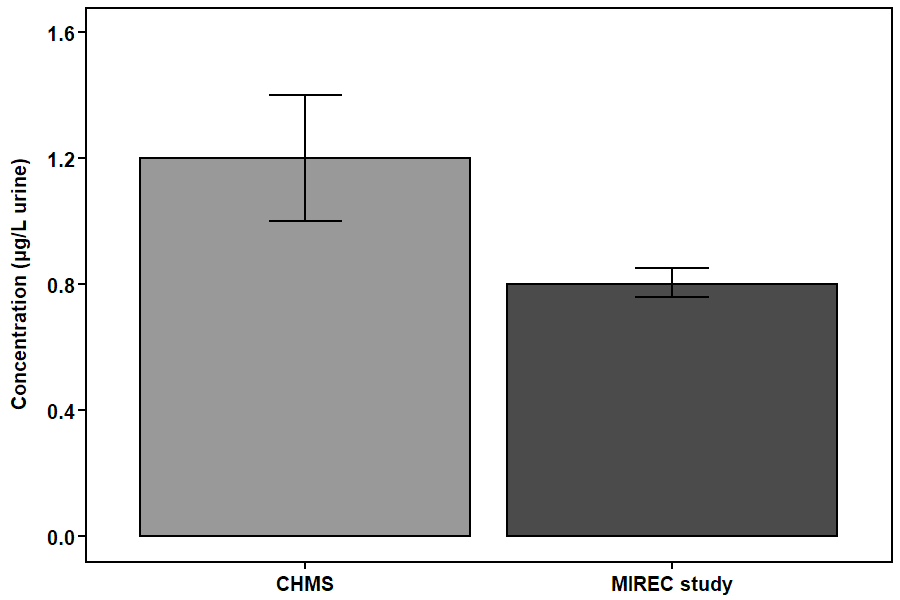
Figure 5: Text description
| Biomonitoring initiative | Geometric mean |
|---|---|
| CHMS | 1.2 |
| MIREC study | 0.8 |
Concentrations of BPA were higher in women of child-bearing age in the general population than in women in the first trimester of pregnancy in cities across Canada.
Comparison of the Canadian and U.S. populations
This figure shows the geometric mean concentrations of BPA in urine (µg/L) in the Canadian population from the CHMS (2007–2019) and in the U.S. population from the NHANES (2007–2016). Note that there are slight differences between the surveys in sampling (such as the age ranges of participants) and analysis (such as the limits of detection).

Figure 6: Text description
| Biomonitoring initiative | Collection period | Geometric mean |
|---|---|---|
| CHMS | 2007–2009 | 1.2 |
| CHMS | 2009–2011 | 1.2 |
| CHMS | 2012–2013 | 1.1 |
| CHMS | 2014–2015 | 1.0 |
| CHMS | 2016–2017 | 0.81 |
| CHMS | 2018–2019 | 0.68 |
| NHANES | 2007–2008 | 2.1 |
| NHANES | 2009–2010 | 1.8 |
| NHANES | 2011–2012 | 1.5 |
| NHANES | 2013–2014 | 1.3 |
| NHANES | 2015–2016 | 1.1 |
Concentrations of BPA were higher in the U.S. population than in the Canadian population. However, the difference between countries has decreased over time.
Suggested citation
Health Canada. 2021. Bisphenol A (BPA) in Canadians. Ottawa, ON. Available: https://www.canada.ca/en/health-canada/services/environmental-workplace-health/reports-publications/environmental-contaminants/human-biomonitoring-resources/bisphenol-a-canadians.html
Additional information
- Arbuckle TE, Davis K, Marro L, Fisher M, Legrand M, LeBlanc A, Gaudreau, E, Foster WG, Choeurng V, Fraser WD, MIREC Study Group. 2014. Phthalate and bisphenol A exposure among pregnant women in Canada - Results from the MIREC study. Environment International, 68: 55–65.
- Assembly of First Nations. 2013. First Nations Biomonitoring Initiative: National Results (2011). Ottawa, ON, Canada.
- Centers for Disease Control and Prevention. 2021. National Report on Human Exposure to Environmental Chemicals. Atlanta, GA, USA.
- Health Canada. 2010. Report on Human Biomonitoring of Environmental Chemicals in Canada: Results of the Canadian Health Measures Survey Cycle 1 (2007–2009). Ottawa, ON, Canada.
- Health Canada. 2013. Second Report on Human Biomonitoring of Environmental Chemicals in Canada: Results of the Canadian Health Measures Survey Cycle 2 (2009–2011). Ottawa, ON, Canada.
- Health Canada. 2015. Third Report on Human Biomonitoring of Environmental Chemicals in Canada: Results of the Canadian Health Measures Survey Cycle 3 (2012–2013). Ottawa, ON, Canada.
- Health Canada. 2017. Fourth Report on Human Biomonitoring of Environmental Chemicals in Canada: Results of the Canadian Health Measures Survey Cycle 4 (2014–2015). Ottawa, ON, Canada.
- Health Canada. 2019. Fifth Report on Human Biomonitoring of Environmental Chemicals in Canada: Results of the Canadian Health Measures Survey Cycle 5 (2016–2017). Ottawa, ON, Canada.
- Health Canada. 2021. Sixth Report on Human Biomonitoring of Environmental Chemicals in Canada: Results of the Canadian Health Measures Survey Cycle 6 (2018–2019). Ottawa, ON, Canada.