
Cadmium in Canadians
Download the alternative format
(PDF format, 440 KB, 14 pages)
Organization: Health Canada
Date published: 2021-12-14
Information on human biomonitoring of cadmium in Canada with results from the Canadian Health Measures Survey.
On this page
Background
What is cadmium?
Cadmium (CASRN 7440-43-9) is a naturally occurring metal. It enters the environment through both natural and industrial processes. Cadmium persists in the environment and can accumulate over time.
Where is cadmium found?
Cadmium is present in air, soil and bodies of water. It is found in cigarette smoke, industrial materials and some foods and consumer products.
How are people exposed to cadmium?
In smokers, the major source of cadmium exposure is inhalation of cigarette smoke. Non-smokers (including children) are exposed mainly through food. Other potential sources of exposure include ambient air, drinking water, soil and dust.
How is cadmium measured in people?
Some cadmium is absorbed into the bloodstream after being ingested or inhaled. Cadmium is commonly measured in blood and urine. Measurement in blood reflects recent exposure to cadmium. Measurement in urine mainly reflects cumulative exposure with slight fluctuations due to recent exposures.
What are the potential health impacts of cadmium?
Cadmium exposure has been associated with adverse health effects in the kidneys, lungs and gastrointestinal tract. The kidney is usually the first to exhibit adverse health effects. The International Agency for Research on Cancer has classified cadmium and its compounds as carcinogenic to humans.
What is the Government of Canada doing to lower human exposures to cadmium?
Inorganic cadmium compounds are identified as toxic under the Canadian Environmental Protection Act, 1999. Regulations under the Canada Consumer Product Safety Act limit how much cadmium can leach from various consumer products, including those meant for children. Cadmium and its compounds are on the List of Ingredients that are Prohibited for Use in Cosmetic Products. Health Canada has established guidelines for cadmium in Canadian drinking water. The Government of Canada continues to monitor and assess cadmium.
Data sources
| Initiative | Target population |
|---|---|
| Canadian Health Measures Survey (CHMS) | General Canadian population living in the 10 provinces |
| First Nations Biomonitoring Initiative (FNBI) | First Nations people living on-reserve south of the 60° parallel |
| Maternal-Infant Research on Environmental Chemicals (MIREC) study | Pregnant women and their infants recruited from obstetric and prenatal clinics in 10 cities across Canada |
| International Polar Year Inuit Health Survey (IPY IHS) | Inuit populations from the Inuvialuit Settlement Region (ISR), Nunavut and Nunatsiavut |
| U.S. National Health and Nutrition Examination Survey (NHANES) | General U.S. population |
This fact sheet presents nationally representative data from the CHMS. These data are compared with data from the FNBI, the MIREC study, the IPY IHS and the U.S. NHANES.
| Collection period | Age range (years) | Matrix | Biomarker |
|---|---|---|---|
| CHMS | |||
| 2007–2009 | 6 to 79 | Blood | Cadmium |
| 2009–2011 | 3 to 79 | Blood | Cadmium |
| 2012–2013 | 3 to 79 | Blood | Cadmium |
| 2014–2015 | 3 to 79 | Blood | Cadmium |
| 2016–2017 | 3 to 79 | Blood | Cadmium |
| 2018–2019 | 3 to 79 | Blood | Cadmium |
| FNBI | |||
| 2011 | 20+ | Blood | Cadmium |
| MIREC study | |||
| 2008–2011 | 18+ | Blood | Cadmium |
| IPY IHS | |||
| 2007–2008 | 18+ | Blood | Cadmium |
| U.S. NHANES | |||
| 2007–2008 | 1+ | Blood | Cadmium |
| 2009–2010 | 1+ | Blood | Cadmium |
| 2011–2012 | 1+ | Blood | Cadmium |
| 2013–2014 | 1+ | Blood | Cadmium |
| 2015–2016 | 1+ | Blood | Cadmium |
Results
Canadian population
This figure shows the geometric mean concentrations of cadmium in blood (µg/L) in the Canadian population from the CHMS (2007–2019).
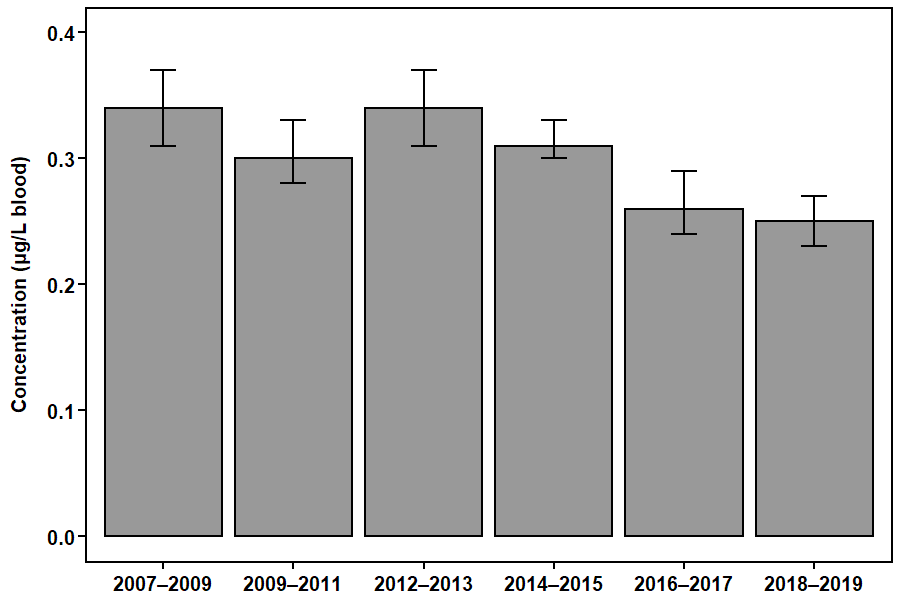
Figure 1: Text description
| Collection period | Geometric mean |
|---|---|
| 2007–2009 | 0.34 |
| 2009–2011 | 0.30 |
| 2012–2013 | 0.34 |
| 2014–2015 | 0.31 |
| 2016–2017 | 0.26 |
| 2018–2019 | 0.25 |
There was a statistically significant decreasing trend (P < 0.001) in cadmium concentrations in the Canadian population aged 6 to 79. Concentrations declined by 26% between 2007–2009 and 2018–2019.
Canadian population, by smoking status
This figure shows the geometric mean concentrations of cadmium in blood (µg/L) in the Canadian population by smoking status from the CHMS (2007–2019). Smokers were defined as individuals with urinary cotinine concentrations equal to or greater than 50 µg/L or blood cotinine concentrations equal to or greater than 10 µg/L.
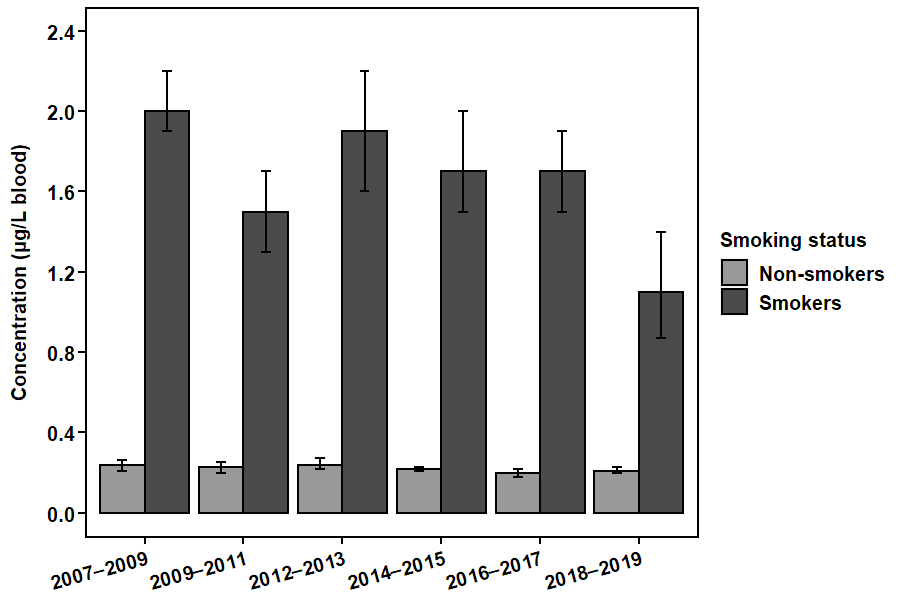
Figure 2: Text description
| Collection period | Smoking status | Geometric mean |
|---|---|---|
| 2007–2009 | Non-smokers | 0.24 |
| 2007–2009 | Smokers | 2.0 |
| 2009–2011 | Non-smokers | 0.23 |
| 2009–2011 | Smokers | 1.5 |
| 2012–2013 | Non-smokers | 0.24 |
| 2012–2013 | Smokers | 1.9 |
| 2014–2015 | Non-smokers | 0.22 |
| 2014–2015 | Smokers | 1.7 |
| 2016–2017 | Non-smokers | 0.20 |
| 2016–2017 | Smokers | 1.7 |
| 2018–2019 | Non-smokers | 0.21 |
| 2018–2019 | Smokers | 1.1 |
Concentrations of cadmium were higher in smokers than in non-smokers in Canada.
Canadian population, by age group
This figure shows the geometric mean concentrations of cadmium in blood (µg/L) in the Canadian population by age group from the CHMS (2007–2019). Geometric mean cadmium concentrations could not be calculated for children under 12 years old. This was because too many samples were below the analytical limit of detection.
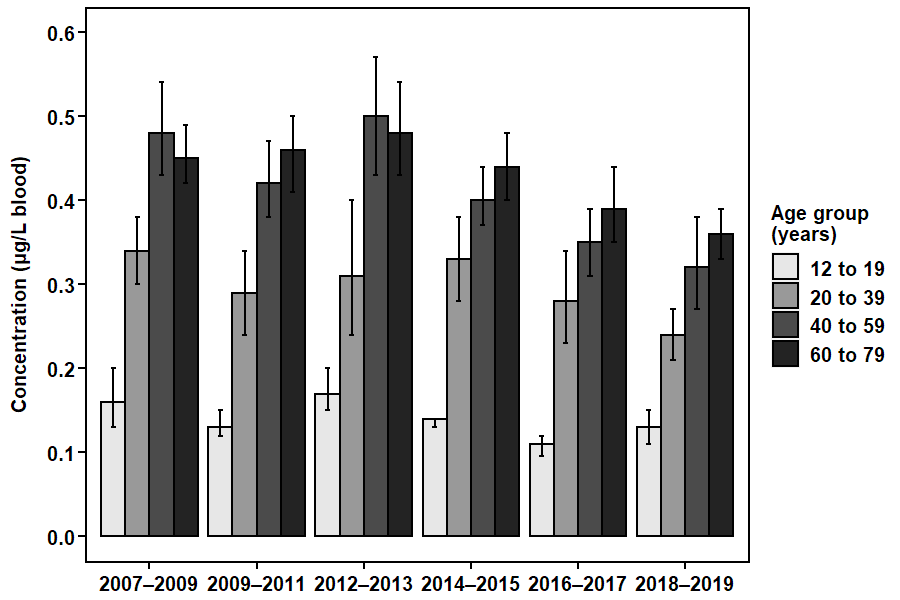
Figure 3: Text description
| Collection period | Age group (years) | Geometric mean |
|---|---|---|
| 2007–2009 | 12 to 19 | 0.16 |
| 2007–2009 | 20 to 39 | 0.34 |
| 2007–2009 | 40 to 59 | 0.48 |
| 2007–2009 | 60 to 79 | 0.45 |
| 2009–2011 | 12 to 19 | 0.13 |
| 2009–2011 | 20 to 39 | 0.29 |
| 2009–2011 | 40 to 59 | 0.42 |
| 2009–2011 | 60 to 79 | 0.46 |
| 2012–2013 | 12 to 19 | 0.17 |
| 2012–2013 | 20 to 39 | 0.31 |
| 2012–2013 | 40 to 59 | 0.50 |
| 2012–2013 | 60 to 79 | 0.48 |
| 2014–2015 | 12 to 19 | 0.14 |
| 2014–2015 | 20 to 39 | 0.33 |
| 2014–2015 | 40 to 59 | 0.40 |
| 2014–2015 | 60 to 79 | 0.44 |
| 2016–2017 | 12 to 19 | 0.11 |
| 2016–2017 | 20 to 39 | 0.28 |
| 2016–2017 | 40 to 59 | 0.35 |
| 2016–2017 | 60 to 79 | 0.39 |
| 2018–2019 | 12 to 19 | 0.13 |
| 2018–2019 | 20 to 39 | 0.24 |
| 2018–2019 | 40 to 59 | 0.32 |
| 2018–2019 | 60 to 79 | 0.36 |
Concentrations of cadmium were higher in adults than in adolescents in the Canadian population.
Canadian population, by sex
This figure shows the geometric mean concentrations of cadmium in blood (µg/L) in the Canadian population by sex from the CHMS (2007–2019).
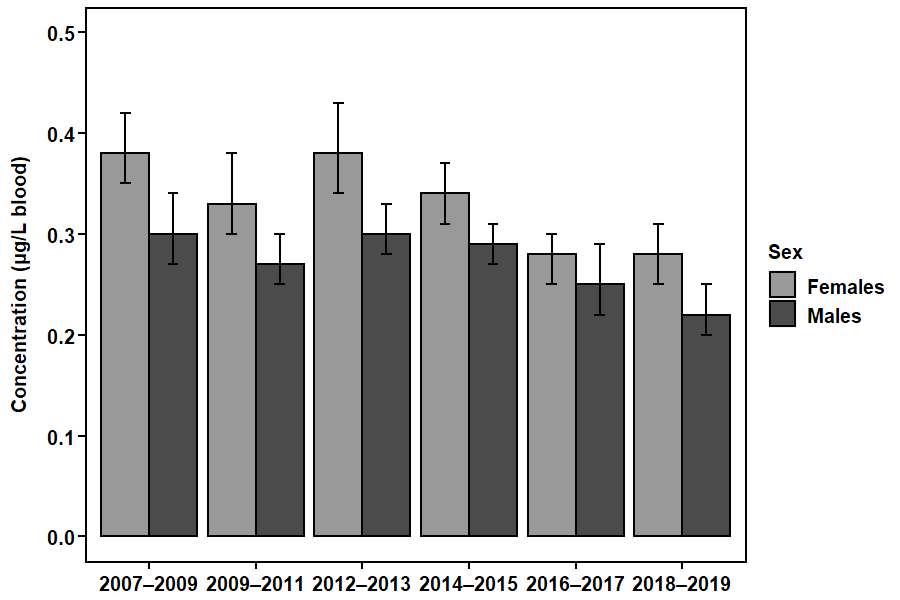
Figure 4: Text description
| Collection period | Sex | Geometric mean |
|---|---|---|
| 2007–2009 | Females | 0.38 |
| 2007–2009 | Males | 0.30 |
| 2009–2011 | Females | 0.33 |
| 2009–2011 | Males | 0.27 |
| 2012–2013 | Females | 0.38 |
| 2012–2013 | Males | 0.30 |
| 2014–2015 | Females | 0.34 |
| 2014–2015 | Males | 0.29 |
| 2016–2017 | Females | 0.28 |
| 2016–2017 | Males | 0.25 |
| 2018–2019 | Females | 0.28 |
| 2018–2019 | Males | 0.22 |
Concentrations of cadmium were higher in females than in males in the Canadian population.
Comparison of the general population and First Nations on-reserve population in Canada
This figure shows the geometric mean concentrations of cadmium in blood (µg/L) in the general population aged 20 to 79 from the CHMS (2009–2011) and in the First Nations on-reserve population aged 20 and older from the FNBI (2011).
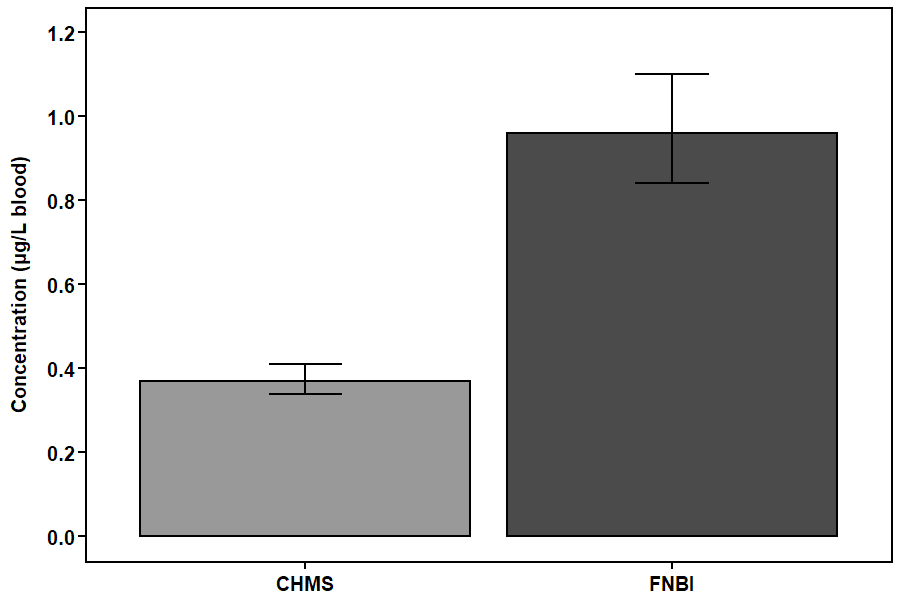
Figure 5: Text description
| Biomonitoring initiative | Geometric mean |
|---|---|
| CHMS | 0.37 |
| FNBI | 0.96 |
Concentrations of cadmium were higher in the First Nations on-reserve population than in the general population in Canada.
Comparison of women of child-bearing age and pregnant women in Canada
This figure shows the geometric mean concentrations of cadmium in blood (µg/L) for women of child-bearing age (18 to 49) in the general population from the CHMS (2009–2011) and for women in the first or third trimester of pregnancy from the MIREC study (2008–2011).
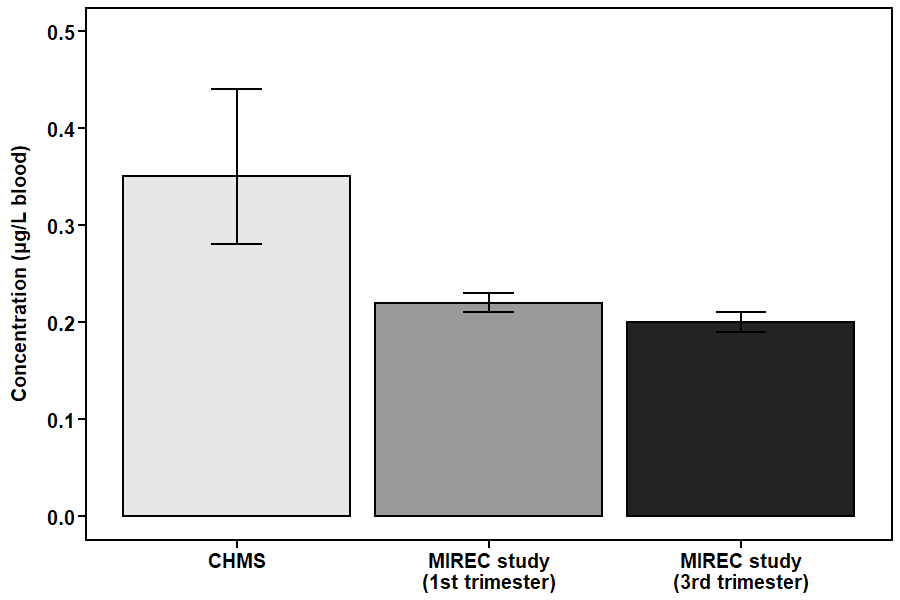
Figure 6: Text description
| Biomonitoring initiative | Geometric mean |
|---|---|
| CHMS | 0.35 |
| MIREC study (1st trimester) | 0.22 |
| MIREC study (3rd trimester) | 0.20 |
Concentrations of cadmium were higher in women of child-bearing age in the general population than in women in the first or third trimester of pregnancy in cities across Canada.
Comparison of the general population and Inuit populations in Canada
This figure shows the geometric mean concentrations of cadmium in blood (µg/L) in females and males in the general population aged 18 to 79 from the CHMS (2007–2009) and in Inuit populations aged 18 and older in the ISR, Nunavut and Nunatsiavut from the IPY IHS (2007–2008).
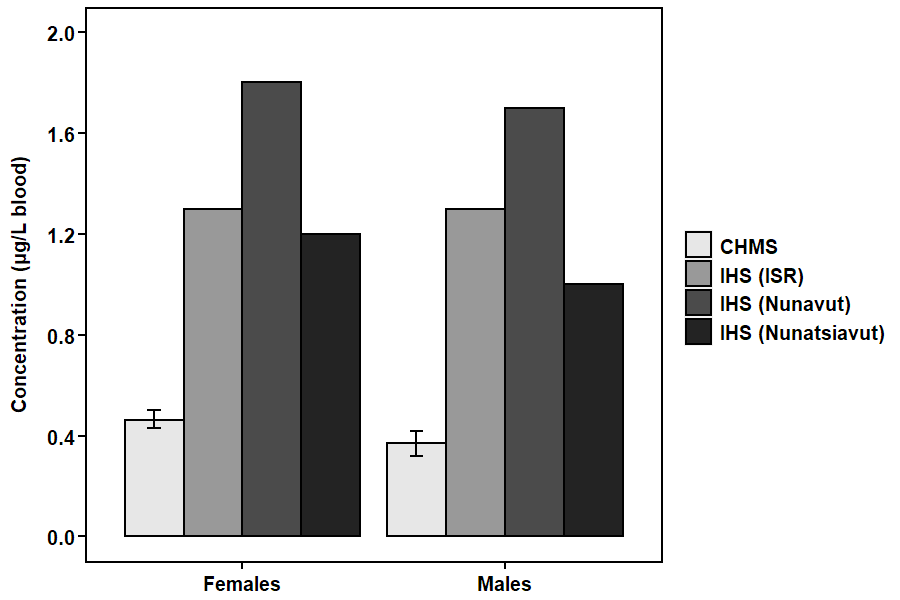
Figure 7: Text description
| Biomonitoring initiative | Sex | Geometric mean |
|---|---|---|
| CHMS | Females | 0.46 |
| CHMS | Males | 0.37 |
| IHS (ISR) | Females | 1.3 |
| IHS (ISR) | Males | 1.3 |
| IHS (Nunavut) | Females | 1.8 |
| IHS (Nunavut) | Males | 1.7 |
| IHS (Nunatsiavut) | Females | 1.2 |
| IHS (Nunatsiavut) | Males | 1.0 |
Concentrations of cadmium were higher in Inuit populations in the ISR, Nunavut and Nunatsiavut than in the general population in Canada.
Comparison of the Canadian and U.S. populations
This figure shows the geometric mean concentrations of cadmium in blood (µg/L) in the Canadian population from the CHMS (2007–2019) and in the U.S. population from the NHANES (2007–2016). Note that there are slight differences between the surveys in sampling (such as the age ranges of participants) and analysis (such as the limits of detection).
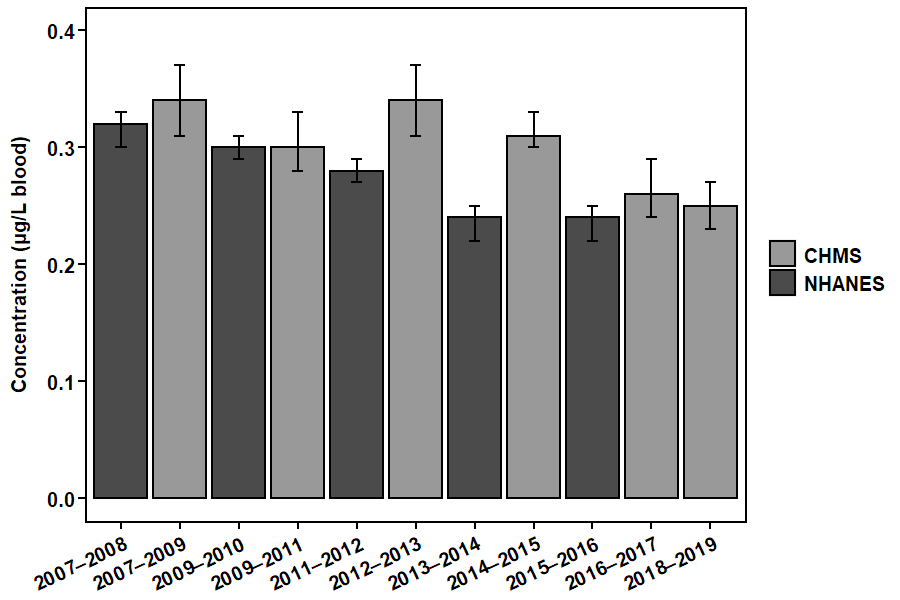
Figure 8: Text description
| Biomonitoring initiative | Collection period | Geometric mean |
|---|---|---|
| CHMS | 2007–2009 | 0.34 |
| CHMS | 2009–2011 | 0.30 |
| CHMS | 2012–2013 | 0.34 |
| CHMS | 2014–2015 | 0.31 |
| CHMS | 2016–2017 | 0.26 |
| CHMS | 2018–2019 | 0.25 |
| NHANES | 2007–2008 | 0.32 |
| NHANES | 2009–2010 | 0.30 |
| NHANES | 2011–2012 | 0.28 |
| NHANES | 2013–2014 | 0.24 |
| NHANES | 2015–2016 | 0.24 |
Concentrations of cadmium were similar between the Canadian and U.S. populations in the most recent collection periods (2015–2019).
Suggested citation
Health Canada. 2021. Cadmium in Canadians. Ottawa, ON. Available: https://www.canada.ca/en/health-canada/services/environmental-workplace-health/reports-publications/environmental-contaminants/human-biomonitoring-resources/cadmium-canadians.html
Additional information
- Arbuckle TE, Liang CL, Morisset A-S, Fisher M, Weiler H, Cirtiu CM, Legrand M, Davis K, Ettinger AS, Fraser WD, MIREC Study Group. 2016. Maternal and fetal exposure to cadmium, lead, manganese and mercury: The MIREC study. Chemosphere, 163: 270–282.
- Assembly of First Nations. 2013. First Nations Biomonitoring Initiative: National Results (2011). Ottawa, ON, Canada.
- Centers for Disease Control and Prevention. 2021. National Report on Human Exposure to Environmental Chemicals. Atlanta, GA, USA.
- Crown-Indigenous Relations and Northern Affairs Canada. 2017. Canadian Arctic Contaminants Assessment Report (CACAR IV): Human Health Assessment. Ottawa, ON, Canada.
- Health Canada. 2010. Report on Human Biomonitoring of Environmental Chemicals in Canada: Results of the Canadian Health Measures Survey Cycle 1 (2007–2009). Ottawa, ON, Canada.
- Health Canada. 2013. Second Report on Human Biomonitoring of Environmental Chemicals in Canada: Results of the Canadian Health Measures Survey Cycle 2 (2009–2011). Ottawa, ON, Canada.
- Health Canada. 2015. Third Report on Human Biomonitoring of Environmental Chemicals in Canada: Results of the Canadian Health Measures Survey Cycle 3 (2012–2013). Ottawa, ON, Canada.
- Health Canada. 2017. Fourth Report on Human Biomonitoring of Environmental Chemicals in Canada: Results of the Canadian Health Measures Survey Cycle 4 (2014–2015). Ottawa, ON, Canada.
- Health Canada. 2019. Fifth Report on Human Biomonitoring of Environmental Chemicals in Canada: Results of the Canadian Health Measures Survey Cycle 5 (2016–2017). Ottawa, ON, Canada.
- Health Canada. 2021. Sixth Report on Human Biomonitoring of Environmental Chemicals in Canada: Results of the Canadian Health Measures Survey Cycle 6 (2018–2019). Ottawa, ON, Canada.