
Methodology document: Usual intakes from food for energy, nutrients and other dietary components (2004 and 2015 Canadian Community Health Survey - Nutrition)
January 2021
Table of Contents
- Acknowledgements
- List of abbreviations
- 1.0 Introduction
- 2.0 The 2015 CCHS - Nutrition: Estimation of population usual intake distribution
- 2.1 Introduction
- 2.2. Rationale for updating estimates for 2004
- 2.3 Methodology for estimating usual intakes
- 2.3.1 Usual intake estimation with the National Cancer Institute method
- 2.3.2 Application of the NCI method in the 2004 and 2015 CCHS-Nutrition
- 2.3.3 Measuring sampling variability with bootstrap replication
- 2.3.4 Estimation of iron inadequacy using the full probability method
- 2.3.5 Estimation of usual intake distribution for caffeine
- 2.3.6 Data source
- 2.4. Comparing 2015 and 2004 nutrient intake estimates
- Appendix A - Table footnotes
- Appendix B - List of dietary components
- References
Acknowledgements
Health Canada would like to acknowledge and thank the individuals who have contributed to this work. The production of these intake estimates was a joint venture between Health Canada and Statistics Canada. Subject-matter experts from the Bureau of Food Surveillance and Science Integration, Food Directorate, and the Office of Nutrition Policy and Promotion at Health Canada and from the Centre for Population Health Data and Health Analysis Division at Statistics Canada produced the usual intake data table and this methodology document.
List of abbreviations
- AI
- Adequate Intake
- AMDR
- Acceptable Macronutrient Distribution Range
- CCHS
- Canadian Community Health Survey
- CDRR
- Chronic Disease Risk Reduction Intake
- CV
- coefficient of variation
- d
- day
- DRI
- Dietary Reference Intake
- EAR
- Estimated Average Requirement
- g
- gram
- IOM
- Institute of Medicine
- kcal
- kilocalories
- mg
- milligram
- n
- sample size
- NCI
- National Cancer Institute
- OC
- oral contraceptive
- SD
- standard deviation
- SE
- standard error
- SIDE
- Software for Intake Distribution Estimation
- UL
- Tolerable Upper Intake Level
1.0 Introduction
Health Canada's Usual intakes from food for energy, nutrients and other dietary components is published on the Government of Canada's Open Government portal. These intake estimates were generated using data collected from Canadians in the 2004 and 2015 Canadian Community Health Survey (CCHS)-Nutrition as a joint venture with Statistics Canada. To optimize the usage of the data, it is recommended that users refer to the Table Footnotes (Appendix A) and also read The Reference Guide to Understanding and Using the Data - 2015 Canadian Community Health Survey - NutritionFootnote 1 published by Health Canada in June 2017. This reference guide includes an overview of the 2015 CCHS-Nutrition, including descriptions of the survey sample, how the survey was conducted and survey components. Further, the reference guide introduces the Dietary Reference Intakes (DRI), the nutrient reference standards used to assess diets by age-sex groups.
This methodology document is a reference for those who will use the 2004 and the 2015 CCHS-Nutrition usual intake data to guide nutrition‐related program and policy decisions. It will be of particular benefit to provincial ministries of health, researchers and graduate students, policy makers and analysts, public health professionals, epidemiologists, dietitians, the food industry, and the health media.
The summary data table presents the distribution of usual intakes of 41 dietary components as described in Appendix B. Data are provided for 16 age-sex groups at the national, regional and provincial levels. Data used for producing the estimates were obtained from the 2004 and 2015 CCHS-Nutrition Share Files. The nutrient intakes represent food consumption only. A methodology for combining data on nutrient intakes derived from food with data on vitamin and mineral supplements is being explored by Health Canada. Because supplements may make meaningful contributions to nutrient intakes, inferences about the prevalence of nutrient excess or inadequacy based on intakes from food alone may respectively underestimate or overestimate the prevalence based on total nutrient intakes from both food and supplements.
Results are presented for 13 geographical areas: Canada excluding the territories, the 10 provinces, the Atlantic Region and the Prairie Region. Data from the four Atlantic Provinces and the three Prairie Provinces were combined into the Atlantic Region and the Prairie Region, respectively.
Recognizing that the smoking of tobacco affects vitamin C requirements, estimates are provided for the intake of vitamin C by smoking status.
The next section describes the methodology used to produce the intake estimates and how we addressed computational problems that were encountered. The guide does not provide any interpretation or draw conclusions. Readers are encouraged to consult The Reference Guide to Understanding and Using the Data - 2015 Canadian Community Health Survey - NutritionFootnote 1, for examples of how to interpret the 2015 CCHS-Nutrition data.
2.0 The 2015 CCHS-Nutrition: Estimation of population usual intake distribution
2.1 Introduction
One of the goals of the 2015 CCHS-Nutrition was to estimate distributions of usual intake from food for energy, several nutrients and other food components at the national, provincial and regional levels for 16 DRI age-sex groups. To accomplish this, data from two dietary recalls were collected concerning the amount and types of foods consumed in the 24 hours preceding the interview: one recall for all respondents and a second recall only from a representative subsample of the group. Using data from the first dietary recall produces a measure of daily intake (i.e. the quantity of nutrients or food eaten in a given day). Data from both the first and second recalls can be used to produce a population-level estimate of usual intake (i.e. the long-term average of the daily intake).
The variability in intakes among a group on a given day reflects both variability in intake within specific individuals (who may have eaten more or less than usual on that day) as well as between different individuals (who habitually have higher or lower intakes). To obtain an estimate of a population's usual intake distribution from daily intake data, one must fit a measurement error model that reduces the effect of the within‐individual variance while measuring the between‐individual variance. Several methods are available to estimate a population's usual intake distributions from daily intake data. Following the release of 2015 CCHS-Nutrition, Statistics Canada recommended the use of the National Cancer Institute (NCI) method for estimation of usual intakes.
Three main types of estimates can be obtained from usual intake distributions including: (i) the mean usual intake; (ii) the percentage of the population having a usual intake under (or over) a given threshold (cut‐off); and (iii) percentiles of the distribution.
The goal of this document is to summarize the:
- Rationale for providing updated estimates for the 2004 CCHS-Nutrition
- Methodology used to estimate usual intake distributions for the 2015 CCHS-Nutrition
- Estimation of iron inadequacy using the full probability method
- Estimation of usual intake for caffeine
- Guidance for comparing intake estimates between cycles 2004 and 2015
- Table footnotes
2.2. Rationale for updating estimates for 2004
Since the release of the data from 2004 CCHS-Nutrition, novel statistical methods to estimate usual intakes from self-report dietary assessments have become available. In 2016, a joint technical working group comprised of statisticians from Health Canada and Statistics Canada evaluated existing statistical methods for estimating the usual dietary intake and recommended the use of the NCI methodFootnote 2 ,Footnote 3 for analysis of the 2015 CCHS-Nutrition data. This was a shift from 2004 CCHS-Nutrition (Cycle 2.2), where usual intake estimates were calculated using the Iowa State University (ISU) methodFootnote 4 which uses the Software for Intake Distribution Estimation (SIDE). Usual intake estimates for the 2004 CCHS-Nutrition have been recalculated using the NCI method in order to facilitate comparisons. The summary data table available on Canada's Open Government Portal presents estimates for both years (2004 and 2015) of the survey. Users are cautioned against comparing the 2015 CCHS-Nutrition usual intake estimates to those published in the three volumes of the 2004 CCHS-Nutrition Compendium of Nutrient Intake TablesFootnote 5 due to differences in usual intake estimation methodology.
2.3 Methodology for estimating usual intake
2.3.1 Usual intake estimation with the National Cancer Institute method
Estimated distributions of usual nutrient intakes for the 2015 CCHS-Nutrition were computed using the NCI methodFootnote 2,Footnote 3. Despite increased computational time compared with other available methods, the NCI method has advantages as it can be used to estimate intake of both ubiquitously and episodically consumed nutrients and foods, can include covariates in the model, and accounts for the correlation between probability of consumption and amount consumed.
The NCI method was developed on the premise that usual intake is equal to the probability of consumption on any given day multiplied by the average amount consumed on a "consumption day". There are slight differences in how the method is applied for dietary components that are consumed by nearly everyone, nearly every day (i.e. ubiquitously consumed) compared with those that are episodically consumed, on a few days. The approach for ubiquitously consumed components (sometimes referred to as the one-part or amount-only model) assumes a probability of consumption of 1 and requires an estimation of the amount consumed using linear regression on a transformed scale with a person-specific random effect. The more complex estimation of episodically consumed components (referred to as the two-part model) requires a model that estimates (1) the probability of consuming a food component using logistic regression also with a person-specific random effect and (2) the amount consumed using a non-linear mixed model. Each part of this two-part model may include multiple or no covariates. For the two-part models, if the person-specific random effects of the two parts are correlated, the two-part correlated model is selected. Otherwise, the two-part uncorrelated model is fit. For either the one-part or the two-part models, the next step is to estimate each individual's linear predictor(s), generate random effects using 100 pseudo-persons for each individual, add random effects to the linear predictors and back-transform the amount estimate to the original scale and finally estimate mean, standard deviation and percentiles empirically.
Training materials on the use of the NCI method to estimate usual intake distribution characteristics from the 2015 CCHS-Nutrition data are available from Statistics Canada (contact Client Services, Health Statistics Division, Statistics Canada at 613-951-1746 or by email at STATCAN.hd-ds.STATCAN@canada.ca). The National Cancer Institute has developed SAS macros for implementation of the NCI method, which are available online.
2.3.2 Application of the NCI method in the 2004 and 2015 CCHS-Nutrition
The NCI method was originally developed for analysis of the United States National Health and Nutrition Examination Survey (NHANES), which has a different design than the one used in the CCHS-Nutrition surveys. Application of the NCI method to CCHS-Nutrition was investigatedFootnote 6 and various statistical considerations were noted. In particular, questions relating to the choice of model (one- or two-part), the method to remedy outliers, and the choice of covariates were investigated and are discussed below.
Selection of one- or two-part model
The decision of whether to implement the one- or two- part model was based on the following scenariosFootnote 3:
- If less than 5% of the 24-hour recalls (unweighted) had zero intake of a nutrient, then the one-part model was used.
- If greater than 10% of the 24-hour recalls had zero intake of a nutrient, the two-part model was fit twice: once including the correlation between person-specific random effects, and another assuming the correlation to be zero. If the correlation is found to be significant, the correlated model is selected, otherwise the uncorrelated model is chosen.
- If between 5% and 10% of the 24-hour recalls had zero intake of a nutrient, then both one- and two- part models were fit and the model with the best fit was chosen for further analysis. The best-fitting model was chosen by examining the significance of the correlation coefficient through implementation of Fisher's z-transformation between the two-part models as in the previous step. If neither of the two-part models converge, the amount-only model is fit. In this case, a warning note may appear stating that the estimated distribution might be right-shifted compared to the true distribution.
Intake estimates for all dietary components, except caffeine, were computed with a one-part model, as less than 5% of 24-hour recalls had zero intake of a nutrient. For caffeine, the two-part model was used for individuals under 30 years of age since more than 10% of recalls had zero intake. For adult groups over 30 years of age, the proportion of zero intakes ranged between 6.41% and 10.24%, thus both the one- and two-part models were fit for these groups.
Once the model was chosen, the ratio of within-between variance components was used to evaluate other statistical assumptions, including choice of covariates and outliers. Large values of the within-between variance ratio suggests instability of model parameter estimates, and leads to a larger adjustment of the one-day intakes to the usual intakes. As a result, estimation of percentiles of the usual intake distribution and prevalence of inadequacy may be impacted. To ensure model accuracy, the effect of covariates, outliers and survey weights were evaluated when computing usual intakes.
Covariates
Since estimates of usual intakes by age-sex group are desired at the national, regional and provincial levels, province was included as a covariate in the model. Initial analysis using the NCI method indicated non-convergence of some age-sex groups in some provinces, thus data from the 2004 CCHS-Nutrition (Cycle 2.2) was included to increase the sample size and then provide usual intake estimates using the NCI method for the 2004 survey. As a result, parameter estimates were obtained from a dataset with 2004 and 2015 CCHS-Nutrition combined, and survey year was also included as a covariate. As per the NCI User Guide, covariates for sequence of recall and weekend/weekday were also included.
Pooling vs. Stratification
Computation was done for usual intakes for each age-sex group separately, using a stratified approach. While the NCI method provides the option to pool groups, an initial analysis using the root survey weight indicated large differences in the estimated ratio of within-between variance components for different age-sex groups. Previous research has noted that pooling is not appropriate in situations where the within-between ratios are much different, since usual intake distributions could be biased in such casesFootnote 6. Hence, for the analysis of CCHS - Nutrition data, usual intakes were obtained by stratification of each age-sex group, while pooling over survey year and province within each strata.
Outliers
In cases where the difference between Day 1 and Day 2 intakes was abnormally large (i.e. ratio of within- to between- variation >10), analyses were conducted to look for potential outliers. In such cases, the Day 2 value was removed as Day 1 values are considered more reliable. Day 1 recall is less likely to be biased due to learning curve or change in diet since the respondent is aware that an upcoming recall will take place. The impact of outlier removal on the within-between variation was determined on the basis of ±3, ±2.5 or ±2 standard deviations (SD) away from the mean distribution of difference between Day 1 and Day 2 values. The scenario that resulted in the greatest improvement in within-between variations with the fewest outliers removed was selected. For those dietary components with outliers identified, the total number of outliers is summarized below:
Dietary Component |
DRI Age-Sex Group |
Threshold |
Number of recalls removed |
|---|---|---|---|
Percentage of total energy intake from fats |
19 to 30 years, females |
3 SD |
4 |
Percentage of total energy intake from monounsaturated fats |
19 to 30 years, females |
3 SD |
8 |
Sodium (mg/d) |
19 to 30 years, males |
2 SD |
39 |
Potassium (mg/d) |
31 to 50 years, males |
2 SD |
63 |
Percentage of total energy intake from linolenic fatty acid |
9 to 13 years, females |
3 SD |
11 |
14 to 18 years, males |
3 SD |
18 |
|
Data source: Statistics Canada, 2015 Canadian Community Health Survey - Nutrition; 2004 Canadian Community Health Survey Nutrition (cycle 2.2) Share files |
|||
SAS macros
Analyses were completed using SAS Macros Version 2.1, specifically the MIXTRAN and DISTRIB macros. General documentation on the NCI method, including user guides and specific examples, is also available online.
To perform the usual intake calculations and model selection steps mentioned previously, the NCI univariate macros MIXTRAN and DISTRIB were implemented in a systematic way, as described below.
The MIXTRAN macro transforms the data and fits the nonlinear mixed model. This macro permits the use of covariates in the model fitting procedure and outputs the parameter estimates needed to calculate distributions of usual intake.
The DISTRIB macro uses the parameters estimated by MIXTRAN to estimate the usual intake distributions through simulation. This macro can also provide the estimated percentage of the population whose usual intake falls below or above a certain value, a feature used to provide estimates above or below DRI values (i.e. EARs, AIs and ULs).
The MIXTRAN macro was used extensively to evaluate the ratio of within-between variances, to determine the presence of outliers and to evaluate differences in pooling and stratification. Once the final model was chosen, the DISTRIB macro was used to calculate percentiles and prevalence of inadequacy for a particular dietary component. The exception to this procedure was iron, whose estimation procedure is summarized in Section 2.3.4.
Convergence criteria for the MIXTRAN macro
As the NCI method uses a numerical optimization method to find a solution, the default convergence criteria (gconv = 1e-8) was originally used for the analysis of all dietary components (Appendix B). In most cases, the default criteria provided feasible solutions with the shortest amount of computational time. For 2% of DRI age/sex groups, the default convergence criteria did not provide a feasible solution, thus more stringent convergence criteria (gconv = 1e-12 for Potassium with Males 9 to 13 years old, and 1e-10 for the remaining) were used for certain dietary components (Table 2), at the expense of additional run time. In general, it is recommended to use the default convergence criterion in the MIXTRAN macro when computing usual intakes.
Dietary Component |
Age-Sex Groups |
|---|---|
Sodium |
Females: 19 to 30 years old Females: 31 to 50 years old |
Potassium |
Females & Males Combined: 1 to 3 years old Males: 9 to 13 years old Females: 14 to 18 years old Females: 19 to 30 years old Males: 31 to 50 years old |
Energy |
Females & Males Combined: 1 to 3 years old |
Phosphorus |
Females & Males Combined: 1 to 3 years old Males: 14 to 18 years old Males: 71 years and over Females: 71 years and over |
Vitamin C |
Females: 9 to 13 years old Males: 14 to 18 years old |
Calcium |
Females & Males Combined: 4 to 8 years old |
Moisture |
Females & Males Combined: 1 to 3 years old |
Total Sugars |
Females: 14 to 19 years old |
2.3.3 Measuring sampling variability with bootstrap replication
The CCHS-Nutrition surveys have a complex design, implying that no mathematical formula exists to calculate the sampling variability directly. Instead, it is necessary to use a replication method to estimate this variance, and the most convenient method is bootstrap replication. Statistics Canada has provided bootstrap replicate weights to estimate the variance from complex survey sampling designs.
For simple estimates such as totals, ratios or regression parameters, it is possible to estimate the sampling variability by using the bootstrap weights with a survey procedure, such as SUDAAN, STATA, or PROC SURVEYMEANS in SAS. These procedures properly account for the complex survey design in the estimation of standard errors. To obtain an estimate, the parameter of interest is calculated (e.g. total, ratio) for each of the 500 replicates and then the variance between the 500 values is computed. This is the method used to estimate the average dietary component intake using day one recalls only. For estimates related to distributions of usual intake, this process must be repeated when using the NCI method. Thus, it is necessary to estimate the parameters of interest with the NCI method for each replicate (using each bootstrap weight) and then calculate the variance between each of the 500 estimates.
For some survey procedures, the variance of the 500 replicates compares each estimate with the mean of the 500 bootstraps (the bootstrap mean). The root estimate (the estimate calculated using the original survey weight) is also available from the data. Typically, since the number of replicates is large (500), the bootstrap mean will converge to the root mean estimate. However, since the NCI method may fail for some of the 500 replicates, it is possible that not all of the 500 distribution estimates will be available to calculate the bootstrap mean estimates. For this reason, when calculating the variance from the bootstrap estimates, each replicate is compared with the root estimate and not with the bootstrap mean. As such, some of the bias caused by failing replicates is mitigated by the estimation procedure.
More specifically for usual intakes, let  denote the estimate of the parameter (e.g. mean, percentile, prevalence of inadequacy) obtained using the root survey weight. Then b,b=1,2,…,B (where B=500), represents the estimate of the parameter from each of the B=500 bootstrap replicates. The bootstrap standard error for is then calculated by:
Figure 1.
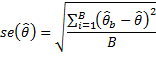
Figure 1 - Text Description
Formula showing how the standard error of the estimates were measured using the bootstrap method. According to this formula, the standard error of an estimate is equal to square root of the mean squared differences between the root estimate and each bootstrap estimates. More specifically, suppose that is an estimate of our parameter of interest evaluated by using the root sampling weight and that b (b=1,2,…,B) are corresponding B bootstrap estimates (B = 500 for the case of CCHS - Nutrition). The variance of is equal to the sum of the B squared differences between and b divided by B. The bootstrap standard error of is evaluated by taking the square root of this variance.
2.3.4 Estimation of iron inadequacy using the full probability method
The distribution of iron requirements for menstruating females and other age-sex groups is not normally distributed, nor necessarily symmetric. Therefore, the full probability approachFootnote 7 is required for the estimation of iron inadequacy as opposed to the EAR cut-point method. For all age-sex groups, the iron requirement distributions from the Institute of Medicine's (IOM) report on the DRIs: The Essential Guide to Nutrient RequirementsFootnote 8 Appendix G was used to estimate inadequacy. For the three DRI age-sex groups of menstruating females aged between 14 and 50 years, the iron requirement distributions of mixed populations, which assumes 17% oral contraceptive (OC) users and 83% non-OC users, were used to estimate inadequacyFootnote 8. For females 51 to 70 years and 71+ years, the iron requirement distributions for the post-menopausal population were used.
Tables of the risk of inadequate intake for specified ranges of the usual intake of iron, which are provided in the IOM report, were used for calculating iron inadequacy. The following summarizes how the full probability method to estimate iron inadequacy was implemented:
- The NCI method was used to estimate the usual intake distribution for iron. For each DRI age-sex group, the MIXTRAN macro was run separately with the covariates survey year (cycle), province, weekend/weekday and sequence of 24-hour recall, similar to other nutrients. For females 9 to 13, 19 to 30 and 31 to 50 years old, other covariates pertaining to female health had sufficient sample size and were considered to improve model fit. In particular, for females 9 to 13, the variable "Have you begun having menstrual cycles (periods) yet?" was considered; while for females 19 to 30 and 31 to 50, the covariate "In the past month, did you take birth control pills, including for reasons other than birth control?" was used. For females 31 to 50, the birth control covariate was significant (p=0.0012) and was included in the final model. For females 9 to 13 and 19 to 30 years old, these covariates were not significant (p=0.1552 and p=0.1400 respectively) and were removed from the final model. Individuals with missing covariate values were excluded from the final model for females 31 to 50 years old.
- In all cases, once the model was finalized, the parameter estimates from MIXTRAN were included in the DISTRIB macro to compute usual intake distributions for iron. Within the DISTRIB macro, the dataset corresponding to estimates of the pseudo-individuals (mcsim) was obtained, which considers iron usual intakes for 100 simulated individuals from each respondent.
- From Appendix G of the IOM reportFootnote 8 on the DRIs for iron, Tables G5, G6 and G7 were used to determine the risk values. For females aged 14 to 18 years and menstruating women, the tables for the mixed adolescent and adult populations were used. Finally, for females 51-70 and 71+, tables for the post-menopausal requirements were used.
- As an example, for the mixed adolescent population, intakes below the minimum value of 4.49 mg/d are assumed to have 100% probability of inadequacy (risk=1.0). Those with intakes above or equal to the maximum value of 14.39 mg/d are assumed to have zero risk of inadequacy. For intakes between these two extremes, the risk of inadequacy is calculated as 100 minus the midpoint of the percentiles of the requirement.
- The weighted average of these simulated risk values over all respondents within the DRI age-sex group was the estimate of the iron inadequacy for that age-sex group.
- Since covariates were included to improve estimates in some age-sex groups, a different approach was used to calculate the usual intake distribution for adult males and females 19 years and older. In these two groups, results from each of the four stratified MIXTRAN runs (e.g. females 19 to 30, females 31 to 50, females 51 to 70 and females 71+) were obtained. The 100 simulated pseudo-individuals from each of these DRI age-sex groups were found using the DISTRIB macro, and the risk associated with each of the 100 pseudo-individuals was calculated, as outlined in the previous step. Finally, the simulated data from the four gender-specific age-sex groups were "stacked" and the prevalence of inadequacy for the entire adult group was estimated by gender.
- Standard errors for the estimates were calculated with the probability approach using the bootstrap method, as described in Section 2.3.3.
- For additional information on iron estimation and the full probability method, consult the Health Canada publication Reference Guide to Understanding and Using the Data - 2015 Canadian Community Health Survey - Nutrition, Appendix 4Footnote 1.
2.3.5 Estimation of usual intake distribution for caffeine
The analysis of caffeine differed from other nutrients, primarily since intake varies depending on the age group considered. To be consistent with Health Canada guidance, information on the usual intake of caffeine is provided for individuals aged 4 years and older. Unlike other nutrients, the usual intake of caffeine was analyzed using the two-part NCI model, since caffeine was found to be an episodically consumed nutrient for some Canadians.
The percentage of 24-hour recalls with zero intake was larger than 10% for many age-sex groups (Table 3), hence the correlated and uncorrelated models were fit (see section 2.3.2). For individuals over 30 years of age, the percentage of zero intake was between 5% and 10% approximately, thus all three NCI models were fit - correlated, uncorrelated and amount-only model. For all models, the same covariates were used: survey year, province, weekend/weekday, and sequential effect of the 24-hour recall. In addition, the parameter estimates from MIXTRAN which were obtained using the original survey weight became starting values for the subsequent bootstrap runs. As part of MIXTRAN, Box-Cox transformations were used to transform the data to normality. However, for children 4 to 8 years, males 9 to 13 years and females 9 to 13 years old, the log-transformation (lambda = 0) was used. The amount-only model was not considered in the final analysis since all of the two-part models converged.
Age-Sex |
Percentage of zero intake (%) |
No. of outliers removed in final model |
Final p-value for correlated model |
Two-part Model Used |
|---|---|---|---|---|
Females & Males combined: 4 to 8 years |
36.0 |
1 |
0.75 |
Uncorrelated |
Males: 9 to 13 years |
32.3 |
0 |
0.40 |
Uncorrelated |
Females: 9 to 13 years |
30.6 |
0 |
≤0.0001 |
Correlated |
Males: 14 to 18 years |
27.4 |
0 |
0.29 |
Uncorrelated |
Females: 14 to 18 years |
31.2 |
0 |
0.52 |
Uncorrelated |
Males: 19 to 30 years |
20.1 |
0 |
0.005 |
Correlated |
Females: 19 to 30 years |
19.5 |
1 |
0.61 |
Uncorrelated |
Males: 31 to 50 years |
9.9 |
8 |
0.17 |
Uncorrelated |
Females: 31 to 50 years |
10.2 |
15 |
0.03 |
Correlated |
Males: 51 to 70 years |
6.8 |
10 |
0.003 |
Correlated |
Females: 51 to 70 years |
7.0 |
11 |
0.12 |
Uncorrelated |
Males: 71 years and older |
6.4 |
6 |
0.02 |
Correlated |
Females 71 years and older |
6.9 |
7 |
N/A |
Uncorrelated |
Data Source: Statistics Canada, 2015 Canadian Community Health Survey - Nutrition; 2004 Canadian Community Health Survey Nutrition (cycle 2.2) Share files N/A - Unable to calculate correlated p-value since the correlated model did not converge: uncorrelated model fitted |
||||
The following procedure was used in choosing which two-part model provided the best fit. When the Fisher's Z-transformation of the estimated correlation between the random effects in the correlated model differed statistically from zero at the 5% significance level, then the correlated model was used. Otherwise, the uncorrelated model was fit. Correlated models were used to estimate usual intakes for females 9 to 13 years, males 19 to 30 years, females 31 to 50 years, males 51 to 70 years and males 71 years and older. For females 71 years and older, the correlated model did not converge using the root survey weight, thus the uncorrelated model was used for analysis. The uncorrelated model was fit for all other DRI groups (Table 3).
By implementing the outlier detection strategy, described in Section 2.3.2, the resulting ratio of within-person to between-person variation was found to be smaller than 10 in all DRI age-sex groups. No outliers were removed using this method. Another outlier detection strategy was used to search for possible violations to the normality assumptionFootnote 9. In particular, the method computes a Box-Cox transformation of the original non-zero intake values and flags extreme values satisfying one of two criteria: i) those below the 25th percentile minus 2.5 times the interquartile range of the transformed distribution; and ii) values which were above the 75th percentile plus 2.5 times the interquartile range. Table 3 lists the number of outliers removed for each DRI age-sex group using this method.
In addition to the specific DRI age-sex groups, usual intake distributions of caffeine for males 19 years and older and females 19 years and older were also calculated. A distinct approach was used for these combined age groups because each individual age-sex group required different models (Table 3). Based on their respective model, for each individual, 100 simulated pseudo-individuals were outputted by the NCI method using the DISTRIB macro. Finally, the simulated pseudo-individuals obtained were "stacked" and the distribution of usual intakes for both adult gender groups was estimated.
Standard errors for the caffeine estimates were calculated using the bootstrap method, as described in Section 2.3.3. For the males 19+ group, 46 bootstrap replicates failed, compared with 80 failed replicates for the females 19+ group.
2.3.6 Data source
The datasets used to generate estimates were the 2004 and 2015 Canadian Community Health Survey - Nutrition Share Files, which consist of all respondents who agreed to share their responses with the survey share partners. About 96% of respondents agreed to share their responsesFootnote 1.
Excluded from the dataset were respondents with null intakes (zero total intake from food) or invalid intakes, breastfed children and pregnant or breastfeeding women. Day one and day two recalls were used. Three respondents with day two recalls who did not have a corresponding day one recall were excluded. Analysis was performed on provincial, regional (Atlantic and Prairies) and national levels for all age-sex groups other than children aged between 0 and 1 year. Analysis was also performed for the aggregated age-sex groups: males 19+ and females 19+ years of age.
2.4. Comparing 2015 and 2004 nutrient intake estimates
One of the objectives of the 2015 CCHS-Nutrition was to assess whether changes in dietary intake have occurred since the 2004 CCHS-Nutrition. To meet this objective, the percentage of the population above or below relevant DRI reference values in 2004 and 2015 were compared. This was done using t-tests where the mean change between 2004 and 2015 is compared to 0 and where the estimate of variance of that change comes from the bootstrap repetitions. The p-values presented in the summary data table were not adjusted for multiple comparisons.
When interpreting between-year comparisons and before drawing conclusions, it is essential to consider that the data are not adjusted for differences in methodology. Differences in intakes between the two survey years may reflect changes in consumption patterns, changes in the nutrient composition of foods and/or changes in survey methodology among other potential explanations. Please refer to The Reference Guide to Understanding and Using the Data- 2015 Canadian Community Health Survey- Nutrition Section 4Footnote 1 for detailed discussions of what differed between survey years and potential implications. A number of potential differences in data collection and processing for the 2015 CCHS-Nutrition are likely to have affected intake estimates. Three of the major differences include:
- changes in the nutrient databases beyond reformulation of food products by manufacturers, for example, filling in nutrient values that were 'missing';
- use of an updated model booklet in the interview to estimate amounts consumed;
- the addition of quality checks during the interview when a large amount was entered, thereby allowing any necessary revisions to be made in the presence of the respondent.
Appendix A - Table footnotes
The following footnotes apply to the summary data table:
- The survey excludes from its target population those living in the three territories, individuals living on reserves, residents of institutions, full‐time members of the Canadian Armed Forces and residents of certain remote regions.
- The table excludes pregnant and breastfeeding females, subject to another set of nutritional recommendations. The sample of pregnant and breastfeeding females is not large enough to allow for reliable estimates at the provincial level.
- Sample size is based on the first 24‐hour recall (first day of interview) only.
- Intakes are based on food consumption only. Intakes from vitamin and mineral supplements are not included. Inferences about the prevalence of nutrient excess or inadequacy based on intakes from food alone may respectively underestimate or overestimate the prevalence based on total nutrient intakes from both food and supplements.
- The intake distribution (percentiles and percentage above or below a cut‐off when applicable) was adjusted using the National Cancer Institute (NCI) Method as described in Tooze JA, Midthune D, Dodd KW, et al.: A new statistical method for estimating the usual intake of episodically consumed foods with application to their distribution. J Am Diet Assoc 2006;106: 1575-1587 and Tooze JA, Kipnis V, Buckman DW, et al.: A mixed-effects model approach for estimating the distribution of usual intake of nutrients: the NCI method. Stat Med 2010; 29: 2857-2868
- Bootstrapping techniques were used to produce the coefficient of variation (CV) and the standard error (SE).
- AMDR is the Acceptable Macronutrient Distribution Range, expressed as a percentage of total energy intake. Intakes inside the range (shown in the AMDR columns) are associated with a reduced risk of chronic disease while providing adequate intakes of essential nutrients. For further information on AMDR in assessing population groups, see the Health Canada publication Reference Guide to Understanding and Using the Data - 2015 Canadian Community Health Survey- Nutrition, Section 2.2.6 page 28Footnote 1.
- EAR is the Estimated Average Requirement. In the context of reporting results in a population-based survey such as the 2004 and 2015 CCHS-Nutrition, the primary use of the EAR is to estimate the prevalence of inadequacy of some nutrients in a group. For further information on EAR and how to interpret the prevalence of inadequacy in a population see the Health Canada publication The Reference Guide to Understanding and Using the Data - 2015 Canadian Community Health Survey - Nutrition, Section 2.2. 2, page 24Footnote 1.
- AI is the Adequate Intake. The level of intake at the AI (shown in the AI columns) is the recommended average daily intake level based on observed or experimentally determined approximations or estimates of nutrient intake by a group or groups of apparently healthy people that are assumed to be adequate. It is developed when an EAR cannot be determined. The percentage of the population having a usual intake above the AI (shown in the %>AI columns) almost certainly meets their needs. The adequacy of intakes below the AI cannot be assessed, and should not be interpreted as being inadequate. For further information on AI and how to interpret the prevalence of inadequacy in a population, see the Health Canada publication Reference Guide to Understanding and Using the Data - 2015 Canadian Community Health Survey - Nutrition, Section 2.2.4, pages 25-26Footnote 1.
- UL is the Tolerable Upper Intake Level. The level of intake at the UL (shown in the UL columns) is the highest average daily intake level that is likely to pose no risk of adverse health effects to almost all individuals in the general population. For further information on UL and how to interpret the prevalence of intakes above the UL in a population, see the Health Canada publication The Reference Guide to Understanding and Using the Data - 2015 Canadian Community Health Survey - Nutrition, Section 2.2.5, page 28Footnote 1. In 2017, the Guiding Principles for Developing Dietary Reference Intakes Based on Chronic Disease recommended that the UL be retained in the expanded DRI model, but that it should characterize toxicological riskFootnote 10.
- The Chronic Disease Risk Reduction Intake (CDRR) is the lowest level of intake for which there is sufficient strength of evidence to characterize a chronic disease risk reduction. For more detailed understanding of the CDRR and its interpretation when assessing intakes of particular nutrients, consult the 2017 National Academies report, Guiding Principles for Developing Dietary Reference Intakes Based on Chronic DiseaseFootnote 10.
- For a more detailed understanding of DRIs and their interpretation when assessing intakes of particular nutrients, consult the summary of the series of publications on DRIs published by the Institute of Medicine: Dietary Reference Intakes: The Essential Guide to Nutrient Requirements, (2006)Footnote 8.
- For more detailed understanding of DRIs and their interpretation when assessing intakes of sodium and potassium, consult the Dietary Reference Intakes for Sodium and Potassium, 2019Footnote 11.
- Data on trans-fat intake cannot be obtained from the 2004 and 2015 CCHS-Nutrition datasets and therefore are not reported separately. However, the estimates for percent energy from total fat comprise all fats, including trans-fats. Note that the estimates provided for energy intake from the individual types of fat will not add up to the estimates provided for total fat due to measurement error as well as the lack of data on trans-fat intake.
- In terms of precision, the estimate 0.0 with a standard error of 0.0 refers to a standard error smaller than 0.1%.
- Data with a coefficient of variation (CV) from 16.6% to 33.3% are identified as follows: (E) use with caution.
- Data with a coefficient of variation (CV) greater than 33.3% with a 95% confidence interval entirely between 0 and 3% are identified as follows: <3 interpret with caution.
- Data with a coefficient of variation (CV) greater than 33.3% were suppressed due to extreme sampling variability and are identified as follows: (F) too unreliable to be published.
- Comparisons between the 2004 and 2015 CCHS-Nutrition were calculated using paired t-tests without adjustment for multiple comparisons.
- Data are not adjusted for differences in methodology between the 2004 and 2015 CCHS-Nutrition. For additional information on what differed between years and potential implications, please refer to section 2.4 of this methodology document.
Appendix B - List of dietary components
Dietary Components |
|
|---|---|
Energy and macronutrients |
Total energy intake Total carbohydrates Percentage of total energy intake from carbohydrates Total sugars Percentage of total energy intake from sugars Total fats Percentage of total energy intake from fats Total saturated fats Percentage of total energy intake from saturated fats Total monounsaturated fats Percentage of total energy intake from monounsaturated fats Total polyunsaturated fats Percentage of total energy intake from polyunsaturated fats Linoleic acid Percentage of total energy intake from linoleic acid Linolenic acidFootnote a Percentage of total energy intake from linolenic acid ProteinFootnote b Percentage of total energy intake from protein Total dietary fibreFootnote c Cholesterol |
Vitamins |
Vitamin AFootnote d Vitamin B6 Vitamin B12 Vitamin C Vitamin C - by smoking status Vitamin D Folate FolacinFootnote e Naturally occurring folate Niacin Riboflavin Thiamin |
Minerals |
Calcium IronFootnote f Magnesium Phosphorus Potassium Sodium Zinc |
Other Dietary Components |
Caffeine MoistureFootnote g |
|
|
References
- Footnote 1
-
Health Canada. Reference Guide to Understanding and Using the Data - 2015 Canadian Community Health Survey- Nutrition. 2017. Available at: https://www.canada.ca/en/health-canada/services/food-nutrition/food-nutrition-surveillance/health-nutrition-surveys/canadian-community-health-survey-cchs/reference-guide-understanding-using-data-2015.html
- Footnote 2
-
Tooze JA, Midthune D, Dodd KW, et al.: A new statistical method for estimating the usual intake of episodically consumed foods with application to their distribution. J Am Diet Assoc 2006;106: pp. 1575-1587.
- Footnote 3
-
Tooze JA, Kipnis V, Buckman DW, et al.: A mixed-effects model approach for estimating the distribution of usual intake of nutrients: the NCI method. Stat Med 2010; 29: pp. 2857-2868.
- Footnote 4
-
Nusser SM, Carriquiry AL, Dodd KW, Fuller WA: A semiparametric transformation approach to estimating usual daily intake distributions. J Am Stat Assoc 1996; 91: pp. 1440-1449.
- Footnote 5
-
Health Canada. Canadian Community Health Survey, Cycle 2.2, Nutrition (2004) Nutrient Intakes from Food Provincial, Regional and National Summary Data Tables, Volume 1, 2 and 3.
- Footnote 6
-
Davis KA, Gonzalez A, Loukine L, Qiao C, Sadeghpour A, Vigneault M, Wang KC, Ibanez D. Early experience analyzing dietary intake data from the Canadian Community Health Survey - Nutrition using the National Cancer Institute (NCI) Method. Nutrients 2019; 11: pp. 1908.
- Footnote 7
-
National Research Council. The probability approach Nutrient Adequacy: Assessment Using Food Consumption Surveys 1986., Washington, DC: National Academy Press, pp. 25-40.
- Footnote 8
-
Otten JJ, Hellwig JP, Meyers LD. Dietary Reference Intakes. The Essential Guide to Nutrient Requirements. 2006. Washington, D.C.: National Academies Press.
- Footnote 9
-
Krebs-Smith SM, Guenther PM, Subar AM, Kirkpatrick SI, Dodd KW. Americans do not meet federal dietary recommendations. The Journal of Nutrition 2010; 140, pp. 1832-1838.
- Footnote 10
-
National Academies of Sciences, Engineering, and Medicine. 2017. Guiding principles for developing Dietary Reference Intakes based on chronic disease. Washington, DC: The National Academies Press.
- Footnote 11
-
National Academies of Sciences, Engineering, and Medicine. 2019. Dietary Reference Intakes for sodium and potassium. Washington, DC: The National Academies Press.
- Footnote 12
-
IOM (Institute of Medicine). Dietary Reference Intakes for energy, carbohydrate, fibre, fat, fatty acids, cholesterol, protein, and amino acids (Macronutrients). 2005. Food and Nutrition Board, Institute of Medicine. The National Academies Press, Washington, DC.
- Footnote 13
-
Health Canada. Proposed Policy: Definition and Energy Value for Dietary Fibre. Food Directorate, Health Products and Food Branch, Health Canada. 2010. Available at: https://www.canada.ca/en/health-canada/services/food-nutrition/public-involvement-partnerships/proposed-policy-definition-energy-value-dietary-fibre/consultation.html