
Characteristics and Labour Market Outcomes of Internationally Educated Health Care Professionals in Canada
Download in PDF format
(2.61 MB, 62 pages)
Organization: Health Canada
Date published: 2023-10-06
Cat.: H22-4/35-2023E-PDF
ISBN: 978-0-660-67821-4
Pub.: 230381
Acknowledgements
Kristyn Frank and Jungwee Park are with the Health Analysis Division at Statistics Canada
Patrick Cyr and Susan Weston are with Health Care Programs and Policy Directorate at Health Canada
Feng Hou is with the Social Analysis and Modelling Division at Statistics Canada
The authors would like to thank the following reviewers for their helpful comments on this paper: Caroline Ewen and Joan Atlin from World Education Services, Thy Dinh, Kisalaya Basu, Olesya Levina, and Olena Schell from Health Canada, and Dafna Kohen and Li Xue from Statistics Canada.
Executive summary
Using the 2021 Canadian Census of Population, this study provides new information on the demographic profile and labour market outcomes of immigrants who are internationally educated health care professionals (IEHPs) in Canada. Labour market outcomes are presented by detailed sociodemographic characteristics.
There were an estimated 259,695 IEHPs aged 18 to 64 residing in Canada in 2021. They accounted for 13% of all Canadians in the same age group with postsecondary education in a health field (excluding non-permanent residents). Most IEHPs were found in Ontario (116,310), followed by British Columbia (45,235), Alberta (42,035), and Quebec (30,595).
One-third (33%) of IEHPs had studied nursing and 15.2% reported studying medicine. Pharmacy (8%) and dentistry (8%) were also among the top fields of study. Lower proportions of IEHPs reported fields of study related to laboratory and diagnostics (3%), personal support work (2%), and therapeutic services (1%). Over one-third of IEHPs had a bachelor's degree, and about 2 in 10 had a degree in medicine, dentistry, or optometry. The majority of IEHPs received their education in Asia, while just over 1 in 10 studied in an English-speaking Western country.
About 7 in 10 of IEHPs were women and most were under the age of 50. Nearly one-third of IEHPs had recently arrived in Canada (between 2016 and 2021) and the majority entered Canada under either the Federal Skilled Worker (FSW) or provincial programs. Most IEHPs were able to speak at least one of Canada's official languages, with the majority reporting another mother tongue, but proficiency in English.
Overall, 76% of IEHPs in Canada were employed in 2021. Among the employed, nearly 6 in 10 worked in health occupations. Newfoundland and Labrador had the highest proportion of IEHPs working in health occupations (74%), while more than 6 in 10 IEHPs in Prince Edward Island, Nova Scotia, and Saskatchewan were also employed in health occupations.
The labour market outcomes of IEHPs varied by field of study. The employment rate ranged from 79% to 81% among IEHPs who studied pharmacy, laboratory and diagnostics, nursing, or therapeutic services, compared with 73% among those who studied medicine and 72% among those who studied dentistry. Among IEHPs who were employed, those who had studied nursing had the highest proportion (69%) working in health occupations, followed by those studied medicine (67%). Across the other major fields of study, 63% of IEHPs who studied pharmacy and 60% who studied dentistry were employed in health occupations. Employed IEHPs who studied medicine had the highest average annual earnings ($89,800), followed by those who studied pharmacy ($64,300), therapeutic services ($58,350), and nursing ($56,500).
The educational level and region of education mattered to the employment outcomes of IEHPs. IEHPs whose highest educational credential was a bachelor's degree had the highest employment rate (81%) followed by 79% of those with a graduate degree (not in medicine, dentistry, or optometry) and 73% of those with a degree in medicine, dentistry, or optometry. Employed IEHPs with a degree in medicine, dentistry, or optometry were more likely to be employed in professional health occupations. IEHPs who were educated in Asia were less likely to obtain employment in a health occupation than those who were educated in most other regions. Also, IEHPs who had studied in English-speaking Western countries or French- speaking European countries had higher earnings than those educated in Asia.
Sociodemographic characteristics were associated with different labour market outcomes of IEHPs. While men were less likely than women to be employed in a health occupation, they were more likely to be employed in managerial or professional health occupations. Women were more likely than men to work in technical or lower-skilled health occupations. Among employed IEHPs, men earned more than women, even when accounting for the differences in the type of health occupation they held. IEHPs in most racialized groups were less likely to work in professional health occupations compared with non-racialized, non-Indigenous IEHPs. Language also mattered to employment outcomes of IEHPs—those whose mother tongue was a non-official language and who did not speak English or French were least likely to obtain employment in a health occupation.
Recency of immigration and immigration class were also important factors differentiating the labour market outcomes of IEHPs. Recent IEHPs who arrived in Canada between 2016 and 2021 had lower employment rates and higher unemployment rates and were also less likely to obtain employment in a health occupation, especially in professional health occupations. As a result, recently arrived IEHPs had the largest earnings gap with immigrants who arrived earlier. IEHPs who immigrated under the family class, or refugee or humanitarian classes were less likely to obtain employment in a health occupation, more likely to obtain employment in lower-skilled health occupations, and earned less than their counterparts who immigrated under the Federal Skilled Worker or provincial programs.
In conclusion, IEHPs are a diverse population with variations in their characteristics, such as fields of study, educational attainment, time of arrival in Canada, and official language proficiency, which were associated with different labour market outcomes. Findings from this study can help inform policymakers about the degree to which IEHPs are not using their skills and educational training in the health sector and which groups of IEHPs may be experiencing greater barriers to entering health occupations in Canada. The results will also be of importance to IEHPs themselves, as well as to employers of health care professionals.
Introduction
Immigrants who received their educational training outside of Canada have had a long history of contributing to the country's labour force. However, many internationally educated immigrants encounter barriers to entering their chosen professions or fields in Canada, such as difficulties having their international credentials and work experience recognized by employers. This is particularly true for those seeking employment in regulated professions in the health care sector such as physicians, nurses, and dentists. The underutilization of internationally trained health workers is associated with the deskilling of these workers which can lead to a loss of their skills and previously held occupational status as well as underemployment in more precarious jobs (Bauder, 2003; Grez, Gamboa, and Purewal, 2023).
Labour shortages in health care professions have been a concern across many Canadian jurisdictions and have intensified during the COVID-19 pandemic. To respond to these shortages, the Government of Canada announced investments towards initiatives that aim to remove barriers for internationally educated health care professionals (IEHPs), support IEHPs with obtaining Canadian work experience, and enable labour mobility of IEHPs and other health care professionals across jurisdictions (ESDC, 2022). Citing "acute shortages" of health care professionals such as physicians, nurses, paramedics, and medical laboratory technicians (ESDC, 2022), these investments are intended to facilitate immigrants with skills and qualifications in health care to enter the professions in which they were trained when they are in Canada.
The provinces and territories also play an important role in the integration of IEHPs into health care occupations. First, the provinces and territories have the authorityFootnote 1 to set requirements for certification or licensure of a regulated health occupation, or minimum educational and training standards in the case of non-regulated health professions (i.e., personal support workers), including credential recognition for IEHPs (ESDC, 2023). Second, Canada's provinces and territories have implemented various training and licensing initiatives to ease the barriers experienced by IEHPs and health professionals from other jurisdictions in Canada trying to enter health care occupations (Government of Saskatchewan, 2022; World Employment Services, 2023). Recruitment programs streamlining the process for entering certain health care professions, such as nursing, have been implemented by several provinces, and many also offer programs that facilitate IEHPs in navigating the assessment and licensing processes. For example, New Brunswick has the "Internationally Educated Nurses (IEN) navigation service" for nurses and has extended this program to support IEHPs in other health care professions (Government of New Brunswick, n.d.). Provincial governments also provide financial supports for IEHPs such as bursaries and tuition support and many have provided funding to expand the number of seats in training and bridging programs for IEHPs. Regulatory reforms, such as the creation of new classes of licensing that are inclusive of IEHPs, have also been implemented in provinces such as British Columbia, Newfoundland and Labrador, and Ontario (World Education Services, 2023).
While previous research has examined the employment of IEHPs in Canada using 2016 census data (Hou and Schimmele, 2020)Footnote 2, information based on more recent data is needed. There is also a need for more detailed information about their characteristics and how different groups of IEHPs may experience greater difficulties entering health occupations than others. Reaching a better understanding of the employment of IEHPs in health fields is valuable for addressing labour shortages in health care and enabling IEHPs to use the skills they bring with them to Canada.
This study first provides recent estimates of the number of IEHPs in Canada by province and territory. Following this, the data are disaggregated to provide more insight into the sociodemographic, educational, and immigration-related characteristics of IEHPs. Results on the labour market outcomes of IEHPs are then presented, which are also disaggregated by various characteristics. Lastly, regression models are estimated to provide greater clarity on the labour market outcomes of IEHPs when accounting for differences in their characteristics. Specifically, these models examine the likelihood of IEHPs being employed in a health occupation, the type of health occupation in which they are employed, and their earnings. Combined, these results will better inform policymakers about the characteristics and labour market outcomes of this group of immigrants, providing more information on the sociodemographic, educational, or immigration-related characteristics that are associated with their employment outcomes in Canada.
Background
Internationally educated health care providers (IEHPs) play an important role in Canada's health workforce (Dumont et al., 2008; World Education Services, 2022). Historically, the role of immigrants in Canada's health care system has fluctuated, as immigration policies have responded to perceived shortages or surpluses of health care professionals at different points in time (Dumont et al., 2008). However, IEHPs are now in demand globally and considered critical for addressing Canada's increasing health care needs (Campbell-Page et al., 2013; Covell, Neiterman, and Bourgeault, 2016; Darzi and Evans, 2016; World Education Services, 2022).
Currently, the aging workforce and labour shortages in key health professions are chief concerns in Canada. In particular, the pressures of the COVID-19 pandemic have substantially impacted the health care workforce (Murphy et al., 2022; Tardif et al., 2022; World Education Services, 2022). To better support the Canadian health workforce, questions have been raised regarding the number of IEHPs in Canada and the additional supply of IEHPs that may be needed (Harun and Walton-Roberts, 2022). This increased interest has pointed to an increasing importance of IEHPs in supporting Canada's health care system.
Previous research has found that immigrants educated outside of Canada are largely overqualified for the occupations they hold in Canada, particularly in the initial years after immigration. For example, in 2016 nearly half (47%) of IEHPs between the ages of 20 and 44 in Canada were either not employed or employed in non-health occupations that required no more than a high school diploma (Hou and Schimmele, 2020).Footnote 3 Additionally, immigrants tend to be over-represented in certain types of health occupations such as nursing and health support occupations (Cornelissen, 2021).
The over-education of qualified health workers not only leads to a loss of their skills but can also result in IEHPs working in more precarious jobs with lower occupational status than their previous positions in health care professions (Bauder, 2003; Grez, Gamboa, and Purewal, 2023). In Ontario, IEHPs were found to be more likely to enter lower-wage occupations and to work outside of the health care sector than their Canadian-born and educated counterparts (Augustine and Commissioner, 2015); often, internationally educated medical graduates report difficulties finding alternative employment in health care (Wang et al., 2023). Among recent immigrants employed as nurse aides, orderlies, and patient service associates, about 45 percent had at least a bachelor's degree, and over 40 percent had a bachelor's degree in a health- related field of study (Turcotte and Savage, 2020).
Many studies have found that IEHPs in Canada face barriers to obtaining employment in their fields. Numerous policy and programmatic initiatives, particularly at the provincial level, are aiming to address barriers to registration and employment, which underscores the need to have accurate and current data to inform decision-making. One of the key challenges experienced by IEHPs is the registration requirements of provincial regulatory bodies, such as educational or recent practice requirements, some of which can only be obtained in Canada. Additionally, immigrants have reported difficulties having their international credentials or work experience recognized by employers in Canada (e.g., Guo, 2009; Houle and Yssaad, 2010; Walton-Roberts, 2023); this is particularly true for those seeking employment in regulated occupations in the health care sector. Bauder (2003) identified these types of barriers as a means of excluding immigrant workers from higher-status occupations, also referred to as labour segmentation.
Other researchers have noted that certain groups of IEHPs, such as women and racialized groups, are particularly impacted by labour segmentation (Bourgeault, 2013; Walters-Roberts, 2022). Moreover, while the majority of health care workers in Canada were women in 2016, they also accounted for over 8 in 10 adults with a health education whose education was underutilized (Hou and Schimmele, 2020). Among racialized workers with an education in health fields, there was a higher proportion who were either unemployed or not working in a health occupation in 2016 than working in a health occupation (Hou and Schimmele, 2020). Geographic differences in the underutilization of individuals trained in health fields have also been observed, with the highest share residing in Ontario (Hou and Schimmele, 2020). Therefore, a more detailed analysis of differences in the labour market outcomes of IEHPs across different sociodemographic characteristics and in different regions of Canada is needed.
The location of education outside of Canada as well as the shifting source countries of immigrants may also be connected to the difficulties IEHPs experience when trying to obtain employment in their fields in Canada (Girard and Smith, 2013; Hou and Schimmele, 2020). For example, previous research indicates that the process of licensure for physicians may favour graduates from certain Western countries as regulations that are required for some IEHPs, such as exams and service obligations, are waived for physicians from many Western countries (Grez, Gamboa, and Purewal, 2023). While the representation of IEHPs from Western nations such as the United Kingdom has decreased over time, immigrants from other regions of the world, such as India and the Philippines, have increased their importance as sources of health care professionals in Canada (Cornelissen, 2021; Covell et al., 2017; Dumont et al., 2008; Harun and Walton-Roberts, 2022). Other educational factors such as field of study may also play a role in employment outcomes. For example, about one-third of IEHPs aged 20 to 44 who studied nursing were underutilized (did not work in the field) in 2016, compared to only 12% of IEHPs who studied medicine and 8% who studied pharmacy (Hou and Schimmele, 2020). Therefore, field of study is important to consider when examining the labour market outcomes of IEHPs.
Previous research on IEHPs has examined the employment challenges that certain groups of IEHPs experience either within particular jurisdictions in Canada or specific occupations (Cornelissen, 2021; Harun and Walton-Roberts, 2022; Walton-Roberts, 2023; Wang et al., 2023). While several studies focus on the over-qualification and deskilling experienced by IEHPs in Canada, a key gap is disaggregated data on IEHPs (World Education Services, 2022) which can provide a better understanding of which groups may be at a particular disadvantage in obtaining employment in the health care sector. There is also a need for more up-to-date information on the number of IEHPs in Canada to better inform policymakers on the potential supply of qualified health care workers. Further, more detailed information on the underutilization of skills among IEHPs would contribute to "planning and policy measures necessary to equitably rebuild Canada's health workforce" (World Education Services, 2022).
This study addresses several of these information gaps. First, it presents estimates of the number of IEHPs in Canada based on the 2021 Census, the most recent census data available. Second, information on the sociodemographic characteristics of IEHPs is provided. Results for several labour market outcomes are also presented across these different characteristics, allowing for more information on which groups of IEHPs may be experiencing greater difficulty obtaining employment in health occupations. Furthermore, the study delves into the types of health occupations held by IEHPs, providing insight into their integration within the health care sector.
Research questions
This study addresses the following research questions:
- How many IEHPs were estimated to be residing in Canada and the provinces/territories in 2021?
- What was the representation of IEHPs across key sociodemographic characteristics?
- What were the general labour market outcomes (employment rates, unemployment rates, annual mean earnings) of IEHPs in Canada and how do they vary across sociodemographic characteristics?
- What proportion of IEHPs in Canada were employed in health occupations in 2021 and in what types of occupations were they employed (managerial, professional, technical, or lower-skilled)?
- Were certain sociodemographic characteristics significantly associated with the likelihood of IEHPs being employed in health occupations?
- Were certain sociodemographic characteristics significantly associated with the type of health occupation in which IEHPs were employed (i.e., managerial, professional, technical, or lower-skilled health occupations)?
- Were certain sociodemographic and employment characteristics (e.g., employed in health/ non-health occupation) associated with higher or lower annual earnings among IEHPs?
Data and methods
Data source and sample
This study uses the 2021 Canadian Census of Population to examine internationally educated health care professionals (IEHPs) in Canada. The Census of Population is based on a sample of 25% of Canadian households and provides information on a range of sociodemographic, geographic, ecysonomic, and labour market characteristics. Of particular interest for the study of IEHPs in Canada are immigration class, age and year of immigration, educational attainment (highest certificate, diploma or degree completed), field of study, and the location of study associated with the highest certificate, diploma, or degree.
Since this study largely focuses on the labour market outcomes of IEHPs, the sample was restricted to individuals who were between the ages of 18 to 64. The decision to set the age limit to 64 was made because age 65 is typically considered retirement age in Canada. Overall, the size of the analytical sample was 63,098, representing 259,695 IEHPs.
For the analysis of employment rates, the sample included all IEHPs aged 18 to 64, and for the analysis of unemployment rates, the sample included all IEHPs aged 18 to 64 who were in the labour force. For the other labour market outcomes examinedFootnote 4, the sample was restricted to only those IEHPs aged 18 to 64 who worked during the census reference week (May 2 to May 8, 2021). This is a standard approach to examining labour outcomes as it ensures valid information for outcomes such as earnings at a common reference point and provides comparable results across different groups. Additionally, including only individuals who were employed during the census reference week is preferable when examining recent immigrants as they may report previous jobs held in 2020 or 2021Footnote 5 that were held outside of Canada (Cornelissen, 2023).
Measures
In this study, IEHPs were defined as individuals who are, or ever have been, landed immigrants or permanent residents, who held a postsecondary certificate, diploma, or degree in a health field of study, and who received their highest certificate, diploma, or degree outside of Canada. The Canadian-born population who received their highest certificate, diploma, or degree in health in a foreign country were excluded. Non-permanent residents (NPRs) were also excluded from this study as they have different labour market circumstances than permanent residents and might be undercounted in the census data due to their high mobility (Tuey and Bastien, 2023). Therefore, the exclusion of this population may affect the estimation of IEHPs who arrive in Canada through NPR programs.Footnote 6
The census data used the 2021 Classification of Instructional Programs (CIP) to classify fields of study; 66 fields were identified as health fields for this study. Detailed information on the health fields of study can be found in Appendix Table 1.
Select sociodemographic and labour variables were used to further understand the characteristics of IEHPs in Canada. The distributions of IEHPs by sociodemographic characteristics are presented by gender (men+, women+)Footnote 7, age group in 2021 (18–29 years, 30–39 years, 40–49 years, 50–59 years, 60–64 years), age at immigration (24 years or younger, 25–34 years, 35–44 years, 45 years or older), year of immigration (before 2000, 2000–2009, 2010–2015, 2016–2021), immigration admission class (Federal Skilled Worker program, provincial programs such as the Provincial Nominee program, other economic immigrants, family immigrants, refugees or humanitarian class, immigrants who arrived before 1980), language (English mother tongue, French mother tongue, other mother tongue and speaks English, other mother tongue and speaks French, other mother tongue and speaks English and French, other mother tongue and does not speak English or French), and population groupFootnote 8 (non-racialized and non-Indigenous, South Asian, Chinese, Black, Filipino, Arab or West Asian, Southeast Asian, Korean or Japanese, other racialized population groups).
Results are also presented by educational characteristics of interest. Education level reflects the highest postsecondary certificate, diploma, or degree received and was divided into the following groups: less than a bachelor's degree; bachelor's degree, graduate degree excluding a degree in medicine, dentistry, or optometry; degree in medicine, dentistry, or optometry. Results for broad fields of study are also presented including the following: medicine and medical fields, nursing, therapeutic services, laboratory/diagnostics, pharmacy, personal support workFootnote 9, and dentistry. Detailed information about the fields of study included for each of these categories can be found in Appendix Table 2. Region of education was also examined and broken into the following categories: English-speaking Western countries (United States, United Kingdom, Australia, New Zealand); French-speaking European countries (France, Belgium, Luxembourg, Switzerland); other European countries; Caribbean, Central, and South America; Africa; and Asia.
Several labour market outcomes of interest are also examined. First, employment and unemployment rates are reported. Employment is presented as the percentage of IEHPs who were in employment during the census reference week (May 2 to May 8, 2021); unemployment is presented as the percentage of IEHPs who were available for work but without employment during the census reference week. Mean annual employment income for IEHPs employed in the census reference week is also reported across sociodemographic characteristics. Annual earnings are based on the calendar year preceding the census year (i.e., 2020).
This study also examines employment in health occupations to get a sense of the extent to which IEHPs are working in jobs related to their educational background. The first measure examines the percentage of IEHPs employed in a health occupation during the census reference week. The health occupations were classified according to the 2021 National Occupational Classification (NOC), including specialized middle management occupations in health care (NOC group 30), professional occupations in health (NOC group 31), technical occupations in health (NOC group 32), and assisting occupations in supporting health services (NOC group 33). A list of all occupations classified as health occupations is presented in Appendix Table 3 at the 5-digit (unit group) level of the NOC. For this measure, all occupations were grouped together and identified as health occupations.
The second measure examines the types of health occupations in which IEHPs were employed during the census reference week. The types of occupations are based on the skill levels required to work in an occupation and were identified using the Training, Education, Experience, and Responsibility (TEER) categories, a new categorization introduced in the 2021 NOC Version 1.0. Health occupations were grouped into the following TEER groups:
- Management occupations: occupations with management responsibilities, including legislators, senior managers, and middle managers.
- Professional occupations: TEER 1
- Occupations that require completion of a university degree (bachelor's, master's, or doctorate) or previous experience and expertise in subject matter knowledge from a related occupation found in TEER 2 (when applicable).
- Technical occupations: TEER 2 and TEER 3 occupations
- TEER 2: occupations that usually require completion of a postsecondary education program of two to three years at a community college, institute of technology, or CEGEP; or completion of an apprenticeship training program of two to five years; or occupations with supervisory or significant safety responsibilities; or several years of experience in a related occupation from TEER 3 (when applicable).
- TEER 3: occupations that usually require completion of a postsecondary education program of less than two years at a community college, institute of technology, or CEGEP; or completion of an apprenticeship training program of less than two years; or more than six months of on-the-job training, training courses, or specific work experience, with some secondary school education; or several years of experience in related occupations from TEER 4 (when applicable).
- Lower-skilled occupations: TEER 4 and TEER 5 occupations
- TEER 4: occupations that usually require completion of secondary school; or several weeks of on-the-job training with some secondary school education; or experience in a related occupation from TEER 5 (when applicable).
- TEER 5: occupations that usually require a short work demonstration and no formal educational requirements.
These skill level measures can provide a better understanding of the extent of underemployment among IEHPs with a university degree. For example, if a large proportion of IEHPs who have a university-level education or whose field of study is associated with higher levels of education (e.g., medicine) were employed in technical or lower-skilled health occupations, this would be an indication of their underemployment in Canada. In addition to these four types of health occupations, results for non-health occupations are also presented which will provide more information about the occupational attainment of IEHPs in Canada.
Analytical approach
This study addresses the research questions of interest using both descriptive and multivariate analyses. Research questions 1, 2, and 3 employ descriptive statistics to obtain an understanding of the characteristics and key labour market outcomes of IEHPs. Results for the descriptive statistics were estimated using the Generalized Specification system (G-Spec), a program that is designed to produce census tabular outputs. G-Spec has automated confidentiality methods which apply rounding and confidentiality rules to the census data.
Research questions 4, 5, and 6 were addressed through multivariate regression models. The first regression (research question 4) uses logistic regression to examine whether certain sociodemographic, education, and immigration characteristics were associated with the likelihood of IEHPs being employed in a health occupation in Canada in 2021. The independent variables of interest included major field of study, gender, age group, period of immigration, immigration class, highest level of education, language, region of education, population group, and province of residence. The dependent variable for this model is binary, indicating whether an individual was employed in a health occupation (coded as 1) or a non-health occupation (coded as 0) in 2021.
The second regression model (research question 5) examines whether certain sociodemographic, education, and immigration characteristics were significantly associated with the type of health occupation in which IEHPs were employed. This model employs the same set of independent variables as the first regression model. However, the analytical approach is a multinomial logit model, which is used to examine employment outcomes across several categories. These categories included health management occupations, professional health occupations, technical health occupations, and lower-skilled health occupations (refer to the Measures section for definitions of each occupational group).
For each of these models, the results are presented as marginal effects as they are more easily interpreted than regression coefficients or odds ratios. Marginal effects represent the change in probability when the predictor increases by one (continuous variable) or changes from 0 to 1 (binary variable).
Lastly, the third regression model (research question 6) examines whether certain sociodemographic, education, immigration, and employment characteristics are associated with higher or lower earnings among IEHPs in Canada. Log earnings in 2020 were used as the dependent variable to reduce the impact of cases with very high earnings on the model estimate. Two models were employed to examine this research question. The first (Model 1) included the same set of independent variables included in the previous regression models.Footnote 10 The second model (Model 2) determines whether the type of occupations that IEHPs hold is associated with earnings. For this model, the different types of health occupations specified above (management, professional, technical, lower-skilled) were included using non-health occupations as the reference category. The inclusion of the type of occupations in the second model allows for an examination of whether IEHPs in certain types of health occupations earned more or less than those employed in non-health occupations. These models employ ordinary least squares (OLS) regression models, and the coefficients can be interpreted proximately as a percent (when multiplied by 100) change in earnings associated with a unit change in the independent variable (while controlling for the other variables).
In estimating all descriptive statistics and regression models, census sample weights were used.
Results
Estimated population counts of IEHPs in Canada
Overall, there were an estimated 259,695 IEHPs between the ages of 18 and 64 residing in Canada in 2021 (Table 1). They accounted for 13% of all Canadians in the same age group with a postsecondary education in a health field (excluding temporary residents). Ontario had an estimated 116,310 IEHPs, the largest number across all jurisdictions. Following Ontario, British Columbia (45,235), Alberta (42,035), and Quebec (30,595) had the next highest number of IEHPs. Of the remaining provinces, Manitoba had 11,680 IEHPs while Saskatchewan had 7,280. The Atlantic Provinces had lower numbers of IEHPs, from 475 in Prince Edward Island to 3,195 in Nova Scotia. The three territories combined were estimated to have 605 IEHPs in 2021.
Estimated counts of IEHPs by major fields of study are also presented in Table 1. Generally, Ontario had the highest number of IEHPs who studied medicine (19,980) and nursing (32,655), followed by Alberta (5,605 and 16,410, respectively) and British Columbia (5,915 and 15,245, respectively). These provinces also had the highest numbers of IEHPs who studied pharmacy and dentistry fields. Population counts for the number of IEHPs by other sociodemographic characteristics can be found in Appendix Table 4.
Distribution of IEHPs across educational and sociodemographic characteristics
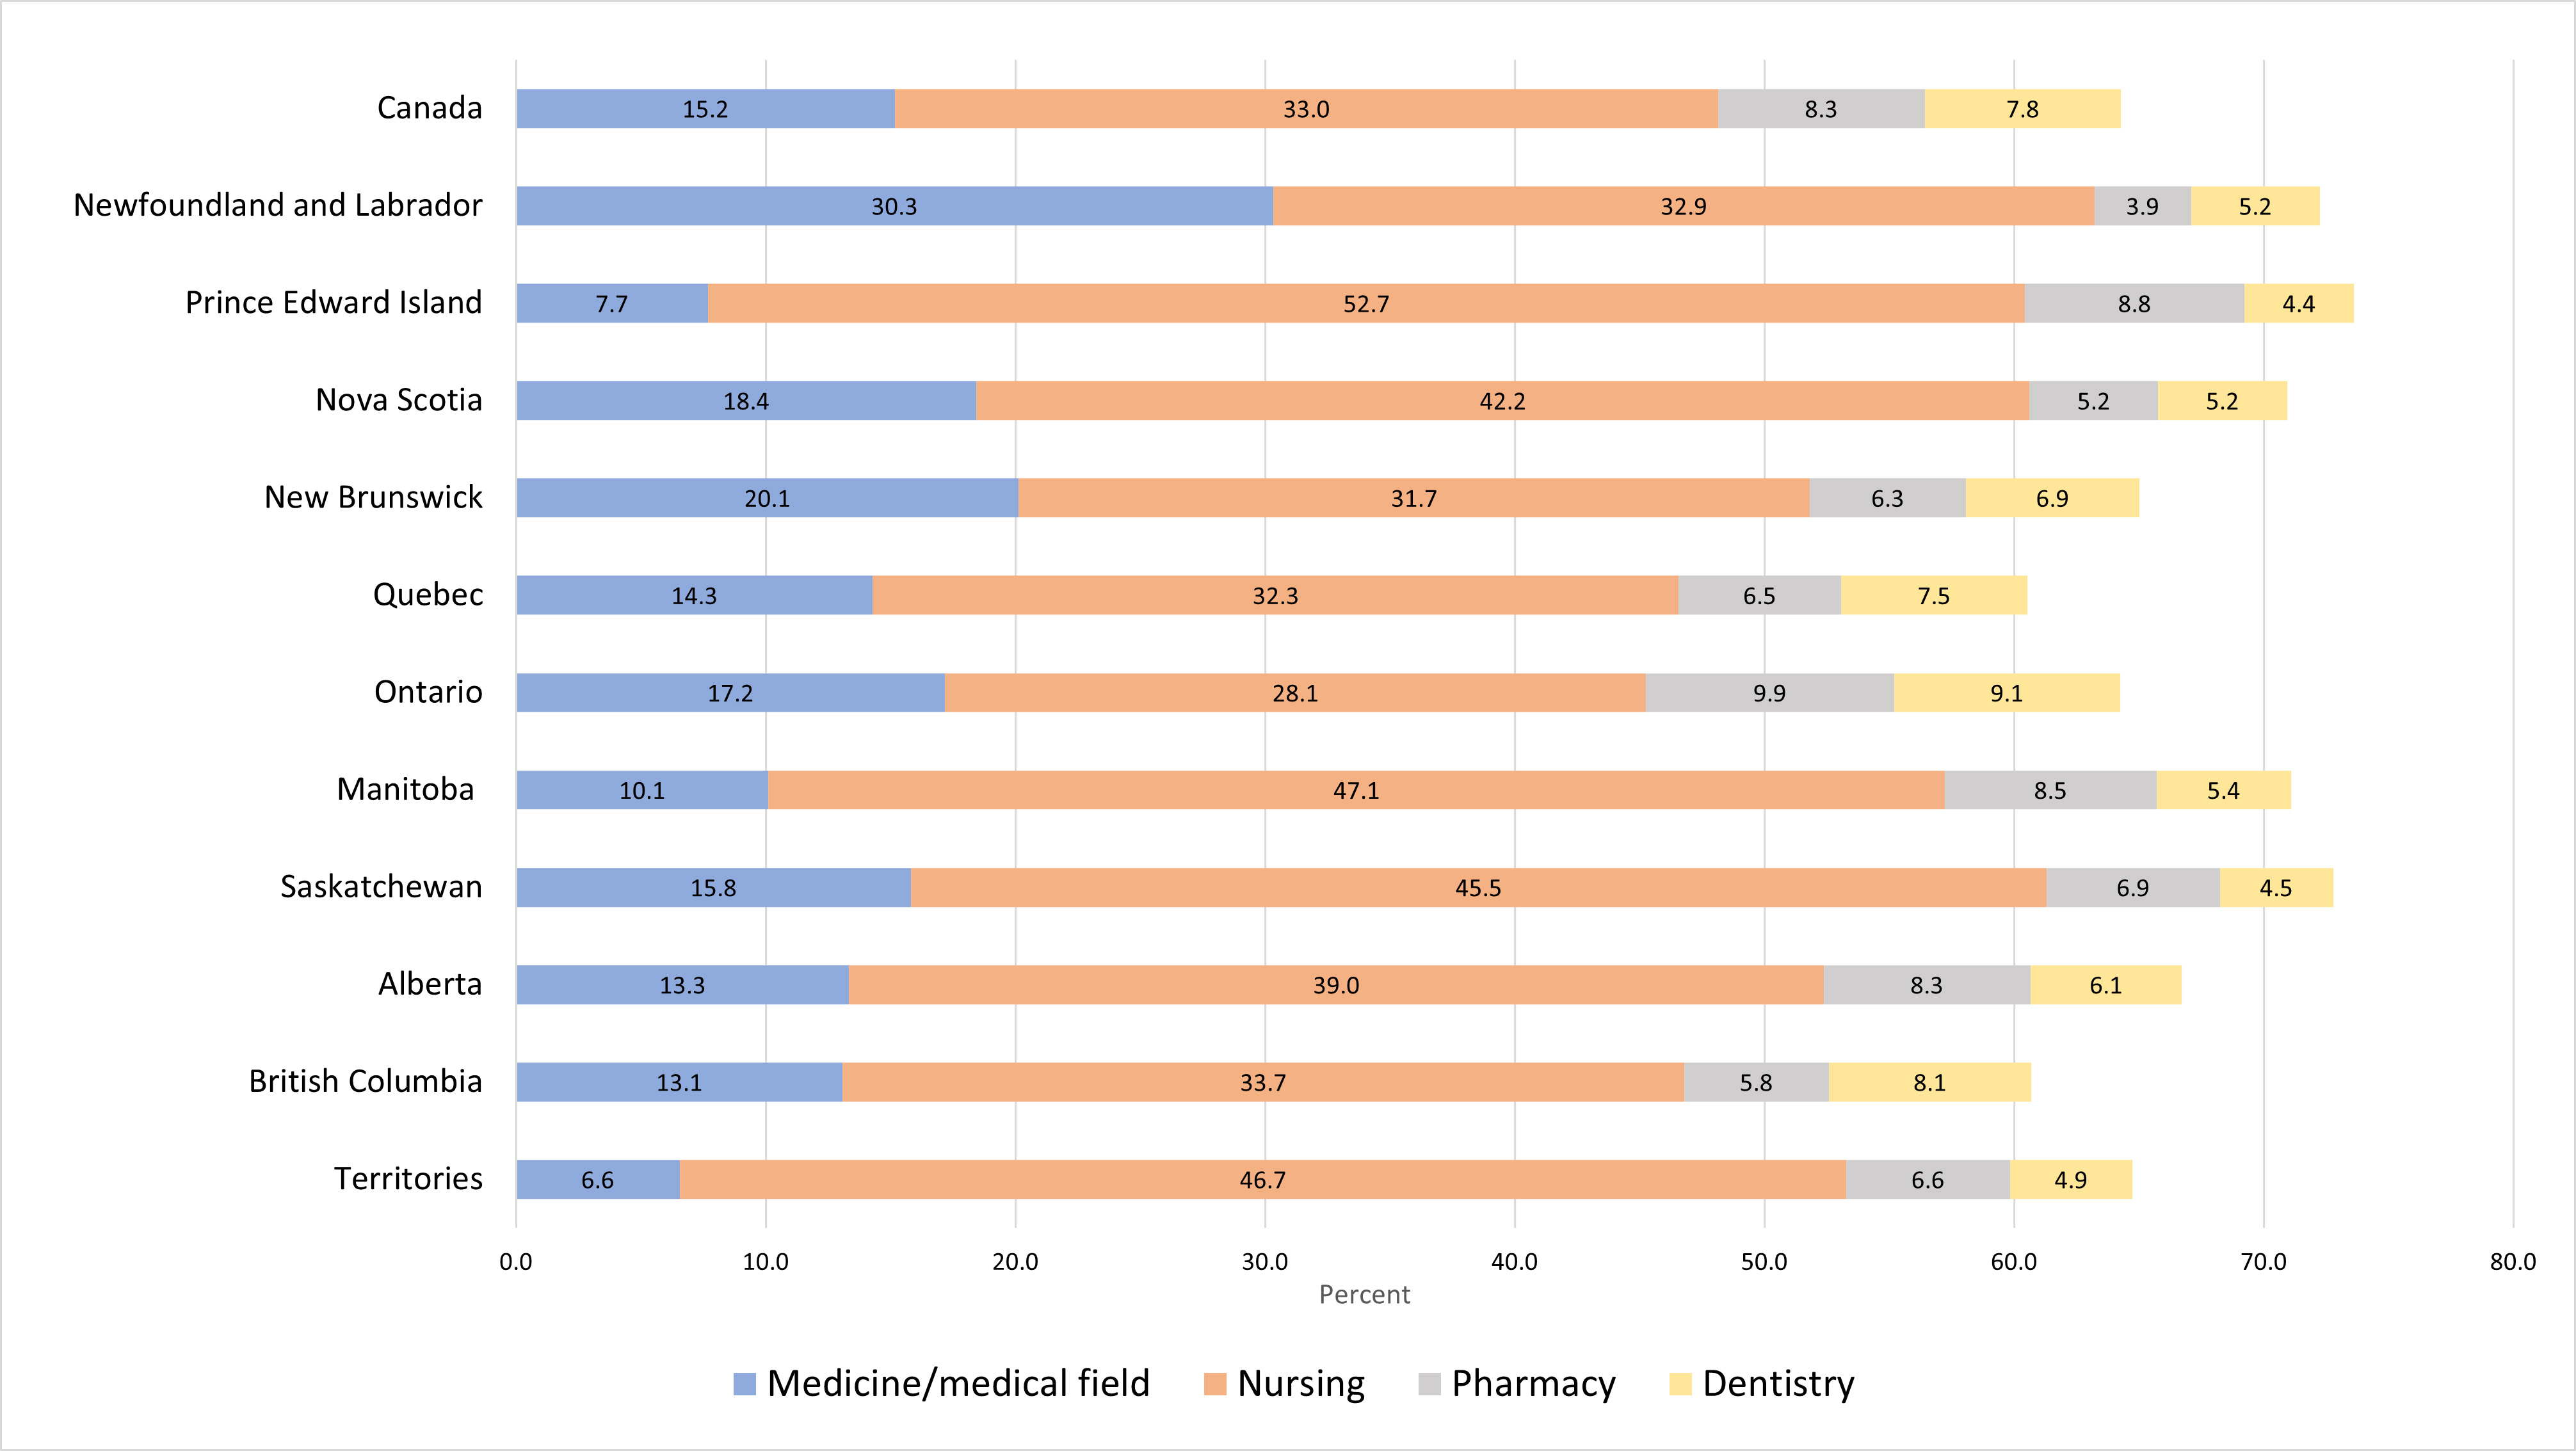
The percentage distribution of IEHPs across four major fields of study (medicine, nursing, pharmacy, and dentistry) is presented in Table 2 and Figure 1. About one-third of IEHPs in Canada had studied nursing (33.0%) and 15.2% reported studying medicine. Just under 1 in 10 IEHPs had studied either pharmacy or dentistry fields (8.3% and 7.8%, respectively). As shown in Table 2, low proportions of IEHPs reported studying fields related to laboratory/diagnostics (3.1%), personal support work (2.3%), and therapeutic services (0.8%), while about 3 in 10 had studied in other health fields.
The distribution of IEHPs across other educational characteristics is presented in Table 2. In Canada, over one-third of IEHPs aged 18 to 64 in Canada had a bachelor's degree (37.6%), while just over 2 in 10 had a degree in medicine, dentistry, or optometry (20.5%). About one-quarter reported having a postsecondary credential below a bachelor's degree (24.7%) and 17.2% had a graduate degree (not in medicine, dentistry, or optometry). Education levels varied across jurisdictions. Notably, over one-third of IEHPs in Newfoundland and Labrador (34.8%) had a degree in medicine, dentistry, or optometry, while New Brunswick (24.0%) and Ontario (23.8%) also had higher proportions of IEHPs with this type of degree compared to Canada overall.
| Canada | Newfoundland and Labrador | Prince Edward Island | Nova Scotia | New Brunswick | Quebec | Ontario | Manitoba | Saskatchewan | Alberta | British Columbia | Territories | |
|---|---|---|---|---|---|---|---|---|---|---|---|---|
| Total — All IEHPs | 259,695 | 770 | 475 | 3,195 | 1,520 | 30,595 | 116,310 | 11,680 | 7,280 | 42,035 | 45,235 | 605 |
| Major field of study | ||||||||||||
| Medicine/medical field | 39,410 | 235 | 35 | 590 | 305 | 4,370 | 19,980 | 1,180 | 1,150 | 5,605 | 5,915 | 40 |
| Nursing | 85,615 | 255 | 240 | 1,350 | 480 | 9,880 | 32,655 | 5,505 | 3,310 | 16,410 | 15,245 | 285 |
| Therapeutic services | 1,990 | 10 | 0 | 30 | 0 | 190 | 740 | 100 | 45 | 395 | 465 | 10 |
| Laboratory/diagnostic | 7,995 | 30 | 0 | 50 | 30 | 730 | 3,750 | 485 | 195 | 1,340 | 1,355 | 20 |
| Pharmacy | 21,540 | 30 | 40 | 165 | 95 | 1,985 | 11,570 | 990 | 505 | 3,485 | 2,625 | 40 |
| Personal support work | 5,890 | 10 | 10 | 70 | 50 | 1,175 | 2,300 | 310 | 110 | 895 | 940 | 25 |
| Dentistry | 20,365 | 40 | 20 | 165 | 105 | 2,290 | 10,535 | 630 | 330 | 2,550 | 3,670 | 30 |
| Other health fields | 76,890 | 165 | 110 | 780 | 450 | 9,975 | 34,780 | 2,480 | 1,630 | 11,355 | 15,015 | 160 |
Note: Sample size is 63,098. The estimated total population counts for some jurisdictions may differ slightly from the sum of IEHPs by fields of study due to suppression and rounding procedures Source: Statistics Canada, 2021 Census of Population. |
||||||||||||
| Canada | Newfoundland and Labrador | Prince Edward Island | Nova Scotia | New Brunswick | Quebec | Ontario | Manitoba | Saskatchewan | Alberta | British Columbia | Territories | |
|---|---|---|---|---|---|---|---|---|---|---|---|---|
| Region of education | ||||||||||||
| English speaking Western countries | 11.3 | 16.7 | 11.7 | 15.9 | 21.3 | 4.1 | 12.4 | 5.7 | 7.3 | 10.0 | 15.9 | 6.6 |
| French speaking European countries | 1.9 | 1.3 | 0.0 | 0.6 | 4.3 | 12.7 | 0.4 | 0.2 | 0.0 | 0.3 | 0.8 | 5.8 |
| Other European countries | 8.7 | 5.1 | 7.4 | 10.3 | 10.8 | 10.9 | 9.6 | 6.5 | 5.4 | 6.3 | 8.3 | 11.6 |
| Caribbean, Central and South America | 5.7 | 7.1 | 2.1 | 4.2 | 5.6 | 14.2 | 5.6 | 2.8 | 2.4 | 3.9 | 3.1 | 3.3 |
| Africa | 9.7 | 17.3 | 7.4 | 10.6 | 15.1 | 22.8 | 7.4 | 9.6 | 12.1 | 11.1 | 4.7 | 4.1 |
| Asia | 62.7 | 52.6 | 71.3 | 58.4 | 43.0 | 35.4 | 64.6 | 75.3 | 72.8 | 68.3 | 67.2 | 68.6 |
| Education level | ||||||||||||
| Postsecondary below bachelor's degree | 24.7 | 20.0 | 24.0 | 21.4 | 30.6 | 31.2 | 22.9 | 22.6 | 22.0 | 23.7 | 26.8 | 35.8 |
| Bachelor's degree | 37.6 | 29.7 | 43.8 | 39.6 | 27.6 | 31.4 | 34.8 | 52.2 | 45.1 | 44.6 | 37.7 | 42.5 |
| Graduate degree (not in medicine) | 17.2 | 15.5 | 21.9 | 17.2 | 17.8 | 18.5 | 18.6 | 11.7 | 14.2 | 14.3 | 17.3 | 11.7 |
| Degree in medicine, dentistry, or optometry | 20.5 | 34.8 | 10.4 | 21.8 | 24.0 | 18.9 | 23.8 | 13.5 | 18.7 | 17.4 | 18.2 | 10.0 |
| Fields of study | ||||||||||||
| Medicine/medical field | 15.2 | 30.3 | 7.7 | 18.4 | 20.1 | 14.3 | 17.2 | 10.1 | 15.8 | 13.3 | 13.1 | 6.6 |
| Nursing | 33.0 | 32.9 | 52.7 | 42.2 | 31.7 | 32.3 | 28.1 | 47.1 | 45.5 | 39.0 | 33.7 | 46.7 |
| Therapeutic services | 0.8 | 1.3 | 0.0 | 0.9 | 0.0 | 0.6 | 0.6 | 0.9 | 0.6 | 0.9 | 1.0 | 1.6 |
| Laboratory/diagnostic | 3.1 | 3.9 | 0.0 | 1.6 | 2.0 | 2.4 | 3.2 | 4.2 | 2.7 | 3.2 | 3.0 | 3.3 |
| Pharmacy | 8.3 | 3.9 | 8.8 | 5.2 | 6.3 | 6.5 | 9.9 | 8.5 | 6.9 | 8.3 | 5.8 | 6.6 |
| Personal support work | 2.3 | 1.3 | 2.2 | 2.2 | 3.3 | 3.8 | 2.0 | 2.7 | 1.5 | 2.1 | 2.1 | 4.1 |
| Dentistry | 7.8 | 5.2 | 4.4 | 5.2 | 6.9 | 7.5 | 9.1 | 5.4 | 4.5 | 6.1 | 8.1 | 4.9 |
| Other health fields | 29.6 | 21.3 | 24.2 | 24.4 | 29.7 | 32.6 | 29.9 | 21.2 | 22.4 | 27.0 | 33.2 | 26.2 |
Note: Sample size is 63,098. Source: Statistics Canada, 2021 Census of Population. |
||||||||||||
Figure 1 Distribution of IEHPs aged 18 to 64, by four major fields of study (medicine, nursing, pharmacy, and dentistry), Canada and the provinces and territories, 2021
Note: Sample size is 63,098.
Source: Statistics Canada, 2021 Canadian Census of Population.
Figure 1: Text description
| Canada | Newfoundland and Labrador | Prince Edward Island | Nova Scotia | New Brunswick | Quebec | Ontario | Manitoba | Saskatchewan | Alberta | British Columbia | Territories | |
|---|---|---|---|---|---|---|---|---|---|---|---|---|
| Medicine/ medical field |
15.2 | 30.3 | 7.7 | 18.4 | 20.1 | 14.3 | 17.2 | 10.1 | 15.8 | 13.3 | 13.1 | 6.6 |
| Nursing | 33.0 | 32.9 | 52.7 | 42.2 | 31.7 | 32.3 | 28.1 | 47.1 | 45.5 | 39.0 | 33.7 | 46.7 |
| Pharmacy | 8.3 | 3.9 | 8.8 | 5.2 | 6.3 | 6.5 | 9.9 | 8.5 | 6.9 | 8.3 | 5.8 | 6.6 |
| Dentistry | 7.8 | 5.2 | 4.4 | 5.2 | 6.9 | 7.5 | 9.1 | 5.4 | 4.5 | 6.1 | 8.1 | 4.9 |
|
Note: Sample size is 63,098. Source: Statistics Canada, 2021 Canadian Census of Population. |
||||||||||||
In contrast, about 1 in 10 IEHPs in Prince Edward Island and the territories had a degree in medicine, dentistry, or optometry. More than half of IEHPs in Manitoba reported a bachelor's degree as their highest degree or diploma, while notable proportions of IEHPs in Saskatchewan and Alberta also had this level of education (45.1% and 44.6%, respectively). The highest proportions of IEHPs who reported a postsecondary credential below the bachelor's level resided in the territories (35.8%), Quebec (31.2%), and New Brunswick (30.6%).
The majority of IEHPs received their highest degree or diploma in Asia (62.7%), while just over 1 in 10 had studied in English-speaking Western countries. Just under 1 in 10 IEHPs received their education in other European countries (8.7%) or Africa (9.7%). Compared to Canada overall, smaller proportions of IEHPs in New Brunswick (43%) and Quebec (35.4%) studied in Asia, while higher proportions of IEHPs in Quebec (22.8%) and Newfoundland and Labrador (17.3%) obtained their highest degree or diploma in Africa. The proportion of IEHPs who studied in an English-speaking Western country was highest in New Brunswick (21.3%) and lowest in Quebec (4.1%). However, Quebec had the highest proportion of IEHPs from French-speaking European countries (12.7%), followed by the territories (5.8%) and New Brunswick (4.3%).
The distribution of IEHPs in Canada across sociodemographic characteristics reveals some interesting results (Table 3). Of note, the majority of IEHPs in Canada aged 18 to 64 were women (71.2%) and just over 3 in 10 were recent immigrants to Canada (32.1%), arriving between 2016 and 2021. Additionally, about two-thirds of IEHPs were under the age of 50 in 2021.
In terms of immigration characteristics, about half of IEHPs immigrated to Canada between the ages of 25 to 34 (49.9%). Over half of IEHPs immigrated under either the Federal Skilled Worker (FSW) program (32.3%) or the Provincial Nominee or Quebec selection programs (20.1%). Just over 2 in 10 arrived as family class immigrants (22.7%). About one-quarter of IEHPs reported either English (22.4%) or French (3.3%) as their mother tongue. The majority, over 7 in 10, reported another mother tongue, but spoke English (65.1%), French (2.3%), or both official languages (5.3%). A small proportion of IEHPs—1.6%—indicated that they had a different mother tongue and did not speak English or French. The largest population groups for IEHPs in Canada were Filipino (25.5%), South Asian (21.8%), non-racialized and non-Indigenous (19.4%), and Arab and West Asian (10.8%). Among population groups, the lowest proportions of IEHPs were Southeast Asian (1.5%) and Korean or Japanese (2.1%).
| Canada | Newfoundland and Labrador | Prince Edward Island | Nova Scotia | New Brunswick | Quebec | Ontario | Manitoba | Saskatchewan | Alberta | British Columbia | Territories | |
|---|---|---|---|---|---|---|---|---|---|---|---|---|
| Gender | ||||||||||||
| Men+ | 28.8 | 39.0 | 34.0 | 33.3 | 36.7 | 30.6 | 28.6 | 29.8 | 32.3 | 27.7 | 27.5 | 27.9 |
| Women+ | 71.2 | 61.0 | 66.0 | 66.7 | 63.3 | 69.4 | 71.4 | 70.2 | 67.7 | 72.3 | 72.5 | 72.1 |
| Current age | ||||||||||||
| 18–29 | 6.1 | 5.9 | 2.1 | 7.1 | 4.9 | 4.0 | 6.9 | 5.2 | 6.5 | 6.1 | 5.8 | 5.0 |
| 30–39 | 31.1 | 34.0 | 47.9 | 40.1 | 26.0 | 32.8 | 28.8 | 44.5 | 42.5 | 35.0 | 25.9 | 38.8 |
| 40–49 | 29.3 | 28.1 | 19.8 | 22.9 | 30.3 | 32.9 | 28.1 | 27.6 | 26.6 | 32.8 | 28.0 | 25.6 |
| 50–59 | 24.3 | 20.3 | 19.8 | 21.2 | 26.6 | 22.6 | 25.9 | 17.5 | 18.7 | 19.6 | 28.7 | 22.3 |
| 60+ | 9.2 | 11.8 | 10.4 | 8.8 | 12.2 | 7.7 | 10.3 | 5.2 | 5.8 | 6.5 | 11.6 | 8.3 |
| Age at immigration | ||||||||||||
| <= 24 | 15.4 | 15.5 | 5.3 | 10.5 | 11.5 | 9.4 | 17.7 | 13.1 | 12.2 | 13.5 | 16.7 | 12.5 |
| 25 to 34 | 49.9 | 44.5 | 52.1 | 52.8 | 37.2 | 51.5 | 49.0 | 54.8 | 52.1 | 52.6 | 47.3 | 55.0 |
| 35 to 44 | 26.8 | 29.0 | 26.6 | 26.7 | 33.9 | 30.7 | 25.6 | 25.3 | 27.2 | 26.9 | 27.2 | 24.2 |
| 45 + | 8.0 | 11.0 | 16.0 | 10.0 | 17.4 | 8.3 | 7.7 | 6.8 | 8.6 | 7.0 | 8.8 | 8.3 |
| Period of immigration | ||||||||||||
| 2016–2021 | 32.1 | 41.9 | 64.6 | 51.6 | 43.0 | 38.2 | 29.2 | 38.3 | 37.4 | 36.0 | 27.0 | 39.7 |
| 2010–2015 | 24.2 | 24.5 | 14.6 | 18.3 | 23.0 | 23.6 | 21.6 | 33.0 | 39.2 | 29.7 | 21.9 | 21.5 |
| 2000–2009 | 26.2 | 19.4 | 12.5 | 17.8 | 21.0 | 26.0 | 28.4 | 20.8 | 16.8 | 22.8 | 28.0 | 24.8 |
| Before 2000 | 17.5 | 14.2 | 8.3 | 12.3 | 13.1 | 12.3 | 20.8 | 7.9 | 6.6 | 11.5 | 23.2 | 14.0 |
| Immigration class | ||||||||||||
| Federal skilled worker program | 32.3 | 32.9 | 12.8 | 21.9 | 17.7 | 8.3 | 40.9 | 14.5 | 17.9 | 32.9 | 34.1 | 19.3 |
| Provincial programs | 20.1 | 34.2 | 67.0 | 43.1 | 45.9 | 53.4 | 7.2 | 59.1 | 52.8 | 17.3 | 14.6 | 29.4 |
| Other economic immigrants | 17.1 | 8.4 | 3.2 | 8.8 | 8.9 | 7.2 | 18.2 | 4.6 | 8.7 | 22.0 | 22.2 | 20.2 |
| Family immigrants | 22.7 | 18.1 | 13.8 | 18.3 | 20.7 | 21.1 | 24.1 | 18.4 | 17.0 | 21.8 | 23.2 | 26.9 |
| Refugees, humanitarian category | 6.4 | 4.5 | 0.0 | 5.9 | 4.6 | 9.1 | 8.1 | 2.4 | 3.0 | 4.8 | 3.9 | 4.2 |
| Immigrants arrived before 1980 | 1.4 | 1.9 | 3.2 | 2.0 | 2.3 | 0.9 | 1.5 | 1.0 | 0.5 | 1.2 | 2.0 | 0.0 |
| Language | ||||||||||||
| English mother tongue | 22.4 | 34.9 | 28.4 | 30.3 | 32.8 | 10.9 | 22.7 | 20.1 | 26.0 | 26.6 | 24.1 | 27.5 |
| French mother tongue | 3.3 | 1.3 | 0.0 | 1.4 | 6.6 | 21.9 | 0.9 | 0.5 | 0.3 | 0.6 | 0.6 | 2.5 |
| Other mother tongue, speaks English | 65.1 | 61.2 | 65.3 | 65.4 | 50.2 | 17.3 | 72.3 | 77.3 | 71.9 | 70.2 | 70.8 | 65.8 |
| Other mother tongue, speaks French | 2.3 | 0.0 | 0.0 | 0.0 | 2.0 | 18.8 | 0.1 | 0.0 | 0.1 | 0.1 | 0.0 | 0.0 |
| Other mother tongue, speaks English and French | 5.3 | 2.6 | 2.1 | 2.0 | 7.2 | 29.9 | 2.5 | 1.2 | 0.8 | 1.6 | 1.3 | 2.5 |
| Other mother tongue, does not speak English or French | 1.6 | 0.0 | 4.2 | 0.9 | 1.3 | 1.2 | 1.4 | 0.9 | 0.9 | 0.9 | 3.1 | 1.7 |
| Population groups | ||||||||||||
| Non-racialized, non-Indigenous | 19.4 | 25.3 | 25.5 | 26.8 | 34.0 | 32.3 | 17.4 | 13.3 | 12.7 | 14.8 | 21.4 | 22.3 |
| South Asian | 21.8 | 20.8 | 33.0 | 22.5 | 11.1 | 5.3 | 27.9 | 21.1 | 27.4 | 22.8 | 15.9 | 17.4 |
| Chinese | 7.2 | 3.9 | 9.6 | 4.1 | 3.3 | 4.3 | 7.5 | 1.6 | 2.7 | 3.7 | 14.3 | 0.0 |
| Black | 6.3 | 13.0 | 2.1 | 6.1 | 10.5 | 13.7 | 5.1 | 6.7 | 7.9 | 8.4 | 2.0 | 8.3 |
| Filipino | 25.5 | 22.1 | 19.1 | 21.1 | 18.3 | 13.3 | 20.8 | 47.7 | 39.8 | 36.3 | 28.2 | 43.8 |
| Arab and West Asian | 10.8 | 12.3 | 5.3 | 11.5 | 12.1 | 19.4 | 13.0 | 3.8 | 4.0 | 5.8 | 7.2 | 0.0 |
| Latin American | 3.1 | 0.0 | 2.1 | 1.7 | 2.6 | 7.7 | 2.8 | 1.5 | 1.5 | 2.6 | 2.1 | 1.7 |
| Southeast Asian | 1.5 | 1.3 | 0.0 | 1.6 | 1.6 | 1.5 | 1.3 | 1.6 | 1.7 | 1.6 | 1.6 | 1.7 |
| Korean and Japanese | 2.1 | 0.0 | 0.0 | 2.0 | 3.3 | 0.7 | 1.7 | 1.0 | 0.3 | 1.8 | 4.7 | 1.7 |
| Other racialized population groups | 2.3 | 1.3 | 3.2 | 2.7 | 3.3 | 1.7 | 2.4 | 1.8 | 1.9 | 2.1 | 2.5 | 3.3 |
Note: Sample size is 63,098. Given that the non-binary population is small, data aggregation to a two-category gender variable is sometimes necessary to protect the confidentiality of responses provided. In these cases, individuals in the category "non-binary persons" are distributed into the other two gender categories and are denoted by the "+" symbol. Source: Statistics Canada, 2021 Census of Population. |
||||||||||||
There were also interesting differences in the profile of IEHPs across provinces and territories. First, while women accounted for the majority of IEHPs across all jurisdictions, there were smaller proportions of IEHP women in Newfoundland and Labrador (61.0%) and New Brunswick (63.3%) compared to other provinces and territories. Additionally, nearly half (47.9%) of IEHPs in Prince Edward Island were between the ages of 30 to 39 in 2021, while more than 4 in 10 IEHPs in Manitoba and Saskatchewan were also in this age group. However, British Columbia and New Brunswick had higher shares of IEHPs aged 50 or older than other jurisdictions (40.3% and 38.8%, respectively).Footnote 11
The results also indicated that Newfoundland and Labrador, Prince Edward Island, and Nova Scotia had higher proportions of recently arrived IEHPs (who immigrated between 2016 and 2021) than other provinces and territories. Prince Edward Island was particularly notable in this respect, with over 6 in 10 of their IEHPs (64.6%) arriving during this period. Lower proportions of IEHPs in Ontario (29.2%) and British Columbia (27.0%) were recent immigrants.
Differences in the immigration class of IEHPs across jurisdictions also indicated that some provinces rely more on the provincial programs (the Provincial Nominee program or Quebec selection) than other immigration programs when admitting IEHPs. The majority of IEHPs residing in Prince Edward Island (67.0%), Quebec (53.4%), Manitoba (59.1%), and Saskatchewan (52.8%) arrived in Canada under provincial programs. In contrast, fewer than 1 in 10 of Ontario's IEHPs arrived through provincial programs, with 40.9% arriving under the FSW program.
Differences in language profiles of IEHPs were also observed across provinces and territories. As expected, the language profile of IEHPs in Quebec differed substantially from other jurisdictions, with a higher proportion reporting French as their mother tongue (21.9%) than IEHPs in other provinces and territories. Nearly 3 in 10 IEHPs residing in Quebec reported that their mother tongue is a non-official language, but that they can speak both English and French (29.9%). Manitoba (77.3%), Ontario (72.3%), and Saskatchewan (71.9%) had the highest proportions of IEHPs whose mother tongue was a non-official language but could speak English.
There were also variations in the distribution of population groups across provinces and territories. While about one-quarter of IEHPs in Canada were Filipino, higher proportions of this population group were represented in Manitoba (47.7%) and the territories (43.8%); only 13.3% of IEHPs in Quebec were Filipino. Across other jurisdictions, South Asian was the most predominant population group in Prince Edward Island (33.0%) and Ontario (27.9%). Non-racialized, non-Indigenous IEHPs were the most often reported population group for New Brunswick (34.0%), Quebec (32.3%), Nova Scotia (26.8%), and Prince Edward Island (25.5%).
Labour market outcomes of IEHPs in Canada
Examining the labour market outcomes of IEHPs in Canada is important to better understand their ability to find employment after migration, particularly in health-related occupations. This section provides detailed information on several labour market outcomes by sociodemographic characteristics. General employment information on the employment and unemployment rates of IEHPs is presented in Table 4.
The employment results indicated that, overall, 76.4% of IEHPs in Canada were employed in 2021, while their unemployment rate was 7.8%. In comparison, about 80% of Canadian-educated healthcare professionalsFootnote 12 (CEHPs) were employed, as observed in the 2021 Census (data not presented in table). Employment outcomes of IEHPs varied by field of study. Although they represented a small proportion of IEHPs overall, individuals who studied therapeutic services fields, such as occupational therapist, physiotherapist, or respiratory therapist programs, had the highest employment rate (80.7%), followed by those who had studied nursing (79.6%), laboratory/ diagnostics fields (79.2%) or pharmacy (79.2%). The lowest employment rates were observed for IEHPs whose fields of study were dentistry (72.0%), personal support work (72.1%), and medicine (73.2%). Across fields, the highest unemployment rates were reported for IEHPs who had studied dentistry (9.6%) or medicine (9.3%).
Differences in employment rates were also observed across other educational characteristics. IEHPs whose highest educational credential was a bachelor's degree had the highest employment rate (80.7%) and the lowest unemployment rate (6.3%) compared to other education levels. IEHPs who had a graduate degree, but not in medicine, dentistry, or optometry, also had a higher employment rate (78.8%) than those with a degree in medicine, dentistry, or optometry (73.2%) or a postsecondary education below the bachelor's level (70.9%). The highest unemployment rate was among IEHPs with a degree in medicine, dentistry, or optometry (9.4%).
IEHPs who obtained their education in French-speaking European countries had the highest employment rate (85.4%), followed by IEHPs who had studied in English-speaking Western countries (79.8%). The lowest employment rates were observed for IEHPs who had studied in other European countries (74.7%), Caribbean, Central, or South America (74.9%), or African countries (74.9%).
| Employment rate (%) | Unemployment rate (%) | |
|---|---|---|
| Overall | 76.4 | 7.8 |
| Gender | ||
| Men+ | 84.4 | 6.3 |
| Women+ | 73.2 | 8.5 |
| Current age | ||
| 18–29 | 65.8 | 13.0 |
| 30–39 | 76.2 | 8.4 |
| 40–49 | 81.9 | 6.5 |
| 50–59 | 78.1 | 7.4 |
| 60+ | 62.5 | 8.2 |
| Age at immigration | ||
| <= 24 | 74.2 | 8.2 |
| 25 to 34 | 78.3 | 7.1 |
| 35 to 44 | 77.0 | 8.0 |
| 45 + | 67.1 | 10.8 |
| Period of immigration | ||
| 2016–2021 | 72.9 | 10.1 |
| 2010–2015 | 79.4 | 7.2 |
| 2000–2009 | 79.3 | 6.5 |
| Before 2000 | 74.5 | 6.4 |
| Immigration class | ||
| Federal skilled worker program | 77.5 | 7.4 |
| Provincial programs | 80.0 | 6.5 |
| Other economic immigrants | 82.4 | 6.4 |
| Family immigrants | 70.6 | 9.6 |
| Refugees, humanitarian category | 64.9 | 13.1 |
| Immigrants arrived before 1980 | 73.2 | 5.6 |
| Language | ||
| English mother tongue | 78.6 | 7.0 |
| French mother tongue | 81.5 | 6.9 |
| Other mother tongue, speaks English | 76.5 | 7.9 |
| Other mother tongue, speaks French | 72.1 | 7.9 |
| Other mother tongue, speaks English and French | 76.1 | 7.6 |
| Other mother tongue, does not speak English or French | 38.0 | 21.0 |
| Population groups | ||
| Non-racialized, non-Indigenous | 76.8 | 6.6 |
| South Asian | 75.6 | 9.1 |
| Chinese | 63.4 | 10.5 |
| Black | 78.2 | 8.2 |
| Filipino | 85.6 | 5.0 |
| Arab and West Asian | 65.6 | 11.9 |
| Latin American | 73.5 | 10.2 |
| Southeast Asian | 78.9 | 7.7 |
| Korean and Japanese | 68.6 | 9.3 |
| Other racialized population groups | 75.7 | 8.7 |
| Education level | ||
| Postsecondary below bachelor's degree | 70.9 | 9.1 |
| Bachelor's degree | 80.7 | 6.3 |
| Graduate degree (not in medicine) | 78.8 | 7.7 |
| Degree in medicine, dentistry, or optometry | 73.2 | 9.4 |
| Region of education | ||
| English speaking Western countries | 79.8 | 5.2 |
| French speaking European countries | 85.4 | 4.5 |
| Other European countries | 74.7 | 8.2 |
| Caribbean, Central and South America | 74.9 | 9.6 |
| Africa | 74.9 | 8.3 |
| Asia | 76.2 | 8.1 |
| Fields of study | ||
| Medicine/medical field | 73.2 | 9.3 |
| Nursing | 79.6 | 6.0 |
| Therapeutic services | 80.7 | 5.8 |
| Laboratory/diagnostic | 79.2 | 6.8 |
| Pharmacy | 79.2 | 6.7 |
| Personal support work | 72.1 | 9.0 |
| Dentistry | 72.0 | 9.6 |
| Other health fields | 74.9 | 9.0 |
Note: the sample size for employment rates is 63,098, including IEHPs aged 18 to 64 who resided in Canada in 2021. The sample size for unemployment rates is 52,377, including IEHPs aged 18 to 64 who resided in Canada in 2021 and were in the labour force. Given that the non-binary population is small, data aggregation to a two-category gender variable is sometimes necessary to protect the confidentiality of responses provided. In these cases, individuals in the category "non-binary persons" are distributed into the other two gender categories and are denoted by the "+" symbol. Source: Statistics Canada, 2021 Census of Population. |
||
A higher proportion of IEHP men were employed compared to IEHP women (84.4% and 73.2%, respectively); conversely, a higher proportion of women than men was unemployed (8.5% and 6.3%, respectively). Across age groups, the highest employment rates were among the middle age groups. The youngest and oldest age groups had the lowest employment rates—65.8% of those aged 18 to 29 and 62.5% of those aged 60 or older were employed. The youngest age group (18 to 29) also had the highest unemployment rate across age groups (13.0%). Interestingly, the unemployment rates of those aged 30 to 39 and those aged 60 or older were similar (8.4% and 8.2%, respectively).
Differences were also observed across immigration characteristics. Immigrants who arrived in Canada between the ages of 25 and 34 had the highest employment rate (78.3%) compared to other ages at immigration, followed closely by those who immigrated between the ages of 35 to 44 (77.0%). The lowest employment rates were among immigrants who had arrived in Canada at older ages—those who arrived at age 45 or older had an employment rate of 67.1% and an unemployment rate of 10.8%.
Recently arrived IEHPs had lower employment rates than IEHPs who arrived in Canada before 2016. Nearly 8 in 10 IEHPs who immigrated between 2010 to 2015 or 2000 to 2009 were employed (79.4% and 79.3%, respectively), compared to 72.9% of IEHPs who arrived between 2016 and 2021. Across immigration classes, IEHPs who immigrated under refugee or humanitarian classes, or the family class had the lowest employment rates (64.9% and 70.6%, respectively). In contrast, about 8 in 10 IEHPs who immigrated under provincial programs (80.0%) or other economic immigrant classes (82.4%) had the highest employment rates. The employment rate of immigrants who arrived under the FSW program was 77.5% in 2021. The lowest unemployment rate was for IEHPs who had arrived before 1980 (5.6%).
The language results indicated higher employment rates for IEHPs whose mother tongue was either French or English. Over 8 in 10 IEHPs who reported their mother tongue as French were employed (81.5%) compared to 78.6% of those who reported their mother tongue as English. Those who had another mother tongue but spoke English had a slightly higher employment rate (76.5%) than other language groups. Notably, IEHPs whose mother tongue was a non-official language and who did not speak English or French had a much lower employment rate (38.0%) and a much higher unemployment rate (21.0%) than other groups.
Comparing results across population groups indicated that Filipino IEHPs had the highest employment rate in 2021 (85.6%), as well as the lowest unemployment rate (5.0%). Southeast Asian (78.9%) and Black (78.2%) IEHPs also had higher employment rates than other population groups. Chinese IEHPs had the lowest employment rate (63.4%) and among the highest unemployment rates (10.5%) compared to the other population groups.
Another important labour market outcome for employed IEHPs is annual earnings. Table 5 presents mean annual earnings in 2020 for IEHPs aged 18 to 64 who were employed during the census reference week across sociodemographic and educational characteristics. Earnings differences will also be discussed in the multivariate analysis section.
Overall, the mean annual earnings of IEHPs who worked during the census reference week was $60,000. Generally, IEHP men earned more than IEHP women on average, with a difference of about $20,000. Additionally, earnings increased as the age group increased, except for those aged 60 or older. Mean annual earnings among IEHPs were highest for those aged 50 to 59 ($69,300) and lowest for those aged 18 to 29 ($33,920).
Substantial earnings differences were observed across educational characteristics. Generally, higher levels of education corresponded with higher earnings, with IEHPs who had a degree in medicine, dentistry, or optometry earning the most on average ($79,000). IEHPs with a postsecondary education below the bachelor's level earned the least ($45,640). The region of education also mattered. IEHPs who received their education in English-speaking Western countries earned the most on average ($82,800), while IEHPs who were educated in Asia had the lowest earnings on average ($52,400).
Annual earnings differed across major fields of study. IEHPs who had studied medicine had substantially higher earnings—$89,800 on average—compared with IEHPs who had studied other fields. The next highest earning field of study was pharmacy at $64,300. IEHPs from three fields of study—nursing, laboratory/diagnostics, and therapeutic services—earned between $55,000 to $60,000 on average. IEHPs who had studied personal support work earned the least on average ($38,960).
Results for the period of immigration revealed that immigrants who arrived before 2000 had the highest earnings ($73,200), while recently arrived IEHPs had the lowest ($45,520). Across immigration classes, IEHPs who arrived before 1980 had the highest annual earnings ($85,600), likely reflecting an association between the length of time in Canada and earnings. Following this group, IEHPs who immigrated under the FSW program and the provincial programs had the next highest annual earnings, while IEHPs who immigrated under the refugee or humanitarian class had the lowest earnings, on average.
IEHPs whose mother tongue was French had the highest annual earnings across language groups ($69,700). Those whose mother tongue was English or whose mother tongue was a non-official language but could speak both English and French also had higher earnings than other language groups. IEHPs whose mother tongue was a non-official language and who could not speak English or French earned the least. Across population groups, non-racialized, non- Indigenous IEHPs earned the most on average ($78,800), nearly $17,000 more than the next highest earning population group—Black IEHPs. Korean and Japanese IEHPs earned the least across population groups ($46,440).
| Mean annual earnings 2020 dollars |
|
|---|---|
| Overall | 60,000 |
| Gender | |
| Men+ | 74,000 |
| Women+ | 53,550 |
| Current age | |
| 18–29 | 33,920 |
| 30–39 | 49,760 |
| 40–49 | 64,800 |
| 50–59 | 69,300 |
| 60+ | 68,000 |
| Age at immigration | |
| <= 24 | 58,900 |
| 25 to 34 | 58,850 |
| 35 to 44 | 63,150 |
| 45 + | 58,500 |
| Period of immigration | |
| 2016–2021 | 45,520 |
| 2010–2015 | 59,450 |
| 2000–2009 | 68,400 |
| Before 2000 | 73,200 |
| Immigration class | |
| Federal skilled worker program | 67,100 |
| Provincial programs | 62,350 |
| Other economic immigrants | 52,350 |
| Family immigrants | 54,150 |
| Refugees, humanitarian category | 50,960 |
| Immigrants arrived before 1980 | 85,600 |
| Language | |
| English mother tongue | 67,800 |
| French mother tongue | 69,700 |
| Other mother tongue, speaks English | 56,850 |
| Other mother tongue, speaks French | 47,840 |
| Other mother tongue, speaks English and French | 67,900 |
| Other mother tongue, does not speak English or French | 26,480 |
| Population groups | |
| Non-racialized, non-Indigenous | 78,800 |
| South Asian | 57,100 |
| Chinese | 54,000 |
| Black | 61,850 |
| Filipino | 52,200 |
| Arab and West Asian | 60,900 |
| Latin American | 54,200 |
| Southeast Asian | 53,000 |
| Korean and Japanese | 46,440 |
| Other racialized population groups | 57,600 |
| Education level | |
| Postsecondary below bachelor's degree | 45,640 |
| Bachelor's degree | 55,500 |
| Graduate degree (not in medicine) | 69,300 |
| Degree in medicine, dentistry, or optometry | 79,000 |
| Region of education | |
| English speaking Western countries | 82,800 |
| French speaking European countries | 80,600 |
| Other European countries | 67,100 |
| Caribbean, Central and South America | 58,050 |
| Africa | 73,900 |
| Asia | 52,400 |
| Fields of study | |
| Medicine/medical field | 89,800 |
| Nursing | 56,500 |
| Therapeutic services | 58,350 |
| Laboratory/diagnostic | 55,800 |
| Pharmacy | 64,300 |
| Personal support work | 38,960 |
| Dentistry | 46,000 |
| Other health fields | 54,400 |
Note: Sample size is 45,066. Given that the non-binary population is small, data aggregation to a two-category gender variable is sometimes necessary to protect the confidentiality of responses provided. In these cases, individuals in the category "non-binary persons" are distributed into the other two gender categories and are denoted by the "+" symbol. Source: Statistics Canada, 2021 Census of Population. |
|
Employment of IEHPs in health occupations
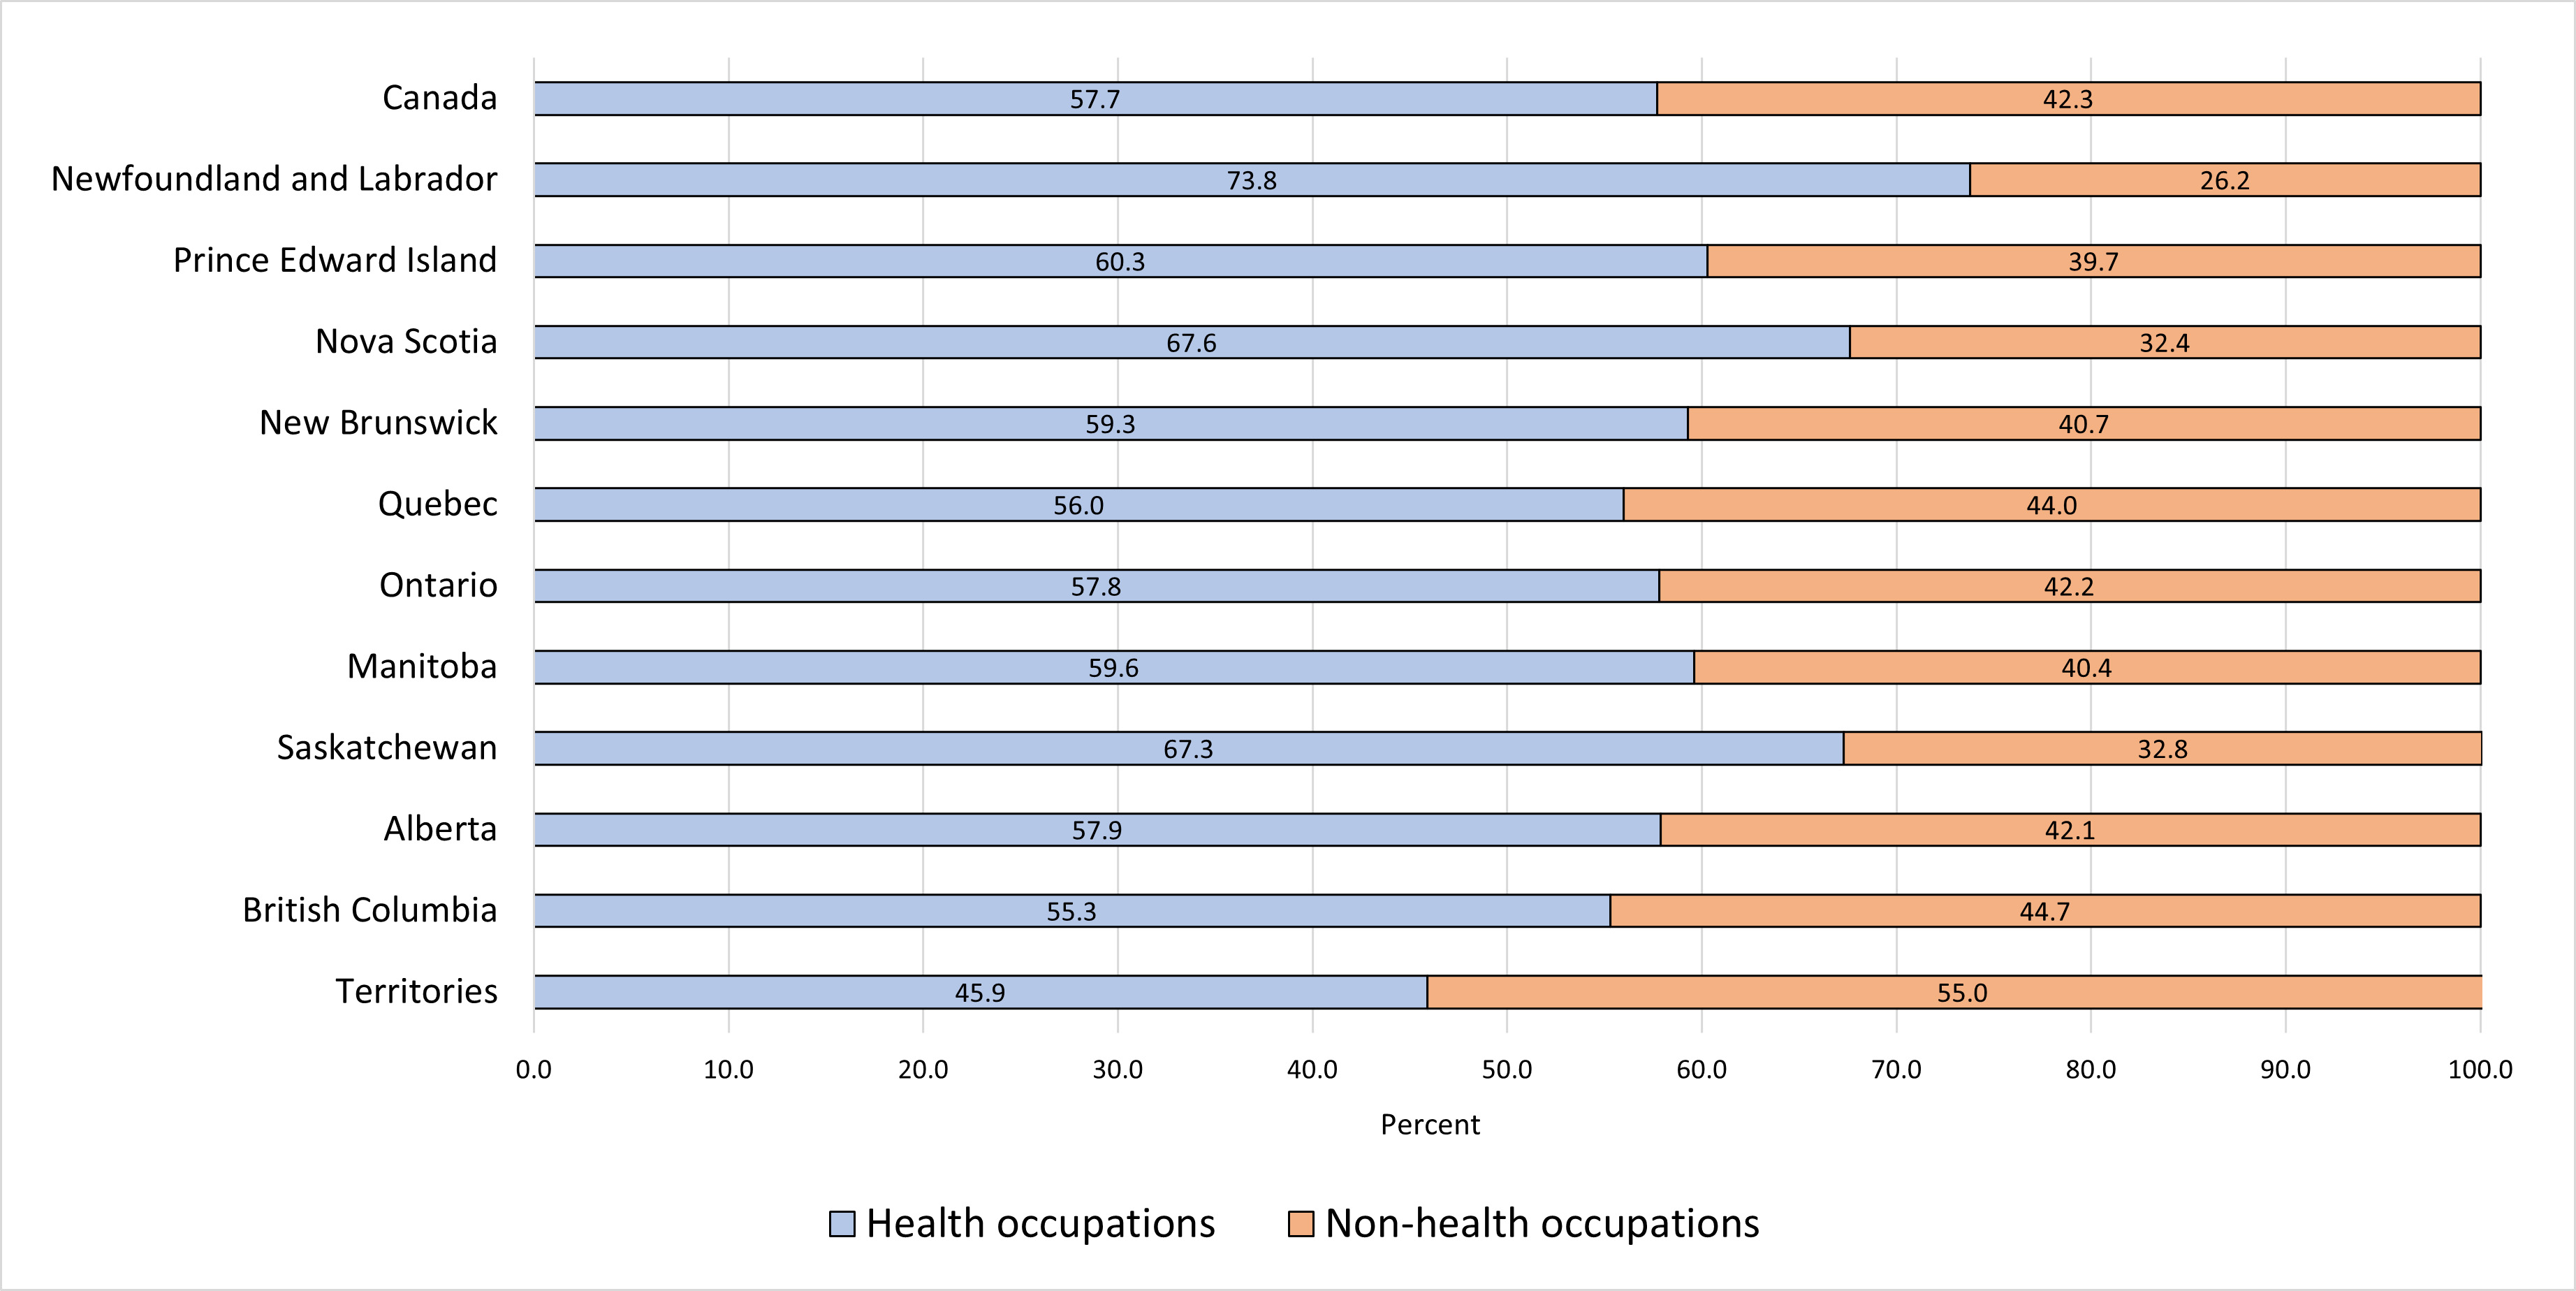
While the previous section provided a broad picture of the labour outcomes of IEHPs in Canada, these measures do not indicate whether they were employed in occupations relevant to their educational training. Overall, 57.7% of IEHPs aged 18 to 64 who were employed during the census reference week worked in a health occupation in 2021 (Figure 2 and Table 6). Nearly one- third of IEHPs were employed in professional health occupations (32.0%), which have high skill level requirements, while an additional 24.1% worked in technical health occupations (Table 6). Very small proportions of IEHPs were employed in health occupations in management (0.9%) or lower-skilled health occupations (0.8%).
Across provinces and territories, Newfoundland and Labrador had the highest proportion of IEHPs employed in health occupations (73.8%, Figure 2). Additionally, more than 6 in 10 IEHPs in Nova Scotia (67.6%) and Saskatchewan (67.3%), and about 6 in 10 in Prince Edward Island (60.3%), were employed in health occupations. Across the remaining provinces, over half of IEHPs worked in health occupations in 2021; just under half of IEHPs residing in the territories were employed in health occupations (45.9%).
Sociodemographic differences in IEHPs' employment in health occupations are shown in Table 6. The highest proportion of IEHPs who were working in health occupations studied nursing (68.7%), followed by those who studied medicine (66.9%). Across the other major fields of study, 63.0% of IEHPs who studied pharmacy and 59.7% who studied dentistry were employed in health occupations. Relative to CEHPs, the gap in the proportion working in health occupations was largest among those trained in medicine (67% of IEHPs vs. 95% of CEHPs), followed by those who studied pharmacy (63% of IEHPs vs. 86% of CEHPs). Among individuals trained in nursing, 69% of IEHPs were employed in health occupations compared with 87% of CEHPs (CEHP data not shown in Table 6).
Examining the types of health occupations in which IEHPs were employed, over half of the IEHPs who studied medicine (51.6%) and 46.4% who studied pharmacy worked in professional health occupations, which require a high skill level. IEHPs who studied laboratory/diagnostic or personal support work were concentrated in technical health occupations (43.1% and 39.5%, respectively).
Figure 2 Percent of IEHPs employed in health and non-health occupations, IEHPs aged 18 to 64 who were employed during the census reference week, Canada and the provinces and territories, 2021
Note: sample size is 48,303.
Source: Statistics Canada, 2021 Canadian Census of Population.
Figure 2: Text description
| Canada | Newfoundland and Labrador | Prince Edward Island | Nova Scotia | New Brunswick | Quebec | Ontario | Manitoba | Saskatchewan | Alberta | British Columbia | Territories | |
|---|---|---|---|---|---|---|---|---|---|---|---|---|
| Health occupations | 57.7 | 73.8 | 60.3 | 67.6 | 59.3 | 56.0 | 57.8 | 59.6 | 67.3 | 57.9 | 55.3 | 45.9 |
| Non-health occupations | 42.3 | 26.2 | 39.7 | 32.4 | 40.7 | 44.0 | 42.2 | 40.4 | 32.8 | 42.1 | 44.7 | 55.0 |
|
Note: sample size is 48,303. Source: Statistics Canada, 2021 Canadian Census of Population. |
||||||||||||
| Employed in non- health occupation | Employed in health occupation | Type of health occupation | ||||
|---|---|---|---|---|---|---|
| Health —Managerial |
Health —Professional |
Health —Technical |
Health —Lower-skilled |
|||
| Overall | 42.3 | 57.7 | 0.9 | 32.0 | 24.1 | 0.8 |
| Gender | ||||||
| Men+ | 47.3 | 52.8 | 1.0 | 35.4 | 16.0 | 0.3 |
| Women+ | 40.1 | 60.0 | 0.8 | 30.3 | 27.9 | 0.9 |
| Current age | ||||||
| 18–29 | 50.4 | 49.6 | 0.4 | 21.5 | 26.8 | 0.9 |
| 30–39 | 41.1 | 58.9 | 0.8 | 32.2 | 25.3 | 0.6 |
| 40–49 | 40.6 | 59.4 | 1.0 | 33.4 | 24.2 | 0.8 |
| 50–59 | 43.7 | 56.3 | 1.0 | 31.5 | 23.0 | 0.8 |
| 60+ | 44.0 | 55.8 | 0.8 | 33.6 | 20.6 | 1.0 |
| Age at immigration | ||||||
| <= 24 | 40.9 | 59.1 | 1.2 | 38.3 | 19.2 | 0.4 |
| 25 to 34 | 40.6 | 59.4 | 0.8 | 33.3 | 24.6 | 0.7 |
| 35 to 44 | 44.6 | 55.3 | 0.9 | 28.1 | 25.4 | 1.0 |
| 45 + | 48.2 | 51.8 | 0.7 | 23.8 | 26.3 | 1.0 |
| Period of immigration | ||||||
| 2016–2021 | 48.0 | 51.9 | 0.7 | 22.0 | 28.3 | 1.0 |
| 2010–2015 | 38.7 | 61.2 | 0.8 | 33.7 | 26.1 | 0.7 |
| 2000–2009 | 39.9 | 60.0 | 1.0 | 36.5 | 22.0 | 0.6 |
| Before 2000 | 40.9 | 59.2 | 1.2 | 40.1 | 17.1 | 0.7 |
| Immigration class | ||||||
| Federal skilled worker program | 37.8 | 62.2 | 1.2 | 40.8 | 19.9 | 0.3 |
| Provincial programs | 39.1 | 60.8 | 0.8 | 34.4 | 24.9 | 0.8 |
| Other economic immigrants | 44.7 | 55.4 | 0.5 | 19.1 | 34.1 | 1.6 |
| Family immigrants | 48.4 | 51.6 | 0.8 | 28.0 | 22.1 | 0.7 |
| Refugees, humanitarian category | 49.9 | 50.1 | 1.0 | 24.9 | 23.5 | 0.7 |
| Immigrants arrived before 1980 | 42.7 | 57.3 | 1.5 | 43.4 | 12.0 | 0.4 |
| Language | ||||||
| English mother tongue | 39.7 | 60.4 | 1.2 | 36.9 | 21.4 | 0.8 |
| French mother tongue | 37.8 | 62.4 | 1.4 | 39.5 | 20.8 | 0.5 |
| Other mother tongue, speaks English | 42.9 | 57.0 | 0.8 | 29.9 | 25.6 | 0.8 |
| Other mother tongue, speaks French | 40.7 | 59.2 | 0.4 | 25.1 | 33.1 | 0.7 |
| Other mother tongue, speaks English and French | 42.7 | 57.2 | 0.8 | 38.0 | 18.0 | 0.5 |
| Other mother tongue, does not speak English or French | 85.6 | 14.4 | 0.6 | 2.9 | 10.9 | 0.0 |
| Population groups | ||||||
| Non-racialized, non-Indigenous | 43.9 | 56.1 | 1.6 | 41.4 | 12.7 | 0.4 |
| South Asian | 39.4 | 60.5 | 1.0 | 37.4 | 21.8 | 0.4 |
| Chinese | 56.8 | 43.1 | 0.9 | 25.9 | 16.1 | 0.3 |
| Black | 35.7 | 64.3 | 0.9 | 35.2 | 26.8 | 1.4 |
| Filipino | 40.4 | 59.6 | 0.4 | 19.1 | 38.6 | 1.5 |
| Arab and West Asian | 39.6 | 60.5 | 0.8 | 45.8 | 13.6 | 0.2 |
| Latin American | 53.8 | 46.1 | 0.4 | 23.1 | 22.1 | 0.6 |
| Southeast Asian | 46.4 | 53.9 | 0.5 | 28.5 | 22.8 | 1.8 |
| Korean and Japanese | 56.4 | 43.5 | 0.4 | 22.6 | 20.3 | 0.3 |
| Other racialized population groups | 42.5 | 57.5 | 0.7 | 31.6 | 24.6 | 0.6 |
| Education level | ||||||
| Postsecondary below bachelor's degree | 54.2 | 45.8 | 0.4 | 14.9 | 29.2 | 1.3 |
| Bachelor's degree | 37.9 | 62.1 | 0.7 | 31.6 | 28.9 | 0.9 |
| Graduate degree (not in medicine) | 45.6 | 54.4 | 1.8 | 38.2 | 14.1 | 0.4 |
| Degree in medicine, dentistry, or optometry | 33.8 | 66.2 | 1.1 | 48.2 | 16.7 | 0.2 |
| Region of education | ||||||
| English speaking Western countries | 39.2 | 60.8 | 2.2 | 50.9 | 7.4 | 0.3 |
| French speaking European countries | 40.2 | 59.6 | 1.6 | 48.4 | 9.3 | 0.5 |
| Other European countries | 48.9 | 51.1 | 1.2 | 31.7 | 17.7 | 0.5 |
| Caribbean, Central and South America | 46.1 | 54.0 | 0.5 | 28.9 | 23.8 | 0.7 |
| Africa | 32.6 | 67.4 | 0.6 | 47.4 | 18.7 | 0.7 |
| Asia | 43.2 | 56.8 | 0.6 | 25.8 | 29.5 | 0.9 |
| Fields of study | ||||||
| Medicine/medical field | 33.1 | 66.9 | 1.2 | 51.6 | 13.9 | 0.2 |
| Nursing | 31.3 | 68.7 | 0.8 | 35.3 | 31.3 | 1.3 |
| Therapeutic services | 38.7 | 61.4 | 0.6 | 38.0 | 21.5 | 1.2 |
| Laboratory/diagnostic | 51.4 | 48.7 | 0.5 | 4.6 | 43.1 | 0.4 |
| Pharmacy | 37.0 | 63.0 | 0.6 | 46.4 | 15.9 | 0.1 |
| Personal support work | 55.0 | 45.1 | 0.0 | 2.2 | 39.5 | 3.3 |
| Dentistry | 40.4 | 59.7 | 0.7 | 26.9 | 31.7 | 0.3 |
| Other health fields | 60.2 | 39.8 | 1.0 | 20.1 | 18.1 | 0.6 |
Note: Sample size is 48,303. Managerial, professional, technical, and lower-skilled health occupations are determined by the skill levels (TEER categories) associated with each occupation in the 2021 National Occupational Classification. Given that the non-binary population is small, data aggregation to a two-category gender variable is sometimes necessary to protect the confidentiality of responses provided. In these cases, individuals in the category "non-binary persons" are distributed into the other two gender categories and are denoted by the "+" symbol. Source: Statistics Canada, 2021 Census of Population. |
||||||
Among the employed IEHPs who studied nursing, the top five occupations were registered nurses and registered psychiatric nurses (34%), nurse aides, orderlies, and patient service associates (21%), licensed practical nurses (8%), light duty cleaners (2%), and social and community service workers (2%). The top five occupations for IEHPs who studied medicine were general practitioners and family physicians (28%); specialists in clinical and laboratory medicine (13%); nurse aides, orderlies, and patient service associates (4%); registered nurses and registered psychiatric nurses (4%); and medical sonographers (3%). Across other major fields of study, IEHPs who studied pharmacy primarily worked as pharmacists (46%), pharmacy technical assistants and pharmacy assistants (9%), pharmacy technicians (5%), retail and wholesale trade managers (4%), and retail salespersons and visual merchandisers (2%). The most frequent occupations for the IEHPs who studied dentistry were dentists (25%), dental assistants and dental laboratory assistants (13%), dental hygienists and dental therapists (7%), dental technologists and technicians (7%), and receptionists (2%).
Across other educational characteristics, the highest proportion of IEHPs employed in a health occupation were those with a degree in medicine, dentistry, or optometry (66.2%), followed by IEHPs with a bachelor's degree (62.1%). In comparison, less than half of IEHPs with a postsecondary credential below the bachelor's level worked in a health occupation in 2021 (45.8%). Just under half of IEHPs with a degree in medicine, dentistry, or optometry (48.2%) and nearly 4 in 10 with a bachelor's degree (38.2%) were employed in professional health occupations. Nearly 3 in 10 IEHPs with a bachelor's degree worked in technical health occupations (28.9%). The results also showed that a considerable number of IEHPs with a bachelor's degree or higher held technical occupations in health, indicating over-education for some workers. However, only small proportions of IEHPs with a bachelor's degree or higher held lower-skilled health occupations.
The highest share of IEHPs employed in health occupations received their education in African countries (67.4%) or English-speaking Western countries (60.8%). IEHPs who studied in other European countries had the lowest percentage employed in health occupations (51.1%) across regions of education. There were also interesting differences by type of health occupation. Just over half of IEHPs who studied in English-speaking Western countries (50.9%) and nearly half of IEHPs who were educated in French-speaking European countries (48.4%) and African countries (47.4%) were employed in professional health occupations, while 29.5% IEHPs who studied in Asian countries held technical health positions in 2021.
Generally, IEHP women (60.0%) were more likely to be employed in a health occupation than men (52.8%). However, a higher proportion of men than women were employed in professional health occupations (35.4% and 30.3%, respectively), while a higher proportion of women than men were employed in technical health professions (27.9% and 16.0%, respectively). Across age groups, higher proportions of IEHPs in the middle age groups were employed in health occupations—just under 6 in 10 of those aged 30 to 39 and 40 to 49.
Some differences were also observed by age at immigration. Higher proportions of IEHPs who arrived in Canada at younger ages were employed in health occupations compared to those who arrived at older ages. Just under 6 in 10 of IEHPs who arrived between the ages of 25 and 34 or under age 25 were employed in health occupations in 2021. Further, a higher proportion of IEHPs who immigrated to Canada before age 25 were employed in professional health occupations (38.3%) compared to other age groups. Period of immigration also mattered. A higher proportion of established immigrants were employed in health occupations than recent immigrants. Additionally, while a higher proportion of IEHPs who arrived in recent years (2016 to 2021) were employed in technical health occupations than professional health occupations (28.3% and 22.0%, respectively), the reverse was true for IEHPs who arrived in earlier years.
By immigration program, those who immigrated to Canada under the FSW program had the highest proportion of IEHPs employed in a health occupation (62.2%), followed by those who immigrated under the provincial programs (60.8%). About 4 in 10 IEHPs who arrived under the FSW program and one-third of those in the provincial programs worked in professional health occupations, which have a high skill level compared to the other occupation types. In contrast, the lowest proportions of IEHPs employed in a health occupation arrived under refugee or humanitarian classes (50.1%) or the family class (51.6%).
Generally, results across language groups were similar to the language results for employment rates. IEHPs whose mother tongue was French or English had the highest proportions who were employed in a health occupation (62.4% and 60.4%, respectively); more than one-third of each of these language groups were employed in professional health occupations. In contrast, a much lower proportion of IEHPs who reported a mother tongue in a non-official language and were not proficient in English or French worked in health occupations (14.4%).
Among population groups, the highest proportion of IEHPs employed in health occupations was for Black IEHPs (64.3%), followed by South Asian, and Arab and West Asian IEHPs (60.5% for each group). Chinese, and Korean and Japanese groups had the lowest proportions employed in health occupations in 2021 (43.1% and 43.5%, respectively). Differences across different types of occupations were also apparent. Higher proportions of Arab and West Asian IEHPs (45.8%) and non-racialized, non-Indigenous IEHPs (41.4%) were employed in professional health occupations compared to other population groups. Additionally, nearly 4 in 10 Filipino IEHPs were employed in technical health occupations (38.6%), a higher proportion than other population groups.
Multivariate analyses
The descriptive analyses provided a general picture of differences in labour market outcomes across various groups of IEHPs. However, they did not account for variations in other characteristics. The following multivariate regression models examine how various factors are associated with three labour outcomes of interest—the likelihood of working in a health occupation, the type of health occupation (based on the skill level required), and the earnings of IEHPs—while controlling for other characteristics. Only IEHPs aged 18 to 64 who were employed during the census reference week were included in these regression analyses.
The first model estimates the likelihood of IEHPs working in a health occupation in Canada in 2021 (Table 7). Across sociodemographic characteristics, women were more likely to be employed in health occupations than men, and the youngest IEHPs (aged 18 to 29) were about 3.5 percentage points less likely than their older counterparts aged 50 or older to be working in a health occupation. However, IEHPs in the middle age groups—20 to 29 and 40 to 49—were more likely to be employed in health occupations than those aged 50 or older.
Compared to IEHPs residing in Ontario, IEHPs in Newfoundland and Labrador, Nova Scotia, and Saskatchewan were significantly more likely to be employed in a health occupation. IEHPs residing in Newfoundland and Labrador were about 12 percentage points more likely to be working in a health occupation than their counterparts in Ontario. Conversely, IEHPs in Quebec and the territories were less likely than their counterparts in Ontario to be employed in a health occupation in 2021.
Relative to IEHPs who immigrated to Canada prior to 2000, IEHPs from all other periods of immigration were less likely to be employed in a health occupation. Of note, recent immigrants were nearly 15 percentage points less likely to be employed in a health occupation in 2021 than their counterparts who immigrated prior to 2000. Moreover, compared to IEHPs who immigrated under the FSW program, IEHPs from most immigration classes were less likely to be employed in health occupations. However, there was not a statistically significant difference between IEHPs who immigrated under the FSW program and those who arrived under the provincial programs after controlling for other sociodemographic and educational differences.
Language differences also accounted for some variations as IEHPs whose mother tongue was French or who had a mother tongue in a non-official language but could speak French were more likely than IEHPs whose mother tongue was English to be employed in a health occupation. However, there was a significant disadvantage for IEHPs who had a mother tongue in a non-official language and did not speak English or French—this group was about 25 percentage points less likely to obtain employment in a health occupation than their counterparts whose mother tongue was English.
Across population groups, some were more likely than non-racialized, non-Indigenous IEHPs to be employed in a health occupation, while others were less likely. Notably, South Asian, Black, and Filipino IEHPs were between 2 and 5 percentage points more likely than their non-racialized, non-Indigenous counterparts to have worked in a health occupation in 2021. However, Chinese, Latin American, and Korean and Japanese IEHPs were less likely than non-racialized, non-Indigenous IEHPs to be employed in a health occupation. The disadvantage was greatest for Latin American IEHPs who were 9.5 percentage points less likely to have worked in a health occupation than their non-racialized, non-Indigenous counterparts.
| Marginal effect | Standard error | |
|---|---|---|
| Men+ (ref: Women+) | –0.076Table 7 Footnote *** | 0.005 |
| Age groups (ref: >= 50) | ||
| 18 to 29 | –0.035Table 7 Footnote ** | 0.012 |
| 30 to 39 | 0.023Table 7 Footnote *** | 0.007 |
| 40 to 49 | 0.037Table 7 Footnote *** | 0.006 |
| Province/territory of residence (ref: Ontario) | ||
| Newfoundland and Labrador | 0.121Table 7 Footnote *** | 0.036 |
| Prince Edward Island | 0.027 | 0.046 |
| Nova Scotia | 0.078Table 7 Footnote *** | 0.018 |
| New Brunswick | 0.016 | 0.029 |
| Quebec | –0.057Table 7 Footnote *** | 0.011 |
| Manitoba | –0.011 | 0.011 |
| Saskatchewan | 0.063Table 7 Footnote *** | 0.013 |
| Alberta | –0.010 | 0.006 |
| British Columbia | –0.006 | 0.006 |
| Territories | –0.108Table 7 Footnote ** | 0.037 |
| Period of immigration (ref: before 2000) | ||
| 2016–2021 | –0.146Table 7 Footnote *** | 0.008 |
| 2010–2015 | –0.056Table 7 Footnote *** | 0.008 |
| 2000–2009 | –0.024Table 7 Footnote *** | 0.007 |
| Immigration class (ref: Federal skilled worker program) | ||
| Provincial programs | 0.000 | 0.007 |
| Other economic immigrants | –0.025Table 7 Footnote *** | 0.007 |
| Family immigrants | –0.085Table 7 Footnote *** | 0.006 |
| Refugees, humanitarian category | –0.078Table 7 Footnote *** | 0.011 |
| Immigrants arrived before 1980 | –0.087Table 7 Footnote *** | 0.020 |
| Language (ref: English mother tongue) | ||
| Other mother tongue, does not speak English or French | –0.251Table 7 Footnote *** | 0.020 |
| Other mother tongue, speaks English and French | 0.024 | 0.013 |
| Other mother tongue, speaks French | 0.087Table 7 Footnote *** | 0.019 |
| Other mother tongue, speaks English | –0.009 | 0.006 |
| French mother tongue | 0.064Table 7 Footnote *** | 0.018 |
| Population groups (ref: non-racialized, non-Indigenous) | ||
| South Asian | 0.054Table 7 Footnote *** | 0.010 |
| Chinese | –0.082Table 7 Footnote *** | 0.012 |
| Black | 0.043Table 7 Footnote *** | 0.012 |
| Filipino | 0.024Table 7 Footnote * | 0.010 |
| Arab and West Asian | 0.020 | 0.010 |
| Latin American | –0.095Table 7 Footnote *** | 0.018 |
| Southeast Asian | 0.005 | 0.019 |
| Korean and Japanese | –0.048Table 7 Footnote ** | 0.018 |
| Other racialized population groups | 0.004 | 0.016 |
| Educational level (ref: degree in medicine, dentistry, or optometry) | ||
| Postsecondary below bachelor's degree | –0.202Table 7 Footnote *** | 0.014 |
| Bachelor's degree | –0.075Table 7 Footnote *** | 0.014 |
| Graduate degree, not in medicine | –0.066Table 7 Footnote *** | 0.014 |
| Region of education (ref: Asia) | ||
| English speaking Western countries | 0.101Table 7 Footnote *** | 0.009 |
| French speaking European countries | 0.072Table 7 Footnote *** | 0.021 |
| Other European countries | –0.009 | 0.011 |
| Caribbean, Central and South America | 0.057Table 7 Footnote *** | 0.014 |
| Africa | 0.118Table 7 Footnote *** | 0.010 |
| Major field of study (ref: other health field) | ||
| Medicine/medical field | 0.137Table 7 Footnote *** | 0.017 |
| Nursing | 0.289Table 7 Footnote *** | 0.006 |
| Therapeutic services | 0.175Table 7 Footnote *** | 0.025 |
| Laboratory /diagnostics | 0.074Table 7 Footnote *** | 0.013 |
| Pharmacy | 0.184Table 7 Footnote *** | 0.009 |
| Personal support work | 0.158Table 7 Footnote *** | 0.016 |
| Dentistry | 0.155Table 7 Footnote *** | 0.014 |
Note: Sample size is 48,303. Given that the non-binary population is small, data aggregation to a two-category gender variable is sometimes necessary to protect the confidentiality of responses provided. In these cases, individuals in the category "non-binary persons" are distributed into the other two gender categories and are denoted by the "+" symbol. Source: Statistics Canada, 2021 Census of Population. |
||
Results for educational characteristics also reveal some interesting findings. First, compared to IEHPs with a degree in medicine, dentistry, or optometry, IEHPs with other levels of education were significantly less likely to obtain employment in a health occupation. The disadvantage was greatest for IEHPs with a postsecondary credential below the bachelor's level who were about 20 percentage points less likely to be employed in a health occupation than their counterparts with a degree in medicine, dentistry, or optometry. Additionally, compared to IEHPs who received their education in Asia, IEHPs from most other regions of education were more likely to be employed in a health occupation. One exception was IEHPs who had studied in other European countries whose likelihood of being employed in a health occupation was not statistically different from their counterparts who had studied in Asia.
The findings on field of study indicated that, relative to IEHPs who studied in other health fields of study, those who studied medicine, nursing, therapeutic services, laboratory/diagnostics, pharmacy, personal support work, or dentistry fields were more likely to be employed in health occupations. Notably, IEHPs who had studied nursing were about 29 percentage points more likely to be employed in a health occupation than their counterparts who had studied other health fields.
The second regression model predicts associations between various characteristics and the type of health occupation of IEHPs based on skill level (Table 8). Among IEHPs, men were about 6 percentage points more likely than women to be employed in professional health occupations. Men were also less likely than women to be employed in technical or lower-skilled health occupations. Across age groups, IEHPs in the middle age groups (30 to 39 and 40 to 49) were more likely than IEHPs aged 50 or older to be employed in professional health occupations and less likely to be employed in technical health occupations.
Compared to IEHPs in Ontario, IEHPs residing in Nova Scotia, Manitoba, Saskatchewan, Alberta, and the territories were less likely to be employed in managerial health occupations. Additionally, IEHPs in Prince Edward Island, Quebec, Manitoba, Saskatchewan, and Alberta were less likely than their counterparts in Ontario to be employed in professional health occupations. For technical health occupations, IEHPs in Prince Edward Island, Quebec, Manitoba, Saskatchewan, and Alberta were more likely to be working in this type of occupation than their counterparts in Ontario. Additionally, IEHPs residing in Quebec, Manitoba, Alberta, British Columbia, and the territories were more likely and IEHPs in Prince Edward Island were less likely to be employed in lower-skilled health occupations compared to IEHPs in Ontario.
Differences were also observed across population groups. IEHPs from nearly all racialized population groups were less likely to work in professional health occupations compared to their non-racialized, non-Indigenous counterparts; notably, Filipino IEHPs were 28 percentage points less likely to be employed in professional health occupations than non-racialized, non-Indigenous IEHPs. One exception was for Arab and West Asian IEHPs who did not differ significantly from non-racialized, non-Indigenous IEHPs in their employment in professional health occupations. The results also indicated that Black and Southeast Asian IEHPs were more likely to be employed in lower-skilled health occupations than non-racialized, non-Indigenous IEHPs after controlling for other characteristics.
| Managerial | Professional | Technical | Lower skilled | |||||
|---|---|---|---|---|---|---|---|---|
| Marginal Effect | Standard Error | Marginal Effect | Standard Error | Marginal Effect | Standard Error | Marginal Effect | Standard Error | |
| Men+ (ref: Women+) | 0.004Table 8 Footnote * | 0.002 | 0.063Table 8 Footnote *** | 0.006 | –0.064Table 8 Footnote *** | 0.006 | –0.003Table 8 Footnote * | 0.002 |
| Age groups (ref: >= 50) | ||||||||
| 18 to 29 | –0.006 | 0.003 | –0.006 | 0.015 | 0.014 | 0.015 | –0.003 | 0.004 |
| 30 to 39 | –0.001 | 0.002 | 0.075Table 8 Footnote *** | 0.008 | –0.066Table 8 Footnote *** | 0.008 | –0.008Table 8 Footnote *** | 0.002 |
| 40 to 49 | 0.002 | 0.002 | 0.060Table 8 Footnote *** | 0.007 | –0.058Table 8 Footnote *** | 0.007 | –0.004 | 0.002 |
| Province of residence (ref: Ontario) | ||||||||
| Newfoundland and Labrador | –0.007 | 0.012 | 0.016 | 0.036 | –0.044 | 0.037 | 0.034 | 0.019 |
| Prince Edward Island | –0.005 | 0.013 | –0.109Table 8 Footnote * | 0.053 | 0.120Table 8 Footnote * | 0.051 | –0.005Table 8 Footnote *** | 0.001 |
| Nova Scotia | –0.013Table 8 Footnote *** | 0.004 | –0.025 | 0.021 | 0.016 | 0.022 | 0.022Table 8 Footnote * | 0.009 |
| New Brunswick | –0.008 | 0.008 | 0.038 | 0.033 | –0.031 | 0.032 | 0.000 | 0.006 |
| Quebec | –0.005 | 0.004 | –0.081Table 8 Footnote *** | 0.015 | 0.070Table 8 Footnote *** | 0.015 | 0.016Table 8 Footnote *** | 0.004 |
| Manitoba | –0.013Table 8 Footnote *** | 0.003 | –0.066Table 8 Footnote *** | 0.013 | 0.041Table 8 Footnote ** | 0.013 | 0.038Table 8 Footnote *** | 0.006 |
| Saskatchewan | –0.015Table 8 Footnote *** | 0.002 | –0.051Table 8 Footnote *** | 0.014 | 0.061Table 8 Footnote *** | 0.014 | 0.005 | 0.004 |
| Alberta | –0.007Table 8 Footnote *** | 0.002 | –0.044Table 8 Footnote *** | 0.007 | 0.046Table 8 Footnote *** | 0.007 | 0.005Table 8 Footnote ** | 0.002 |
| British Columbia | –0.004 | 0.002 | 0.001 | 0.008 | –0.014 | 0.007 | 0.016Table 8 Footnote *** | 0.002 |
| Territories | –0.014Table 8 Footnote ** | 0.005 | –0.014 | 0.045 | –0.018 | 0.048 | 0.046Table 8 Footnote * | 0.023 |
| Population groups (ref: non-racialized, non-Indigenous) | ||||||||
| South Asian | –0.006 | 0.003 | –0.060Table 8 Footnote *** | 0.012 | 0.068Table 8 Footnote *** | 0.012 | –0.002 | 0.003 |
| Chinese | –0.008 | 0.004 | –0.113Table 8 Footnote *** | 0.017 | 0.124Table 8 Footnote *** | 0.017 | –0.004 | 0.004 |
| Black | –0.007 | 0.004 | –0.098Table 8 Footnote *** | 0.014 | 0.090Table 8 Footnote *** | 0.014 | 0.015Table 8 Footnote * | 0.007 |
| Filipino | –0.011Table 8 Footnote ** | 0.004 | –0.282Table 8 Footnote *** | 0.013 | 0.289Table 8 Footnote *** | 0.013 | 0.005 | 0.003 |
| Arab and West Asian | –0.008Table 8 Footnote * | 0.004 | 0.020 | 0.012 | –0.012 | 0.012 | 0.000 | 0.004 |
| Latin American | –0.011 | 0.006 | –0.152Table 8 Footnote *** | 0.025 | 0.153Table 8 Footnote *** | 0.025 | 0.010 | 0.010 |
| Southeast Asian | –0.011 | 0.006 | –0.128Table 8 Footnote *** | 0.023 | 0.120Table 8 Footnote *** | 0.024 | 0.019Table 8 Footnote * | 0.009 |
| Korean and Japanese | –0.014Table 8 Footnote ** | 0.005 | –0.071Table 8 Footnote ** | 0.026 | 0.090Table 8 Footnote *** | 0.026 | –0.005 | 0.005 |
| Other racialized population groups | –0.010 | 0.006 | –0.127Table 8 Footnote *** | 0.020 | 0.137Table 8 Footnote *** | 0.020 | 0.000 | 0.004 |
| Period of immigration (ref: before 2000) | ||||||||
| 2016–2021 | –0.002 | 0.003 | –0.261Table 8 Footnote *** | 0.010 | 0.256Table 8 Footnote *** | 0.010 | 0.007Table 8 Footnote * | 0.003 |
| 2010–2015 | –0.002 | 0.003 | –0.135Table 8 Footnote *** | 0.010 | 0.137Table 8 Footnote *** | 0.009 | 0.000 | 0.002 |
| 2000–2009 | –0.001 | 0.002 | –0.056Table 8 Footnote *** | 0.008 | 0.058Table 8 Footnote *** | 0.008 | –0.002 | 0.002 |
| Immigration class (ref: Federal skilled worker program) | ||||||||
| Provincial programs | –0.001 | 0.003 | 0.007 | 0.008 | –0.007 | 0.008 | 0.001 | 0.002 |
| Other economic immigrants | –0.003 | 0.003 | –0.058Table 8 Footnote *** | 0.009 | 0.049Table 8 Footnote *** | 0.008 | 0.013Table 8 Footnote *** | 0.002 |
| Family immigrants | –0.002 | 0.002 | –0.057Table 8 Footnote *** | 0.008 | 0.053Table 8 Footnote *** | 0.008 | 0.006Table 8 Footnote ** | 0.002 |
| Refugees, humanitarian category | 0.002 | 0.004 | –0.127Table 8 Footnote *** | 0.013 | 0.122Table 8 Footnote *** | 0.013 | 0.003 | 0.003 |
| Immigrants arrived before 1980 | –0.004 | 0.004 | –0.043 | 0.028 | 0.047 | 0.028 | 0.000 | 0.006 |
| Language (ref: English mother tongue) | ||||||||
| Other mother tongue, does not speak English or French | 0.036 | 0.034 | –0.243Table 8 Footnote *** | 0.071 | 0.199Table 8 Footnote ** | 0.069 | 0.007 | 0.021 |
| Other mother tongue, speaks English and French | –0.004 | 0.004 | 0.025 | 0.016 | –0.014 | 0.016 | –0.007 | 0.003 |
| Other mother tongue, speaks French | –0.009Table 8 Footnote * | 0.005 | –0.069Table 8 Footnote ** | 0.024 | 0.089Table 8 Footnote *** | 0.024 | –0.011Table 8 Footnote *** | 0.003 |
| Other mother tongue, speaks English | –0.002 | 0.002 | –0.015Table 8 Footnote * | 0.007 | 0.018Table 8 Footnote ** | 0.007 | –0.001 | 0.002 |
| French mother tongue | 0.005 | 0.007 | –0.068Table 8 Footnote ** | 0.023 | 0.074Table 8 Footnote *** | 0.023 | –0.011Table 8 Footnote *** | 0.003 |
| Educational level (ref: degree in medicine, dentistry, or optometry) | ||||||||
| Postsecondary below bachelor's degree | –0.001 | 0.003 | –0.448Table 8 Footnote *** | 0.015 | 0.440Table 8 Footnote *** | 0.015 | 0.008 | 0.005 |
| Bachelor's degree | 0.004 | 0.004 | –0.252Table 8 Footnote *** | 0.016 | 0.248Table 8 Footnote *** | 0.016 | 0.000 | 0.005 |
| Graduate degree, not in medicine | 0.017Table 8 Footnote *** | 0.005 | –0.151Table 8 Footnote *** | 0.016 | 0.135Table 8 Footnote *** | 0.016 | –0.002 | 0.005 |
| Region of education (ref: Asia) | ||||||||
| English speaking Western countries | 0.013Table 8 Footnote *** | 0.003 | 0.230Table 8 Footnote *** | 0.011 | –0.236Table 8 Footnote *** | 0.011 | –0.006 | 0.003 |
| French speaking European countries | –0.001 | 0.005 | 0.286Table 8 Footnote *** | 0.021 | –0.286Table 8 Footnote *** | 0.020 | 0.001 | 0.009 |
| Other European countries | 0.002 | 0.003 | –0.004 | 0.015 | 0.002 | 0.016 | 0.000 | 0.005 |
| Caribbean, Central and South America | –0.003 | 0.004 | 0.072Table 8 Footnote *** | 0.019 | –0.066Table 8 Footnote *** | 0.019 | –0.003 | 0.005 |
| Africa | –0.005Table 8 Footnote * | 0.003 | 0.119Table 8 Footnote *** | 0.013 | –0.110Table 8 Footnote *** | 0.013 | –0.004 | 0.004 |
| Major field of study (ref: other health field) | ||||||||
| Medicine/medical field | 0.005 | 0.005 | –0.066Table 8 Footnote *** | 0.017 | 0.074Table 8 Footnote *** | 0.017 | –0.012Table 8 Footnote *** | 0.003 |
| Nursing | 0.000 | 0.002 | 0.189Table 8 Footnote *** | 0.007 | –0.185Table 8 Footnote *** | 0.007 | –0.003 | 0.002 |
| Therapeutic services | –0.008 | 0.004 | 0.110Table 8 Footnote *** | 0.026 | –0.109Table 8 Footnote *** | 0.027 | 0.006 | 0.011 |
| Laboratory /diagnostics | 0.004 | 0.007 | –0.267Table 8 Footnote *** | 0.017 | 0.272Table 8 Footnote *** | 0.017 | –0.009Table 8 Footnote * | 0.004 |
| Pharmacy | –0.008Table 8 Footnote *** | 0.002 | 0.161Table 8 Footnote *** | 0.010 | –0.140Table 8 Footnote *** | 0.010 | –0.012Table 8 Footnote *** | 0.003 |
| Personal support work | 0.002 | 0.012 | –0.232Table 8 Footnote *** | 0.031 | 0.202Table 8 Footnote *** | 0.030 | 0.028Table 8 Footnote ** | 0.009 |
| Dentistry | –0.003 | 0.003 | –0.176Table 8 Footnote *** | 0.012 | 0.190Table 8 Footnote *** | 0.013 | –0.011Table 8 Footnote *** | 0.003 |
Note: Sample size is 27,888. Given that the non-binary population is small, data aggregation to a two-category gender variable is sometimes necessary to protect the confidentiality of responses provided. In these cases, individuals in the category "non-binary persons" are distributed into the other two gender categories and are denoted by the "+" symbol. Source: Statistics Canada, 2021 Census of Population. |
||||||||
All IEHPs who arrived in Canada after 2000 were less likely to be employed in professional health occupations relative to IEHPs who arrived before 2000. This difference was particularly large for recent immigrants (who arrived between 2016 and 2021) who were 26 percentage points less likely to be employed in professional health occupations than their more established counterparts. Additionally, the most recently arrived IEHPs were more likely than IEHPs who immigrated before 2000 to be employed in lower-skilled occupations, although this difference was small (about 0.7 percentage points less likely).
Across most language groups, IEHPs were less likely to be employed in professional health occupations and more likely to be employed in technical health occupations compared to IEHPs whose mother tongue was English. One exception was for IEHPs with a mother tongue in a non- official language who spoke both English and French. They were as likely as their counterparts whose mother tongue was English to be employed in a professional health occupation. Additionally, although the differences were small, IEHPs whose mother tongue was a non- official language but could speak French and those whose mother tongue was French were less likely to be employed in lower-skilled health occupations compared to IEHPs whose mother tongue was English.
Relative to IEHPs who arrived under the FSW program, those who arrived under other economic immigration programs, the family class, or refugee or humanitarian classes were less likely to be employed in professional health occupations. For example, IEHPs who arrived under refugee or humanitarian admission programs were about 12 percentage points less likely to be employed in professional health occupations than their counterparts who arrived under the FSW program. Additionally, IEHPs who arrived under other economic immigration programs, the family class, or refugees or humanitarian classes were more likely to be employed in technical health occupations than those who arrived under the FSW program.
In terms of educational differences, IEHPs with a level of education that was not a degree in medicine, dentistry, or optometry were less likely to be employed in professional health occupations than IEHPs with this type of degree. Additionally, IEHPs who did not have a degree in medicine, dentistry, or optometry were more likely to be employed in technical health occupations than their counterparts with a degree in medicine, dentistry, or optometry. Interestingly, results predicting the likelihood of working in lower-skilled health occupations indicated that there were no statistically significant differences between IEHPs with a degree in medicine, dentistry, or optometry and IEHPs with other education levels.
IEHPs from several regions of education—English-speaking Western countries, French- speaking European countries, Caribbean, Central and South American countries, and African countries—were more likely to be employed in professional health occupations than their counterparts who were educated in Asian countries. Additionally, IEHPs who had studied in these four regions were less likely to be employed in technical health occupations than IEHPs who had studied in Asia. There were no differences across regions of education in the likelihood of working in lower-skilled health occupations.
IEHPs who studied nursing, therapeutic services, and pharmacy fields were more likely to be employed in professional health occupations than their counterparts who had studied 'other' health fields. Interestingly, IEHPs who had studied medicine or dentistry fields were less likely to be employed in professional health occupations than IEHPs who had studied other health fields. IEHPs who studied dentistry were about 17 percentage points less likely and IEHPS who studied medicine were about 7 percentage points less likely than their counterparts who had studied 'other' health fields to be employed in a professional health occupation. Additionally, IEHPs who had studied nursing, therapeutic services, and pharmacy were less likely to be employed in technical health occupations than IEHPs who had studied 'other' health fields.
The last model predicts the log annual earnings of IEHPs aged 18 to 64 (Table 9). In addition to examining the relationships between sociodemographic and educational characteristics with the earnings of IEHPs, an additional model determines the associations between the type of occupation and earnings. Generally, the results indicated that IEHP men were associated with 0.269 log-point (or 31%) higher annual earnings than IEHP women when differences in other sociodemographic characteristics were taken into account; this difference increased slightly when the type of health occupation was accounted for in the second model. IEHPs aged 18 to 29 and 30 to 39 were associated with much lower annual earnings than IEHPs aged 50 or older.
Compared to IEHPs in Ontario, IEHPs residing in Newfoundland and Labrador earned more (Model 1); however, when the type of health occupation was added to the model (Table 9, Model 2) this difference was no longer statistically significant. This result indicates that earnings differences between IEHPs in these two provinces are attributable to differences in the types of health occupations they hold. IEHPs residing in Saskatchewan, Alberta, British Columbia, and the territories earned more on average than IEHPs in Ontario, even when controlling for differences in types of occupations. Conversely, IEHPs in Quebec earned less than their Ontario counterparts when accounting for sociodemographic, educational, and occupational differences.
Additionally, most racialized population groups earned less than non-racialized, non-Indigenous IEHPs in 2020. Results from Model 2 indicated that only the earnings of IEHPs from Latin America, Southeast Asia, and other racialized population groups did not statistically differ from the earnings of non-racialized, non-Indigenous IEHPs. The largest earnings disadvantages were observed for Arab and West Asian and Chinese IEHPs.
The period during which IEHPs arrived in Canada was also significantly associated with their earnings. All IEHP groups that arrived after 2000 earned less than their counterparts who arrived before 2000. Recent immigrants had the largest earnings gap with IEHPs who arrived pre-2000. Generally, these results indicate that the more years IEHPs have resided in Canada, the higher their earnings. Immigration class also revealed some interesting results. IEHPs who immigrated under provincial programs or other economic immigration programs earned slightly more than IEHPs who immigrated under the FSW program. However, IEHPs who arrived under the family class or the refugee or humanitarian classes earned less than their counterparts who immigrated under the FSW program.
| Model 1 | Model 2 | |||
|---|---|---|---|---|
| Coefficient | Standard Error | Coefficient | Standard Error | |
| Men+ (ref: Women+) | 0.269Table 9 Footnote *** | 0.012 | 0.289Table 9 Footnote *** | 0.011 |
| Age groups (ref: >= 50) | ||||
| 18 to 29 | –0.455Table 9 Footnote *** | 0.029 | –0.434Table 9 Footnote *** | 0.028 |
| 30 to 39 | –0.173Table 9 Footnote *** | 0.016 | –0.211Table 9 Footnote *** | 0.016 |
| 40 to 49 | 0.031Table 9 Footnote * | 0.014 | –0.011 | 0.013 |
| Province of residence (ref: Ontario) | ||||
| Newfoundland and Labrador | 0.325Table 9 Footnote * | 0.131 | 0.245 | 0.126 |
| Prince Edward Island | –0.135 | 0.105 | –0.112 | 0.101 |
| Nova Scotia | 0.057 | 0.049 | 0.040 | 0.048 |
| New Brunswick | 0.057 | 0.074 | 0.045 | 0.070 |
| Quebec | –0.198Table 9 Footnote *** | 0.025 | –0.141Table 9 Footnote *** | 0.024 |
| Manitoba | –0.020 | 0.026 | 0.018 | 0.024 |
| Saskatchewan | 0.127Table 9 Footnote *** | 0.030 | 0.123Table 9 Footnote *** | 0.029 |
| Alberta | 0.098Table 9 Footnote *** | 0.015 | 0.118Table 9 Footnote *** | 0.014 |
| British Columbia | 0.066Table 9 Footnote *** | 0.014 | 0.071Table 9 Footnote *** | 0.014 |
| Territories | 0.348Table 9 Footnote *** | 0.089 | 0.415Table 9 Footnote *** | 0.087 |
| Population groups (ref: non-racialized, non-Indigenous) | ||||
| South Asian | –0.094Table 9 Footnote *** | 0.025 | –0.096Table 9 Footnote *** | 0.024 |
| Chinese | –0.321Table 9 Footnote *** | 0.032 | –0.240Table 9 Footnote *** | 0.031 |
| Black | –0.160Table 9 Footnote *** | 0.029 | –0.129Table 9 Footnote *** | 0.028 |
| Filipino | –0.027 | 0.025 | 0.058Table 9 Footnote * | 0.024 |
| Arab and West Asian | –0.320Table 9 Footnote *** | 0.028 | –0.332Table 9 Footnote *** | 0.027 |
| Latin American | –0.130Table 9 Footnote ** | 0.042 | –0.042 | 0.040 |
| Southeast Asian | –0.098Table 9 Footnote * | 0.043 | –0.060 | 0.042 |
| Korean and Japanese | –0.285Table 9 Footnote *** | 0.044 | –0.225Table 9 Footnote *** | 0.042 |
| Other racialized population groups | –0.098Table 9 Footnote ** | 0.037 | –0.053 | 0.036 |
| Period of immigration (ref: before 2000) | ||||
| 2016–2021 | –0.497Table 9 Footnote *** | 0.021 | –0.339Table 9 Footnote *** | 0.020 |
| 2010–2015 | –0.231Table 9 Footnote *** | 0.019 | –0.158Table 9 Footnote *** | 0.018 |
| 2000–2009 | –0.086Table 9 Footnote *** | 0.017 | –0.052Table 9 Footnote ** | 0.016 |
| Immigration class (ref: Federal skilled worker program) | ||||
| Provincial programs | 0.068Table 9 Footnote *** | 0.017 | 0.062Table 9 Footnote *** | 0.017 |
| Other economic immigrants | 0.047Table 9 Footnote ** | 0.017 | 0.082Table 9 Footnote *** | 0.016 |
| Family immigrants | –0.124Table 9 Footnote *** | 0.015 | –0.061Table 9 Footnote *** | 0.015 |
| Refugees, humanitarian category | –0.184Table 9 Footnote *** | 0.026 | –0.102Table 9 Footnote *** | 0.024 |
| Immigrants arrived before 1980 | –0.114Table 9 Footnote * | 0.050 | –0.057 | 0.050 |
| Language (ref: English mother tongue) | ||||
| Other mother tongue, does not speak English or French | –0.641Table 9 Footnote *** | 0.067 | –0.502Table 9 Footnote *** | 0.067 |
| Other mother tongue, speaks English and French | 0.113Table 9 Footnote *** | 0.032 | 0.092Table 9 Footnote ** | 0.031 |
| Other mother tongue, speaks French | 0.022 | 0.043 | 0.013 | 0.041 |
| Other mother tongue, speaks English | –0.052Table 9 Footnote *** | 0.013 | –0.046Table 9 Footnote *** | 0.013 |
| French mother tongue | 0.148Table 9 Footnote *** | 0.043 | 0.141Table 9 Footnote *** | 0.041 |
| Educational level (ref: degree in medicine, dentistry, or optometry) | ||||
| Postsecondary below bachelor's degree | –0.182Table 9 Footnote *** | 0.035 | 0.048 | 0.035 |
| Bachelor's degree | 0.018 | 0.036 | 0.140Table 9 Footnote *** | 0.035 |
| Graduate degree, not in medicine | 0.118Table 9 Footnote ** | 0.037 | 0.213Table 9 Footnote *** | 0.037 |
| Region of education (ref: Asia) | ||||
| English speaking Western countries | 0.312Table 9 Footnote *** | 0.024 | 0.183Table 9 Footnote *** | 0.023 |
| French speaking European countries | 0.308Table 9 Footnote *** | 0.050 | 0.173Table 9 Footnote *** | 0.048 |
| Other European countries | 0.029 | 0.029 | 0.037 | 0.027 |
| Caribbean, Central and South America | 0.108Table 9 Footnote ** | 0.037 | 0.063 | 0.035 |
| Africa | 0.145Table 9 Footnote *** | 0.028 | 0.038 | 0.027 |
| Major field of study (ref: other health field) | ||||
| Medicine/medical field | 0.254Table 9 Footnote *** | 0.039 | 0.203Table 9 Footnote *** | 0.039 |
| Nursing | 0.309Table 9 Footnote *** | 0.013 | 0.100Table 9 Footnote *** | 0.013 |
| Therapeutic services | 0.191Table 9 Footnote *** | 0.044 | 0.058 | 0.043 |
| Laboratory /diagnostics | 0.203Table 9 Footnote *** | 0.026 | 0.235Table 9 Footnote *** | 0.026 |
| Pharmacy | 0.230Table 9 Footnote *** | 0.021 | 0.078Table 9 Footnote *** | 0.021 |
| Personal support work | 0.091Table 9 Footnote ** | 0.033 | 0.043 | 0.032 |
| Dentistry | –0.101Table 9 Footnote *** | 0.030 | –0.100Table 9 Footnote *** | 0.030 |
| Occupational skill levels (ref: Non-health occupation) | ||||
| Health managerial occupations | N/A | N/A | 0.685Table 9 Footnote *** | 0.052 |
| Health professional occupations | N/A | N/A | 0.769Table 9 Footnote *** | 0.013 |
| Technical health occupations | N/A | N/A | 0.243Table 9 Footnote *** | 0.012 |
| Lower skilled health occupations | N/A | N/A | 0.010 | 0.060 |
| Intercept | 10.698Table 9 Footnote *** | 0.046 | 10.261Table 9 Footnote *** | 0.046 |
Note: Sample size is 45,066. Given that the non-binary population is small, data aggregation to a two-category gender variable is sometimes necessary to protect the confidentiality of responses provided. In these cases, individuals in the category "non-binary persons" are distributed into the other two gender categories and are denoted by the "+" symbol. Source: Statistics Canada, 2021 Census of Population. |
||||
Some earnings differences were observed across language groups. IEHPs whose mother tongue was French or whose mother tongue was a non-official language but could speak English and French earned more than their counterparts whose mother tongue was English (Table 9, Model 2). However, IEHPs whose mother tongue was a non-official language who could speak English or who could not speak English or French earned less than IEHPs whose mother tongue was English after controlling for other characteristics.
Across education levels, IEHPs with a postsecondary credential below the bachelor's level earned less than IEHPs with a degree in medicine, dentistry, or optometry. However, when the type of health occupation was controlled for in Model 2, this difference was no longer statistically significant. Interestingly, when sociodemographic, educational, and occupational differences were accounted for, IEHPs with a bachelor's degree and IEHPs with a graduate degree that was not in medicine, dentistry, or optometry earned more than their counterparts with a degree in medicine, dentistry, or optometry.
IEHPs who were educated in Caribbean, Central, or South American countries or African countries earned more than their counterparts who were educated in Asia in Model 1. However, after accounting for differences in the type of occupations they held, these earnings differences were no longer statistically significant. Model 2 results indicated that IEHPs who studied in English-speaking Western countries or French-speaking European countries earned more than IEHPs who studied in Asia, even when occupational differences were controlled in the model. The field of study results also revealed that IEHPs who had studied medicine, nursing, laboratory/diagnostics, or pharmacy fields earned more than their counterparts who had studied other health fields while IEHPs who had studied dentistry earned less (Table 9, Model 2).
Finally, results from Model 2 indicated that IEHPs who were employed in managerial, professional, or technical health occupations earned more than their counterparts who were employed in non-health occupations. The earnings of IEHPs who were employed in lower-skill health occupations did not differ significantly from IEHPs employed in non-health occupations after accounting for other sociodemographic and educational characteristics.
Discussion
This study provides new information about the number of IEHPs who resided in Canada using 2021 Census of Population data. Detailed information about the characteristics of IEHPs was presented, allowing for insights into the sociodemographic and educational makeup of this population. Additionally, recent information about the extent to which IEHPs were employed in occupations relevant to their educational training was presented. The disaggregation of these results by key sociodemographic, educational, and immigration characteristics provides greater insight into differences in the labour market outcomes of IEHPs in Canada.
The results indicated that there were an estimated 259,695 IEHPs residing in Canada in 2021. The highest numbers of IEHPs resided in more populated jurisdictions which have higher numbers of immigrants generally. Notably, nearly half of IEHPs resided in Ontario (116,310), while both British Columbia and Alberta had over 40,000 IEHPs; Quebec had just over 30,000 IEHPs. Smaller jurisdictions, such as provinces in the Atlantic region and the territories had the lowest numbers of IEHPs in Canada, ranging from about 475 in Prince Edward Island to 3,195 in Nova Scotia.
The profile of IEHPs revealed that about one-third had studied nursing, and over 1 in 10 reported that they studied medicine. Very small proportions of IEHPs had studied in therapeutic services or personal support work fields.Footnote 13 Of note, over half of IEHPs in Prince Edward Island had studied nursing, while Ontario had the highest proportions of IEHPS who had studied dentistry or pharmacy.
Over one-third of IEHPs had a bachelor's degree, and about 2 in 10 had a degree in medicine, dentistry, or optometry. A notable proportion of IEHPs—about one-quarter—also held a postsecondary credential below the bachelor's level. Across jurisdictions, a higher proportion of IEHPs in Newfoundland and Labrador, Ontario, and New Brunswick had a degree in medicine, dentistry, or optometry compared to Canada overall. The majority of IEHPs received their education in Asia, while just over 1 in 10 studied in an English-speaking Western country. The proportion of IEHPs who had studied in an English-speaking Western country was highest in New Brunswick (21.3%), while the highest proportion of IEHPs who had studied in French- speaking European countries resided in Quebec (12.7%).
The majority of IEHPs—about 7 in 10—were women, although there were some variations across jurisdictions. For example, Newfoundland and Labrador and New Brunswick had smaller proportions of IEHPs who were women. Additionally, most IEHPs were under the age of 50 in 2021. However, compared to Canada overall, there were larger proportions of IEHPs in British Columbia and New Brunswick aged 50 or older. Nearly one-third of IEHPs had recently arrived in Canada (between 2016 and 2021) and the majority entered Canada under either the FSW or provincial programs. Interestingly, some provinces seemed to have a greater reliance on provincial programs for bringing IEHPs to Canada—over half of the IEHPs in Prince Edward Island, Quebec, Manitoba, and Saskatchewan arrived under this program. In contrast, the majority of IEHPs in Ontario arrived under either the FSW program or the family class.
Most IEHPs were able to speak at least one of Canada's official languages, with the majority reporting another mother tongue, but proficiency in English. Additionally, about one-quarter of IEHPs were Filipino, although this group represented a higher proportion of IEHPs in Manitoba and the territories. South Asians accounted for just over 2 in 10 IEHPs, the second largest population group at the national level; however, there were higher proportions of South Asian IEHPs in Prince Edward Island and Ontario.
In 2021, over half of the IEHPs—57.7 percent—were employed in health occupations. Newfoundland and Labrador had the highest proportion of IEHPs working in health occupations compared to other jurisdictions (73.8%), while more than 6 in 10 IEHPs in Prince Edward Island, Nova Scotia, and Saskatchewan were also employed in health occupations. Nearly one-third of IEHPs worked in professional health occupations, and almost one-quarter were employed in technical health occupations. Very small proportions of IEHPs were employed in management or lower-skilled health occupations—under 1 percent for each occupation type.
The results also showed that many IEHPs in Canada were over-educated for their jobs as notable proportions with a university degree were working in technical health occupations that require lower levels of education than professional health occupations. However, very small proportions of IEHPs with a university degree were employed in lower skilled health occupations.
The labour market outcomes of IEHPs differed across sociodemographic, educational, and immigration characteristics. After accounting for other factors, the regression results indicated that IEHPs in Newfoundland and Labrador, Nova Scotia, and Saskatchewan were more likely than their Ontario counterparts to be employed in a health occupation. However, IEHPs residing in Quebec and the territories were less likely than their Ontario counterparts to be employed in a health occupation. IEHPs in several jurisdictions (Prince Edward Island, Quebec, Manitoba, Saskatchewan, Alberta) were less likely to be employed in professional health occupations than IEHPs in Ontario. The provincial and territorial results also showed some earnings differences— IEHPs in Saskatchewan, Alberta, British Columbia, and the territories earned more than their counterparts in Ontario.
Previous research has indicated women who have a health education are largely underutilized in the Canadian labour market (Hou and Schimmele, 2020). This study indicates that among IEHPs, men were less likely than women to be employed in a health occupation, but they were more likely than women to be employed in managerial or professional health occupations. Conversely, men were less likely than women to work in technical or lower-skilled health occupations. The results also indicated that among IEHPs, men earned more than women, even after accounting for differences in the type of health occupation they held.
While some population groups were less likely to be employed in a health occupation compared to non-racialized, non-Indigenous IEHPs, there were some exceptions—South Asian, Black, and Filipino IEHPs were more likely than their non-racialized, non-Indigenous counterparts to be employed in a health occupation. However, IEHPs in most population groups were less likely to work in professional health occupations compared to non-racialized, non-Indigenous IEHPs, with Filipino IEHPs having the greatest disadvantage. One exception was among Arab and West Asian IEHPs whose likelihood of being employed in a professional health occupation did not differ significantly from non-racialized, non-Indigenous IEHPs. The results also indicated that Black and Southeast Asian IEHPs were more likely to be employed in lower-skilled health occupations than their non-racialized, non-Indigenous counterparts. Moreover, there was an earnings disadvantage for most racialized population groups, with Arab and West Asian and Chinese IEHPs having the largest earnings gaps with their non-racialized, non-Indigenous counterparts.
Language also mattered to employment outcomes of IEHPs—those whose mother tongue was a non-official language and who did not speak English or French were less likely to obtain employment in a health occupation than their counterparts whose mother tongue was English. IEHPs whose mother tongue was French or whose mother tongue was a non-official language but could speak both English and French also had higher earnings compared to IEHPs whose mother tongue was English, indicating an earnings advantage for IEHPs with proficiency in French. IEHPs in other language groups were less likely to be employed in professional health occupations and more likely to be employed in technical health occupations than IEHPs whose mother tongue was English. IEHPs who could not speak either English or French had a particular employment disadvantage which included the largest earnings gap with IEHPs whose mother tongue was English.
Immigration characteristics were also associated with the labour outcomes of IEHPs. IEHPs who recently arrived in Canada (between 2016 and 2021) had several employment disadvantages compared to their counterparts who had arrived in Canada in earlier years. IEHPs who arrived between 2016 and 2021 had lower employment rates and higher unemployment rates than IEHPs who arrived in earlier years and were also less likely than their counterparts who had immigrated prior to 2000 to obtain employment in a health occupation. More recent cohorts of IEHPs were less likely to be employed in professional health occupations and more likely to hold technical and lower-skilled health occupations than their counterparts who arrived in Canada before 2000. Recently arrived IEHPs also had the largest earnings gap with immigrants who arrived in Canada prior to 2000. Generally, these results indicated that the more years an IEHP has resided in Canada, the greater their earnings and likelihood of working in a health occupation.
IEHPs who arrived under most immigration classes were less likely than their counterparts who immigrated under the FSW program to obtain employment in a health occupation. However, those who arrived through provincial programs did not differ significantly from those who arrived under the FSW program in this outcome. Additionally, IEHPs who arrived under provincial programs earned more than those who immigrated under the FSW program. In contrast, IEHPs who arrived under the family class or refugee or humanitarian classes were at a particular employment disadvantage as they were less likely to obtain employment in a health occupation, more likely to obtain employment in lower-skilled health occupations, and earned less than their counterparts who immigrated to Canada under the FSW program.
Employment outcomes also differed by education level. IEHPs whose highest educational credential was a bachelor's degree had the highest employment rate, while IEHPs with a degree in medicine, dentistry, or optometry had the highest unemployment rate. IEHPs with other levels of education were less likely to be employed in a health occupation and less likely to be employed in professional health occupations than IEHPs with a degree in medicine, dentistry, or optometry. However, while the descriptive results indicated that IEHPs with a degree in medicine, dentistry, or optometry had the highest earnings on average, when other characteristics were controlled for, including the type of health occupation held, IEHPs with a bachelor's degree or graduate degree that was not in medicine, dentistry, or optometry earned more than IEHPs with a degree in medicine, dentistry, or optometry.
Supporting previous research that found the region of education mattered to the employment outcomes of IEHPs (e.g., Girard and Smith, 2013; Hou and Schimmele, 2020), results from this study revealed that IEHPs who obtained their education in French-speaking European countries had the highest employment rate compared to other regions of education. IEHPs who were educated in most regions were more likely to obtain employment in a health occupation than their counterparts who were educated in Asia. Region of education was also associated with the type of health occupation IEHPs held—those from English-speaking Western countries, French-speaking European countries, Caribbean, Central and South American countries, and African countries were more likely to be employed in professional health occupations than their counterparts who were educated in Asian countries. Furthermore, IEHPs who had studied in English-speaking Western countries or French-speaking European countries had higher earnings than their counterparts who were educated in Asia.
The results showed that IEHPs who studied in all major health fields of study were more likely to be employed in health occupations compared to IEHPs who had studied 'other' health fields. However, IEHPs who had studied nursing tended to have better labour market outcomes than IEHPs from other fields of study. First, IEHPs with educational training in nursing had the second lowest unemployment rate (6.0%) and second highest employment rate (79.6%) compared to IEHPs with a background in other fields. Among IEHPs who were employed, over two-thirds of those with a nursing education were employed in a health occupation—a higher percentage than IEHPs from all other fields of study. Over one-third (35.3%) were employed in professional health occupations and an additional 31.3% worked in technical health fields. Their top five occupations were registered nurses and registered psychiatric nurses (34%); nurse aides, orderlies, and patient service associates (21%); licensed practical nurses (8%); light duty cleaners (2%); and social and community service workers (2%). On average, IEHPs with a nursing background earned more ($56,500) than most other IEHPs, except for those who studied medicine or pharmacy fields.
In contrast, IEHPs with educational training in medicine had a lower employment rate (73.2%) than IEHPs who had studied in most other fields; only IEHPs who had studied dentistry or personal support work had lower rates of employment. Among those who were employed, over half of IEHPs who studied medicine were employed in professional health occupations. Further examination of employment by educational background indicated that just over 1 in 10 IEHPs who had a degree in medicine, dentistry, or optometry worked in technical health occupations, indicating some degree of underemployment among these workers. Their top five occupations were general practitioners and family physicians (28%); specialists in clinical and laboratory medicine (13%); nurse aides, orderlies, and patient service associates (4%); registered nurses and registered psychiatric nurses (4%); and medical sonographers (3%). Employed IEHPs with an educational background in medicine earned more than other employed IEHPs on average.
Lastly, the type of health occupation an IEHP held was a significant predictor of their earnings in Canada. Those who were employed in managerial, professional, or technical health occupations earned more than their counterparts employed in non-health occupations. However, there was no statistically significant difference between the earnings of IEHPs employed in lower-skilled health occupations and IEHPs employed in non-health occupations. These results indicate that employment in higher-skilled health occupations corresponds to an earnings advantage for IEHPs.
While this study provides updated information on the characteristics and labour market outcomes of IEHPs in Canada, there are some limitations. First, the results are cross-sectional and therefore changes in the employment of IEHPs across time cannot be followed. Second, while the labour market outcomes provide a picture of the extent to which IEHPs are employed in occupations relevant to their educational training, this report does not provide specific information on occupational matching. However, this could be addressed in future research, such as more detailed analyses of the inconsistencies between the type of health education IEHPs have and their occupations in Canada. For example, further investigation into the extent to which IEHPs trained in medicine are employed as physicians, or the proportion of IEHPs who studied nursing and are employed as nurses would provide greater insight into the underemployment and occupational matching of IEHPs in Canada. Third, an examination of the inconsistencies between fields of study and education levels would also be useful; for example, determining the number of IEHPs educated in medical fields but who report a bachelor's degree or lower as their highest level of education, and whether these differences show a pattern by region of education.
Addressing these information gaps would allow policymakers to better understand the labour market integration of IEHPs into Canada's health workforce. Additionally, this study did not examine non-permanent residents who were internationally educated health care professionals. The 2021 census data show that the number of NPR IEHPs was sizable (35,580) and about 74% of them were employed with a relatively high concentration working as nurse aides, orderlies, or patient service associates. To better understand the landscape of IEHPs, further studies should examine the transition of NPR IEHPs to permanent residency and their retention in health occupations. As this report focuses on providing new information on the landscape of IEHPs, future studies may offer further detailed analyses of specific population groups such as gender groups, racialized population groups, and their intersectionality.
Conclusion
While immigrants who were educated outside of Canada have a long history of contributing to Canada's labour force, detailed information on the labour market outcomes of those with training and qualifications in health fields is limited. This type of information is needed amid labour shortages in the health care sector, particularly in the wake of the COVID-19 pandemic. This study provides new information about the profile of IEHPs in Canada and their labour market outcomes, with results disaggregated by sociodemographic, educational, and immigration characteristics.
Generally, the results found that 57.7% of IEHPs in Canada were employed in health occupations in 2021, with most concentrated in professional health occupations. However, some groups of IEHPs experienced better outcomes than others. For example, among IEHPs in Canada, women were less likely to obtain employment in a professional health occupation and recently arrived IEHPs (who arrived in Canada between 2016 and 2021) had several employment disadvantages compared to their counterparts who arrived in earlier years.
Findings from this study can help to inform policymakers about the degree to which IEHPs are not using their skills and educational training in the health sector and which groups of IEHPs may be experiencing greater barriers to entering health occupations in Canada. The results will also be of importance to IEHPs themselves, as well as to employers of health care professionals.
References
- Augustine, J. and Commissioner, F. 2015. "Employment Match Rates in the Regulated Professions: Trends and Policy Implications. Canadian Public Policy, 41, S28–S47. http://www.jstor.org/stable/43697449
- Bauder, H. 2003. "'Brain Abuse', or the Devaluation of Immigrant Labour in Canada." Antipode, 35(4), 699–717. DOI: 10.1046/j.1467-8330.2003.00346.x
- Bourgeault, I. 2013. "Ethical considerations for Effective Health Human Resources Planning and Management." Healthcare Management Forum, 26(2), 65–67.
- Campbell-Page, R.M., J. Tepper, A.G. Klei, B. Hodges, M. Alsuwaidan, D.H. Bayoumy, J.A. Page and D.C. Cole. 2013. "Foreign-trained medical professionals: Wanted or not? A case study of Canada." Journal of Global Health 3(2): 020304.
- Cornelissen, L. 2023. Choosing the reference population for census statistics on language of work. Catalogue no. 89-657-X2023004. Ottawa: Statistics Canada.
- Cornelissen, L. 2021. "Profile of Immigrants in Nursing and Health Care Support Occupations." Insights on Canadian Society. Catalogue no. 75-006-X. Ottawa: Statistics Canada.
- Covell, C.L, M-D. Primeau, K. Kilpatrick, and I. St-Pierre. 2017. "Internationally educated nurses in Canada: predictors of workforce integration." Human Resources for Health, 15(1). DOI: 10.1186/s12960-017-0201-8
- Covell, C.L., E. Neiterman, and I.L. Bourgeault. 2016. "Scoping review about the professional integration of internationally educated health professionals." Human Resources for Health 14, 38.
- Darzi, A. and T. Evans. 2016. "The global shortage of health workers—an opportunity to transform care." The Lancet 388(10060: 2576–2577.
- Dumont, J-C., P. Zurn, J. Church, and C. LeThi. 2008. International Mobility of Health Professionals and Health Workforce Management in Canada: Myths and Realities. OECD Health Working Papers No. 40. Paris: OECD.
- Employment and Social Development Canada (ESDC). 2022. Government of Canada launches call for proposals to help internationally educated professionals work in Canadian healthcare. News Release. Dec. 5, 2022. https://www.canada.ca/en/employment-social-development/news/2022/12/government-of-canada-launches-call-for-proposals-to-help-internationally-educated-professionals-work-in-canadian-healthcare.html
- Employment and Social Development Canada (ESDC). 2023. Learn more about foreign credential recognition in Canada. Available at: https://www.canada.ca/en/employment-social-development/programs/foreign-credential-recognition.html
- Girard, M. and M. Smith. 2013. "Working in a regulated occupation in Canada: An immigrant-native born comparison." Journal of International Migration and Integration, 14: 219–244.
- Government of New Brunswick. n.d. Immigration and Settlement in New Brunswick: Internationally Educated Healthcare Professionals (IEHPs). Available at: https://www.welcomenb.ca/content/wel-bien/en/international_nurses.html
- Government of Saskatchewan. 2022. Regulatory Changes, Additional Supports to Reduce Credential Recognition Challenges Face by Out-of-Province Workers. December 6. Available at: https://www.saskatchewan.ca/government/news-and-media/2022/december/06/
- regulatory-changes-additional-supports-to-reduce-credential-recognition-challenges-faced-by-outofpro
- Grez, E.E., P.A. Gamboa, and S.Purewal. 2023. The Myth of Canada: The Exclusion of Internationally Trained Physicians. https://radiussfu.com/wp-content/uploads/2023/02/The-Myth-Of-Canada_DIGITAL.pdf
- Guo, 2. 2009. "Difference, Deficiency, and Devaluation: Tracing the Roots of Non-Recognition of Foreign Credentials for Immigrant Professionals in Canada." Canadian Journal for the Study of Adult Education, 22: 37–52.
- Harun, R. and M. Walton-Roberts. 2022. "Assessing the Contribution of Immigrants to Canada's Nursing and Health Care Support Occupations: A Multi-Scalar Analysis." Human Resources for Health, 20:53. DOI: https://doi.org/10.1186/s12960-022-00748-7
- Hou, F. and C. Schimmele. 2020. "Adults with a Health Education but not Working in Health Occupations." StatCan COVID-19: Data to Insights for a Better Canada. Catalogue no. 45280001. Ottawa: Statistics Canada.
- Houle, R. and Yssaad. 2010. "Recognition of Newcomers" Foreign Credentials and Work Experience." Perspectives on Labour and Income, 11(9), 18–33.Ottawa: Statistics Canada.
- Murphy, G.T., T. Sampalli, L.B. Bearskin, N. Cashen, G. Cummings, A.E. Rose et al. 2022. "Investing in Canada's nursing worforce post-pandemic: A call to action." FACETS, 7: 1051–1120.
- Tardif, A., B. Gupta, L. McNeely, and W. Feeney. 2022. "Impact of the COVID-19 pandemic on the health workforce in Canada." Healthcare Quarterly, 25(1): 17–20.
- Tilson, D. 2009. Recognizing Success: A Report on Improving Foreign Credential Recognition. Report of the Standing Committee on Citizenship and Immigration. November 2009. 40th Parliament, 2nd session, House of Commons. Available at: https://www.noscommunes.ca/Content/Committee/402/CIMM/Reports/RP4227034/cimmrp13/cimmrp13-e.pdf
- Turcotte, M. and K. Savage. 2020. "The Contribution of Immigrants and Population Groups Designated as Visible Minorities to Nurse Aide, Orderly and Patient Service Associate Occupations." StatCan COVID-19: Data to Insights for a Better Canada. Catalogue no. 45280001. Ottawa: Statistics Canada.
- Walton-Roberts. 2023. "The Future of Health Care Work and the Place of Migrant Workers within It: Internationally Educated Nurses in Ontario Canada during the COVID-19 Pandemic." Journal of Immigrant and Refugee Studies, DOI: 10.1080/15562948.2022.2153393
- Walton-Roberts, M. (Ed). 2022. "Global Migration." Gender and Health Professional Credentials: Transnational Value Transfers and Losses. University of Toronto Press.
- Wang, Y., R.L. Vijendra Das, T. Lapa, P. Marosan, R. Pawliuk, H.D. Chable, et al. 2023. "Career Development of International Medical Graduates in Canada: Status of the Unmatched." Humanities and Social Sciences Communications, 10:38. DOI: https://doi.org/10.1057/s41599-023-01534-z
- World Education Services. 2023. Summary of Recent Provincial Initiatives Supporting Internationally Educated Health Professionals (IEHPs). Available at: https://i5d8m7g6.rocketcdn.me/wp-content/uploads/2023/07/Provincial-IEHP-Initiatives_ESDC-Comp_July-2023.pdf
- World Education Services. 2022. Addressing the Underutilization of Internationally Educated Health Professionals in Canada: What the Data Does and Doesn't Tell Us. Policy Brief. March 2022. Available at: https://knowledge.wes.org/canada-report-addressing-the-underutilization-of-iehps-in-canada.html
Appendix Table 1
| CIP code | Field of study |
|---|---|
| 31.05 | Sports, kinesiology, and physical education/physical fitness |
| 42.28 | Clinical, counselling and applied psychology |
| 51.00 | General health services/allied health/health sciences |
| 51.01 | Chiropractic (DC) |
| 51.02 | Communication disorders sciences and services |
| 51.04 | Dentistry (DDS, DMD) |
| 51.05 | Advanced/graduate dentistry and oral sciences (Cert., MS, MSc, PhD) |
| 51.06 | Dental support services and allied professions |
| 51.07 | Health and medical administrative services |
| 51.08 | Allied health and medical assisting services |
| 51.09 | Allied health diagnostic, intervention and treatment professions |
| 51.10 | Clinical/medical laboratory science/research and allied professions |
| 51.11 | Health/medical preparatory programs |
| 51.12 | Medicine |
| 51.14 | Medical clinical sciences/graduate medical studies |
| 51.15 | Mental and social health services and allied professions |
| 51.17 | Optometry (OD) |
| 51.18 | Ophthalmic and optometric support services and allied professions |
| 51.20 | Pharmacy, pharmaceutical sciences and administration |
| 51.22 | Public health |
| 51.23 | Rehabilitation and therapeutic professions |
| 51.26 | Health aides/attendants/orderlies |
| 51.27 | Medical illustration and informatics |
| 51.31 | Dietetics and clinical nutrition services |
| 51.32 | Health professions education, ethics, and humanities |
| 51.33 | Alternative and complementary medicine and medical systems |
| 51.34 | Alternative and complementary medical support services |
| 51.35 | Somatic bodywork and related therapeutic services |
| 51.36 | Movement and mind-body therapies |
| 51.37 | Energy-based and biologically-based therapies |
| 51.38 | Registered nursing, nursing administration, nursing research and clinical nursing |
| 51.39 | Practical nursing, vocational nursing and nursing assistants |
| 51.99 | Health professions and related programs, other |
| 60.01 | Dental residency/fellowship programs |
| 60.07 | Nurse practitioner residency/fellowship programs |
| 60.08 | Pharmacy residency/fellowship programs |
| 60.09 | Physician assistant residency/fellowship programs |
| 60.99 | Health professions residency/fellowship programs, other |
| 61.01 | Combined medical residency/fellowship programs |
| 61.02 | Multiple-pathway medical fellowship programs |
| 61.03 | Allergy and immunology residency/fellowship programs |
| 61.04 | Anesthesiology residency/fellowship programs |
| 61.05 | Dermatology residency/fellowship programs |
| 61.06 | Emergency medicine residency/fellowship programs |
| 61.07 | Family medicine residency/fellowship programs |
| 61.08 | Internal medicine residency/fellowship programs |
| 61.09 | Medical genetics and genomics residency/fellowship programs |
| 61.10 | Neurological surgery residency/fellowship programs |
| 61.11 | Neurology residency/fellowship programs |
| 61.12 | Nuclear medicine residency/fellowship programs |
| 61.13 | Obstetrics and gynecology residency/fellowship programs |
| 61.14 | Ophthalmology residency/fellowship programs |
| 61.15 | Orthopedic surgery residency/fellowship programs |
| 61.16 | Osteopathic medicine residency/fellowship programs |
| 61.17 | Otolaryngology residency/fellowship programs |
| 61.18 | Pathology residency/fellowship programs |
| 61.19 | Pediatrics residency/fellowship programs |
| 61.20 | Physical medicine and rehabilitation residency/fellowship programs |
| 61.21 | Plastic surgery residency/fellowship programs |
| 61.22 | Podiatric medicine residency/fellowship programs |
| 61.23 | Preventive medicine residency/fellowship programs |
| 61.24 | Psychiatry residency/fellowship programs |
| 61.25 | Radiation oncology residency/fellowship programs |
| 61.26 | Radiology residency/fellowship programs |
| 61.27 | Surgery residency/fellowship programs |
| 61.28 | Urology residency/fellowship programs |
| 61.99 | Medical residency/fellowship programs, other |
Appendix Table 2
| Broad field of study | CIP code | CIP field of study |
|---|---|---|
| Medicine/medical field | 51.12 | Medicine |
| 61.01 | Combined medical residency/fellowship programs | |
| 61.02 | Multiple-pathway medical fellowship programs | |
| 61.03 | Allergy and immunology residency/fellowship programs | |
| 61.04 | Anesthesiology residency/fellowship programs | |
| 61.05 | Dermatology residency/fellowship programs | |
| 61.06 | Emergency medicine residency/fellowship programs | |
| 61.07 | Family medicine residency/fellowship programs | |
| 61.08 | Internal medicine residency/fellowship programs | |
| 61.09 | Medical genetics and genomics residency/fellowship programs | |
| 61.10 | Neurological surgery residency/fellowship programs | |
| 61.11 | Neurology residency/fellowship programs | |
| 61.12 | Nuclear medicine residency/fellowship programs | |
| 61.13 | Obstetrics and gynecology residency/fellowship programs | |
| 61.14 | Ophthalmology residency/fellowship programs | |
| 61.15 | Orthopedic surgery resid ency/fellowship programs | |
| 61.16 | Osteopathic medicine residency/fellowship programs | |
| 61.17 | Otolaryngology residency/fellowship programs | |
| 61.18 | Pathology residency/fellowship programs | |
| 61.19 | Pediatrics residency/fellowship programs | |
| 61.20 | Physical medicine and rehabilitation residency/fellowship programs | |
| 61.21 | Plastic surgery residency/fellowship programs | |
| 61.22 | Podiatric medicine residency/fellowship programs | |
| 61.23 | Preventive medicine residency/fellowship programs | |
| 61.24 | Psychiatry residency/fellowship programs | |
| 61.25 | Radiation oncology residency/fellowship programs | |
| 61.26 | Radiology residency/fellowship programs | |
| 61.27 | Surgery residency/fellowship programs | |
| 61.28 | Urology residency/fellowship programs | |
| 61.99 | Medical residency/fellowship programs, other | |
| Nurses | 51.3801 | Registered nursing/registered nurse (RN, ASN, BSN, BScN, MSN, MScN) |
| 51.3802 | Nursing administration (Cert., MSN, MS, MScN, MSc, PhD) | |
| 51.3803 | Adult health nurse/nursing | |
| 51.3804 | Nurse anesthetist | |
| 51.3805 | Primary health care nurse/nursing and family practice nurse/nursing | |
| 51.3806 | Maternal/child health and neonatal nurse/nursing | |
| 51.3807 | Nurse midwife/nursing midwifery | |
| 51.3808 | Nursing science (MS, MSc, PhD) | |
| 51.3809 | Pediatric nurse/nursing | |
| 51.3810 | Psychiatric/mental health nurse/nursing | |
| 51.3811 | Public health/community nurse/nursing | |
| 51.3812 | Perioperative/operating room and surgical nurse/nursing | |
| 51.3813 | Clinical nurse specialist | |
| 51.3814 | Critical care nurse/nursing | |
| 51.3815 | Occupational and environmental health nurse/nursing | |
| 51.3816 | Emergency room/trauma nurse/nursing | |
| 51.3818 | Nursing practice | |
| 51.3819 | Palliative care nurse/nursing | |
| 51.3821 | Geriatric nurse/nursing | |
| 51.3823 | Registered psychiatric nurse/nursingCAN | |
| 51.3824 | Forensic nursing | |
| 51.3899 | Registered nursing, nursing administration, nursing research and clinical nursing, other | |
| 60.0700 | Nurse practitioner residency/fellowship programs | |
| 51.3900 | Practical nursing, vocational nursing and nursing assistants | |
| 51.3901 | Licensed practical/vocational nurse training | |
| Therapeutic services | 51.23 | Rehabilitation and therapeutic professions |
| 51.2306 | Occupational therapist | |
| 51.2309 | Physiotherapist | |
| 51.09 | Allied health diagnostic, intervention and treatment professions | |
| 51.0908 | Respiratory care therapy/therapist | |
| Laboratory/diagnostics | 51.10 | Clinical/medical laboratory science/research and allied professions |
| 51.09 | Allied health diagnostic, intervention and treatment professions | |
| 51.0912 | Physician assistant | |
| Pharmacy | 51.20 | Pharmacy, pharmaceutical sciences and administration |
| 60.08 | Pharmacy residency/fellowship programs | |
| Personal Support Work | 51.26 | Health aides/attendants/orderlies |
| Dentistry | 51.04 | Dentistry (DDS, DMD) |
| 51.05 | Advanced/graduate dentistry and oral sciences (Cert., MS, MSc, PhD) | |
| 51.06 | Dental support services and allied professions |
Appendix Table 3
| NOC major group | "NOC code (5-digit)" | Occupation title |
|---|---|---|
| Specialized middle management occupations in health care | 30010 | Managers in health care |
| Professional occupations in health | 31100 | Specialists in clinical and laboratory medicine |
| 31101 | Specialists in surgery | |
| 31102 | General practitioners and family physicians | |
| 31110 | Dentists | |
| 31111 | Optometrists | |
| 31112 | Audiologists and speech-language pathologists | |
| 31120 | Pharmacists | |
| 31200 | Psychologists | |
| 31202 | Physiotherapists | |
| 31203 | Occupational therapists | |
| 31204 | Kinesiologists and other professional occupations in therapy and assessment | |
| 31209 | Other professional occupations in health diagnosing and treating | |
| 31300 | Nursing coordinators and supervisors | |
| 31301 | Registered nurses and registered psychiatric nurses | |
| 31302 | Nurse practitioners | |
| 31303 | Physician assistants, midwives, and allied health professionals | |
| Technical occupations in health | 32100 | Opticians |
| 32101 | Licensed practical nurses | |
| 32102 | Paramedical occupations | |
| 32103 | Respiratory therapists, clinical perfusionists, and cardiopulmonary | |
| 32109 | Other technical occupations in therapy and assessment | |
| 32110 | Denturists | |
| 32111 | Dental hygienists and dental therapists | |
| 32120 | Medical laboratory technologists | |
| 32121 | Medical radiation technologists | |
| 32122 | Medical sonographers | |
| 32123 | Cardiology technologists and electrophysiological diagnostic technnologists | |
| 32124 | Pharmacy technicians | |
| 32129 | Other medical technologists and technicians | |
| Assisting occupations in support of health services | 33100 | Dental assistants and dental laboratory assistants |
| 33101 | Medical laboratory assistants and related technical occupations | |
| 33102 | Nurse aides, orderlies, and patient service associates | |
| 33103 | Pharmacy technical assistants and pharmacy assistants | |
| 33109 | Other assisting occupations in support of health services | |
| Occupations in education, law and social, community and government services | 44101 | Home support workers, caregivers, and related occupations |
Appendix Table 4
| Canada | Newfoundland and Labrador | Prince Edward Island | Nova Scotia | New Brunswick | Quebec | Ontario | Manitoba | Saskatchewan | Alberta | British Columbia | Territories | |
|---|---|---|---|---|---|---|---|---|---|---|---|---|
| Gender | Count | |||||||||||
| Men+ | 74,770 | 300 | 160 | 1,065 | 560 | 9,355 | 33,275 | 3,480 | 2,350 | 11,640 | 12,425 | 170 |
| Women+ | 184,920 | 470 | 310 | 2,130 | 965 | 21,245 | 83,035 | 8,195 | 4,930 | 30,395 | 32,805 | 440 |
| Current age | ||||||||||||
| 18–29 | 15,935 | 45 | 10 | 225 | 75 | 1,215 | 8,065 | 610 | 470 | 2,575 | 2,615 | 30 |
| 30–39 | 80,665 | 260 | 230 | 1,280 | 395 | 10,045 | 33,505 | 5,200 | 3,095 | 14,710 | 11,710 | 235 |
| 40–49 | 76,025 | 215 | 95 | 730 | 460 | 10,055 | 32,680 | 3,220 | 1,935 | 13,800 | 12,685 | 155 |
| 50–59 | 63,090 | 155 | 95 | 675 | 405 | 6,905 | 30,105 | 2,050 | 1,360 | 8,225 | 12,970 | 135 |
| 60+ | 23,980 | 90 | 50 | 280 | 185 | 2,370 | 11,950 | 605 | 420 | 2,720 | 5,255 | 50 |
| Age at immigration | ||||||||||||
| <= 24 | 39,870 | 120 | 25 | 335 | 175 | 2,885 | 20,615 | 1,530 | 885 | 5,660 | 7,565 | 75 |
| 25 to 34 | 129,650 | 345 | 245 | 1,690 | 565 | 15,770 | 57,000 | 6,395 | 3,790 | 22,130 | 21,400 | 330 |
| 35 to 44 | 69,515 | 225 | 125 | 855 | 515 | 9,390 | 29,735 | 2,955 | 1,980 | 11,305 | 12,295 | 145 |
| 45 + | 20,650 | 85 | 75 | 320 | 265 | 2,550 | 8,965 | 800 | 625 | 2,945 | 3,980 | 50 |
| Period of immigration | ||||||||||||
| 2016–2021 | 83,345 | 325 | 310 | 1,655 | 655 | 11,680 | 33,965 | 4,470 | 2,720 | 15,125 | 12,200 | 240 |
| 2010–2015 | 62,715 | 190 | 70 | 585 | 350 | 7,215 | 25,095 | 3,850 | 2,855 | 12,490 | 9,895 | 130 |
| 2000–2009 | 68,135 | 150 | 60 | 570 | 320 | 7,945 | 33,050 | 2,430 | 1,225 | 9,585 | 12,655 | 150 |
| Before 2000 | 45,490 | 110 | 40 | 395 | 200 | 3,755 | 24,200 | 925 | 480 | 4,830 | 10,485 | 85 |
| Immigration class | ||||||||||||
| Federal skilled workers | 83,780 | 255 | 60 | 700 | 270 | 2,525 | 47,575 | 1,690 | 1,305 | 13,850 | 15,440 | 115 |
| Provincial Nominee program | 52,205 | 265 | 315 | 1,380 | 700 | 16,340 | 8,410 | 6,910 | 3,845 | 7,255 | 6,610 | 175 |
| Other economic immigrants | 44,405 | 65 | 15 | 280 | 135 | 2,195 | 21,150 | 540 | 635 | 9,255 | 10,025 | 120 |
| Family immigrants | 58,890 | 140 | 65 | 585 | 315 | 6,470 | 28,070 | 2,150 | 1,240 | 9,175 | 10,515 | 160 |
| Refugees, humanitarian category | 16,725 | 35 | 0 | 190 | 70 | 2,780 | 9,375 | 275 | 220 | 2,020 | 1,745 | 25 |
| Immigrants arrived before 1980 | 3,690 | 15 | 15 | 65 | 35 | 290 | 1,730 | 120 | 40 | 485 | 895 | 0 |
| Language | ||||||||||||
| English mother tongue | 58,120 | 265 | 135 | 965 | 500 | 3,330 | 26,435 | 2,350 | 1,895 | 11,170 | 10,900 | 165 |
| French mother tongue | 8,565 | 10 | 0 | 45 | 100 | 6,700 | 1,085 | 60 | 25 | 270 | 250 | 15 |
| Other mother tongue, speaks English | 169,175 | 465 | 310 | 2,085 | 765 | 5,300 | 84,060 | 9,020 | 5,235 | 29,510 | 32,040 | 395 |
| Other mother tongue, speaks French | 5,945 | 0 | 0 | 0 | 30 | 5,750 | 110 | 0 | 10 | 25 | 10 | 0 |
| Other mother tongue, speaks English and French | 13,790 | 20 | 10 | 65 | 110 | 9,145 | 2,930 | 135 | 55 | 690 | 610 | 15 |
| Other mother tongue, does not speak English or French | 4,100 | 0 | 20 | 30 | 20 | 370 | 1,685 | 105 | 65 | 370 | 1,415 | 10 |
| Population groups | ||||||||||||
| Non-racialized, non-Indigenous | 50,310 | 195 | 120 | 860 | 520 | 9,890 | 20,195 | 1,550 | 925 | 6,230 | 9,690 | 135 |
| South Asian | 56,695 | 160 | 155 | 720 | 170 | 1,630 | 32,495 | 2,460 | 2,000 | 9,595 | 7,210 | 105 |
| Chinese | 18,750 | 30 | 45 | 130 | 50 | 1,330 | 8,760 | 185 | 195 | 1,560 | 6,465 | 0 |
| Black | 16,475 | 100 | 10 | 195 | 160 | 4,190 | 5,980 | 780 | 575 | 3,550 | 895 | 50 |
| Filipino | 66,220 | 170 | 90 | 675 | 280 | 4,070 | 24,200 | 5,575 | 2,905 | 15,240 | 12,755 | 265 |
| Arab and West Asian | 28,155 | 95 | 25 | 370 | 185 | 5,930 | 15,100 | 445 | 295 | 2,445 | 3,260 | 0 |
| Latin American | 8,015 | 0 | 10 | 55 | 40 | 2,350 | 3,235 | 170 | 110 | 1,075 | 960 | 10 |
| Southeast Asian | 3,775 | 10 | 0 | 50 | 25 | 445 | 1,535 | 190 | 125 | 690 | 710 | 10 |
| Korean and Japanese | 5,395 | 0 | 0 | 65 | 50 | 220 | 1,985 | 120 | 20 | 770 | 2,145 | 10 |
| Other racialized population groups | 5,910 | 10 | 15 | 85 | 50 | 525 | 2,825 | 205 | 140 | 880 | 1,150 | 20 |
| Educational level | ||||||||||||
| Postsecondary below bachelor's degree | 64,170 | 155 | 115 | 685 | 465 | 9,550 | 26,635 | 2,640 | 1,600 | 9,975 | 12,130 | 215 |
| Bachelor's degree | 97,570 | 230 | 210 | 1,265 | 420 | 9,605 | 40,430 | 6,100 | 3,280 | 18,745 | 17,035 | 255 |
| Graduate degree (not in medicine) | 44,630 | 120 | 105 | 550 | 270 | 5,665 | 21,610 | 1,365 | 1,035 | 6,005 | 7,840 | 70 |
| Degree in medicine, dentistry, or optometry | 53,325 | 270 | 50 | 695 | 365 | 5,775 | 27,635 | 1,580 | 1,360 | 7,305 | 8,225 | 60 |
| Region of education | ||||||||||||
| English speaking Western countries | 29,305 | 130 | 55 | 510 | 325 | 1,240 | 14,415 | 660 | 530 | 4,205 | 7,195 | 40 |
| French speaking European countries | 5,045 | 10 | 0 | 20 | 65 | 3,895 | 510 | 25 | 0 | 140 | 345 | 35 |
| Other European countries | 22,645 | 40 | 35 | 330 | 165 | 3,320 | 11,140 | 755 | 395 | 2,645 | 3,750 | 70 |
| Caribbean, Central and South America | 14,755 | 55 | 10 | 135 | 85 | 4,345 | 6,535 | 330 | 175 | 1,650 | 1,420 | 20 |
| Africa | 25,115 | 135 | 35 | 340 | 230 | 6,970 | 8,620 | 1,115 | 885 | 4,665 | 2,110 | 25 |
| Asia | 162,720 | 410 | 335 | 1,875 | 655 | 10,820 | 75,080 | 8,790 | 5,300 | 28,705 | 30,345 | 415 |
Note: Sample size is 63,098. Given that the non-binary population is small, data aggregation to a two-category gender variable is sometimes necessary to protect the confidentiality of responses provided. In these cases, individuals in the category "non-binary persons" are distributed into the other two gender categories and are denoted by the "+" symbol. Source: Statistics Canada, 2021 Census of Population. |
||||||||||||
Footnotes
- Footnote 1
-
The authority is often delegated to a regulatory authority of the respective health profession in that jurisdiction.
- Footnote 2
-
This research examined only those aged 20 to 44 and its finding are not comparable to the current analysis.
- Footnote 3
-
Note that the study by Hou and Schimmele (2020) used occupational skill levels based on the 2016 National Occupational Classification (NOC) and their results are not directly comparable to the results of the current study. This is because the current study is based on the new definition of occupational skill levels in the 2021 NOC.
- Footnote 4
-
These outcomes include annual earnings, percent working in health/non-health occupations, distribution of IEHPs across different types of health occupations, and regression analyses related to these outcomes.
- Footnote 5
-
Typically, the occupation variable in the census reports the job the respondent held during the census reference week. However, if the person did not work during that week but had worked at some point since January 1, 2020, the information reported relates to the job held the longest during that period. Persons with two or more jobs are asked to report the information for the job at which they worked the most hours.
- Footnote 6
-
There were estimated 35,580 NPRs who were internationally educated health care professionals in the 2021 census, compared with 259,695 immigrant IEHPs. About 73.7% of NPR IEHPs were employed, and their top five occupations were nurse aides, orderlies and patient service associates (18.1%); registered nurses and registered psychiatric nurses (5.8%); specialists in clinical and laboratory medicine (4.2%); home child care providers (4.1%); and general practitioners and family physicians (3.2%). Overall, 44.6% of employed NPR IEHPs worked in health occupations.
- Footnote 7
-
Given that the population that identifies as non-binary is small, data aggregation to a two-category gender variable is sometimes necessary to protect the confidentiality of responses provided. In these cases, individuals in the category "non-binary persons" were distributed into the other two gender categories and are denoted by the "+" symbol.
- Footnote 8
-
The concept of "population group" is derived directly from the detailed "visible minority" variable in the census. The term "visible minority" comes from the Employment Equity Act, which defines visible minorities as "persons, other than Aboriginal peoples, who are non-Caucasian in race or non-white in colour." The terminology used to refer to visible minority groups collectively is "racialized population groups." Note that population group is a unique concept used to identify visible minority groups and is distinct from other measures that may have similar categorizations such as region of education or ethnic origin. Indigenous individuals were excluded from the study as very few immigrants identify as Indigenous.
- Footnote 9
-
Note that the "personal support work" group is associated with the 'health aides/attendants/orderlies' field of study reported on the census.
- Footnote 10
-
Note that hours worked was not included in the model because the census data measure for hours worked is based on the census reference week, while earnings are based on the year preceding the census. Since it cannot be assumed that individuals worked the same hours in 2020 and 2021, this variable was not included in the model. Additionally, hours (or weeks) worked may be a voluntary or involuntary choice. If it is an involuntary choice, this would be part of the disadvantage in the economic outcomes of IEHPs.
- Footnote 11
-
These percentages were determined by adding the 50–59 and 60+ age groups together.
- Footnote 12
-
Includes Canadian-born and immigrant individuals whose highest degree or diploma was received in Canada. NPRs were excluded.
- Footnote 13
-
While NPR IEHPs were not studied in this paper, they also had very small proportions who had studied therapeutic services (0.7%) or personal support work fields (3.0%).