Drug Analysis Service: Trends 2012-2019
Find detailed information about the drug samples submitted by law enforcement agencies and analyzed by the Drug Analysis Service.
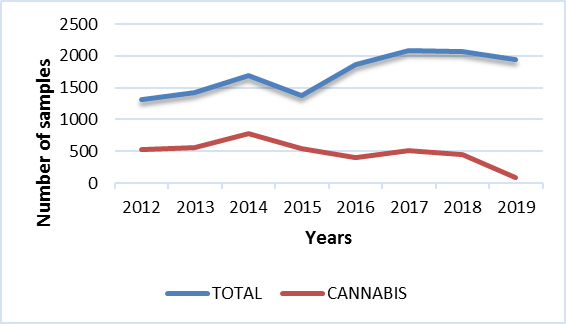
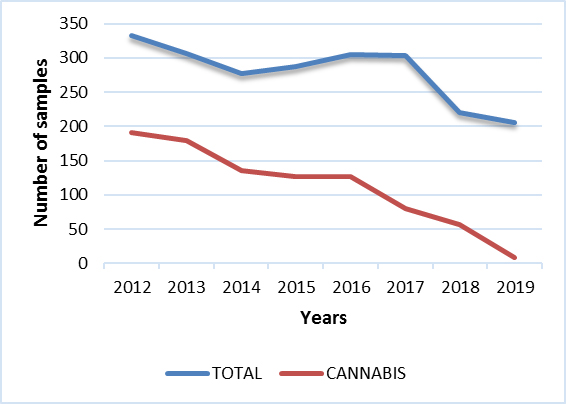
Number of samples received
Canada
Canada / Samples received

Canada / Samples received - Table
|
2012 |
2013 |
2014 |
2015 |
2016 |
2017 |
2018 |
2019 |
| Total |
111283 |
111802 |
114972 |
115679 |
122134 |
131823 |
128270 |
114395 |
| Cannabis |
49190 |
49579 |
51099 |
42717 |
40829 |
41240 |
38487 |
8941 |
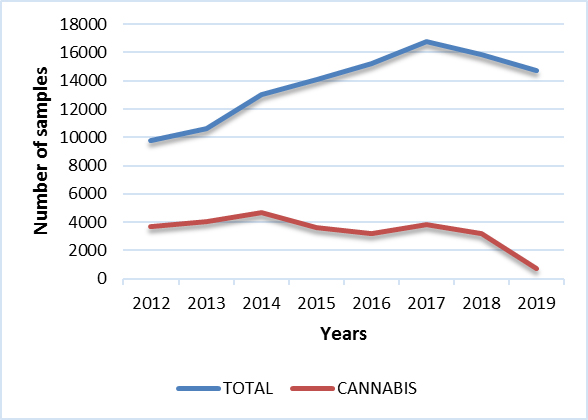
AB
AB / Samples received
AB / Samples received - Table
|
2012 |
2013 |
2014 |
2015 |
2016 |
2017 |
2018 |
2019 |
| Total |
9761 |
10593 |
12992 |
14096 |
15218 |
16798 |
15872 |
14714 |
| Cannabis |
3722 |
4069 |
4684 |
3632 |
3210 |
3812 |
3222 |
715 |
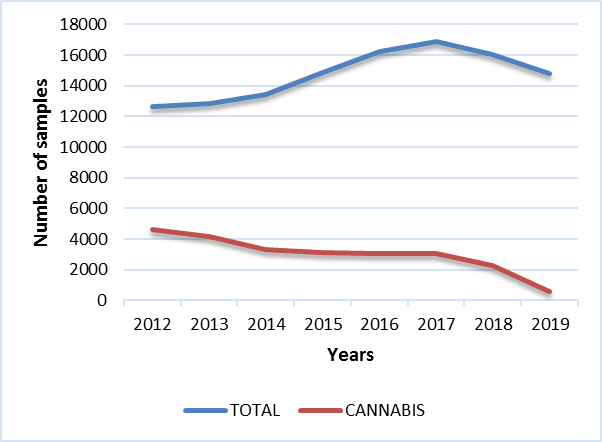
BC
BC / Samples received
BC / Samples received - Table
|
2012 |
2013 |
2014 |
2015 |
2016 |
2017 |
2018 |
2019 |
| Total |
12661 |
12821 |
13446 |
14883 |
16225 |
16880 |
16055 |
14766 |
| Cannabis |
4604 |
4143 |
3321 |
3144 |
3050 |
3029 |
2296 |
604 |
MB
MB / Samples received

MB / Samples received - Table
|
2012 |
2013 |
2014 |
2015 |
2016 |
2017 |
2018 |
2019 |
| Total |
2784 |
2384 |
2232 |
2302 |
2439 |
3308 |
3652 |
2515 |
| Cannabis |
1007 |
1088 |
989 |
838 |
813 |
716 |
910 |
129 |
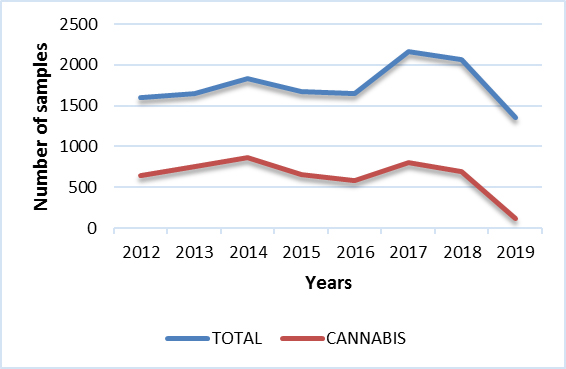
NB
NB / Samples received
NB / Samples received - Table
|
2012 |
2013 |
2014 |
2015 |
2016 |
2017 |
2018 |
2019 |
| Total |
1599 |
1646 |
1828 |
1672 |
1652 |
2163 |
2072 |
1354 |
| Cannabis |
642 |
755 |
868 |
657 |
583 |
800 |
695 |
121 |
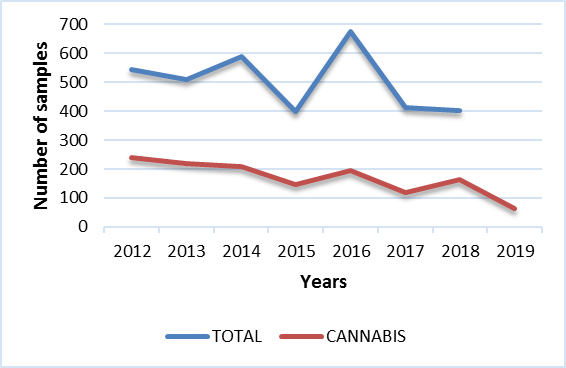
NFL
NFL / Samples received
NFL / Samples received - Table
|
2012 |
2013 |
2014 |
2015 |
2016 |
2017 |
2018 |
2019 |
| Total |
543 |
508 |
588 |
398 |
676 |
412 |
403 |
587 |
| Cannabis |
239 |
218 |
209 |
148 |
194 |
119 |
163 |
62 |
NS
NS / Samples received
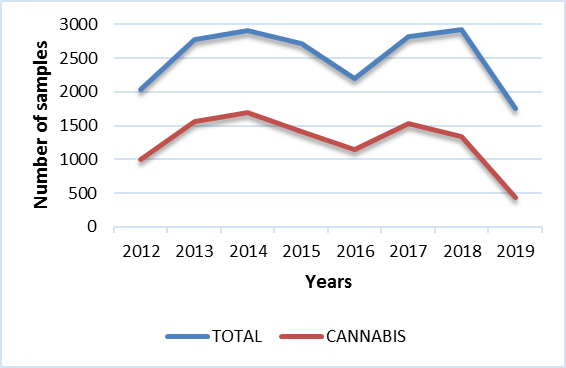
NS / Samples received - Table
|
2012 |
2013 |
2014 |
2015 |
2016 |
2017 |
2018 |
2019 |
| Total |
2032 |
2770 |
2905 |
2719 |
2204 |
2826 |
2925 |
1758 |
| Cannabis |
992 |
1555 |
1693 |
1408 |
1144 |
1531 |
1341 |
431 |
ON
ON / Samples received
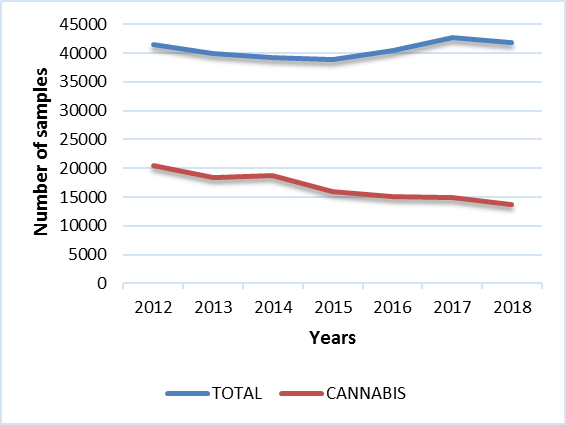
ON / Samples received - Table
|
2012 |
2013 |
2014 |
2015 |
2016 |
2017 |
2018 |
2019 |
| Total |
41412 |
39896 |
39299 |
38823 |
40527 |
42695 |
41816 |
38205 |
| Cannabis |
20424 |
18400 |
18688 |
16043 |
15060 |
14874 |
13775 |
2670 |
PEI
PEI / Samples received
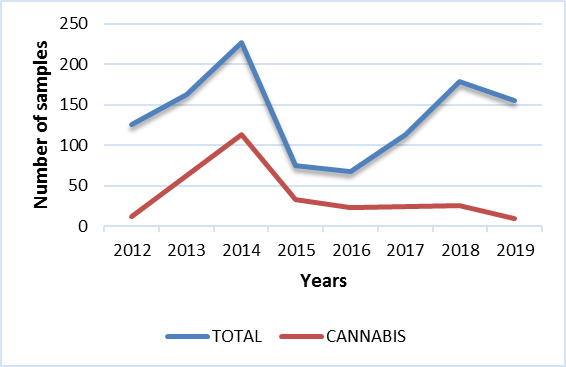
PEI / Samples received - Table
|
2012 |
2013 |
2014 |
2015 |
2016 |
2017 |
2018 |
2019 |
| Total |
126 |
163 |
227 |
75 |
68 |
113 |
179 |
155 |
| Cannabis |
12 |
62 |
113 |
33 |
23 |
24 |
26 |
10 |
QC
QC / Samples received
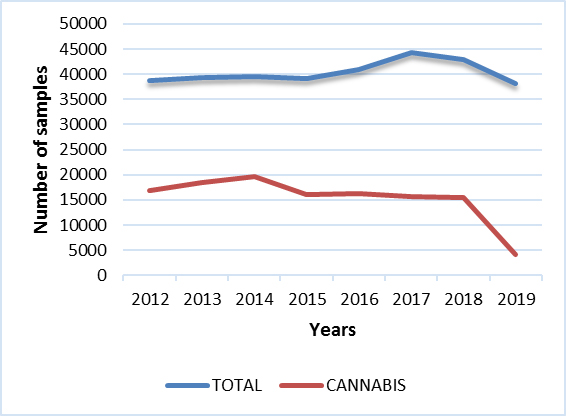
QC / Samples received - Table
|
2012 |
2013 |
2014 |
2015 |
2016 |
2017 |
2018 |
2019 |
| Total |
38713 |
39285 |
39489 |
39044 |
40954 |
44245 |
43012 |
38189 |
| Cannabis |
16827 |
18549 |
19619 |
16146 |
16221 |
15740 |
15560 |
4095 |
SK
SK / Samples received
SK / Samples received - Table
|
2012 |
2013 |
2014 |
2015 |
2016 |
2017 |
2018 |
2019 |
| Total |
1319 |
1430 |
1688 |
1380 |
1866 |
2079 |
2064 |
1947 |
| Cannabis |
530 |
561 |
779 |
542 |
405 |
515 |
443 |
96 |
Territories
Territories / Samples received
Territories / Samples received - Table
|
2012 |
2013 |
2014 |
2015 |
2016 |
2017 |
2018 |
2019 |
| Total |
333 |
306 |
277 |
287 |
305 |
304 |
220 |
205 |
| Cannabis |
191 |
179 |
136 |
126 |
126 |
80 |
56 |
8 |
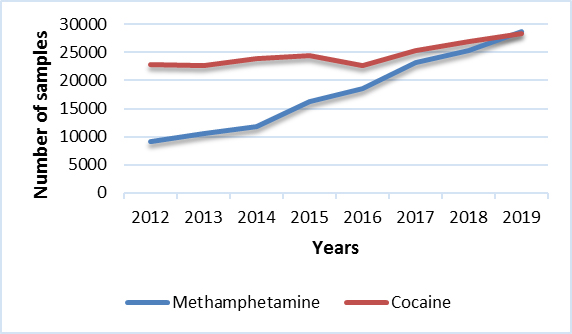
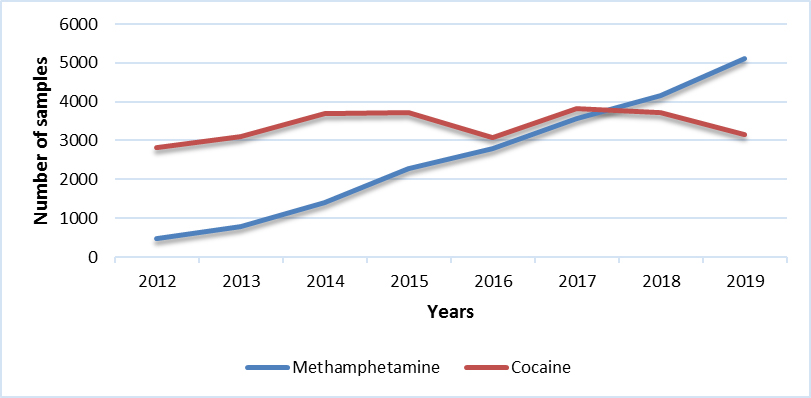
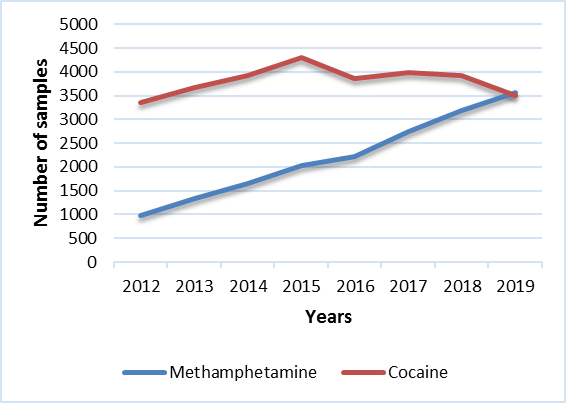
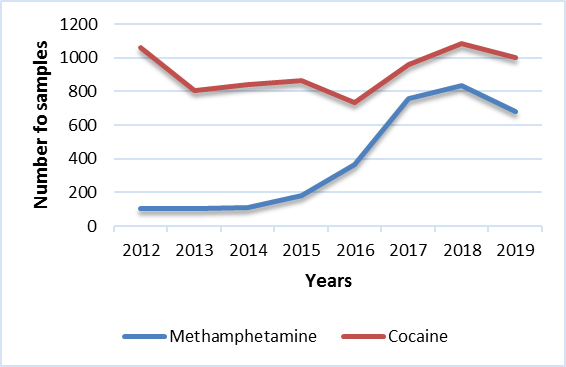
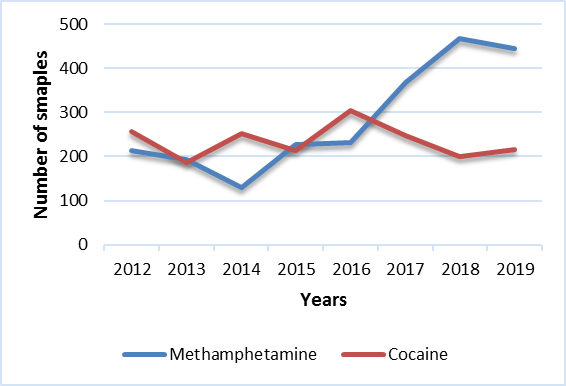
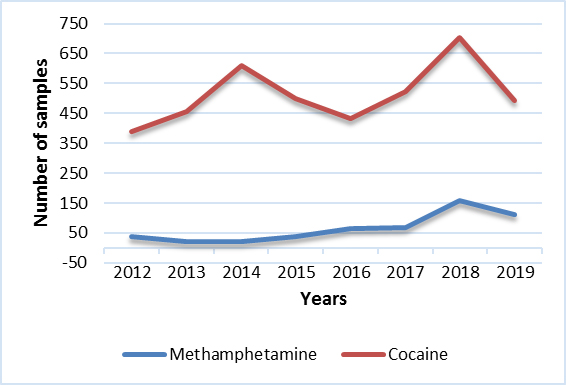
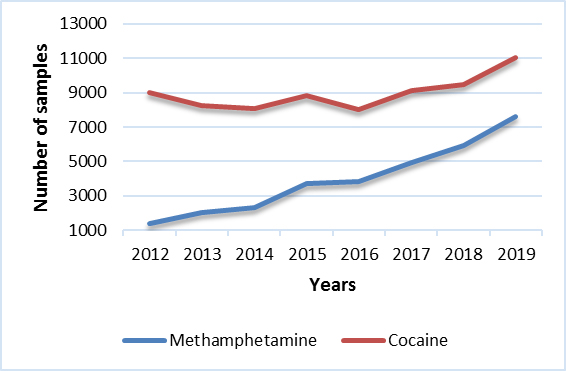
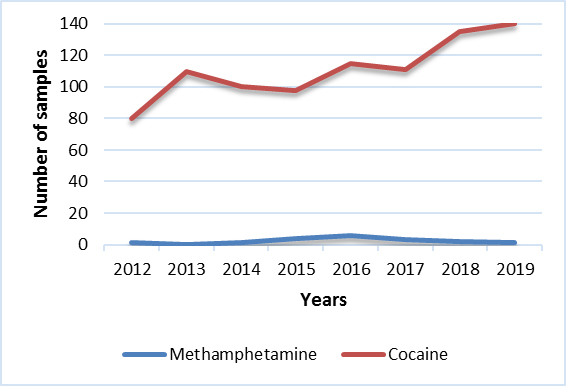
Cocaine & Methamphetamine identified in samples analyzed
Canada
Canada / Cocaine & Methamphetamine
Canada / Cocaine & Methamphetamine - Table
|
2012 |
2013 |
2014 |
2015 |
2016 |
2017 |
2018 |
2019 |
| Methamphetamine |
9175 |
10493 |
11729 |
16229 |
18611 |
23152 |
25314 |
28646 |
| Cocaine |
22883 |
22690 |
23956 |
24403 |
22727 |
25403 |
26944 |
28277 |
AB
AB / Cocaine & Methamphetamine
AB / Cocaine & Methamphetamine - Table
|
2012 |
2013 |
2014 |
2015 |
2016 |
2017 |
2018 |
2019 |
| Methamphetamine |
487 |
786 |
1392 |
2279 |
2801 |
3572 |
4146 |
5120 |
| Cocaine |
2809 |
3103 |
3684 |
3721 |
3064 |
3821 |
3716 |
3159 |
BC
BC / Cocaine & Methamphetamine
BC / Cocaine & Methamphetamine - Table
|
2012 |
2013 |
2014 |
2015 |
2016 |
2017 |
2018 |
2019 |
| Methamphetamine |
975 |
1330 |
1654 |
2027 |
2216 |
2749 |
3177 |
3565 |
| Cocaine |
3351 |
3678 |
3912 |
4292 |
3850 |
3975 |
3932 |
3498 |
MB
MB / Cocaine & Methamphetamine
MB / Cocaine & Methamphetamine - Table
|
2012 |
2013 |
2014 |
2015 |
2016 |
2017 |
2018 |
2019 |
| Methamphetamine |
107 |
103 |
113 |
181 |
364 |
755 |
834 |
682 |
| Cocaine |
1058 |
804 |
842 |
863 |
733 |
960 |
1084 |
1000 |
NB
NB / Cocaine & Methamphetamine
NB / Cocaine & Methamphetamine - Table
|
2012 |
2013 |
2014 |
2015 |
2016 |
2017 |
2018 |
2019 |
| Methamphetamine |
213 |
194 |
129 |
227 |
231 |
368 |
468 |
445 |
| Cocaine |
257 |
187 |
251 |
214 |
305 |
247 |
201 |
215 |
NFL
NFL / Cocaine & Methamphetamine

NFL / Cocaine & Methamphetamine - Table
|
2012 |
2013 |
2014 |
2015 |
2016 |
2017 |
2018 |
2019 |
| Methamphetamine |
8 |
6 |
7 |
6 |
5 |
8 |
6 |
4 |
| Cocaine |
94 |
94 |
109 |
75 |
144 |
92 |
138 |
119 |
NS
NS / Cocaine & Methamphetamine
NS / Cocaine & Methamphetamine - Table
|
2012 |
2013 |
2014 |
2015 |
2016 |
2017 |
2018 |
2019 |
| Methamphetamine |
39 |
22 |
20 |
37 |
63 |
67 |
157 |
110 |
| Cocaine |
388 |
457 |
610 |
498 |
434 |
523 |
704 |
491 |
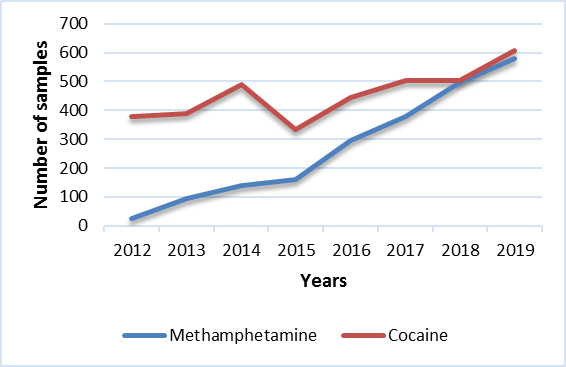
ON
ON / Cocaine & Methamphetamine
ON / Cocaine & Methamphetamine - Table
|
2012 |
2013 |
2014 |
2015 |
2016 |
2017 |
2018 |
2019 |
| Methamphetamine |
1370 |
2036 |
2314 |
3741 |
3830 |
4950 |
5918 |
7634 |
| Cocaine |
9013 |
8275 |
8062 |
8802 |
8039 |
9145 |
9481 |
11051 |
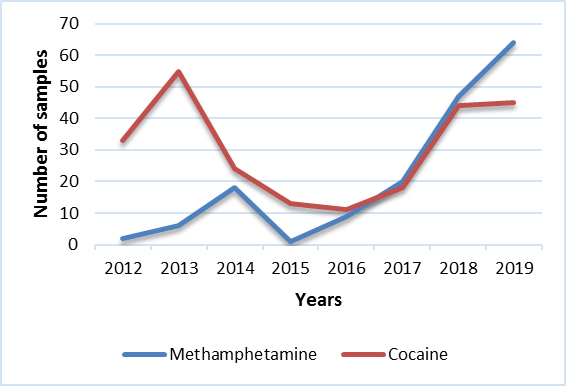
PEI
PEI / Cocaine & Methamphetamine
PEI / Cocaine & Methamphetamine - Table
|
2012 |
2013 |
2014 |
2015 |
2016 |
2017 |
2018 |
2019 |
| Methamphetamine |
2 |
6 |
18 |
1 |
9 |
20 |
47 |
64 |
| Cocaine |
33 |
55 |
24 |
13 |
11 |
18 |
44 |
45 |
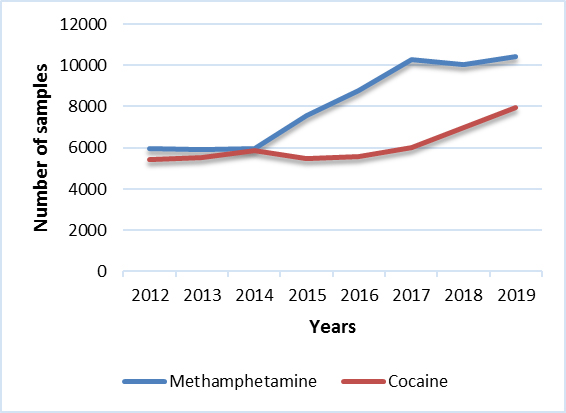
QC
QC / Cocaine & Methamphetamine
QC / Cocaine & Methamphetamine - Table
|
2012 |
2013 |
2014 |
2015 |
2016 |
2017 |
2018 |
2019 |
| Methamphetamine |
5948 |
5916 |
5940 |
7567 |
8790 |
10281 |
10046 |
10441 |
| Cocaine |
5421 |
5539 |
5873 |
5492 |
5586 |
6006 |
7004 |
7950 |
SK
SK / Cocaine & Methamphetamine
SK / Cocaine & Methamphetamine - Table
|
2012 |
2013 |
2014 |
2015 |
2016 |
2017 |
2018 |
2019 |
| Methamphetamine |
25 |
94 |
141 |
159 |
296 |
379 |
495 |
580 |
| Cocaine |
379 |
388 |
489 |
335 |
446 |
505 |
505 |
609 |
Territories
Territories / Cocaine & Methamphetamine
Territories / Cocaine & Methamphetamine - Table
|
2012 |
2013 |
2014 |
2015 |
2016 |
2017 |
2018 |
2019 |
| Methamphetamine |
1 |
0 |
1 |
4 |
6 |
3 |
2 |
1 |
| Cocaine |
80 |
110 |
100 |
98 |
115 |
111 |
135 |
140 |
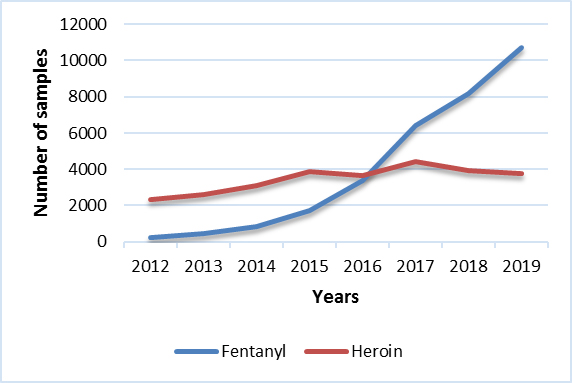
Fentanyl & Heroin identified in samples analyzed
Canada
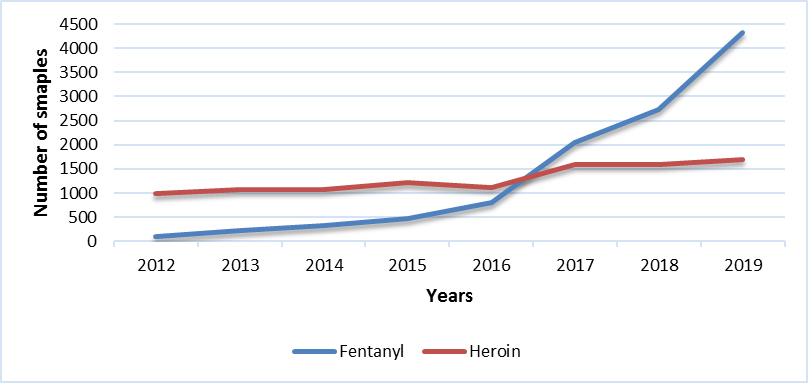
Canada / Fentanyl & Heroin
Canada / Fentanyl & Heroin - Table
|
2012 |
2013 |
2014 |
2015 |
2016 |
2017 |
2018 |
2019 |
| Fentanyl |
217 |
446 |
809 |
1711 |
3351 |
6438 |
8181 |
10722 |
| Heroin |
2337 |
2609 |
3079 |
3883 |
3658 |
4442 |
3934 |
3752 |
AB
AB / Fentanyl & Heroin

AB / Fentanyl & Heroin - Table
|
2012 |
2013 |
2014 |
2015 |
2016 |
2017 |
2018 |
2019 |
| Fentanyl |
18 |
60 |
182 |
564 |
730 |
857 |
1167 |
1832 |
| Heroin |
85 |
118 |
212 |
312 |
324 |
315 |
309 |
418 |
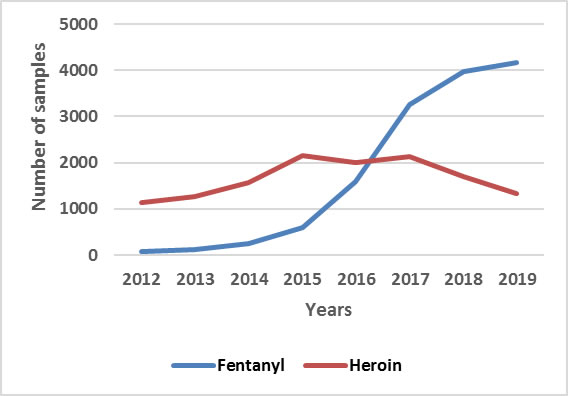
BC
BC / Fentanyl & Heroin
BC / Fentanyl & Heroin - Table
|
2012 |
2013 |
2014 |
2015 |
2016 |
2017 |
2018 |
2019 |
| Fentanyl |
77 |
124 |
242 |
601 |
1596 |
3262 |
3969 |
4173 |
| Heroin |
1137 |
1275 |
1572 |
2152 |
2012 |
2141 |
1698 |
1322 |
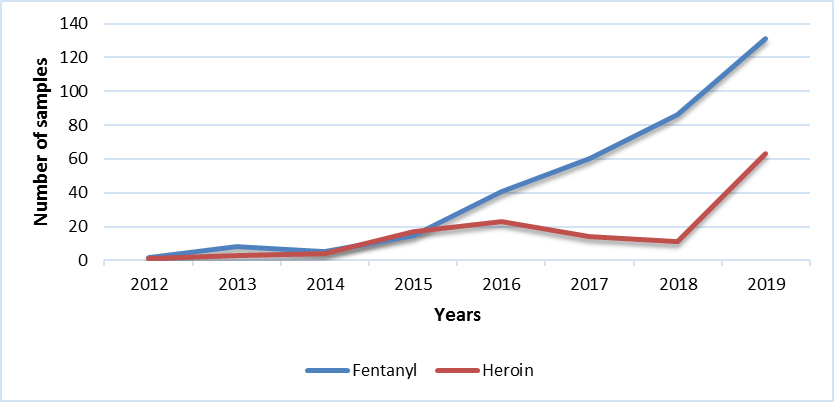
MB
MB / Fentanyl & Heroin
MB / Fentanyl & Heroin - Table
|
2012 |
2013 |
2014 |
2015 |
2016 |
2017 |
2018 |
2019 |
| Fentanyl |
2 |
8 |
5 |
15 |
41 |
60 |
86 |
131 |
| Heroin |
1 |
3 |
4 |
17 |
23 |
14 |
11 |
63 |
NB
NB / Fentanyl & Heroin
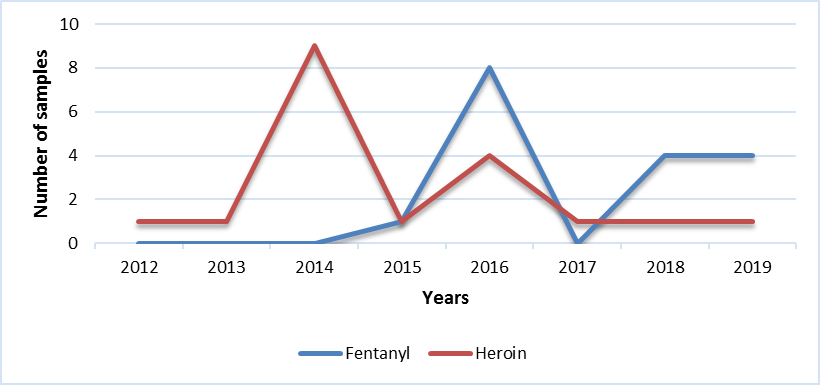
NB / Fentanyl & Heroin - Table
|
2012 |
2013 |
2014 |
2015 |
2016 |
2017 |
2018 |
2019 |
| Fentanyl |
0 |
0 |
0 |
1 |
8 |
0 |
4 |
4 |
| Heroin |
1 |
1 |
9 |
1 |
4 |
1 |
1 |
1 |
NFL
NFL / Fentanyl & Heroin
NFL / Fentanyl & Heroin - Table
|
2012 |
2013 |
2014 |
2015 |
2016 |
2017 |
2018 |
2019 |
| Fentanyl |
5 |
0 |
0 |
1 |
5 |
15 |
9 |
5 |
| Heroin |
0 |
0 |
1 |
1 |
0 |
9 |
4 |
0 |
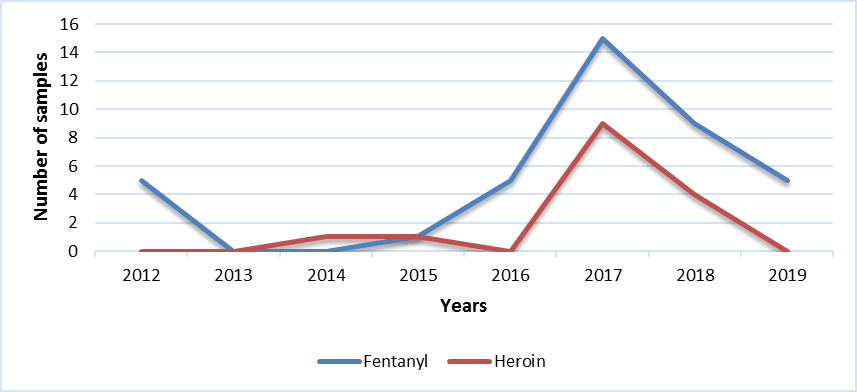
NS
NS / Fentanyl & Heroin
NS / Fentanyl & Heroin - Table
|
2012 |
2013 |
2014 |
2015 |
2016 |
2017 |
2018 |
2019 |
| Fentanyl |
0 |
1 |
0 |
2 |
0 |
5 |
21 |
13 |
| Heroin |
0 |
0 |
2 |
3 |
6 |
2 |
12 |
3 |
ON
ON / Fentanyl & Heroin
ON / Fentanyl & Heroin - Table
|
2012 |
2013 |
2014 |
2015 |
2016 |
2017 |
2018 |
2019 |
| Fentanyl |
106 |
235 |
325 |
465 |
809 |
2052 |
2729 |
4329 |
| Heroin |
986 |
1064 |
1069 |
1214 |
1118 |
1598 |
1593 |
1692 |
PEI
PEI / Fentanyl & Heroin
PEI / Fentanyl & Heroin - Table
|
2012 |
2013 |
2014 |
2015 |
2016 |
2017 |
2018 |
2019 |
| Fentanyl |
0 |
0 |
0 |
0 |
0 |
0 |
0 |
0 |
| Heroin |
0 |
0 |
0 |
0 |
0 |
0 |
0 |
0 |
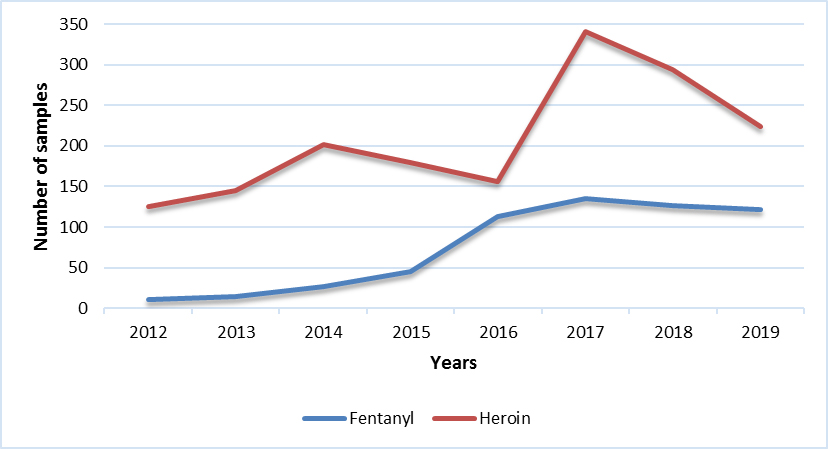
QC
QC / Fentanyl & Heroin
QC / Fentanyl & Heroin - Table
|
2012 |
2013 |
2014 |
2015 |
2016 |
2017 |
2018 |
2019 |
| Fentanyl |
10 |
14 |
26 |
45 |
113 |
135 |
126 |
122 |
| Heroin |
125 |
145 |
202 |
180 |
156 |
341 |
294 |
224 |
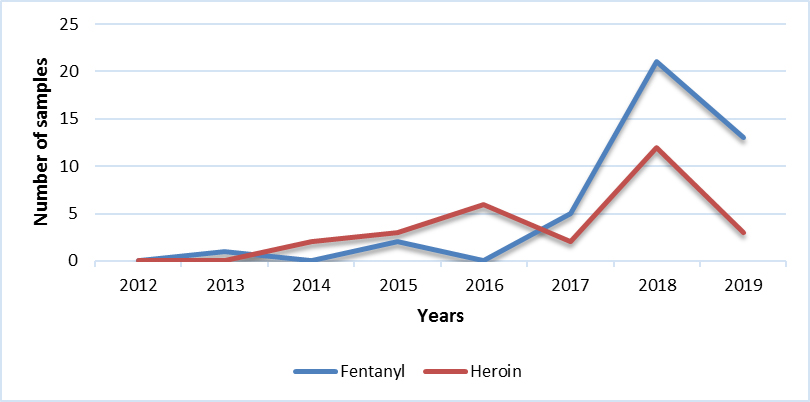
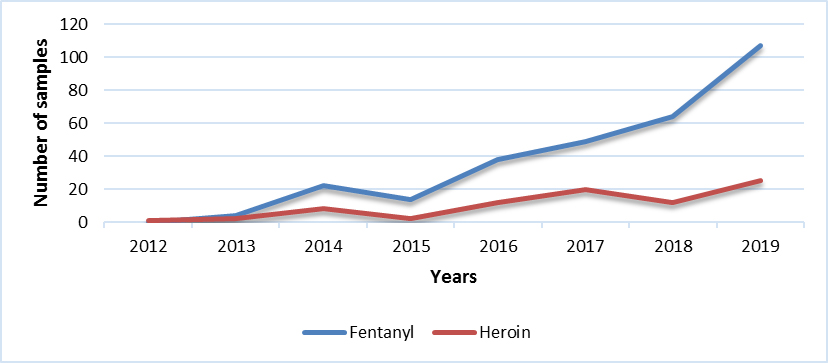
SK
SK / Fentanyl & Heroin
SK / Fentanyl & Heroin - Table
|
2012 |
2013 |
2014 |
2015 |
2016 |
2017 |
2018 |
2019 |
| Fentanyl |
0 |
4 |
22 |
14 |
38 |
49 |
64 |
107 |
| Heroin |
1 |
2 |
8 |
2 |
12 |
20 |
12 |
25 |
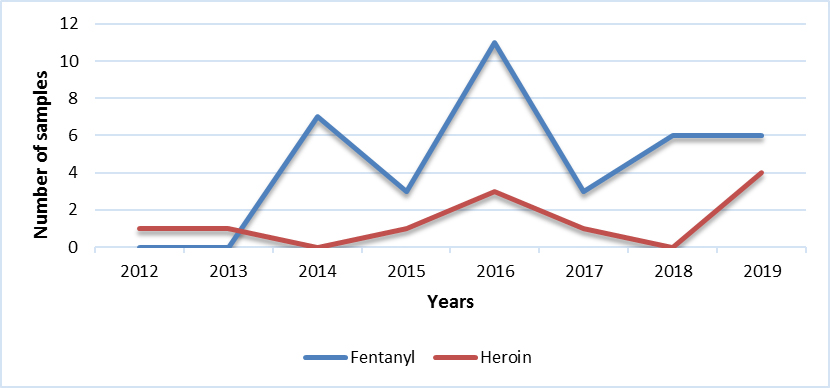
Territories
Territories / Fentanyl & Heroin
Territories / Fentanyl & Heroin - Table
|
2012 |
2013 |
2014 |
2015 |
2016 |
2017 |
2018 |
2019 |
| Fentanyl |
0 |
0 |
7 |
3 |
11 |
3 |
6 |
6 |
| Heroin |
1 |
1 |
0 |
1 |
3 |
1 |
0 |
4 |
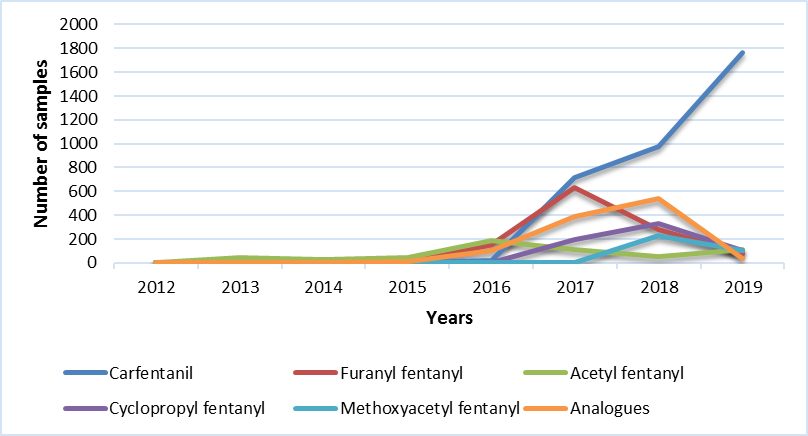
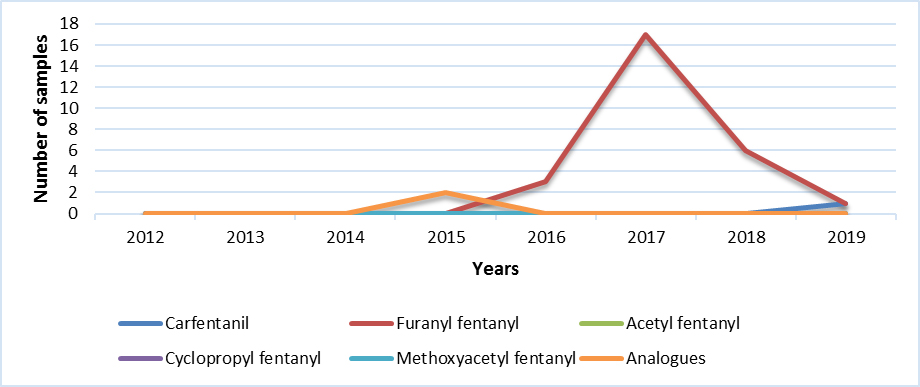
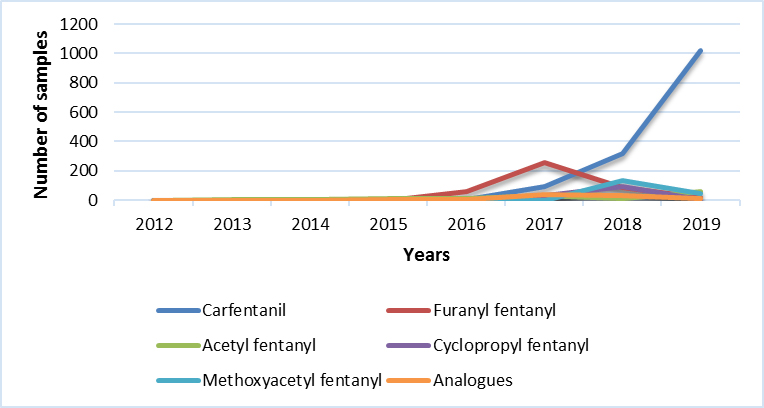
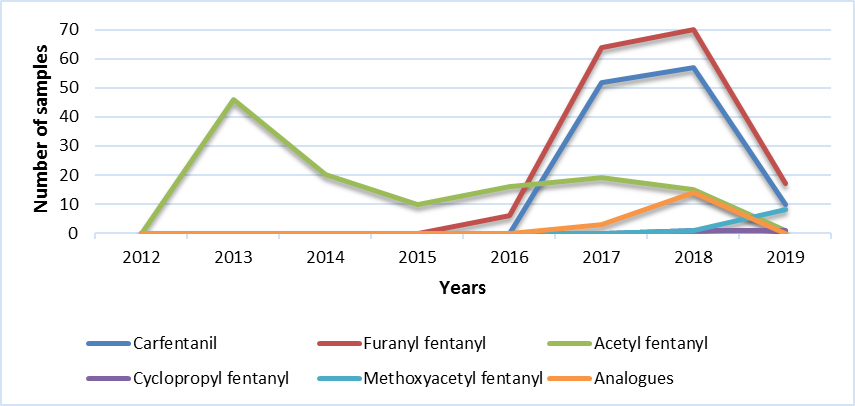
Main Fentanyl analogues identified in the analyzed samples
Canada
Canada / Main Fentanyl analogues
Canada / Main Fentanyl analogues - Table
|
2012 |
2013 |
2014 |
2015 |
2016 |
2017 |
2018 |
2019 |
| Carfentanil |
0 |
0 |
0 |
0 |
23 |
715 |
973 |
1762 |
| Furanyl Fentanyl |
0 |
0 |
0 |
0 |
154 |
628 |
277 |
77 |
| Acetyl Fentanyl |
0 |
48 |
27 |
45 |
186 |
115 |
51 |
111 |
| Cyclopropyl Fentanyl |
0 |
0 |
0 |
0 |
0 |
198 |
328 |
106 |
| Methoxyacetyl Fentanyl |
0 |
0 |
0 |
0 |
0 |
|
227 |
104 |
| Analogues |
0 |
0 |
0 |
15 |
100 |
385 |
537 |
40 |
AB
AB / Main Fentanyl analogues
AB / Main Fentanyl analogues - Table
|
2012 |
2013 |
2014 |
2015 |
2016 |
2017 |
2018 |
2019 |
| Carfentanil |
0 |
0 |
0 |
0 |
3 |
165 |
364 |
207 |
| Furanyl Fentanyl |
0 |
0 |
0 |
0 |
15 |
81 |
30 |
7 |
| Acetyl Fentanyl |
0 |
0 |
0 |
5 |
36 |
11 |
4 |
12 |
| Cyclopropyl Fentanyl |
0 |
0 |
0 |
0 |
0 |
16 |
21 |
13 |
| Methoxyacetyl Fentanyl |
0 |
0 |
0 |
0 |
0 |
0 |
54 |
32 |
| Analogues |
0 |
0 |
0 |
1 |
26 |
31 |
170 |
2 |
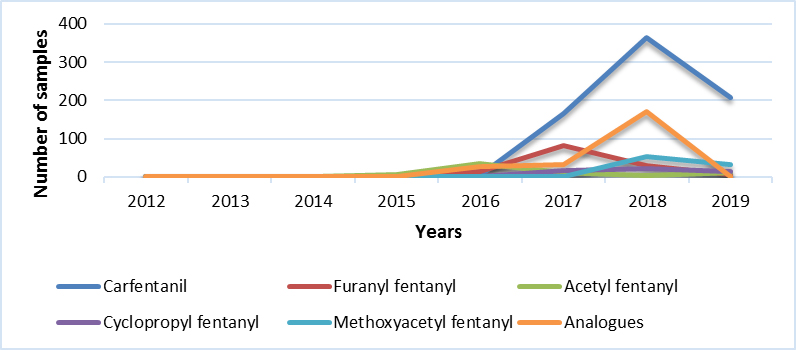
BC
BC / Main Fentanyl analogues
BC / Main Fentanyl analogues - Table
|
2012 |
2013 |
2014 |
2015 |
2016 |
2017 |
2018 |
2019 |
| Carfentanil |
0 |
0 |
0 |
0 |
8 |
360 |
214 |
467 |
| Furanyl Fentanyl |
0 |
0 |
0 |
0 |
52 |
173 |
64 |
32 |
| Acetyl Fentanyl |
0 |
0 |
0 |
11 |
124 |
50 |
21 |
39 |
| Cyclopropyl Fentanyl |
0 |
0 |
0 |
0 |
0 |
151 |
194 |
77 |
| Methoxyacetyl Fentanyl |
0 |
0 |
0 |
0 |
0 |
0 |
34 |
18 |
| Analogues |
0 |
0 |
0 |
11 |
67 |
42 |
307 |
25 |
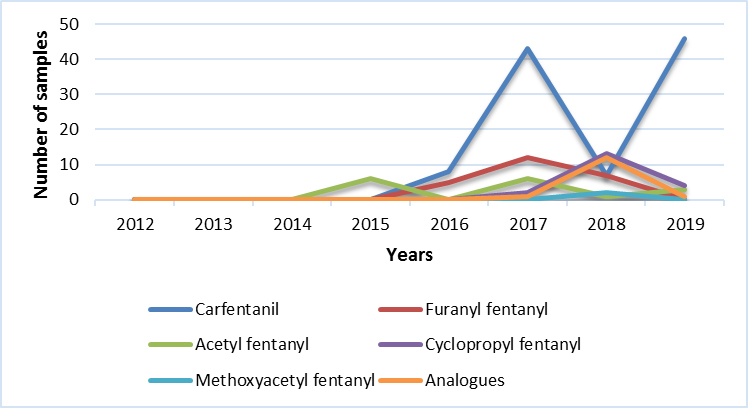
MB
MB / Main Fentanyl analogues
MB / Main Fentanyl analogues - Table
|
2012 |
2013 |
2014 |
2015 |
2016 |
2017 |
2018 |
2019 |
| Carfentanil |
0 |
0 |
0 |
0 |
8 |
43 |
7 |
46 |
| Furanyl Fentanyl |
0 |
0 |
0 |
0 |
5 |
12 |
7 |
0 |
| Acetyl Fentanyl |
0 |
0 |
0 |
6 |
0 |
6 |
1 |
3 |
| Cyclopropyl Fentanyl |
0 |
0 |
0 |
0 |
0 |
2 |
13 |
4 |
| Methoxyacetyl Fentanyl |
0 |
0 |
0 |
0 |
0 |
0 |
2 |
0 |
| Analogues |
0 |
0 |
0 |
0 |
0 |
1 |
12 |
1 |
NB
NB / Main Fentanyl analogues
NB / Main Fentanyl analogues - Table
|
2012 |
2013 |
2014 |
2015 |
2016 |
2017 |
2018 |
2019 |
| Carfentanil |
0 |
0 |
0 |
0 |
0 |
0 |
0 |
1 |
| Furanyl Fentanyl |
0 |
0 |
0 |
0 |
3 |
17 |
6 |
1 |
| Acetyl Fentanyl |
0 |
0 |
0 |
0 |
0 |
0 |
0 |
0 |
| Cyclopropyl Fentanyl |
0 |
0 |
0 |
0 |
0 |
0 |
0 |
0 |
| Methoxyacetyl Fentanyl |
0 |
0 |
0 |
0 |
0 |
0 |
0 |
0 |
| Analogues |
0 |
0 |
0 |
2 |
0 |
0 |
0 |
0 |
NFL
NFL / Main Fentanyl analogues
NFL / Main Fentanyl analogues - Table
|
2012 |
2013 |
2014 |
2015 |
2016 |
2017 |
2018 |
2019 |
| Carfentanil |
0 |
0 |
0 |
0 |
0 |
0 |
0 |
0 |
| Furanyl Fentanyl |
0 |
0 |
0 |
0 |
0 |
0 |
0 |
0 |
| Acetyl Fentanyl |
0 |
0 |
0 |
0 |
0 |
0 |
0 |
0 |
| Cyclopropyl Fentanyl |
0 |
0 |
0 |
0 |
0 |
0 |
0 |
0 |
| Methoxyacetyl Fentanyl |
0 |
0 |
0 |
0 |
0 |
0 |
0 |
0 |
| Analogues |
0 |
0 |
0 |
0 |
0 |
0 |
0 |
0 |
NS
NS / Main Fentanyl analogues

NS / Main Fentanyl analogues - Table
|
2012 |
2013 |
2014 |
2015 |
2016 |
2017 |
2018 |
2019 |
| Carfentanil |
0 |
0 |
0 |
0 |
0 |
0 |
0 |
1 |
| Furanyl Fentanyl |
0 |
0 |
0 |
0 |
11 |
20 |
4 |
0 |
| Acetyl Fentanyl |
0 |
0 |
0 |
2 |
0 |
0 |
0 |
0 |
| Cyclopropyl Fentanyl |
0 |
0 |
0 |
0 |
0 |
0 |
0 |
0 |
| Methoxyacetyl Fentanyl |
0 |
0 |
0 |
0 |
0 |
0 |
0 |
0 |
| Analogues |
0 |
0 |
0 |
0 |
0 |
0 |
0 |
0 |
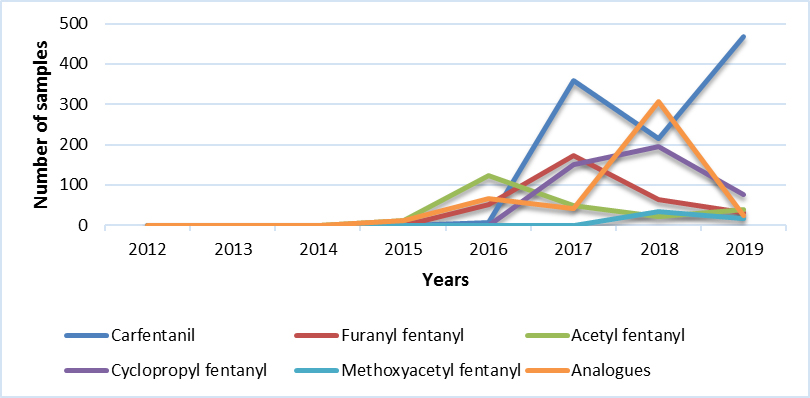
ON
ON / Main Fentanyl analogues
ON / Main Fentanyl analogues - Table
|
2012 |
2013 |
2014 |
2015 |
2016 |
2017 |
2018 |
2019 |
| Carfentanil |
0 |
0 |
0 |
0 |
4 |
90 |
321 |
1019 |
| Furanyl Fentanyl |
0 |
0 |
0 |
0 |
57 |
259 |
88 |
18 |
| Acetyl Fentanyl |
0 |
2 |
7 |
10 |
10 |
28 |
10 |
56 |
| Cyclopropyl Fentanyl |
0 |
0 |
0 |
0 |
0 |
28 |
95 |
6 |
| Methoxyacetyl Fentanyl |
0 |
0 |
0 |
0 |
0 |
0 |
133 |
44 |
| Analogues |
0 |
0 |
0 |
1 |
7 |
40 |
33 |
12 |
PEI
PEI / Main Fentanyl analogues
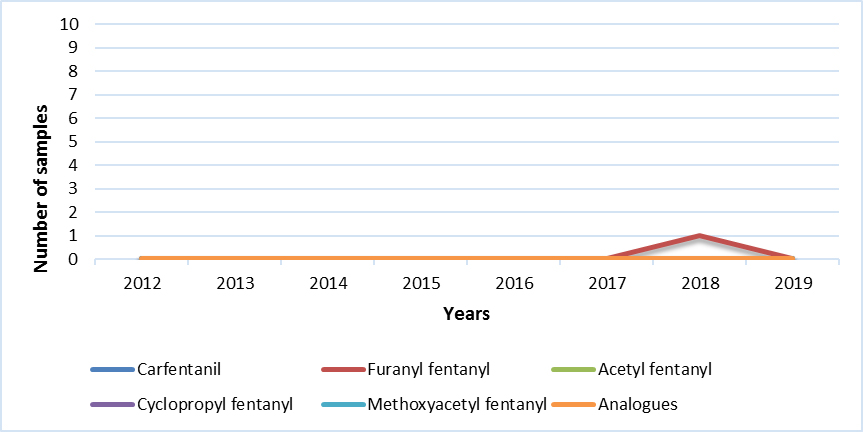
PEI / Main Fentanyl analogues - Table
|
2012 |
2013 |
2014 |
2015 |
2016 |
2017 |
2018 |
2019 |
| Carfentanil |
0 |
0 |
0 |
0 |
0 |
0 |
0 |
0 |
| Furanyl Fentanyl |
0 |
0 |
0 |
0 |
0 |
0 |
1 |
0 |
| Acetyl Fentanyl |
0 |
0 |
0 |
0 |
0 |
0 |
0 |
0 |
| Cyclopropyl Fentanyl |
0 |
0 |
0 |
0 |
0 |
0 |
0 |
0 |
| Methoxyacetyl Fentanyl |
0 |
0 |
0 |
0 |
0 |
0 |
0 |
0 |
| Analogues |
0 |
0 |
0 |
0 |
0 |
0 |
0 |
0 |
QC
QC / Main Fentanyl analogues
QC / Main Fentanyl analogues - Table
|
2012 |
2013 |
2014 |
2015 |
2016 |
2017 |
2018 |
2019 |
| Carfentanil |
0 |
0 |
0 |
0 |
0 |
52 |
57 |
10 |
| Furanyl Fentanyl |
0 |
0 |
0 |
0 |
6 |
64 |
70 |
17 |
| Acetyl Fentanyl |
0 |
46 |
20 |
10 |
16 |
19 |
15 |
1 |
| Cyclopropyl Fentanyl |
0 |
0 |
0 |
0 |
0 |
0 |
1 |
1 |
| Methoxyacetyl Fentanyl |
0 |
0 |
0 |
0 |
0 |
0 |
1 |
8 |
| Analogues |
0 |
0 |
0 |
0 |
0 |
3 |
14 |
0 |
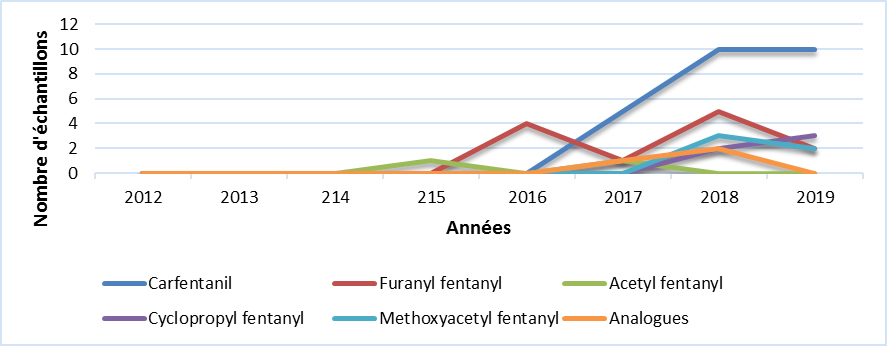
SK
SK / Main Fentanyl analogues
SK / Main Fentanyl analogues - Table
|
2012 |
2013 |
214 |
215 |
2016 |
2017 |
2018 |
2019 |
| Carfentanil |
0 |
0 |
0 |
0 |
0 |
5 |
10 |
10 |
| Furanyl Fentanyl |
0 |
0 |
0 |
0 |
4 |
1 |
5 |
2 |
| Acetyl Fentanyl |
0 |
0 |
0 |
1 |
0 |
1 |
0 |
0 |
| Cyclopropyl Fentanyl |
0 |
0 |
0 |
0 |
0 |
0 |
2 |
3 |
| Methoxyacetyl Fentanyl |
0 |
0 |
0 |
0 |
0 |
0 |
3 |
2 |
| Analogues |
0 |
0 |
0 |
0 |
0 |
1 |
2 |
0 |
Territories
Territories / Main Fentanyl analogues

Territories / Main Fentanyl analogues - Table
|
2012 |
2013 |
2014 |
2015 |
2016 |
2017 |
2018 |
2019 |
| Carfentanil |
0 |
0 |
0 |
0 |
0 |
0 |
0 |
1 |
| Furanyl Fentanyl |
0 |
0 |
0 |
0 |
1 |
1 |
2 |
0 |
| Acetyl Fentanyl |
0 |
0 |
0 |
0 |
0 |
0 |
0 |
0 |
| Cyclopropyl Fentanyl |
0 |
0 |
0 |
0 |
0 |
0 |
2 |
2 |
| Methoxyacetyl Fentanyl |
0 |
0 |
0 |
0 |
0 |
0 |
0 |
0 |
| Analogues |
0 |
0 |
0 |
0 |
0 |
0 |
0 |
0 |
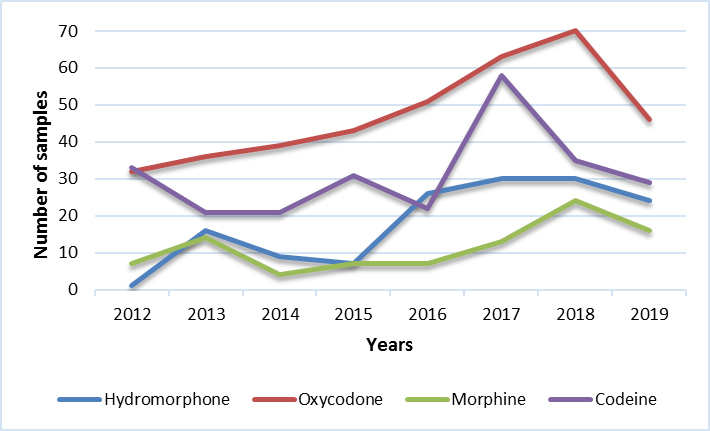
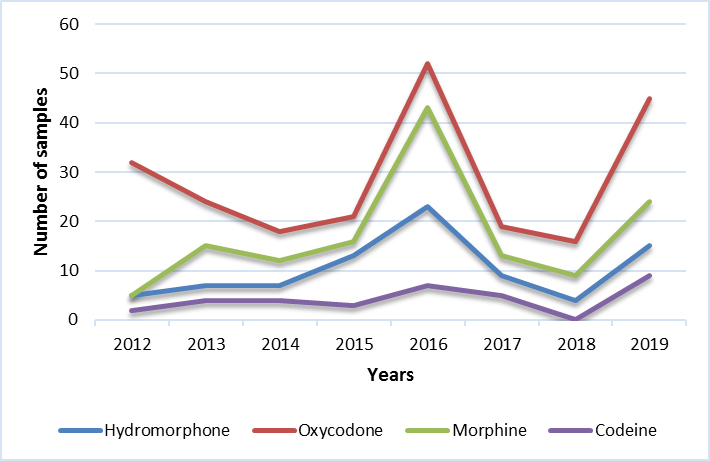
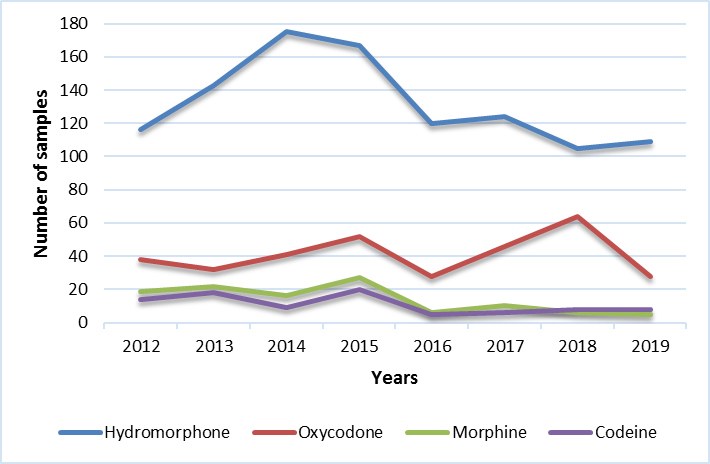
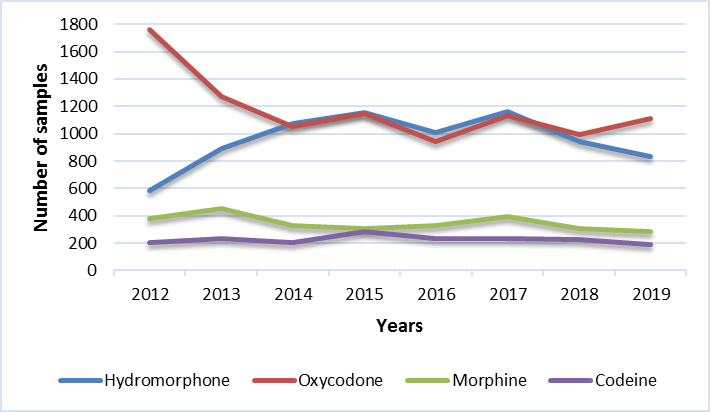
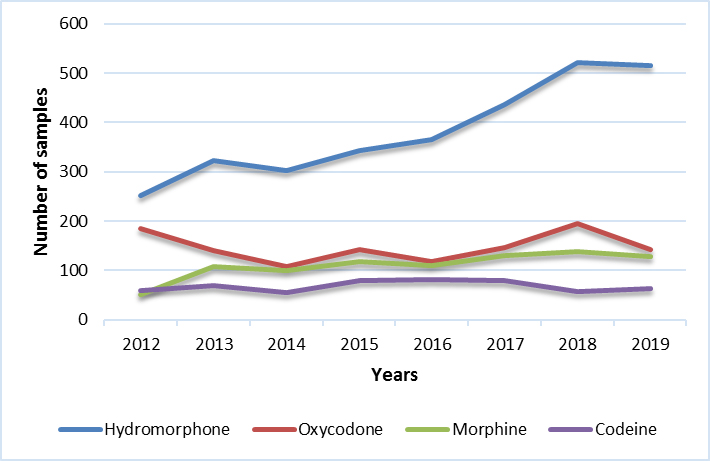
Other common opioids identified in the samples analyzed
Canada
Canada / Other common opioids
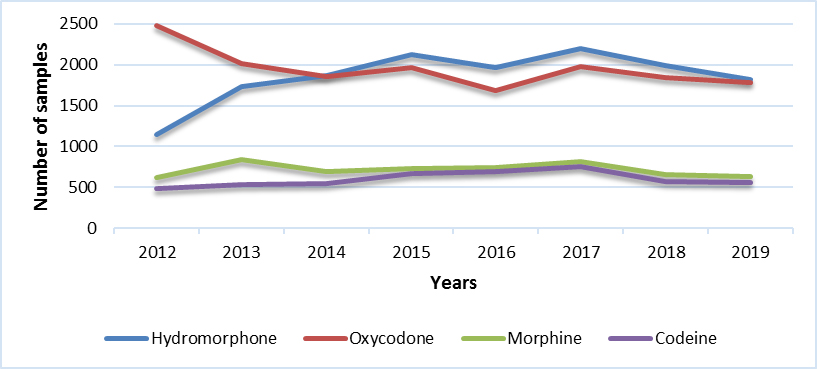
Canada / Other common opioids - Table
|
2012 |
2013 |
2014 |
2015 |
2016 |
2017 |
2018 |
2019 |
| Hydromorphone |
1148 |
1731 |
1872 |
2121 |
1972 |
2201 |
1991 |
1817 |
| Oxycodone |
2477 |
2020 |
1857 |
1969 |
1690 |
1983 |
1842 |
1782 |
| Morphine |
620 |
837 |
693 |
731 |
739 |
811 |
657 |
632 |
| Codeine |
481 |
528 |
540 |
670 |
696 |
757 |
568 |
563 |
AB
AB / Other common opioids
AB / Other common opioids - Table
|
2012 |
2013 |
2014 |
2015 |
2016 |
2017 |
2018 |
2019 |
| Hydromorphone |
44 |
74 |
118 |
167 |
199 |
219 |
130 |
84 |
| Oxycodone |
185 |
208 |
323 |
293 |
292 |
337 |
292 |
253 |
| Morphine |
55 |
84 |
118 |
121 |
146 |
129 |
84 |
69 |
| Codeine |
66 |
91 |
140 |
158 |
209 |
273 |
158 |
183 |
BC
BC / Other common opioids

BC / Other common opioids - Table
|
2012 |
2013 |
2014 |
2015 |
2016 |
2017 |
2018 |
2019 |
| Hydromorphone |
59 |
79 |
40 |
55 |
39 |
74 |
52 |
39 |
| Oxycodone |
158 |
230 |
192 |
196 |
144 |
173 |
134 |
104 |
| Morphine |
73 |
124 |
101 |
115 |
77 |
87 |
62 |
80 |
| Codeine |
83 |
76 |
76 |
75 |
100 |
74 |
50 |
51 |
MB
MB / Other common opioids
MB / Other common opioids - Table
|
2012 |
2013 |
2014 |
2015 |
2016 |
2017 |
2018 |
2019 |
| Hydromorphone |
1 |
16 |
9 |
7 |
26 |
30 |
30 |
24 |
| Oxycodone |
32 |
36 |
39 |
43 |
51 |
63 |
70 |
46 |
| Morphine |
7 |
14 |
4 |
7 |
7 |
13 |
24 |
16 |
| Codeine |
33 |
21 |
21 |
31 |
22 |
58 |
35 |
29 |
NB
NB / Other common opioids

NB / Other common opioids - Table
|
2012 |
2013 |
2014 |
2015 |
2016 |
2017 |
2018 |
2019 |
| Hydromorphone |
36 |
95 |
49 |
115 |
54 |
75 |
128 |
81 |
| Oxycodone |
72 |
71 |
73 |
56 |
43 |
49 |
67 |
36 |
| Morphine |
10 |
6 |
5 |
9 |
3 |
16 |
15 |
10 |
| Codeine |
7 |
10 |
8 |
13 |
6 |
20 |
16 |
12 |
NFL
NFL / Other common opioids
NFL / Other common opioids - Table
|
2012 |
2013 |
2014 |
2015 |
2016 |
2017 |
2018 |
2019 |
| Hydromorphone |
5 |
7 |
7 |
13 |
23 |
9 |
4 |
15 |
| Oxycodone |
32 |
24 |
18 |
21 |
52 |
19 |
16 |
45 |
| Morphine |
5 |
15 |
12 |
16 |
43 |
13 |
9 |
24 |
| Codeine |
2 |
4 |
4 |
3 |
7 |
5 |
0 |
9 |
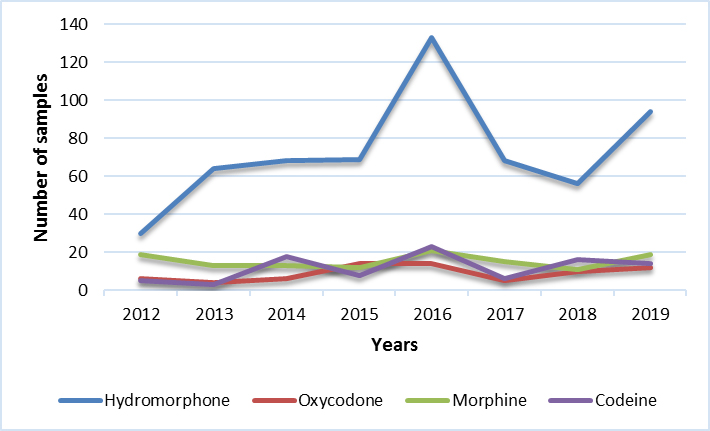
NS
NS / Other common opioids
NS / Other common opioids - Table
|
2012 |
2013 |
2014 |
2015 |
2016 |
2017 |
2018 |
2019 |
| Hydromorphone |
116 |
143 |
175 |
167 |
120 |
124 |
105 |
109 |
| Oxycodone |
38 |
32 |
41 |
52 |
28 |
46 |
64 |
28 |
| Morphine |
19 |
22 |
16 |
27 |
6 |
10 |
6 |
5 |
| Codeine |
14 |
18 |
9 |
20 |
5 |
6 |
8 |
8 |
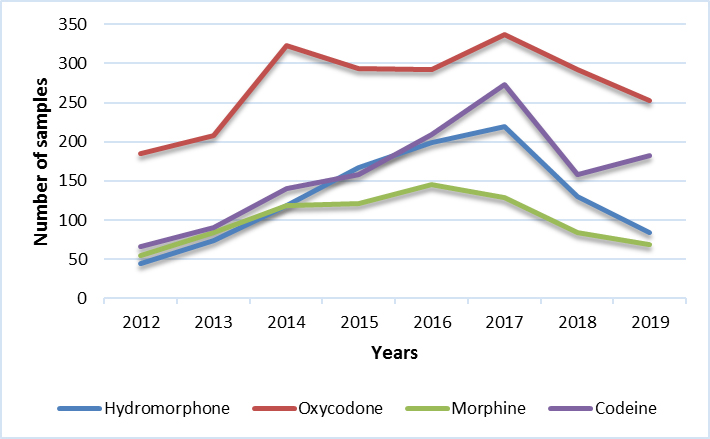
ON
ON / Other common opioids
ON / Other common opioids - Table
|
2012 |
2013 |
2014 |
2015 |
2016 |
2017 |
2018 |
2019 |
| Hydromorphone |
584 |
891 |
1071 |
1152 |
1010 |
1160 |
942 |
836 |
| Oxycodone |
1759 |
1268 |
1053 |
1147 |
943 |
1134 |
992 |
1107 |
| Morphine |
377 |
450 |
330 |
306 |
326 |
395 |
304 |
281 |
| Codeine |
206 |
230 |
204 |
282 |
236 |
232 |
228 |
190 |
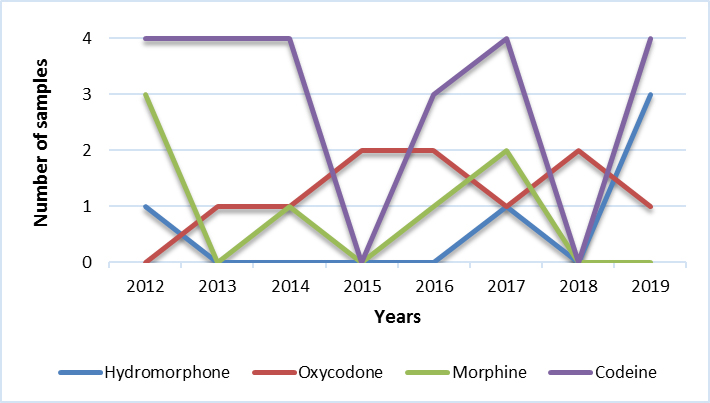
PEI
PEI / Other common opioids

PEI / Other common opioids - Table
|
2012 |
2013 |
2014 |
2015 |
2016 |
2017 |
2018 |
2019 |
| Hydromorphone |
21 |
39 |
33 |
33 |
2 |
5 |
22 |
16 |
| Oxycodone |
11 |
6 |
3 |
3 |
3 |
9 |
0 |
8 |
| Morphine |
0 |
1 |
0 |
0 |
0 |
0 |
3 |
0 |
| Codeine |
1 |
1 |
0 |
0 |
3 |
0 |
0 |
0 |
QC
QC / Other common opioids
QC / Other common opioids - Table
|
2012 |
2013 |
2014 |
2015 |
2016 |
2017 |
2018 |
2019 |
| Hydromorphone |
251 |
323 |
302 |
343 |
366 |
436 |
522 |
516 |
| Oxycodone |
184 |
140 |
108 |
142 |
118 |
147 |
195 |
142 |
| Morphine |
52 |
108 |
100 |
118 |
109 |
131 |
139 |
128 |
| Codeine |
60 |
70 |
56 |
80 |
82 |
79 |
57 |
63 |
SK
SK / Other common opioids
SK / Other common opioids - Table
|
2012 |
2013 |
2014 |
2015 |
2016 |
2017 |
2018 |
2019 |
| Hydromorphone |
30 |
64 |
68 |
69 |
133 |
68 |
56 |
94 |
| Oxycodone |
6 |
4 |
6 |
14 |
14 |
5 |
10 |
12 |
| Morphine |
19 |
13 |
13 |
12 |
21 |
15 |
11 |
19 |
| Codeine |
5 |
3 |
18 |
8 |
23 |
6 |
16 |
14 |
Territories
Territories / Other common opioids
Territories / Other common opioids - Table
|
2012 |
2013 |
2014 |
2015 |
2016 |
2017 |
2018 |
2019 |
| Hydromorphone |
1 |
0 |
0 |
0 |
0 |
1 |
0 |
3 |
| Oxycodone |
0 |
1 |
1 |
2 |
2 |
1 |
2 |
1 |
| Morphine |
3 |
0 |
1 |
0 |
1 |
2 |
0 |
0 |
| Codeine |
4 |
4 |
4 |
0 |
3 |
4 |
0 |
4 |
