
Drug Analysis Service: Trends 2012-2020
Notice to the reader:
This is an archived page. Please refer to the most current version.
Find detailed information about the drug samples submitted by law enforcement agencies and analyzed by the Drug Analysis Service.
On this page
Number of samples received
Canada
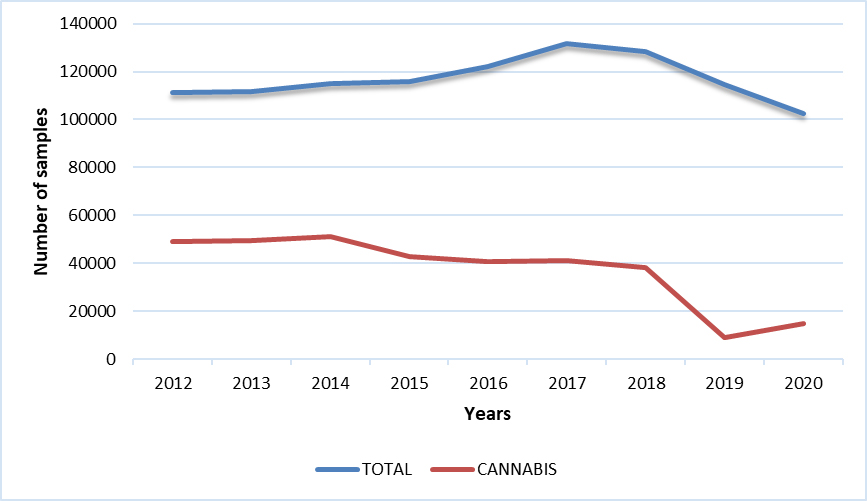
Canada / Samples received - Table
| 2012 | 2013 | 2014 | 2015 | 2016 | 2017 | 2018 | 2019 | 2020 | |
|---|---|---|---|---|---|---|---|---|---|
| Total | 111283 | 111802 | 114972 | 115679 | 122134 | 131823 | 128270 | 114395 | 102410 |
| Cannabis | 49190 | 49579 | 51099 | 42717 | 40829 | 41240 | 38487 | 8942 | 14968 |
AB
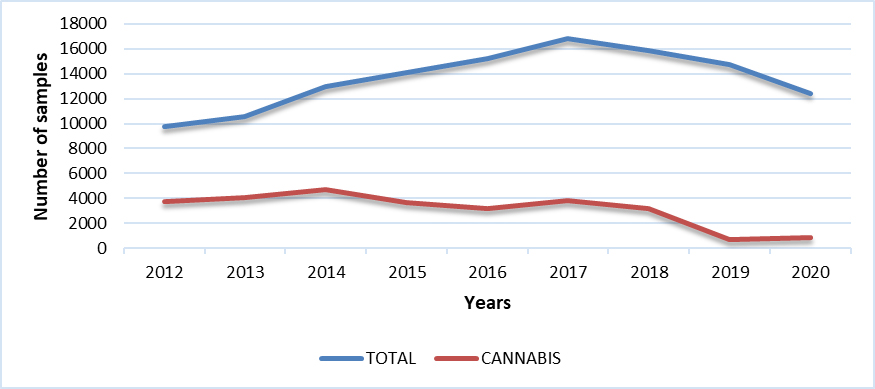
AB / Samples received - Table
| 2012 | 2013 | 2014 | 2015 | 2016 | 2017 | 2018 | 2019 | 2020 | |
|---|---|---|---|---|---|---|---|---|---|
| Total | 9761 | 10593 | 12992 | 14096 | 15218 | 16798 | 15872 | 14714 | 12412 |
| Cannabis | 3722 | 4069 | 4684 | 3632 | 3210 | 3812 | 3222 | 715 | 818 |
BC
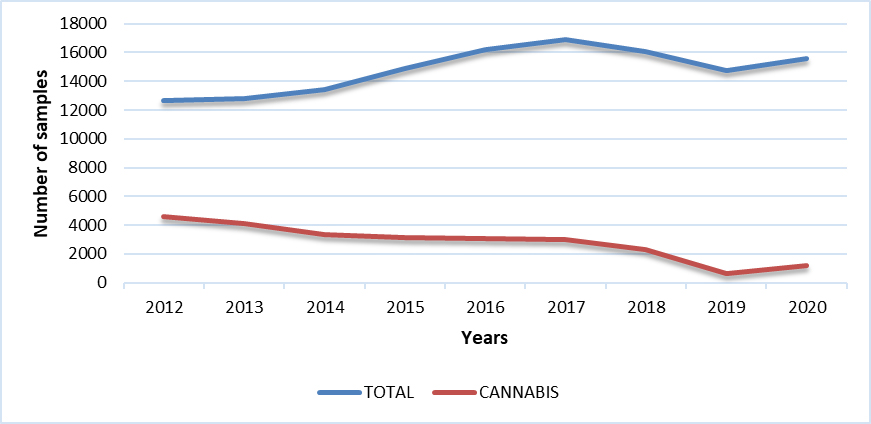
BC / Samples received - Table
| 2012 | 2013 | 2014 | 2015 | 2016 | 2017 | 2018 | 2019 | 2020 | |
|---|---|---|---|---|---|---|---|---|---|
| Total | 12661 | 12821 | 13446 | 14883 | 16225 | 16880 | 16055 | 14766 | 15584 |
| Cannabis | 4604 | 4143 | 3321 | 3144 | 3050 | 3029 | 2296 | 604 | 1201 |
MB
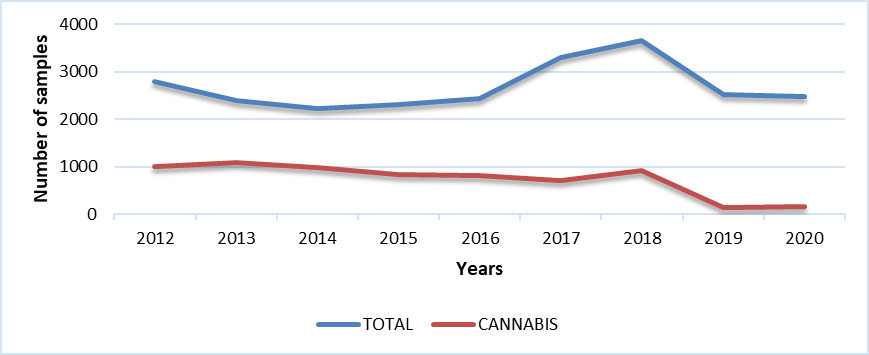
MB / Samples received - Table
| 2012 | 2013 | 2014 | 2015 | 2016 | 2017 | 2018 | 2019 | 2020 | |
|---|---|---|---|---|---|---|---|---|---|
| Total | 2784 | 2384 | 2232 | 2302 | 2439 | 3308 | 3652 | 2515 | 2477 |
| Cannabis | 1007 | 1088 | 989 | 838 | 813 | 716 | 910 | 129 | 152 |
NB
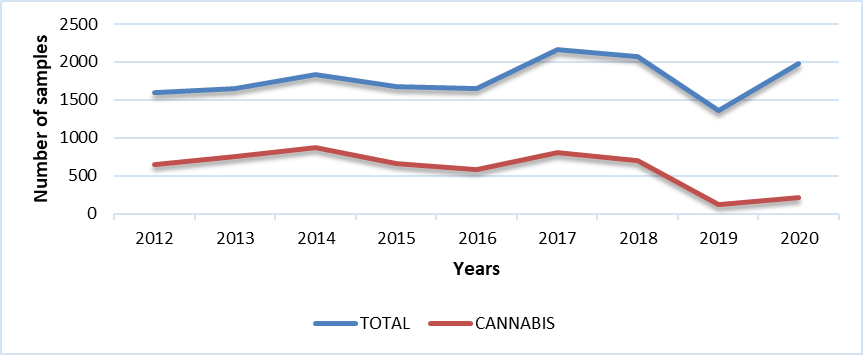
NB / Samples received - Table
| 2012 | 2013 | 2014 | 2015 | 2016 | 2017 | 2018 | 2019 | 2020 | |
|---|---|---|---|---|---|---|---|---|---|
| Total | 1599 | 1646 | 1828 | 1672 | 1652 | 2163 | 2072 | 1354 | 1981 |
| Cannabis | 642 | 755 | 868 | 657 | 583 | 800 | 695 | 121 | 209 |
NFL
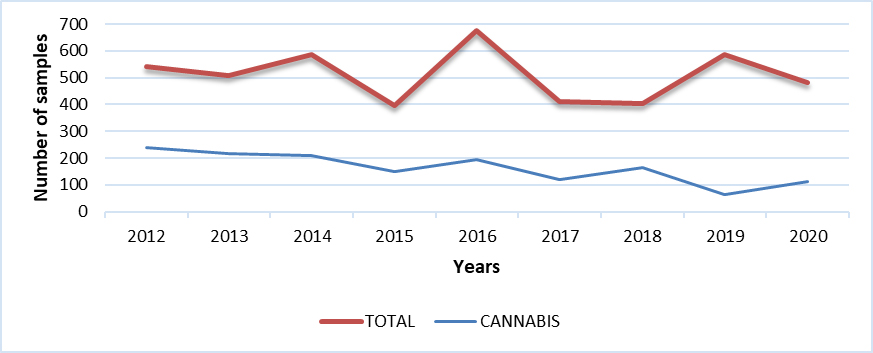
NFL / Samples received - Table
| 2012 | 2013 | 2014 | 2015 | 2016 | 2017 | 2018 | 2019 | 2020 | |
|---|---|---|---|---|---|---|---|---|---|
| Total | 543 | 508 | 588 | 398 | 676 | 412 | 403 | 587 | 482 |
| Cannabis | 239 | 218 | 209 | 148 | 194 | 119 | 163 | 62 | 113 |
NS
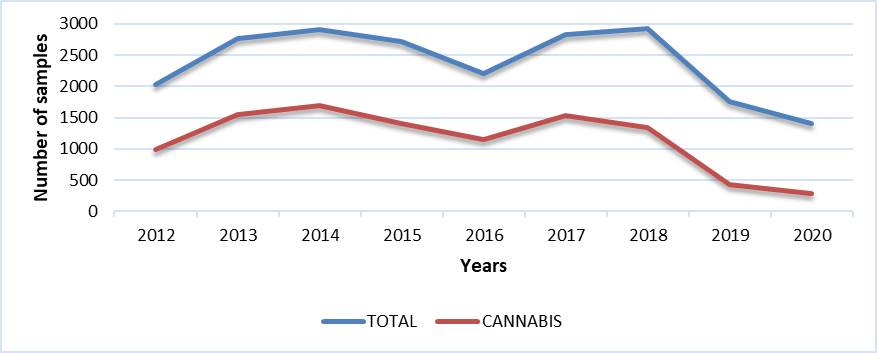
NS / Samples received - Table
| 2012 | 2013 | 2014 | 2015 | 2016 | 2017 | 2018 | 2019 | 2020 | |
|---|---|---|---|---|---|---|---|---|---|
| Total | 2032 | 2770 | 2905 | 2719 | 2204 | 2826 | 2925 | 1758 | 1408 |
| Cannabis | 992 | 1555 | 1693 | 1408 | 1144 | 1531 | 1341 | 289 | 431 |
ON
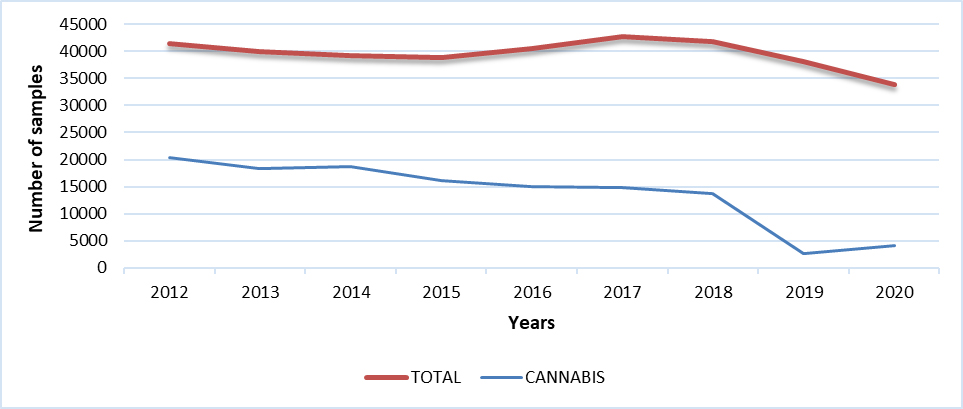
ON / Samples received - Table
| 2012 | 2013 | 2014 | 2015 | 2016 | 2017 | 2018 | 2019 | 2020 | |
|---|---|---|---|---|---|---|---|---|---|
| Total | 41412 | 39896 | 39299 | 38823 | 40527 | 42695 | 41816 | 38205 | 33830 |
| Cannabis | 20424 | 18400 | 18688 | 16043 | 15060 | 14874 | 13775 | 2670 | 4192 |
PEI
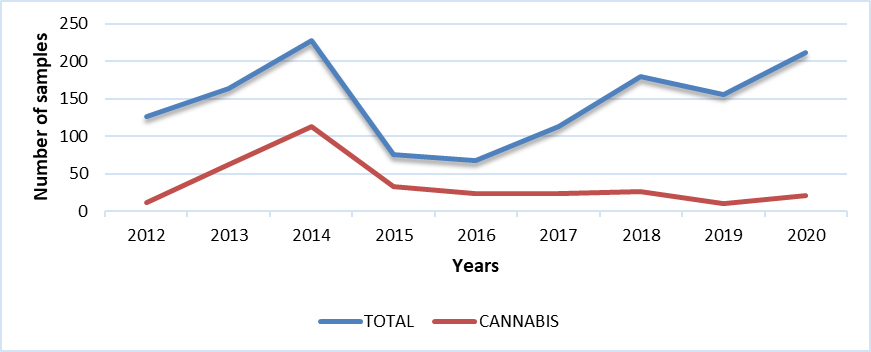
PEI / Samples received - Table
| 2012 | 2013 | 2014 | 2015 | 2016 | 2017 | 2018 | 2019 | 2020 | |
|---|---|---|---|---|---|---|---|---|---|
| Total | 126 | 163 | 227 | 75 | 68 | 113 | 179 | 155 | 212 |
| Cannabis | 12 | 62 | 113 | 33 | 23 | 24 | 26 | 10 | 21 |
QC
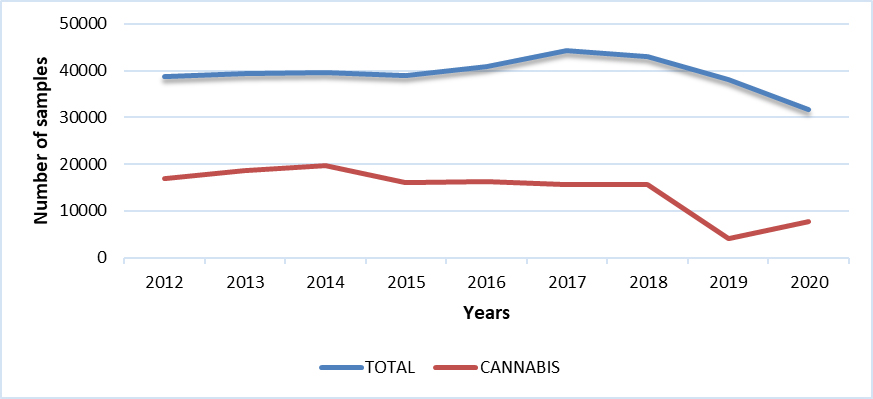
QC / Samples received - Table
| 2012 | 2013 | 2014 | 2015 | 2016 | 2017 | 2018 | 2019 | 2020 | |
|---|---|---|---|---|---|---|---|---|---|
| Total | 38713 | 39285 | 39489 | 39044 | 40954 | 44245 | 43012 | 38189 | 31771 |
| Cannabis | 16827 | 18549 | 19619 | 16146 | 16221 | 15740 | 15560 | 4095 | 7691 |
SK
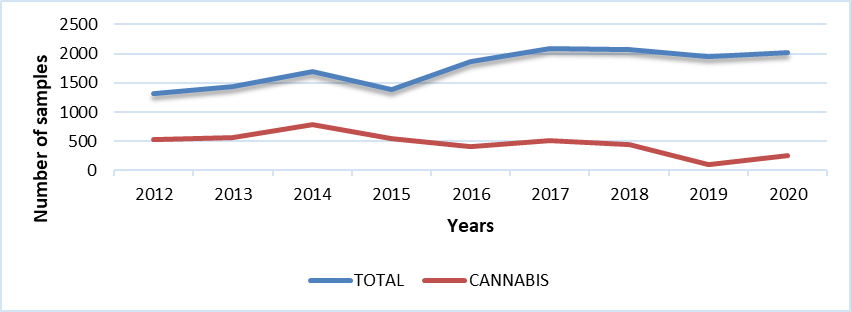
SK / Samples received - Table
| 2012 | 2013 | 2014 | 2015 | 2016 | 2017 | 2018 | 2019 | 2020 | |
|---|---|---|---|---|---|---|---|---|---|
| Total | 1319 | 1430 | 1688 | 1380 | 1866 | 2079 | 2064 | 1947 | 2022 |
| Cannabis | 530 | 561 | 779 | 542 | 405 | 515 | 443 | 96 | 251 |
Territories
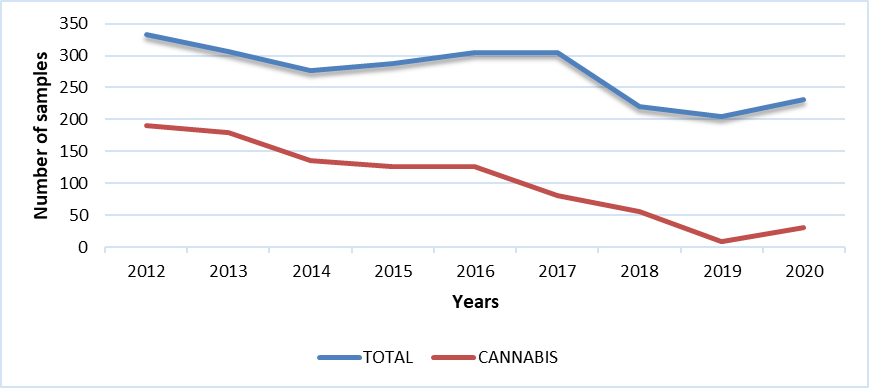
Territories / Samples received - Table
| 2012 | 2013 | 2014 | 2015 | 2016 | 2017 | 2018 | 2019 | 2020 | |
|---|---|---|---|---|---|---|---|---|---|
| Total | 333 | 306 | 277 | 287 | 305 | 304 | 220 | 205 | 231 |
| Cannabis | 191 | 179 | 136 | 126 | 126 | 80 | 56 | 8 | 31 |
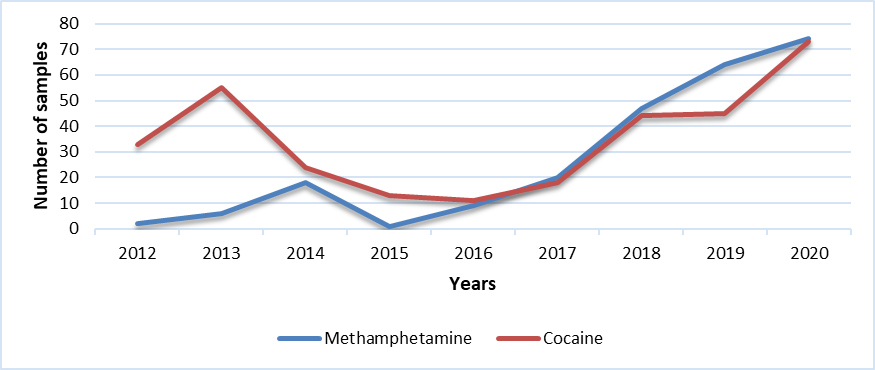
Cocaine & Methamphetamine identified in samples analyzed
Canada
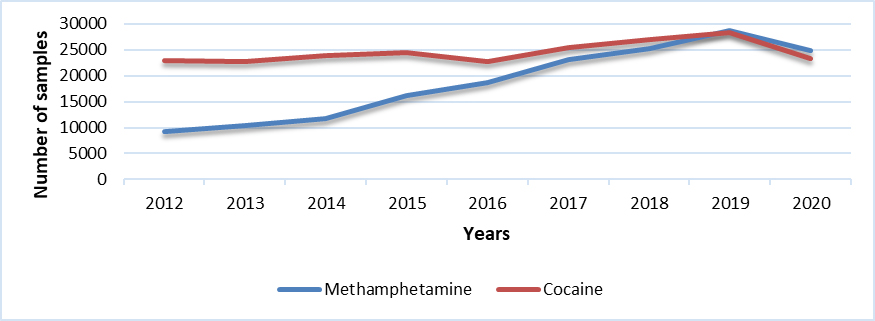
Canada / Cocaine & Methamphetamine - Table
| 2012 | 2013 | 2014 | 2015 | 2016 | 2017 | 2018 | 2019 | 2020 | |
|---|---|---|---|---|---|---|---|---|---|
| Methamphetamine | 9175 | 10493 | 11729 | 16229 | 18611 | 23152 | 25314 | 28646 | 24850 |
| Cocaine | 22883 | 22690 | 23956 | 24403 | 22727 | 25403 | 26944 | 28277 | 23231 |
AB
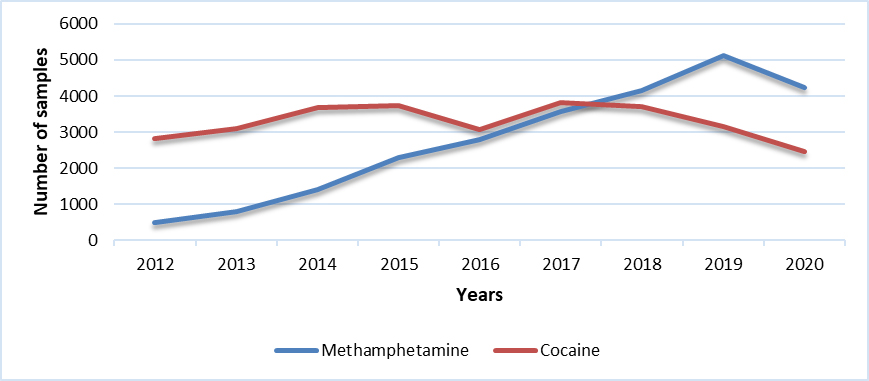
AB / Cocaine & Methamphetamine - Table
| 2012 | 2013 | 2014 | 2015 | 2016 | 2017 | 2018 | 2019 | 2020 | |
|---|---|---|---|---|---|---|---|---|---|
| Methamphetamine | 487 | 786 | 1392 | 2279 | 2801 | 3572 | 4146 | 5120 | 4236 |
| Cocaine | 2809 | 3103 | 3684 | 3721 | 3064 | 3821 | 3716 | 3159 | 2465 |
BC
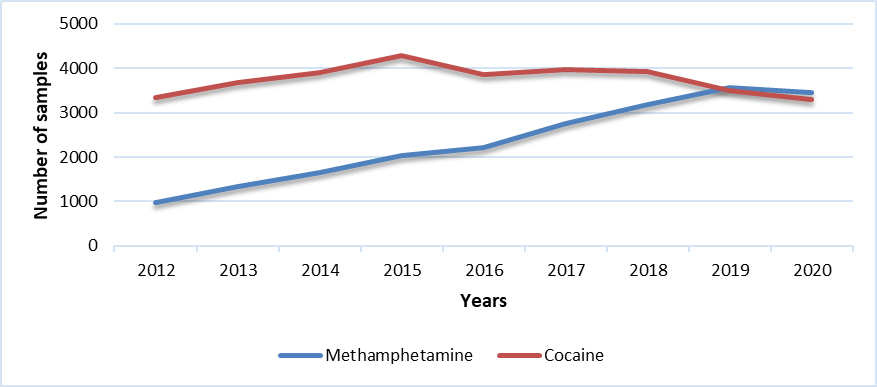
BC / Cocaine & Methamphetamine - Table
| 2012 | 2013 | 2014 | 2015 | 2016 | 2017 | 2018 | 2019 | 2020 | |
|---|---|---|---|---|---|---|---|---|---|
| Methamphetamine | 975 | 1330 | 1654 | 2027 | 2216 | 2749 | 3177 | 3565 | 3454 |
| Cocaine | 3351 | 3678 | 3912 | 4292 | 3850 | 3975 | 3932 | 3498 | 3307 |
MB
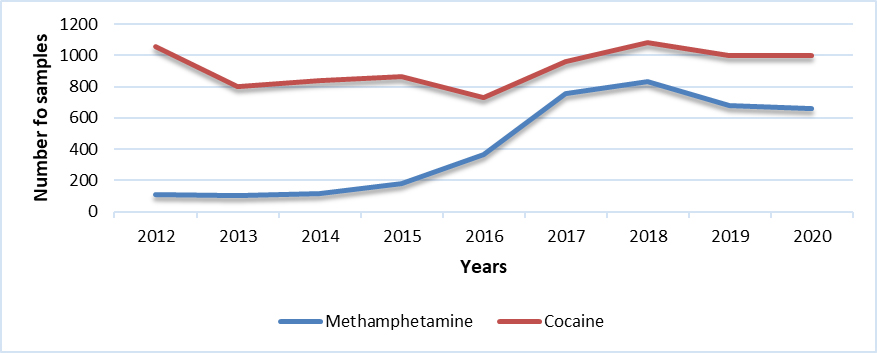
MB / Cocaine & Methamphetamine - Table
| 2012 | 2013 | 2014 | 2015 | 2016 | 2017 | 2018 | 2019 | 2020 | |
|---|---|---|---|---|---|---|---|---|---|
| Methamphetamine | 107 | 103 | 113 | 181 | 364 | 755 | 834 | 682 | 657 |
| Cocaine | 1058 | 804 | 842 | 863 | 733 | 960 | 1084 | 1000 | 997 |
NB
NB / Cocaine & Methamphetamine - Table
| 2012 | 2013 | 2014 | 2015 | 2016 | 2017 | 2018 | 2019 | 2020 | |
|---|---|---|---|---|---|---|---|---|---|
| Methamphetamine | 213 | 194 | 129 | 227 | 231 | 368 | 468 | 445 | 663 |
| Cocaine | 257 | 187 | 251 | 214 | 305 | 247 | 201 | 215 | 297 |
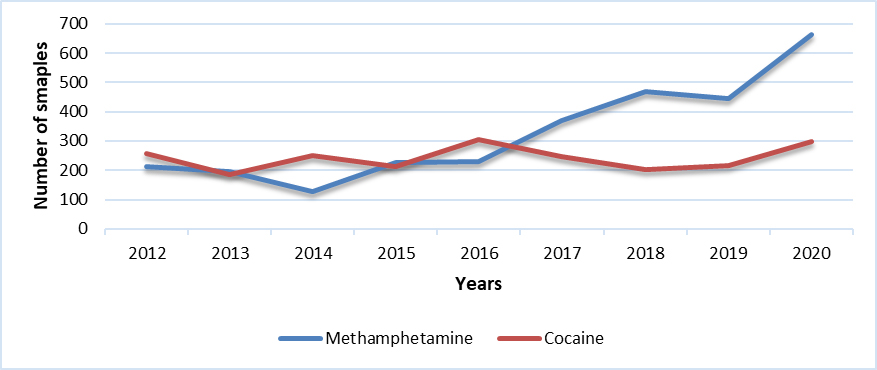
NFL
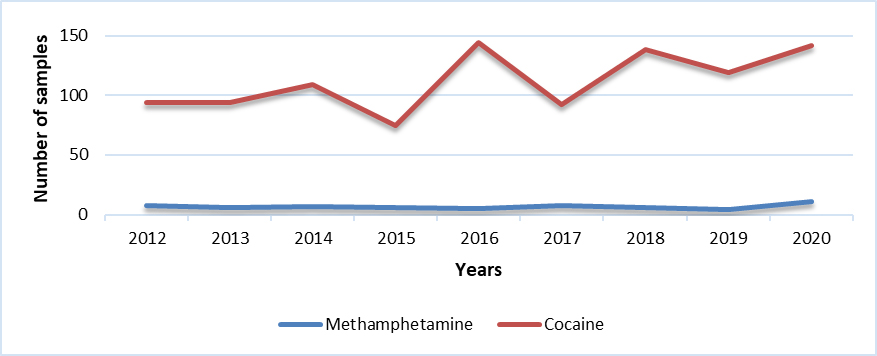
NFL / Cocaine & Methamphetamine - Table
| 2012 | 2013 | 2014 | 2015 | 2016 | 2017 | 2018 | 2019 | 2020 | |
|---|---|---|---|---|---|---|---|---|---|
| Methamphetamine | 8 | 6 | 7 | 6 | 5 | 8 | 6 | 4 | 11 |
| Cocaine | 94 | 94 | 109 | 75 | 144 | 92 | 138 | 119 | 142 |
NS
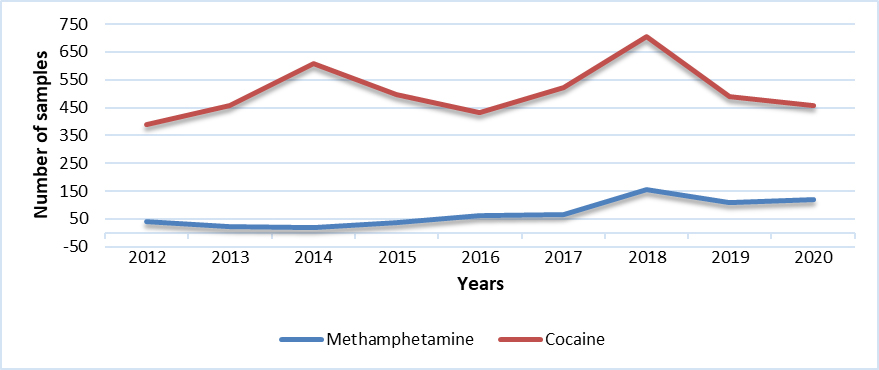
NS / Cocaine & Methamphetamine - Table
| 2012 | 2013 | 2014 | 2015 | 2016 | 2017 | 2018 | 2019 | 2020 | |
|---|---|---|---|---|---|---|---|---|---|
| Methamphetamine | 39 | 22 | 20 | 37 | 63 | 67 | 157 | 110 | 118 |
| Cocaine | 388 | 457 | 610 | 498 | 434 | 523 | 704 | 491 | 459 |
ON
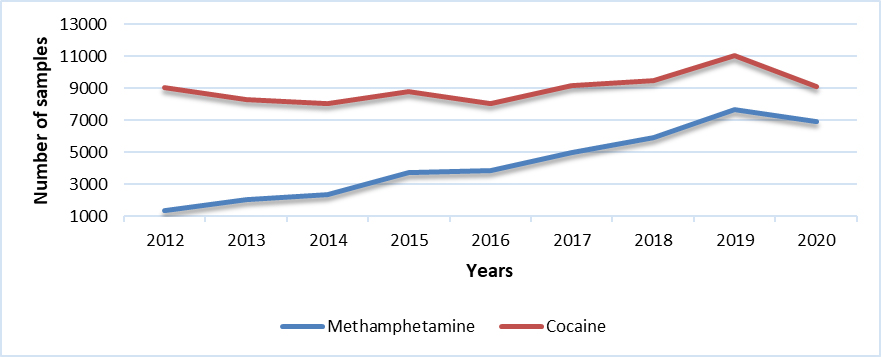
ON / Cocaine & Methamphetamine - Table
| 2012 | 2013 | 2014 | 2015 | 2016 | 2017 | 2018 | 2019 | 2020 | |
|---|---|---|---|---|---|---|---|---|---|
| Methamphetamine | 1370 | 2036 | 2314 | 3741 | 3830 | 4950 | 5918 | 7634 | 6883 |
| Cocaine | 9013 | 8275 | 8062 | 8802 | 8039 | 9145 | 9481 | 11051 | 9074 |
PEI
PEI / Cocaine & Methamphetamine - Table
| 2012 | 2013 | 2014 | 2015 | 2016 | 2017 | 2018 | 2019 | 2020 | |
|---|---|---|---|---|---|---|---|---|---|
| Methamphetamine | 2 | 6 | 18 | 1 | 9 | 20 | 47 | 64 | 74 |
| Cocaine | 33 | 55 | 24 | 13 | 11 | 18 | 44 | 45 | 73 |
QC
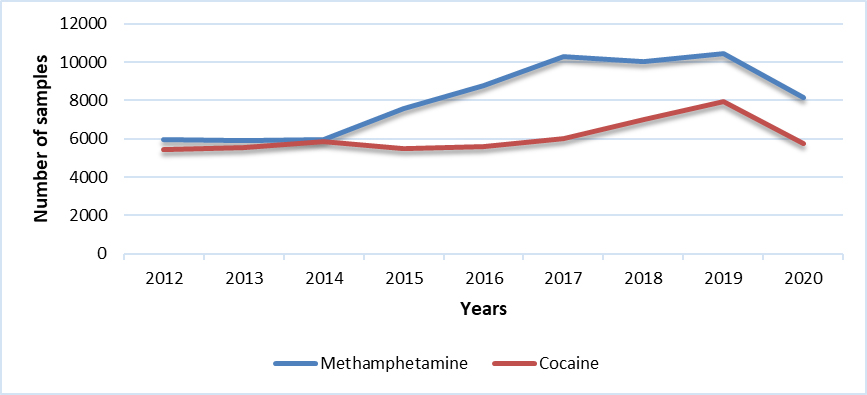
QC / Cocaine & Methamphetamine - Table
| 2012 | 2013 | 2014 | 2015 | 2016 | 2017 | 2018 | 2019 | 2020 | |
|---|---|---|---|---|---|---|---|---|---|
| Methamphetamine | 5948 | 5916 | 5940 | 7567 | 8790 | 10281 | 10046 | 10441 | 8148 |
| Cocaine | 5421 | 5539 | 5873 | 5492 | 5586 | 6006 | 7004 | 7950 | 5730 |
SK

SK / Cocaine & Methamphetamine - Table
| 2012 | 2013 | 2014 | 2015 | 2016 | 2017 | 2018 | 2019 | 2019 | |
|---|---|---|---|---|---|---|---|---|---|
| Methamphetamine | 25 | 94 | 141 | 159 | 296 | 379 | 495 | 580 | 605 |
| Cocaine | 379 | 388 | 489 | 335 | 446 | 505 | 505 | 609 | 568 |
Territories

Territories / Cocaine & Methamphetamine - Table
| 2012 | 2013 | 2014 | 2015 | 2016 | 2017 | 2018 | 2019 | 2020 | |
|---|---|---|---|---|---|---|---|---|---|
| Methamphetamine | 1 | 0 | 1 | 4 | 6 | 3 | 2 | 1 | 1 |
| Cocaine | 80 | 110 | 100 | 98 | 115 | 111 | 135 | 140 | 119 |
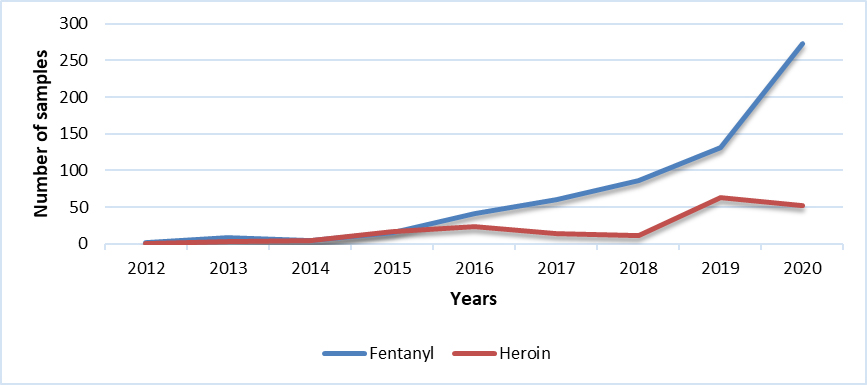
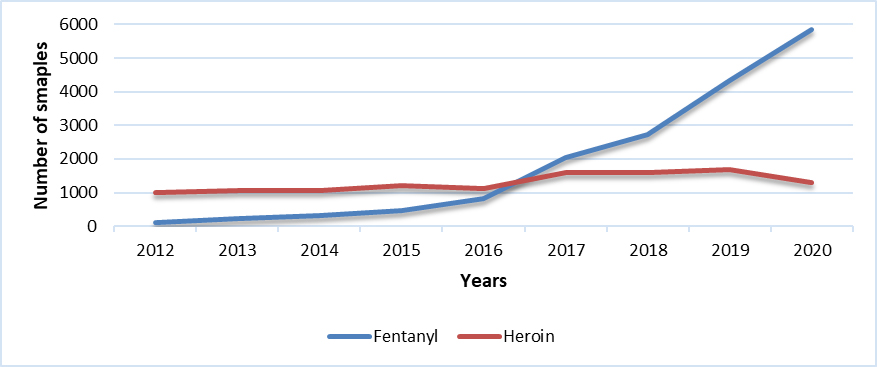
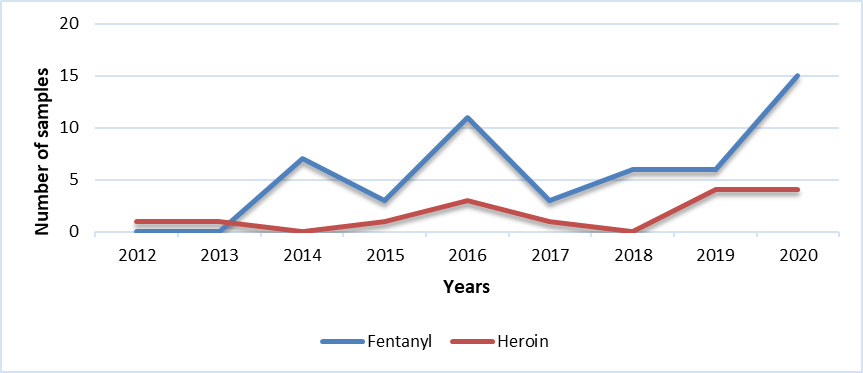
Fentanyl & Heroin identified in samples analyzed
Canada
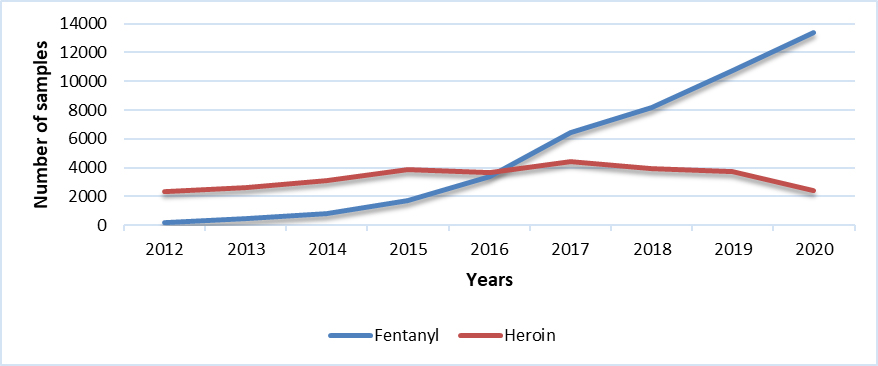
Canada / Fentanyl & Heroin - Table
| 2012 | 2013 | 2014 | 2015 | 2016 | 2017 | 2018 | 2019 | 2020 | |
|---|---|---|---|---|---|---|---|---|---|
| Fentanyl | 217 | 446 | 809 | 1711 | 3351 | 6438 | 8181 | 10722 | 13348 |
| Heroin | 2337 | 2609 | 3079 | 3883 | 3658 | 4442 | 3934 | 3752 | 2407 |
AB

AB / Fentanyl & Heroin - Table
| 2012 | 2013 | 2014 | 2015 | 2016 | 2017 | 2018 | 2019 | 2020 | |
|---|---|---|---|---|---|---|---|---|---|
| Fentanyl | 18 | 60 | 182 | 564 | 730 | 857 | 1167 | 1832 | 2048 |
| Heroin | 85 | 118 | 212 | 312 | 324 | 315 | 309 | 418 | 220 |
BC
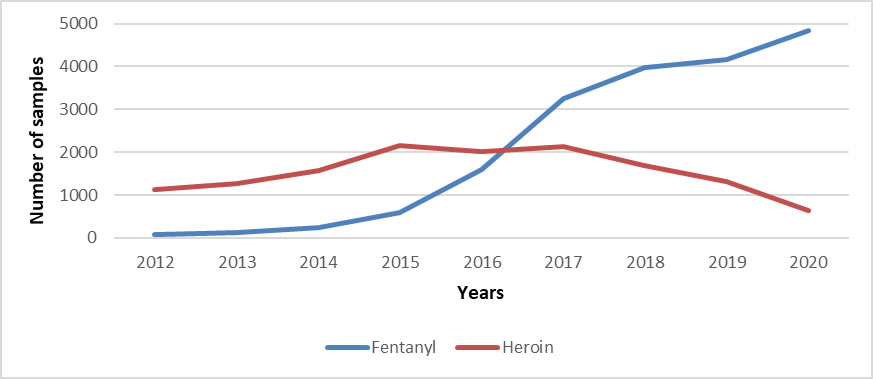
BC / Fentanyl & Heroin - Table
| 2012 | 2013 | 2014 | 2015 | 2016 | 2017 | 2018 | 2019 | 2020 | |
|---|---|---|---|---|---|---|---|---|---|
| Fentanyl | 77 | 124 | 242 | 601 | 1596 | 3262 | 3969 | 4173 | 4842 |
| Heroin | 1137 | 1275 | 1572 | 2152 | 2012 | 2141 | 1698 | 1322 | 643 |
MB
MB / Fentanyl & Heroin - Table
| 2012 | 2013 | 2014 | 2015 | 2016 | 2017 | 2018 | 2019 | 2020 | |
|---|---|---|---|---|---|---|---|---|---|
| Fentanyl | 2 | 8 | 5 | 15 | 41 | 60 | 86 | 131 | 273 |
| Heroin | 1 | 3 | 4 | 17 | 23 | 14 | 11 | 63 | 52 |
NB
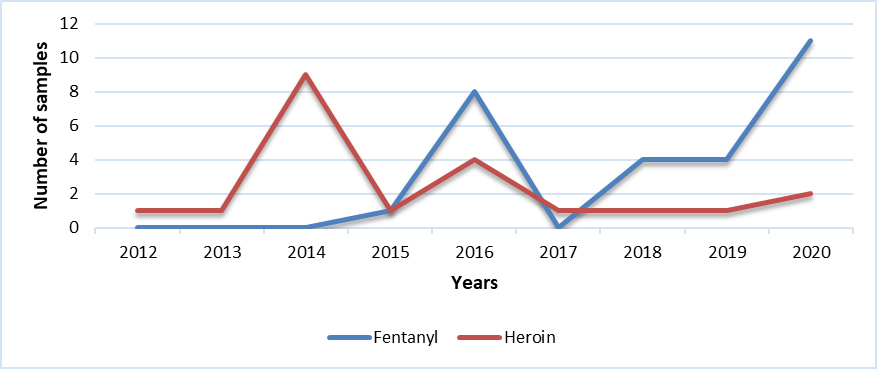
NB / Fentanyl & Heroin - Table
| 2012 | 2013 | 2014 | 2015 | 2016 | 2017 | 2018 | 2019 | 2020 | |
|---|---|---|---|---|---|---|---|---|---|
| Fentanyl | 0 | 0 | 0 | 1 | 8 | 0 | 4 | 4 | 11 |
| Heroin | 1 | 1 | 9 | 1 | 4 | 1 | 1 | 1 | 2 |
NFL
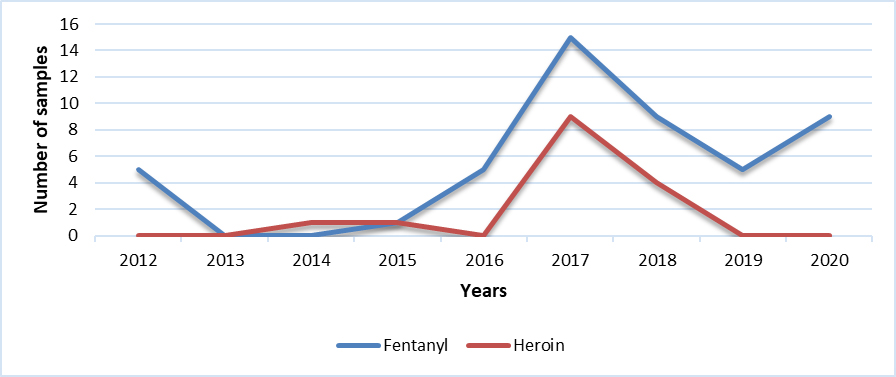
NFL / Fentanyl & Heroin - Table
| 2012 | 2013 | 2014 | 2015 | 2016 | 2017 | 2018 | 2019 | 2020 | |
|---|---|---|---|---|---|---|---|---|---|
| Fentanyl | 5 | 0 | 0 | 1 | 5 | 15 | 9 | 5 | 9 |
| Heroin | 0 | 0 | 1 | 1 | 0 | 9 | 4 | 0 | 0 |
NS
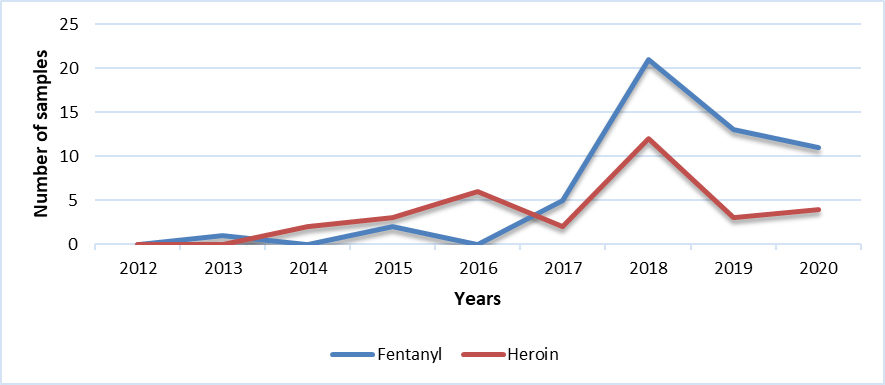
NS / Fentanyl & Heroin - Table
| 2012 | 2013 | 2014 | 2015 | 2016 | 2017 | 2018 | 2019 | 2020 | |
|---|---|---|---|---|---|---|---|---|---|
| Fentanyl | 0 | 1 | 0 | 2 | 0 | 5 | 21 | 13 | 11 |
| Heroin | 0 | 0 | 2 | 3 | 6 | 2 | 12 | 3 | 4 |
ON
ON / Fentanyl & Heroin - Table
| 2012 | 2013 | 2014 | 2015 | 2016 | 2017 | 2018 | 2019 | 2020 | |
|---|---|---|---|---|---|---|---|---|---|
| Fentanyl | 106 | 235 | 325 | 465 | 809 | 2052 | 2729 | 4329 | 5854 |
| Heroin | 986 | 1064 | 1069 | 1214 | 1118 | 1598 | 1593 | 1692 | 1298 |
PEI
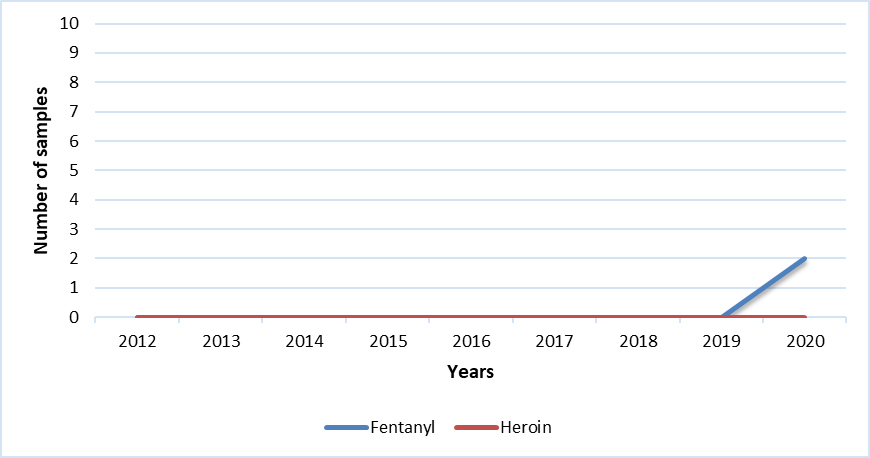
PEI / Fentanyl & Heroin - Table
| 2012 | 2013 | 2014 | 2015 | 2016 | 2017 | 2018 | 2019 | 2020 | |
|---|---|---|---|---|---|---|---|---|---|
| Fentanyl | 0 | 0 | 0 | 0 | 0 | 0 | 0 | 0 | 2 |
| Heroin | 0 | 0 | 0 | 0 | 0 | 0 | 0 | 0 | 0 |
QC
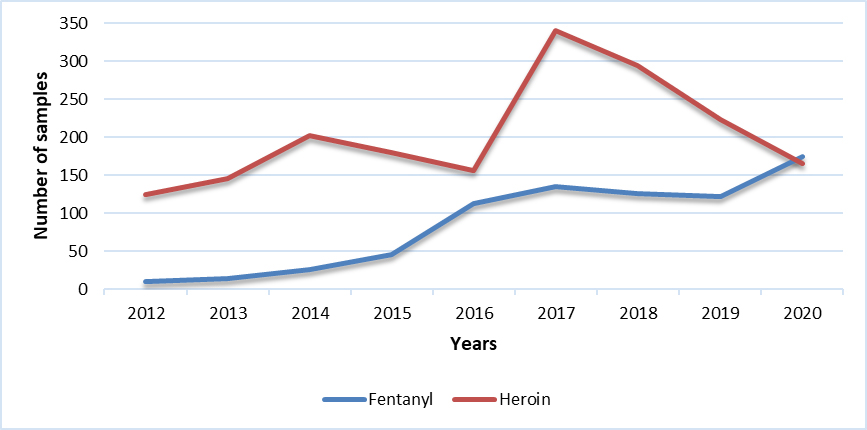
QC / Fentanyl & Heroin - Table
| 2012 | 2013 | 2014 | 2015 | 2016 | 2017 | 2018 | 2019 | 2020 | |
|---|---|---|---|---|---|---|---|---|---|
| Fentanyl | 10 | 14 | 26 | 45 | 113 | 135 | 126 | 122 | 175 |
| Heroin | 125 | 145 | 202 | 180 | 156 | 341 | 294 | 224 | 166 |
SK
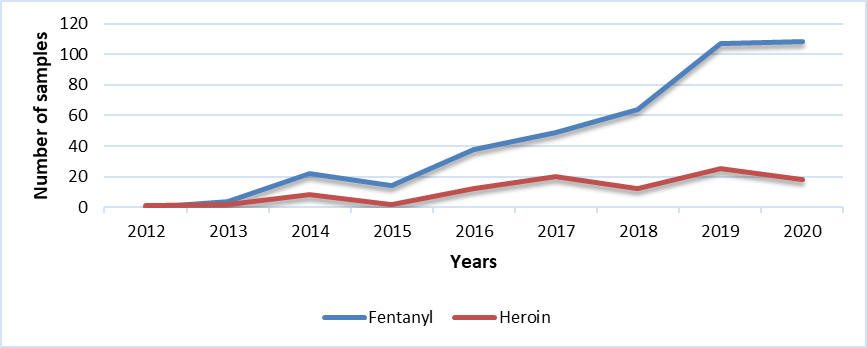
SK / Fentanyl & Heroin - Table
| 2012 | 2013 | 2014 | 2015 | 2016 | 2017 | 2018 | 2019 | 2020 | |
|---|---|---|---|---|---|---|---|---|---|
| Fentanyl | 0 | 4 | 22 | 14 | 38 | 49 | 64 | 107 | 108 |
| Heroin | 1 | 2 | 8 | 2 | 12 | 20 | 12 | 25 | 18 |
Territories
Territories / Fentanyl & Heroin - Table
| 2012 | 2013 | 2014 | 2015 | 2016 | 2017 | 2018 | 2019 | 2020 | |
|---|---|---|---|---|---|---|---|---|---|
| Fentanyl | 0 | 0 | 7 | 3 | 11 | 3 | 6 | 6 | 15 |
| Heroin | 1 | 1 | 0 | 1 | 3 | 1 | 0 | 4 | 4 |
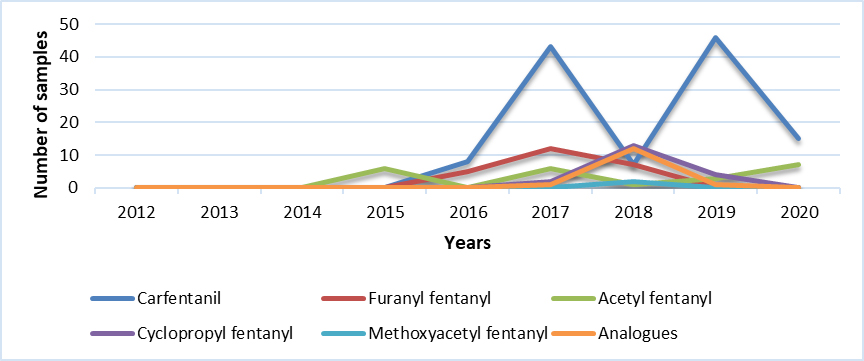
Main Fentanyl analogues identified in the analyzed samples
Canada
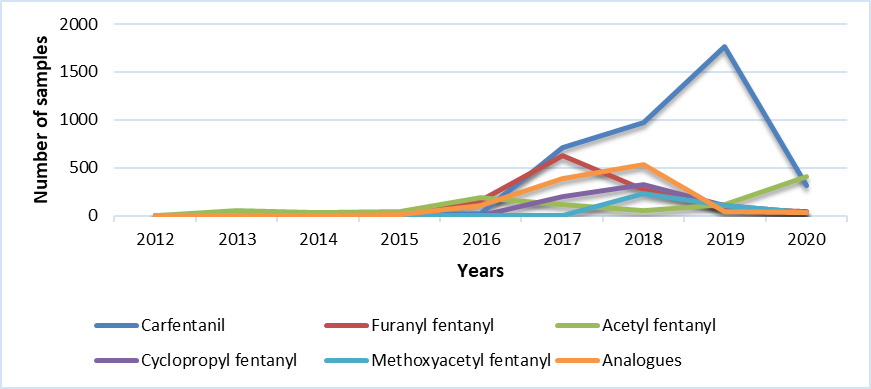
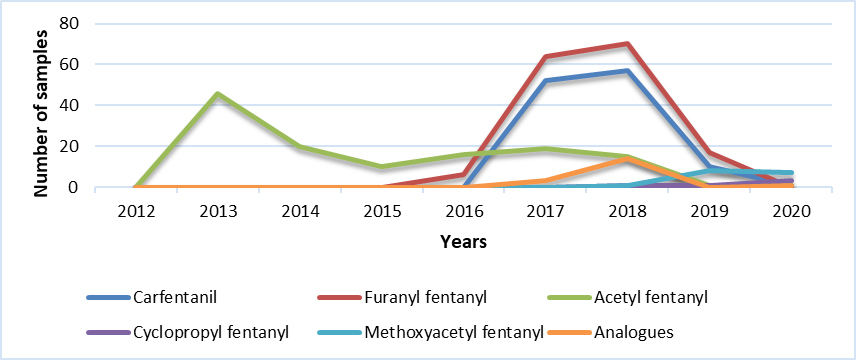
Canada / Main Fentanyl analogues - Table
| 2012 | 2013 | 2014 | 2015 | 2016 | 2017 | 2018 | 2019 | 2020 | |
|---|---|---|---|---|---|---|---|---|---|
| Carfentanil | 0 | 0 | 0 | 0 | 23 | 715 | 973 | 1762 | 312 |
| Furanyl fentanyl | 0 | 0 | 0 | 0 | 154 | 628 | 277 | 77 | 47 |
| Acetyl fentanyl | 0 | 48 | 27 | 45 | 186 | 115 | 51 | 111 | 404 |
| Cyclopropyl fentanyl | 0 | 0 | 0 | 0 | 0 | 198 | 328 | 106 | 35 |
| Methoxyacetyl fentanyl | 0 | 0 | 0 | 0 | 0 | 0 | 227 | 104 | 31 |
| Analogues | 0 | 0 | 0 | 15 | 100 | 385 | 537 | 40 | 30 |
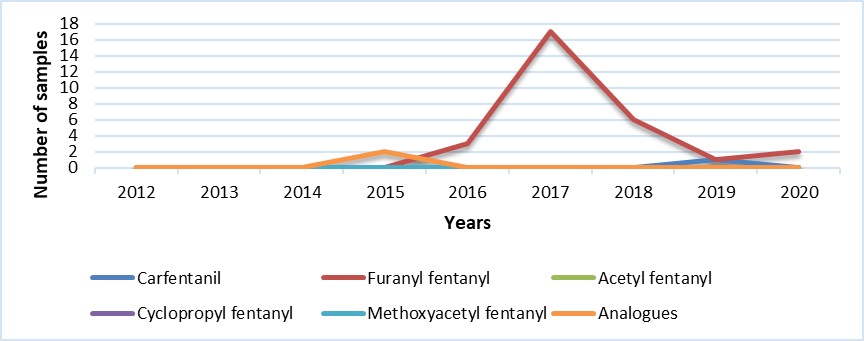
AB
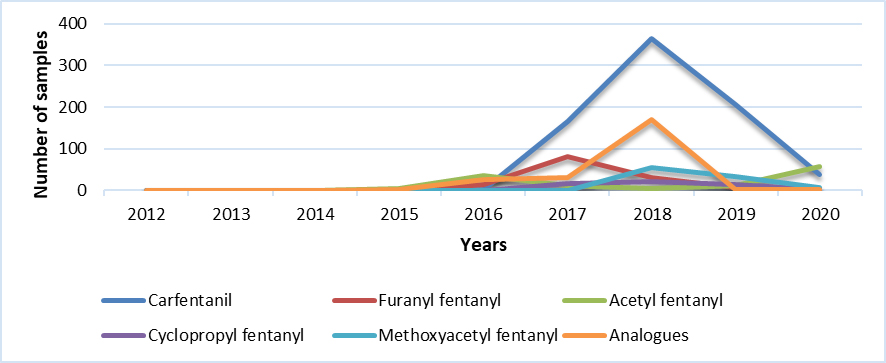
AB / Main Fentanyl analogues - Table
| 2012 | 2013 | 2014 | 2015 | 2016 | 2017 | 2018 | 2019 | 2020 | |
|---|---|---|---|---|---|---|---|---|---|
| Carfentanil | 0 | 0 | 0 | 0 | 3 | 165 | 364 | 207 | 38 |
| Furanyl fentanyl | 0 | 0 | 0 | 0 | 15 | 81 | 30 | 7 | 3 |
| Acetyl fentanyl | 0 | 0 | 0 | 5 | 36 | 11 | 4 | 12 | 56 |
| Cyclopropyl fentanyl | 0 | 0 | 0 | 0 | 0 | 16 | 21 | 13 | 3 |
| Methoxyacetyl fentanyl | 0 | 0 | 0 | 0 | 0 | 0 | 54 | 32 | 6 |
| Analogues | 0 | 0 | 0 | 1 | 26 | 31 | 170 | 2 | 2 |
BC
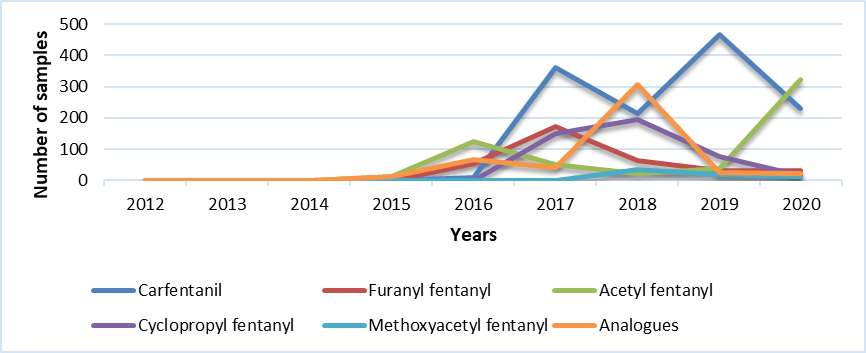
BC / Main Fentanyl analogues - Table
| 2012 | 2013 | 2014 | 2015 | 2016 | 2017 | 2018 | 2019 | 2020 | |
|---|---|---|---|---|---|---|---|---|---|
| Carfentanil | 0 | 0 | 0 | 0 | 8 | 360 | 214 | 367 | 231 |
| Furanyl fentanyl | 0 | 0 | 0 | 0 | 52 | 173 | 64 | 32 | 32 |
| Acetyl fentanyl | 0 | 0 | 0 | 11 | 124 | 50 | 21 | 39 | 324 |
| Cyclopropyl fentanyl | 0 | 0 | 0 | 0 | 0 | 151 | 194 | 77 | 16 |
| Methoxyacetyl fentanyl | 0 | 0 | 0 | 0 | 0 | 0 | 34 | 18 | 13 |
| Analogues | 0 | 0 | 0 | 11 | 67 | 42 | 307 | 25 | 21 |
MB
MB / Main Fentanyl analogues - Table
| 2012 | 2013 | 2014 | 2015 | 2016 | 2017 | 2018 | 2019 | 2020 | |
|---|---|---|---|---|---|---|---|---|---|
| Carfentanil | 0 | 0 | 0 | 0 | 8 | 43 | 7 | 46 | 15 |
| Furanyl fentanyl | 0 | 0 | 0 | 0 | 5 | 12 | 7 | 0 | 0 |
| Acetyl fentanyl | 0 | 0 | 0 | 6 | 0 | 6 | 1 | 3 | 7 |
| Cyclopropyl fentanyl | 0 | 0 | 0 | 0 | 0 | 2 | 13 | 4 | 0 |
| Methoxyacetyl fentanyl | 0 | 0 | 0 | 0 | 0 | 0 | 2 | 0 | 0 |
| Analogues | 0 | 0 | 0 | 0 | 0 | 1 | 12 | 1 | 0 |
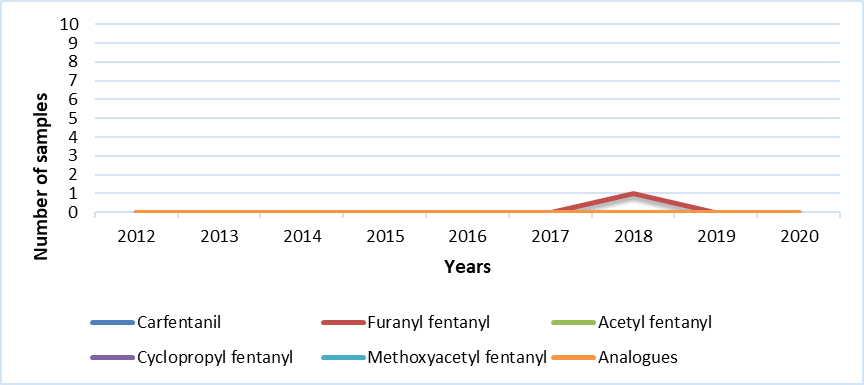
NB
NB / Main Fentanyl analogues - Table
| 2012 | 2013 | 2014 | 2015 | 2016 | 2017 | 2018 | 2019 | 2020 | |
|---|---|---|---|---|---|---|---|---|---|
| Carfentanil | 0 | 0 | 0 | 0 | 0 | 0 | 0 | 1 | 0 |
| Furanyl fentanyl | 0 | 0 | 0 | 0 | 3 | 17 | 6 | 1 | 2 |
| Acetyl fentanyl | 0 | 0 | 0 | 0 | 0 | 0 | 0 | 0 | 0 |
| Cyclopropyl fentanyl | 0 | 0 | 0 | 0 | 0 | 0 | 0 | 0 | 0 |
| Methoxyacetyl fentanyl | 0 | 0 | 0 | 0 | 0 | 0 | 0 | 0 | 0 |
| Analogues | 0 | 0 | 0 | 2 | 0 | 0 | 0 | 0 | 0 |
NFL
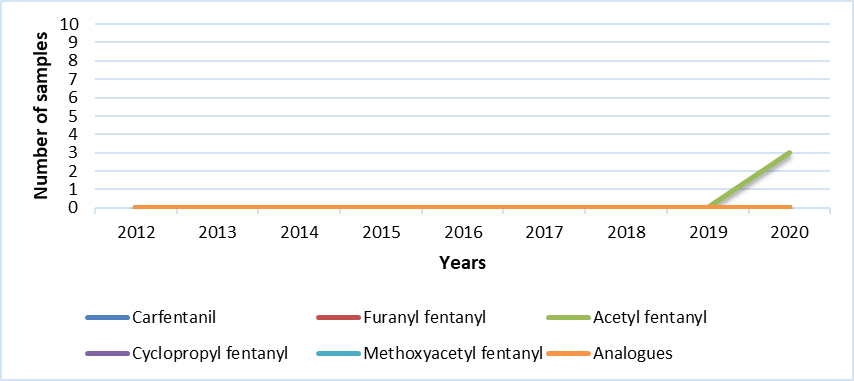
NFL / Main Fentanyl analogues - Table
| 2012 | 2013 | 2014 | 2015 | 2016 | 2017 | 2018 | 2019 | 2020 | |
|---|---|---|---|---|---|---|---|---|---|
| Carfentanil | 0 | 0 | 0 | 0 | 0 | 0 | 0 | 0 | 0 |
| Furanyl fentanyl | 0 | 0 | 0 | 0 | 0 | 0 | 0 | 0 | 0 |
| Acetyl fentanyl | 0 | 0 | 0 | 0 | 0 | 0 | 0 | 0 | 3 |
| Cyclopropyl fentanyl | 0 | 0 | 0 | 0 | 0 | 0 | 0 | 0 | 0 |
| Methoxyacetyl fentanyl | 0 | 0 | 0 | 0 | 0 | 0 | 0 | 0 | 0 |
| Analogues | 0 | 0 | 0 | 0 | 0 | 0 | 0 | 0 | 0 |
NS
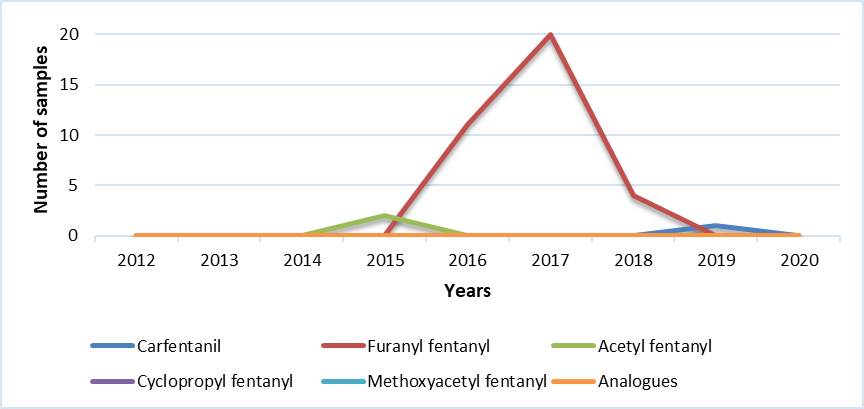
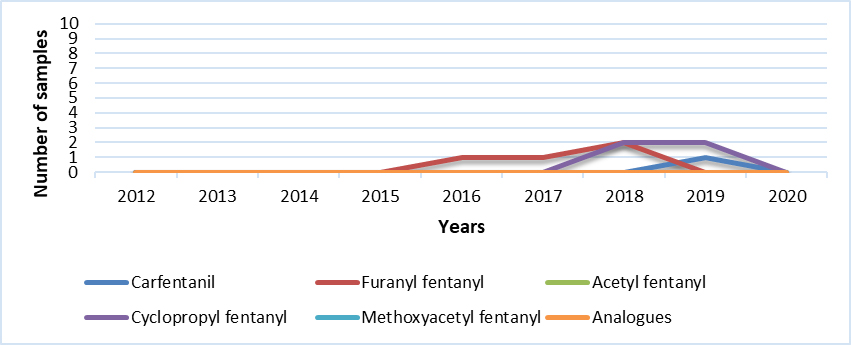
NS / Main Fentanyl analogues - Table
| 2012 | 2013 | 2014 | 2015 | 2016 | 2017 | 2018 | 2019 | 2020 | |
|---|---|---|---|---|---|---|---|---|---|
| Carfentanil | 0 | 0 | 0 | 0 | 0 | 0 | 0 | 1 | 0 |
| Furanyl fentanyl | 0 | 0 | 0 | 0 | 11 | 20 | 4 | 0 | 0 |
| Acetyl fentanyl | 0 | 0 | 0 | 2 | 0 | 0 | 0 | 0 | 0 |
| Cyclopropyl fentanyl | 0 | 0 | 0 | 0 | 0 | 0 | 0 | 0 | 0 |
| Methoxyacetyl fentanyl | 0 | 0 | 0 | 0 | 0 | 0 | 0 | 0 | 0 |
| Analogues | 0 | 0 | 0 | 0 | 0 | 0 | 0 | 0 | 0 |
ON

ON / Main Fentanyl analogues - Table
| 2012 | 2013 | 2014 | 2015 | 2016 | 2017 | 2018 | 2019 | 2020 | |
|---|---|---|---|---|---|---|---|---|---|
| Carfentanil | 0 | 0 | 0 | 0 | 4 | 90 | 321 | 1019 | 23 |
| Furanyl fentanyl | 0 | 0 | 0 | 0 | 57 | 259 | 88 | 18 | 10 |
| Acetyl fentanyl | 0 | 2 | 7 | 10 | 10 | 28 | 10 | 56 | 9 |
| Cyclopropyl fentanyl | 0 | 0 | 0 | 0 | 0 | 28 | 95 | 6 | 10 |
| Methoxyacetyl fentanyl | 0 | 0 | 0 | 0 | 0 | 0 | 113 | 44 | 5 |
| Analogues | 0 | 0 | 0 | 1 | 7 | 40 | 33 | 12 | 6 |
PEI
PEI / Main Fentanyl analogues - Table
| 2012 | 2013 | 2014 | 2015 | 2016 | 2017 | 2018 | 2019 | 2020 | |
|---|---|---|---|---|---|---|---|---|---|
| Carfentanil | 0 | 0 | 0 | 0 | 0 | 0 | 0 | 0 | 0 |
| Furanyl fentanyl | 0 | 0 | 0 | 0 | 0 | 0 | 1 | 0 | 0 |
| Acetyl fentanyl | 0 | 0 | 0 | 0 | 0 | 0 | 0 | 0 | 0 |
| Cyclopropyl fentanyl | 0 | 0 | 0 | 0 | 0 | 0 | 0 | 0 | 0 |
| Methoxyacetyl fentanyl | 0 | 0 | 0 | 0 | 0 | 0 | 0 | 0 | 0 |
| Analogues | 0 | 0 | 0 | 0 | 0 | 0 | 0 | 0 | 0 |
QC
QC / Main Fentanyl analogues - Table
| 2012 | 2013 | 2014 | 2015 | 2016 | 2017 | 2018 | 2019 | 2020 | |
|---|---|---|---|---|---|---|---|---|---|
| Carfentanil | 0 | 0 | 0 | 0 | 0 | 52 | 57 | 10 | 1 |
| Furanyl fentanyl | 0 | 0 | 0 | 0 | 6 | 64 | 70 | 17 | 0 |
| Acetyl fentanyl | 0 | 46 | 20 | 10 | 16 | 19 | 15 | 1 | 1 |
| Cyclopropyl fentanyl | 0 | 0 | 0 | 0 | 0 | 0 | 1 | 1 | 3 |
| Methoxyacetyl fentanyl | 0 | 0 | 0 | 0 | 0 | 0 | 1 | 8 | 7 |
| Analogues | 0 | 0 | 0 | 0 | 0 | 3 | 14 | 0 | 1 |
SK

SK / Main Fentanyl analogues - Table
| 2012 | 2013 | 2014 | 2015 | 2016 | 2017 | 2018 | 2019 | 2020 | |
|---|---|---|---|---|---|---|---|---|---|
| Carfentanil | 0 | 0 | 0 | 0 | 0 | 5 | 10 | 10 | 4 |
| Furanyl fentanyl | 0 | 0 | 0 | 0 | 4 | 1 | 5 | 2 | 0 |
| Acetyl fentanyl | 0 | 0 | 0 | 1 | 0 | 1 | 0 | 0 | 4 |
| Cyclopropyl fentanyl | 0 | 0 | 0 | 0 | 0 | 0 | 2 | 3 | 3 |
| Methoxyacetyl fentanyl | 0 | 0 | 0 | 0 | 0 | 0 | 3 | 2 | 0 |
| Analogues | 0 | 0 | 0 | 0 | 0 | 1 | 2 | 0 | 0 |
Territories
Territories / Main Fentanyl analogues - Table
| 2012 | 2013 | 2014 | 2015 | 2016 | 2017 | 2018 | 2019 | 2020 | |
|---|---|---|---|---|---|---|---|---|---|
| Carfentanil | 0 | 0 | 0 | 0 | 0 | 0 | 0 | 1 | 0 |
| Furanyl fentanyl | 0 | 0 | 0 | 0 | 1 | 1 | 2 | 0 | 0 |
| Acetyl fentanyl | 0 | 0 | 0 | 0 | 0 | 0 | 0 | 0 | 0 |
| Cyclopropyl fentanyl | 0 | 0 | 0 | 0 | 0 | 0 | 2 | 2 | 0 |
| Methoxyacetyl fentanyl | 0 | 0 | 0 | 0 | 0 | 0 | 0 | 0 | 0 |
| Analogues | 0 | 0 | 0 | 0 | 0 | 0 | 0 | 0 | 0 |
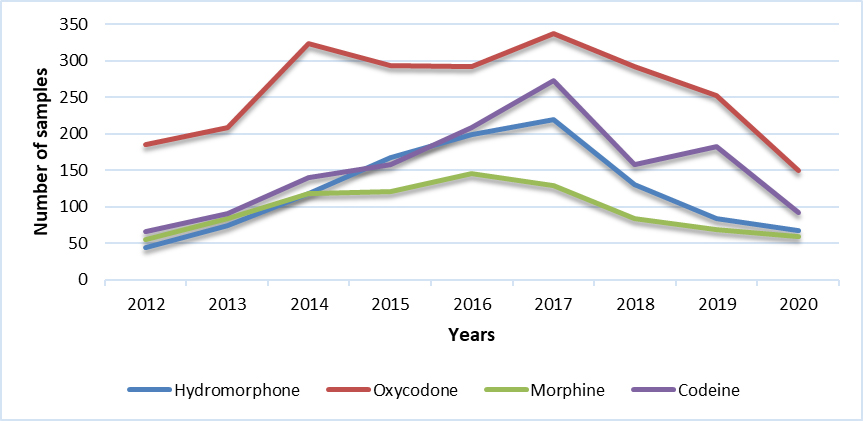
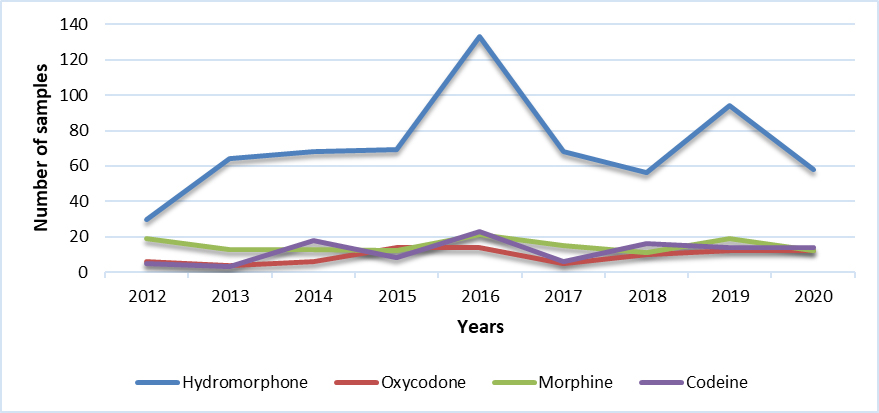
Other common opioids identified in the samples analyzed
Canada
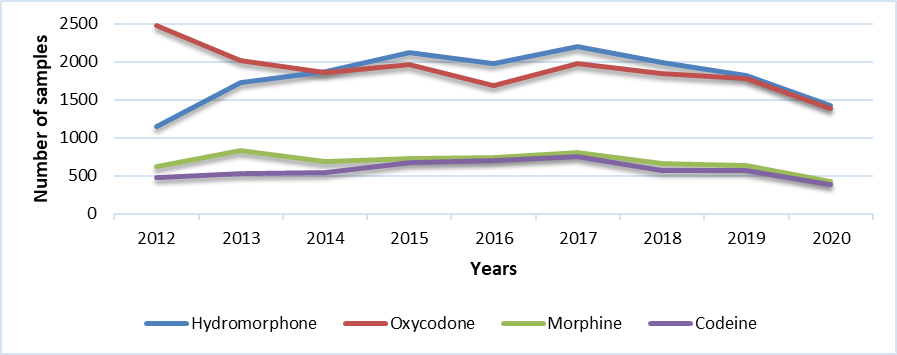
Canada / Other common opioids - Table
| 2012 | 2013 | 2014 | 2015 | 2016 | 2017 | 2018 | 2019 | 2020 | |
|---|---|---|---|---|---|---|---|---|---|
| Hydromorphone | 1148 | 1731 | 1872 | 2121 | 1972 | 2201 | 1991 | 1817 | 1427 |
| Oxycodone | 2477 | 2020 | 1857 | 1969 | 1690 | 1983 | 1942 | 1782 | 1390 |
| Morphine | 620 | 837 | 693 | 731 | 739 | 811 | 657 | 632 | 424 |
| Codeine | 481 | 528 | 540 | 670 | 696 | 757 | 568 | 563 | 383 |
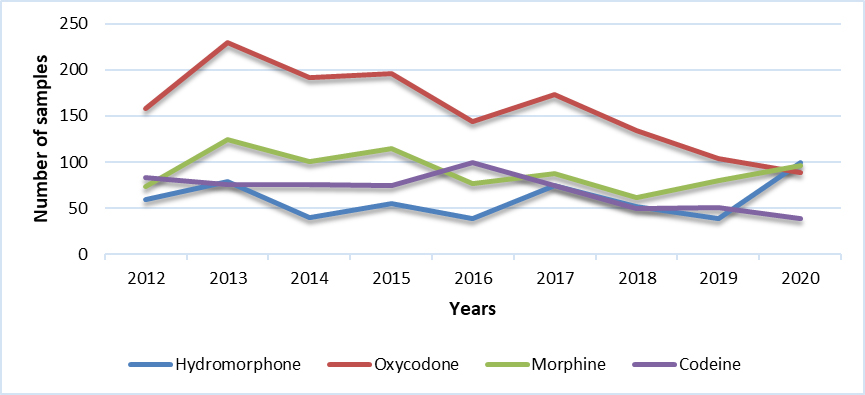
AB
AB / Other common opioids - Table
| 2012 | 2013 | 2014 | 2015 | 2016 | 2017 | 2018 | 2019 | 2020 | |
|---|---|---|---|---|---|---|---|---|---|
| Hydromorphone | 44 | 74 | 118 | 167 | 199 | 219 | 130 | 84 | 67 |
| Oxycodone | 185 | 208 | 323 | 293 | 292 | 337 | 292 | 253 | 150 |
| Morphine | 55 | 84 | 118 | 121 | 146 | 129 | 84 | 69 | 59 |
| Codeine | 66 | 91 | 140 | 158 | 209 | 273 | 158 | 183 | 92 |
BC
BC / Other common opioids - Table
| 2012 | 2013 | 2014 | 2015 | 2016 | 2017 | 2018 | 2019 | 2020 | |
|---|---|---|---|---|---|---|---|---|---|
| Hydromorphone | 59 | 79 | 40 | 55 | 39 | 74 | 52 | 39 | 99 |
| Oxycodone | 158 | 230 | 192 | 196 | 144 | 173 | 134 | 104 | 89 |
| Morphine | 73 | 124 | 101 | 115 | 77 | 87 | 62 | 80 | 96 |
| Codeine | 83 | 76 | 76 | 75 | 100 | 74 | 50 | 51 | 39 |
MB
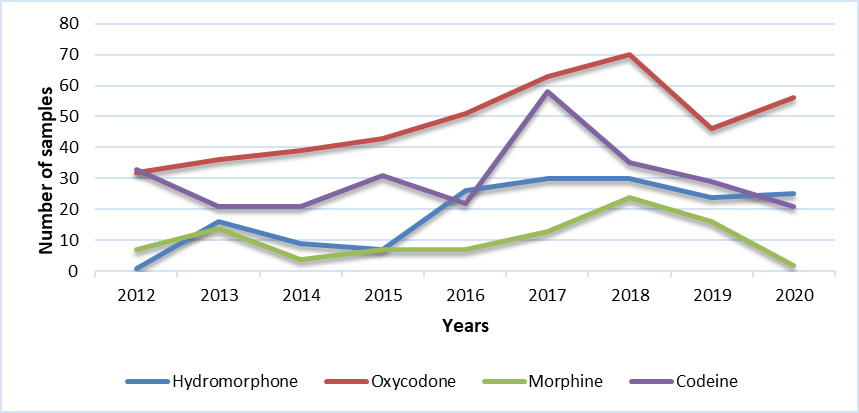
MB / Other common opioids - Table
| 2012 | 2013 | 2014 | 2015 | 2016 | 2017 | 2018 | 2019 | 2020 | |
|---|---|---|---|---|---|---|---|---|---|
| Hydromorphone | 1 | 16 | 9 | 7 | 26 | 30 | 30 | 24 | 25 |
| Oxycodone | 32 | 36 | 39 | 43 | 51 | 63 | 70 | 46 | 56 |
| Morphine | 7 | 14 | 4 | 7 | 7 | 13 | 24 | 16 | 2 |
| Codeine | 33 | 21 | 21 | 31 | 22 | 58 | 35 | 29 | 21 |
NB
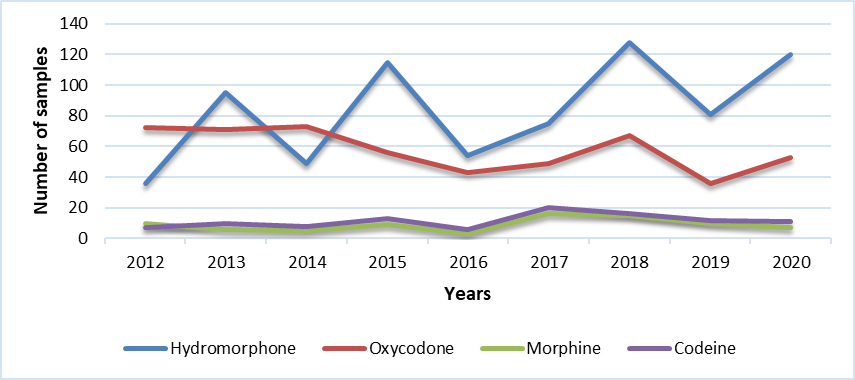
NB / Other common opioids - Table
| 2012 | 2013 | 2014 | 2015 | 2016 | 2017 | 2018 | 2019 | 2020 | |
|---|---|---|---|---|---|---|---|---|---|
| Hydromorphone | 36 | 95 | 49 | 115 | 54 | 75 | 128 | 81 | 120 |
| Oxycodone | 72 | 71 | 73 | 56 | 43 | 49 | 67 | 36 | 53 |
| Morphine | 10 | 6 | 5 | 9 | 3 | 16 | 15 | 10 | 7 |
| Codeine | 7 | 10 | 8 | 13 | 6 | 20 | 16 | 12 | 11 |
NFL

NFL / Other common opioids - Table
| 2012 | 2013 | 2014 | 2015 | 2016 | 2017 | 2018 | 2019 | 2020 | |
|---|---|---|---|---|---|---|---|---|---|
| Hydromorphone | 5 | 7 | 7 | 13 | 23 | 9 | 4 | 15 | 9 |
| Oxycodone | 32 | 24 | 18 | 21 | 52 | 19 | 16 | 45 | 16 |
| Morphine | 5 | 15 | 12 | 16 | 43 | 13 | 9 | 24 | 9 |
| Codeine | 2 | 4 | 4 | 3 | 7 | 5 | 0 | 9 | 5 |
NS
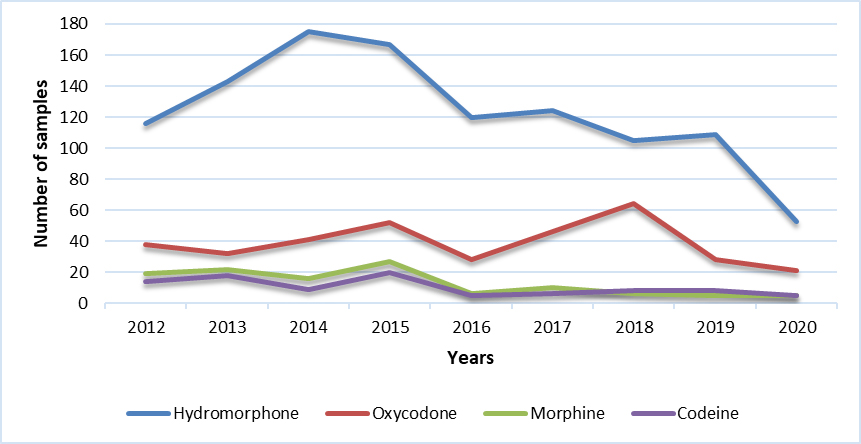
NS / Other common opioids - Table
| 2012 | 2013 | 2014 | 2015 | 2016 | 2017 | 2018 | 2019 | 2020 | |
|---|---|---|---|---|---|---|---|---|---|
| Hydromorphone | 116 | 143 | 175 | 167 | 120 | 124 | 105 | 109 | 53 |
| Oxycodone | 38 | 32 | 41 | 52 | 28 | 46 | 64 | 28 | 21 |
| Morphine | 19 | 22 | 16 | 27 | 6 | 10 | 6 | 5 | 5 |
| Codeine | 14 | 18 | 9 | 20 | 5 | 6 | 8 | 8 | 5 |
ON
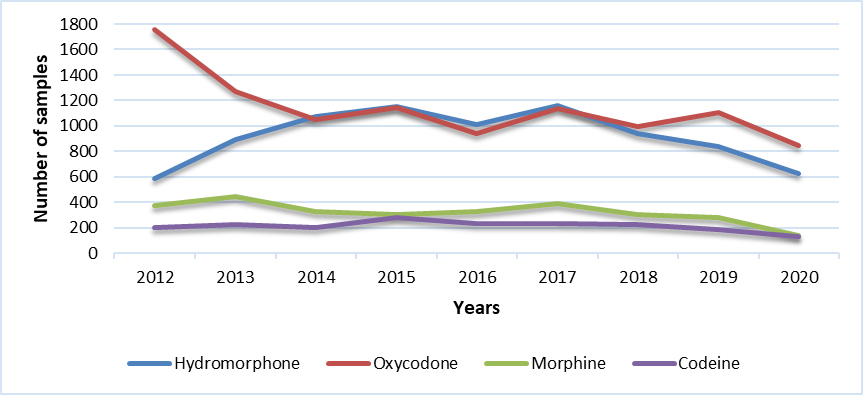
ON / Other common opioids - Table
| 2012 | 2013 | 2014 | 2015 | 2016 | 2017 | 2018 | 2019 | 2020 | |
|---|---|---|---|---|---|---|---|---|---|
| Hydromorphone | 584 | 891 | 1071 | 1152 | 1010 | 1160 | 942 | 836 | 624 |
| Oxycodone | 1759 | 1268 | 1053 | 1147 | 943 | 1134 | 992 | 1107 | 844 |
| Morphine | 377 | 450 | 330 | 306 | 326 | 395 | 304 | 281 | 139 |
| Codeine | 206 | 230 | 204 | 282 | 236 | 232 | 228 | 190 | 131 |
PEI
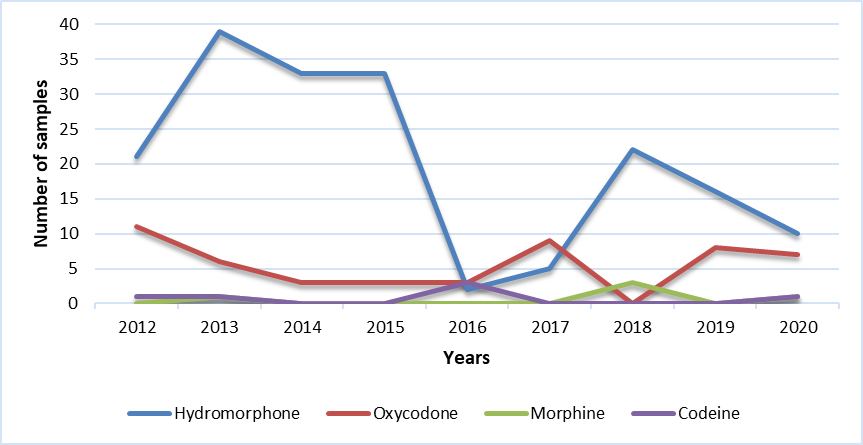
PEI / Other common opioids - Table
| 2012 | 2013 | 2014 | 2015 | 2016 | 2017 | 2018 | 2019 | 2020 | |
|---|---|---|---|---|---|---|---|---|---|
| Hydromorphone | 21 | 39 | 33 | 33 | 2 | 5 | 22 | 16 | 10 |
| Oxycodone | 11 | 6 | 3 | 3 | 3 | 9 | 0 | 8 | 7 |
| Morphine | 0 | 1 | 0 | 0 | 0 | 0 | 3 | 0 | 1 |
| Codeine | 1 | 1 | 0 | 0 | 3 | 0 | 0 | 0 | 1 |
QC
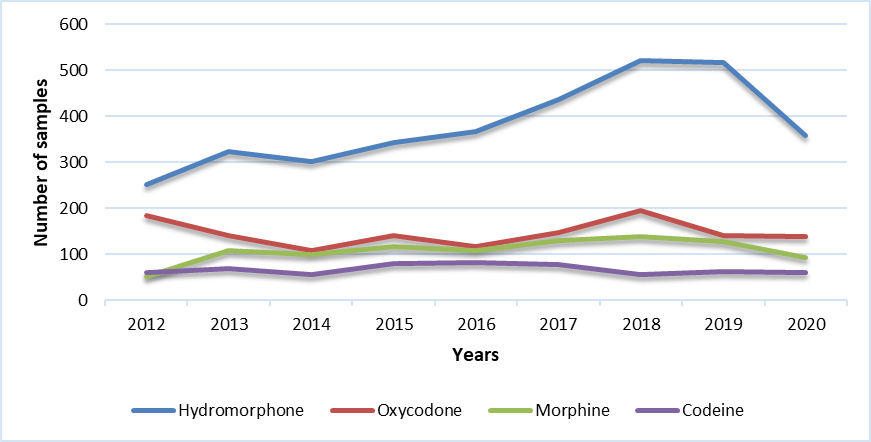
QC / Other common opioids - Table
| 2012 | 2013 | 2014 | 2015 | 2016 | 2017 | 2018 | 2019 | 2020 | |
|---|---|---|---|---|---|---|---|---|---|
| Hydromorphone | 251 | 323 | 302 | 343 | 366 | 436 | 522 | 516 | 359 |
| Oxycodone | 184 | 140 | 108 | 142 | 118 | 147 | 195 | 142 | 138 |
| Morphine | 52 | 108 | 100 | 118 | 109 | 131 | 139 | 128 | 94 |
| Codeine | 60 | 70 | 56 | 80 | 82 | 79 | 57 | 63 | 61 |
SK
SK / Other common opioids - Table
| 2012 | 2013 | 214 | 215 | 2016 | 2017 | 2018 | 2019 | 2020 | |
|---|---|---|---|---|---|---|---|---|---|
| Hydromorphone | 30 | 64 | 68 | 69 | 133 | 68 | 56 | 94 | 58 |
| Oxycodone | 6 | 4 | 6 | 14 | 14 | 5 | 10 | 12 | 12 |
| Morphine | 19 | 13 | 13 | 12 | 21 | 15 | 11 | 19 | 12 |
| Codeine | 5 | 3 | 18 | 8 | 23 | 6 | 16 | 14 | 14 |
Territories
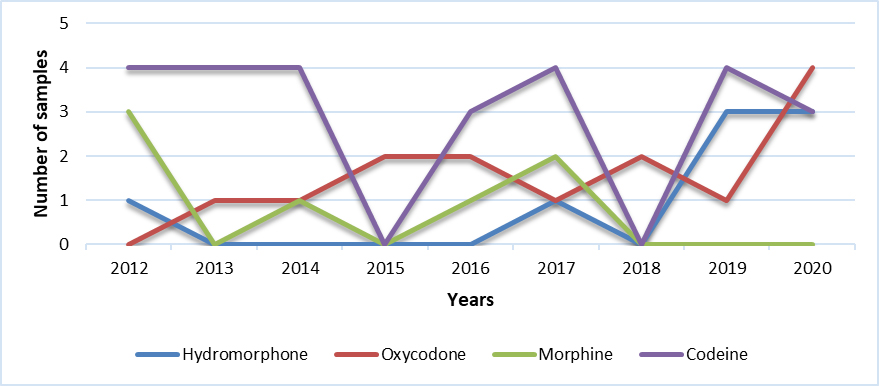
Territories / Other common opioids - Table
| 2012 | 2013 | 2014 | 2015 | 2016 | 2017 | 2018 | 2019 | 2020 | |
|---|---|---|---|---|---|---|---|---|---|
| Hydromorphone | 1 | 0 | 0 | 0 | 0 | 1 | 0 | 3 | 3 |
| Oxycodone | 0 | 1 | 1 | 2 | 2 | 1 | 2 | 1 | 4 |
| Morphine | 3 | 0 | 1 | 0 | 1 | 2 | 0 | 0 | 0 |
| Codeine | 4 | 4 | 4 | 0 | 3 | 4 | 0 | 4 | 3 |