
Sodium detector: Naturally occurring
Select one of the products below:
- Fresh baby carrots
- Celery
- Skim milk
- Plain, fat-free yogurt
- Tofu
- Lentils (boiled)
- Natural peanut butter
Fresh baby carrots
Follow these 3 steps to find out how much sodium is in this food:
Step 1:
Look at the serving size on the nutrition facts table. The serving for carrots is 8 carrots (85 g). Compare this amount to the quantity that you actually eat.
Step 2:
Read the % DV (Daily Value) on the food label. 5% DV or less is a little and 15 % DV or more is a lot.
Step 3:
Choose wisely. Look closely at the label to see if carrots have a little or a lot of sodium.
Fresh baby carrots - Text description
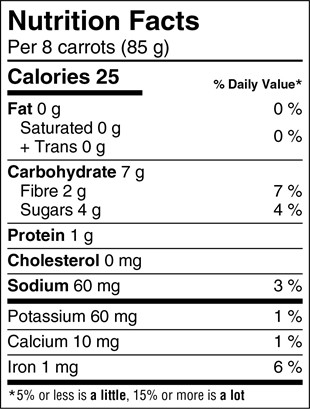
Shown here is a Nutrition Facts table. Left justified at the top of the table is the heading Nutrition Facts in bold. The next line is Per 8 carrots open parenthesis 85 g close parenthesis. There is a thin rule below per 8 carrots information that spans the width of the table.
The next line is Calories in bold followed by 25, also in bold. Right justified on the same line is the subheading percent symbol Daily Value in bold. Percent Daily Value is followed by an asterisk that refers to a footnote at the bottom of the Nutrition Facts table. There is a thick rule under Calories that ends after the 25; it does not span the width of the table.
Left justified on the next line is Fat in bold followed by 0 and a lowercase g. Right justified on the same line is 0 followed by a percent symbol. Indented on the next line is Saturated followed by 0 and a lowercase g. Indented on the next line is a plus symbol followed by Trans, followed by 0 and a lowercase g. Right justified and vertically centered against the saturated and trans information on the left is 0 followed by a percent symbol. There is a thin rule below the trans information that spans the width of the table.
The next line is Carbohydrate in bold followed by 7 and a lowercase g. Indented on the next line is Fibre followed by 2 and a lowercase g. Right justified on the same line is 7 followed by a percent symbol. Indented on the next line is Sugars followed by 4 and a lowercase g. Right justified on the same line is 4 followed by a percent symbol. There is a thin rule under the sugars information that spans the width of the table.
The next line is Protein in bold followed by 1 and a lowercase g. There is a thin rule under the protein information that spans the width of the table.
The next line is Cholesterol, in bold followed by 0 and mg in lowercase. There is a thin rule under the cholesterol information that spans the width of the table.
The next line is Sodium in bold followed by 60 and mg in lowercase. Right justified on the same line is 3 followed by a percent symbol. There is a thick rule under the sodium information that spans the width of the table.
The next line is Potassium followed by 60 and mg in lowercase. Right justified on the same line is 1 followed by a percent symbol. There is a thin rule under the potassium information that spans the width of the table.
The next line is Calcium followed by 10 and mg in lowercase. Right justified on the same line is 1 followed by a percent symbol. There is a thin rule below the calcium information that spans the width of the table.
The next line is Iron followed by 1 and mg in lowercase. Right justified on the same line is 6 followed by a percent symbol. There is a thick rule under the iron information that spans the width of the Nutrition Facts table.
The next line is the percent Daily Value footnote that was referred to at the beginning of the table description. The footnote starts with an asterisk followed by the statement: 5 percent symbol or less is a little, 15 percent symbol or more is a lot. The terms 'a little' and 'a lot' are in bold. This is the end of the Nutrition Facts table.
Tip: Choose vegetables and fruits more often as they are low in sodium and good for you.
Celery
Follow these 3 steps to find out how much sodium is in this food:
Step 1:
Look at the serving size on the nutrition facts table. The serving size for celery is 2 stalks (85 g). Compare this amount to the quantity that you actually eat.
Step 2:
Read the % DV (Daily Value) on the food label. 5% DV or less is a little and 15 % DV or more is a lot.
Step 3:
Choose wisely. Look closely at the label to see if celery has a little or a lot of sodium.
Celery - Text description
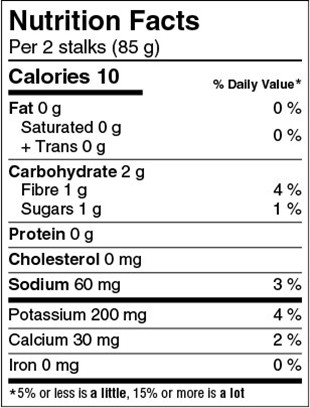
Shown here is a Nutrition Facts table. Left justified at the top of the table is the heading Nutrition Facts in bold. The next line is Per 2 stalks open parenthesis 85 g close parenthesis. There is a thin rule below per 2 stalks information that spans the width of the table.
The next line is Calories in bold followed by 10, also in bold. Right justified on the same line is the subheading percent symbol Daily Value in bold. Percent Daily Value is followed by an asterisk that refers to a footnote at the bottom of the Nutrition Facts table. There is a thick rule under Calories that ends after the 10; it does not span the width of the table.
Left justified on the next line is Fat in bold followed by 0 and a lowercase g. Right justified on the same line is 0 followed by a percent symbol. Indented on the next line is Saturated followed by 0 and a lowercase g. Indented on the next line is a plus symbol followed by Trans, followed by 0 and a lowercase g. Right justified and vertically centered against the saturated and trans information on the left is 0 followed by a percent symbol. There is a thin rule below the trans information that spans the width of the table.
The next line is Carbohydrate in bold followed by 2 and a lowercase g. Indented on the next line is Fibre followed by 1 and a lowercase g. Right justified on the same line is 4 followed by a percent symbol. Indented on the next line is Sugars followed by 1 and a lowercase g. Right justified on the same line is 1 followed by a percent symbol. There is a thin rule under the sugars information that spans the width of the table.
The next line is Protein in bold followed by 0 and a lowercase g. There is a thin rule under the protein information that spans the width of the table.
The next line is Cholesterol, in bold followed by 0 and mg in lowercase. There is a thin rule under the cholesterol information that spans the width of the table.
The next line is Sodium in bold followed by 60 and mg in lowercase. Right justified on the same line is 3 followed by a percent symbol. There is a thick rule under the sodium information that spans the width of the table.
The next line is Potassium followed by 200 and mg in lowercase. Right justified on the same line is 4 followed by a percent symbol. There is a thin rule under the potassium information that spans the width of the table.
The next line is Calcium followed by 30 and mg in lowercase. Right justified on the same line is 2 followed by a percent symbol. There is a thin rule below the calcium information that spans the width of the table.
The next line is Iron followed by 0 and mg in lowercase. Right justified on the same line is 0 followed by a percent symbol. There is a thick rule under the iron information that spans the width of the Nutrition Facts table.
The next line is the percent Daily Value footnote that was referred to at the beginning of the table description. The footnote starts with an asterisk followed by the statement: 5 percent symbol or less is a little, 15 percent symbol or more is a lot. The terms 'a little' and 'a lot' are in bold. This is the end of the Nutrition Facts table.
Tip: Celery and carrot sticks make a quick and healthy low sodium snack for kids and adults alike!
Skim milk
Follow these 3 steps to find out how much sodium is in this food:
Step 1:
Look at the serving size on the nutrition facts table. The serving size for skim milk is 1 cup (250 mL). Compare this amount to the quantity that you actually eat.
Step 2:
Read the % DV (Daily Value) on the food label. 5% DV or less is a little and 15 % DV or more is a lot.
Step 3:
Choose wisely. Look closely at the label to see if skim milk has a little or a lot of sodium.
Skim milk - Text description
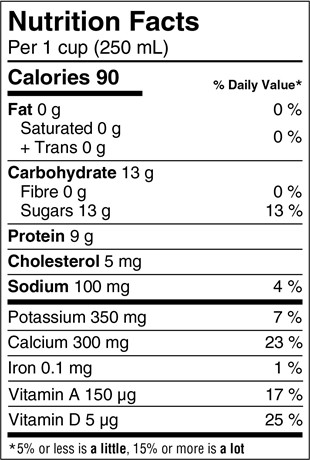
Shown here is a Nutrition Facts table. Left justified at the top of the table is the heading Nutrition Facts in bold. The next line is Per 1 cup open parenthesis 250 mL close parenthesis. There is a thin rule below per ½ cup (250 mL) information that spans the width of the table. The next line is Calories in bold followed by 90, also in bold. Right justified on the same line is the subheading percent symbol Daily Value in bold. Percent Daily Value is followed by an asterisk that refers to a footnote at the bottom of the Nutrition Facts table. There is a thick rule under Calories that ends after the 90; it does not span the width of the table.
Left justified on the next line is Fat in bold followed by 0 and a lowercase g. Right justified on the same line is 0 followed by a percent symbol. Indented on the next line is Saturated followed by 0 and a lowercase g. Indented on the next line is a plus symbol followed by Trans, followed by 0 and a lowercase g. Right justified and vertically centered against the saturated and trans information on the left is 0 followed by a percent symbol. There is a thin rule below the trans information that spans the width of the table.
The next line is Carbohydrate in bold followed by 13 and a lowercase g. Indented on the next line is Fibre followed by 0 and a lowercase g. Right justified on the same line is 0 followed by a percent symbol. Indented on the next line is Sugars followed by 13 and a lowercase g. Right justified on the same line is 13 followed by a percent symbol. There is a thin rule under the sugars information that spans the width of the table.
The next line is Protein in bold followed by 9 and a lowercase g. There is a thin rule under the protein information that spans the width of the table.
The next line is Cholesterol, in bold followed by 5 and mg in lowercase. There is a thin rule under the cholesterol information that spans the width of the table.
The next line is Sodium in bold followed by 100 and mg in lowercase. Right justified on the same line is 4 followed by a percent symbol. There is a thick rule under the sodium information that spans the width of the table.
The next line is Potassium followed by 350 and mg in lowercase. Right justified on the same line is 7 followed by a percent symbol. There is a thin rule under the potassium information that spans the width of the table.
The next line is Calcium followed by 300 and mg in lowercase. Right justified on the same line is 23 followed by a percent symbol. There is a thin rule below the calcium information that spans the width of the table.
The next line is Iron followed by 0.1 and mg in lowercase. Right justified on the same line is 1 followed by a percent symbol. There is a thin rule under the iron information that spans the width of the Nutrition Facts table.
The next line is Vitamin A followed by 150 and µg in lowercase. Right justified on the same line is 17 followed by a percent symbol. There is a thin rule under the iron information that spans the width of the Nutrition Facts table.
The next line is Vitamin D followed by 5 and µg in lowercase. Right justified on the same line is 25 followed by a percent symbol. There is a thck rule under the vitamin D information that spans the width of the Nutrition Facts table.The next line is the percent Daily Value footnote that was referred to at the beginning of the table description. The footnote starts with an asterisk followed by the statement: 5 percent symbol or less is a little, 15 percent symbol or more is a lot. The terms 'a little' and 'a lot' are in bold. This is the end of the Nutrition Facts table.
Tip: Choose unflavoured milk, fortified soy beverages and yogurt more often because they are low in sodium. Sometimes flavoured versions, such as chocolate milk, have added sodium so read the label of these products carefully.
Plain fat-free yogurt
Follow these 3 steps to find out how much sodium is in this food:
Step 1:
Look at the serving size on the nutrition facts table. The serving size for the plain fat-free yogurt is ¾ cup (175 g). Compare this amount to the quantity that you actually eat.
Step 2:
Read the % DV (Daily Value) on the food label. 5% DV or less is a little and 15 % DV or more is a lot.
Step 3:
Choose wisely. Look closely at the label to see if this plain yogurt has a little or a lot of sodium.

Plain fat-free yogurt - Text description
Shown here is a Nutrition Facts table. Left justified at the top of the table is the heading Nutrition Facts in bold. The next line is Per ¾ cup open parenthesis 175 g close parenthesis. There is a thin rule below per ¾ cup information that spans the width of the table. The next line is Calories in bold followed by 70, also in bold. Right justified on the same line is the subheading percent symbol Daily Value in bold. Percent Daily Value is followed by an asterisk that refers to a footnote at the bottom of the Nutrition Facts table. There is a thick rule under Calories that ends after the 70; it does not span the width of the table.
Left justified on the next line is Fat in bold followed by 0 and a lowercase g. Right justified on the same line is 0 followed by a percent symbol. Indented on the next line is Saturated followed by 0 and a lowercase g. Indented on the next line is a plus symbol followed by Trans, followed by 0 and a lowercase g. Right justified and vertically centered against the saturated and trans information on the left is 0 followed by a percent symbol. There is a thin rule below the trans information that spans the width of the table.
The next line is Carbohydrate in bold followed by 8 and a lowercase g. Indented on the next line is Fibre followed by 0 and a lowercase g. Right justified on the same line is 0 followed by a percent symbol. Indented on the next line is Sugars followed by 7 and a lowercase g. Right justified on the same line is 7 followed by a percent symbol. There is a thin rule under the sugars information that spans the width of the table.
The next line is Protein in bold followed by 8 and a lowercase g. There is a thin rule under the protein information that spans the width of the table.
The next line is Cholesterol, in bold followed by 7 and mg in lowercase. There is a thin rule under the cholesterol information that spans the width of the table.
The next line is Sodium in bold followed by 90 and mg in lowercase. Right justified on the same line is 4 followed by a percent symbol. There is a thick rule under the sodium information that spans the width of the table.
The next line is Potassium followed by 350 and mg in lowercase. Right justified on the same line is 7 followed by a percent symbol. There is a thin rule under the potassium information that spans the width of the table.
The next line is Calcium followed by 250 and mg in lowercase. Right justified on the same line is 19 followed by a percent symbol. There is a thin rule below the calcium information that spans the width of the table.
The next line is Iron followed by 0 and mg in lowercase. Right justified on the same line is 0 followed by a percent symbol. There is a thick rule under the iron information that spans the width of the Nutrition Facts table.
The next line is the percent Daily Value footnote that was referred to at the beginning of the table description. The footnote starts with an asterisk followed by the statement: 5 percent symbol or less is a little, 15 percent symbol or more is a lot. The terms 'a little' and 'a lot' are in bold. This is the end of the Nutrition Facts table.
Tip: Be creative and replace mayonnaise, sour cream or heavy cream with yogurt in recipes. Plain yogurt mixed with fruit makes a delicious low sodium snack or dessert for kids and adults alike!
Tofu
Follow these 3 steps to find out how much sodium is in this food:
Step 1:
Look at the serving size on the nutrition facts table. The serving size for tofu is 85 g. Compare this amount to the quantity that you actually eat.
Step 2:
Read the % DV (Daily Value) on the food label. 5% DV or less is a little and 15 % DV or more is a lot.
Step 3:
Choose wisely. Look closely at the label to see if tofu has a little or a lot of sodium.
Tofu - Text description
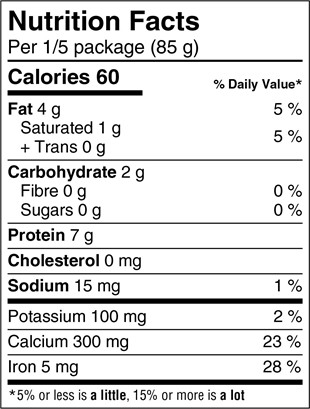
Shown here is a Nutrition Facts table. Left justified at the top of the table is the heading Nutrition Facts in bold. The next line is Per ½ package open parenthesis 85 g close parenthesis. There is a thin rule below per ½ package (85 g) information that spans the width of the table. The next line is Calories in bold followed by 60, also in bold. Right justified on the same line is the subheading percent symbol Daily Value in bold. Percent Daily Value is followed by an asterisk that refers to a footnote at the bottom of the Nutrition Facts table. There is a thick rule under Calories that ends after the 60; it does not span the width of the table.
Left justified on the next line is Fat in bold followed by 4 and a lowercase g. Right justified on the same line is 5 followed by a percent symbol. Indented on the next line is Saturated followed by 1 and a lowercase g. Indented on the next line is a plus symbol followed by Trans, followed by 0 and a lowercase g. Right justified and vertically centered against the saturated and trans information on the left is 5 followed by a percent symbol. There is a thin rule below the trans information that spans the width of the table.
The next line is Carbohydrate in bold followed by 2 and a lowercase g. Indented on the next line is Fibre followed by 0 and a lowercase g. Right justified on the same line is 0 followed by a percent symbol. Indented on the next line is Sugars followed by 0 and a lowercase g. Right justified on the same line is 0 followed by a percent symbol. There is a thin rule under the sugars information that spans the width of the table.
The next line is Protein in bold followed by 7 and a lowercase g. There is a thin rule under the protein information that spans the width of the table.
The next line is Cholesterol, in bold followed by 0 and mg in lowercase. There is a thin rule under the cholesterol information that spans the width of the table.
The next line is Sodium in bold followed by 15 and mg in lowercase. Right justified on the same line is 1 followed by a percent symbol. There is a thick rule under the sodium information that spans the width of the table.
The next line is Potassium followed by 100 and mg in lowercase. Right justified on the same line is 2 followed by a percent symbol. There is a thin rule under the potassium information that spans the width of the table.
The next line is Calcium followed by 300 and mg in lowercase. Right justified on the same line is 23 followed by a percent symbol. There is a thin rule below the calcium information that spans the width of the table.
The next line is Iron followed by 5 and mg in lowercase. Right justified on the same line is 28 followed by a percent symbol. There is a thick rule under the iron information that spans the width of the Nutrition Facts table.
The next line is the percent Daily Value footnote that was referred to at the beginning of the table description. The footnote starts with an asterisk followed by the statement: 5 percent symbol or less is a little, 15 percent symbol or more is a lot. The terms 'a little' and 'a lot' are in bold. This is the end of the Nutrition Facts table.
Tip: Use fresh or dried herbs and spices like garlic, ginger, onion and lemon and lime juice instead of salt to season your tofu.
Lentils (boiled)
Follow these 3 steps to find out how much sodium is in this food:
Step 1:
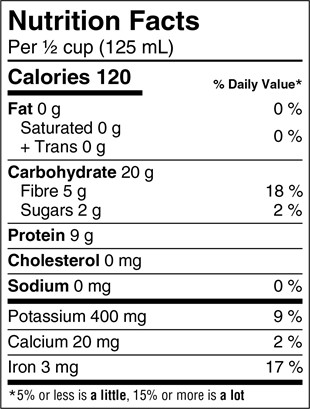
Look at the serving size on the nutrition facts table. The serving size for lentils is ½ cup (125 mL). Compare this amount to the quantity that you actually eat.
Step 2:
Read the % DV (Daily Value) on the food label. 5% DV or less is a little and 15 % DV or more is a lot.
Step 3:
Choose wisely. Look closely at the label to see if lentils have a little or a lot of sodium.
Lentils (boiled) - Text description
Shown here is a Nutrition Facts table. Left justified at the top of the table is the heading Nutrition Facts in bold. The next line is Per ½ cup open parenthesis 125 mL g close parenthesis. There is a thin rule below per ½ cup information that spans the width of the table. The next line is Calories in bold followed by 120, also in bold. Right justified on the same line is the subheading percent symbol Daily Value in bold. Percent Daily Value is followed by an asterisk that refers to a footnote at the bottom of the Nutrition Facts table. There is a thick rule under Calories that ends after the 120; it does not span the width of the table.
Left justified on the next line is Fat in bold followed by 0 and a lowercase g. Right justified on the same line is 0 followed by a percent symbol. Indented on the next line is Saturated followed by 0 and a lowercase g. Indented on the next line is a plus symbol followed by Trans, followed by 0 and a lowercase g. Right justified and vertically centered against the saturated and trans information on the left is 0 followed by a percent symbol. There is a thin rule below the trans information that spans the width of the table.
The next line is Carbohydrate in bold followed by 20 and a lowercase g. Indented on the next line is Fibre followed by 5 and a lowercase g. Right justified on the same line is 18 followed by a percent symbol. Indented on the next line is Sugars followed by 2 and a lowercase g. Right justified on the same line is 2 followed by a percent symbol. There is a thin rule under the sugars information that spans the width of the table.
The next line is Protein in bold followed by 9 and a lowercase g. There is a thin rule under the protein information that spans the width of the table.
The next line is Cholesterol, in bold followed by 0 and mg in lowercase. There is a thin rule under the cholesterol information that spans the width of the table.
The next line is Sodium in bold followed by 0 and mg in lowercase. Right justified on the same line is 0 followed by a percent symbol. There is a thick rule under the sodium information that spans the width of the table.
The next line is Potassium followed by 400 and mg in lowercase. Right justified on the same line is 9 followed by a percent symbol. There is a thin rule under the potassium information that spans the width of the table.
The next line is Calcium followed by 20 and mg in lowercase. Right justified on the same line is 2 followed by a percent symbol. There is a thin rule below the calcium information that spans the width of the table.
The next line is Iron followed by 3 and mg in lowercase. Right justified on the same line is 17 followed by a percent symbol. There is a thick rule under the iron information that spans the width of the Nutrition Facts table.
The next line is the percent Daily Value footnote that was referred to at the beginning of the table description. The footnote starts with an asterisk followed by the statement: 5 percent symbol or less is a little, 15 percent symbol or more is a lot. The terms 'a little' and 'a lot' are in bold. This is the end of the Nutrition Facts table.
Tip: Use dry legumes and lentils when possible - they need to be soaked overnight and boiled before use. If you buy legumes or lentils, rinse them well to wash out some of the sodium.
Use fresh or dried herbs and spices like garlic, ginger, onion and lemon and lime juice instead of salt to flavour your lentils.
Natural peanut butter
Follow these 3 steps to find out how much sodium is in this food:
Step 1:
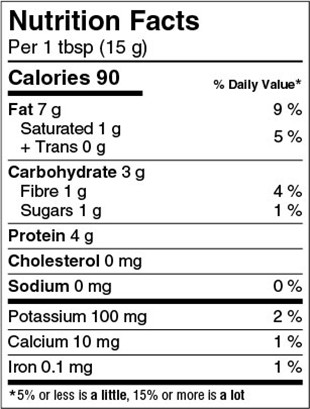
Look at the serving size on the nutrition facts table. The serving size for natural peanut butter is 1 tbsp (15 g). Compare this amount to the quantity that you actually eat.
Step 2:
Read the % DV (Daily Value) on the food label. 5% DV or less is a little and 15 % DV or more is a lot.
Step 3:
Choose wisely. Look closely at the label to see if natural peanut butter has a little or a lot of sodium.
Natural peanut butter - Text description
Shown here is a Nutrition Facts table. Left justified at the top of the table is the heading Nutrition Facts in bold. The next line is Per 1 tbsp open parenthesis 15 g close parenthesis. There is a thin rule below per 1 tbsp (15 g) information that spans the width of the table. The next line is Calories in bold followed by 90, also in bold. Right justified on the same line is the subheading percent symbol Daily Value in bold. Percent Daily Value is followed by an asterisk that refers to a footnote at the bottom of the Nutrition Facts table. There is a thick rule under Calories that ends after the 90; it does not span the width of the table.
Left justified on the next line is Fat in bold followed by 7 and a lowercase g. Right justified on the same line is 9 followed by a percent symbol. Indented on the next line is Saturated followed by 1 and a lowercase g. Indented on the next line is a plus symbol followed by Trans, followed by 0 and a lowercase g. Right justified and vertically centered against the saturated and trans information on the left is 5 followed by a percent symbol. There is a thin rule below the trans information that spans the width of the table.
The next line is Carbohydrate in bold followed by 3 and a lowercase g. Indented on the next line is Fibre followed by 1 and a lowercase g. Right justified on the same line is 4 followed by a percent symbol. Indented on the next line is Sugars followed by 1 and a lowercase g. Right justified on the same line is 1 followed by a percent symbol. There is a thin rule under the sugars information that spans the width of the table.
The next line is Protein in bold followed by 4 and a lowercase g. There is a thin rule under the protein information that spans the width of the table.
The next line is Cholesterol, in bold followed by 0 and mg in lowercase. There is a thin rule under the cholesterol information that spans the width of the table.
The next line is Sodium in bold followed by 0 and mg in lowercase. Right justified on the same line is 0 followed by a percent symbol. There is a thick rule under the sodium information that spans the width of the table.
The next line is Potassium followed by 100 and mg in lowercase. Right justified on the same line is 2 followed by a percent symbol. There is a thin rule under the potassium information that spans the width of the table.
The next line is Calcium followed by 10 and mg in lowercase. Right justified on the same line is 1 followed by a percent symbol. There is a thin rule below the calcium information that spans the width of the table.
The next line is Iron followed by 0.1 and mg in lowercase. Right justified on the same line is 1 followed by a percent symbol. There is a thick rule under the iron information that spans the width of the Nutrition Facts table.
The next line is the percent Daily Value footnote that was referred to at the beginning of the table description. The footnote starts with an asterisk followed by the statement: 5 percent symbol or less is a little, 15 percent symbol or more is a lot. The terms 'a little' and 'a lot' are in bold. This is the end of the Nutrition Facts table.