
Characteristics of patients with repeat emergency department visits for opioid-related harms in Alberta, Ontario and the Yukon
Table of contents
- Background
- Definitions included in this report
- Key findings
- In summary
- Acknowledgements
- Disclaimer
- Suggested citation
- Technical notes
- Appendix A
- References
Background
Canada is experiencing an overdose crisis driven by the toxic and illegal drug supply. In addition to ongoing surveillance, the Public Health Agency of Canada (PHAC) releases targeted analytical reports about specific substance-related harms topics to help fill knowledge gaps identified by stakeholders.
Emergency department (ED) visits for opioid-related harms, including opioid use disorders (OUDs) and opioid-related poisonings, frequently occur in Canada and have been increasing in recent years.Footnote 1 In 2016, there were an average of 12 opioid-related poisoning ED visits per day in Ontario, which increased to an average of 33 in 2022.Footnote 2 Similarly, in 2016 approximately 21 opioid-related ED visits (including both opioid-related poisonings and OUDs) were reported in Alberta each day, which increased to 43 opioid-related ED visits per day in 2023.Footnote 3
The number of people who frequently visit the ED for mental health conditions and substance use (not restricted to opioids) and addictive disorders is also on the rise.
- From April 2022 to March 2023, nearly one in ten Canadians visited the ED or an urgent care centre four or more times during this period.Footnote 4
- In Ontario, repeat ED visits (two or more times in a year) among adolescents and young adults have increased from 1,469 in 2008 to 3,291 in 2018.Footnote 5
With the increases in ED visits for opioid-related harms and repeated ED visits for mental health conditions and substance use and addictive disorders, it is important to describe the distribution and characteristics of individuals with repeat ED visits and the ED visits themselves. Frequent ED visits may indicate that these patients may not have access to, or may have difficulty accessing services or supports in their communities.
Findings can be used to improve the health of people who visit the ED for OUDs and opioid-related poisonings by informing:
- harm reduction interventions such as safe consumption sites
- treatment and recovery services and systems such as opioid agonist therapy
- prevention strategies such as improving community supports to help prevent ED visits for OUDs and opioid-related poisonings
The objectives of this analysis are to:
- compare repeat and single ED visits in a 12-month period between 2018 and 2022 in Alberta, Ontario and the Yukon for OUDs and opioid-related poisonings
- compare repeat and single ED visits in 2022 in Alberta, Ontario and the Yukon for OUDs and opioid-related poisonings
- describe repeat and single ED visits by visit characteristics:
- admittance by ambulance
- triage level/severity
- poisoning intention
- length of stay
- visit disposition
- describe repeat and single ED visits by patient sex and age
Definitions included in this report
Opioid use disorders (OUDs)
A mental or behavioural disorder related to the use of opioids, resulting in a pattern of opioid use that leads to clinically significant impairment or distress.Footnote 6
Opioid-related poisonings
An opioid poisoning harm (overdose) resulting from the use of one or multiple opioids in an accidental, intentional, or unknown manner.
Repeat emergency department (ED) visits
An emergency department visit for an opioid-related harm (that is, an opioid-related poisoning or OUD) that follows at least one other ED visit for the same reason as their earliest ED visit (that is, another opioid-related poisoning or OUD) in the previous 12 months.
More information on these definitions is available in the Technical notes section.
Key findings
Emergency department visit time trends in Alberta, Ontario and the Yukon
Opioid use disorders
From 2018 to 2022, repeat ED visits for OUDs increased in Alberta, Ontario and the Yukon (Figure 1a). Of all ED visits for OUDs, 2022 had the highest proportion of patients with repeat ED visits (34%). There may be an increasing trend in the annual proportion of patients with repeat ED visits compared to those with single ED visits for OUDs. The unadjusted odds ratio was 1.108 (95% confidence interval: 1.094, 1.122) which indicates that with each year, the odds of an individual having a repeat ED visit rather than a single ED visit increased by 11% (p < .001).
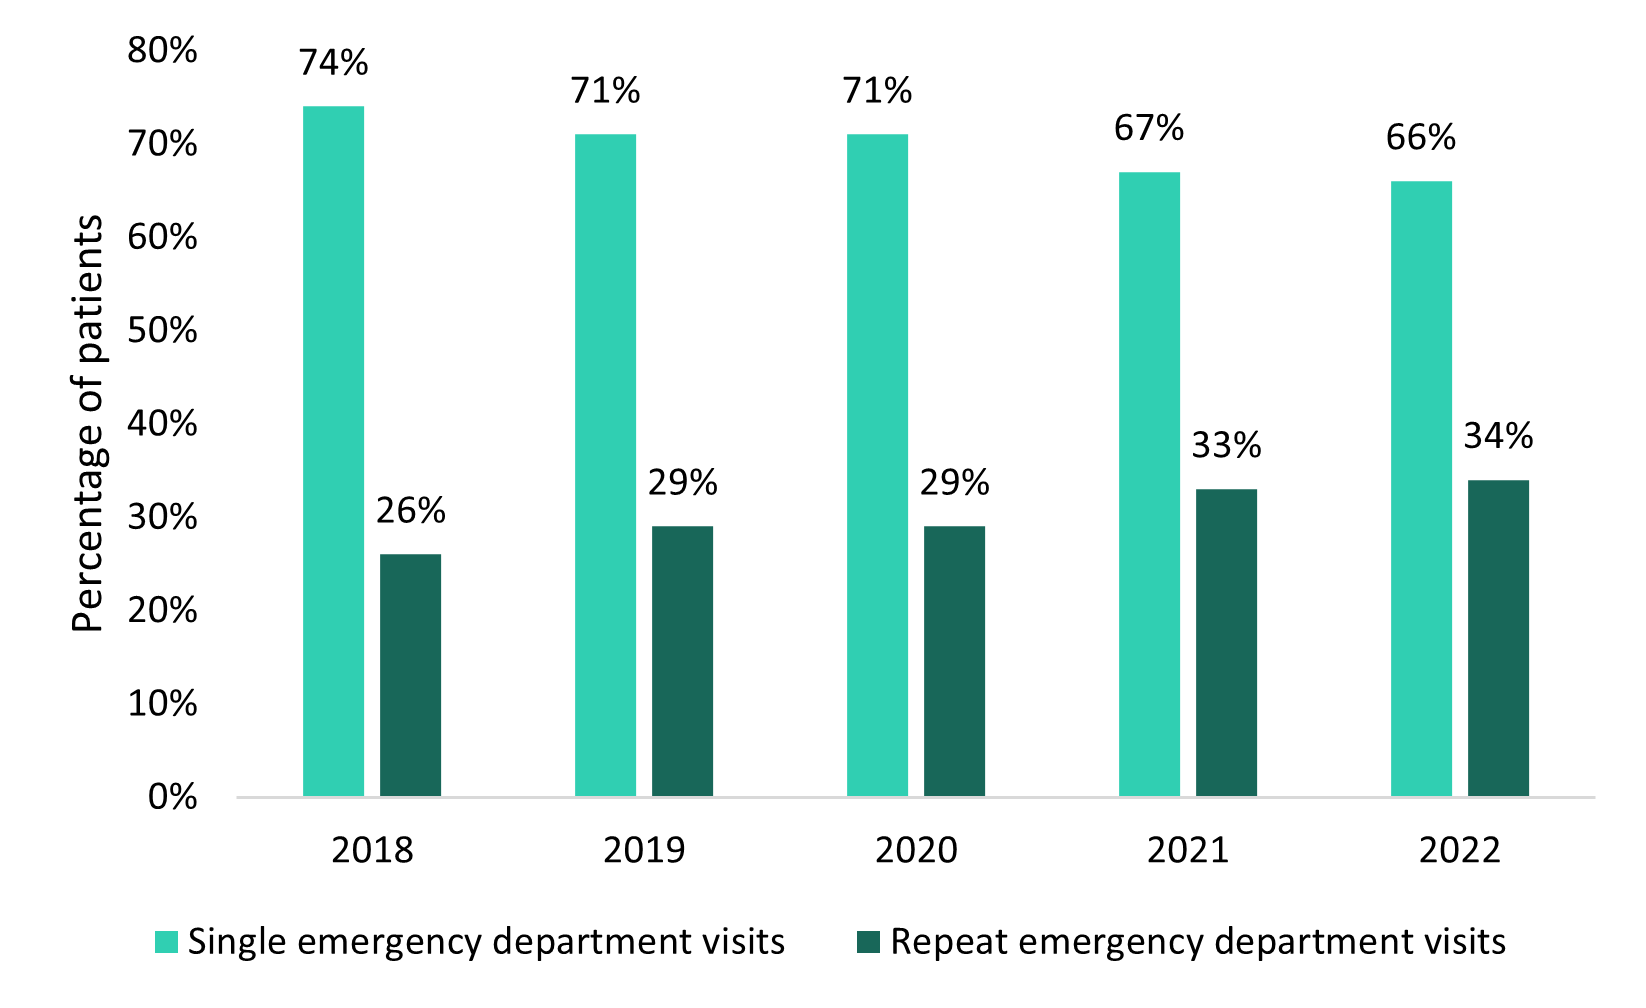
Figure 1a - Text description
| Year | Single emergency department visits for opioid use disorders |
Repeat emergency department visits for opioid use disorders |
||
|---|---|---|---|---|
| Number of patients |
Percentage of patients (%) |
Number of patients |
Percentage of patients (%) |
|
| 2018 | 7,642 | 74 | 2,626 | 26 |
| 2019 | 7,675 | 71 | 3,090 | 29 |
| 2020 | 8,073 | 71 | 3,364 | 29 |
| 2021 | 9,475 | 67 | 4,693 | 33 |
| 2022 | 8,197 | 66 | 4,244 | 34 |
Source: National Ambulatory Care Reporting System (NACRS) 2017-2022, Canadian Institute for Health Information (CIHI). |
||||
Opioid-related poisonings
From 2018 to 2022, repeat ED visits for opioid-related poisonings increased (Figure 1b). Of all ED visits for opioid-related poisonings, 2021 had the highest proportion of repeat ED visits (30%). There may be an increasing trend in the annual proportion of patients with repeat ED visits compared to those with single ED visits for opioid-related poisonings. The unadjusted odds ratio was 1.150 (95% confidence interval: 1.135, 1.165) which indicates that with each year, the odds of an individual having a repeat ED visit rather than a single ED visit increased by 15% (p < .001).
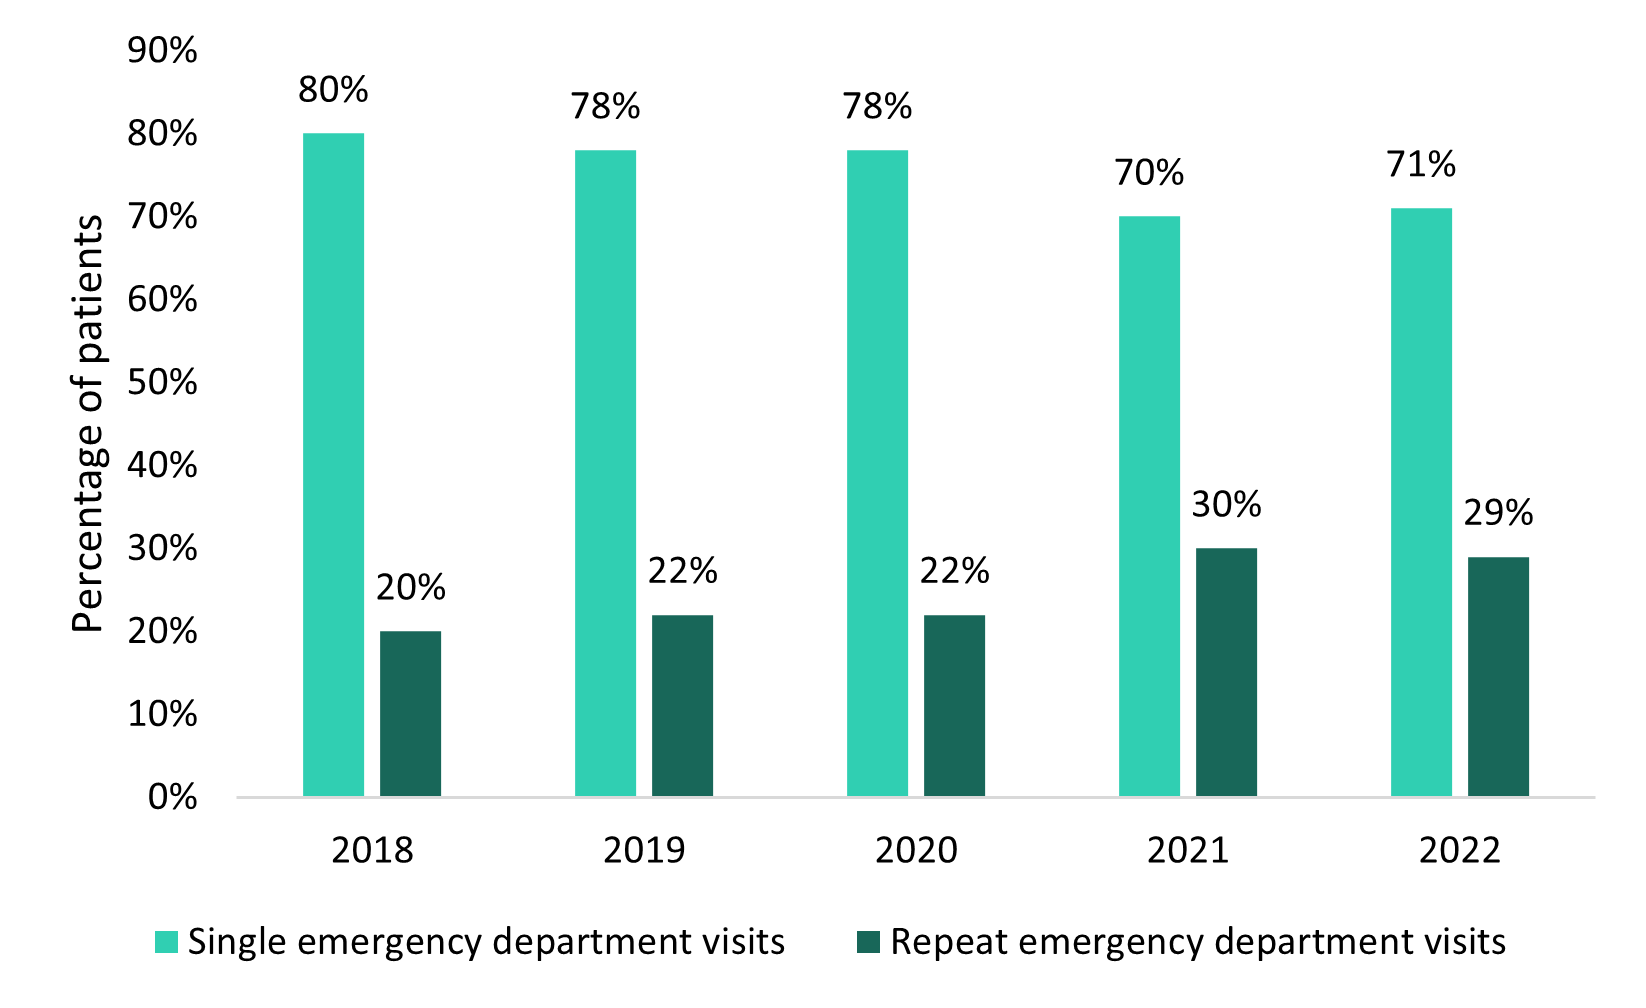
Figure 1b - Text description
| Year | Single emergency department visits for opioid-related poisonings |
Repeat emergency department visits for opioid-related poisonings |
||
|---|---|---|---|---|
| Number of patients |
Percentage of patients (%) |
Number of patients |
Percentage of patients (%) |
|
| 2018 | 8,975 | 80 | 2,290 | 20 |
| 2019 | 8,608 | 78 | 2,390 | 22 |
| 2020 | 9,936 | 78 | 2,873 | 22 |
| 2021 | 10,599 | 70 | 4,611 | 30 |
| 2022 | 8,796 | 71 | 3,523 | 29 |
Source: National Ambulatory Care Reporting System (NACRS) 2017-2022, Canadian Institute for Health Information (CIHI). |
||||
Comparing single and repeat emergency department visits in Alberta, Ontario and the Yukon in 2022
In 2022, there were more patients with repeat ED visits for OUDs (n = 4,244) than for opioid-related poisonings (n = 3,523; Figure 2). For OUDs, the proportion of patients with single ED visits (66%) was higher than repeat ED visits (34%). For opioid-related poisonings, the proportion of patients with single ED visits (71%) was higher than repeat ED visits (29%).
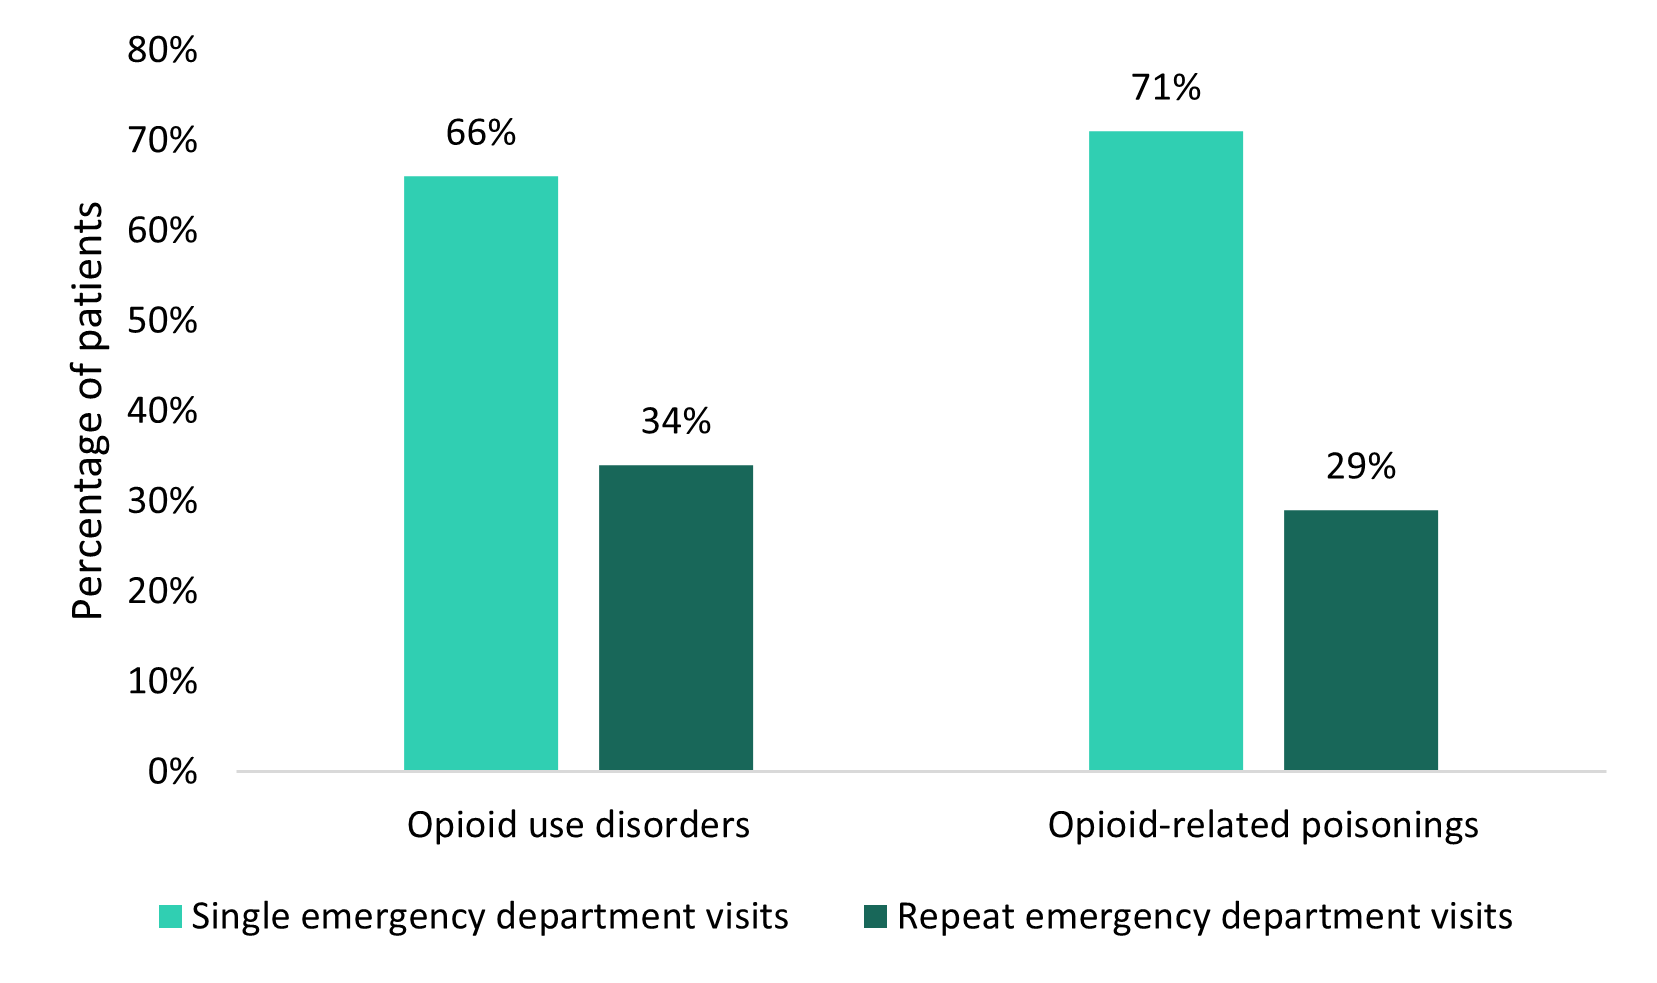
Figure 2 - Text description
| Reason for visit | Single emergency department visits | Repeat emergency department visits | ||
|---|---|---|---|---|
| Number of patients |
Percentage of patients (%) |
Number of patients |
Percentage of patients (%) |
|
| Opioid use disorders | 8,197 | 66 | 4,244 | 34 |
| Opioid-related poisonings | 8,796 | 71 | 3,523 | 29 |
Source: National Ambulatory Care Reporting System (NACRS) 2021-2022, Canadian Institute for Health Information (CIHI). |
||||
Admission via an ambulance
For OUDs in 2022, there was a slightly higher proportion of arrivals by ambulance among patients with single ED visits (50%) compared to the proportion of arrivals by ambulance among patients with repeat ED visits (46%). In contrast, for opioid-related poisonings, there were a higher proportion of arrivals via ambulance among patients with repeat ED visits (91%) than for single ED visits (86%).
Triage level
Opioid use disorders
In 2022, for both single (47%) and repeat (46%) ED visits, the highest proportion of patients was in the urgent category (conditions that could potentially progress to a serious issueFootnote 7; Table 1a).
| Triage level | Single emergency department visits for opioid use disorders |
Repeat emergency department visits for opioid use disorders |
||
|---|---|---|---|---|
| Number of patients |
Percentage of patients (%) |
Number of patients |
Percentage of patients (%) |
|
| Resuscitation | 276 | 3 | 111 | 3 |
| Emergent | 2,779 | 34 | 1,284 | 30 |
| Urgent | 3,794 | 47 | 1,936 | 46 |
| Semi-Urgent | 1,018 | 12 | 649 | 15 |
| Non-Urgent | 286 | 4 | 238 | 6 |
Notes: Counts within triage level may not align with total counts due to missing triage level. Source: National Ambulatory Care Reporting System (NACRS) 2021-2022, Canadian Institute for Health Information (CIHI). |
||||
Opioid-related poisonings
In 2022, for both single (56%) and repeat (57%) ED visits, the highest proportion of patients was in the emergent category (conditions that are a potential threat to life, limb, or functionFootnote 7; Table 1b).
| Triage level | Single emergency department visits for opioid-related poisonings |
Repeat emergency department visits for opioid-related poisonings |
||
|---|---|---|---|---|
| Number of patients |
Percentage of patients (%) |
Number of patients |
Percentage of patients (%) |
|
| Resuscitation | 1,392 | 16 | 454 | 13 |
| Emergent | 4,870 | 56 | 2,012 | 57 |
| Urgent | 2,304 | 26 | 948 | 27 |
| Semi-Urgent | 161 | 2 | 84 | 2 |
| Non-Urgent | 21 | 0 | 11 | 0 |
Notes: Counts within triage level may not align with total counts due to missing triage level. Source: National Ambulatory Care Reporting System (NACRS) 2021-2022, Canadian Institute for Health Information (CIHI). |
||||
Intention of opioid-related poisoning
In 2022, there was a higher proportion of accidental poisonings among patients with repeat ED visits (84%) compared to the proportion of accidental poisonings among patients with single ED visits (77%). There was a higher proportion of intentional poisonings among patients with single ED visits (14%) compared to the proportion of intentional poisonings among patients with repeat ED visits (6%). Lastly, the proportion of opioid-related poisonings classified as undetermined intent were similar among patients with single (9%) and repeat (10%) opioid-related poisoning ED visits.
Length of stay
In 2022, patients visiting the ED for OUDs had similar median lengths of stay for single and repeat ED visits with slightly longer stays for repeat ED visits. Patients visiting the ED for opioid-related poisonings also had similar median lengths of stay for single and repeat ED visits, but with slightly longer stays for single visits (Table 2).
| Reason for visit | Visit type | Median length of stay (hours) in the emergency department and IQR |
|---|---|---|
| Opioid use disorders | Single | 6.0 (IQR 3.2-11.8) |
| Repeat | 6.4 (IQR 3.4-13.3) | |
| Opioid-related poisonings | Single | 6.2 (IQR 3.5-11.0) |
| Repeat | 5.8 (IQR 3.2-9.7) | |
Notes: IQR = Interquartile range Source: National Ambulatory Care Reporting System (NACRS) 2021-2022, Canadian Institute for Health Information (CIHI). |
||
Visit disposition
Opioid use disorders
Visit disposition refers to the location the patient was discharged to or the status of the patient on discharge. In 2022, the highest proportion of patients were discharged home (59% for single ED visits; 57% for repeat ED visits) (Figure 3a). Among patients who were discharged home for OUDs, 3% of patients with single ED visits and 2% of patients with repeat ED visit were discharged home with support (meaning that they were discharged with supports from the community at home or referred to services).
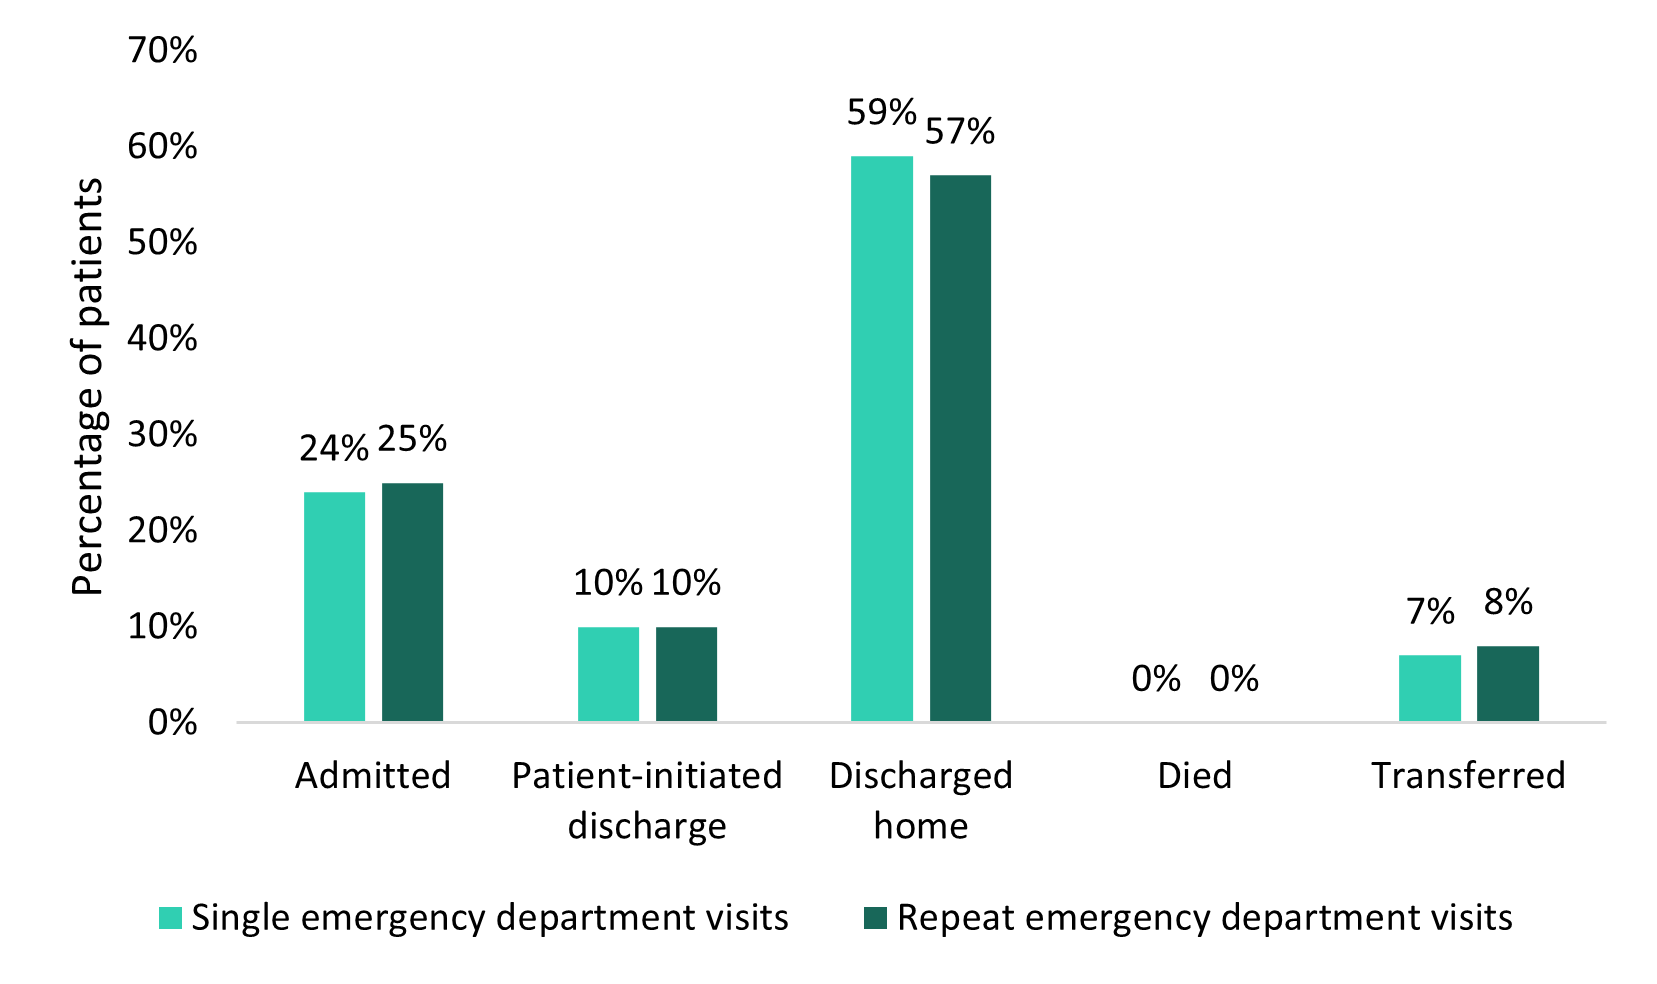
Figure 3a - Text description
| Visit disposition | Single emergency department visits for opioid use disorders | Repeat emergency department visits for opioid use disorders | ||
|---|---|---|---|---|
| Number of patients |
Percentage of patients (%) |
Number of patients |
Percentage of patients (%) |
|
| Admitted | 1,995 | 24 | 1,076 | 25 |
| Patient-initiated discharge | 813 | 10 | 412 | 10 |
| Discharged home | 4,807 | 59 | 2,404 | 57 |
| Died | 9 | 0 | 0 | 0 |
| Transferred | 573 | 7 | 352 | 8 |
Source: National Ambulatory Care Reporting System (NACRS) 2021-2022, Canadian Institute for Health Information (CIHI). |
||||
Opioid-related poisonings
In 2022, for both single and repeat ED visits, the highest proportion of patients were discharged home (58% and 62%, respectively). When comparing single to repeat ED visits, there was a higher proportion of patients with repeat ED visits who initiated discharge (15%), were discharged home (62%) and transferred (9%; for example, an intra-facility transfer) compared to the proportion of patients with single ED visits (11%, 58%, and 5% respectively; Figure 3b). There was a higher proportion of patients with single ED visits who were admitted, for instance as an inpatient to the reporting facility, compared to the proportion of patients with repeat ED visits (24% and 14%, respectively). Among patients who were discharged home for opioid-related poisonings, 2% of patients with single ED visits and 2% of patients with repeat ED visits, were discharged home with support.
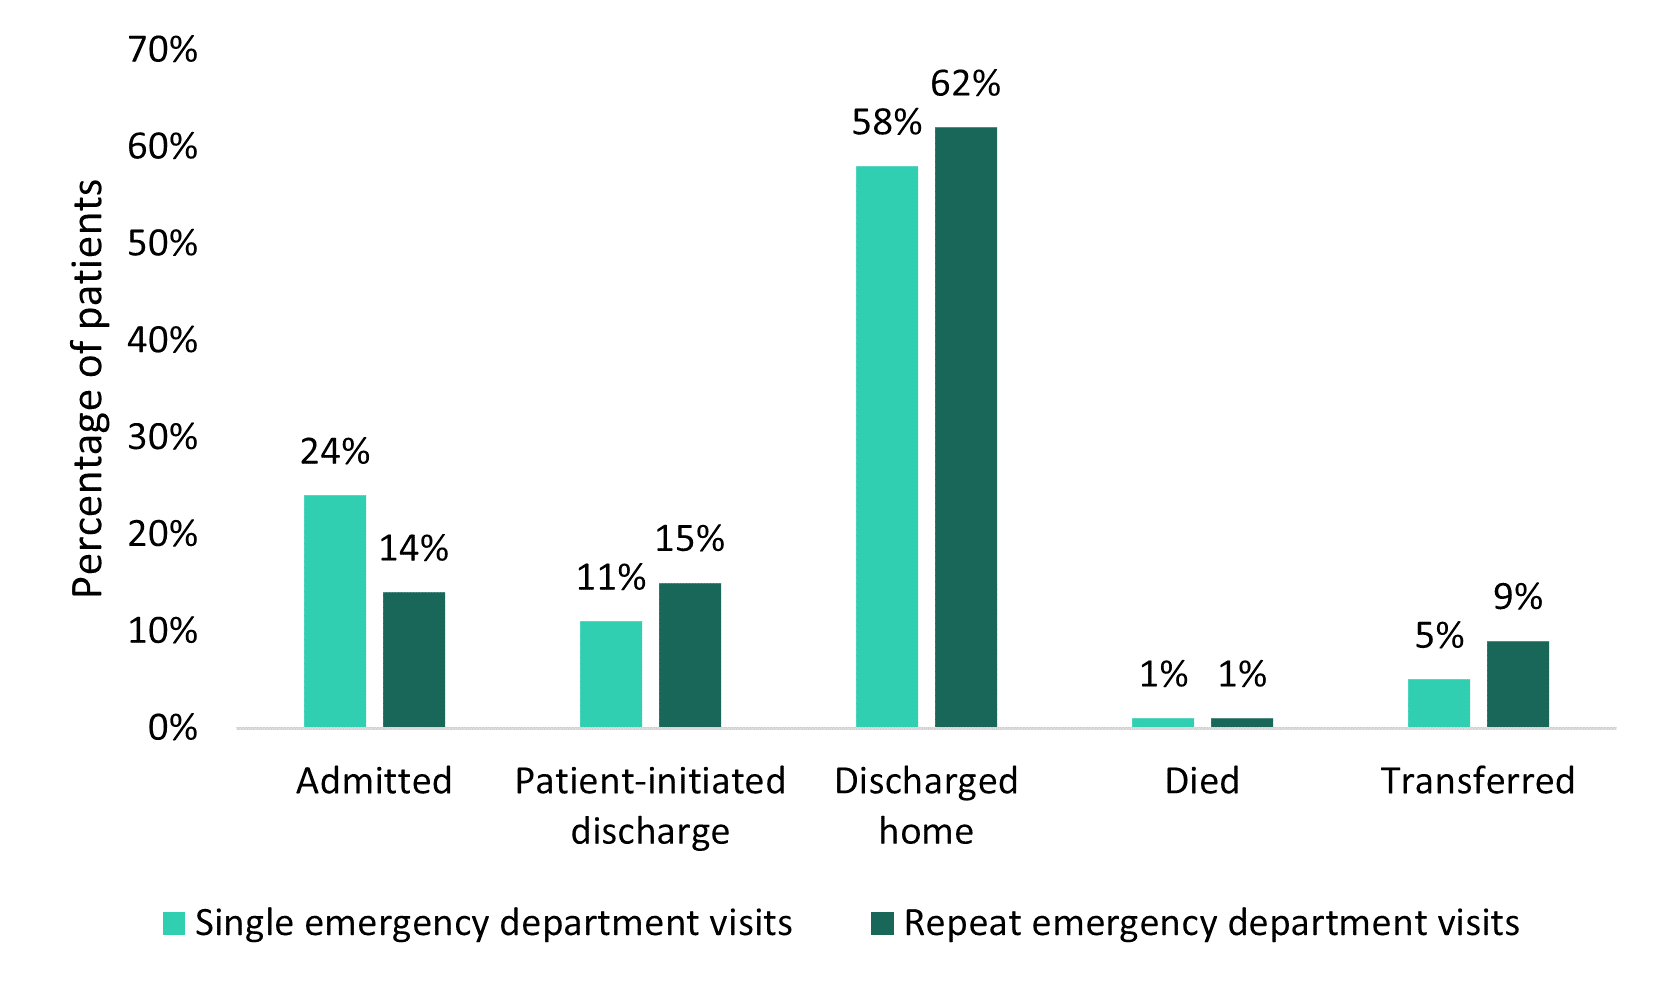
Figure 3b - Text description
| Visit disposition | Single emergency department visits for opioid-related poisonings | Repeat emergency department visits for opioid-related poisonings | ||
|---|---|---|---|---|
| Number of patients |
Percentage of patients (%) |
Number of patients |
Percentage of patients (%) |
|
| Admitted | 2,144 | 24 | 488 | 14 |
| Patient-initiated discharge | 977 | 11 | 513 | 15 |
| Discharged home | 5,125 | 58 | 2,190 | 62 |
| Died | 68 | 1 | 26 | 1 |
| Transferred | 482 | 5 | 306 | 9 |
Source: National Ambulatory Care Reporting System (NACRS) 2021-2022, Canadian Institute for Health Information (CIHI). |
||||
Sex
Opioid use disorders
For OUDs, in 2022, males had a higher proportion of single and repeat ED visits compared to females. The proportions of males and females were similar among patients with single ED visits and patients with repeat ED visits (Figure 4a).
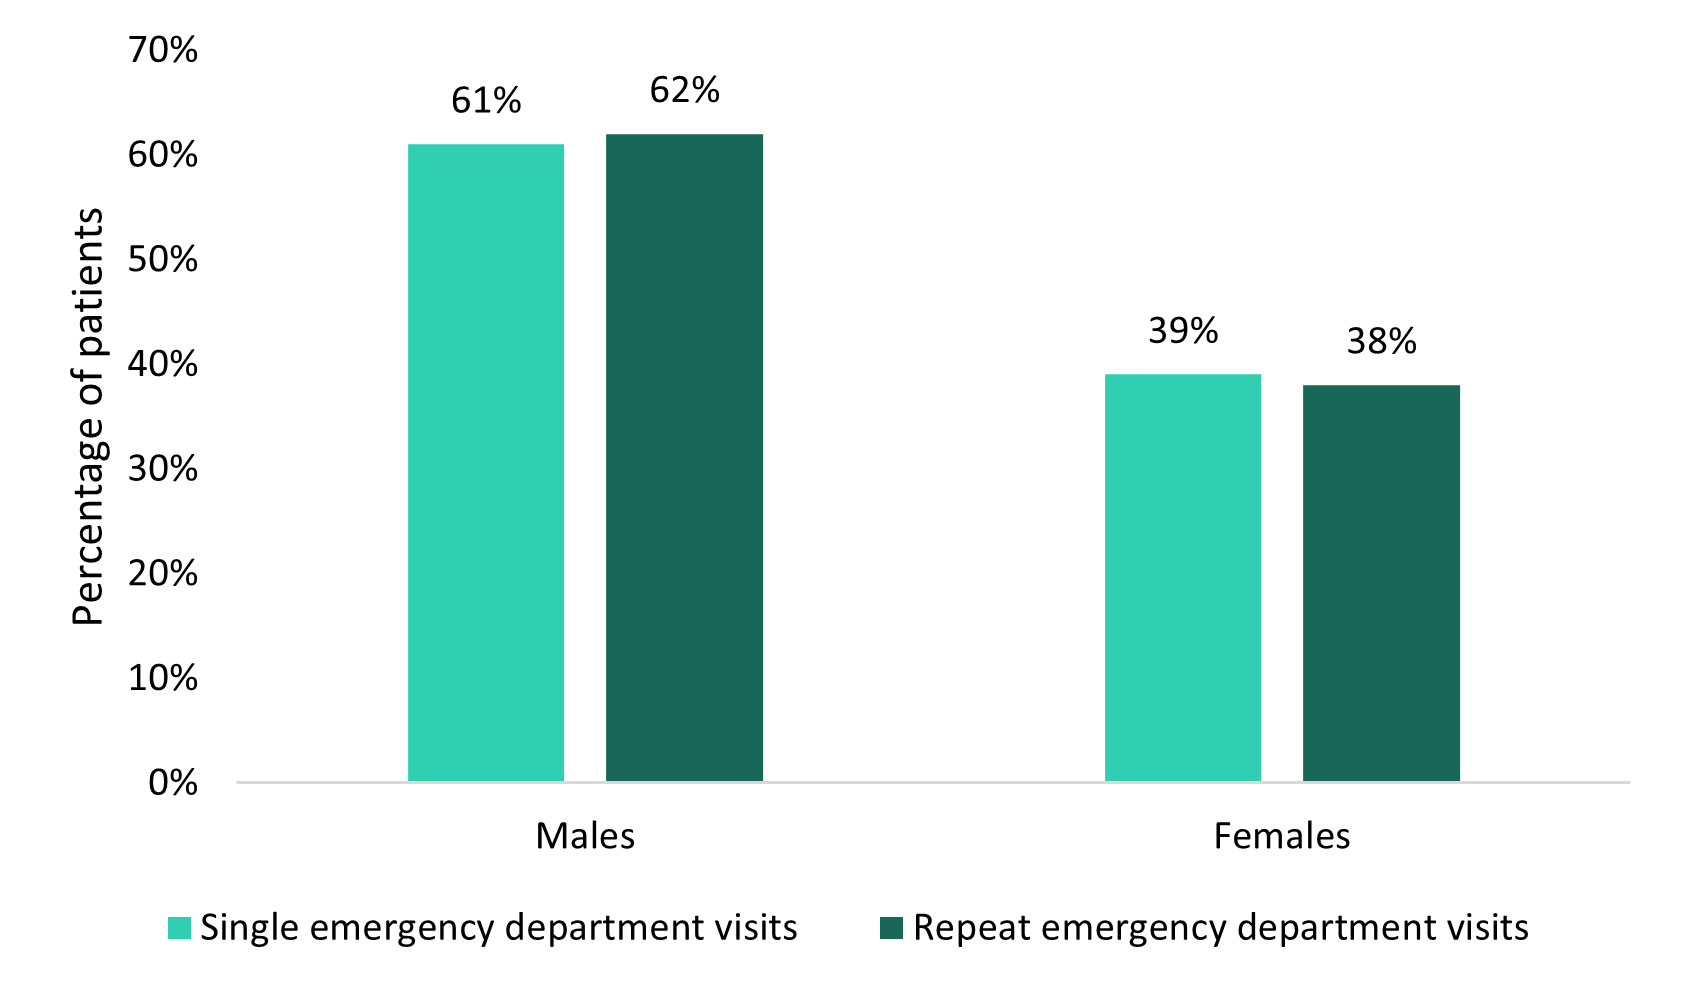
Figure 4a - Text description
| Sex | Single emergency department visits for opioid use disorders | Repeat emergency department visits for opioid use disorders | ||
|---|---|---|---|---|
| Number of patients |
Percentage of patients (%) |
Number of patients |
Percentage of patients (%) |
|
| Males | 4,981 | 61 | 2,629 | 62 |
| Females | 3,211 | 39 | 1,610 | 38 |
Notes: Counts may not align with total counts as the data do not include cases with missing, unknown or other sex. Source: National Ambulatory Care Reporting System (NACRS) 2021-2022, Canadian Institute for Health Information (CIHI). |
||||
Opioid-related poisonings
For opioid-related poisonings in 2022, males had a higher proportion of single and repeat ED visits compared to females. There was a higher proportion of males among patients with repeat ED visits compared to patients with single ED visits. There was a higher proportion of females among patients with single ED visits compared to patients with repeat ED visits (Figure 4b).
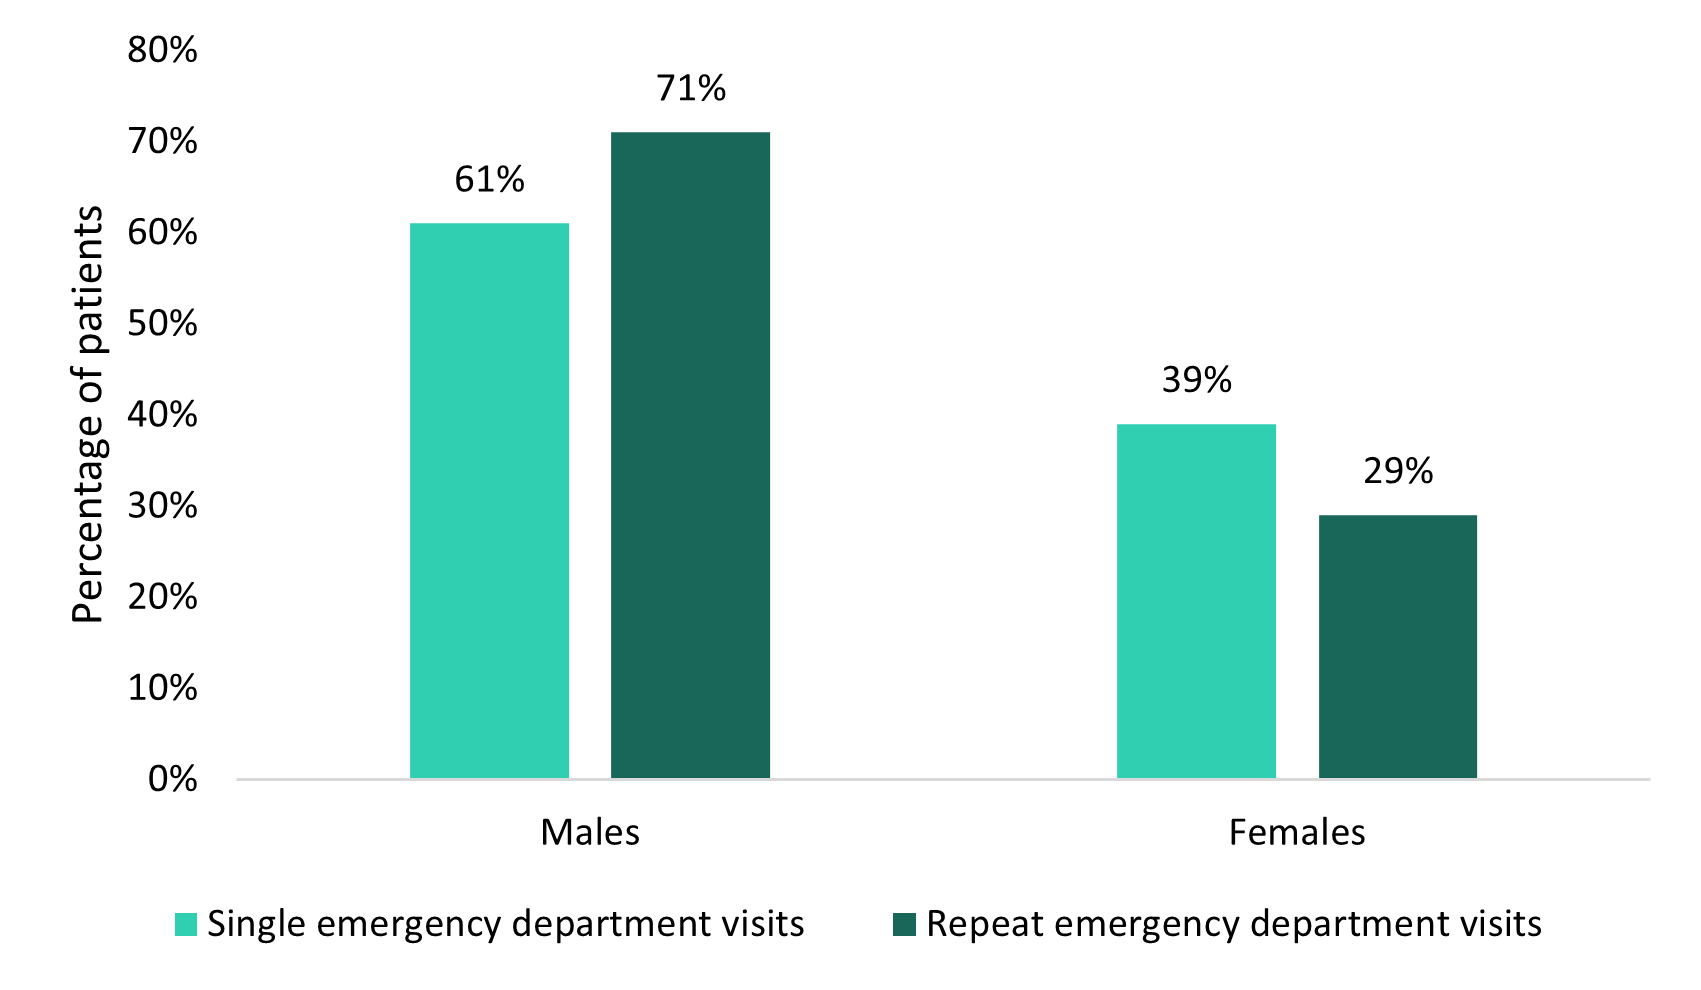
Figure 4b - Text description
| Sex | Single emergency department visits for opioid-related poisonings | Repeat emergency department visits for opioid-related poisonings | ||
|---|---|---|---|---|
| Number of patients |
Percentage of patients (%) |
Number of patients |
Percentage of patients (%) |
|
| Males | 5,379 | 61 | 2,504 | 71 |
| Females | 3,411 | 39 | 1,016 | 29 |
Notes: Counts may not align with total counts as the data do not include cases with missing, unknown or other sex. Source: National Ambulatory Care Reporting System (NACRS) 2021-2022, Canadian Institute for Health Information (CIHI). |
||||
Age
Opioid use disorders
In 2022, the highest proportion of patients was aged 30 to 39 (34% for single ED visits; 40% for repeat ED visits). There was a higher proportion of patients aged 30 to 39 with repeat ED visits than patients with single ED visits (Table 3a). There was a higher proportion of patients who were aged 60 or older with single ED visits than patients with repeat ED visits.
| Age group | Single emergency department visits for opioid use disorders |
Repeat emergency department visits for opioid use disorders |
||
|---|---|---|---|---|
| Number of patients |
Percentage of patients (%) |
Number of patients |
Percentage of patients (%) |
|
| 0 to 19 years | 248 | 3 | 70 | 2 |
| 20 to 29 years | 1,767 | 22 | 980 | 23 |
| 30 to 39 years | 2,816 | 34 | 1,707 | 40 |
| 40 to 49 years | 1,622 | 20 | 884 | 21 |
| 50 to 59 years | 970 | 12 | 418 | 10 |
| 60 years and older | 774 | 9 | 184 | 4 |
Notes: Counts may not align with total counts as the data do not include cases with missing age. Source: National Ambulatory Care Reporting System (NACRS) 2021-2022, Canadian Institute for Health Information (CIHI). |
||||
Opioid-related poisonings
In 2022, the highest proportion of patients was in the 30 to 39 age group (29% for single ED visits; 36% for repeat ED visits). There was a higher proportion of patients ages 20 to 29 and ages 30 to 39 with repeat ED visits than patients with single ED visits. There was a higher proportion of patients ages 0 to 19 and 60 and over with single ED visits than repeat ED visits (Table 3b).
| Age group | Single emergency department visits for opioid-related poisonings | Repeat emergency department visits for opioid-related poisonings | ||
|---|---|---|---|---|
| Number of patients |
Percentage of patients (%) |
Number of patients |
Percentage of patients (%) |
|
| 0 to 19 years | 506 | 6 | 105 | 3 |
| 20 to 29 years | 1,692 | 19 | 857 | 24 |
| 30 to 39 years | 2,547 | 29 | 1,274 | 36 |
| 40 to 49 years | 1,671 | 19 | 700 | 20 |
| 50 to 59 years | 1,220 | 14 | 412 | 12 |
| 60 years and older | 1,158 | 13 | 174 | 5 |
Notes: Counts may not align with total counts as the data do not include cases with missing age. Source: National Ambulatory Care Reporting System (NACRS) 2021-2022, Canadian Institute for Health Information (CIHI). |
||||
In summary
Canada continues to experience an overdose crisis, and understanding trends in healthcare utilization can help to inform opportunities for:
- prevention
- harm reduction interventions
- treatment and recovery services and systems
In particular, understanding the distribution and characteristics of patients with repeat ED visits for OUDs and opioid-related poisonings can help target interventions and prevention strategies based on sex, age, nature and intent of the harms, and visit disposition, which may also help inform public health care policies.
There has been an increase in the proportion of patients with repeat ED visits compared to those with single ED visits for both OUDs and opioid-related poisonings over time. This may suggest that some patients may not have access to the support they need, increasing the chance for subsequent visits.Footnote 8 Footnote 9 For instance, referrals for services and supports may not be available or accessible to people after their initial visit to the ED.Footnote 5 While evidence continues to build, EDs represent promising settings for the integration of services and supports such as harm reduction or initiation of opioid agonist therapies, depending on patient needs and goals.Footnote 10 Footnote 11
This study found that people experienced more repeat ED visits for OUDs than for opioid-related poisonings. As this study did not differentiate between the "main" and "other" reasons for the patient's ED visit, further analysis separating out the main reason and co-occurring events among patients that had an ED visit for an OUD would help to provide a more fulsome description of ED visits among patients with an OUD. Previous researchers have found that there are missed opportunities to initiate therapies, such as opioid agonist therapy, to prevent future mortality and morbidity in patients with OUD after an ED visit or hospital admission for opioid toxicity.Footnote 12 Among patients with repeat visits, there was a greater proportion of males and patients aged 30 to 39 years of age, for both OUDs and opioid-related poisonings, which may suggest that greater support is needed for these specific populations.
It would also be important to investigate how to best support frequent users of the healthcare system through:
- substance-use stigma reduction initiatives
- intervention efforts focused on improving the quality of substance-related services.Footnote 13
Acknowledgements
We recognize that the data in this report may represent stories of pain, grief and trauma. This report cannot adequately reflect the burden borne by Canadians. We acknowledge all those impacted by substance use, and those who work to save lives and reduce substance related harms on individuals and communities. We also acknowledge the Canadian Institute for Health Information (CIHI) for collecting and providing the data used in this report.
Disclaimer
Parts of this material are based on data and information compiled and provided by the Canadian Institute for Health Information. However, the analyses, conclusions, opinions, and statements expressed herein are those of the authors, and not necessarily those of CIHI.
Suggested citation
Characteristics of patients with repeat emergency department visits for opioid-related harms in Alberta, Ontario and the Yukon. Ottawa: Public Health Agency of Canada; March 2024. https://www.canada.ca/en/health-canada/services/opioids/data-surveillance-research/characteristics-patients-repeat-emergency-department-visits-opioid-related-harms-alberta-ontario-yukon.html
Technical notes
Methodology
The findings presented in this descriptive report only included closed year data (that is, finalized data) from the Canadian Institute for Health Information's National Ambulatory Care Reporting System (NACRS) between January 1st, 2017 and December 31st, 2022. NACRS contains data from provinces and territories where ED reporting is fully or partially mandated. This analysis only includes the provinces and territories with full coverage, which include Alberta, Ontario and the Yukon, representing approximately 50% of the Canadian population.Footnote 14 The province or territory reflects the location of the reporting facility where the ED visit occurred. ED visits include the visits to an ED that aren't scheduled or pre-registered for service (that is, true emergencies), and analyses were based on registration date.
To identify opioid-related poisonings and opioid use disorders (OUDs), International Classification of Diseases and Related Health Problems, Tenth Revision, Canada (ICD-10-CA) codes were used to group the codes identified in the NACRS datasets.
Data Analysis
Logistic regressions were used to calculate the probability of repeat ED visits compared to single ED visits occurring across time. Unadjusted odds ratios were presented; and no additional variables were controlled for.
Repeat emergency department visits
Patients with repeat ED visits were identified from their most recent ED visit for an opioid-related poisoning or OUD. If that patient had at least one other ED visit for the same reason as their first identified ED visit (meaning another opioid-related poisoning or opioid use disorder) in the previous 12 months, they were identified as having a repeat ED visit.
For example, if the patient visited an ED on March 1st, 2022, the look back period would extend to March 1st, 2021. If they did not have another ED visit for the same reason in the previous 12 months, they were identified as having a single ED visit. If a patient received a diagnosis for an opioid-related poisoning and an opioid use disorder within a single ED visit, they were counted in both opioid-related harm categories.
Opioid use disorders
The ICD-10-CA codes used to identify opioid use disorders in NACRS were F11: mental and behavioural disorders due to use of opioids.Footnote 15 The analysis includes Level 3 ED abstracts where mental and behavioural disorders due to the use of opioids were noted as either a "main" or "other" problem, as it is mandatory for Level 3 abstracts to capture diagnoses and interventions using codes from the ICD-10-CA.Footnote 16
The "main" problem is defined as the ICD-10-CA code that describes the one problem that is considered to be the most clinically significant reason for the patient's ED visit.Footnote 17"Other" problems are defined as ICD-10-CA codes that describe the patient's ED visit in addition to the "main" problem.Footnote 17
Opioid-related poisonings
A complete list of all ICD-10-CA codes used to identify opioid-related poisonings is available in Appendix A.Footnote 15 Information on opioid-related poisonings was extracted from patient charts by trained coders, which may be based on toxicological analysis, patient self-report, or both. This analysis includes Level 3 ED abstracts where opioid-related poisonings were noted as either a "main" or "other" problem, as it is mandatory for Level 3 abstracts to capture diagnoses and interventions using codes from the ICD-10-CA.Footnote 16
The "main" problem is defined as the ICD-10-CA code that describes the single problem that is considered to be the most clinically significant reason for the patient's ED visit.Footnote 17 "Other" problems are defined as ICD-10-CA codes that describe the patient's ED visit in addition to the "main" problem.Footnote 17
Intention
For all opioid-related poisonings, coders assign an external cause ICD-10-CA code from physician documentation where available to indicate the intention (meaning, the reason) for the poisoning.Footnote 17 Three groups are outlined by the ICD-10-CA.
Accidental
An opioid-related poisoning ED visit that is considered to be non-intentional in nature and is identified by an associated external cause ICD-10-CA code of X41, X42, or X45.
Intentional
An opioid-related poisoning ED visit that occurred as a result of purposely self-inflicted harm and is identified by an associated external cause ICD-10-CA code of X61, X62, or X65.
Undetermined
An opioid-related poisoning ED visit which has been documented to be of undetermined or unknown intention and is identified by an associated external cause ICD-10-CA code of Y11, Y12, or Y15.
Sex and age
Assigned sex at birth (for example, recorded on the original birth certificate) and age group were identified from the patient's most recent ED visit. Assigned sex at birth can be self-reported or clinician-recorded where it is clinically relevant. The records with unknown, missing, or other sex were excluded from the analysis of sex, but were included in other analyses. Age is recorded at the date of admission. The records with unknown or missing age were excluded from the analysis of age, but were included in other analyses.
Admit via ambulance
Admit via ambulance indicates whether or not the patient was brought to the ED by ambulance, including:
- Air ambulance (field value of A)
- Ground ambulance (field value of G)
- Combination of air and ground ambulances (field value of C).
Emergency department triage level
ED triage level categorizes the patient using the Canadian Triage Acuity Scale based on the type and severity of the patient's initial presenting signs and symptoms.Footnote 16 ED triage level was identified from the patient's most recent ED visit.
Five categories of ED triage level were investigated (ordered from most life threatening to least life threatening)Footnote 7 :
- Resuscitation (field value of 1): conditions that are threats to life or limb
- Emergent (field value of 2): conditions that are a potential threat to life, limb, or function
- Urgent (field value of 3): conditions that could potentially progress to a serious issue
- Semi-Urgent (field value of 4): conditions that show potential for deterioration
- Non-Urgent (field value of 5): conditions that may be acute but non-urgent
The records with unknown or missing triage levels were excluded from the analysis of ED triage level, but were included in other analyses.
Length of stay
Length of stay is calculated as the difference in hours between the registration date and time and the disposition date/time, for the patient's most recent ED visit.
Visit disposition
Visit disposition refers to the location where the patient was discharged to or the status of the patient on discharge. Visit disposition was identified from the patient's most recent ED visit. A total of five categories of ED disposition were investigated:
- Admitted: Identified by a field value of 06, 07, 08 or 09.
- Died: Identified by a field value of 10, 11, 71,72, 73 or 74.
- Discharged home: Identified by a field value of 01, 16 or 17.
- Transferred: Identified by a field value of 12, 13, 14, 15, 30, 40 or 90.
- Patient-initiated dischargeFootnote *: Identified by a field value of 02, 03, 04, 05, 61, 62, 63 or 64.
- Footnote *
-
This category includes patients that leave the emergency department after registration and before medical discharge. There are several reasons a patient may decide to leave including long wait times, mistreatment from a healthcare provider, they feel better, personal or family responsibilities, or their preferred treatment options (like safe supply) may not be available at the hospital.
Limitations
- This descriptive report presents differences between single and repeat ED visits by patient demographics and ED visit characteristics, but doesn't evaluate why these differences occur.
- The patient's reason for visit was captured as either a "main" or "other" problem, but no differentiation was made between them.
- Besides an opioid use disorder or opioid-related poisoning, patients could have received care for other reasons while visiting the ED. Some visit characteristics could have been influenced by these other diagnoses and not necessarily the opioid-related harm.
- Patient demographics and ED visit characteristics are based on the patient's most recent ED visit in 2022, and do not represent previous ED visits.
- The trend data on ED visits in this report include ED visits during the COVID-19 pandemic in Canada. The pandemic could have led to changes in ED practices and differences in the frequency of single and repeat ED visits compared to pre- and post-pandemic levels.
- Opioid-related poisonings are classified as accidental unless there is clear documentation of intentional self-harm or undetermined intention.Footnote 18 This may reflect an overrepresentation of accidental poisonings.
- Determining intention can rely on self-reported information which patients may not be willing to disclose due to various reasons, or unable to due to disability or death.
- This analysis reports on assigned sex at birth and doesn't report on gender identity. It also doesn't include any individuals who are not recorded as male or female (such as "other" sex or unknown), due to low numbers.
- Data released by provinces and territories may differ from the data provided in this report due to:
- the availability of updated data
- differences in the type of data reported
- use of alternate case definitions
- differences in time periods presented
- differences in population estimates used for calculations
- other factors
- Patients with unknown or invalid health card numbers were excluded from this analysis, as they couldn't be linked to their past ED visits.
- Only provinces and territories that had mandatory or conditional mandatory field completion were included in the analyses. All provinces and territories, other than Alberta, Ontario and the Yukon were excluded.
- Data in this report do not capture people who experienced opioid-related harms who did not visit the ED, which may underestimate the extent of opioid harms in Alberta, Ontario and the Yukon.
- Since this report only focused on opioids, if an opioid-related harm was misclassified as a substance other than an opioid, it would not have been included in this report.
Appendix A
| Substance | Poisoning ICD-10-CA codes and descriptions |
|---|---|
| Opioids |
|