
Update on Sexually Transmitted Infections in Canada, 2016
Download the alternative format
(PDF format, 1.3 MB, 28 pages)
Organization: Public Health Agency of Canada
Published: 2019-02-11
Cat.: HP40-228/2018F-PDF
ISBN: 978-0-660-28215-2
Pub.: 180352
Table of Contents
- Foreword
- Acknowledgements
- Abbreviations
- 1.0 Introduction
- 2.0 Methods
- 3.0 Chlamydia
- 4.0 Gonorrhea
- 5.0 Infectious Syphilis
- 6.0 Conclusion
- Appendix A: Reported Rates of Chlamydia Per 100,000 Population in Canada, by Sex and Age Group, CNDSS, 2007-2016
- Appendix B: Reported Rates of Gonorrhea Per 100,000 Population in Canada, by Sex and Age Group, CNDSS, 2007-2016
- Appendix C: Reported Rates of Infectious Syphilis Per 100,000 Population in Canada, by Sex and Age Group, CNDSS, 2007-2016
- References
Foreword
The Centre for Communicable Diseases and Infection Control, Public Health Agency of Canada (PHAC), is pleased to present the Update on Sexually Transmitted Infections in Canada, 2016. This report is intended to provide information on trends in cases and rates of chlamydia, gonorrhea, infectious syphilis and congenital syphilis over 2007-2016 to those who require surveillance data including program managers, policy makers, researchers, and others.
Chlamydia, gonorrhea and syphilis are notifiable sexually transmitted infections in Canada. The rates of these three infections have been rising since the late 1990s and continue to be a significant public health concern in Canada. Sexually transmitted infections may have serious consequences on the sexual, reproductive and overall health of individuals and can represent an important burden on the healthcare system.
The Update on Sexually Transmitted Infections in Canada, 2016 is based on surveillance data reported to the Canadian Notifiable Disease Surveillance System (CNDSS) by provincial and territorial health authorities.
Any comments and suggestions that would improve the usefulness of future publications are appreciated and should be sent to the attention of the staff of the Centre for Communicable Diseases and Infection Control, Public Health Agency of Canada at ccdic-clmti@phac-aspc.gc.ca .
Acknowledgements
The publication of this report would not have been possible without the collaboration of epidemiological units in all provinces and territories, whose continuous contribution to national sexually transmitted infection surveillance is gratefully appreciated.
This report was prepared by the Centre for Communicable Diseases and Infection Control, Infectious Disease Prevention and Control Branch, Public Health Agency of Canada.
Abbreviations
- AB
- Alberta
- BC
- British Columbia
- CNDSS
- Canadian Notifiable Disease Surveillance System
- MB
- Manitoba
- NB
- New Brunswick
- NL
- Newfoundland and Labrador
- NS
- Nova Scotia
- NT
- Northwest Territories
- NU
- Nunavut
- ON
- Ontario
- PE
- Prince Edward Island
- PHAC
- Public Health Agency of Canada
- QC
- Quebec
- SK
- Saskatchewan
- STBBI
- Sexually Transmitted and Blood-borne Infection
- STI
- Sexually Transmitted Infection
- YK
- Yukon
1.0 Introduction
Sexually transmitted infections (STIs) continue to be a significant public health concern in Canada. The rate of reported cases of STIs has been steadily increasing since 1997 due to a variety of reasons including improved screening and testing as well as changes in behaviours and in social norms (1-3). In July 2018, the Public Health Agency of Canada released a Pan-Canadian Sexually Transmitted and Blood-borne Infection (STBBI) Framework for Action that provides a vision, strategic goals and guiding principles to address STBBIs in Canada across all sectors and to contribute to the global efforts to eliminate STBBIs as major health concerns (4).
Apart from HIV, there are three reportable STIs in Canada: chlamydia, gonorrhea and syphilis. The reported rate of chlamydia is the highest, followed by gonorrhea and syphilis, respectively.
This summary provides an update of these STI rates and number of reported cases in Canada for 2016. It also describes trends in the number of reported cases and rates by age group, sex and province and territory from 2007 to 2016.
2.0 Methods
2.1 Data Sources
Chlamydia has been nationally notifiable since 1991 while gonorrhea and syphilis have been notifiable since 1924. Provincial and territorial health authorities provide non-nominal data on laboratory-confirmed cases to the Public Health Agency of Canada (PHAC) through the Canadian Notifiable Disease Surveillance System (CNDSS). All cases adhered to national case definitions (1-3). Variables submitted along with the diagnosis include age at time of diagnosis, sex, year of diagnosis and province/territory of diagnosis. The received data are validated in collaboration with the corresponding province or territory. Data from January 1 to December 31, 2016, were available from all provinces and territories and were extracted from the CNDSS in May 2018, along with updated historical data from 2007 to 2015.
2.2 Data Analysis
Descriptive analysis was performed using Microsoft Excel. All stages of syphilis are notifiable but only infectious stages (primary, secondary, and early latent) and congenital syphilis were included in this summary. National annual rates of reported cases of chlamydia, gonorrhea and infectious syphilis were computed using the number of cases from the CNDSS as numerators, and Statistics Canada July 2017 yearly population estimates as denominators. Age group, sex and province/territory-specific rates were also calculated. For all years, rates were given per 100,000 population. For congenital syphilis, rates were computed per 100,000 live births. Rates, percentages, and percent change in rates were calculated using unrounded numbers. Thus, numbers presented may differ from calculations based on rounded numbers. No statistical procedures were used for comparative analyses. Small numbers are more susceptible to change therefore corresponding rates should be interpreted with caution. Previous reports may present different rates for some years due to reporting delays, to data being updated from provinces and territories or to improvements in data cleaning and validation.
3.0 Chlamydia
Between 2007 and 2016, the number of reported cases and rates of chlamydia have steadily risen, excluding a decrease observed in 2013. The number of reported cases increased from 73,937 in 2007 to 121,244 in 2016, corresponding to an increase in rates of 49% during this period (from 224.8 to 334.3 per 100,000 population).
3.1 Sex
In 2016, females consisted of 61% of all cases. Over the 2007 to 2016 time frame, females have consistently reported higher rates of chlamydia compared to males (Figure 1). However, from 2007 to 2016, rates in males rose at a faster rate, with a 69% increase seen among males (from 154.3 to 261.0 per 100,000 population) compared to a 40% increase among females (from 290.6 to 405.6 per 100,000 population).
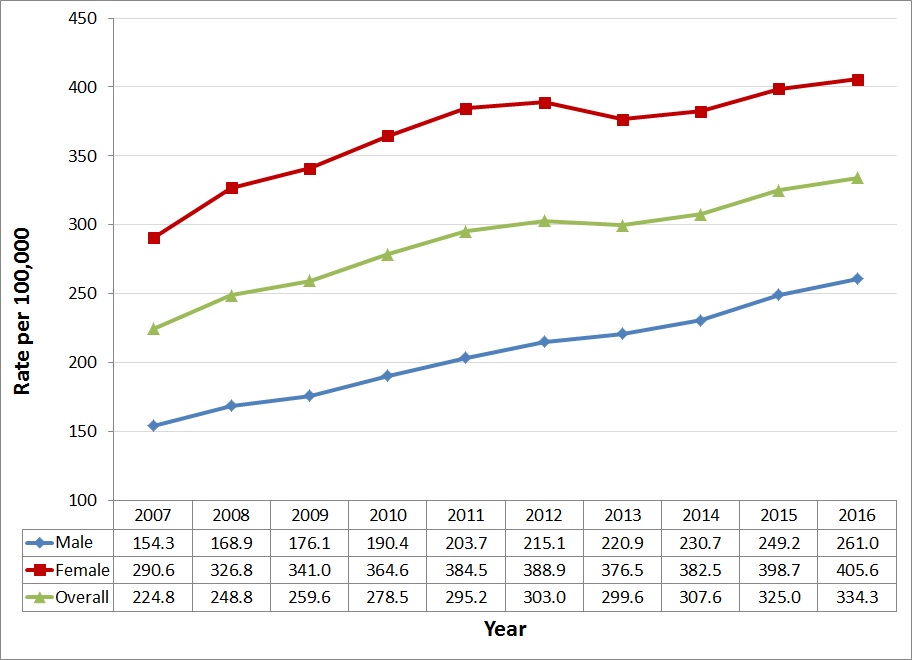
Figure 1 - Text description
This graph presents the overall rates and sex-specific rates of reported chlamydia cases, between 2007 and 2016 in Canada. The horizontal axis shows the calendar years from 2007 to 2016. The vertical axis shows the rate of reported chlamydia cases per 100,000 people for male, female, and overall.
Year |
Rates | ||
|---|---|---|---|
| Male | Female | Overall | |
| 2007 | 154.3 | 290.6 | 224.8 |
| 2008 | 168.9 | 326.8 | 248.8 |
| 2009 | 176.1 | 341.0 | 259.6 |
| 2010 | 190.4 | 364.6 | 278.5 |
| 2011 | 203.7 | 384.5 | 295.2 |
| 2012 | 215.1 | 388.9 | 303.0 |
| 2013 | 220.9 | 376.5 | 299.6 |
| 2014 | 230.7 | 382.5 | 307.6 |
| 2015 | 249.2 | 398.7 | 325.0 |
| 2016 | 261.0 | 405.6 | 334.3 |
3.2 Age Group
In 2016, the highest rates reported were in the 15-19, 20-24 and 25-29 year age groups (Figure 2). Overall, cases in the 15-29 year age groups consisted of 76% of the total reported cases of chlamydia in 2016, as observed in 2015, although they represented only 19% of the total population.
Female cases were younger than male cases: among female cases, 81% were 15-29 years old while 68% of male cases were in these age groups. Female rates were higher than male rates in all age groups except those aged 40 and over (Figure 2). Male and female rates were similar in the 30-39 year age group.
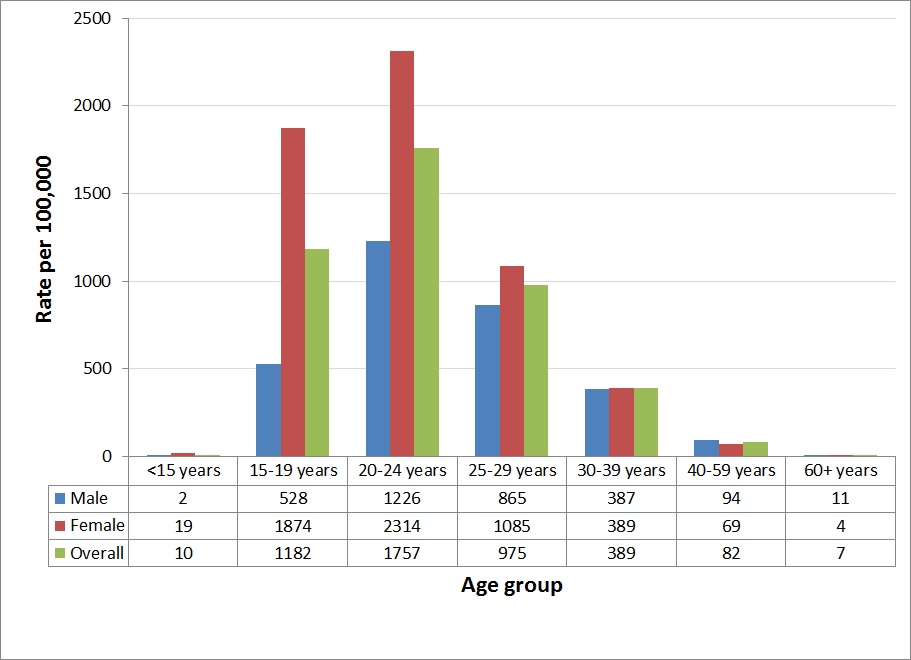
Figure 2 - Text description
This graph presents the rates of reported chlamydia cases by sex and age group, in 2016 in Canada. The horizontal axis shows the age groups from under 15 years old to 60 years old and over. The vertical axis shows the rate of reported chlamydia cases per 100,000 people for male, female, and overall.
| Age groups | Rates | ||
|---|---|---|---|
| Male | Female | Overall | |
| <15 years | 1.9 | 19.2 | 10.3 |
| 15-19 years | 527.6 | 1,874.2 | 1,182.2 |
| 20-24 years | 1,226.0 | 2,314.3 | 1,756.7 |
| 25-29 years | 865.4 | 1,085.4 | 975.4 |
| 30-39 years | 386.6 | 389.2 | 388.6 |
| 40-59 years | 94.1 | 69.3 | 81.8 |
| 60+ years | 10.8 | 3.9 | 7.1 |
In the past ten years (2007-2016), there was an increase in chlamydia rates reported among all age groups. Notably, the age groups with the highest rates were not the ones with the highest rate increases in recent years. Despite the highest rates being reported in the 15-29 year age groups, the highest relative increases in rates were seen in the 40-59 year age group (up 135% from 34.9 to 81.8 per 100,000 population) and in the 60 and over age group (up 115% from 3.3 to 7.1 per 100,000 population).
Throughout 2007 to 2016, among males, the age groups with the highest rates were the 20-24 year age group followed by the 25-29 year age group (Figure 3) while the highest increases in rates were seen among those aged 40 and over. For females, the age group with the highest rates was the 20-24 year age group, followed by the 15-19 year age group (Figure 4). The highest increases in rates reported among females were also among those aged 40 years and over.
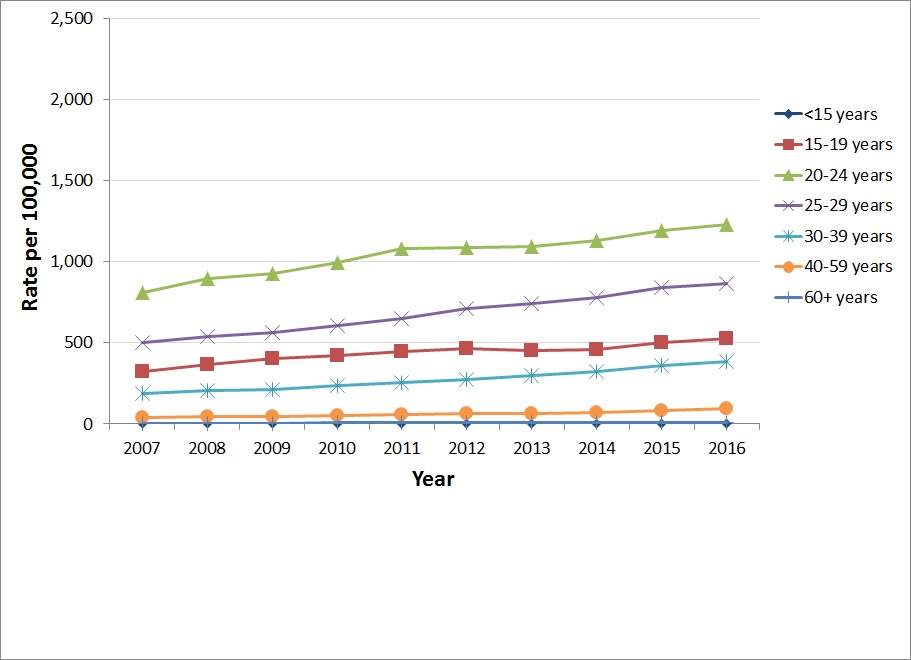
Figure 3 - Text description
This graph presents the rates of reported chlamydia cases by age group among males, between 2007 and 2016, in Canada. The horizontal axis shows the calendar years from 2007 to 2016. The vertical axis shows the rate of reported chlamydia cases per 100,000 people for all age groups.
| Year | Age groups | ||||||
|---|---|---|---|---|---|---|---|
| <15 years | 15-19 years | 20-24 years | 25-29 years | 30-39 years | 40-59 years | 60+ years | |
| 2007 | 1.9 | 320.4 | 808.5 | 500.8 | 188.7 | 41.5 | 5.1 |
| 2008 | 2.4 | 366.0 | 895.4 | 536.6 | 206.2 | 45.5 | 4.2 |
| 2009 | 2.5 | 401.8 | 924.0 | 562.2 | 210.9 | 47.1 | 5.0 |
| 2010 | 2.4 | 422.1 | 992.2 | 609.1 | 238.8 | 50.6 | 6.4 |
| 2011 | 2.2 | 446.4 | 1,078.3 | 651.7 | 252.8 | 56.1 | 6.0 |
| 2012 | 2.4 | 464.5 | 1,089.4 | 713.1 | 275.8 | 62.2 | 6.3 |
| 2013 | 2.3 | 452.3 | 1,092.2 | 743.9 | 297.8 | 66.8 | 7.7 |
| 2014 | 1.4 | 458.8 | 1,127.5 | 778.2 | 320.8 | 72.9 | 9.1 |
| 2015 | 1.9 | 504.4 | 1,192.8 | 839.7 | 357.1 | 83.3 | 10.1 |
| 2016 | 1.9 | 527.6 | 1,226.0 | 865.4 | 386.6 | 94.1 | 10.8 |
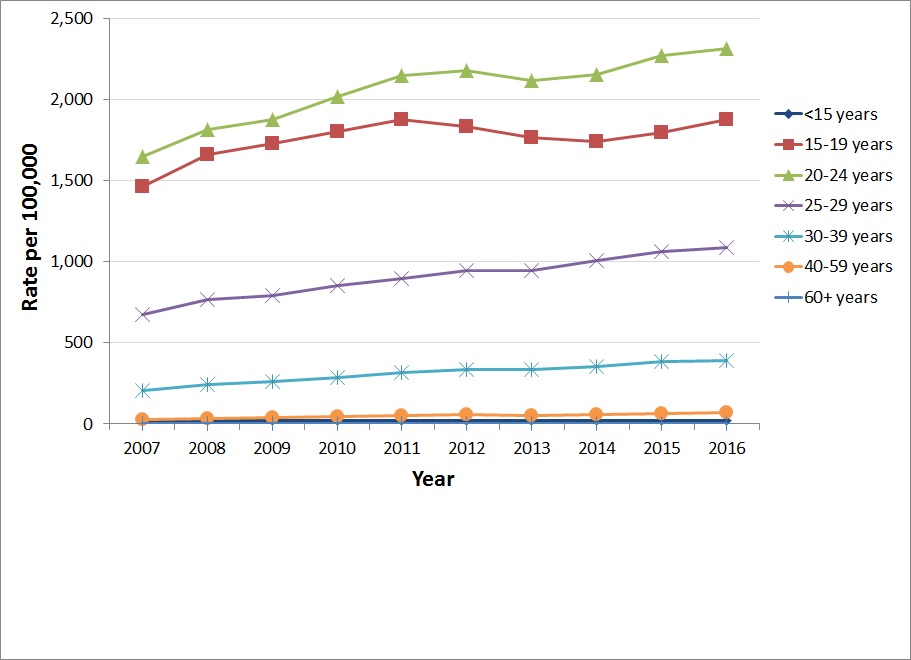
Figure 4 - Text description
This graph presents the rates of reported chlamydia cases by age group among females, between 2007 and 2016, in Canada. The horizontal axis shows the calendar years from 2007 to 2016. The vertical axis shows the rate of reported chlamydia cases per 100,000 people for all age groups.
| Year | Age groups | ||||||
|---|---|---|---|---|---|---|---|
| <15 years | 15-19 years | 20-24 years | 25-29 years | 30-39 years | 40-59 years | 60+ years | |
| 2007 | 18.3 | 1,461.8 | 1,646.2 | 676.6 | 205.7 | 28.2 | 1.8 |
| 2008 | 19.2 | 1,659.3 | 1,811.9 | 764.6 | 241.4 | 34.5 | 1.4 |
| 2009 | 20.9 | 1,728.7 | 1,874.2 | 788.0 | 261.9 | 40.1 | 2.2 |
| 2010 | 20.7 | 1,803.0 | 2,017.6 | 853.2 | 288.0 | 47.4 | 2.3 |
| 2011 | 21.8 | 1,876.4 | 2,146.9 | 895.8 | 317.7 | 50.6 | 3.0 |
| 2012 | 19.7 | 1,832.5 | 2,175.3 | 948.0 | 337.4 | 55.5 | 3.1 |
| 2013 | 20.9 | 1,762.8 | 2,113.1 | 944.7 | 332.4 | 53.7 | 2.4 |
| 2014 | 20.3 | 1,741.7 | 2,152.1 | 1,006.1 | 354.0 | 57.2 | 3.1 |
| 2015 | 20.8 | 1,794.1 | 2,271.5 | 1,061.5 | 384.8 | 64.5 | 3.0 |
| 2016 | 19.2 | 1,874.2 | 2,314.3 | 1,085.4 | 389.2 | 69.3 | 3.9 |
3.3 Geographic Distribution
In 2016, the provinces and territories with chlamydia rates higher than the national average of 334.3 per 100,000 population were: Nunavut (3,652.8 per 100,000 population), the Northwest Territories (1,981.3 per 100,000 population), Yukon (729.9 per 100,000 population), Manitoba (546.4 per 100,000 population), Saskatchewan (543.4 per 100,000 population), and Alberta (392.5 per 100,000 population) (Table 1 and Figure 5).
The provinces and territories with rates below the national average were: British Columbia (320.3 per 100,000 population), Nova Scotia (309.9 per 100,000 population), Quebec (305.7 per 100,000 population), Ontario (299.3 per 100,000 population), New Brunswick (256.9 per 100,000 population), Prince Edward Island (193.3 per 100,000 population), and Newfoundland and Labrador (181.8 per 100,000 population) (Table 1 and Figure 5). Over 2007-2016, all provinces and territories, except for Nunavut, observed an increase in their chlamydia rates.
| Province or Territory | OverallFootnote a | Male | Female | |||
|---|---|---|---|---|---|---|
| Number of cases | Rate | Number of cases | Rate | Number of cases | Rate | |
| British Columbia | 15,241 | 320.3 | 6,086 | 257.8 | 9,129 | 380.9 |
| Alberta | 16,628 | 392.5 | 6,525 | 303.8 | 10,103 | 483.8 |
| Saskatchewan | 6,242 | 543.4 | 2,281 | 393.8 | 3,961 | 695.6 |
| Manitoba | 7,202 | 546.4 | 2,633 | 401.3 | 4,565 | 689.5 |
| Ontario | 41,833 | 299.3 | 16,820 | 244.9 | 24,966 | 351.2 |
| Quebec | 25,439 | 305.7 | 9,584 | 231.7 | 15,771 | 376.8 |
| New Brunswick | 1,946 | 256.9 | 675 | 180.3 | 1,271 | 331.8 |
| Nova Scotia | 2,940 | 309.9 | 983 | 211.4 | 1,954 | 404.1 |
| Prince Edward Island | 289 | 193.3 | 84 | 115.2 | 205 | 267.8 |
| Newfoundland and Labrador | 964 | 181.8 | 340 | 130.0 | 624 | 232.1 |
| Yukon | 278 | 729.9 | 110 | 568.3 | 168 | 896.9 |
| Northwest Territories | 884 | 1,981.3 | 351 | 1,537.4 | 533 | 2,446.4 |
| Nunavut | 1,358 | 3,652.8 | 462 | 2,398.9 | 896 | 5,000.6 |
| Canada | 121,244 | 334.3 | 46,934 | 261.0 | 74,146 | 405.6 |
|
||||||
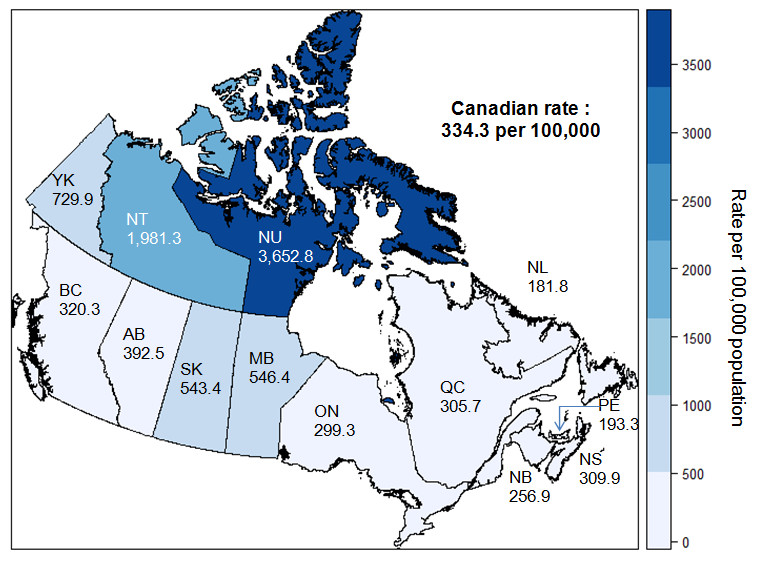
Figure 5 - Text description
This map presents the rates of reported chlamydia cases by province and territory in Canada, in 2016. The vertical axis shows the rate of reported chlamydia cases per 100,000 people in grading colors, corresponding to those on the map.
| Province or Territory | Rate |
|---|---|
| British Columbia | 320.3 |
| Alberta | 392.5 |
| Saskatchewan | 543.4 |
| Manitoba | 546.4 |
| Ontario | 299.3 |
| Quebec | 305.7 |
| New Brunswick | 256.9 |
| Nova Scotia | 309.9 |
| Prince Edward Island | 193.3 |
| Newfoundland and Labrador | 181.8 |
| Yukon | 729.9 |
| Northwest Territories | 1,981.3 |
| Nunavut | 3,652.8 |
| Canada | 334.3 |
4.0 Gonorrhea
Between 2007 and 2016, gonorrhea rates increased steadily, with the exception of a decrease in 2009. In total, there were 23,708 cases reported in 2016, almost double the 11,874 cases reported in 2007; this corresponds to an 81% increase in rates, from 36.1 to 65.4 per 100,000 population.
4.1 Sex
Over the 2007 to 2016 time frame, more males were diagnosed with gonorrhea compared to women and accounted for at least 55% of all cases each year. In 2016, males consisted of 64% of reported cases. From 2007 to 2016, rates in males nearly doubled (from 42.4 to 84.1 per 100,000 population) compared to a 56% increase in females (from 29.9 to 46.8 per 100,000 population) (Figure 6).
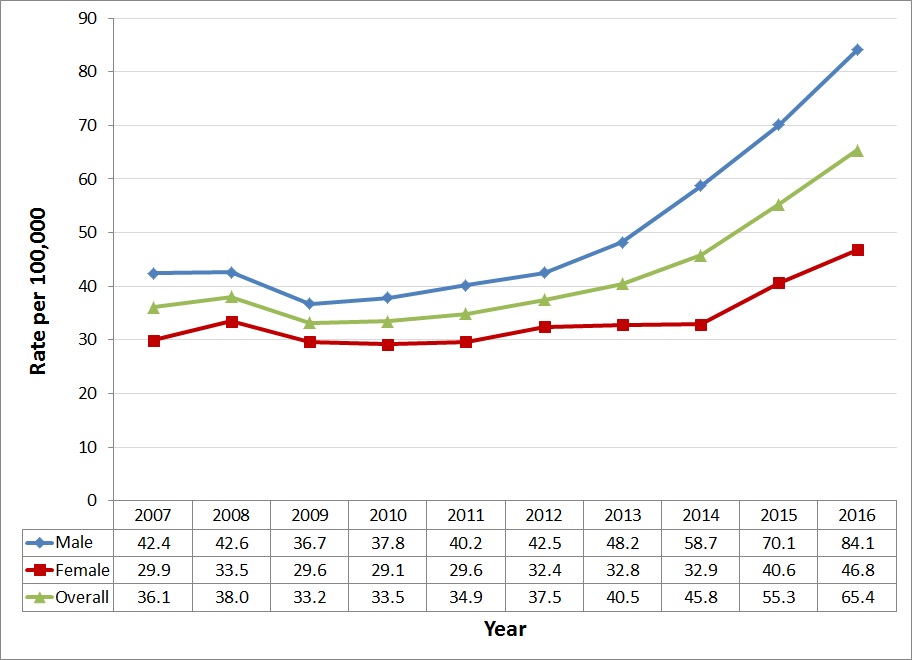
Figure 6 - Text description
This graph presents the overall rates and sex-specific rates of reported gonorrhea cases, between 2007 and 2016 in Canada. The horizontal axis shows the calendar years from 2007 to 2016. The vertical axis shows the rate of reported gonorrhea cases per 100,000 people for male, female, and overall.
| Year | Rates | ||
|---|---|---|---|
| Male | Female | Overall | |
| 2007 | 42.4 | 29.9 | 36.1 |
| 2008 | 42.6 | 33.5 | 38.0 |
| 2009 | 36.7 | 29.6 | 33.2 |
| 2010 | 37.8 | 29.1 | 33.5 |
| 2011 | 40.2 | 29.6 | 34.9 |
| 2012 | 42.5 | 32.4 | 37.5 |
| 2013 | 48.2 | 32.8 | 40.5 |
| 2014 | 58.7 | 32.9 | 45.8 |
| 2015 | 70.1 | 40.6 | 55.3 |
| 2016 | 84.1 | 46.8 | 65.4 |
4.2 Age Group
In 2016, the highest rates reported were in the 20-39 year age groups among males
and in the 15-29 year age groups among females (Figure 7). Reported gonorrhea rates for males were higher than female rates in all age groups except those aged 19 and younger. Overall, cases in the 15-39 year age groups consisted of 82% of the total reported cases of gonorrhea in 2016, although they represented only 33% of the total population.
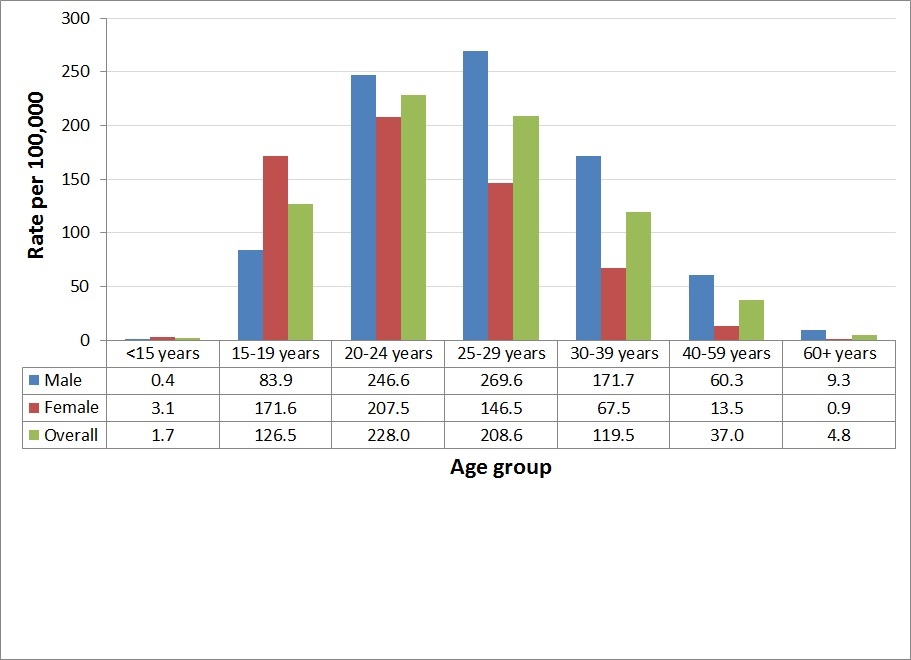
Figure 7 - Text description
This graph presents the rates of reported gonorrhea cases by sex and age group, in 2016 in Canada. The horizontal axis shows the age groups from under 15 years old to 60 years old and over. The vertical axis shows the rate of reported gonorrhea cases per 100,000 people for male, female, and overall.
| Age groups | Rates | ||
|---|---|---|---|
| Male | Female | Overall | |
| <15 years | 0.4 | 3.1 | 1.7 |
| 15-19 years | 83.9 | 171.6 | 126.5 |
| 20-24 years | 246.6 | 207.5 | 228.0 |
| 25-29 years | 269.6 | 146.5 | 208.6 |
| 30-39 years | 171.7 | 67.5 | 119.5 |
| 40-59 years | 60.3 | 13.5 | 37.0 |
| 60+ years | 9.3 | 0.9 | 4.8 |
In the past ten years (2007-2016), all age groups experienced an increase in rates except for children less than 15 years of age. Similar to chlamydia, the age groups with the highest overall rates were not the ones experiencing the highest relative increases in rates. The highest rates were among the 20-24 and 25-29 year age groups. However, the highest increase in overall rates was in the 30-39 year age group (160% from 46.0 to 119.5 per 100,000 population), followed by the 40-59 year age group (138% from 15.5 to 37.0 per 100,000 population) and the 60 and over age group (126% from 2.1 to 4.8 per 100,000 population).
Over 2007-2016, the highest rates reported among males were in the 20-24 and 25-29 year age groups (Figure 8). Among males, the greatest increase from 2007 to 2016 was seen in the 30-39 year age group (162% from 65.6 to 171.8 per 100,000 population).
For females, the two groups with the highest rates, the 20-24 year age group and the 15-19 year age group, had very similar rates for a large portion of this time frame (Figure 9). However, since 2011, the 20-24 year age group had higher rates than the 15-19 year age group. Among females, the largest increase was in the 40-59 year age group (244% from 3.9 to 13.5 per 100,000 population).
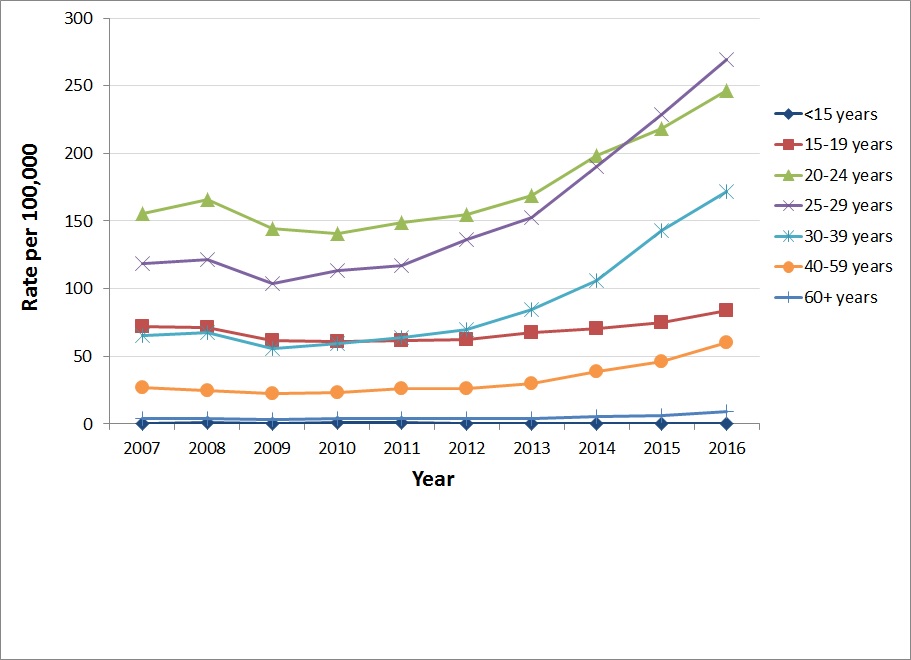
Figure 8 - Text description
This graph presents the rates of reported gonorrhea cases by age group among males, between 2007 and 2016, in Canada. The horizontal axis shows the calendar years from 2007 to 2016. The vertical axis shows the rate of reported gonorrhea cases per 100,000 people for all age groups.
| Year | Age groups | ||||||
|---|---|---|---|---|---|---|---|
| <15 years | 15-19 years | 20-24 years | 25-29 years | 30-39 years | 40-59 years | 60+ years | |
| 2007 | 0.4 | 72.2 | 155.3 | 118.5 | 65.6 | 27.1 | 4.2 |
| 2008 | 0.7 | 71.6 | 166.2 | 121.6 | 67.5 | 24.3 | 4.0 |
| 2009 | 0.4 | 61.9 | 144.4 | 104.0 | 55.8 | 22.4 | 3.2 |
| 2010 | 0.8 | 60.9 | 140.6 | 113.6 | 59.3 | 23.0 | 4.3 |
| 2011 | 0.7 | 62.0 | 149.0 | 117.1 | 64.1 | 26.0 | 4.3 |
| 2012 | 0.6 | 62.5 | 154.5 | 136.1 | 69.7 | 25.9 | 3.7 |
| 2013 | 0.6 | 67.4 | 168.8 | 152.6 | 84.4 | 29.8 | 4.2 |
| 2014 | 0.3 | 70.5 | 198.2 | 190.2 | 105.9 | 38.5 | 5.7 |
| 2015 | 0.5 | 75.1 | 218.2 | 229.1 | 142.6 | 45.8 | 6.3 |
| 2016 | 0.4 | 83.9 | 246.6 | 269.6 | 171.8 | 60.3 | 9.3 |
Figure 9. Rates of reported gonorrhea cases by age group among females, 2007-2016, Canada
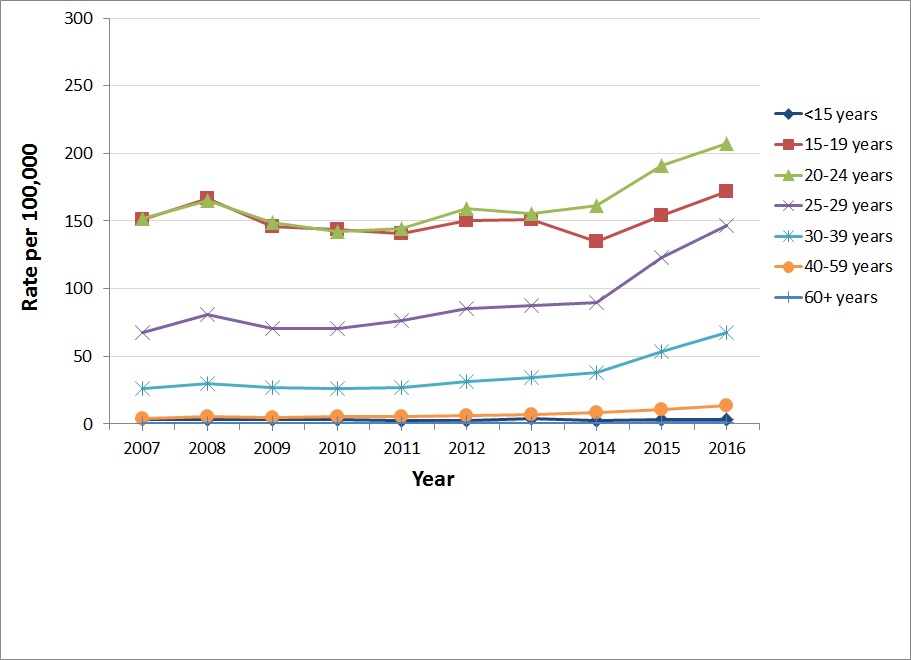
Figure 9 - Text description
This graph presents the rates of reported gonorrhea cases by age group among females, between 2007 and 2016, in Canada. The horizontal axis shows the calendar years from 2007 to 2016. The vertical axis shows the rate of reported gonorrhea cases per 100,000 people for all age groups.
| Year | Age groups | ||||||
|---|---|---|---|---|---|---|---|
| <15 years | 15-19 years | 20-24 years | 25-29 years | 30-39 years | 40-59 years | 60+ years | |
| 2007 | 3.5 | 150.8 | 151.6 | 67.8 | 26.2 | 3.9 | 0.4 |
| 2008 | 3.2 | 166.6 | 165.2 | 80.6 | 29.8 | 5.2 | 0.4 |
| 2009 | 3.0 | 146.2 | 149.2 | 70.4 | 26.6 | 4.4 | 0.4 |
| 2010 | 3.0 | 143.7 | 142.0 | 70.4 | 26.3 | 5.1 | 0.5 |
| 2011 | 2.5 | 140.8 | 144.7 | 76.5 | 27.1 | 5.7 | 0.5 |
| 2012 | 2.8 | 150.5 | 159.2 | 85.3 | 31.5 | 6.2 | 0.7 |
| 2013 | 3.7 | 151.1 | 155.5 | 87.4 | 34.6 | 6.9 | 0.3 |
| 2014 | 2.8 | 135.0 | 161.6 | 90.0 | 38.0 | 8.3 | 0.5 |
| 2015 | 3.0 | 153.7 | 190.8 | 123.2 | 53.6 | 10.6 | 0.7 |
| 2016 | 3.1 | 171.6 | 207.5 | 146.5 | 67.5 | 13.5 | 0.9 |
4.3 Geographic Distribution
In 2016, the provinces and territories which reported gonorrhea rates higher than the national average of 65.4 per 100,000 population were: the Northwest Territories (1,051.2 per 100,000 population), Nunavut (503.0 per 100,000 population), Yukon (196.9 per 100,000 population), Manitoba (169.9 per 100,000 population), Saskatchewan (120.6 per 100,000 population), Alberta (89.3 per 100,000 population), and British Columbia (77.6 per 100,000 population) (Table 2 and Figure 10).
The provinces and territories with rates below the national average were: Quebec (57.4 per 100,000 population), Ontario (48.5 per 100,000 population), Nova Scotia (21.4 per 100,000 population), New Brunswick (9.6 per 100,000 population), Prince Edward Island (8.0 per 100,000 population), and Newfoundland and Labrador (6.6 per 100,000 population) (Table 2 and Figure 10). From 2007-2016, all provinces and territories observed an increase in their gonorrhea rates.
| Province or Territory | OverallFootnote a | Male | Female | |||
|---|---|---|---|---|---|---|
| Number of cases | Rate | Number of cases | Rate | Number of cases | Rate | |
| British Columbia | 3,691 | 77.6 | 2,508 | 106.2 | 1,175 | 49.0 |
| Alberta | 3,781 | 89.3 | 2,107 | 98.1 | 1,674 | 80.2 |
| Saskatchewan | 1,385 | 120.6 | 686 | 118.4 | 699 | 122.8 |
| Manitoba | 2,240 | 169.9 | 1,040 | 158.2 | 1,200 | 181.2 |
| Ontario | 6,780 | 48.5 | 4,473 | 65.1 | 2,296 | 32.3 |
| Quebec | 4,777 | 57.4 | 3,755 | 90.8 | 996 | 23.8 |
| New Brunswick | 73 | 9.6 | 40 | 10.7 | 33 | 8.6 |
| Nova Scotia | 203 | 21.4 | 131 | 28.2 | 72 | 14.9 |
| Prince Edward Island | 12 | 8.0 | 8 | 11.0 | 4 | 5.2 |
| Newfoundland and Labrador | 35 | 6.6 | 25 | 9.6 | 10 | 3.7 |
| Yukon | 75 | 196.9 | 37 | 191.2 | 38 | 202.9 |
| Northwest Territories | 469 | 1,051.2 | 242 | 1,060.0 | 227 | 1,041.9 |
| Nunavut | 187 | 503.0 | 65 | 337.5 | 122 | 680.9 |
| Canada | 23,708 | 65.4 | 15,117 | 84.1 | 8,546 | 46.7 |
|
||||||
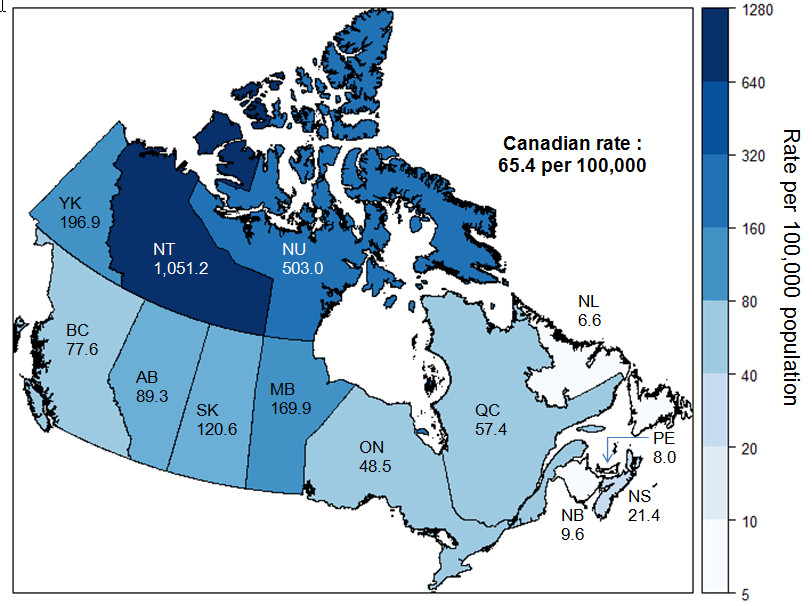
Figure 10 - Text description
This map presents the rates of reported gonorrhea cases by province and territory in Canada, in 2016. The vertical axis shows the rate of reported gonorrhea cases per 100,000 people in grading colors, corresponding to those on the map.
| Province or Territory | Rate |
|---|---|
| British Columbia | 77.6 |
| Alberta | 89.3 |
| Saskatchewan | 120.6 |
| Manitoba | 169.9 |
| Ontario | 48.5 |
| Quebec | 57.4 |
| New Brunswick | 9.6 |
| Nova Scotia | 21.4 |
| Prince Edward Island | 8.0 |
| Newfoundland and Labrador | 6.6 |
| Yukon | 196.9 |
| Northwest Territories | 1,051.2 |
| Nunavut | 503.0 |
| Canada | 65.4 |
5.0 Infectious Syphilis
Between 2007 and 2016, syphilis cases increased consistently with a particularly large increase from 2014 to 2015 (33% increase from 2,397 to 3,186 cases). Overall, the number of infectious syphilis cases more than tripled between 2007 and 2016 (from 1,250 reported cases in 2007 to 3,829 cases in 2016), corresponding to a 178% increase in rates from 3.8 to 10.6 per 100,000 population.
5.1 Sex
Over the 2007 to 2016 time frame, more men were diagnosed with syphilis compared to women and accounted for over 85% of all cases each year. In 2016, males consisted of 92% of the total cases. From 2007 to 2016, rates in males increased by 192% (from 6.7 to 19.5 per 100,000 population) compared to a 75% increase in females (from 1.0 to 1.7 per 100,000 population) (Figure 11).
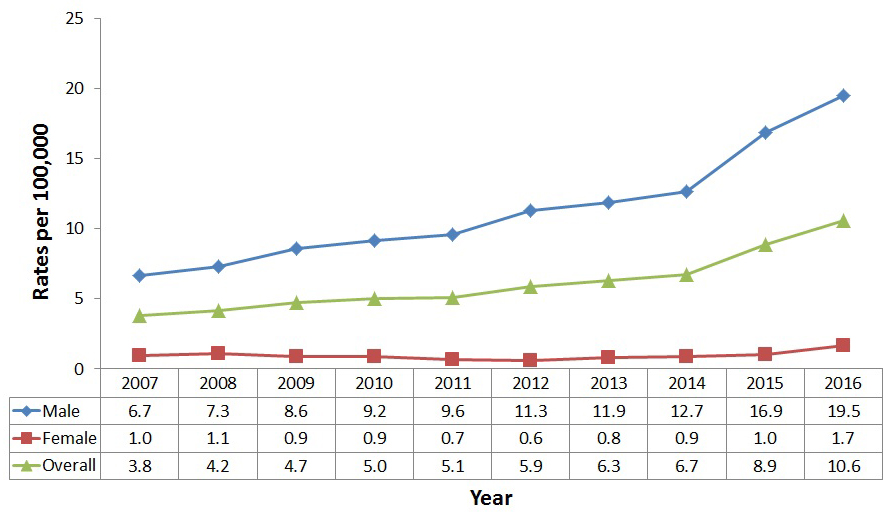
Figure 11 - Text description
This graph presents the overall and sex-specific rates of reported infectious syphilis cases, between 2007 and 2016 in Canada. The horizontal axis shows the calendar years from 2007 to 2016. The vertical axis shows the rate of reported infectious syphilis cases per 100,000 people for male, female, and overall.
| Year | Rates | ||
|---|---|---|---|
| Male | Female | Overall | |
| 2007 | 6.7 | 1.0 | 3.8 |
| 2008 | 7.3 | 1.1 | 4.2 |
| 2009 | 8.6 | 0.9 | 4.7 |
| 2010 | 9.2 | 0.9 | 5.0 |
| 2011 | 9.6 | 0.7 | 5.1 |
| 2012 | 11.3 | 0.6 | 5.9 |
| 2013 | 11.9 | 0.8 | 6.3 |
| 2014 | 12.7 | 0.9 | 6.7 |
| 2015 | 16.9 | 1.0 | 8.9 |
| 2016 | 19.5 | 1.7 | 10.6 |
5.2 Age Group
In 2016, male rates were higher than female rates in almost all age groups, except for those under 15 years old (Figure 12). The highest male rates were seen in the 25-39 year age groups and female rates were highest in the 15-29 year age groups. Overall, male cases in the 25-39 year age groups consisted of 42% of the total reported male cases of syphilis in 2016, although they represented 21% of the total male population. Female cases in the 15-29 year age groups represented 56% of the total reported female cases; however they represented only 19% of the total female population.
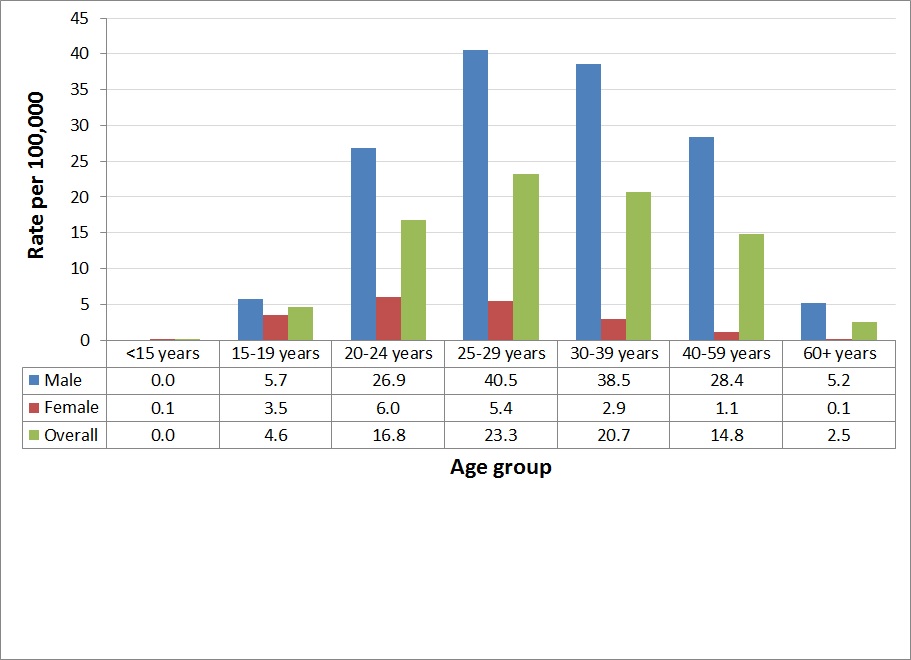
Figure 12 - Text description
This graph presents the rates of reported infectious syphilis cases by sex and age group, in 2016 in Canada. The horizontal axis shows the age groups from under 15 years old to 60 years old and over. The vertical axis shows the rate of reported infectious syphilis cases per 100,000 people for male, female, and overall.
| Age groups | Rates | ||
|---|---|---|---|
| Male | Female | Overall | |
| <15 years | 0.0 | 0.1 | 0.0 |
| 15-19 years | 5.7 | 3.5 | 4.6 |
| 20-24 years | 26.9 | 6.0 | 16.8 |
| 25-29 years | 40.5 | 5.4 | 23.3 |
| 30-39 years | 38.5 | 2.9 | 20.7 |
| 40-59 years | 28.4 | 1.1 | 14.8 |
| 60+ years | 5.2 | 0.1 | 2.5 |
In the past ten years (2007-2016), all age groups experienced an increase in rates, except for children aged less than 15 years old. The age groups with the highest rates were different from the groups with the highest rate increases. The highest overall rates were among the 25-39 year age groups (Figure 12) while the highest relative increases were in younger age groups: 287% increase from 4.3 to 16.8 per 100,000 population in the 20-24 year age group followed by a 258% increase from 1.3 to 4.6 per 100,000 population in the 15-19 year age group.
The two age groups with the highest rates for males, the 25-29 year age group as well as the 30-39 year age group, had very similar rates over the years. For the majority of the time period, for females, the 20-24 year age group has been the one with the highest rate followed by the 25-29 year age group.
For males, the highest increase in rates was in the 15-19 year age group, which increased by 368% from 1.2 to 5.7 per 100,000 (Figure 13). This group was closely followed by the 20-24 year age group, which increased by 331% from 6.2 to 26.9 per 100,000 population. Reported syphilis rates among females increased the highest among the 60 and over age group. Syphilis rates in that age group rose by 203% from 0.03 to 0.09 per 100,000 population. This group was followed by the 20-24 year age group, which increased by 155% from 2.4 to 6.0 per 100,000 population (Figure 14).
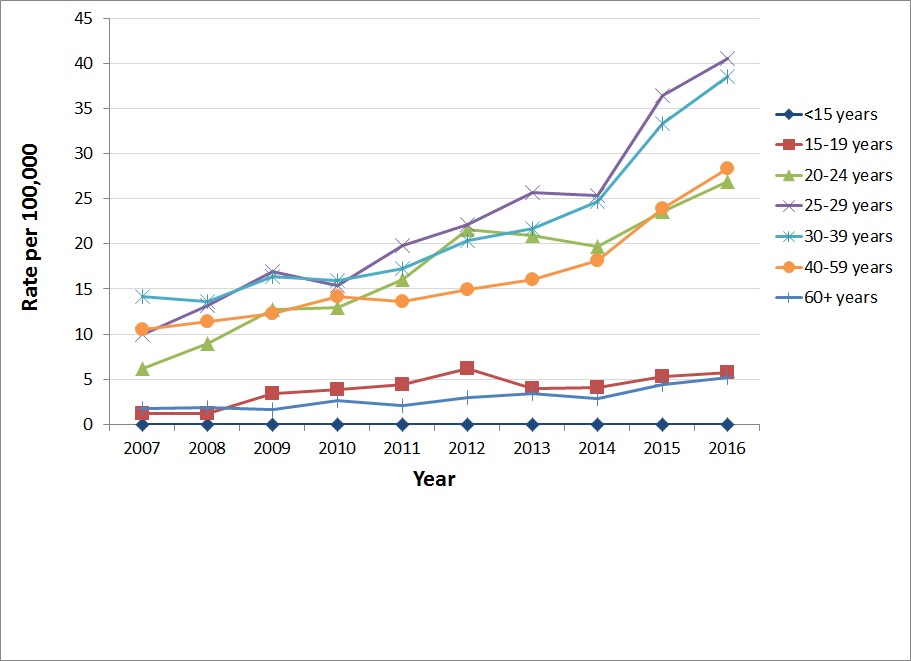
Figure 13 - Text description
This graph presents the rates of reported infectious syphilis cases by age group among males, between 2007 and 2016, in Canada. The horizontal axis shows the calendar years from 2007 to 2016. The vertical axis shows the rate of reported infectious syphilis cases per 100,000 people for all age groups.
| Year | Age groups | ||||||
|---|---|---|---|---|---|---|---|
| <15 years | 15-19 years | 20-24 years | 25-29 years | 30-39 years | 40-59 years | 60+ years | |
| 2007 | 0.03 | 1.23 | 6.23 | 9.92 | 14.22 | 10.46 | 1.77 |
| 2008 | 0.00 | 1.22 | 9.01 | 13.12 | 13.57 | 11.43 | 1.87 |
| 2009 | 0.00 | 3.39 | 12.72 | 16.95 | 16.39 | 12.26 | 1.67 |
| 2010 | 0.00 | 3.91 | 12.90 | 15.36 | 15.91 | 14.17 | 2.64 |
| 2011 | 0.00 | 4.45 | 16.09 | 19.77 | 17.25 | 13.64 | 2.11 |
| 2012 | 0.00 | 6.25 | 21.61 | 22.14 | 20.36 | 14.96 | 2.94 |
| 2013 | 0.00 | 3.93 | 20.87 | 25.72 | 21.65 | 16.03 | 3.41 |
| 2014 | 0.00 | 4.09 | 19.73 | 25.39 | 24.74 | 18.12 | 2.87 |
| 2015 | 0.03 | 5.29 | 23.56 | 36.43 | 33.33 | 23.89 | 4.37 |
| 2016 | 0.00 | 5.74 | 26.85 | 40.55 | 38.52 | 28.38 | 5.18 |
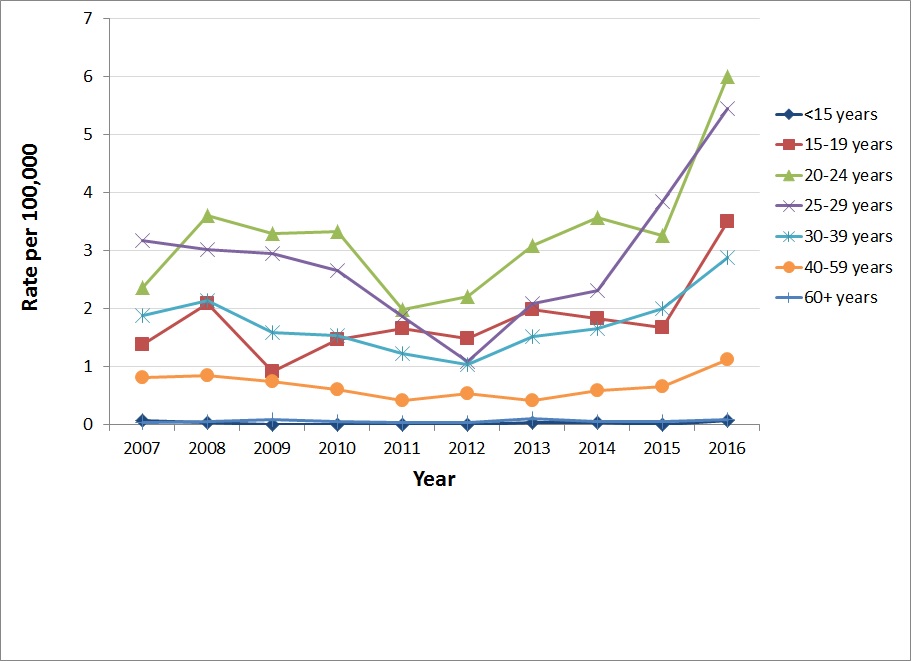
Figure 14 - Text description
This graph presents the rates of reported infectious syphilis cases by age group among females, between 2007 and 2016, in Canada. The horizontal axis shows the calendar years from 2007 to 2016. The vertical axis shows the rate of reported infectious syphilis cases per 100,000 people for all age groups.
| Year | Age groups | ||||||
|---|---|---|---|---|---|---|---|
| <15 years | 15-19 years | 20-24 years | 25-29 years | 30-39 years | 40-59 years | 60+ years | |
| 2007 | 0.07 | 1.38 | 2.35 | 3.16 | 1.88 | 0.81 | 0.03 |
| 2008 | 0.04 | 2.09 | 3.60 | 3.01 | 2.14 | 0.84 | 0.06 |
| 2009 | 0.00 | 0.91 | 3.30 | 2.95 | 1.59 | 0.74 | 0.08 |
| 2010 | 0.00 | 1.46 | 3.32 | 2.64 | 1.53 | 0.60 | 0.05 |
| 2011 | 0.00 | 1.65 | 1.98 | 1.86 | 1.21 | 0.41 | 0.03 |
| 2012 | 0.00 | 1.49 | 2.20 | 1.09 | 1.02 | 0.53 | 0.03 |
| 2013 | 0.04 | 1.98 | 3.08 | 2.08 | 1.51 | 0.41 | 0.10 |
| 2014 | 0.04 | 1.83 | 3.56 | 2.31 | 1.65 | 0.59 | 0.05 |
| 2015 | 0.00 | 1.67 | 3.25 | 3.83 | 1.99 | 0.65 | 0.05 |
| 2016 | 0.07 | 3.49 | 5.99 | 5.44 | 2.88 | 1.13 | 0.09 |
5.3 Geographic Distribution
In 2016, the provinces and territories which reported higher infectious syphilis rates than the national average of 10.6 per 100,000 population were: Nunavut (260.9 per 100,000 population), Manitoba (17.6 per 100,000 population), British Columbia (12.4 per 100,000 population), and Quebec (11.7 per 100,000 population) (Table 3 and Figure 15).
The remaining provinces and territories saw rates below the national average were: Ontario (10.0 per 100,000 population), Alberta (9.6 per 100,000 population), Saskatchewan (7.4 per 100,000 population), Newfoundland and Labrador (4.3 per 100,000 population), Nova Scotia (1.8 per 100,000 population), New Brunswick (1.7 per 100,000 population), Prince Edward Island (1.3 per 100,000 population), Yukon (0.0 per 100,000 population) and the Northwest Territories (0.0 per 100,000 population) (Table 3 and Figure 15). From 2007-2016, all provinces and territories experienced an overall increase in syphilis rates except for Northwest Territories and Yukon which observed an increase followed by a decrease, with no cases being reported in 2016.
| Province or Territory | OverallFootnote 1 | Males | Females | |||
|---|---|---|---|---|---|---|
| Number of cases | Rate | Number of cases | Rate | Number of cases | Rate | |
| British Columbia | 591 | 12.4 | 577 | 24.4 | 13 | 0.5 |
| Alberta | 408 | 9.6 | 356 | 16.6 | 52 | 2.5 |
| Saskatchewan | 85 | 7.4 | 79 | 13.6 | 6 | 1.0 |
| Manitoba | 232 | 17.6 | 158 | 24.1 | 74 | 11.2 |
| Ontario | 1,391 | 10.0 | 1,313 | 19.1 | 70 | 1.0 |
| Quebec | 970 | 11.7 | 927 | 22.4 | 41 | 1.0 |
| New Brunswick | 13 | 1.7 | 13 | 3.5 | 0 | 0.0 |
| Nova Scotia | 17 | 1.8 | 17 | 3.7 | 0 | 0.0 |
| Prince Edward Island | 2 | 1.3 | N/AFootnote 2 | N/AFootnote 2 | N/AFootnote 2 | N/AFootnote 2 |
| Newfoundland and Labrador | 23 | 4.3 | N/AFootnote 2 | N/AFootnote 2 | N/AFootnote 2 | N/AFootnote 2 |
| Yukon | 0 | 0.0 | 0 | 0.0 | 0 | 0.0 |
| Northwest Territories | 0 | 0.0 | 0 | 0.0 | 0 | 0.0 |
| Nunavut | 97 | 260.9 | 45 | 233.7 | 52 | 290.2 |
| Canada | 3,829 | 10.6 | 3,508 | 19.5 | 310 | 1.7 |
|
||||||
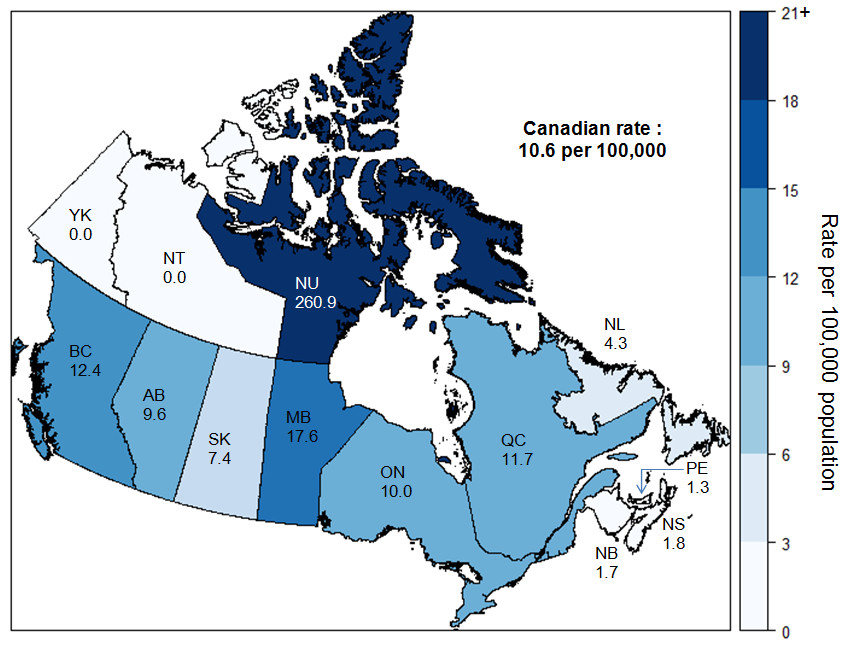
Figure 15 - Text description
This map presents the rates of reported infectious syphilis cases by province and territory in Canada, in 2016. The vertical axis shows the rate of reported infectious syphilis cases per 100,000 people in grading colors, corresponding to those on the map.
| Province or Territory | Rate |
|---|---|
| British Columbia | 12.4 |
| Alberta | 9.6 |
| Saskatchewan | 7.4 |
| Manitoba | 17.6 |
| Ontario | 10.0 |
| Quebec | 11.7 |
| New Brunswick | 1.7 |
| Nova Scotia | 1.8 |
| Prince Edward Island | 1.3 |
| Newfoundland and Labrador | 4.3 |
| Yukon | 0.0 |
| Northwest Territories | 0.0 |
| Nunavut | 260.9 |
| Canada | 10.6 |
5.4 Congenital Syphilis
The number of confirmed congenital syphilis cases reported in Canada varied from one to ten cases per year from 2007 to 2016 (Table 4).
| Indicator | Year of Diagnosis | |||||||||
|---|---|---|---|---|---|---|---|---|---|---|
| 2007 | 2008 | 2009 | 2010 | 2011 | 2012 | 2013 | 2014 | 2015 | 2016 | |
| Number of cases | 7 | 5 | 10 | 5 | 4 | 3 | 1 | 1 | 5 | 4 |
| Rate per 100,000 live births | 1.90 | 1.32 | 2.63 | 1.33 | 1.06 | 0.79 | 0.26 | 0.26 | 1.31 | 1.04 |
6.0 Conclusion
From 2007 to 2016, the trends observed in the past years were still occurring: rates have increased for all three STIs. Since 2015, syphilis and gonorrhea rates have shown the highest overall relative increase (18.8% and 18.2% respectively) while chlamydia rates have only increased slightly (2.9%). Females had higher rates of chlamydia while males had higher rates of gonorrhea. Males accounted for the vast majority of syphilis cases (92%). For all three infections, rates increased faster in males.
In 2016, most cases were among youth and young adults for chlamydia and gonorrhea, while high rates of infectious syphilis were reported among those aged 20 to 59. Notably, rates of all three infections increased in older age groups.
Reasons for those increases include a true rise in incidence due to risky sexual behaviours and changing societal norms, but also more sensitive laboratory tests and expanded screening (1-3). The Public Health Agency of Canada published three articles on surveillance of chlamydia, gonorrhea, and syphilis in Canada for 2010-2015 in February 2018 (1-3). These articles detail possible reasons for increases in STIs. Ongoing monitoring of STIs and research will help inform STI prevention and control activities.
Appendix A: Reported rates of chlamydia per 100,000 population in canada, by sex and age group, CNDSS, 2007-2016
| Year | Overall rate | Age groups | ||||||
|---|---|---|---|---|---|---|---|---|
| <15 years | 15-19 years | 20-24 years |
25-29 years | 30-39 years | 40-59 years | 60+ years | ||
| 2007 | 154.3 | 1.9 | 320.4 | 808.5 | 500.8 | 188.7 | 41.5 | 5.1 |
| 2008 | 168.9 | 2.4 | 366.0 | 895.4 | 536.6 | 206.2 | 45.5 | 4.2 |
| 2009 | 176.1 | 2.5 | 401.8 | 924.0 | 562.2 | 210.9 | 47.1 | 5.0 |
| 2010 | 190.4 | 2.4 | 422.1 | 992.2 | 609.1 | 238.8 | 50.6 | 6.4 |
| 2011 | 203.7 | 2.2 | 446.4 | 1,078.3 | 651.7 | 252.8 | 56.1 | 6.0 |
| 2012 | 215.1 | 2.4 | 464.5 | 1,089.4 | 713.1 | 275.8 | 62.2 | 6.3 |
| 2013 | 220.9 | 2.3 | 452.3 | 1,092.2 | 743.9 | 297.8 | 66.8 | 7.7 |
| 2014 | 230.7 | 1.4 | 458.8 | 1,127.5 | 778.2 | 320.8 | 72.9 | 9.1 |
| 2015 | 249.2 | 1.9 | 504.4 | 1,192.8 | 839.7 | 357.1 | 83.3 | 10.1 |
| 2016 | 261.0 | 1.9 | 527.6 | 1,226.0 | 865.4 | 386.6 | 94.1 | 10.8 |
| Year | Overall rate | Age groups | ||||||
|---|---|---|---|---|---|---|---|---|
| <15 years | 15-19 years | 20-24 years | 25-29 years | 30-39 years | 40-59 years | 60+ years | ||
| 2007 | 290.6 | 18.3 | 1,461.8 | 1,646.2 | 676.6 | 205.7 | 28.2 | 1.8 |
| 2008 | 326.8 | 19.2 | 1,659.3 | 1,811.9 | 764.6 | 241.4 | 34.5 | 1.4 |
| 2009 | 341.0 | 20.9 | 1,728.7 | 1,874.2 | 788.0 | 261.9 | 40.1 | 2.2 |
| 2010 | 364.6 | 20.7 | 1,803.0 | 2,017.6 | 853.2 | 288.0 | 47.4 | 2.3 |
| 2011 | 384.5 | 21.8 | 1,876.4 | 2,146.9 | 895.8 | 317.7 | 50.6 | 3.0 |
| 2012 | 388.9 | 19.7 | 1,832.5 | 2,175.3 | 948.0 | 337.4 | 55.5 | 3.1 |
| 2013 | 376.5 | 20.9 | 1,762.8 | 2,113.1 | 944.7 | 332.4 | 53.7 | 2.4 |
| 2014 | 382.5 | 20.3 | 1,741.7 | 2,152.1 | 1,006.1 | 354.0 | 57.2 | 3.1 |
| 2015 | 398.7 | 20.8 | 1,794.1 | 2,271.5 | 1,061.5 | 384.8 | 64.5 | 3.0 |
| 2016 | 405.6 | 19.2 | 1,874.2 | 2,314.3 | 1,085.4 | 389.2 | 69.3 | 3.9 |
Appendix B: Reported rates of gonorrhea per 100,000 population in Canada, by sex and Age Group, CNDSS, 2007-2016
| Year | Overall rate | Age groups | ||||||
|---|---|---|---|---|---|---|---|---|
| <15 years | 15-19 years | 20-24 years | 25-29 years | 30-39 years | 40-59 years | 60+ years | ||
| 2007 | 42.4 | 0.4 | 72.2 | 155.3 | 118.5 | 65.6 | 27.1 | 4.2 |
| 2008 | 42.6 | 0.7 | 71.6 | 166.2 | 121.6 | 67.5 | 24.3 | 4.0 |
| 2009 | 36.7 | 0.4 | 61.9 | 144.4 | 104.0 | 55.8 | 22.4 | 3.2 |
| 2010 | 37.8 | 0.8 | 60.9 | 140.6 | 113.6 | 59.3 | 23.0 | 4.3 |
| 2011 | 40.2 | 0.7 | 62.0 | 149.0 | 117.1 | 64.1 | 26.0 | 4.3 |
| 2012 | 42.5 | 0.6 | 62.5 | 154.5 | 136.1 | 69.7 | 25.9 | 3.7 |
| 2013 | 48.2 | 0.6 | 67.4 | 168.8 | 152.6 | 84.4 | 29.8 | 4.2 |
| 2014 | 58.7 | 0.3 | 70.5 | 198.2 | 190.2 | 105.9 | 38.5 | 5.7 |
| 2015 | 70.1 | 0.5 | 75.1 | 218.2 | 229.1 | 142.6 | 45.8 | 6.3 |
| 2016 | 84.1 | 0.4 | 83.9 | 246.6 | 269.6 | 171.7 | 60.3 | 9.3 |
| Year | Overall rate | Age groups | ||||||
|---|---|---|---|---|---|---|---|---|
| <15 years | 15-19 years | 20-24 years | 25-29 years | 30-39 years | 40-59 years | 60+ years | ||
| 2007 | 29.9 | 3.5 | 150.8 | 151.6 | 67.8 | 26.2 | 3.9 | 0.4 |
| 2008 | 33.5 | 3.2 | 166.6 | 165.2 | 80.6 | 29.8 | 5.2 | 0.4 |
| 2009 | 29.6 | 3.0 | 146.2 | 149.2 | 70.4 | 26.6 | 4.4 | 0.4 |
| 2010 | 29.1 | 3.0 | 143.7 | 142.0 | 70.4 | 26.3 | 5.1 | 0.5 |
| 2011 | 29.6 | 2.5 | 140.8 | 144.7 | 76.5 | 27.1 | 5.7 | 0.5 |
| 2012 | 32.4 | 2.8 | 150.5 | 159.2 | 85.3 | 31.5 | 6.2 | 0.7 |
| 2013 | 32.8 | 3.7 | 151.1 | 155.5 | 87.4 | 34.6 | 6.9 | 0.3 |
| 2014 | 32.9 | 2.8 | 135.0 | 161.6 | 90.0 | 38.0 | 8.3 | 0.5 |
| 2015 | 40.6 | 3.0 | 153.7 | 190.8 | 123.2 | 53.6 | 10.6 | 0.7 |
| 2016 | 46.8 | 3.1 | 171.6 | 207.5 | 146.5 | 67.5 | 13.5 | 0.9 |
Appendix C: Reported rates of infectious syphilis per 100,000 population in canada, by sex and age group, CNDSS, 2007-2016
| Year | Overall rate | Age groups | ||||||
|---|---|---|---|---|---|---|---|---|
| <15 years | 15-19 years | 20-24 years | 25-29 years | 30-39 years | 40-59 years | 60+ years | ||
| 2007 | 6.70 | 0.03 | 1.23 | 6.23 | 9.92 | 14.22 | 10.46 | 1.77 |
| 2008 | 7.30 | 0.00 | 1.22 | 9.01 | 13.12 | 13.57 | 11.43 | 1.87 |
| 2009 | 8.60 | 0.00 | 3.39 | 12.72 | 16.95 | 16.39 | 12.26 | 1.67 |
| 2010 | 9.20 | 0.00 | 3.91 | 12.90 | 15.36 | 15.91 | 14.17 | 2.64 |
| 2011 | 9.60 | 0.00 | 4.45 | 16.09 | 19.77 | 17.25 | 13.64 | 2.11 |
| 2012 | 11.30 | 0.00 | 6.25 | 21.61 | 22.14 | 20.36 | 14.96 | 2.94 |
| 2013 | 11.90 | 0.00 | 3.93 | 20.87 | 25.72 | 21.65 | 16.03 | 3.41 |
| 2014 | 12.70 | 0.00 | 4.09 | 19.73 | 25.39 | 24.74 | 18.12 | 2.87 |
| 2015 | 16.90 | 0.03 | 5.29 | 23.56 | 36.43 | 33.33 | 23.89 | 4.37 |
| 2016 | 19.50 | 0.00 | 5.74 | 26.85 | 40.55 | 38.52 | 28.38 | 5.18 |
| Year | Overall rate | Age groups | ||||||
|---|---|---|---|---|---|---|---|---|
| <15 years | 15-19 years | 20-24 years | 25-29 years | 30-39 years | 40-59 years | 60+ years | ||
| 2007 | 1.00 | 0.07 | 1.38 | 2.35 | 3.16 | 1.88 | 0.81 | 0.03 |
| 2008 | 1.10 | 0.04 | 2.09 | 3.60 | 3.01 | 2.14 | 0.84 | 0.06 |
| 2009 | 0.90 | 0.00 | 0.91 | 3.30 | 2.95 | 1.59 | 0.74 | 0.08 |
| 2010 | 0.90 | 0.00 | 1.46 | 3.32 | 2.64 | 1.53 | 0.60 | 0.05 |
| 2011 | 0.70 | 0.00 | 1.65 | 1.98 | 1.86 | 1.21 | 0.41 | 0.03 |
| 2012 | 0.60 | 0.00 | 1.49 | 2.20 | 1.09 | 1.02 | 0.53 | 0.03 |
| 2013 | 0.80 | 0.04 | 1.98 | 3.08 | 2.08 | 1.51 | 0.41 | 0.10 |
| 2014 | 0.90 | 0.04 | 1.83 | 3.56 | 2.31 | 1.65 | 0.59 | 0.05 |
| 2015 | 1.00 | 0.00 | 1.67 | 3.25 | 3.83 | 1.99 | 0.65 | 0.05 |
| 2016 | 1.70 | 0.07 | 3.49 | 5.99 | 5.44 | 2.88 | 1.13 | 0.09 |
References
- Choudhri Y, Miller J, Sandhu J, Leon A, Aho J. Chlamydia in Canada, 2010–2015. Can Commun Dis Rep. 2018;44(2):49-54. https://doi.org/10.14745/ccdr.v44i02a03
- Choudhri Y, Miller J, Sandhu J, Leon A, Aho J. Gonorrhea in Canada, 2010–2015. Can Commun Dis Rep. 2018;44(2):37-42. https://doi.org/10.14745/ccdr.v44i02a01
- Choudhri Y, Miller J, Sandhu J, Leon A, Aho J. Infectious and congenital syphilis in Canada, 2010–2015. Can Commun Dis Rep. 2018;44(2):43-8. https://doi.org/10.14745/ccdr.v44i02a02
- Centre for Communicable Diseases and Infection Control. A summary of the Pan-Canadian framework on sexually-transmitted and blood-borne infections. Can Commun Dis Rep 2018;44(7/8):179-81. https://doi.org/10.14745/ccdr.v44i78a05
Footnotes
- Footnote 1
-
Overall includes unspecified sex