
Substance use among street-involved youth in Canada: Pan-Canadian findings from the People with Lived and Living Experience Survey

Resources
Due to the sensitive nature of substance use and the drug toxicity crisis, certain parts of this report may cause emotional distress. Mental health supports are available:
If you or someone you love is struggling with substance use, help is available:
Introduction
Studies have shown that in Canada, homelessness among youth is associated with poor nutrition, victimization, higher-risk substance use, and limited access to health and social servicesFootnote 1Footnote 2Footnote 3Footnote 4Footnote 5. This often leads to harmful effects on health, isolation among youth, and higher rates of substance use and mental health problemsFootnote 6.
Although street-involved youth are at higher risk of substance-related harms, they are under-represented in survey data on substance use. In response, Health Canada developed a targeted survey called the People with Lived and Living Experience Survey (PWLLES) to examine substance use and related harms among street-involved youth, with input from a peer researcher and other stakeholders. This report focuses on quantitative findings from the PWLLES, which collected responses from September 2021 to February 2023 from youth aged 14-24 years who were 1) experiencing homelessness, unstable housing, spent most of their time in the streets, and/or accessed services for street involved youth, and 2) who had used alcohol, tobacco, cannabis, or other drugs in the past year.
Key findings
Demographics and social determinants of health
There were 442 participants from 16 sentinel sites across 9 Canadian cities that completed the survey. Ontario (37.8%) and the Prairies (25.1%) accounted for the greatest proportion of participants. The Atlantic region had low participation (less than 5.0%), and no sentinel sites were engaged in the Territories. At the city level, Windsor (22.9%), Montreal (17.2%), and Vancouver (15.8%) had the greatest proportion of participants (Figure 1).
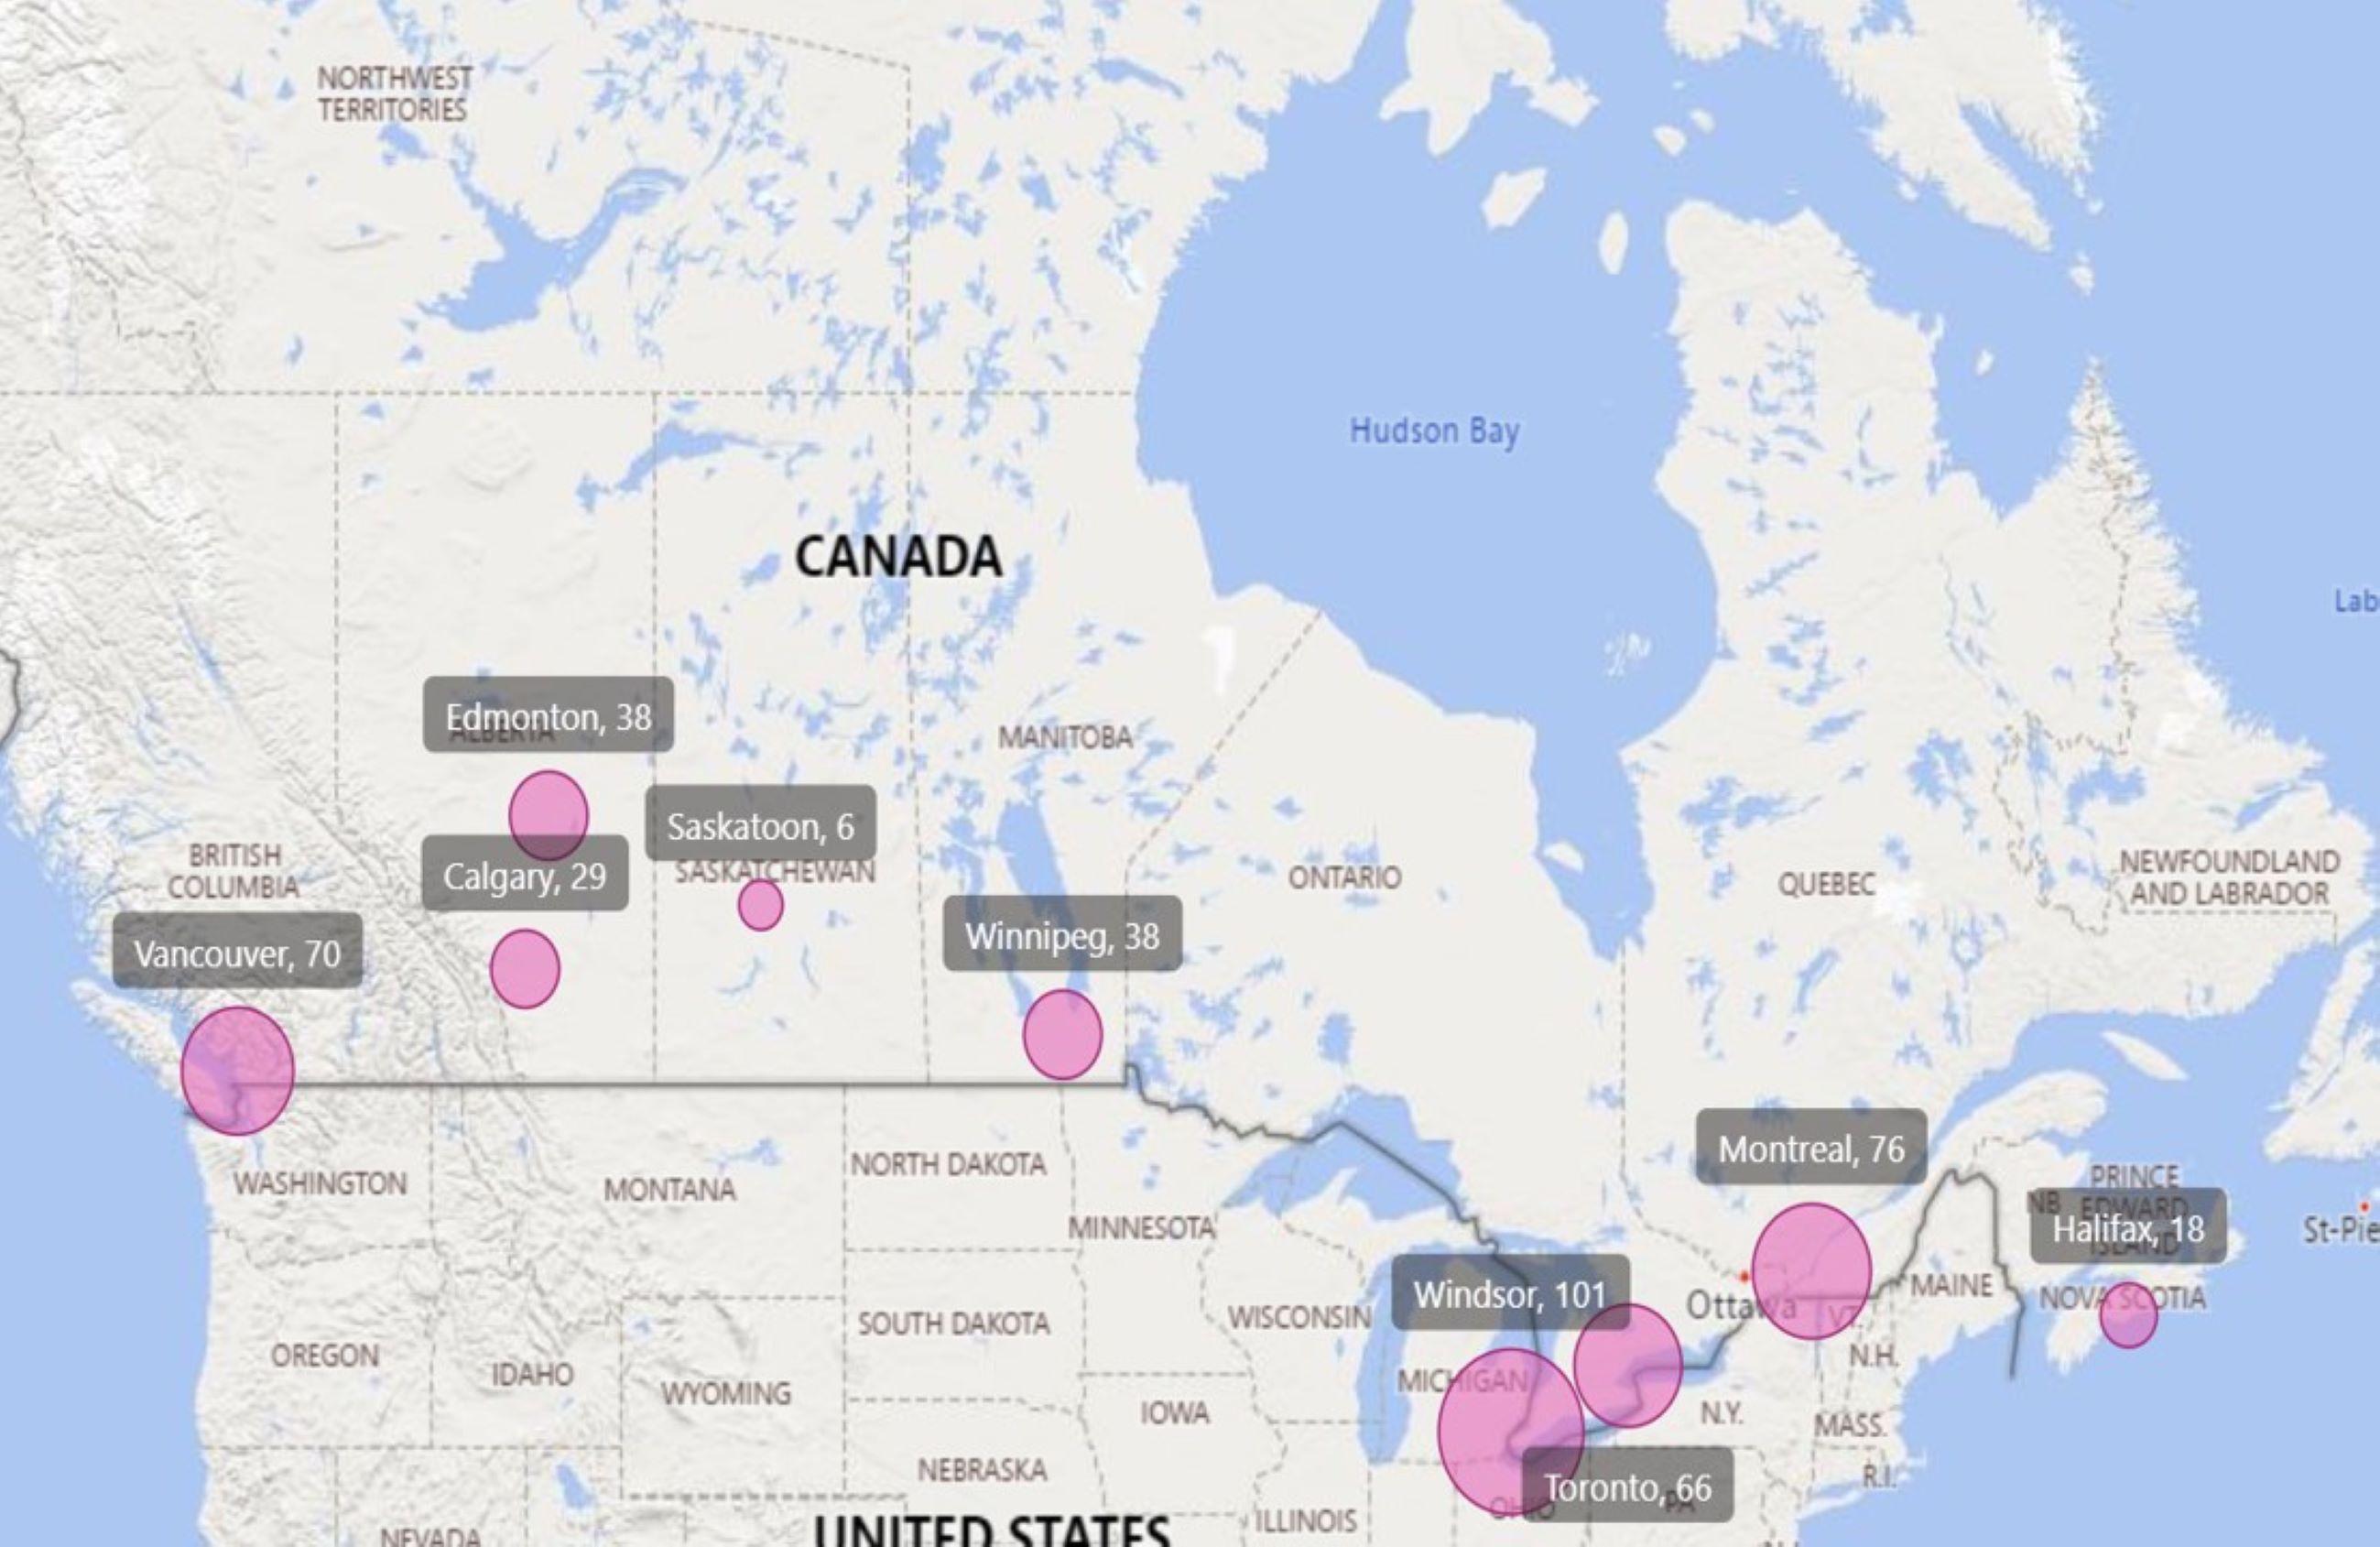
Figure 1 - Text description
| City | Number of participants (Number of sites) | Percentage of participants (%) | Total |
|---|---|---|---|
| Windsor | 101 (2) | 22.9 | 442 |
| Montreal | 76 (2) | 17.2 | |
| Vancouver | 70 (3) | 15.8 | |
| Toronto | 66 (3) | 14.9 | |
| Edmonton | 38 (1) | 8.6 | |
| Winnipeg | 38 (1) | 8.6 | |
| Calgary | 29 (2) | 6.6 | |
| Halifax | 18 (1) | 4.1 | |
| Saskatoon | 6 (1) | 1.4 | |
Note: The size of the circle on each city is scaled proportionally to the number of PWLLES participants in that city. |
|||
The average age of all participants was 20.7 years (standard deviation [SD] = 2.7 years). Most participants (80.1%) were above the legal age for alcohol consumption in their province. The majority identified as cisgender (86.9%), with slightly more cisgender males (46.4%) than cisgender females (40.5%) [Table 1]. Just over half reported their sexual orientation as heterosexual or straight (55.4%), followed by bisexual or pansexual (17.9%). Approximately 1 quarter of participants (26.0%) identified as Indigenous, and of these, 74.8% identified as First Nations. One (1) third of respondents (33.9%) identified as visible minorities, and of these, the most commonly reported racialized identities were Black (38.0%); Other race, including multiracial identity (18.7%); and Latino (13.3%).
Most participants reported currently living in a shelter or refuge (29.1%), or a rented house or apartment (alone or shared) [28.9%]. Approximately 3 quarters of participants (73.3%) stated that they were not currently attending a school, college, CEGEP or university. Most participants (70.4%) were unemployed, while 24.2% reported currently having full-time, part-time, or seasonal employment.
| Demographic characteristics | Number of participants | Percentage of participants (%) | Total |
|---|---|---|---|
| Gender identity | |||
| Cisgender male | 205 | 46.4 | 442 |
| Cisgender female | 179 | 40.5 | |
| Non-binary | 29 | 6.6 | |
| Transgender female | 12 | 2.7 | |
| Transgender male | 11 | 2.5 | |
| Prefer not to answer | 6 | 1.4 | |
| Sexual orientation | |||
| Heterosexual/straight | 245 | 55.4 | 442 |
| Bisexual or pansexual | 79 | 17.9 | |
| Gay or lesbian | 35 | 7.9 | |
| Sexual orientation, n.e.c. | 24 | 5.4 | |
| Prefer not to answer | 59 | 13.3 | |
| Indigenous identity | |||
| Not Indigenous | 293 | 66.3 | 442 |
| IndigenousFootnote * | 115 | 26.0 | |
| Prefer not to answer or do not know | 34 | 7.7 | |
| Population Group | |||
| Visible minority | 150 | 33.9 | 442 |
| Not a visible minority | 258 | 58.4 | |
| Prefer not to answer or do not know | 34 | 7.7 | |
| Current living situationFootnote ‡ | |||
| Shelter/refuge | 120 | 29.1 | 412 |
| Rented house/apartment (alone/shared) | 119 | 28.9 | |
| Parents'/carers' family home | 61 | 14.8 | |
| No fixed address/couch surfing/staying with friends | 50 | 12.1 | |
| Boarding house/hostel/single room occupancy hotel (SRO) | 30 | 7.3 | |
| Other | 32 | 7.8 | |
|
|||
Substance use trends
Among participants who had ever used each respective substance, the most used substances in the past 30 days were cannabis (85.0%), cigarettes (81.2%), alcohol (80.3%), illegal drugs (57.0%), and vaping nicotine (55.7%) [Table 2].
| Prevalence of substance use | Number of participants | Percentage of participants (%) | Total |
|---|---|---|---|
| CannabisFootnote ‡ | 328 | 85.0 | 386 |
| Smoking cigarettesFootnote ‡ | 290 | 81.2 | 357 |
| Alcohol (more than a sip)Footnote ‡ | 331 | 80.3 | 412 |
| Illegal drugsFootnote † | 150 | 57.0 | 263 |
| Vaping nicotineFootnote ‡ | 244 | 55.7 | 438 |
| StimulantsFootnote ‡ | 83 | 46.1 | 180 |
| Sedatives or tranquilizersFootnote ‡ | 61 | 39.1 | 156 |
| Opioid or opioid-containing pain-relieversFootnote § | 75 | 38.9 | 193 |
Note: 'Do not know' was not an option for all questions except those on opioid or opioid-containing pain relievers. Only participants who had ever-used each respective substance were eligible for corresponding questions on past 30-day use. |
|||
The average age at first use of each substance type ranged from 13.8 to 17.2 years (Figure 2). On average, participants reported first using cannabis (13.8 years), stimulants (13.8 years), and alcohol (14.0 years) at a younger age compared to other substance types. Stimulants are sometimes prescribed to help with attention or concentration problems, such as Attention Deficit Hyperactivity Disorder (ADHD). Of those who had ever used stimulants, 62.2% had received a formal diagnosis of ADHD. The younger age of initiation for stimulants may be related to use of prescribed stimulant medications for ADHD. Sedatives or tranquilizers are sometimes prescribed to help people sleep, calm them down, or to relax their muscles. Illegal drugs or 'street drugs' (e.g., cocaine, heroin, etc.) cannot be obtained by prescription. The average age of first use was higher for sedatives or hypnotics (16.4 years), illegal drugs (17.0 years), and injected drugs (17.2 years).
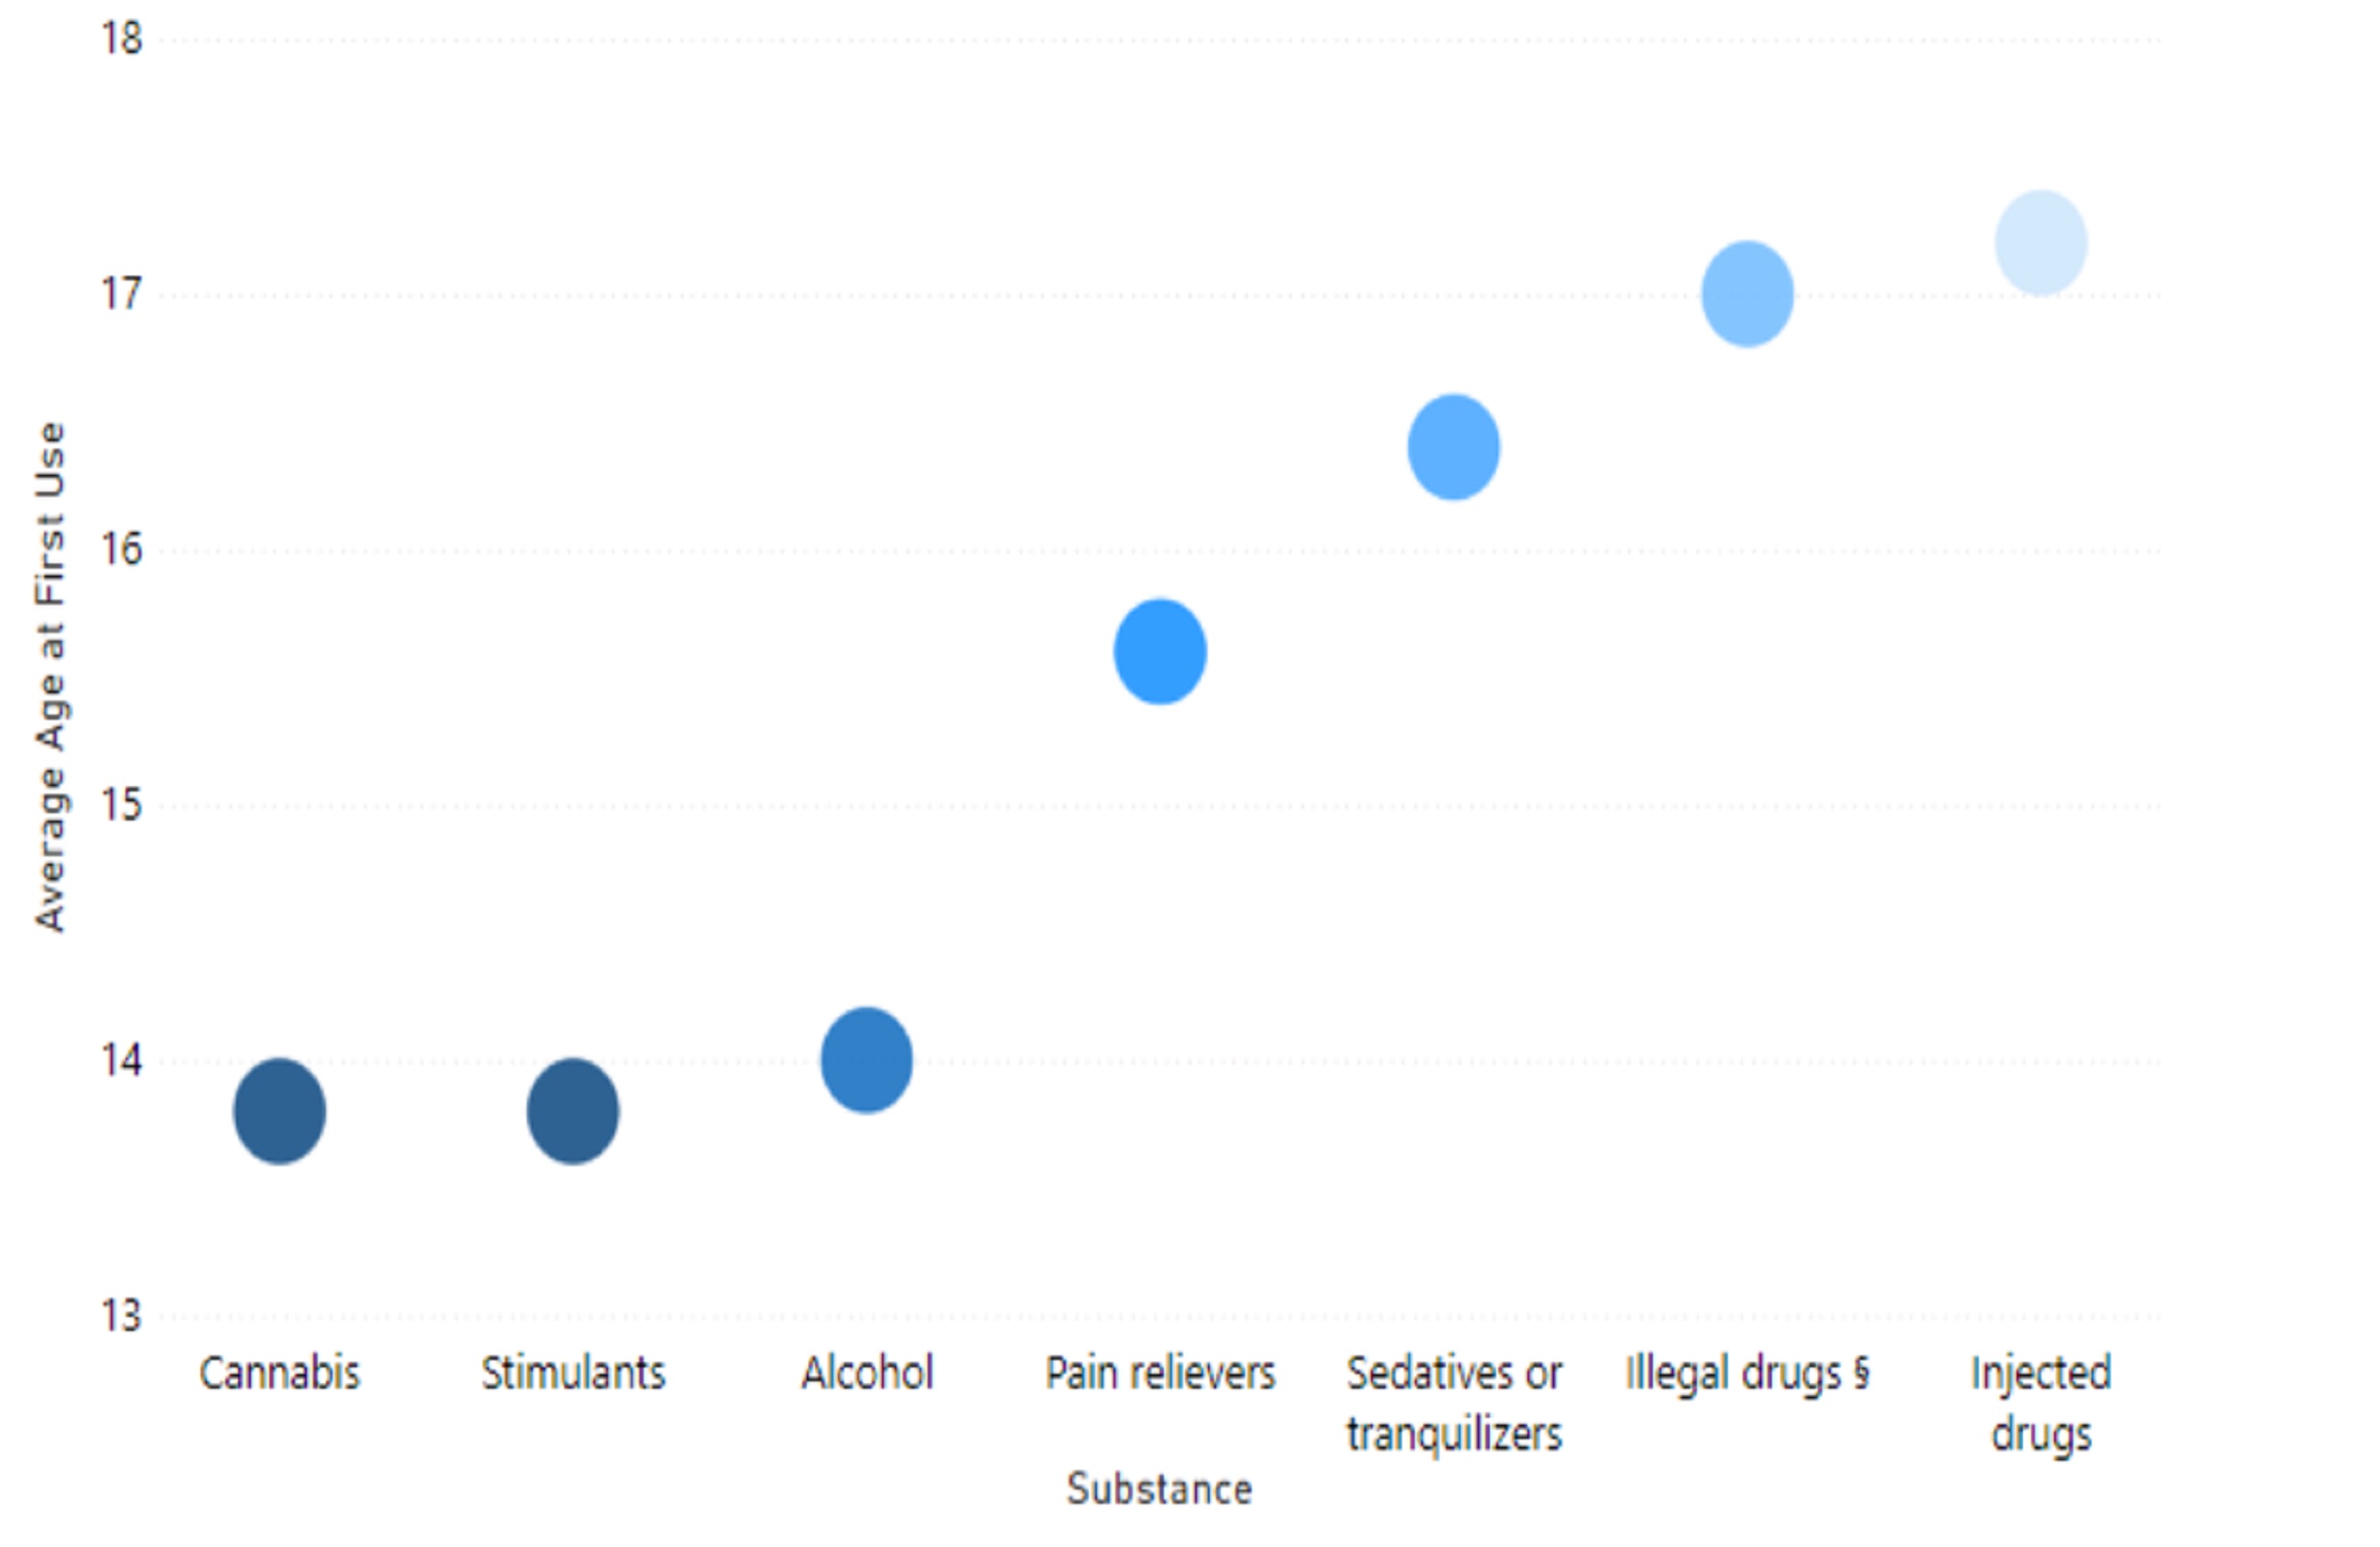
Figure 2 - Text description
| Substance | Average age (years) | Standard deviation for age (years) | Number of participants |
|---|---|---|---|
| Cannabis | 13.8 | 2.8 | 317 |
| Stimulants | 13.8 | 4.2 | 180 |
| Alcohol | 14.0 | 3.2 | 330 |
| Pain relievers | 15.6 | 3.5 | 158 |
| Sedatives or tranquilizers | 16.4 | 2.8 | 156 |
| Illegal drugsFootnote § | 17.0 | 2.9 | 127 |
| Injected drugs | 17.2 | 2.9 | 35 |
Note: Stimulants, pain relievers, and sedatives or tranquilizers included either prescribed or non-prescribed substances. 'Prefer not to answer' and 'Do not know' were excluded from the denominators since missing values could not be used in the calculation of the mean and standard deviation. Ages greater than 1 were included in the denominator. Only participants who had ever used pain-relievers were eligible for answering 'Age at first use of pain-relievers'. Only participants who had ever used sedatives were eligible for answering 'Age at first use of sedatives'. Only participants who had ever used stimulants were eligible for answering 'Age at first use of stimulants'. For all other substances listed, only participants who had used each respective substance in the past 30 days were eligible for answering 'Age at first use'. |
|||
Past 30-day binge drinking, defined as 5 drinks or more per occasion for males and 4 drinks or more per occasion for females, was reported by 65.0% of participants who consumed alcohol in the past 30 days. Among those who reported using cannabis in the past 30 days, 35.4% reported using cannabis more than once a day. Furthermore, among those who reported smoking cigarettes in the past 30 days, 70.3% reported smoking cigarettes daily. Of participants who consumed alcohol in the past 30 days, 65.0% reported combining or mixing alcohol with another substance. 51.2% of participants who used cannabis in the past 30 days reported combining or mixing cannabis with another substance. 51.6% of all participants reported combining or mixing tobacco with cannabis.
Substance use behaviours and related harms
Of participants who had used an illegal drug in the past 30 days, the majority (69.6%) reported that it was very easy to obtain an illegal drug (i.e., within 90 minutes). Most (57.0%) stated that they obtained an illegal drug by buying or trading something for it, and nearly 1 quarter (23.7%) said it was given to them by someone.
In the past 30 days, 13.6% stated they had used a drug or substance that was not what they thought it was, 57.0% obtained drug use or preparation equipment, and 45.5% stated they shared drug use or preparation equipment. Approximately 1 in 10 participants (10.2%) reported that they injected a drug in the past 30 days.
Participants most frequently reported that their cannabis or drug use had harmful effects on their:
- Mental health (37.1%)
- Finances or ability to meet basic needs (34.2%)
- Home life, family, or relationships (33.5%)
Impacts in other areas of life (i.e., work, studies, employment, physical health, or relationships) were reported by at least 28.1% of participants (Figure 3).
The most common reported consequences of cannabis or drug use in the past 30 days were:
- Severe withdrawal symptoms (31.0%)
- Housing problems (29.0%)
- Difficulty learning things (28.1%)
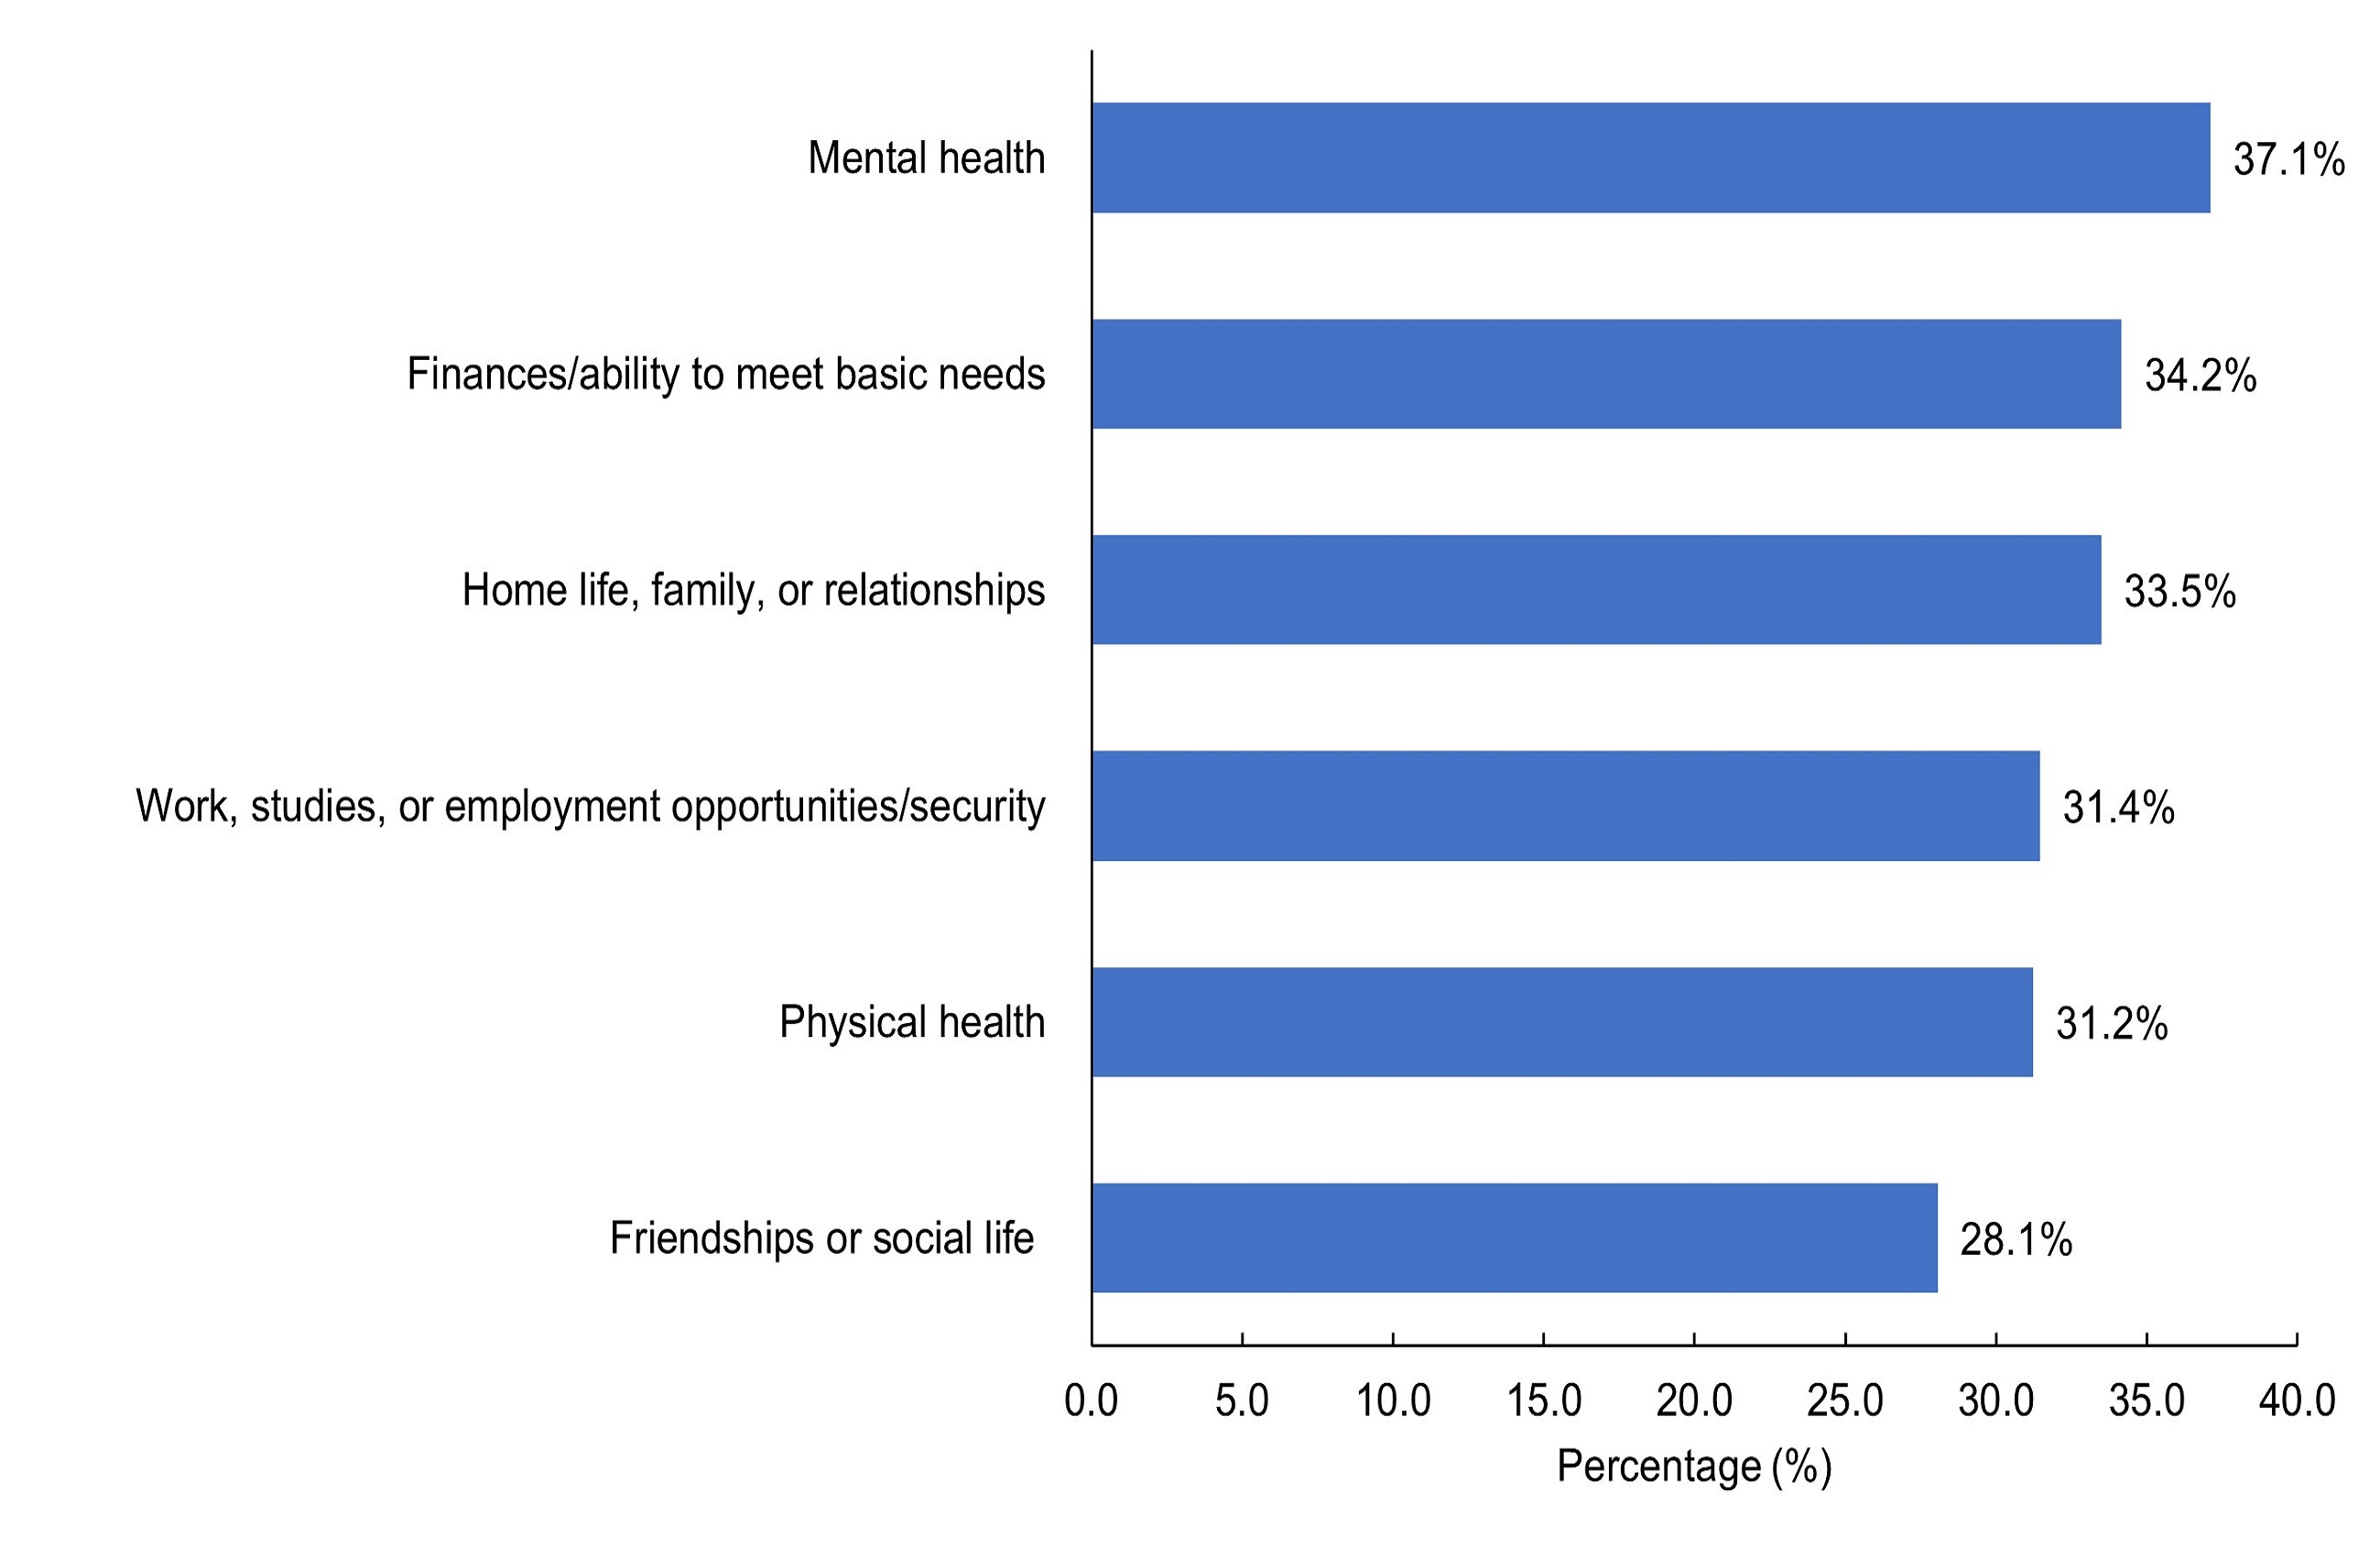
Figure 3 - Text description
| Harmful effects due to cannabis or drug use in the past 30 days | Number of participants | Percentage of participants (%) | Total |
|---|---|---|---|
| Experienced harmful effects due to drug use in the past 30 days | |||
| Mental health | 164 | 37.1 | 442 |
| Finances/ability to meet basic needs | 151 | 34.2 | 442 |
| Home life, family, or relationships | 148 | 33.5 | 442 |
| Work, studies, or employment opportunities/security | 139 | 31.4 | 442 |
| Physical health | 138 | 31.2 | 442 |
| Friendships or social life | 124 | 28.1 | 442 |
|
Note: Categories were not mutually exclusive. |
|||
Driving under the influence was defined as one or more drinks of alcohol within the past hour, using cannabis within the past 2 hours, and using any drug other than alcohol or cannabis within the past hour. Within the past year, driving under the influence of cannabis (15.8%) was more frequently reported than driving under the influence of alcohol (12.9%) or under the influence of other drugs (7.2%). Similarly, being a passenger of a driver under the influence of cannabis (39.8%) was more frequently reported than being a passenger of a driver under the influence of alcohol (32.1%) or under the influence of other drugs (30.8%).
One (1) third of participants (33.0%) reported having overdosed in their lifetime, and of these, the majority (56.2%) had overdosed within the past year. During the most recent overdose, most participants were aware of the drug used (70.5%); however nearly half of all participants (45.9%) were not aware of the potency of the drug used (Figure 4). More than 1 in 5 participants (21.9%) were alone during their most recent overdose. Nearly half of participants (47.9%) reported taking multiple drugs at the same time during their most recent overdose. Participants were asked to name the main drug believed to be responsible for their most recent overdose, where fentanyl was the most commonly reported substance.
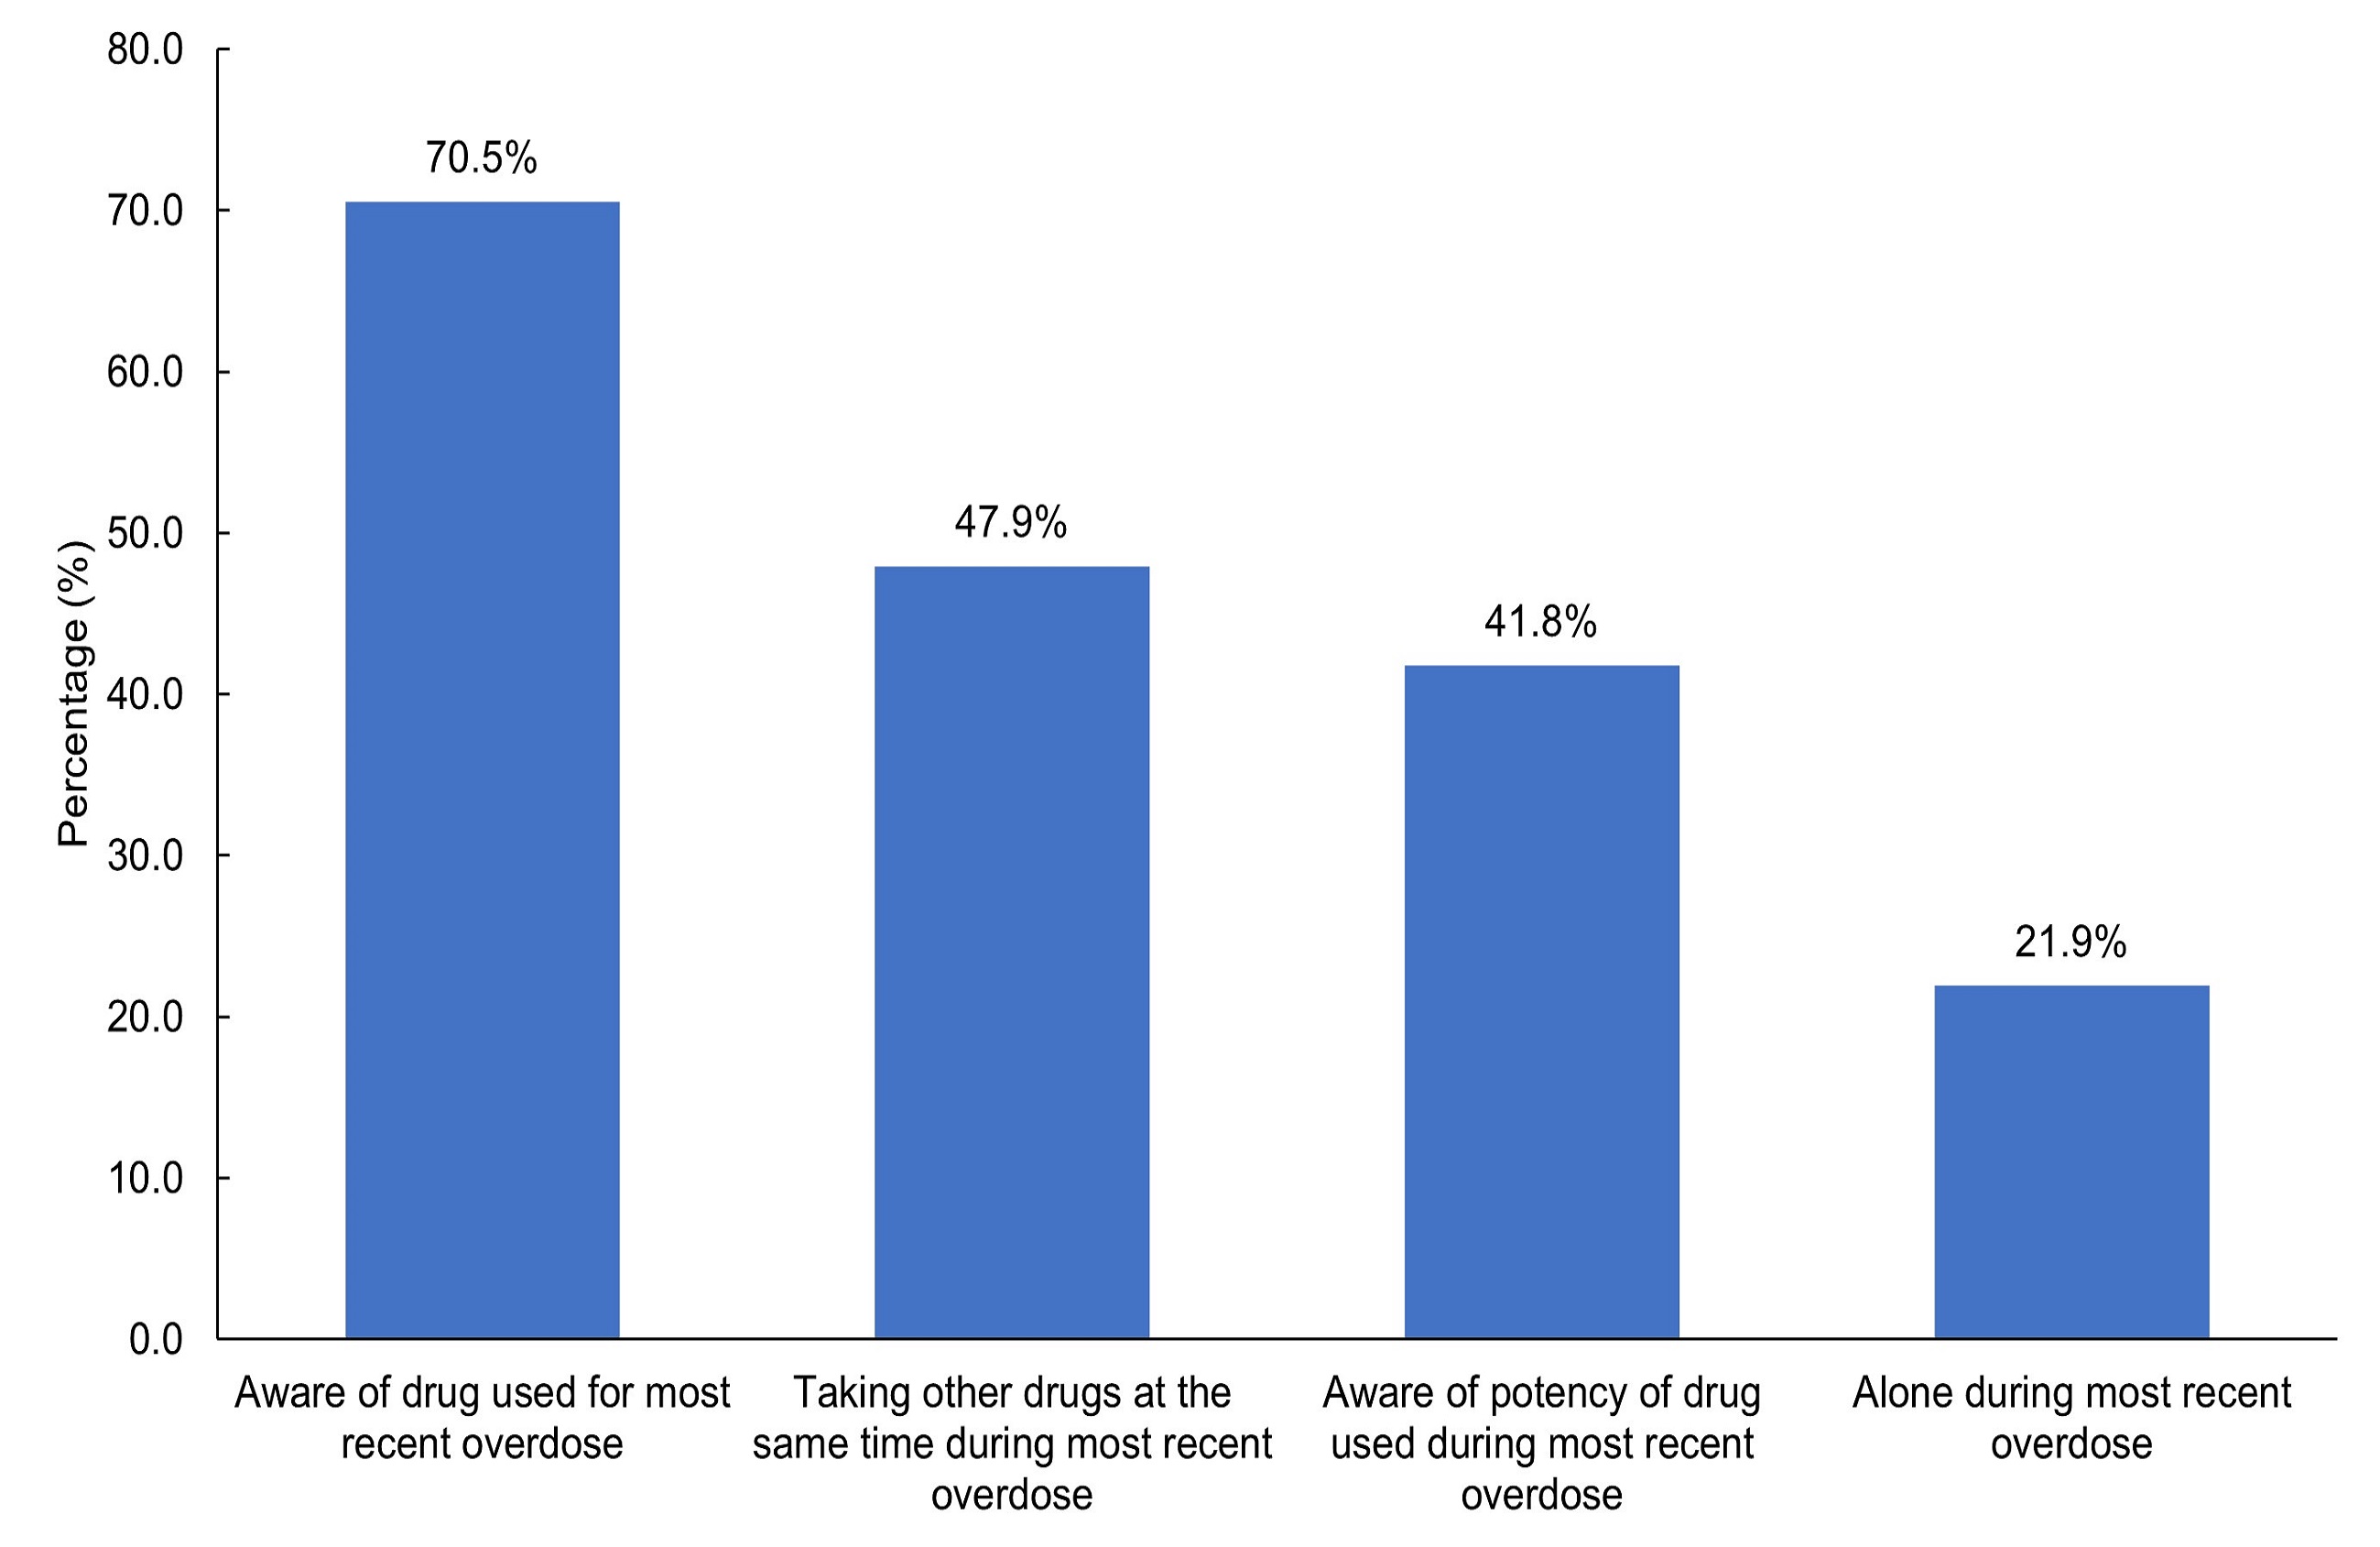
Figure 4 - Text description
| Characteristics of recent overdose | Number of participants | Percentage of participants (%) | Total |
|---|---|---|---|
| Aware of drug used for most recent overdose | 103 | 70.5 | 146 |
| Taking other drugs at the same time during most recent overdose | 70 | 47.9 | 146 |
| Aware of potency of drug used during most recent overdose | 61 | 41.8 | 146 |
| Alone during most recent overdose | 32 | 21.9 | 146 |
|
Note: 'Prefer not to answer' was 5.5% for 'Aware of drug used for most recent overdose', 6.2% for 'Taking other drugs at the same time during most recent overdose', 6.2% for 'Aware of potency of drug used during most recent overdose', and 8.2% for 'Alone during most recent overdose'. 'Do not know' was less than 5.0% for 'Aware of drug used for most recent overdose' and 'Taking other drugs at the same time during most recent overdose'. 'Do not know' was 6.2% for 'Aware of potency of drug used during most recent overdose'. 'Do not know' was not an option for 'Alone during most recent overdose'. |
|||
Treatment and support
Close to half (42.8%) of the participants reported having ever obtained a naloxone kit. Obtaining a kit in case someone on the streets or at a venue needs it was the main reason reported (37.0% of participants who had ever obtained a naloxone kit). Other reasons for obtaining a kit included (Figure 5):
- In case it was needed for a friend (24.3%)
- In case the participant needed it for themselves (24.3%)
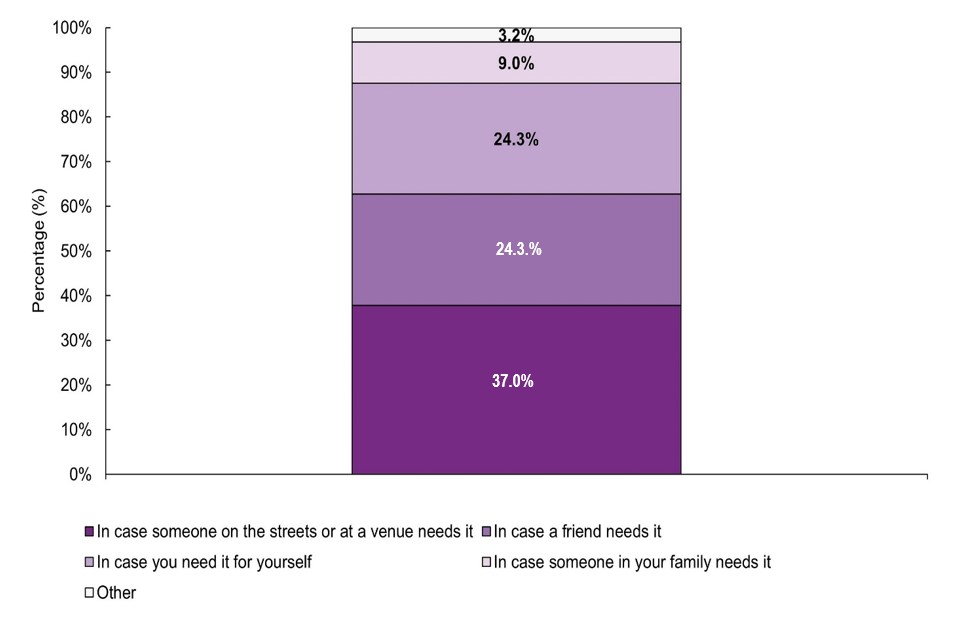
Figure 5 - Text description
| Main reason for obtaining naloxone kitFootnote † | Number of participants | Percentage of participants (%) | Total |
|---|---|---|---|
| In case someone on the streets or at a venue needs it | 70 | 37.0 | 189 |
| In case a friend needs it | 46 | 24.3 | 189 |
| In case you need it for yourself | 46 | 24.3 | 189 |
| In case someone in your family needs it | 17 | 9.0 | 189 |
| Other | 6 | 3.2 | 189 |
Note: 'Do not know' was not an option for Main reason for obtaining naloxone kit. Categories are mutually exclusive. |
|||
A similar proportion of participants reported ever feeling that they needed professional help for alcohol, cannabis, and/or drug use (31.9%), as those who have ever sought professional help (32.6%). Among those who reported having ever sought treatment, 38.9% reported seeking professional help in the past 30-days, while 28.5% stated that they were currently trying to get into treatment (including methadone).
Approximately 1 third (30.3%) of participants ever received professional help for alcohol, cannabis, or drug use, where 21.3% voluntarily received professional help and the remaining 9.0% stated that they involuntarily received help (e.g., checked-in by a parent or guardian). Among those who had ever received treatment, 45.5% reported having received professional help in the 30-days prior to survey completion. The most frequently reported types of treatment and supports for those currently receiving treatment were:
- Counsellor (60.7%)
- Detox/youth detox e.g., withdrawal management (18.0%)
- Treatment centre (11.5%)
- Other out-patient treatment program (11.5%)
With respect to accessing treatment other than alcohol and/or drug treatment, youth have reported seeking a variety of services. The most frequently reported services were (Figure 6):
- Housing services, such as shelters (31.4%)
- Foodbanks (28.3%)
- Income-support services (26.9%)
- Employment services (14.7%)
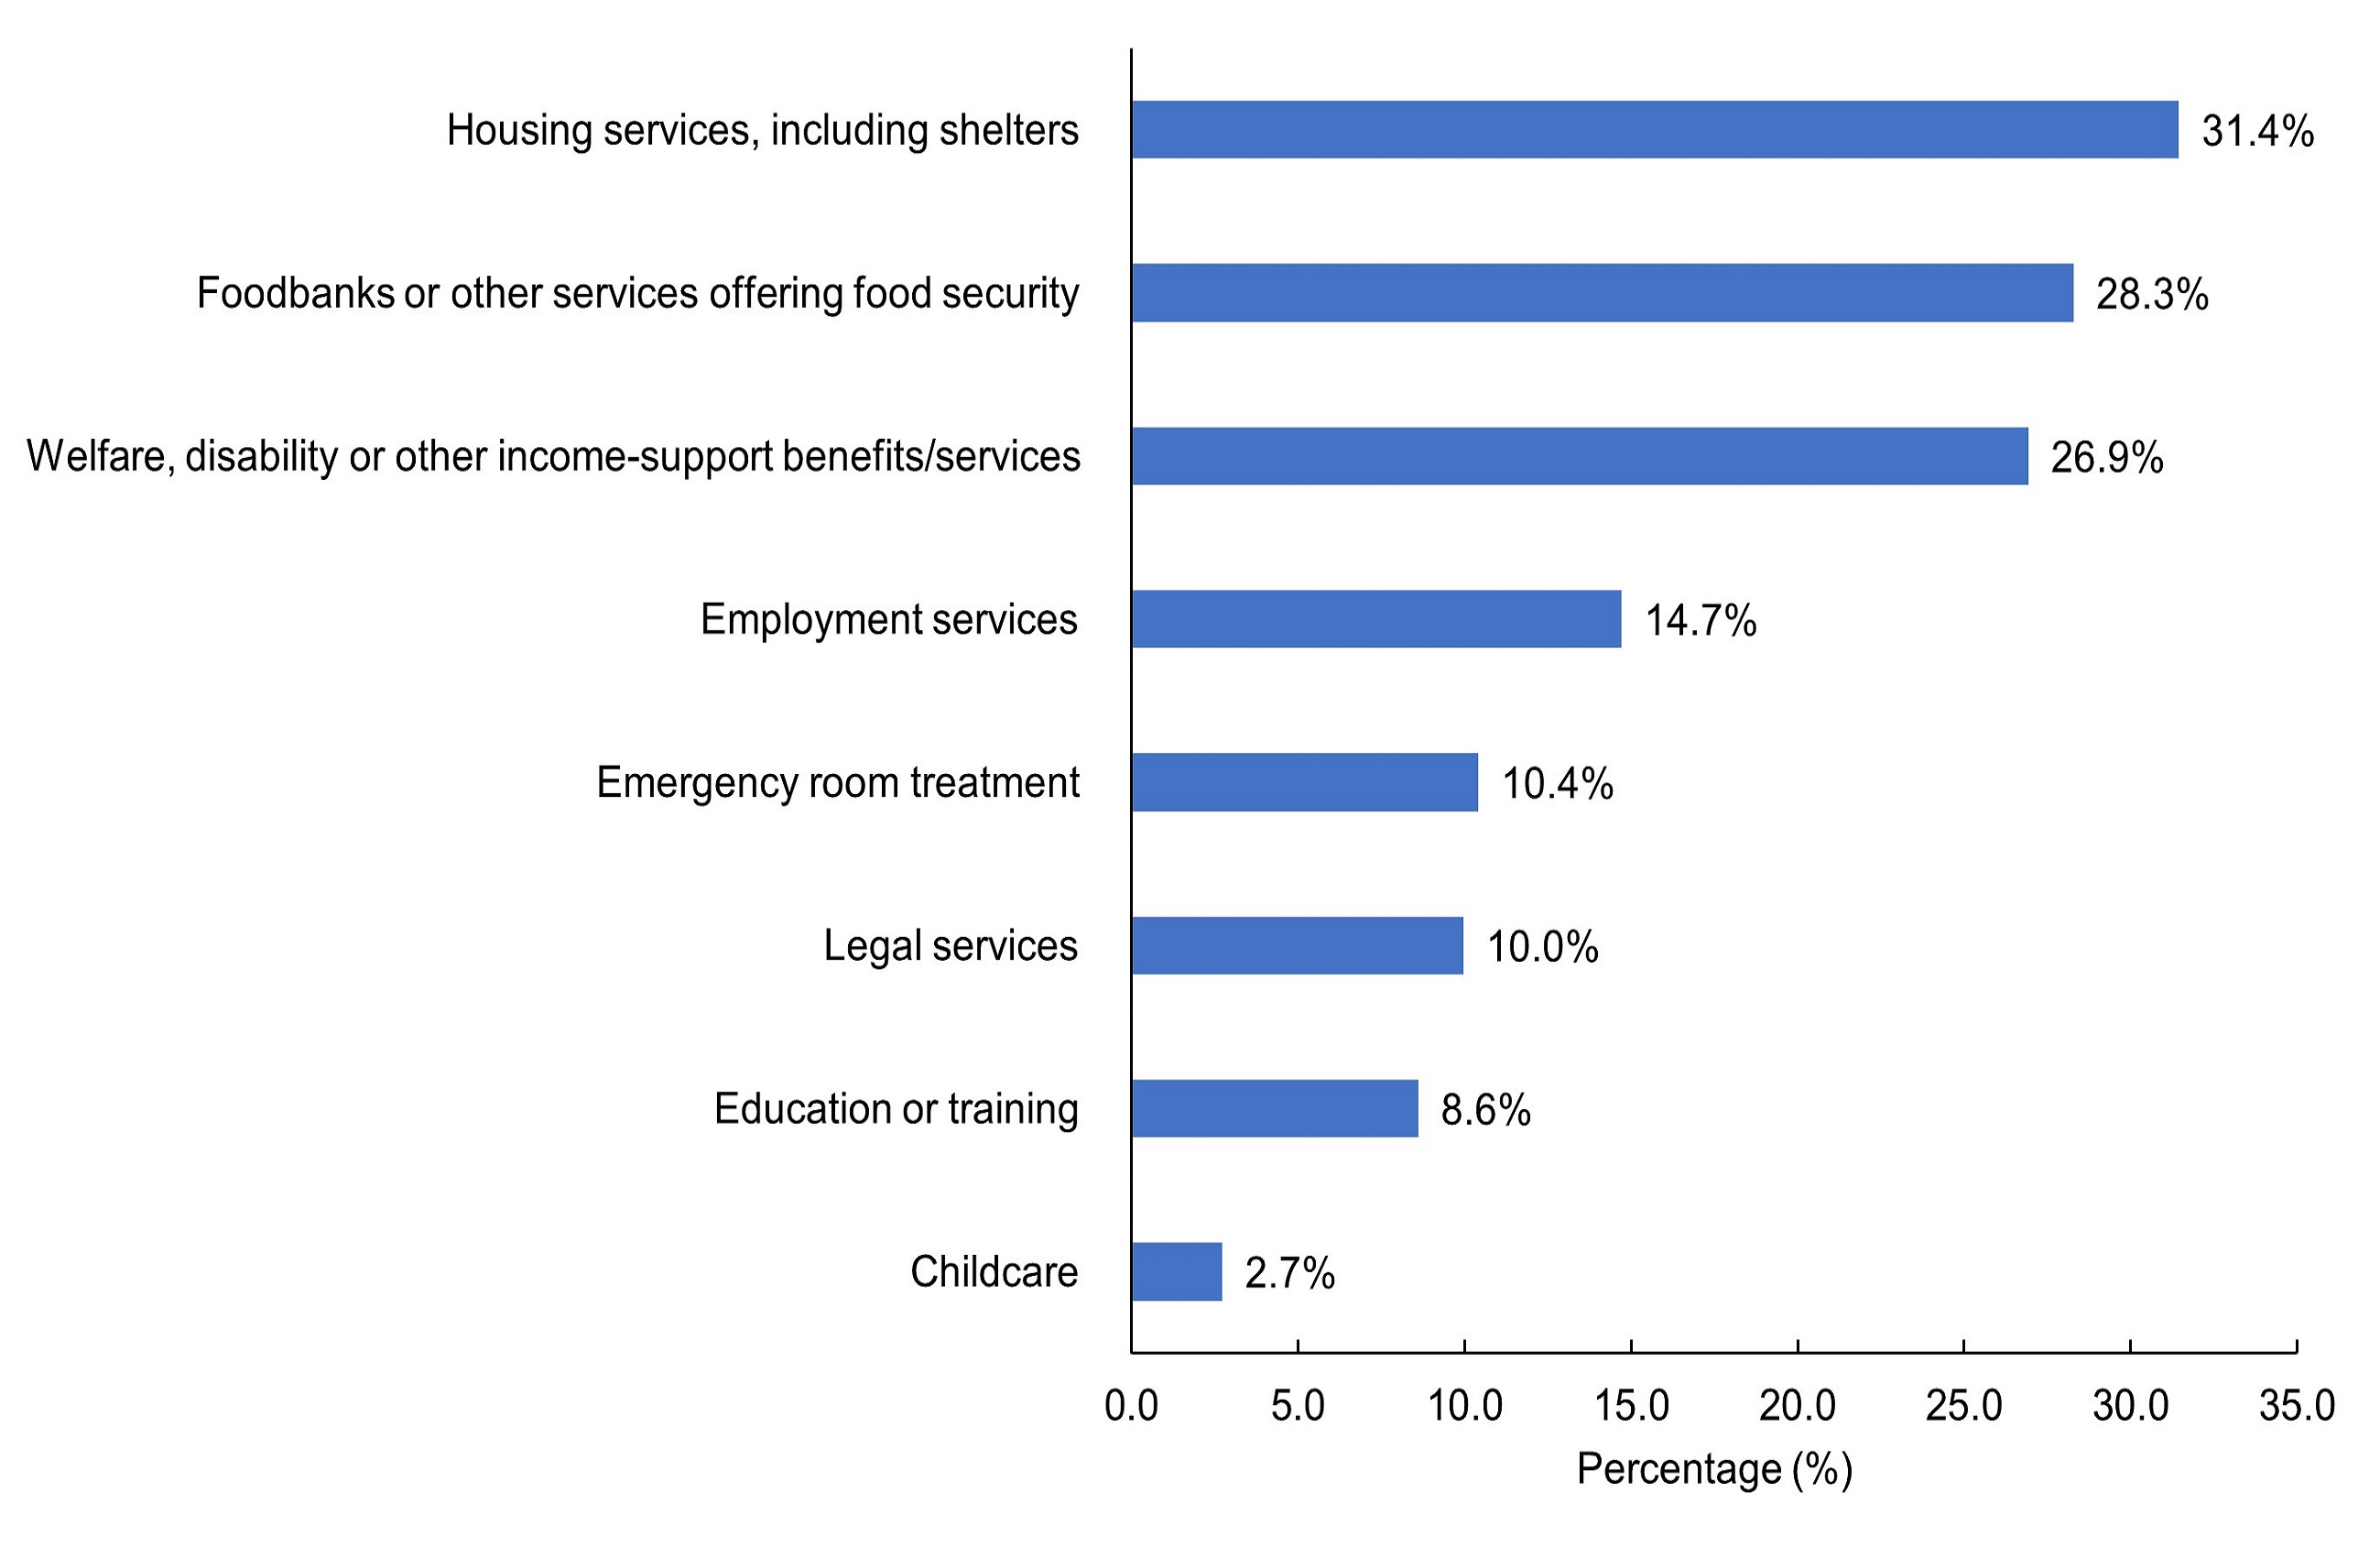
Figure 6 - Text description
| Services accessed other than alcohol and/or drug treatment | Number of participants | Percentage of participants (%) | Total |
|---|---|---|---|
| Housing services, including shelters | 139 | 31.4 | 442 |
| Foodbanks or other services offering food security | 125 | 28.3 | 442 |
| Welfare, disability or other income-support benefits/services | 119 | 26.9 | 442 |
| Employment services | 65 | 14.7 | 442 |
| Emergency room treatment | 46 | 10.4 | 442 |
| Legal services | 44 | 10.0 | 442 |
| Education or training | 38 | 8.6 | 442 |
| Childcare | 12 | 2.7 | 442 |
|
Note: Categories were not mutually exclusive. |
|||
Limitations
- The survey results are not generalizable to the general Canadian population.
- Recruitment difficulties due to reduced staffing during the COVID-19 pandemic, Hurricane Fiona in Atlantic Canada, and the general logistics of engaging with the hard-to-reach population of street-involved youth may have contributed to low response rates. As a result, sampling may not capture differences between sentinel sites in a region, and prevalence estimates may not be representative of the street-involved youth population.
- The data collection process may have led to engagement issues for some respondents (e.g., questionnaire was too long or repetitive, respondents did not want their responses audio recorded). This, in turn, affected low completion rates.
- Recall errors when self-reporting on past drug use (i.e., recall bias) or answering in a way to minimize drug use behaviors due to stigma (i.e., social desirability bias) may have contributed to underreporting of substance use prevalence.
- Impacts of the COVID-19 pandemic (e.g., economic stress, social isolation, reduced access to drug treatment services) may have influenced substance use among street-involved youth.
- The sample size of this survey was not large enough to perform statistical tests on the results.
- The estimate of participants currently attending a school, college, CEGEP or university may have been influenced by the significant number of participants that completed the survey during the summer months when school was not in session.
Technical Notes
- The option 'Not a visible minority' includes Indigenous people, in accordance with the Employment Equity Act and Statistics Canada's definition of 'Visible minority of a person'. Visible minority includes identifying as Black, East/Southeast Asian, Latino, Middle Eastern, South Asian, or other raceFootnote 7.
Acknowledgements
We would like to acknowledge and thank the contributions of the street-involved youth who shared their experiences as part of the PWLLES. The PWLLES was possible due to the collaboration between 16 centres across Canada that serve street-involved youth and the Office of Drug Research and Surveillance at Health Canada.
References
- Reference 1
-
Adlaf EM, Zdanowicz YM. A cluster-analytic study of substance problems and mental health among street youths. Am J Drug Alcohol Abuse. 1999 Nov;25(4):639-60. doi: 10.1081/ada-100101884. PMID: 10548440.
- Reference 2
-
Boivin, J. F., Roy, E., Haley, N., & Galbaud du Fort, G. (2005). The health of street youth: a Canadian Perspective. Canadian Journal of Public Health, 96(6), 432-437.
- Reference 3
-
Kirst, M., Erickson, P. G., & Strike, C. (2009). Poly-substance use among female and male street youth in Toronto. International Journal of Social Inquiry, 2(2), 123-139.
- Reference 4
-
Kirst, M., Frederick, T., & Erickson, P. G. (2011). Concurrent mental health and substance use problems among street-involved youth. International Journal of Mental Health and Addiction, 9(4), 347-364.
- Reference 5
-
Roy, E., Haley, N., Leclerc, P., Sochanski, B. Boudreau, J. F., & Boivin, J. F. (2004). Mortality in a cohort of street youth in Montreal. Journal of the American Medical Association, 292(5), 569-574.
- Reference 6
-
Kirst M., Erickson P. Substance use & mental health problems among street-involved youth: The need for a harm reduction approach. Homeless Hub. https://www.homelesshub.ca/sites/default/files/11KIRSTweb.pdf
- Reference 7
-
Government of Canada (2021). Visible minority of person. Government of Canada, Statistics Canada. https://www23.statcan.gc.ca/imdb/p3Var.pl?Function=DEC&Id=45152