
Annual Report 2019
ISSN: 1495-0561
Cat. no.: H78E-PDF
PDF version (2.3 MB)
Table of Contents
- Statistical Highlights 2019
- Letter to the Minister
- Chairperson's Message
- About the Patented Medicine Prices Review Board: Acting in the Interest of Canadians
- Regulating Prices of Patented Medicines: Continued Vigilance Necessary
- Key Pharmaceutical Trends: More Expensive Medicines Continue to Influence Sales
- The National Prescription Drug Utilization Information System: Supporting Health Care Decision Making in Canada
- Analysis of Research and Development Expenditures: R&D Investment Falling Short of Target
- Appendix 1: Glossary
- Appendix 2: Patented Medicines First Reported to the PMPRB in 2019
- Appendix 3: Pharmaceutical Trends - Sales
- Appendix 4: Research and Development
Statistical Highlights 2019
Regulatory Mandate
- 1,364 patented medicines for human use were reported to the PMPRB, including 81 new medicines.
- 12 Voluntary Compliance Undertakings were accepted as of December 31, 2019.
- $3.5 million in excess revenues were offset by way of payments to the Government of Canada, in addition to price reductions.
Reporting Mandate
Sales Trends:
- Sales of patented medicines in Canada reached $17.2 billion in 2019, a moderate increase of 3.5% from the previous year.
- Patented medicines accounted for approximately 60% of the sales of all medicines in Canada.
Price Trends:
- Prices of existing patented medicines were stable, while the Consumer Price Index rose by 1.9%.
- Canadian prices were fourth highest among the seven PMPRB comparator countries, lower than prices in Switzerland, Germany, and the US.
- Canadian list prices were fourth highest among 31 Organisation for Economic Co-operation and Development (OECD) countries, lower only than prices in Switzerland, Germany and the US.
Research and Development:
R&D-to-sales ratios decreased in 2019:
- 3.9% for all patentees, a slight decrease from 4.0% in 2018.
- 3.9% for Innovative Medicines Canada members, a decrease from 4.3% in 2018.
R&D expenditures:
- $893.2 million in total R&D expenditures reported by patentees, an increase of 0.1% over 2018.
- $652.6 million in R&D expenditures reported by Innovative Medicines Canada members, a decrease of 9.7% over 2018.
Letter to the Minister
January 15, 2021
The Honourable Patty Hajdu, P.C., M.P.
Minister of Health
House of Commons
Ottawa, Ontario
K1A 0A6
Dear Minister:
I have the pleasure to present to you, in accordance with sections 89 and 100 of the Patent Act, the Annual Report of the Patented Medicine Prices Review Board for the year ended
December 31, 2019.
Yours very truly,
Dr. Mitchell Levine
Chairperson
Chairperson’s Message
The Patented Medicine Prices Review Board (PMPRB) is an independent quasi-judicial body established by Parliament in 1987 under the Patent Act (the Act). The PMPRB’s mandate is to protect and inform Canadians by ensuring that the prices of patented medicines sold in Canada are not excessive and by reporting on pharmaceutical trends.
This past year was a busy and important one for the PMPRB. The organization focused on completing the final steps in a multiyear effort to strengthen and modernize our regulatory framework. To that end, in November 2019, we published a draft set of new pricing Guidelines, followed by the most intensive and far reaching public consultation in our more than three decades long history. In June 2020, following the Government’s announcement of its decision to postpone the coming into force of the amended Patented Medicines Regulations (Regulations) by six months, to January 1, 2021, due to the COVID-19 pandemic, the PMPRB published a second draft set of new Guidelines that reflected our understanding of the feedback we received on the first draft. This was followed by another round of consultations which ended on August 4, 2020.
In terms of pharmaceutical trends, the most striking takeaway from this year’s Annual Report is the unprecedented 0.6% decrease in total spending on patented medicines. This can be explained by the fact that some key top-selling medicines stopped reporting to the PMPRB in 2018, including Remicade the highest selling prescription medicine in Canada. In 2018, medicines that previously reported to the PMPRB accounted for estimated sales of $3.3 billion, or 11.6% of all sales. This is a marked increase over the previous year and considerably more than a decade ago when medicines that formerly reported to the PMPRB accounted for $0.7 billion in sales, or 3.2% of all sales. Historically patented medicines have experienced a substantial erosion in market share upon loss of patent protection, however, recently that same effect has not been observed in a number of very high cost, biologic medicines that have come off patent. Given the significance of this phenomenon, the PMPRB has added new content to its Annual Report to track the impact of this trend as the market for these medicines matures.
Our efforts to complete the regulatory modernization process took place in parallel to our usual and customary work under our reporting mandate of identifying and analyzing key pharmaceutical trends in Canada. In 2019-20, the PMPRB published seven analytical reports, three chartbooks and eight presentation posters under its National Prescription Drug Utilization Information System (NPDUIS) banner. The chief takeaway from all that work is the notable rise in the sales of higher-cost medicines Canada has experienced in recent years. Over the last five years, sales of patented medicines grew by an average of 4.5% per year, reaching $17.2 billion in 2019. The increasing use of higher-cost medicines remains the primary cost driver for Canadian public and private drug plans. Indeed, high-cost, biologic, oncology and targeted treatments now account for approximately half of all sales in patented medicines in Canada. This is a dramatic increase from the 10% of less than a decade ago. To put this trend in context, in 2009, only one of the top ten selling patented medicines in Canada had a treatment cost over $1000/year. In 2019, seven of the top ten selling patented medicines had annual treatment costs that exceeded $10,000/year.
Canadian list prices of patented medicines are the fourth highest in the Organisation for Economic Co-operation and Development (OECD), still well behind the US but just marginally lower than Germany and Switzerland. Conversely, the R&D to sales ratio of pharmaceutical patentees in Canada continues its decades-long decline and now stands at 3.9%, its lowest level since the PMPRB first began reporting on pharmaceutical trends in the 1980s.
Once the PMPRB’s new Guidelines are finalized and the amended regulations come into force in January 2021, we look forward to working with all of our stakeholders on a comprehensive Guidelines Monitoring and Evaluation Plan (GMEP) that will enable us to assess the impact of the new regime and fine tune it in real time so that the PMPRB can continue to protect Canadians from excessive prices while avoiding any unintended consequences to other aspects of our health care system.
The PMPRB has been in reform mode for the better part of five years. Once the final Guidelines are published and the amended Regulations come into force, we look forward to a new and exciting chapter of applying our consumer protection powers responsibly and with the best interests of all Canadians at heart.
Dr. Mitchell Levine
Chairperson
About the Patented Medicine Prices Review Board: Acting in the Interest of Canadians
The Patented Medicine Prices Review Board (PMPRB) is an independent, quasi-judicial body established by Parliament in 1987 under the Patent Act (Act).
The PMPRB is a quasi-judicial administrative agency with a dual regulatory and reporting mandate. Through its regulatory mandate, it ensures that the prices of patented medicines sold in Canada are not excessive. The PMPRB also reports on trends in pharmaceutical sales and pricing for all medicines and on research and development (R&D) spending by patentees. In addition, at the request of the Minister of Health pursuant to Section 90 of the Act, the PMPRB conducts critical analyses of price, utilization, and cost trends for patented and non-patented prescription medicines under the National Drug Utilization Information System (NPDUIS) initiative. Its reporting mandate provides pharmaceutical payers and policy makers with information to make rational, evidence-based reimbursement and pricing decisions.
The PMPRB is part of the Health Portfolio, which includes Health Canada, the Public Health Agency of Canada, the Canadian Institutes of Health Research and the Canadian Food Inspection Agency. The Health Portfolio supports the Minister of Health in maintaining and improving the health of Canadians.
Our Mission:
The PMPRB is a respected public agency that makes a unique and valued contribution to sustainable spending on pharmaceuticals in Canada by:
- Providing stakeholders with price, cost, and utilization information to help them make timely and knowledgeable pricing, purchasing, and reimbursement decisions; and
- Acting as an effective check on the prices of patented medicines through the responsible and efficient use of its consumer protection powers.
Protecting Consumers in a Complex Marketplace
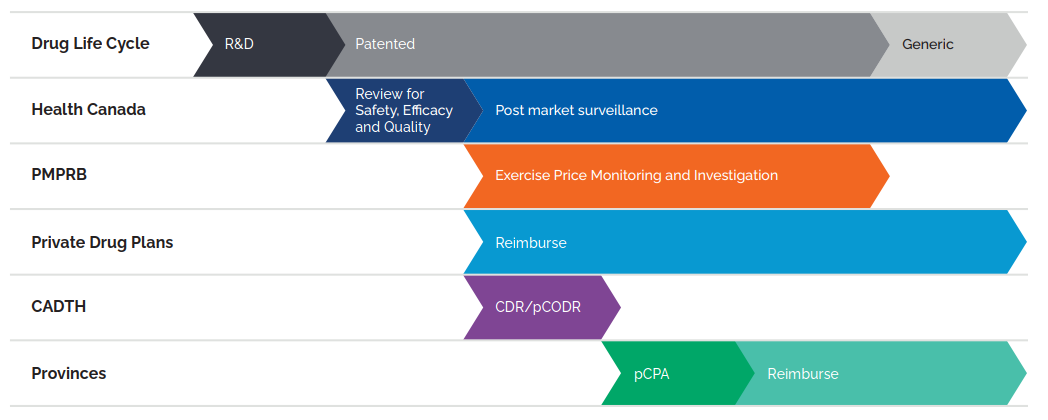
Figure description
This flowchart illustrates the role of Canadian regulators during the life cycle of a medicine through research and development, the patent period, and post-patent generic period. Health Canada reviews medicines for safety, efficacy, and quality at the start of the patent period and provides subsequent post-market surveillance. The PMPRB exercises price monitoring and investigation during the patent period, after Health Canada’s review. Private drug plans reimburse during and after the patent period, following Health Canada’s review. CADTH conducts the Common Drug Review and pan-Canadian Oncology Drug Review processes after Health Canada’s review. For provinces and territories, the pan-Canadian Pharmaceutical Alliance negotiations begin after CADTH reviews, and reimbursement is after these negotiations.
(CADTH) Canadian Agency for Drugs and Technologies in Health; (CDR) Common Drug Review; (pCODR) pan-Canadian Oncology Drug Review; and (pCPA) pan-Canadian Pharmaceutical Alliance
Data source: PMPRB
Although part of the Health Portfolio, because of its quasi-judicial responsibilities, the PMPRB carries out its mandate at arm’s length from the Minister of Health, who is responsible for the sections of the Act pertaining to the PMPRB. The PMPRB also operates independently of other healthcare related bodies such as:
- Health Canada, which approves medicines for marketing in Canada based on their safety, efficacy and quality;
- federal, provincial and territorial (F/P/T) public drug plans, working collectively as the pCPA, which approve the listing of medicines on their respective formularies for reimbursement purposes; and
- the Common Drug Review and pan-Canadian Oncology Drug Review, administered by the CADTH, which recommends which new medicines should qualify for reimbursement by the pCPA.
The PMPRB is composed of public servants (Staff) who are responsible for carrying out the organization’s day-to-day work, and Board Members, Governor-in-Council appointees who serve as hearing panel members in the event of a dispute between Staff and a patentee over the price of a patented medicine.
Jurisdiction
Regulatory
The PMPRB regulates the maximum ceiling price at which patentees (companies) may sell their products to wholesalers, hospitals, pharmacies and other large distributors. This price is sometimes also known as the “factory gate” (ex-factory) price. The PMPRB does not regulate the prices of non-patented medicines.
The PMPRB’s jurisdiction is not limited to medicines for which the patent is for the active ingredient or for the specific formulation(s) or uses the patentee sells the medicine for in Canada. Rather, its jurisdiction also covers medicines for which a patent “pertains” including patents for manufacturing processes, delivery systems or dosage forms, indications/use and any formulations.
The Act requires patentees (which include any parties who benefit from patents regardless of whether they are owners or licensees under those patents and regardless of whether they operate in the “brand” or “generic” sector of the market) to inform the PMPRB of their intention to sell a new patented medicine. Upon the sale of a new patented medicine, patentees are required to file price and sales information at introduction and, thereafter, until all patents pertaining have expired. Patentees are not required to obtain approval of the price to be able to market their medicines. However, the Act requires the PMPRB to ensure that the prices of patented medicines sold in Canada are not excessive.
Our Vision:
A sustainable pharmaceutical system where payers have the information they need to make smart reimbursement choices and Canadians can afford the patented medicines they need to live healthy and productive lives.
Staff reviews the prices that patentees charge for each individual strength and form of a patented medicine. If the price of a patented medicine appears to be potentially excessive, Staff will first try to reach a voluntary resolution by the patentee. If this fails, the Chairperson can decide that the matter should go to a hearing. At the hearing, a panel composed of Board members acts as a neutral arbiter between Staff and the patentee. If a panel finds that the price of a patented medicine is excessive, it can order the price be reduced to a non-excessive level. It can also order a patentee to make a monetary payment to the Government of Canada to offset the excess revenues earned and, in cases where the panel determines there has been a policy of excessive pricing, it can double the amount of the monetary payment.
Reporting
1,364 Patented medicines were reported to the PMPRB in 2019.
As required by the Act, the PMPRB reports annually to Parliament through the Minister of Health on its price review activities, the prices of patented medicines and price trends of all prescription medicines, and on the R&D expenditures reported by pharmaceutical patentees.
In addition, pursuant to an agreement by the F/P/T Ministers of Health in 2001, and at the request of the Minister of Health pursuant to section 90 of the Act, the PMPRB conducts critical analyses of price, utilization and cost trends for patented and non-patented prescription medicines under the National Prescription Drug Utilization Information System (NPDUIS). The PMPRB publishes the results of NPDUIS analyses in the form of research papers, posters, presentations and briefs. This program provides F/P/T governments and other interested stakeholders with a centralized, objective and credible source of information on pharmaceutical trends.
Among other initiatives under its reporting mandate, the PMPRB also hosts various forums, such as webinars, research forums and information sessions, with academics and policy experts to discuss and disseminate research on emerging areas for study on pharmaceutical trends in Canada and internationally.
Communications and Outreach
The PMPRB takes a proactive and plain-language approach to its external communication activities. This includes targeted social media campaigns and more conventional (e.g., email and telephone) engagement with domestic, international and specialized news media. The PMPRB is actively pursuing additional opportunities to leverage new and emerging media to communicate with Canadians and its stakeholders.
The PMPRB recognizes the importance of openness and transparency as we continue to work on modernizing the way we carry out our mandate. We communicate regularly, through various channels, about our progress, including projected timelines, and key milestones. Engagement with stakeholders will remain a central part of our multi-faceted communications approach. Reporting on our progress helps ensure we remain focused on delivering results.
Governance
The Board consists of not more than five members who serve on a part-time basis. Board members, including a Chairperson and a Vice-Chairperson, are appointed by the Governor-in-Council. The Chairperson, designated under the Act as the Chief Executive Officer of the PMPRB, has the authority and responsibility to supervise and direct its work. By law, the Vice-Chairperson exercises all the powers and functions of the Chairperson when the Chairperson is absent or incapacitated, or when the office of the Chairperson is vacant.
The members of the Board, including the Chairperson, are collectively responsible for implementing the applicable provisions of the Act. Together, they establish the guidelines, rules, by-laws and other policies of the PMPRB provided for by the Act (section 96) and consult, as necessary, with stakeholders including provincial and territorial Ministers of Health, representatives of consumer groups, the pharmaceutical industry and others.
Members of the Board
Chairperson
Mitchell Levine,
BSc, MSc, MD, FRCPC, FISPE, FACP

Dr. Mitchell Levine was appointed Chairperson of the Board on February 13, 2018.
Dr. Levine is a professor in both the Department of Health Research Methods, Evidence and Impact and in the Department of Medicine, Division of Clinical Pharmacology & Toxicology at McMaster University in Hamilton, Ontario. He is also an Assistant Dean in the Faculty of Health Sciences and a faculty member of the Centre for Health Economics and Policy Analysis at McMaster.
Dr. Levine received his medical degree from the University of Calgary in 1979, followed by postgraduate medical training in Internal Medicine (FRCPC) and in Clinical Pharmacology at the University of Toronto (1981–1987). He received an MSc degree in Clinical Epidemiology from McMaster University in 1988.
Prior to his appointment to the Board, Dr. Levine was a member of the PMPRB’s Human Drug Advisory Panel. He currently acts on an ad hoc basis as a clinical pharmacology consultant to the Ontario Ministry of Health and Ministry of Long-Term Care. In addition, he is a Deputy Editor of the ACP Journal Club: Evidence-Based Medicine.
This is Dr. Levine’s second term as a Board member. He was initially appointed as its Vice-Chairperson in 2011.
Vice-Chairperson
Mélanie Bourassa Forcier
LLB., LL.L, MSc, LL.M., DCL

Mélanie Bourassa Forcier was appointed Vice-Chairperson of the Board on June 19, 2019.
Ms. Bourassa Forcier is an Associate Professor in the Faculty of Law at the Université de Sherbrooke. She directs the Law and Health Policy, and Law and Life Sciences programs. She has expertise in the regulation, marketing and reimbursement of new medical technologies.
Professor Bourassa Forcier has published numerous books and articles on the subject of pharmaceutical regulation and health law. She holds a Ph.D. in Pharmaceutical Patent Law from McGill University, an MSc in International Health Policy from the London School of Economics and Political Science, and an LL.L. from the University of Ottawa.
Members
Carolyn Kobernick,
B.C.L., LL.B.
Carolyn Kobernick was appointed Member of the Board on June 13, 2014.
Ms. Kobernick is a lawyer and former public servant. Prior to her retirement in 2013, Ms. Kobernick was Assistant Deputy Minister of Public Law for the Department of Justice. As principal counsel to the Minister of Justice and Attorney General of Canada, Ms. Kobernick was instrumental in the development and delivery of policy for the Public Law sector. In addition to identifying key strategic, legal and operational matters, she tackled cross-cutting national issues as the liaison between the Department of Justice and other government organizations.
Ms. Kobernick joined the Department of Justice in 1980, where she practiced litigation and tax law at the Toronto Regional office. In 1991, she was appointed Senior General Counsel, Deputy Head, Business and Regulatory Law Portfolio, after working for over a decade in the legal services unit of the Correctional Service of Canada. In her role as Senior General Counsel, Ms. Kobernick was involved in complex federal policy and operational issues, including the Alaska Pipeline and Mackenzie Valley Pipeline files and the Sponsorship file.
During her career with the public service, Ms. Kobernick actively participated in many high- profile initiatives. She was Chair of the National Legal Advisory Committee and Departmental Champion for Aboriginal People and Gender Equity. She also served as the Senior Department of Justice official at the Domestic Affairs Cabinet Committee, and was appointed Senior Legal Advisor to the Government of Canada for the 2004 Gomery Inquiry.
Ms. Kobernick holds a B.C.L. and LL.B. from McGill University and is a member of the bar of Ontario. In 2012 she obtained a Certificate in Adjudication for Administrative Agencies, Boards and Tribunals from the Osgoode Hall Law School and the Society of Ontario Adjudicators and Regulators.
Dr. Ingrid Sketris,
BSc (Pharm), PharmD, MPA(HSA), Clinical Toxicology Residency

Dr. Ingrid Sketris was appointed Member of the Board on June 29, 2018.
Dr. Sketris is a licensed pharmacist and a professor at the College of Pharmacy, Dalhousie University, with cross appointments to Medicine and Health Administration.
Dr. Sketris received her Doctor of Pharmacy in 1979 from the University of Minnesota, followed by her residency in Clinical Toxicology at the University of Tennessee Centre for the Health Sciences. She also received a Master of Public Administration/Health Services Administration from Dalhousie University.
She is a leader in pharmacy, and has served as President of the Association of Faculties of Pharmacy of Canada and as a board member of the Canadian Council for Accreditation of Pharmacy Programs.
Dr. Sketris is a Fellow of the Canadian Society of Hospital Pharmacists, the American College of Clinical Pharmacy and the Canadian Academy of Health Sciences. She was previously elected to the US National Academies of Practice.
Matthew Herder,
B.Sc. (hons), LL.B., LL.M., J.S.M.

Matthew Herder was appointed Member of the Board on June 29, 2018.
Mr. Herder is the Director of the Health Law Institute at Dalhousie University as well as an Associate Professor in the Department of Pharmacology in the Faculty of Medicine, with a cross-appointment to the Schulich School of Law.
Mr. Herder’s research focuses on biomedical innovation policy, with a particular emphasis on intellectual property rights and the regulation of biopharmaceutical interventions. His work is often interdisciplinary and policy-oriented, and he has received grants from the Canadian Institutes of Health Research and the Royal Society of Canada, in addition to appearing as an expert witness before several Parliamentary committees on pharmaceutical regulation and policy.
Prior to arriving at Dalhousie, Mr. Herder was the Ewing Marion Kauffman Foundation Legal Research Fellow at New York University’s School of Law. He was a Law Clerk at the Federal Court of Canada and was admitted to the Law Society of Upper Canada. Mr. Herder holds a Master of the Science of Law degree from Stanford Law School as well as two law degrees from Dalhousie University.
Organizational Structure and Staff
PMPRB Organizational Chart
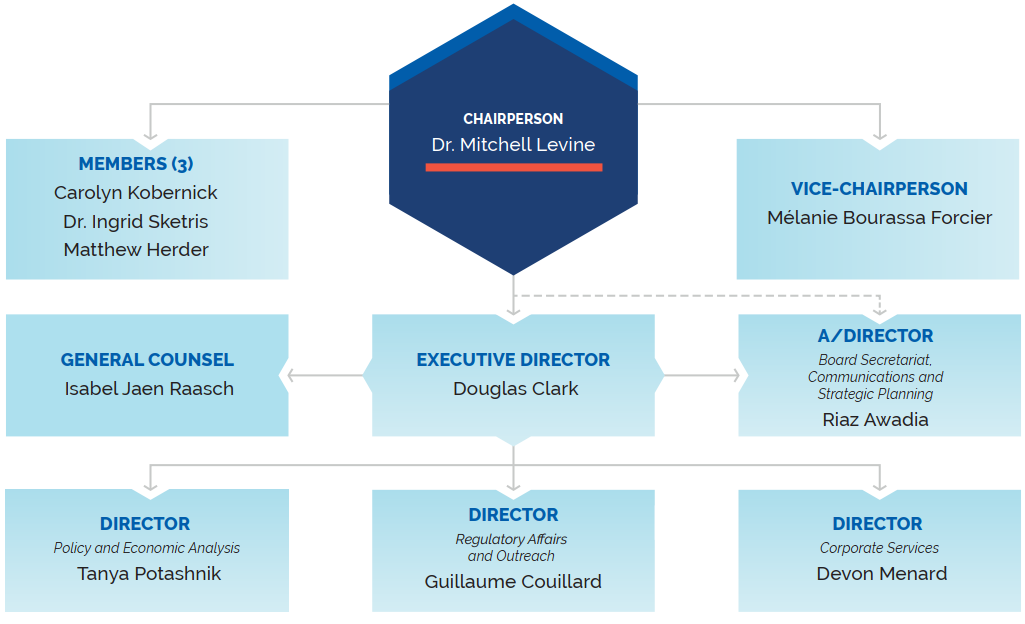
Figure description
This organizational chart illustrates the high-level reporting structure within the PMPRB and lists the current Board and Senior Staff members. Board: Chairperson— Dr. Mitchell Levine; Vice-Chairperson— Mélanie Bourassa Forcier; Members— Carolyn Kobernick, Ingrid Sketris, Matthew Herder. Senior Staff: Executive Director— Douglas Clark; General Counsel— Isabel Jaen Raasch; A/Director Board Secretariat, Communications and Strategic Planning— Riaz Awadia; Director Policy and Economic Analysis— Tanya Potashnik; Director Regulatory Affairs and Outreach— Guillaume Couillard; Director Corporate Services— Devon Menard.
Executive Director
The Executive Director is responsible for advising the Board and for the leadership and management of Staff.
Regulatory Affairs and Outreach
The Regulatory Affairs and Outreach Branch reviews the prices of patented medicines sold in Canada to ensure they are not excessive; ensures that patentees are fulfilling their filing obligations; encourages patentees to comply voluntarily with the PMPRB’s Guidelines; implements related compliance policies; and investigates complaints into the prices of patented medicines.
Policy and Economic Analysis
The Policy and Economic Analysis Branch develops policy and strategic advice; leads stakeholder consultations, and makes recommendations on possible amendments to the PMPRB’s Guidelines; conducts research and analysis on the prices of medicines, pharmaceutical market developments, and R&D trends; and publishes studies aimed at providing F/P/T governments and other interested stakeholders with centralized, objective, and credible information in support of evidence based policy.
Corporate Services
The Corporate Services Branch provides advice and services in relation to human resources management; facilities; procurement; health, safety and security; information technology; and information management. It is also responsible for financial planning and reporting, accounting operations, audit and evaluation, and liaising with federal central agencies on these topics.
Board Secretariat, Communications and Strategic Planning
The Board Secretariat, Communications and Strategic Planning Branch develops and manages the PMPRB’s communications, media relations, and public enquiries; manages the Board’s meeting and hearing processes, including the official record of proceedings; and coordinates activities pursuant to the Access to Information Act and the Privacy Act. It is also responsible for strategic planning and reporting.
General Counsel
The General Counsel advises the PMPRB on legal matters and leads the legal team representing Staff in proceedings before the Board.
Budget
In 2019-20, the PMPRB had a budget of $16.6 million and an approved staff level of 82 full-time equivalent employees.
Table 1. Budget and Staffing
| 2018-19 | 2019-20 | 2020-21 | |
|---|---|---|---|
| Budget* | $14,871,872 |
$16,612,511 |
$17,804,400 |
| Salaries and employee benefits | $8,373,171 |
$9,636,550 |
$10,054,721 |
| Operating | $3,079,220 |
$2,699,395 |
$2,491,893 |
| Special Purpose Allotment** | $3,419,481 |
$4,276,566 |
$5,257,786 |
| Full Time Employees (FTEs) | 72 |
82 |
87 |
* Budget amounts are based on the Main Estimates
** The Special Purpose Allotment is reserved strictly for external costs of public hearings (legal counsel, expert witnesses, etc.). Unspent funds are returned to the Consolidated Revenue Fund.
Regulating Prices of Patented Medicines: Continued Vigilance Necessary
Medical advancements have introduced many innovative new medicines to the Canadian marketplace to improve existing treatments and to treat conditions that previously had no pharmaceutical therapy. However, many of these new medicines come at a very high cost. Since 1987, pharmaceutical costs in Canada have grown at an average annual rate of 7.2%Footnote 1, outpacing all other health care costs and growing at well over 3 times the pace of inflation.
At 15.7% of total health care spending, pharmaceuticals now rank ahead of spending on physicians.Footnote 2 About 1 in 5 Canadians reports having no prescription medicine coverage and many more are under-insured or face high deductibles or co-pays. Almost 1 in 10 Canadians have had to forego filling a prescription medicine in the past year for reasons related to cost.Footnote 3
The PMPRB protects the interests of Canadian consumers by ensuring that the prices of patented medicines sold in Canada are not excessive. It does this by reviewing the prices that patentees charge for each individual patented medicine and by ensuring that patentees reduce their prices and pay back excess revenues where appropriate.
Reporting Requirements
By law, patentees must file information about the sale of their medicines in Canada. The Act, along with the Patented Medicines Regulations(Regulations) set out the information required and Staff reviews pricing information on an ongoing basis until all relevant patents have expired.
There are several factors used for determining whether the price of a medicine is excessive, as outlined in section 85 of the Act.
The Compendium of Policies, Guidelines and Procedures (Guidelines) details price tests and triage mechanisms used by Staff when it reviews and investigates the prices of patented medicines. The Guidelines are not binding and were developed in consultation with stakeholders, including the provincial and territorial Ministers of Health, consumer groups, and the pharmaceutical industry. When an investigation suggests that the price of a patented medicine may be excessive, the patentee is offered the opportunity to voluntarily lower its price and/or refund its excess revenues through a Voluntary Compliance Undertaking (VCU). If the patentee chooses not to submit a VCU, the Chairperson hold a hearing on the matter if he feels it is in the public interest. After hearing all the evidence, if the Board finds that a price is in fact excessive, it can issue an order requiring a patentee to reduce that price and/or refund excess revenues. Copies of the Act, the Regulations and the Guidelines are available on the PMPRB’s website.
Failure to Report
The PMPRB relies on patentees’ full and timely disclosure of any and all patented medicines being sold in Canada to which a patent pertains. In 2019, 10 medicines were reported to the PMPRB for the first time despite being patented and sold prior to 2019. (See Table 2, Failure to Report the Sale of Patented Medicines)
Failure to File Price and Sales Data (Form 2)
Failure to file refers to the complete or partial failure of a patentee to file the information required by the Act and the Regulations to the PMPRB. There were no Board Orders issued for failure to file in 2019
Table 2. Failure to Report the Sale of Patented Medicines
| Patentee | Brand name | Medicinal ingredient | Year medicine reported to the PMPRB as under PMPRB’s jurisdiction | Year medicine reported to the PMPRB with subsequent patent |
|---|---|---|---|---|
Knight Therapeutics Inc. |
Nerlynx |
neratinib |
2017 |
- |
Mitsubishi Tanabe Pharma Corporation |
Radicut |
edaravone |
2018 |
- |
Bausch Health, Canada Inc |
Prolensa |
bromfenac |
2015 |
- |
Chiesi USA Inc. |
Cardene IV (4 DINs) |
nicardipine hydrocholride |
2012 |
- |
Sun Pharmaceutical Industries, Inc |
Ilmya |
tildrakizumab |
2018 |
- |
Ipsen Biopharmaceuticals Canada Inc. |
Increlex |
mecasermin |
2016 |
- |
Novo Nordisk Canada Inc. |
Xultophy |
insulin degludec/liraglutide |
2018 |
- |
Shire Pharma Canada Inc. |
Obizur |
antihemophilic factor (recombinant), porcine Sequence |
2017 |
- |
Sun Pharmaceutical Industries, Inc. |
Odomzo |
sonidegib |
2012 |
- |
Indivior Canada Ltd |
Suboxone (3 DINs) |
buprenorphine/naloxone |
2019 |
- |
Data source: PMPRB
Scientific Review
Human Drug Advisory Panel
A scientific evaluation is done on all new patented medicines as part of the price review process. The PMPRB established the Human Drug Advisory Panel (HDAP) to provide advice to Staff. The HDAP conducts an evaluation when a patentee claims the new medicine provides a therapeutic improvement. The HDAP members review and evaluate the appropriate scientific information available, including any submission by a patentee about the proposed level of therapeutic improvement, the selection of comparator medicines, and comparable dosage regimens.
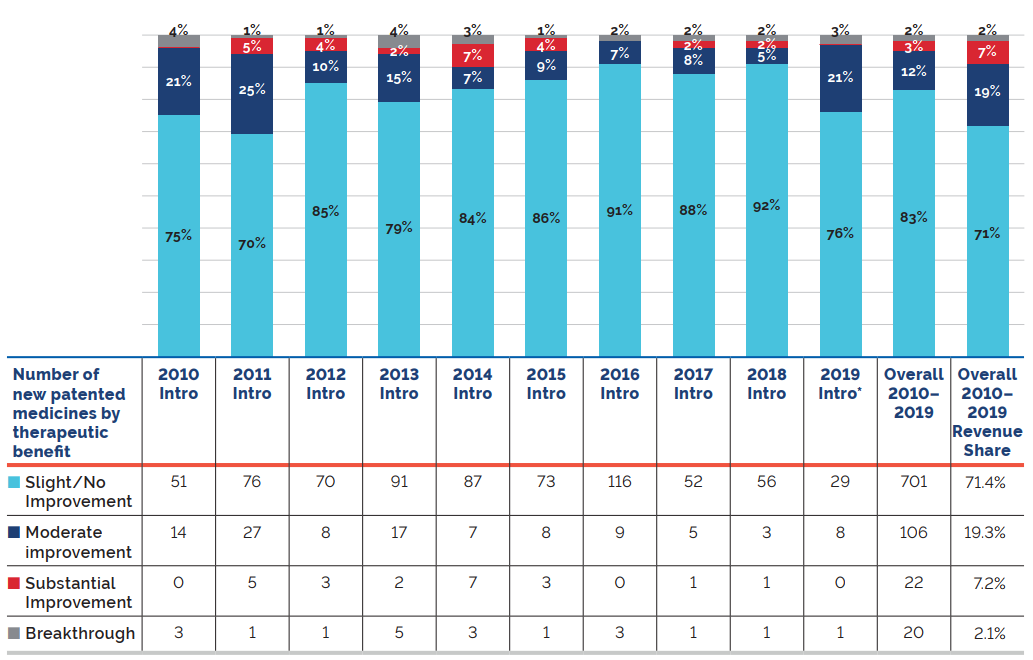
The HDAP evaluates the therapeutic benefit of new patented medicines according to the following definitions:
- Breakthrough: A medicine that is the first one sold in Canada to effectively treat a particular illness or effectively address a particular indication.
- Substantial Improvement: A medicine that, relative to other medicines sold in Canada provides substantial improvement in therapeutic effects.
- Moderate Improvement: A medicine that, relative to other medicines sold in Canada provides moderate improvement in therapeutic effects.
- Slight or No Improvement: A medicine that, relative to other medicines sold in Canada, provides slight or no improvement in therapeutic effects.
* Assessment as of March 31, 2020
Data source: PMPRB
Figure description
This bar graph depicts the breakdown in percentages of new patented medicines by therapeutic benefit over existing medicines in the year of introduction for the period 2010 to 2019.
|
Slight/No improvement |
Moderate improvement |
Substantial improvement |
Breakthrough |
Intro 2010 |
75% |
21% |
0% |
4% |
Intro 2011 |
70% |
25% |
5% |
1% |
Intro 2012 |
85% |
10% |
4% |
1% |
Intro 2013 |
79% |
15% |
2% |
4% |
Intro 2014 |
84% |
7% |
7% |
3% |
Intro 2015 |
86% |
9% |
4% |
1% |
Intro 2016 |
91% |
7% |
0% |
2% |
Intro 2017 |
88% |
8% |
2% |
2% |
Intro 2018 |
92% |
5% |
2% |
2% |
Intro 2019 |
71% |
19% |
7% |
2% |
The therapeutic benefit of all new patented medicines introduced from 2010 to 2019 is depicted by the Overall 2010-2019 bar. From 2010-2019; 83% new patented medicines were slight or no improvement, 12% were moderate improvement, 3% were substantial improvement, and 2% were breakthrough. The Overall 2010-2019 Revenue Share depicts the percentage of sales related to each level of therapeutic benefit: 71% of sales were medicines of little or no improvement, 19% were medicines of moderate improvement, 7% were medicines of substantial improvement, and 2% were breakthroughs.
Figure 1 illustrates the breakdown of new patented medicines in the year of introduction by therapeutic benefit for 2010 to 2019. The largest percentage of patented medicines (83.0%) introduced since 2010 were categorized as “Slight or No Improvement” in therapeutic benefit over existing therapies.Footnote 4
The “Overall 2010-2019” bar represents the therapeutic benefit breakdown for all new patented medicines introduced from 2010 to 2019. The “Overall 2010-2019 Revenue Share” bar illustrates the revenue share by therapeutic benefit for all new patented medicines introduced from 2010 to 2019.
Our motto

Protect, Empower, Adapt.
Price Review
The PMPRB reviews the average price of each strength of each individual dosage form of each patented medicine. In most cases, this unit is consistent with the Drug Identification Number(s) (DIN), (DINs) assigned by Health Canada at the time the medicine is approved for sale in Canada.
New Patented Medicines Reported to the PMPRB in 2019
For the purpose of this report, a new patented medicine in 2019 is defined as any patented medicine or new dosage form or strength of a patented medicine first sold in Canada, or previously sold but first patented, between December 1, 2018, and November 30, 2019.
There were 81 new patented medicines for human use reported as sold in 2019. Some are one or more strengths of a new active substance and others are new presentations of existing medicines. Of these 81 new patented medicines, 2 (2.5%) were being sold in Canada prior to the issuance of the Canadian patent that brought them under the PMPRB’s jurisdiction. Table 3 shows the year of first sale for these medicines.
Table 3. Number of New Patented Medicines for Human Use in 2019 by Year First Sold
| Year First Sold | Number of Medicines |
|---|---|
| 2017 | 1 |
| 2018 | 1 |
| 2019 | 79 |
| Total | 81 |
Data source: PMPRB
The list of New Patented Medicines Reported to PMPRB is available on the PMPRB’s website under “Regulating Prices”. This list includes information on the status of the review (i.e., whether the medicine is under review, within the Guidelines, under investigation, or subject to a VCU or Notice of Hearing). Figure 2 illustrates the number of new patented medicines for human use reported to the PMPRB from 1989 to 2019.

Data source: PMPRB
Figure description
This bar graph depicts the number of new patented medicines for human use reported to the Patented Medicine Prices Review Board by year. In 1989, 68 patented medicines for human use were reported to the PMPRB.
In 1990: 74; 1991: 94; 1992: 88; 1993: 77; 1994: 64; 1995: 81; 1996: 80; 1997: 93; 1998: 90; 1999: 111; 2000: 81; 2001: 82; 2002: 98; 2003: 77; 2004: 96; 2005: 68; 2006: 112; 2007: 77; 2008: 83; 2009: 81; 2010: 68; 2011: 109; 2012: 82; 2013: 115; 2014: 103; 2015: 86; 2016: 128; 2017: 80; 2018: 108; 2019: 81.
Of the 81 new patented medicines, the prices of 38 had been reviewed as of March 31, 2020:
- 29 were found to be within the thresholds set out in the Guidelines;
- 3 were at a level that appeared to exceed the thresholds set out in the Guidelines by an amount that did not trigger the investigation criteria; and
- 6 were at levels that appeared to exceed the thresholds set out in the Guidelines and resulted in investigations being commenced.
For a complete list of the 81 new patented medicines and their price review status, see Appendix 2.
Price Review of Existing Patented Medicines for Human Use in 2019
For the purpose of this report, existing patented medicines include all patented medicines first sold and reported to the PMPRB prior to December 1, 2018.
At the time of this report, there were 1,283 existing patented medicines:
- 919 were priced within the thresholds set out in the Guidelines;
- 202 had prices that appeared to exceed the thresholds set out in the Guidelines by an amount that did not trigger the investigation criteria;
- 122 were the subject of investigations;
- 17 were under review;
- 20 were the subject of a Voluntary Compliance Undertaking;
- 2 are the subject of a hearing; and
- 1 is subject to a price reduction and excess revenue payment order (currently partially stayed).
Table 4 provides a summary of the status of the price review of the new and existing patented medicines for human use in 2019.
Table 4. Patented Medicines for Human Use Sold in 2019—Status of Price Review as of March 31, 2020
| New medicines introduced in 2019 | Existing medicines | Total | |
|---|---|---|---|
| Total | 81 | 1,283 | 1,364 |
| Within Guidelines Thresholds | 29 | 919 | 948 |
| Under Review | 43 | 17 | 60 |
| Does Not Trigger Investigation | 3 | 202 | 205 |
| Under Investigation | 6 | 122 | 128 |
| Subject to Voluntary Compliance Undertaking | 0 | 19 | 191 |
| Price Hearing | 0 | 2 | 2 |
| Subject to Price Reduction Order (Stayed) | 0 | 1 | 1 |
1The terms and conditions of previous years VCUs that have carried over into 2018 are not captured in this count.
Data source: PMPRB
Update From the 2018 Annual Report
- Reviews of all the medicines for human use that were reported as Under Review in the 2018 Annual Report have been completed.
- 105 of the 128 investigations reported in the 2018 Annual Report resulted in one of the following:
- the closure of the investigation where it was concluded the price was within the thresholds set out in the Guidelines;
- a VCU by the patentee to reduce the price and offset excess revenues through a payment and/or a reduction in the price of another patented medicine (see Voluntary Compliance Undertakings); or
- a public hearing to determine whether the price was excessive, including any remedial Order determined by the Board (see Hearings).
Patented Over-the-Counter Medicines and Patented Medicines For Veterinary Use
Staff only reviews the prices of patented over-the-counter medicines, patented generic medicines and patented veterinary medicines when a complaint of excessive pricing has been received. No such complaints were received in 2019.
Voluntary Compliance Undertakings and Hearings
Voluntary Compliance Undertakings
A VCU is a written undertaking by a patentee to adjust its price to conform to the Board’s Guidelines. The Guidelines set out procedures for patentees to submit a VCU when, following an investigation by Staff, the price of a patented medicine sold in Canada appears to have exceeded the thresholds set out in the Guidelines. A VCU represents a promise by a patentee geared towards a satisfactory resolution of an investigation initiated by Staff under the Guidelines. A VCU takes into account the specific facts and underlying context of a particular case. VCUs are not intended to have precedential value.
In 2019, twelve VCUs were approved by the Chairperson. In addition to price reductions for certain medicines, excess revenues totaling $3,492,454.93 were offset by way of payments to the Government of Canada.
As of May 31, 2020, the Chairperson approved the closure of an investigation after the receipt of an additional VCU totalling $75.8 thousand bringing the total payments to the Government of Canada for 2019 up to May 31, 2020 to $3.6 million.
Table 5. Voluntary Compliance Undertakings in 2019 up to May 31, 2020
| Patented medicine brand name | Therapeutic use | Patentee | Date of approval | Offset of excessive revenues | |
|---|---|---|---|---|---|
| Price reduction | Payment to the government | ||||
VCUs in 2019 |
|||||
Triptorelin (sold under trade name Trelstar) |
Palliative treatment of hormone dependent advanced carcinoma of the prostate gland (stage D2) |
Paladin Labs Inc. |
January |
✓ |
$157,159.70 |
Belimumab (sold under trade name Benlysta) |
An adjunct to standard therapy for reducing disease activity in adult patients with active, autoantibody-positive, systemic lupus erythematosus (SLE) |
GlaxoSmithKline Inc. |
March |
✓ |
|
Dupilumab (sold under trade name Dupixent) |
Treatment of adult patients with moderate-to-severe atopic dermatitis whose disease is not adequately controlled with topical prescription therapies or when those therapies are not advisable. |
Sanofi-aventis Canada Inc. |
April |
✓ |
$1,654,520.73 |
Alirocumab (sold under trade name Praluent) |
An adjunct to diet and maximally tolerated statin therapy for the treatment of adults with heterozygous familial hypercholesterolemia (HeFH) or clinical atherosclerotic cardiovascular disease (CVD), who require additional lowering of low density lipoprotein cholesterol (LDL-C). |
Sanofi-aventis Canada Inc. |
April |
|
$426,955.62 |
Darunavir/cobicistat/emtricitabine |
An antiretroviral agent indicated as a complete regimen for the treatment of human immunodeficiency virus type 1 infection in adults and adolescents (aged 12 years and older with a body weight at least 40 kilograms) and with no known mutations associated with resistance to the individual components of Symtuza. |
Janssen Inc. |
April |
✓ |
$4,590.73 |
Ciproflaxacin/ |
For the treatment of infections caused by most strains of gram-positive and gram-negative microorganisms in the specific conditions including in part acute otitis media with otorrhea and acute otitis externa. |
Novartis Pharmaceuticals Canada Inc. |
June |
✓ |
$141,159.41 |
Moxifloxacin hydrochloride (sold under trade name Vigamox) |
For the treatment of patients one year of age and older with bacterial conjunctivitis caused by susceptible aerobic gram-positive and gram-negative bacterial strains. |
Novartis Pharmaceuticals Canada Inc. |
June |
✓ |
|
Olopatadine hydrochloride (sold under trade name Pataday) |
For the treatment of ocular itching associated with seasonal allergic conjunctivitis. |
Novartis Pharmaceuticals Canada Inc. |
June |
✓ |
$72,691.53 |
Crizotinib (sold under trade name Xalkori) |
A monotherapy for use in patients with anaplastic lymphoma kinase (ALK)-positive locally advanced (not amenable to curative therapy) or metastic non-small cell lung cancer (NSCLC) |
Pfizer Canada ULC |
June |
✓ |
$54,955.56 |
Sertraline hydrochloride (sold under trade name Zoloft) |
For the symptomatic relief of depressive illness, for symptomatic relief of panic disorder with or without agoraphobia, and for the symptomatic relief of obsessive-complusive disorder (OCD) |
Upjohn Canada ULC |
June |
✓ |
$754,647.71 |
Desmopressin acetate (sold under trade name Nocdurna) |
An antidiuretic for the treatment of nocturia in adults with four or less nocturnal voids |
Ferring Inc. |
July |
✓ |
$94,977.75 |
Trifluridine/ |
An antineoplastic agent indicated for the treatment of adult patients with metastic colorectal cancer who have been previously treated with, or are not candidates for, available therapies including flurorpyrimidine-, oxaliplatin- and irnotecan-based chemotherapies, anti-VEGF biological agents, and if RAS wild-type, anti-EGFR agents |
Taiho Pharma Canada Inc. |
October |
✓ |
|
Pegademase bovine (sold under trade name Adagen) |
Enzyme replacement therapy for adenosine deaminase (ADA) deficiency in patients with sever combined immunodeficiency disease (SCID) who are not suitable candidates for or who have failed bone marrow transplanation |
Leadiant Biosciences, Inc. |
October |
|
$130,796.19 |
Total as of December 31, 2019 |
$3,492,454.93 |
||||
VCUs in 2020 as of May 31, 2020 |
|||||
Ixekizumab (sold under trade name Taltz) |
For the treatment of adult patients with moderate-to-severe plaque psoriasis who are candidates for systemic therapy or phototherapy, and for the treatment of adult patients with active psoriasis who have responded inadequately to, or are intolerant to one or more disease-modifying antirheumatic drugs. |
Eli Lilly Canada Inc. |
January |
|
$75,844.49 |
Total as of May 31, 2020 |
$3,568,299.42 |
||||
Hearings
The PMPRB holds hearings into two types of matters:
- excessive pricing; and
- failure to file–jurisdiction.
Excessive Pricing
In the event that the price of a patented medicine appears to be excessive, the Chairperson can commence a public hearing. If the Hearing Panel finds the price is excessive, it can issue an order to reduce the price of the patented medicine in question (or of another patented medicine of the patentee) and/or to offset revenues received as a result of the excessive price. Judicial review of Board decisions can be sought in the Federal Court of Canada.
In January 2019, the PMPRB announced it would hold a public hearing in the matter of the price of the patented medicine cysteamine bitartrate sold under the trade name Procysbi by Horizon Therapeutics Canada. The purpose of this hearing is to determine whether the medicine has been or is being sold in any market in Canada at a price that, in the Board’s opinion, is or was excessive: and, if so, what order, if any, should be made to remedy the excessive pricing. The matter is ongoing.
Failure to File–Jurisdiction
When Staff believes a patentee has failed or refused to provide the PMPRB the pricing and sales information required by law, Staff will recommend that the Chairperson call a public hearing to determine whether the patentee has, in fact, breached the reporting requirements of the Act and Regulations. If the Hearing Panel finds, as the result of a public hearing, that the patentee has failed to report the required information, the Hearing Panel can order the patentee to file the required pricing and sales information.
There were no failure to file hearings as of March 31, 2020.
On May 7, 2020, the Board issued its decision on re-determination on its decision dated December 19, 2016 whereby the Board originally found that Canadian Patent No. 2,478,237 pertains to the patented medicine eculizumab sold under the trade name Differin and ordered Galderma to file the required information for the period between January 1, 2010 and March 14, 2016. The Board’s decision on redetermination again ordered Galderma to file the required information for the period between January 1, 2010 and March 14, 2016. On August 11, 2020, Galderma Canada Inc. filed an application for judicial review of the Board’s May 7, 2020 decision on redetermination (T-906-20).
Summary
Excess revenues totaling $3,568,299.42 were offset by payments to the Government of Canada through VCUs and Board Orders in 2019 and up to May 31, 2020.
Since 1993, 154 VCUs have been approved and 30 public hearings related to allegations of failure to file and/or excessive pricing have been initiated. These measures resulted in price reductions and the offset of excess revenues by additional price reductions and/or payments to the Government of Canada. Over $210 million has been collected through VCUs, settlements and Board Orders through payments to the Government of Canada and/or to customers such as hospitals and clinics.
Matters Before the Federal Court, Federal Court of Appeal and Supreme Court of Canada or Other Courts
On October 20, 2017, Alexion Pharmaceuticals Inc. filed an application for judicial review of the Board’s decision dated September 20, 2017 in respect of its finding that the patented medicine eculizumab sold under the trade name Soliris was being sold at an excessive price in Canada and ordering Alexion to lower its price (currently stayed) and make an excess revenue payment of $4,245,329.60. The Board’s decision was found to be reasonable by the Federal Court via a decision dated May 23, 2019. Alexion has appealed the Federal Court’s decision in the Federal Court of Appeal. This matter is currently pending.
On January 18, 2017, Galderma Canada Inc. filed an application for judicial review of the Board’s decision dated December 19, 2016. In that decision the Board found that Canadian Patent No. 2,478,237 pertains to the patented medicine adapalene sold under the trade name Differin and ordered Galderma to file the required information for the period between January 1, 2010 and March 14, 2016. The Federal Court granted Galderma’s judicial review application on November 9, 2017 and quashed the Board’s decision. On November 21, 2017, the Attorney General appealed the Federal Court’s grant of the judicial review application. On June 28, 2019, the Federal Court of Appeal granted the appeal and issued its decision sending the matter back to the Board for redetermination. The Board’s decision on redetermination issued on May 7, 2020, again ordered Galderma to file the required information for the period between January 1, 2010 and March 14, 2016. On August 11, 2020, Galderma Canada Inc. filed an application for judicial review of the Board’s May 7, 2020 decision on redetermination (T-906-20). This matter is currently pending.
There are no PMPRB related matters before the Supreme Court of Canada.
Two challenges related to PMPRB legislation were commenced in 2019:
I.M.C. et al. v. Canada (Attorney General), T-1465-19: Innovative Medicines Canada and sixteen individual pharmaceutical companies brought an application in Federal Court to judicially review s. 4 (new factors), s. 6 and Schedule (new basket of countries) and ss. 3(4) (new net price calculation) of the 2019 Amendments to the Patented Medicines Regulations (coming into force in January, 2020) on the basis that they were ultra vires the regulation-making power contained in the Patent Act. The Federal Court issued its decision on June 29, 2020 and held that the amendments in s 4, s. 6 and the Schedule are intra vires the Patent Act, but that the amendment in ss. 3(4) is not. On September 10, 2020, I.M.C. and the individual pharmaceutical companies filed a Notice of Appeal with respect to the Federal Court decision. This matter is currently pending.
Merck et al. v Canada (Attorney General), No. 500-17-109270-192: six individual pharmaceutical companies brought an application for judicial review in Quebec Superior Court challenging the constitutionality of ss. 79-103 of the Patent Act. This matter is set to be heard by the Quebec Superior Court the week of September 28, 2020.
Table 6. Status of Board Proceedings in 2019 up to May 31, 2020
| Medicine | Indication/use | Patentee | Issuance of notice of hearing | Status |
|---|---|---|---|---|
| Eculizumab (sold under trade name Soliris) | Paroxysmal nocturnal hemoglobinuria Atypical hemolytic uremic syndrome |
Alexion Pharmaceuticals Inc. | January 20, 2015 | Board Order: September 27, 2017 |
| Cysteamine bitartrate (sold under trade name Procysbi) |
Nephropathic cystinosis | Horizon Thearpeutics Canada | January 14, 2019 | Ongoing |
| Medicine | Indication/use | Patentee | Issuance of Notice of Hearing | Status |
|---|---|---|---|---|
| Adapalene (sold under trade names Differin and Differin XP) |
Acne | Galderma Canada Inc. | (redetermination) | Board Order: May 7, 2020. Galderma to file the required information for the requested period. * Application for Judicial Review and prior litigation: see below. |
| Medicine | Indication/use | Patentee | Issuance of Notice of Hearing | Date of notice of hearing/status |
|---|---|---|---|---|
Eculizumab (sold under trade name Soliris) |
Paroxysmal nocturnal hemoglobinuria |
Alexion Pharmaceuticals Inc. |
Allegations of excessive pricing |
Application for Judicial Review. Court File T-1596-17 (Re. Board Panel’s decision of September 20, 2017): Decision issued May 23, 2019. Notice of Appeal (Federal Court of Appeal) filed on June 21, 2019. Court File A-237-19, Matter pending |
Adapalene (sold under trade names Differin and |
Acne |
Galderma Canada Inc. |
Failure to file (jurisdiction) |
Application for Judicial Review. Court File T-83-17 (Re. Board Panel’s decision of December 19, 2016): Decision issued November 9, 2017 quashing in part Board Panel’s decision. Notice of Appeal (Federal Court of Appeal) filed on November 21, 2017. Court File A-385-17. Decision issued on June 28, 2019. Matter sent for redetermination by the Board. Redetermination decision issued on May 7, 2020. Application for Judicial Review. Court File T-906-20 (Re. Board Panel’s Decision of May 7, 2020) filed on August 11, 2020. Matter pending. |
Key pharmaceutical trends: more expensive medicines continue to influence sales
Overall spending on pharmaceuticals is influenced by many factors, including price, utilization, the entry of newer, more expensive medicines, and the loss of market exclusivity of older patented medicines. In 2019, there was a notable rise in the sales of higher-cost medicines, resulting in an overall increase in total spending of 3.5%. Canadian list prices of patented medicines remained among the highest in the Organisation for Economic Co-operation and Development (OECD), ranking fourth, well behind the US and just marginally lower than Germany and Switzerland.
The PMPRB is responsible for reporting on trends in pharmaceutical sales and pricing for all medicines and for reporting research and development spending by patentees.
Under the Regulations, patentees are required to submit detailed information on their sales of patented medicines, including quantities sold, gross and net prices, and net revenues. The PMPRB uses this information to analyze trends in the sales, prices,Footnote 5 and use of patented medicines.Footnote 6 This section provides key trends, including analyses of Canadian national, public, and private payer markets for all medicines. Note that any reference to sales in this section should be interpreted as sales revenues unless otherwise noted.
$17.2 billion sales in patented medicines in 2019
Sales of patented medicines have grown by an average of 4.5% per year over the last five years.
Disclaimers
- Although select statistics reported in the KEY PHARMACEUTICAL TRENDS section are based in part on data obtained under license from the IQVIA MIDAS® database and the IQVIA Private Pay Direct Drug Plan database, the statements, findings, conclusions, views, and opinions expressed in this Annual Report are exclusively those of the PMPRB and are not attributable to IQVIA.
- To provide a broader perspective on pharmaceutical trends in Canada, summaries of the results of NPDUIS analyses have been included as additional “Brief Insights” throughout the Pharmaceutical Trends section of the Annual Report. A variety of public and licensed data sources are used for NPDUIS analytical studies. Many of these sources do not differentiate between patented and non-patented generic medicines; in these instances, the general term “generic” is used to include both. NPDUIS is a research initiative that operates independently of the regulatory activities of the PMPRB.
Trends in Sales of Patented Medicines
Canadians spend much more on patented medicines today than they did a decade ago. Over the last five years, sales of these medicines grew by an average of 4.5% per year, reaching $17.2 billion in 2019. This section looks at the most important factors driving the change in sales revenues from 2018 to 2019 and compares them to trends from previous years.
Trends in Sales Revenues
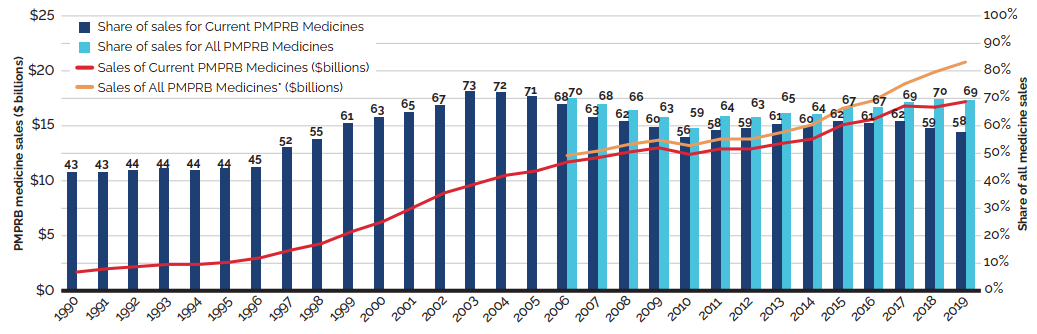
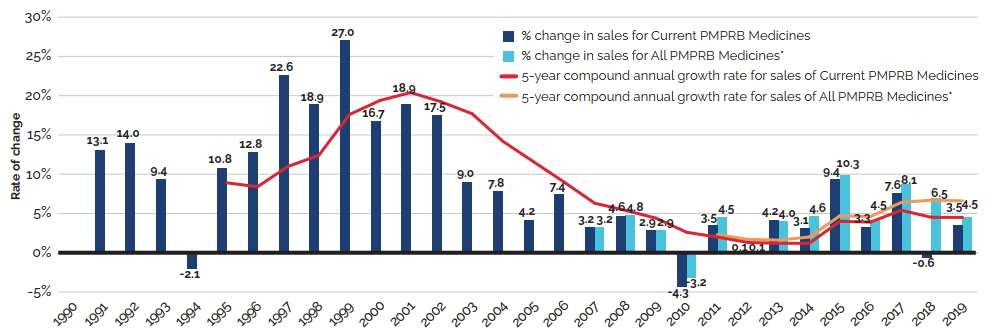
Between 2018 and 2019, there was a moderate 3.5% increase in the sales of patented medicines. Figure 3 reports on trends in the sales of patented medicines from 1990 to 2019. While there has been a 10-fold increase in annual sales since 1990, the year-over-year rate of change within that period has varied. This trend is highlighted by the five-year compound annual growth rate given in Figure 3(b).
Figure 3(a) gives the sales of patented medicines as a share of overall medicine sales. This share, which reached a peak of 72.7% in 2003, declined from 2004 to 2010. Since then, patented medicines have accounted for approximately 60% of the sales of all medicines in Canada.
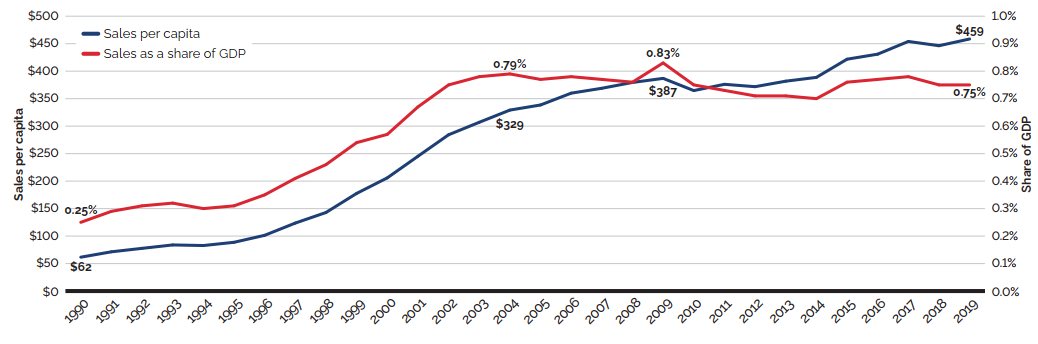
The trends in sales per capita and sales as a percentage of the gross domestic product (GDP) show the increasing importance of patented medicines in the Canadian economy. Overall, per capita sales of patented medicines rose from $61.60 in 1990 to $458.60 in 2019, while sales as a percentage of GDP rose from 0.25% in 1990 to 0.75% in 2019 [Figure 3(c)].
To highlight the continuing impact of patented medicines, Figures 3(a) and 3(b) also provide results for “All PMPRB Medicines”. This broader category includes all medicines, current and historic, that ever reported sales to the PMPRB (since its creation).
Sales for All PMPRB Medicines rose by 4.5% in 2019. Medicines that previously reported to the PMPRB accounted for estimated sales of $3.6 billion, or 12.1% of all sales. This is considerably more than a decade ago when medicines that formerly reported to the PMPRB accounted for $0.7 billion in sales, or 3.2% of all sales.
A complete table of the data presented in Figure 3 for patented medicines currently reporting to the PMPRB is included in Appendix 3.
Figure 3. Trends in Patented Medicine Sales, 1990 to 2019
* Includes sales of currently patented medicines and medicines that once reported to the PMPRB but are no longer reporting a patent.
Data source: PMPRB; MIDAS® database, 1990–2019, IQVIA (all rights reserved)
Figure description
Figure 3 (a) – Patented medicine share of all medicine sales: Current PMPRB Medicines and All PMPRB Medicines
This line and bar graphic depicts the annual sales of patented medicines currently reporting to the PMPRB and patented medicines that once reported to the PMPRB but are no longer reporting a patent and the patented medicine share of sales for current PMPRB medicines and sales for all PMPRB medicines, for the period from 1990 to 2019. In 1990, the sales of current PMPRB patented medicines was $1.7 billion and the current PMPRB patented medicine share of all medicine sales was 43.2%.
In 1991: $2.0 billion, 43.2%; 1992: $2.2 billion, 43.8%; 1993: $2.4 billion, 44.4%;
1994: $2.4 billion, 43.9%; 1995: $2.6 billion, 44.4%; 1996: $3.0 billion, 45.0%; 1997: $3.7 billion, 52.3%; 1998: $4.3 billion, 55.1%; 1999: $5.4 billion, 61.0%; 2000: $6.3 billion, 63.0%; 2001: $7.6 billion, 65.0%; 2002: $8.9 billion, 67.4%; 2003: $9.7 billion, 72.7%; 2004: $10.5 billion, 72.2%;
2005: $10.9 billion, 70.6%;
In 2006: the sales of current PMPRB medicines was $11.7 billion, current PMPRB medicines share of all medicine sales was 67.8%, the sales of all PMPRB medicines was $12.3 billion and the share of sales for all PMPRB medicines was 69.9%;
2007: $12.1 billion, 63.2%, $12.7 billion, 67.9%;
2008: $12.6 billion, 61.7%, $13.3 billion, 65.5%;
2009: $13.0 billion, 59.6%, $13.7 billion, 63.1%;
2010: $12.4 billion, 55.8%, $13.2 billion, 59.2%;
2011: $12.9 billion, 58.3%, $13.8 billion, 63.6%;
2012: $12.9 billion, 59.2%, $13.8 billion 63.0%;
2013: $13.4 billion, 60.7% $14.4 billion, 64.6%;
2014: $13.8 billion, 59.9%, $15.1 billion, 64.3%;
2015: $15.1 billion, 61.6%, $16.6 billion, 66.9%;
2016: $15.6 billion, 60.8%, $17.3 billion, 66.8%;
2017: $16.8 billion, 61.5%, $18.8 billion, 68.6%;
2018: $16.7 billion, 59.0%, $19.9 billion, 69.8%;
2019: $17.2 billion, 57.5%, $20.8 billion, 69.3%.
Note: As data is updated each year, historical results may not exactly match those reported in previous editions.
* Includes sales of currently patented medicines and medicines that once reported to the PMPRB but are no longer reporting a patent.
Data source: PMPRB; MIDAS® database, 1990–2019, IQVIA (all rights reserved)
Figure description
Figure 3 (b) – Rate of change in patented medicine sales: Current PMPRB Medicines and All PMPRB Medicines
This line and bar graphic depicts the annual rate of change in patented medicine sales and the
5-year compound annual growth rate from 1990 to 2019 for Current PMPRB Medicines and All PMPRB Medicines. Current PMPRB Medicines includes sales of patented medicines currently reporting to the PMPRB. All PMPRB Medicines includes sales for currently patented medicines as well as patented medicines that once reported to the PMPRB but are no longer reporting a patent. In 1991, the rate of change in sales for Current PMPRB medicines was 13.1%. In 1992: 14.0%; 1993: 9.4%; 1994: -2.1%.
In 1995, the rate of change in sales for Current PMPB medicines was 10.8% and the 5-year compound annual growth rate for sales of Current PMPRB medicines was 8.9%.
1996: 12.8%, 8.4%;
1997: 22.6%, 11.0%;
1998: 18.9%, 12.4%;
1999: 27.0%, 17.6%;
2000: 16.7%, 19.4%;
2001: 18.9%, 20.4%;
2002: 17.5%, 19.2%;
2003: 9.0%, 17.7%;
2004: 7.8%, 14.2%;
2005: 4.2%, 11.6%;
2006: 7.4%, 9.0%;
In 2007: the rate of change in sales for Current PMPRB medicines was 3.2%, the 5-year compound annual growth rate for sales of Current PMPRB medicines was 6.3% and the rate of change in sales for All PMPRB medicines was 3.2%.
2008: 4.6%, 5.4%, 4.8%;
2009: 2.9%, 4.4%, 2.9%;
2010: -4.3%, 2.6%, -3.2%;
In 2011, the rate of change in sales for Current PMPRB medicines was 3.5%, the 5-year compound annual growth rate for sales of Current PMPRB medicines was 2.0%, the rate of change in sales for All PMPRB medicines was 4.5%, and the 5-year compound annual growth rate for sales of All PMPRB medicines was 2.3%;
2012: 0.1%, 1.3%, 0.1%, 1.7%;
2013: 4.2%, 1.2%,4.0%, 1.6%;
2014: 3.1%, 1.2%, 4.6%, 2.0%;
2015: 9.4%, 4.0%, 9.9%, 4.7%;
2016: 3.3%, 3.9%, 4.2%, 4.6%;
2017: 7.6%, 5.4%, 8.7%, 6.4%;
2018: -0.6%, 4.5%, 6.9%, 6.7%;
2019: 3.5%, 4.5%, 4.5%, 6.6%
Data source: PMPRB; Statistics Canada; OECD
Figure description
Figure 3 (c) – Patented medicine sales per capita and as a share of GDP: Current PMPRB Medicines
This line graphic depicts Current PMPRB medicine sales per capita and as a share of GDP from 1990 to 2019. In 1990, Current PMPRB medicine sales per capita was $61.60 and as a share of GDP 0.25%. In 1991: $71.40, 0.29%; 1992: $77.70, 0.31%; 1993: $83.90, 0.32%; 1994: $82.80, 0.30%; 1995: $88.70, 0.31%; 1996: $101.40, 0.35%; 1997: $123.70, 0.41%; 1998: $142.90, 0.46%; 1999: $177.60, 0.54%;
2000: $205.90, 0.57%; 2001: $245.20, 0.67%; 2002: $284.30, 0.75%; 2003: $307.00, 0.78%;
2004: $329.20, 0.79%; 2005: $338.50, 0.77%; 2006: $360.00, 0.78%; 2007: $368.90, 0.77%;
2008: $379.50, 0.76%; 2009: $386.90, 0.83%; 2010: $364.70, 0.75%; 2011: $376.10, 0.73%;
2012: $371.80, 0.71%; 2013: $381.80, 0.71%; 2014: $388.70, 0.70%; 2015: $421.80, 0.76%;
2016: $430.94, 0.77%; 2017: $454.09, 0.78%; 2018: $446.30, 0.75%; 2019: $458.60, 0.75%.
Brief Insights: Trends in the Sales of Generic Medicines
While the sales of patented medicines increased by 3.5% in 2019, retail sales of generic medicines dropped by almost 4%. Generic sales have had low or negative rates of change since 2010, due in large part to the introduction of price-setting policies initiated by individual provincial governments and through the pan-Canadian Pharmaceutical Alliance (pCPA).
In 2018, the introduction of a five-year joint agreement between the pCPA and the Canadian Generic Pharmaceutical Association (CGPA) reduced the prices of 67 generic medicines to 10% or 18% of their brand reference price, driving expenditures down to virtually the same level as in 2010, even while retail generic use continued to increase.
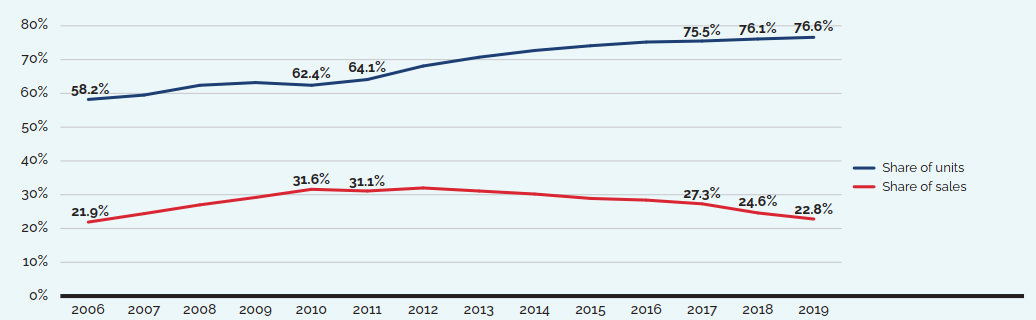
Note: The results reflect prescription sales in the national retail market based on manufacturer ex-factory list prices.
Data source: MIDAS® database, 2006–2019, IQVIA (all rights reserved)
[NPDUIS Report: Generics360, 2018 – graph updated for 2019]
Figure description
| 2006 | 2007 | 2008 | 2009 | 2010 | 2011 | 2012 | 2013 | 2014 | 2015 | 2016 | 2017 | 2018 | 2019 | |
|---|---|---|---|---|---|---|---|---|---|---|---|---|---|---|
Share of units |
58.2% |
59.5% |
62.4% |
63.2% |
62.4% |
64.1% |
68.1% |
70.7% |
72.7% |
74.1% |
75.2% |
75.5% |
76.1% |
76.6% |
Share of sales |
21.9% |
24.4% |
27.0% |
29.2% |
31.6% |
31.1% |
32.0% |
31.1% |
30.2% |
28.9% |
28.4% |
27.3% |
24.6% |
22.8% |
Drivers of the Growth in Sales Revenues
The growth in the sales revenue of patented medicines is influenced by changes in several key factors:
- Volume effect: changes in the quantity or amount of patented medicines sold.
This effect focuses on established medicines that were on the market for the entire period analyzed. Increases in the population, changes in demographic composition (e.g., shifts in the age distribution), increases in the incidence of disease, and changes in prescribing practices are among the factors that may contribute to this effect. - Mix effect: shifts in use between lower- and higher-cost patented medicines.
This effect applies to both new medicines and those that were already on the market. The switch to new higher-priced medicines, the use of new medicines that treat conditions for which no effective treatment previously existed, and changes in physician prescribing practices are among the factors that may contribute to this change. - Exiting effect: previously patented medicines that have stopped reporting sales revenue to the PMPRB or are no longer sold in Canada.
- Loss-of-exclusivity effect: medicines that have lost market exclusivity and are open to some level of generic competition but are still patented.
- Price effect: changes in the prices of existing patented medicines.
This effect applies to both increases and decreases in the prices of patented medicines over the time period analyzed.
Some factors, such as the mix effect, will generally put an upward pressure on sales, while others, such as the loss-of-exclusivity effect, have the opposite effect.
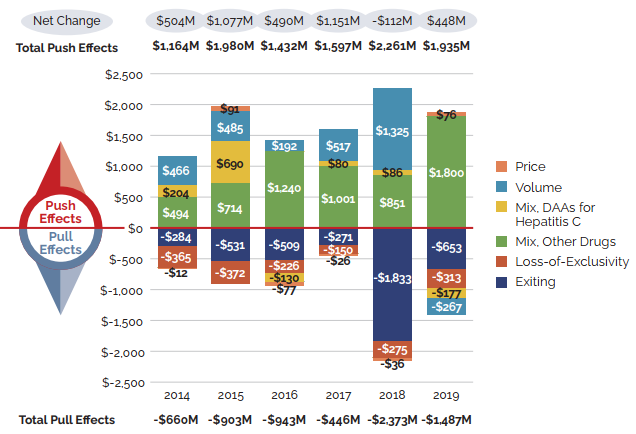
Figure 5 focuses on the major factors that drove the year-by-year growth in patented medicine salesFootnote 7 between 2014 and 2019 (a) in absolute dollar amounts, and (b) as proportions of the overall annual change in sales. In addition to the standard sales drivers, the emergence of a new “blockbuster” medicine may have a significant influence on sales and will be monitored as a separate effect. For example, direct-acting antiviral (DAA) treatments for hepatitis C are presented separately to show their continuing impact on expenditures.
Figure 5. Key Drivers of Change in the Sales of Patented Medicines, 2014 to 2019
Note: When multiple factors change simultaneously, they create a residual or cross effect, which is not reported separately in this analysis, but is accounted for in the total cost change.
Values may not add to the net change due to rounding and the cross effect.
* As this model uses various measures to isolate the factors contributing to growth, the net change reported here may differ slightly from the change in sales for the patented medicines market reported in Figure 3(b).
Data source: PMPRB
Figure description
These two bar graphs describe the factors that impacted the annual rates of change in the sales of patented medicines from 2014 to 2019. The first graph gives the rate of change in absolute dollar amounts and the second gives the corresponding percent rate of growth for each contributing factor along with the total push up (positive) and pull down (negative) effects. Direct-acting antiviral (DAA) medicines for hepatitis C are presented separately from the rest of the drug-mix effect because of their high impact.
(a) Absolute change in millions of dollars
| Exiting | Loss-of-Exclusivity | Mix, Other Drugs | Mix, DAAs for hepatitis C | Volume | Price | |
|---|---|---|---|---|---|---|
2014 |
-$284 |
-$365 |
$494 |
$204 |
$466 |
-$12 |
2015 |
-$531 |
-$372 |
$714 |
$690 |
$485 |
$91 |
2016 |
-$509 |
-$226 |
$1,240 |
-$130 |
$192 |
-$77 |
2017 |
-$271 |
-$150 |
$1,001 |
$80 |
$517 |
-$26 |
2018 |
-$1,833 |
-$275 |
$851 |
$ 86 |
$1,325 |
-$36 |
2019 |
-$653 |
-$313 |
$1,800 |
-$177 |
-$267 |
$76 |
| Absolute change (millions of dollars) | 2014 | 2015 | 2016 | 2017 | 2018 | 2019 |
|---|---|---|---|---|---|---|
Total Push Effects |
$1,164 |
$1,980 |
$1,432 |
$1,597 |
$2,261 |
$1,935 |
Total Pull Effects |
-$660 |
-$903 |
-$943 |
-$446 |
-$2,373 |
-$1,487 |
Net Change |
$504 |
$1,077 |
$490 |
$1,151 |
-$112 |
$448 |
Note: When multiple factors change simultaneously, they create a residual or cross effect, which is not reported separately in this analysis, but is accounted for in the total cost change.
Values may not add to the net change due to rounding and the cross effect.
* As this model uses various measures to isolate the factors contributing to growth, the net change reported here may differ slightly from the change in sales for the patented medicines market reported in Figure 3(b).
Data source: PMPRB
Figure description
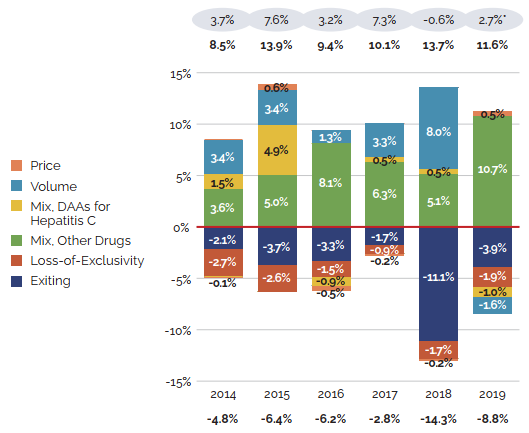
(b) Relative change in percent
| Exiting | Loss-of-Exclusivity | Mix, Other Drugs | Mix, DAAs for hepatitis C | Volume | Price | |
|---|---|---|---|---|---|---|
2014 |
-2.1% |
-2.7% |
3.6% |
1.5% |
3.4% |
-0.1% |
2015 |
-3.7% |
-2.6% |
5.0% |
4.9% |
3.4% |
0.6% |
2016 |
-3.3% |
-1.5% |
8.1% |
-0.9% |
1.3% |
-0.5% |
2017 |
-1.7% |
-0.9% |
6.3% |
0.5% |
3.3% |
-0.2% |
2018 |
-11.1% |
-1.7% |
5.1% |
0.5% |
8.0% |
-0.2% |
2019 |
-3.9% |
-1.9% |
10.7% |
-1.0% |
-1.6% |
0.5% |
| Relative change (in percent) | 2014 | 2015 | 2016 | 2017 | 2018 | 2019 |
|---|---|---|---|---|---|---|
Total Pull Effects |
-4.8% |
-6.4% |
-6.2% |
-2.8% |
-14.3% |
-8.8% |
Total Push Effects |
8.5% |
13.9% |
9.4% |
10.1% |
13.7% |
11.6% |
Net Change |
3.7% |
7.6% |
3.2% |
7.3% |
-0.6% |
2.7% |
Changes in the prices of patented medicines have played a very minor role in the growth in patented medicine sales over the last several years, suggesting that, on average, the prices of existing patented medicines are fairly stable. However, this does not reflect the overall increases in treatment costs due to the entry of newer, higher-priced patented medicines, the impact of which is captured by the mix effect.
The shift to new higher-cost patented medicines has been a major driver of sales growth in recent years. In 2019, the use of higher-cost patented medicines put an upward pressure on expenditures $1.8 billion (10.7%). While growth was observed in many therapeutic areas, the increase in sales of antineoplastic and immunomodulating agents far surpassed that of any other class, and oncology medicines accounted for one fifth of the patented medicine sales in 2019. These results are discussed in further detail in the upcoming sections.
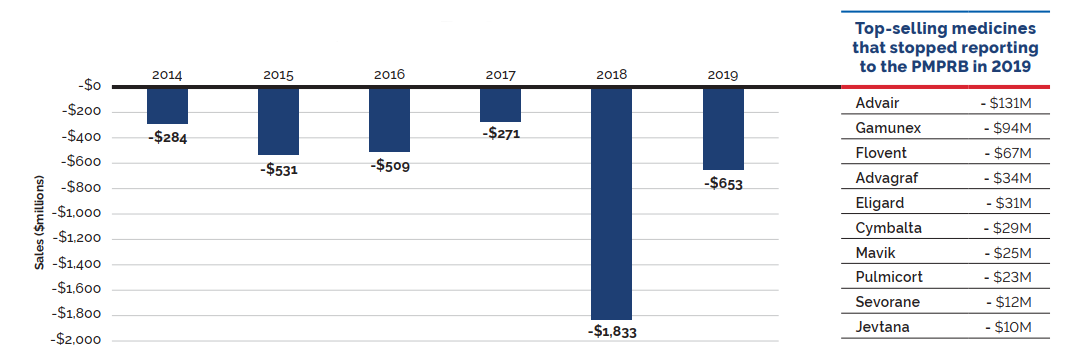
Counterbalancing this upward sales pressure, there was a moderate market segment shift as some high-selling medicines no longer reported their sales to the PMPRB. The exiting effect accounted for a moderate loss of over $650 million (-3.9%) in sales in 2019, returning to a level more in line with historic trends. Figure 6 illustrates the change in the impact of the exiting effect since 2014 and identifies the 10 top-selling medicines that stopped reporting to the PMPRB in 2019.
The volume effect also had a slight pull down effect on sales in 2019, reflecting a very small decrease in the total market quantity after a year of significant expansion.
Figure 6. Loss in Patented Medicine Sales from the Exiting Effect, 2014 to 2019
Data source: PMPRB
Figure description
This bar graph describes the change in patented medicine sales caused by patented medicines no longer reporting patents from 2014 to 2019. An accompanying table gives the change in sales for the top-selling medicines that stopped reporting patents in 2019.
| Year | Change in sales (millions of dollars) |
|---|---|
2014 |
-$284 |
2015 |
-$531 |
2016 |
-$509 |
2017 |
-$271 |
2018 |
-$1,833 |
2019 |
-$653 |
| Top-selling medicines that stopped reporting to the PMPRB in 2019 | Change in sales (millions of dollars) |
|---|---|
Advair |
- $131 |
Gamunex |
- $94 |
Flovent |
- $67 |
Advagraf |
- $34 |
Eligard |
- $31 |
Cymbalta |
- $29 |
Mavik |
- $25 |
Pulmicort |
- $23 |
Sevorane |
- $12 |
Jevtana |
-$10 |
Brief Insights: Cost Drivers of Public and Private Drug Plans
The increasing use of higher-cost medicines is the primary cost driver for Canadian public and private drug plans. Over the past several years, higher-cost medicines (other than DAAs for hepatitis C) have exerted a consistent upward pressure on expenditures, accounting for a significant 6.1% contribution toward drug costs in public plans in 2018-19 and 5.9% towards private plan costs in 2019.
The savings from a new generic pricing policy introduced in 2018 had a significant impact on both public (fiscal year 2018-19) and private (2018) drug plan costs, reversing recent trends and offsetting the upward push from the use of higher-cost medicines in each of the respective years. However, policies such as this are not expected to have a sustained impact on cost growth over multiple years, and 2019 results for private plans indicate a return to historic levels.
Although the potential for additional generic savings is limited, given the strong market for biologics in Canada, biosimilars offer an opportunity for future cost savings. Recent policy changes announced by several public drug plans aimed at promoting switching to available biosimilars, as well as initiatives introduced by some private payers, are expected to result in significant cost reductions, helping to offset the pressure from higher-cost medicines in the upcoming years.
Plan design changes can also contribute significantly to growth, as was the case with the introduction of OHIP+ in Ontario in January 2018, which initially provided pharmaceutical benefits for all Ontario residents 24 and under. Since then, additional eligibility criteria have been placed on the program, the effects of which are shown in the private plan results in 2019.
(a) NPDUIS public drug plans,* 2013-14 to 2018-19
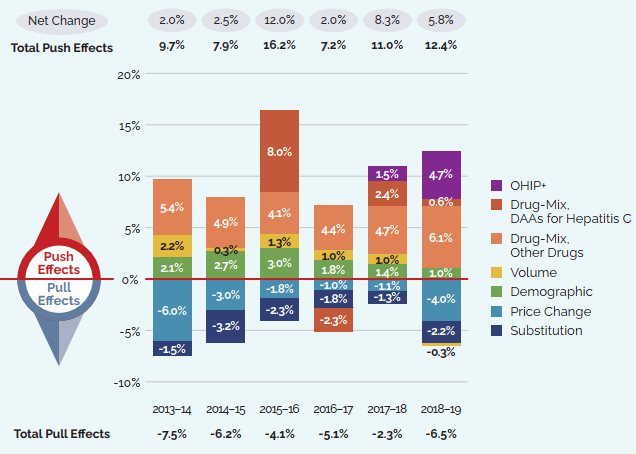
Note: Public plans report on a fiscal year basis and private plans report on the calendar year. This has an impact on the magnitude of the effect of policies such as the OHIP+ program or generic pricing initiative introduced in 2018, for which most of the impact on public plans was felt in the 2018-19 fiscal year.
When multiple factors change simultaneously, they create a residual or cross effect, which is not reported separately in this analysis, but is accounted for in the total cost change.
Values may not add to the net change due to rounding and the cross effect.
* British Columbia, Alberta, Saskatchewan, Manitoba, Ontario, New Brunswick, Nova Scotia, Prince Edward Island, Newfoundland and Labrador, Yukon, and the Non-Insured Health Benefits Program
Data source: NPDUIS database, Canadian Institute for Health Information; IQVIA Private Pay Direct Drug Plan database
[NPDUIS Report: CompassRx 2018/19 (pre-publication results); NPDUIS Poster: Pressures behind the Rising Costs in Canadian Private Drug Plans, 2018 – graph updated for 2019]
Figure description
These two bar graphs describe the factors that impacted the annual rates of change in medicine costs for public and private plans. The first graph depicts the total for the combined NPDUIS public drug plans from fiscal year 2013-14 to 2018-19 and the second depicts the Canadian private drug plans from calendar year 2014 to 2019. The total positive or push effects, negative or pull effects, and net change is given above and below the bars for each year. Direct-acting antiviral (DAA) medicines for hepatitis C are presented separately from the rest of the drug-mix effect because of their high impact. The effects of the introduction of the OHIP+ program in Ontario are also shown separately for 2017-18 and 2018-19 in the public plan results and for 2018 and 2019 in the private plan results.
NPDUIS public drug plans, 2013-14 to 2018-19
| 2013-14 | 2014-15 | 2015-16 | 2016-17 | 2017-18 | 2018-19 | |
|---|---|---|---|---|---|---|
OHIP+ |
– |
– |
– |
– |
1.5% |
4.7% |
Drug-Mix, DAAs for Hepatitis C |
0.0% |
0.0% |
8.0% |
-2.3% |
2.4% |
0.6% |
Drug-Mix, Others |
5.4% |
4.9% |
4.1% |
4.4% |
4.7% |
6.1% |
Volume |
2.2% |
0.3% |
1.3% |
1.0% |
1.0% |
-0.3% |
Demographic |
2.1% |
2.7% |
3.0% |
1.8% |
1.4% |
1.0% |
Price Change |
-6.0% |
-3.0% |
-1.8% |
-1.0% |
-1.1% |
-4.0% |
Generic Substitution |
-1.5% |
-3.2% |
-2.3% |
-1.8% |
-1.3% |
-2.2% |
Total pull effects |
-7.5% |
-6.2% |
-4.1% |
-5.1% |
-2.3% |
-6.5% |
Total push effects |
9.7% |
7.9% |
16.2% |
7.2% |
11.0% |
12.4% |
Net change |
2.0% |
2.5% |
12.0% |
2.0% |
8.3% |
5.8% |
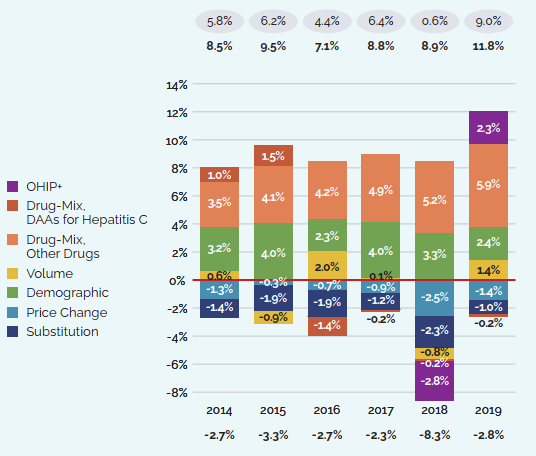
Note: Public plans report on a fiscal year basis and private plans report on the calendar year. This has an impact on the magnitude of the effect of policies such as the OHIP+ program or generic pricing initiative introduced in 2018, for which most of the impact on public plans was felt in the 2018-19 fiscal year.
When multiple factors change simultaneously, they create a residual or cross effect, which is not reported separately in this analysis, but is accounted for in the total cost change.
Values may not add to the net change due to rounding and the cross effect.
* British Columbia, Alberta, Saskatchewan, Manitoba, Ontario, New Brunswick, Nova Scotia, Prince Edward Island, Newfoundland and Labrador, Yukon, and the Non-Insured Health Benefits Program
Data source: NPDUIS database, Canadian Institute for Health Information; IQVIA Private Pay Direct Drug Plan database
[NPDUIS Report: CompassRx 2018/19 (pre-publication results); NPDUIS Poster: Pressures behind the Rising Costs in Canadian Private Drug Plans, 2018 – graph updated for 2019]
Figure description
(b) Private drug plans, 2014 to 2019
|
2014 |
2015 |
2016 |
2017 |
2018 |
2019 |
OHIP+ |
– |
– |
– |
– |
-2.8% |
2.3% |
Drug-Mix, DAAs for Hepatitis C |
1.0% |
1.5% |
-1.4% |
-0.2% |
-0.2% |
-0.2% |
Drug-Mix, Others |
3.5% |
4.1% |
4.2% |
4.9% |
5.2% |
5.9% |
Volume |
0.6% |
-0.9% |
2.0% |
0.1% |
-0.8% |
1.4% |
Demographic |
3.2% |
4.0% |
2.3% |
4.0% |
3.3% |
2.4% |
Price Change |
-1.3% |
-0.3% |
-0.7% |
-0.9% |
-2.5% |
-1.4% |
Generic Substitution |
-1.4% |
-1.9% |
-1.9% |
-1.2% |
-2.3% |
-1.0% |
Total pull effects |
-2.7% |
-3.3% |
-2.7% |
-2.3% |
-8.3% |
-2.8% |
Total push effects |
8.5% |
9.5% |
7.1% |
8.8% |
8.9% |
11.8% |
Net change |
5.8% |
6.2% |
4.4% |
6.4% |
0.6% |
9.0% |
New Medicines Driving Sales Revenues
Figure 8 breaks down the 2019 sales of patented medicines according to the year in which the medicine was first issued a Notice of Compliance (NOC) by Health Canada and approved for market in Canada. Throughout the latter part of the 1990s and early 2000s, sales growth was largely driven by a succession of new “blockbuster” medicines that ultimately achieved very high sales volumes. As the patents for these medicines expired, their share of sales gradually decreased. The introduction of new higher-cost medicines such as biologics, oncology medicines, and treatments for hepatitis C has accounted for a growing share of sales in recent years.
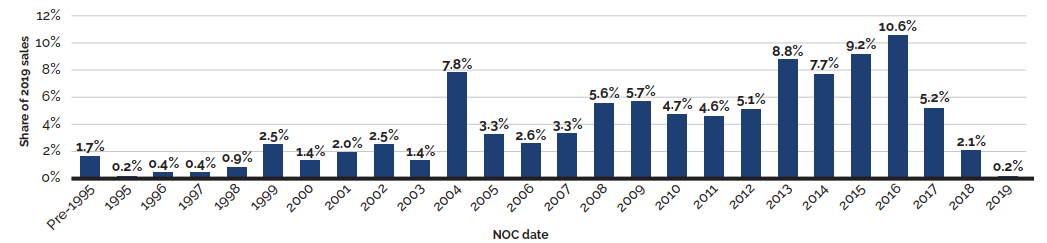
Data source: PMPRB
Figure description
This bar graph depicts the share of sales of patented medicines by the year in which the medicine was first issued a NOC by Health Canada and approved for sale in Canada. Medicines introduced before 1995 comprised 1.7% of the 2019 sales. In 1995: 0.2%; 1996: 0.4%; 1997: 0.4%; 1998: 0.9%; 1999: 2.5%;
2000: 1.4%; 2001: 2.0%; 2002: 2.5%; 2003: 1.4%; 2004: 7.8%; 2005: 3.3%; 2006: 2.6%; 2007: 3.3%;
2008: 5.6%; 2009: 5.7%; 2010: 4.7%; 2011: 4.6%; 2012: 5.1%; 2013: 8.8%; 2014: 7.7%; 2015: 9.2%;
2016: 10.6%; 2017: 5.2%; 2018: 2.1%; 2019: 0.2%.
Higher-Cost Medicines Driving Sales Revenues
Over the last decade, there has been a notable shift in pharmaceutical development toward more specialized medicines, with an increasing number of higher-cost medicines entering the market and realizing a significant market share.
In 2019, the trend in the shift to new or higher-cost medicines continued to put an upward pressure on overall patented medicine sales. The top 10 medicines contributed over $800 million to the increase in sales (Table 7). Most of these medicines had an average annual treatment cost greater than $10,000.Footnote 8
| Medical Ingredient (Trade Name) | ATC* | Date of first NOC† | Sales ($millions) 2018 | Sales ($millions) 2019 | Absolute change in sales ($millions) 2018–2019 | AVG. annual treatment cost† 2019 |
|---|---|---|---|---|---|---|
Daratumumab |
L01 |
June-16 |
$10.2 |
$173.8 |
$163.7 |
$60,895 |
Glecaprevir/pibrentasvir (Maviret) |
J05 |
Aug-17 |
$24.7 |
$131.6 |
$106.9 |
$29,551 |
Semaglutide |
A10 |
Jan-18 |
$25.2 |
$109.7 |
$84.5 |
$1,379 |
Pembrolizumab |
L01 |
May-15 |
$206.3 |
$280.4 |
$74.1 |
$40,987 |
Adalimumab |
L04 |
Sept-04 |
$791.0 |
$862.2 |
$71.2 |
$17,429 |
Herpes zoster vaccine |
J07 |
Oct-17 |
$85.2 |
$149.8 |
$64.6 |
$201 |
Palbociclib |
L01 |
Mar-16 |
$118.4 |
$180.4 |
$62.0 |
$37,698 |
Ibrutinib |
L01 |
Nov-14 |
$205.7 |
$266.1 |
$60.4 |
$56,024 |
Lenalidomide |
L04 |
Jan-08 |
$408.4 |
$465.9 |
$57.5 |
$60,313 |
Apixaban |
B01 |
Dec-11 |
$256.6 |
$313.2 |
$56.6 |
$740 |
Total top 10 medicines§ |
|
|
$2,131.7 |
$2,933.1 |
$801.4 |
|
Note: Highlighted medicines were also identified as top contributors in 2018.
* Level 2 of the Anatomic Therapeutic Chemical (ATC) classification system maintained by the World Health Organization.
†Date of first Notice of Compliance or Notice of Compliance with Conditions issued by Health Canada.
‡ The annual treatment cost was calculated based on the average annual cost per active beneficiary in selected private drug plans. This amount may be underestimated.
§ Values may not add to totals due to rounding.
Data source: PMPRB, IQVIA Private Pay Direct Drug Plan database, 2019
While Table 7 reports the top 10 medicines contributing to the increase in the sales of patented medicines, Table 8 compares the 10 top-selling patented medicines in 2006 and 2019, along with their treatment costs. In 2006, Remicade was the only biologic medicine to make the top 10 list, with an average annual treatment cost of $17,759. This was much higher than the rest of the medicines on the list, none of which exceeded $1,000 annually. By 2019, however, half of the top 10 medicines were biologics, with annual treatment costs ranging from $9,142 to $40,987. Only two of the top-selling non-biologic medicines in 2019 had annual treatment costs of less than $10,000, and the highest treatment cost exceeded $60,000. With collective annual sales of approximately $4.1 billion, these 10 medicines accounted for close to one quarter of the total sales for all patented medicines in 2019.
| 2006 | 2019 | ||||||||
|---|---|---|---|---|---|---|---|---|---|
| Medicinal ingredient (Trade name) | ATC | Date of first NOC* | Avg. annual treatment cost | Medicinal ingredient (Trade name) | ATC | Date of first NOC* | Avg. annual treatment cost | Sales ($millions) | Share of patented sales |
1. Atorvastatin calcium (Lipitor) |
C10A |
Feb-97 |
$511 |
1. Adalimumab (Humira) Biologic medicine |
L04A |
Sept-04 |
$17,429 |
$862.2 |
5.0% |
2. Amlodipine besylate (Norvasc) |
C08C |
Aug-97 |
$417 |
2. Aflibercept (Eylea) Biologic medicine |
S01L |
Nov-13 |
$9,142 |
$553.6 |
3.2% |
3. Ramipril (Altace) |
C09A |
Sept-94 |
$271 |
3. Sofosbuvir/velpatasvir (Epclusa) |
J05A |
July-16 |
$43,563 |
$645.2 |
2.8% |
4. Venlafaxine hydrochloride (Effexor) |
N06A |
July-94 |
$446 |
4. Lenalidomide (Revlimid) |
L04A |
Jan-08 |
$60,313 |
$465.9 |
2.7% |
5. Pantoprazole sodium (Pantoloc) |
A02B |
Sept-96 |
$330 |
5. Sitagliptin phosphate monohydrate/metformin hydrochloride (Janumet) |
A10B |
Sept-09 |
$852 |
$334.1 |
1.9% |
6. Clopidogrel bisulfate (Plavix) |
B01A |
Oct-98 |
$607 |
6. Apixaban (Eliquis) |
B01A |
Dec-11 |
$740 |
$313.2 |
1.8% |
7. Rosuvastatin calcium (Crestor) |
C10A |
Feb-03 |
$341 |
7. Ustekinumab (Stelara) Biologic medicine |
L04A |
Dec-08 |
$22,618 |
$295.4 |
1.7% |
8. Olanzapine (Zyprexa) |
N05A |
Oct-96 |
$977 |
8. Pembrolizumab (Keytruda) Biologic medicine |
L01X |
May-15 |
$40,987 |
$280.4 |
1.6% |
9. Salmeterol xinafoate /fluticasone propionate (Advair) |
R03A |
Sept-99 |
$343 |
9. Ibrutinib (Imbruvica) |
L01X |
Nov-14 |
$56,024 |
$266.1 |
1.5% |
10. Infliximab (Remicade) Biologic medicine |
L04A |
June-01 |
$17,759 |
10. Rituximab (Rituxan) Biologic medicine |
L01X |
Mar-00 |
$11,960 |
$261.2 |
1.5% |
|
Total top 10 medicines† |
$4,108.2 |
24.0% |
||||||
|
Total patented medicines |
$17,238.7 |
|||||||
Note: Biologic medicines are highlighted.
* Date of first Notice of Compliance or Notice of Compliance with Conditions issued by Health Canada.
† Values may not add to totals due to rounding.
Data source: PMPRB, IQVIA Private Pay Direct Drug Plan database, 2019
Figure 9 details the trend in the treatment costs of patented medicines since 2006. For many years, the majority of the 20 top-selling patented medicines had annual treatment costs under $1,000; however, 2015 marked a turning point, and now most of the top sellers cost in the thousands or tens of thousands of dollars per year. This shift is reflected in the exceptional 10-fold growth in the median annual treatment cost between 2006 and 2015. In 2019, the median annual treatment cost was $6,227. In addition to their higher cost, these medicines have had a strong uptake in use, resulting in a weighted average annual treatment cost of $19,266 for the 20 top-selling patented medicines in 2019.
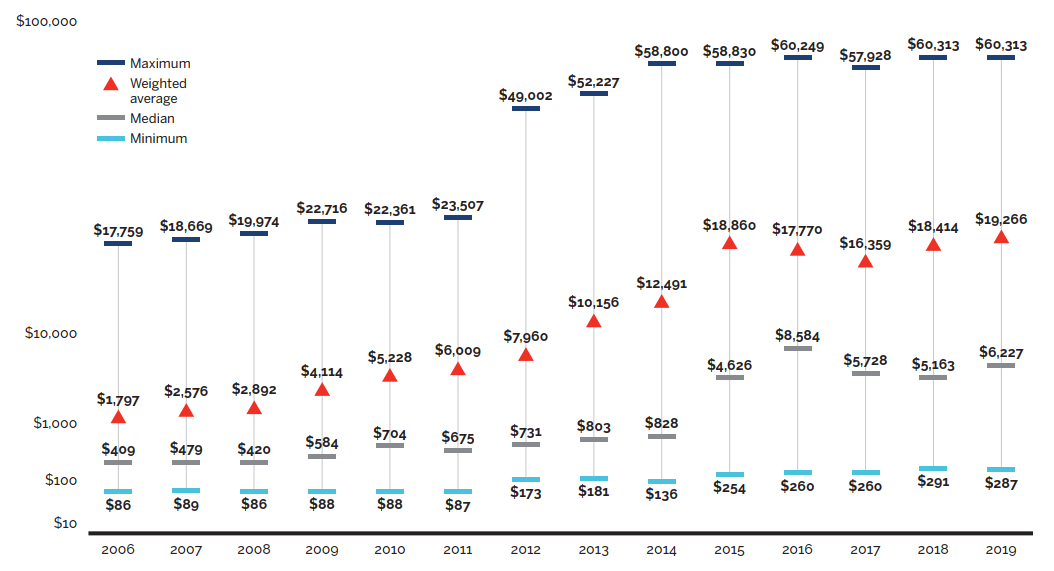
Data source: PMPRB; IQVIA Private Pay Direct Drug Plan database, 2006–2019
Figure description
This graph depicts the minimum, maximum, median, and weighted average annual treatment costs for the 20 top-selling patented medicines sold in Canada from 2006 to 2019.
| Treatment cost | 2006 | 2007 | 2008 | 2009 | 2010 | 2011 | 2012 | 2013 | 2014 | 2015 | 2016 | 2017 | 2018 | 2019 |
|---|---|---|---|---|---|---|---|---|---|---|---|---|---|---|
Maximum |
$17,759 |
$18,669 |
$19,974 |
$22,716 |
$22,361 |
$23,507 |
$49,002 |
$52,227 |
$58,800 |
$58,830 |
$60,249 |
$57,928 |
$60,313 |
$60,313 |
Weighted average |
$1,797 |
$2,576 |
$2,892 |
$4,114 |
$5,228 |
$6,009 |
$7,960 |
$10,156 |
$12,491 |
$18,860 |
$17,770 |
$16,359 |
$18,414 |
$19,266 |
Median |
$409 |
$479 |
$420 |
$584 |
$704 |
$675 |
$731 |
$803 |
$828 |
$4,626 |
$8,584 |
$5,728 |
$5,163 |
$6,227 |
Minimum |
$86 |
$89 |
$86 |
$88 |
$88 |
$87 |
$173 |
$181 |
$136 |
$254 |
$260 |
$260 |
$291 |
$287 |
Figure 10 shows that high-cost medicines represent an increasingly significant share of the total sales of patented medicines, rising steeply from 5.0% in 2006 to 48.3% in 2019. This growth was evident in all ranges of annual treatment costs ($10 to $20 thousand; $20 to $50 thousand; and $50+ thousand), with medicines in the highest cost band climbing from 0.1% to 12.0% of sales over the same period. Despite the sharp increase in the share of costs, less than 1% of the population use these medicines.
In 2019, high-cost medicines accounted for almost 50% of all patented medicine sales, as compared to 5% in 2006.
Between 2006 and 2019 the number of patented medicines in Canada with an annual average treatment cost of at least $10,000 more than quadrupled.
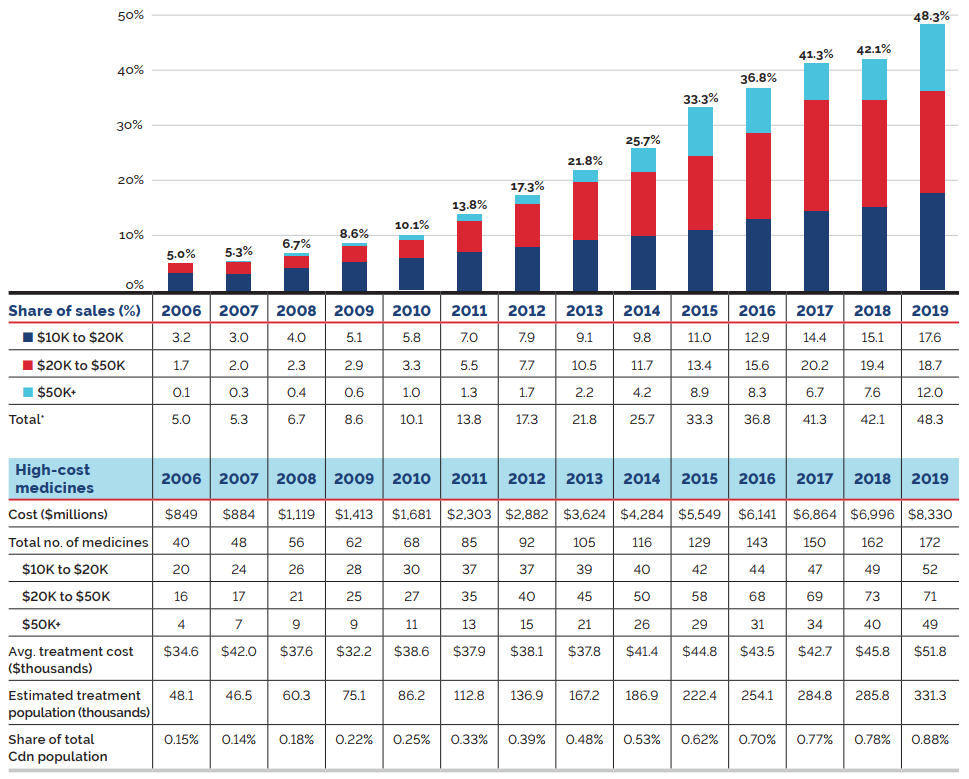
Note: The methodology for this analysis was revised in 2018, and as such, historical results may not match those reported in earlier editions.
* Values may not add to totals due to rounding.
Data source: PMPRB; IQVIA Private Pay Direct Drug Plan database, 2006–2019
Figure description
This bar graph depicts the high-cost medicine share of total patented medicine sales per year by annual treatment cost from 2006 to 2019. The bars are subdivided into three bands based on average annual treatment cost: $10 to $20 thousand; $20 to $50 thousand; and greater than $50 thousand.
| Year | Share of sales for medicines costing $10 to $20 thousand | Share of sales for medicines costing $20 to $50 thousand | Share of sales for medicines costing greater than $50 thousand | Total share of sales of high-cost medicines |
|---|---|---|---|---|
2006 |
3.2% |
1.7% |
0.1% |
5.0% |
2007 |
3.0% |
2.0% |
0.3% |
5.3% |
2008 |
4.0% |
2.3% |
0.4% |
6.7% |
2009 |
5.1% |
2.9% |
0.6% |
8.6% |
2010 |
5.8% |
3.3% |
1.0% |
10.1% |
2011 |
7.0% |
5.5% |
1.3% |
13.8% |
2012 |
7.9% |
7.7% |
1.7% |
17.3% |
2013 |
9.1% |
10.5% |
2.2% |
21.8% |
2014 |
9.8% |
11.7% |
4.2% |
25.7% |
2015 |
11.0% |
13.4% |
8.9% |
33.3% |
2016 |
12.9% |
15.6% |
8.3% |
36.8% |
2017 |
14.4% |
20.2% |
6.7% |
41.3% |
2018 |
15.1% |
19.4% |
7.6% |
42.1% |
2019 |
17.6% |
18.7% |
12.0% |
48.3% |
The table below the graph gives additional information including the medicine cost, the number of medicines, the average annual treatment cost, and the estimated treatment population and corresponding share of total Canadian population.
| - | 2006 | 2007 | 2008 | 2009 | 2010 | 2011 | 2012 | 2013 | 2014 | 2015 | 2016 | 2017 | 2018 | 2019 |
|---|---|---|---|---|---|---|---|---|---|---|---|---|---|---|
Medicine cost (millions of dollars) |
$849 |
$884 |
$1,119 |
$1,413 |
$1,681 |
$2,303 |
$2,882 |
$3,624 |
$4,284 |
$5,549 |
$6,141 |
$6,864 |
$6,996 |
$8,330 |
Total number of medicines |
40 |
48 |
56 |
62 |
68 |
85 |
92 |
105 |
116 |
129 |
143 |
150 |
162 |
172 |
Number of medicines costing $10,000 to $20,000 |
20 |
24 |
26 |
28 |
30 |
37 |
37 |
39 |
40 |
42 |
44 |
47 |
49 |
52 |
Number of medicines costing $20,000 to $50,000 |
16 |
17 |
21 |
25 |
27 |
35 |
40 |
45 |
50 |
58 |
68 |
69 |
73 |
71 |
Number of medicines costing more than $50,000 |
4 |
7 |
9 |
9 |
11 |
13 |
15 |
21 |
26 |
29 |
31 |
34 |
40 |
49 |
Avg. treatment cost (thousands of dollars) |
$34.6 |
$42.0 |
$37.6 |
$32.2 |
$38.6 |
$37.9 |
$38.1 |
$37.8 |
$41.4 |
$44.8 |
$43.5 |
$42.7 |
$45.8 |
$51.8 |
Estimated treatment population (thousands) |
48.1 |
46.5 |
60.3 |
75.1 |
86.2 |
112.8 |
136.9 |
167.2 |
186.9 |
222.4 |
254.1 |
284.8 |
285.8 |
331,3 |
Share total Canadian population |
0.15% |
0.14% |
0.18% |
0.22% |
0.25% |
0.33% |
0.39% |
0.48% |
0.53% |
0.62% |
0.70% |
0.77% |
0.78% |
0.88% |
Brief Insights: High-Cost Medicines in Public Drug Plans
High-cost medicines now account for 34% of all public drug plan expenditures. This is lower than the share for patented medicines reported in Figure 10 because public plan costs also include non-patented generic and non-patented single-source medicines.
In 2019, private drug plans reimbursed 205 high-cost medicines, while public plans reimbursed 115 in fiscal year 2018-19. Note that the number of oncology medicines and other high-cost medicines covered by public plans may be underestimated, as some are reimbursed through specialized programs, such as cancer care, that are not captured in the data.
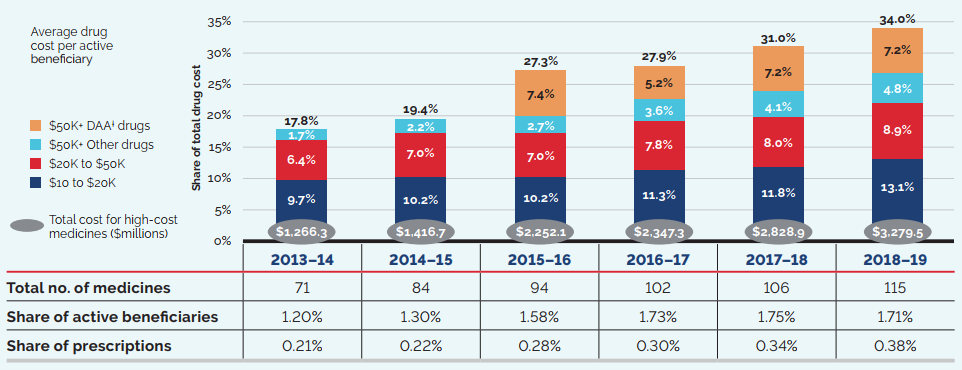
Note: High-cost medicines are defined as having an annual treatment cost greater than $10,000. If medicines reach this threshold in any given year, they are included in the count for all other years. Thus, the number and composition of high-cost medicines in any given year may vary depending on the time of analysis.
Values may not add to totals due to rounding.
* British Columbia, Alberta, Saskatchewan, Manitoba, Ontario, New Brunswick, Nova Scotia, Prince Edward Island, Newfoundland and Labrador, Yukon, and the Non-Insured Health Benefits Program
† DAA: Direct-acting antivirals for the treatment for hepatitis C, which were launched in 2014 and 2015
Data source: NPDUIS database, Canadian Institute for Health Information (fiscal year data)
[NPDUIS Report: CompassRx 2018/19 (pre-publication results)]
Figure description
This stacked bar graph depicts the high-cost medicine share of total medicine costs for the NPDUIS public drug plans from fiscal year 2013-14 to 2018-19. The bars are subdivided into bands based on average annual costs per active beneficiary: $10 to $20 thousand; $20 to $50 thousand; and more than $50 thousand. The share of new direct-acting antiviral (DAA) medicines for hepatitis C is reported separately. An accompanying table gives the total number of high-cost medicines, the share of beneficiaries using these medicines, and the share of prescriptions they represent.
High-cost medicines share of total medicine costs
| 2013-14 | 2014-15 | 2015-16 | 2016-17 | 2017-18 | 2018-19 | |
|---|---|---|---|---|---|---|
| Medicine cost in millions of dollars | $1,266.3 | $1,416.7 | $2,252.1 | $2,347.3 | $2,828.9 | $3,279.5 |
| Total number of medicines | 71 | 84 | 94 | 102 | 106 | 115 |
| Average cost per active beneficiary of $10,000‒$20,000: share of total medicine cost | 9.7% | 10.2% | 10.2% | 11.3% | 11.8% | 13.1% |
| Average cost per active beneficiary of $20,000‒$50,000: share of total medicine cost | 6.4% | 7.0% | 7.0% | 7.8% | 8.0% | 8.9% |
| Average cost per active beneficiary of greater than $50,000: share of total medicine cost for medicines other than DAAs for hepatitis C | 1.7% | 2.2% | 2.7% | 3.6% | 4.1% | 4.8% |
| Average cost per active beneficiary of greater than $50,000: share of total medicine cost for DAAs | 0% | 0% | 7.4% | 5.2% | 7.2% | 7.2% |
| Overall high-cost share of total medicine cost | 17.8% | 19.4% | 27.3% | 27.9% | 31.0% | 34.0% |
| High-cost medicines - share of active beneficiaries | 1.20% | 1.30% | 1.58% | 1.73% | 1.75% | 1.71% |
| High-cost medicines - share of total prescriptions | 0.21% | 0.22% | 0.28% | 0.30% | 0.34% | 0.38% |
The shift toward higher-cost treatments is especially evident in oncology medicines. Figure 12 shows the share of total sales for patented oncology medicines by treatment cost based on a standard 28-day treatment regimen.Footnote 9
From 2006 to 2019, the average treatment cost for oncology medicines more than doubled, from $3,555 to $9,320. Many treatment regimens use multiple medicines resulting in even higher treatment costs per beneficiary.
The dual pressures of increasing average treatment costs and growing utilization mean that this therapeutic area is likely to continue to grow as a proportion of patented medicine sales.
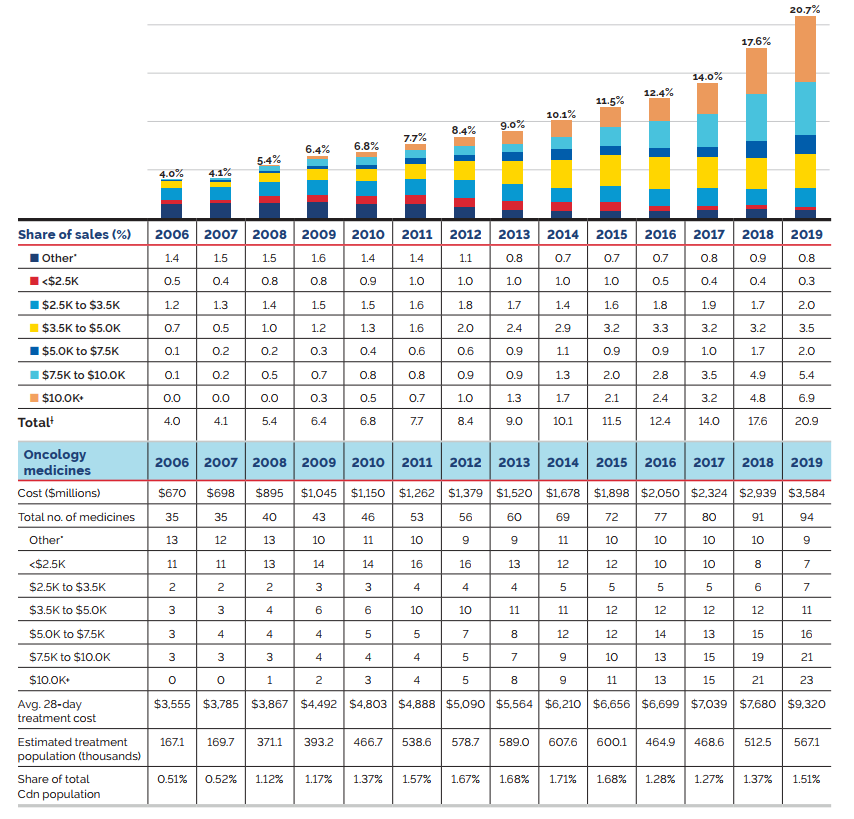
Note: The methodology used for this analysis has been refined over the past two editions to better represent the market for oncology medicines. This includes a revised set of selection criteria, established following a thorough review and expert recommendation, as well as an updated method for determining the annual count of medicines. Thus, there may be some variation between these results and those previously reported.
These results reflect the total sales for patented medicines used in the treatment of cancer. While some of these medicines may also be used to treat other conditions, the data used for this analysis does not distinguish between indications, and thus, the reported sales may reflect some non-cancer use.
* Treatment costs for these medicines are not available.
† Values may not add to totals due to rounding.
Data source: PMPRB; CADTH pCODR
Figure description
This bar graph depicts the patented oncology medicine share of total patented medicine sales from 2006 to 2019. The bars are subdivided into seven bands based on the average 28-day treatment cost: medicines whose costs are not available; medicines costing less than $2.5 thousand; $2.5 to $3.5 thousand; $3.5 to $5.0 thousand; $5.0 to $7.5 thousand; $7.5 to $10.0 thousand; and more than $10 thousand.
| Year | Share of sales for patented oncology medicines for which treatment cost is unavailable | Share of sales for patented oncology medicines for which treatment cost is less than $2,500 | Share of sales for patented oncology medicines for which treatment cost is $2,500 to $3,500 | Share of sales for patented oncology medicines for which treatment cost is $3,500 to $5,000 | Share of sales for patented oncology medicines for which treatment cost is $5,000 to $7,500 | Share of sales for patented oncology medicines for which treatment cost is $7,500 to $10,000 | Share of sales for patented oncology medicines for which treatment cost is more than $10,000 | Total share of sales for patented oncology medicines |
|---|---|---|---|---|---|---|---|---|
2006 |
1.4% |
0.5% |
1.2% |
0.7% |
0.1% |
0.1% |
0.0% |
4.0% |
2007 |
1.5% |
0.4% |
1.3% |
0.5% |
0.2% |
0.2% |
0.0% |
4.1% |
2008 |
1.5% |
0.8% |
1.4% |
1.0% |
0.2% |
0.5% |
0.0% |
5.4% |
2009 |
1.6% |
0.8% |
1.5% |
1.2% |
0.3% |
0.7% |
0.3% |
6.4% |
2010 |
1.4% |
0.9% |
1.5% |
1.3% |
0.4% |
0.8% |
0.5% |
6.8% |
2011 |
1.4% |
1.0% |
1.6% |
1.6% |
0.6% |
0.8% |
0.7% |
7.7% |
2012 |
1.1% |
1.0% |
1.8% |
2.0% |
0.6% |
0.9% |
1.0% |
8.4% |
2013 |
0.8% |
1.0% |
1.7% |
2.4% |
0.9% |
0.9% |
1.3% |
9.0% |
2014 |
0.7% |
1.0% |
1.4% |
2.9% |
1.1% |
1.3% |
1.7% |
10.1% |
2015 |
0.7% |
1.0% |
1.6% |
3.2% |
0.9% |
2.0% |
2.1% |
11.5% |
2016 |
0.7% |
0.5% |
1.8% |
3.3% |
0.9% |
2.8% |
2.4% |
12.4% |
2017 |
0.8% |
0.4% |
1.9% |
3.2% |
1.0% |
3.5% |
3.2% |
14.0% |
2018 |
0.9% |
0.4% |
1.7% |
3.2% |
1.7% |
4.9% |
4.8% |
17.6% |
2019 |
0.8% |
0.3% |
2.0% |
3.5% |
2.0% |
5.4% |
6.9% |
20.9% |
The table below the graph gives additional information including the medicine cost, the number of medicines, the average 28-day treatment cost, and the estimated treatment population and corresponding share of total Canadian population.
| Oncology medicines | 2006 | 2007 | 2008 | 2009 | 2010 | 2011 | 2012 | 2013 | 2014 | 2015 | 2016 | 2017 | 2018 | 2019 |
|---|---|---|---|---|---|---|---|---|---|---|---|---|---|---|
Cost (millions of dollars) |
$670 |
$698 |
$895 |
$1,045 |
$1,150 |
$1,262 |
$1,379 |
$1,520 |
$1,678 |
$1,898 |
$2,050 |
$2,324 |
$2,939 |
$3,584 |
Total number of medicines |
35 |
35 |
40 |
43 |
46 |
53 |
56 |
60 |
69 |
72 |
77 |
80 |
91 |
94 |
Number of medicines for which cost is unavailable |
13 |
12 |
13 |
10 |
11 |
10 |
9 |
9 |
11 |
10 |
10 |
10 |
10 |
9 |
Number of medicines costing less than $2,500 |
11 |
11 |
13 |
14 |
14 |
16 |
16 |
13 |
12 |
12 |
10 |
10 |
8 |
7 |
Number of medicines costing $2,500 to $3,500 |
2 |
2 |
2 |
3 |
3 |
4 |
4 |
4 |
5 |
5 |
5 |
5 |
6 |
7 |
Number of medicines costing $3,500 to $5,000 |
3 |
3 |
4 |
6 |
6 |
10 |
10 |
11 |
11 |
12 |
12 |
12 |
12 |
11 |
Number of medicines costing $5,000 to $7,500 |
3 |
4 |
4 |
4 |
5 |
5 |
7 |
8 |
12 |
12 |
14 |
13 |
15 |
16 |
Number of medicines costing $7,500 to $10,000 |
3 |
3 |
3 |
4 |
4 |
4 |
5 |
7 |
9 |
10 |
13 |
15 |
19 |
21 |
Number of medicines costing more than $10,000 |
0 |
0 |
1 |
2 |
3 |
4 |
5 |
8 |
9 |
11 |
13 |
15 |
21 |
23 |
Average |
$3,555 |
$3,785 |
$3,867 |
$4,492 |
$4,803 |
$4,888 |
$5,090 |
$5,564 |
$6,210 |
$6,656 |
$6,699 |
$7,039 |
$7,680 |
$9,320 |
Estimated treatment population (thousands) |
167.1 |
169.7 |
371.1 |
393.2 |
466.7 |
538.6 |
578.7 |
589.0 |
607.6 |
600.1 |
464.9 |
468.6 |
512.5 |
567.1 |
Share total Canadian population |
0.51% |
0.52% |
1.12% |
1.17% |
1.37% |
1.57% |
1.67% |
1.68% |
1.71% |
1.68% |
1.28% |
1.27% |
1.37% |
1.51% |
Brief Insights: Oncology Market in Canada
Results for the overall Canadian oncology market reflect the same trend of more expensive medicines accounting for a growing proportion of sales revenue. Figure 13 shows the share of total oncology sales by treatment cost based on a standard 28-day treatment regimen for both patented and non-patented medicines.
From 2010 to 2019, the share of revenue captured by medicines with a 28-day treatment cost greater than $10,000 grew from 7% to 37%. The oncology market as a whole shifted toward more expensive medicines, with the sales-weighted average treatment cost for the 10 highest-selling medicines more than doubling from $3,715 in 2010 to $8,365 in 2019.
As the oncology market shifted toward high-cost treatments, the overall pace of growth increased as well. The compound annual growth rate (CAGR) for 2010–2019 was 12.4%, with the highest annual growth rates occurring in 2017 (17.1%), 2018 (23.3%), and 2019 (20.2%).
The accelerating growth of this therapeutic area, from rising average treatment costs and utilization, is likely to increase cost pressures on Canadian payers.
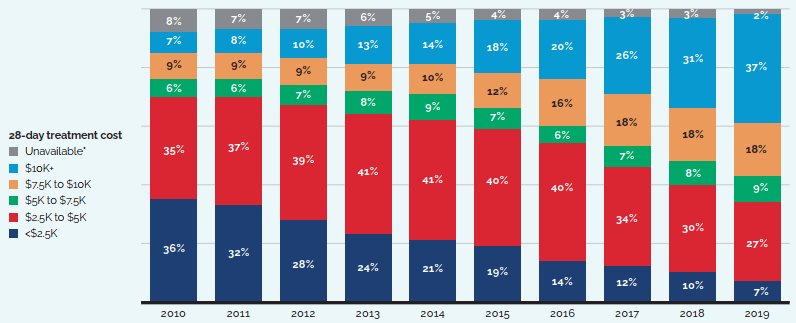
Note: While some of these medicines may also be used to treat other conditions, the data used for this analysis does not distinguish between indications, and thus, the reported sales may reflect some non-cancer use.
Values may not add to totals due to rounding.
* 28-day treatment costs are not available for these medicines.
Data source: PMPRB; MIDAS® database, 2010–2019, IQVIA (all rights reserved)
[NPDUIS Chartbook: Oncology Medicines in Canada: Trends and International Comparisons, 2010–2019 (pre-publication results)]
Figure description
This bar graph depicts the distribution of total oncology medicine sales by treatment cost from 2010 to 2019. The bars are subdivided into six bands based on the average 28-day treatment cost: medicines whose costs are not available; medicines costing less than $2.5 thousand; $2.5 to $5.0 thousand; $5.0 to $7.5 thousand; $7.5 to $10.0 thousand; and more than $10 thousand.
| Year | Medicines with treatment costs unavailable | Medicines with treatment costs less than $2,500 | Medicines with treatment costs between $2,500 and $5,000 | Medicines with treatment costs between $5,000 and $7,500 | Medicines with treatment costs $7,500 and $10,000 | Medicines with treatment costs more than $10,000 |
|---|---|---|---|---|---|---|
2010 |
8% |
36% |
35% |
6% |
9% |
7% |
2011 |
7% |
32% |
37% |
6% |
9% |
8% |
2012 |
7% |
28% |
39% |
7% |
9% |
10% |
2013 |
6% |
24% |
41% |
8% |
9% |
13% |
2014 |
5% |
21% |
41% |
9% |
10% |
14% |
2015 |
4% |
19% |
40% |
7% |
12% |
18% |
2016 |
4% |
14% |
40% |
6% |
16% |
20% |
2017 |
3% |
12% |
34% |
7% |
18% |
26% |
2018 |
3% |
10% |
30% |
8% |
18% |
31% |
2019 |
2% |
7% |
27% |
9% |
18% |
37% |
Brief Insights: Spending on Expensive Drugs for Rare Diseases
Expensive drugs for rare diseases (EDRDs) are the fastest growing market segment in Canada. From 2012 to 2019, EDRD expenditures grew by 32%, more than six times the growth rate observed for all prescription medicines. Despite the small patient population, EDRDs accounted for nearly one tenth of the entire Canadian pharmaceutical market in 2019.
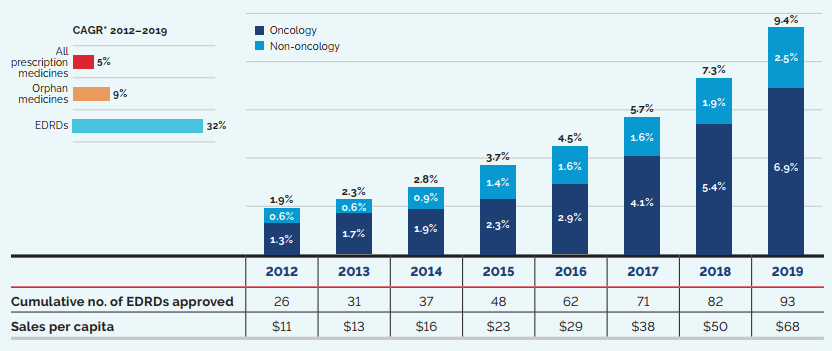
* Compound annual growth rate (CAGR) of expenditures over the study period
Data source: PMPRB; MIDAS® database, 2012–2019, IQVIA (all rights reserved); IQVIA Private Pay Direct Drug Plan database
For this analysis, EDRDs are defined as medicines with at least one orphan designation (by the US Food and Drug Administration or the European Medicines Agency) and estimated treatment costs exceeding $100,000 per year for non-oncology drugs and $7,500 per 28 days for oncology drugs.
[NPDUIS Chartbook: Expensive Drugs for Rare Diseases: Canadian and International Markets (pre-publication results)]
Figure description
This stacked bar graph depicts the market shares held by oncology and non-oncology expensive drugs for rare diseases in Canada from 2012 to 2019. The compound annual growth rate for all Canadian pharmaceutical sales over that period was 5%; for orphan-designated medicines, this growth rate was 9%, while sales of expensive drugs for rare diseases grew by 32%. A table below the graph gives the cumulative number of EDRDs approved as well as the Canadian EDRD sales per capita for each year.
| Share of Canadian pharmaceutical sales | 2012 | 2013 | 2014 | 2015 | 2016 | 2017 | 2018 | 2019 |
|---|---|---|---|---|---|---|---|---|
Oncology EDRDs |
1.3% |
1.7% |
1.9% |
2.3% |
2.9% |
4.1% |
5.4% |
6.9% |
Non-oncology EDRDs |
0.6% |
0.6% |
0.9% |
1.4% |
1.6% |
1.6% |
1.9% |
2.5% |
Total EDRDs |
1.9% |
2.3% |
2.8% |
3.7% |
4.5% |
5.7% |
7.3% |
9.4% |
Cumulative number of EDRDs approved |
26 |
31 |
37 |
48 |
62 |
71 |
82 |
93 |
EDRD sales per capita |
$11 |
$13 |
$16 |
$23 |
$29 |
$38 |
$50 |
$68 |
Top Therapeutic Classes Driving Sales Revenues
“Antineoplastics and immunomodulating agents”, “alimentary tract and metabolism”, and “general antiinfectives for systemic use and antiparasitic products” were the three top-selling therapeutic classes in 2019, accounting for close to two thirds of all patented medicine sales. The top-selling “antineoplastics and immunomodulating agents” class experienced a significant increase in sales of 17% in 2019. Conversely, sales of “respiratory system” medicines, which grew by 8.4% in 2018, experienced a significant decrease of -15.5% in 2019, as three top-selling medicines in this therapeutic class—Advair, Flovent, and Pulmicort—stopped reporting sales to the PMPRB.
Figure 15 breaks out the sales of patented medicines in Canada by therapeutic class using level 1 of the World Health Organization’s (WHO) Anatomical Therapeutic Chemical (ATC) system.Footnote 10 Two donut graphs compare the share of total sales for each therapeutic class in 2019 to the share in 2008. The associated table gives the 2019 sales for each class and the sales growth from 2018 to 2019.
7 of the 10
top-selling medicines in 2019 had annual treatment costs exceeding $10,000.
The “antineoplastics and immunomodulating agents” class accounted for a much larger share of sales in 2019 (38.8%) than in 2008 (15.6%), as more high-cost medicines entered the market over the past decade. By contrast, the share of sales of cardiovascular system medicines decreased dramatically from 24.5% to 3.3%.
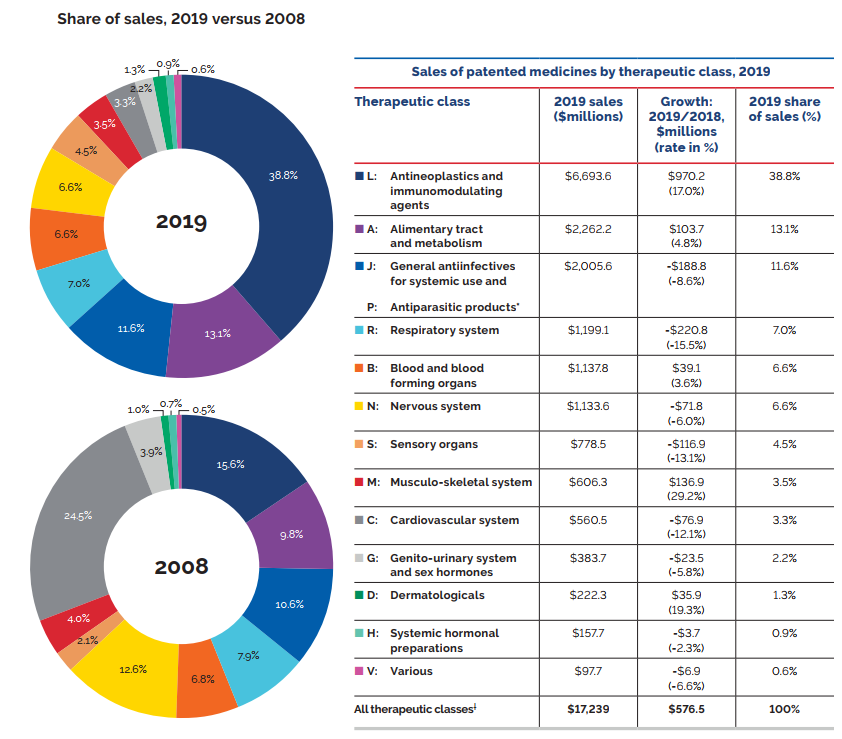
* These groups have been combined for reasons of confidentiality.
† Values may not add to totals due to rounding.
Data source: PMPRB
Figure description
These two pie charts depict the sales of patented medicines as a percentage of all medicine sales by therapeutic class in 2019 and 2008.
| Therapeutic Class | 2019 Share of Sales (%) | 2008 Share of Sales (%) |
|---|---|---|
L: Antineoplastics and immunomodulating agents |
38.8 |
15.6 |
A: Alimentary tract and metabolism |
13.1 |
9.8 |
J: General antiinfectives for systemic use and P: Antiparasitic products |
11.6 |
10.6 |
R: Respiratory system |
7.0 |
7.9 |
B: Blood and blood forming organs |
6.6 |
6.8 |
N: Nervous system |
6.6 |
12.6 |
S: Sensory organs |
4.5 |
2.1 |
M: Musculo-skeletal system |
3.5 |
4.0 |
C: Cardiovascular system |
3.3 |
24.5 |
G: Genito-urinary system and sex hormones |
2.2 |
3.9 |
D: Dermatologicals |
1.3 |
1.0 |
H: Systemic hormonal preparations |
0.9 |
0.7 |
V: Various |
0.6 |
0.5 |
The accompanying table gives the 2019 total sales by therapeutic class, the growth in sales (millions of dollars) and the growth rate (percent) from 2018 to 2019, and the 2019 share of sales.
| Therapeutic Class | 2019 Sales (millions of dollars) | Growth: 2019/2018 in millions of dollars (rate in percentages) | 2019 share of sales (%) |
|---|---|---|---|
L: Antineoplastics and immunomodulating agents |
$6,693.6 |
$970.2 |
38.8% |
A: Alimentary tract and metabolism |
$2,262.2 |
$103.7 |
13.1% |
J: General antiinfectives for systemic use and P: Antiparasitic products |
$2,005.6 |
-$188.8 |
11.6% |
R: Respiratory system |
$1,199.1 |
-$220.8 |
7.0% |
B: Blood and blood forming organs |
$1,137.8 |
$39.1 |
6.6% |
N: Nervous system |
$1,133.6 |
-$71.8 |
6.6% |
S: Sensory organs |
$778.5 |
-$116.9 |
4.5% |
M: Musculo-skeletal system |
$606.3 |
$136.9 |
3.5% |
C: Cardiovascular system |
$560.5 |
-$76.9 |
3.3% |
G: Genito-urinary system and sex hormones |
$383.7 |
-$23.5 |
2.2% |
D: Dermatologicals |
$222.3 |
$35.9 |
1.3% |
H: Systemic hormonal preparations |
$157.7 |
-$3.7 |
0.9% |
V: Various |
$97.7 |
-$6.9 |
0.6% |
All therapeutic classes |
$17,238.6 |
$576.5 |
100% |
Biologic medicines
Biologic medicines, many of which are in the high-cost category, have been capturing an increasing share of the Canadian market, from 16% of patented medicine sales in 2008 to 41% in 2019. In 2019, Humira, Eylea, and Stelara were the top-selling biologics, collectively accounting for 10% of all patented medicine sales. Figure 16 breaks down the annual growth in biologic patented medicine sales by major therapeutic class.
Although the share of biologic medicine sales has increased in many therapeutic classes, immunomodulating agents other than those for oncology had the highest uptake over the last decade, growing from 4% of total patented medicine sales in 2008 to 17% in 2017. In 2018, the share of sales for this therapeutic class dipped from 17% to 13%, as top-selling Remicade stopped reporting to the PMPRB, but the sales share increased once again in 2019, reaching 15%. Oncology medicines also represent a steadily growing share of the biologic market, increasing from 2% of patented medicine sales in 2008 to 9% in 2019.
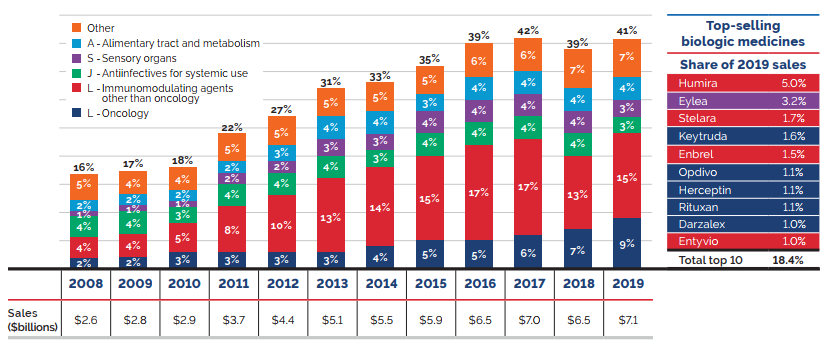
Note: Values may not add to totals due to rounding.
* Level 1 of Anatomical Therapeutic Chemical (ATC) classification system maintained by the World Health Organization.
Data source: PMPRB
Figure description
This bar graph depicts the biologic medicine share of total patented medicine sales by therapeutic class from 2008 to 2019. Each bar is subdivided into the therapeutic class bands: Other; Alimentary tract and metabolism; Sensory organs; Antiinfectives for systemic use; Immunomodulating agents other than oncology; and Oncology. The total sales in billions of dollars is given for each year.
| Therapeutic Class | 2008 | 2009 | 2010 | 2011 | 2012 | 2013 | 2014 | 2015 | 2016 | 2017 | 2018 | 2019 |
|---|---|---|---|---|---|---|---|---|---|---|---|---|
Other |
5% |
4% |
4% |
5% |
5% |
5% |
5% |
5% |
6% |
6% |
7% |
7% |
A: Alimentary tract and metabolism |
2% |
2% |
2% |
2% |
3% |
4% |
4% |
3% |
4% |
4% |
4% |
4% |
S: Sensory organs |
1% |
1% |
1% |
2% |
2% |
3% |
3% |
4% |
4% |
4% |
4% |
3% |
J: Antiinfectives for systemic use |
4% |
4% |
3% |
4% |
4% |
4% |
3% |
4% |
4% |
4% |
4% |
3% |
L: Immunomodulating agents – other than Oncology |
4% |
4% |
5% |
8% |
10% |
13% |
14% |
15% |
17% |
17% |
13% |
15% |
L: Oncology |
2% |
2% |
3% |
3% |
3% |
3% |
4% |
5% |
5% |
6% |
7% |
9% |
Total biologic share of patented medicine sales |
16% |
17% |
18% |
22% |
27% |
31% |
33% |
35% |
39% |
42% |
39% |
41% |
Total biologic sales (billions of dollars) |
$2.6 |
$2.8 |
$2.9 |
$3.7 |
$4.4 |
$5.1 |
$5.5 |
$5.9 |
$6.5 |
$7.0 |
$6.5 |
$7.1 |
The accompanying table gives the share of 2019 sales for the 10 top-selling biologics and their therapeutic class.
| Medicine | Therapeutic Class | Share of 2019 Sales |
|---|---|---|
Humira |
L: Immunomodulating agents other than oncology |
5.0% |
Eylea |
S: Sensory organs |
3.2% |
Stelara |
L: Immunomodulating agents other than oncology |
1.7% |
Keytruda |
L: Oncology |
1.6% |
Enbrel |
L: Immunomodulating agents other than oncology |
1.5% |
Opdivo |
L: Oncology |
1.1% |
Herceptin |
L: Oncology |
1.1% |
Rituxan |
L: Oncology |
1.1% |
Darzalex |
L: Oncology |
1.0% |
Entyvio |
L: Immunomodulating agents other than oncology |
1.0% |
Total Top 10 Biologics |
18.4% |
|
Brief Insights: Biosimilar uptake
Given the high use and cost of biologics in Canada, biosimilars offer an opportunity for significant cost savings. However, unlike generics, biosimilars are not identical to their originator medicines, but are rather highly similar versions, and Health Canada's authorization of a biosimilar is not a declaration of equivalence to the originator biologic.
While European countries have experienced some success in terms of early market entry, price discounts, and the uptake of biosimilars, Canada has lagged behind. For example, although the biosimilar Inflectra was first sold in Canada in 2015, it only represented 8% of the infliximab units sold at the end of 2018, with the originator biologic Remicade still maintaining a significant market share. This placed Canada well below the OECD median of 46% for sales shares of infliximab biosimilars.
Recently, some Canadian payers have undertaken initiatives to increase biosimilar uptake.
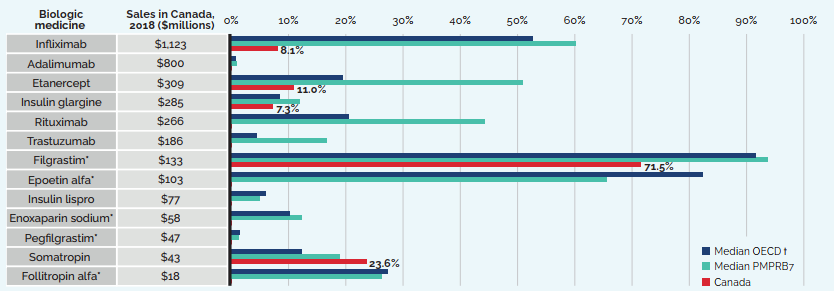
* Generally used to treat acute conditions.
† Canada is excluded from the median OECD value.
Data source: MIDAS® database, prescription retail and hospital markets, 2018, IQVIA (all rights reserved)
[NPDUIS Chartbook: Biologics in Canada. Part 1: Market Trends, 2018]
Figure description
This bar graph reports the biosimilar uptake, in share of units, for Canada, the PMPRB7, and the Organisation for Economic Co-operation and Development as of the fourth quarter of 2018. The graph compares the uptake for biologic medicines with biosimilar availability in Canada. Total 2018 Canadian sales for each medicine are also given. Note that medicines with an asterisk are generally used to treat acute conditions.
| Biologic medicine | Sales in Canada, 2018, in millions of dollars | Biosimilar uptake, Q4-2018, share of units | ||
|---|---|---|---|---|
| Median OECD | Median PMPRB7 | Canada | ||
Infliximab |
$1,123 |
52.7% |
60.2% |
8.1% |
Adalimumab |
$800 |
0.7% |
1.0% |
0.0% |
Etanercept |
$309 |
19.4% |
50.9% |
11.0% |
Insulin glargine |
$285 |
8.4% |
12.0% |
7.3% |
Rituximab |
$266 |
20.5% |
44.3% |
0.0% |
Trastuzumab |
$186 |
4.5% |
16.7% |
0.0% |
Filgrastim* |
$133 |
91.6% |
93.7% |
71.5% |
Epoetin alfa* |
$103 |
82.3% |
65.5% |
0.0% |
Insulin lispro |
$77 |
6.1% |
4.9% |
0.0% |
Enoxaparin sodium* |
$58 |
10.2% |
12.3% |
0.0% |
Pegfilgrastim* |
$47 |
1.4% |
1.3% |
0.0% |
Somatropin |
$43 |
12.4% |
19.0% |
23.6% |
Follitropin alfa* |
$18 |
27.3% |
26.3% |
0.0% |
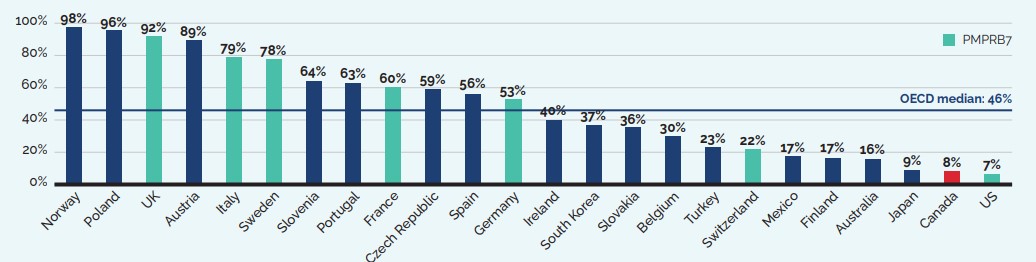
Note: Countries with limited data were excluded from the analysis.
Data source: MIDAS® database, prescription retail and hospital markets, Q4-2018, IQVIA (all rights reserved)
[NPDUIS Chartbook: Biologics in Canada. Part 1: Market Trends, 2018]
Figure description
This bar graph gives the uptake for infliximab biosimilars for each country in the Organisation for Economic Co-operation and Development as a share of all infliximab units sold in the fourth quarter of 2018. Countries with limited sales data were excluded from this analysis. The median for all countries listed was 46%.
| Country | Share of units |
|---|---|
Norway |
98% |
Poland |
96% |
United Kingdom (UK) |
92% |
Austria |
89% |
Italy |
79% |
Sweden |
78% |
Slovenia |
64% |
Portugal |
63% |
France |
60% |
Czech Republic |
59% |
Spain |
56% |
Germany |
53% |
Ireland |
40% |
South Korea |
37% |
Slovakia |
36% |
Belgium |
30% |
Turkey |
23% |
Switzerland |
22% |
Mexico |
17% |
Finland |
17% |
Australia |
16% |
Japan |
9% |
Canada |
8% |
United States (US) |
7% |
Oncology medicines
Figure 19 illustrates the growth in the sales of all oncology medicines (biologic and non-biologic) over the last decade. In 2019, oncology medicines accounted for 20.9% of total patented medicine sales, a substantial increase from 5.4% in 2008. Oral forms of cancer treatment are a noteworthy emerging segment, increasing their share of the patented medicine market from 1.7% to 10.6%, or half of all oncology medicine sales, over the same period. The oral therapy Revlimid was the top-selling oncology medicine in 2019, accounting for 2.7% of all patented medicine sales.Footnote 11
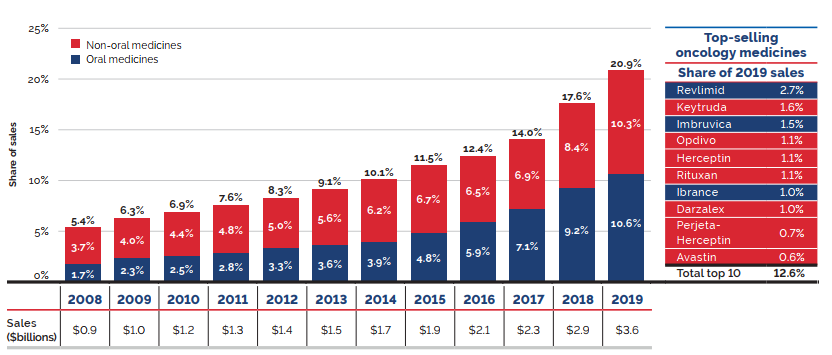
Note: The methodology used for this analysis has been refined over the past two editions to better represent the market for oncology medicines. This includes a revised set of selection criteria, established following a thorough review and expert recommendation, as well as an updated method for determining the annual count of medicines. Thus, there may be some variation between these results and those previously reported.
These results reflect the total sales for patented medicines used in the treatment of cancer. While some of these medicines may also be used to treat other conditions, the data used for this analysis does not distinguish between indications, and thus, the reported sales may reflect some non-cancer use.
Values may not add to totals due to rounding.
Data source: PMPRB
Figure description
This stacked bar graph depicts the oncology medicine share of patented medicine sales by formulation from 2008 to 2019. Each bar is subdivided into non-oral medicine and oral medicine formulations. The combined total oncology share of patented medicine sales as well as the net sales in billions of dollars are also indicated.
| Formulation | 2008 | 2009 | 2010 | 2011 | 2012 | 2013 | 2014 | 2015 | 2016 | 2017 | 2018 | 2019 |
|---|---|---|---|---|---|---|---|---|---|---|---|---|
Non-oral medicines |
3.7% |
4.0% |
4.4% |
4.8% |
5.0% |
5.6% |
6.2% |
6.7% |
6.5% |
6.9% |
8.4% |
10.3% |
Oral medicines |
1.7% |
2.3% |
2.5% |
2.8% |
3.3% |
3.6% |
3.9% |
4.8% |
5.9% |
7.1% |
9.2% |
10.6% |
Total oncology share |
5.4% |
6.3% |
6.9% |
7.6% |
8.3% |
9.1% |
10.1% |
11.5% |
12.4% |
14.0% |
17.6% |
20.9% |
Sales (billions of dollars) |
$0.9 |
$1.0 |
$1.2 |
$1.3 |
$1.4 |
$1.5 |
$1.7 |
$1.9 |
$2.1 |
$2.3 |
$2.9 |
$3.6 |
The accompanying table gives the share of 2019 sales for the 10 top-selling oncology medicines.
| Oncology medicine | Formulation | Share of 2019 sales |
|---|---|---|
Revlimid |
Oral |
2.7% |
Keytruda |
Non-oral |
1.6% |
Imbruvica |
Oral |
1.5% |
Opdivo |
Non-oral |
1.1% |
Herceptin |
Non-oral |
1.1% |
Rituxan |
Non-oral |
1.1% |
Ibrance |
Oral |
1.0% |
Darzalex |
Non-oral |
1.0% |
Perjeta-Herceptin |
Non-oral |
0.7% |
Avastin |
Non-oral |
0.6% |
Total top 10 |
|
12.6% |
Price Trends
The PMPRB uses the Patented Medicines Price Index (PMPI) to monitor trends in the prices of patented medicines. The PMPI measures the average year-over-year change in the ex-factory prices of patented medicines sold in Canada using a sales-weighted average of price changes at the level of individual medicines.Footnote 12 This is similar to the approach Statistics Canada uses to construct the Consumer Price Index (CPI). The PMPI is based on an average transaction price and sales information submitted by patentees for a six-month period.
The PMPI only measures the sales growth attributable to changes in the prices of patented medicines. It does not measure changes in the use of patented medicines; this is measured by the quantity index or PMQI (see the Utilization of Patented Medicines section). Nor does it measure the cost impact of changes in prescribing patterns or the introduction of new medicines.
The Patent Act requires the PMPRB to consider changes in the CPI, among other factors, in determining whether the price of a patented medicine is excessive. Figure 20 compares year-over-year changes in the PMPI to corresponding changes in the CPI from 2003 to 2019. The PMPI is reported based on two measures: the national average transaction price, a “net” price which includes rebates and discounts; and the national list price, a “gross” price. Both measures are reported to the PMPRB by patentees. General price inflation, as measured by the CPI, has exceeded the average increase in the prices of patented medicines almost every year since 2003. In 2019, the CPI rose by 1.9%, while the PMPI increased by 1.3%.
It is not surprising that the PMPI has seldom kept pace with the CPI. The PMPRB’s Guidelines envisage that the price of a patented medicine should not rise by more than the CPI over any three-year period.Footnote 13 (The Guidelines also contemplate a cap on year-over-year price increases equal to one and one-half times the current year rate of CPI inflation.) This effectively establishes CPI inflation as an upper bound on the amount by which individual prices could rise over any three-year period. Increases in the PMPI normally do not reach this upper bound because many patentees do not raise their prices by the full amount envisaged under the Guidelines.
Patented medicine prices increased by less than CPI
In 2019, the increase in patented medicine prices was, on average, less than the rate of inflation, as measured by the Consumer Price Index (CPI).
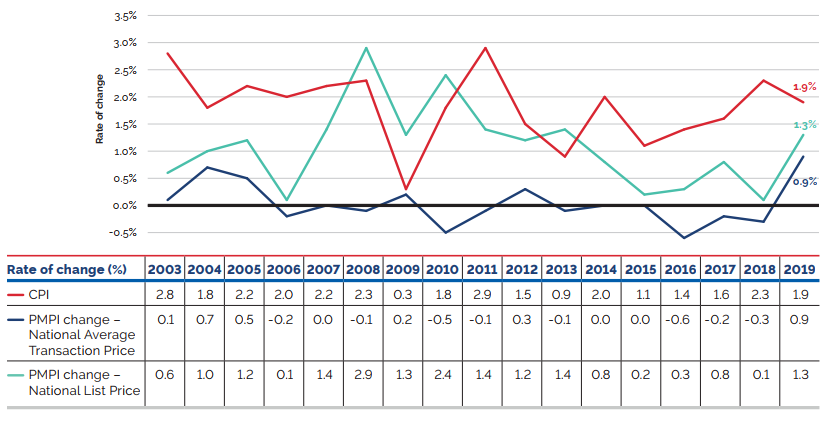
Data source: PMPRB; Statistics Canada
Figure description
This line graph depicts the year-over-year percent changes in the PMPI and CPI for the years 2003 to 2019. The PMPI is represented by two lines – one based on the national average transaction price and one based on the national list price.
| 2003 | 2004 | 2005 | 2006 | 2007 | 2008 | 2009 | 2010 | 2011 | 2012 | 2013 | 2014 | 2015 | 2016 | 2017 | 2018 | 2019 | |
|---|---|---|---|---|---|---|---|---|---|---|---|---|---|---|---|---|---|
CPI change |
2.8% |
1.8% |
2.2% |
2.0% |
2.2% |
2.3% |
0.3% |
1.8% |
2.9% |
1.5% |
0.9% |
2.0% |
1.1% |
1.4% |
1.6% |
2.3% |
1.9% |
PMPI change (National Average Transaction Price) |
0.1% |
0.7% |
0.5% |
-0.2% |
0.0% |
-0.1% |
0.2% |
-0.5% |
-0.1% |
0.3% |
-0.1% |
0.0% |
0.0% |
-0.6% |
-0.2% |
-0.3% |
0.9% |
PMPI change (National List Price) |
0.6% |
1.0% |
1.2% |
0.1% |
1.4% |
2.9% |
1.3% |
2.4% |
1.4% |
1.2% |
1.4% |
0.8% |
0.2% |
0.3% |
0.8% |
0.1% |
1.3% |
Price Behaviour after Introduction
Does the price of a typical patented medicine change much in the years after it enters the Canadian market? To answer this question, Figure 21 provides the average ratio of the 2019 price to introductory price (the price at which the medicine was sold in its first year on the Canadian market).
The results in Figure 21 suggest a consistent trend: prices remain stable early in their life cycle, and then gradually rise by a small amount, year-over-year, afterwards. This is consistent with the effect of the PMPRB’s CPI methodology.Footnote 14 For example, the average prices of medicines introduced a decade ago are still at the same level in 2019.
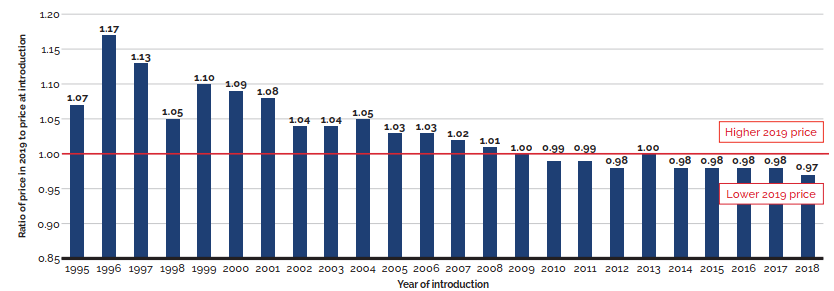
Data source: PMPRB
Figure description
This bar graph depicts the average ratio of the 2019 price of a typical patented medicine to the introductory price (the price at which the medicine was sold in its first year on the Canadian market) for medicines introduced between 1995 and 2018. A line at 1.00 indicates the 2019 price.
For medicines introduced in 1995, the average ratio of the 2019 price to the introductory price is 1.07. In 1996, 1.17; 1997, 1.13; 1998, 1.05; 1999, 1.10; 2000, 1.09; 2001, 1.08; 2002, 1.04; 2003, 1.04;
2004, 1.05; 2005, 1.03; 2006, 1.03; 2007, 1.02; 2008, 1.01; 2009, 1.00; 2010, 0.99; 2011, 0.99;
2012, 0.98; 2013, 1.00; 2014, 0.98; 2015, 0.98; 2016, 0.98; 2017, 0.98; 2018, 0.97.
Price Change by Country
In 2019, in accordance with the Act and the Regulations, patentees reported publicly available prices of patented medicines for seven comparator countries (PMPRB7): France, Germany, Italy, Sweden, Switzerland, the United Kingdom (UK), and the United States (US).
The PMPRB uses this information to
- conduct international price comparison tests; and
- compare the Canadian prices of patented medicines to those prevailing in other countries.
Figure 22 gives the average annual rates of price change for Canada and each of the PMPRB7 countries. These results were obtained by applying the PMPI methodology (with weights based on Canadian sales patterns) to the international price data that patentees submitted to the PMPRB. Note that prices from the US Federal Supply Schedule (FSS)Footnote 15 are incorporated into the US results.
In 2019, Canadian prices saw a slight increase of 0.9%, while prices in the US rose by an average of 10.3% and those in the UK increased by 0.5%. Prices in all other countries declined. These results are consistent with a long-term tendency for patented medicine prices to slowly fall over time in most comparable countries (with the exception of the US).
The foreign market results are based on publicly available gross prices, namely ex-factory price information (generally for the retail customer class) submitted by patentees to the PMPRB. The Canadian rate of change, however, is based on net prices, namely actual average transaction prices net of rebates and discounts provided by manufacturers to their direct customers.
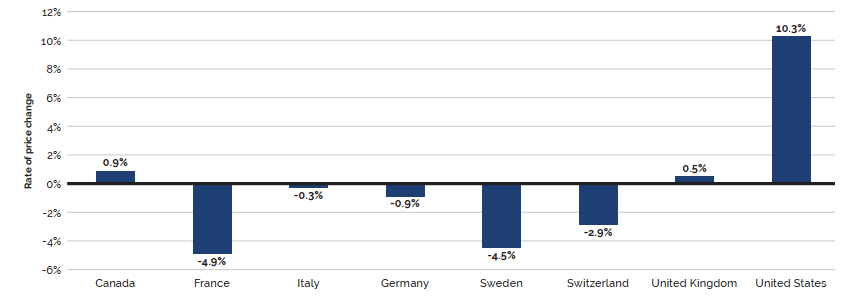
Data source: PMPRB
Figure description
This bar graph depicts the average annual rates of price change for Canada and each of the PMPRB7 comparator countries for 2019. In Canada, the average annual rate of price change was 0.9%.
France, -4.9%; Italy, -0.3%; Germany, -0.9%; Sweden, -4.5%; Switzerland, -2.9%; United Kingdom, 0.5%; United States, 10.3%.
Comparison of Canadian Prices to Foreign Prices
Tables 9 and 10 provide detailed statistics comparing the foreign prices of patented medicines to their Canadian prices. Each table provides two sets of average price ratios. These are differentiated according to the method by which foreign prices were converted to their Canadian dollar equivalents. The tables also give the numbers of strengths and dosage forms of medicines (DINs) and the volume of sales encompassed by each reported price ratio.Footnote 16
The average price ratios given in Tables 9 and 10 are sales-weighted arithmetic means of price ratios obtained for individual DINs, with weights based on Canadian sales patterns. Average price ratios constructed in this way provide answers to questions such as:
How much more/less would Canadians have paid for the patented medicines they purchased in 2019 had they paid Country X prices rather than Canadian prices?
For example, Table 9 states that the 2019 average France-to-Canada price ratio was 0.73. This means Canadians would have paid 27% less for the patented medicines they purchased in 2019 if they had paid French prices.
For many years, the PMPRB has reported average foreign-to-Canadian price ratios with foreign prices converted to their Canadian dollar equivalents by means of market exchange rates (more exactly, the 36-month moving averages of market rates the PMPRB normally uses in applying its Guidelines). Tables 9 and 10 also report foreign-to-Canadian price ratios with currency conversion at purchasing power parity (PPP). The PPP between any two countries measures their relative costs of living expressed in units of their own currencies. In practice, cost of living is determined by pricing out a standard “basket” of goods and services at the prices prevailing in each country.
Because PPPs are designed to represent relative costs of living, they offer a simple way to account for differences in overall national price levels when comparing individual prices, incomes, and other monetary values across countries. When applied to the calculation of average foreign-to-Canadian price ratios they produce statistics answering questions such as:
How much more/less consumption of other goods and services would Canadians have sacrificed for the patented medicines they purchased in 2019 had they lived in Country X?
Questions such as this cannot be answered by simply comparing the prices of medicines. Rather, one must first calculate what each price represents in terms of goods and services foregone. PPPs are designed for such purposes.
Bilateral Price Comparisons
Table 9 provides bilateral comparisons of prices in each of the PMPRB7 countries to corresponding Canadian prices. Focusing on the results with currency conversion at market exchange rates, it appears that, as in previous years, Canadian prices were typically within the range of prices observed among the comparator countries. Prices in France were appreciably lower than Canadian prices followed by Sweden, Italy, and the UK, while prices in Switzerland and Germany were higher. As in previous years, prices reported for the United States were much higher than prices in Canada or any other comparator country.
Table 9. Average Foreign-to-Canadian Price Ratios, Bilateral Comparisons, 2019
| Canada | France | Germany | Italy | Sweden | Switzerland | United Kingdom | United States | |
|---|---|---|---|---|---|---|---|---|
At market exchange rates |
||||||||
Average price ratio 2019 |
1.00 |
0.73 |
1.07 |
0.96 |
0.81 |
1.04 |
0.97 |
3.77 |
Average price ratio 2018 |
1.00 |
0.74 |
1.09 |
0.97 |
0.94 |
1.08 |
1.00 |
3.59 |
At purchasing power parities |
||||||||
Average price ratio 2019 |
1.00 |
0.79 |
1.16 |
1.15 |
0.78 |
0.81 |
0.99 |
3.50 |
Average price ratio 2018 |
1.00 |
0.76 |
1.13 |
1.09 |
0.82 |
0.82 |
0.99 |
3.07 |
Number of patented medicines compared 2019 (DINs) |
1,331 |
637 |
980 |
778 |
801 |
858 |
958 |
1,035 |
Sales ($millions) |
$17,235.6 |
$11,317.8 |
$15,200.5 |
$13,880.7 |
$12,444.7 |
$14,872.2 |
$14,928.4 |
$15,808.5 |
Data source: PMPRB
It is important to note that it is not always possible to find a matching foreign price for every strength and dosage form of a patented medicine sold in Canada. Table 9 displays how often an international price comparison was available for each of the comparator countries. For example, out of 1,331 DINs for patented medicines reported as under the PMPRB’s jurisdiction in 2019, a publicly available ex-factory price for France was available 48% of the time, whereas US prices were available for 78% of medicines. Given the integrated nature of the Canadian and US supply chain, it is not uncommon for the US to be the only comparator country with an available price for a strength and dosage form of a medicine sold in Canada. In this case, it is considered to constitute the international median price, as per the PMPRB’s methodology.
Average price ratios obtained with currency conversion at PPPs tell the same story. When international differences in the cost of living are considered, it appears that Canadians incurred a larger consumption cost for the patented medicines they purchased in 2019 than did residents of France, Sweden, Switzerland, and the UK.
Figure 23 puts these results in historical perspective. In 2008, Canadian prices were, on average, slightly higher than prices in Italy, France, and Sweden, and approximately the same as prices in the UK and Switzerland. By 2019, the gap between Canadian prices and prices in France and Sweden had grown significantly greater as the relative prices in these countries dropped, while the prices in Italy and the UK in 2019 were in line with Canadian levels. Price levels in Switzerland, Germany, and the US all exceeded those in Canada in 2019, although the gap between Canadian and German prices narrowed.
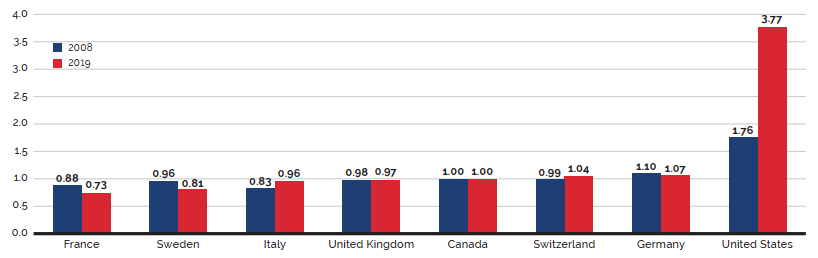
Data source: PMPRB
Figure description
This bar graph depicts the average foreign-to-Canadian price ratios in 2008 and 2019 for the PMPRB7 comparator countries.
- France — 2008; 0.88, 2019: 0.73
- Sweden — 2008; 0.96, 2019: 0.81
- Italy — 2008; 0.83, 2019: 0.96
- United Kingdom — 2008; 0.98, 2019: 0.97
- Canada — 2008: 1.00, 2019: 1.00
- Switzerland — 2008; 0.99, 2019: 1.04
- Germany — 2008; 1.10, 2019: 1.07
- United States — 2008; 1.76, 2019: 3.77
If the patented medicine is being sold in one or more of the PMPRB7 countries, the patentee must report the publicly available ex-factory prices to the PMPRB for each class of customer.Footnote 17 Using this data, Figure 23 provides sales weighted bilateral ratios comparing Canadian average transactional prices against foreign list prices. In order to assess how Canada compares to a basket of countries beyond the PMPRB7, Figure 24 uses Canadian and international prices reported in the IQVIA MIDAS® database at the ex-factory manufacturer level, reflecting all sales to the pharmacy and hospital sectors.Footnote 18 Note that the results presented in Figures 23 and 24 will differ somewhat due to the use of different data sources.
The international price comparisons reported in Figure 24 provide a bilateral price comparison for all countries in the Organisation for Economic Co-operation and Development (OECD) with available MIDAS® data. The average foreign-to-Canadian price ratios are calculated using the same approach employed to produce the ratios presented in Figure 23. These are Canadian sales-weighted arithmetic averages of the corresponding foreign-to-Canadian price ratios for individual medicines. As shown in Figure 24, median OECD prices are, on average, approximately 19% lower than price levels in Canada, which are the fourth highest among the 31 countries. Notably, the top three highest-priced countries are the US, Germany, and Switzerland.
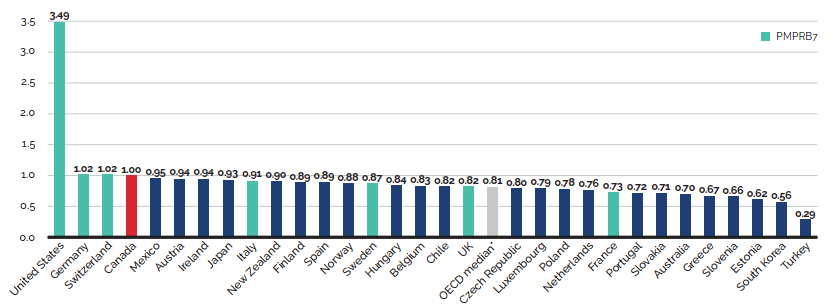
* Calculated at the medicine level for medicines with prices available in at least three foreign markets.
Data source: MIDAS® database, 2019, IQVIA (all rights reserved)
Figure description
This bar graph depicts the average foreign-to-Canadian price ratios for patented medicines in 2019 for OECD countries using Canadian and international prices reported in the IQVIA MIDAS® database. The given OECD median value is calculated at the medicine level for medicines with prices available in at least three foreign markets.
United States: 3.49; Germany: 1.02; Switzerland: 1.02; Canada: 1.00; Mexico: 0.95; Austria: 0.94;
Ireland: 0.94; Japan: 0.93; Italy: 0.91; New Zealand: 0.90; Finland: 0.89; Spain: 0.89; Norway: 0.88; Sweden: 0.87; Hungary: 0.84; Belgium: 0.83; Chile: 0.82; UK: 0.82; OECD Median*: 0.81;
Czech Republic: 0.80; Luxembourg: 0.79; Poland: 0.78; Netherlands: 0.76; France: 0.73; Portugal: 0.72; Slovakia: 0.71; Australia: 0.70; Greece: 0.67; Slovenia: 0.66; Estonia: 0.62; South Korea: 0.56;
Turkey: 0. 29.
Brief Insights: Trends in the Price of Generic Medicines
The average price of generic medicines in Canada has dropped substantially, by 60% relative to price levels in 2007 (Figure 25). This was the greatest rate of price reduction compared to all PMPRB7 markets, as generic price decreases continued to reduce the historic gap between Canadian and foreign generic price levels. The recent Canadian generic pricing policy, implemented in 2018, brought Canadian generic prices in line with average prices in Italy, although price levels are still lower in the US, Germany, and France, and significantly lower in the UK and Sweden. The average prices for all OECD countries were just 8% lower than prices in Canada in the last quarter of 2019, an improvement from the gap of 15% at the end of the previous year (Figure 26).
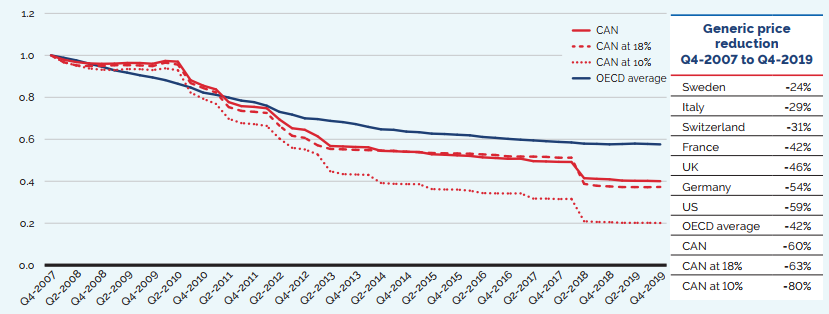
Note: The term “generic” used in this analysis includes both patented and non-patented generic medicines. Results are based on manufacturer ex-factory list prices in the national retail markets. The analysis was restricted to oral solid generic medicines that had been on the market for at least one year.
CAN at 18% and 10% refer to the 67 generic medicines reduced to 18% and 10% of their brand reference prices through the generic pricing policy introduced in April 2018.
Data source: MIDAS® database, October–December 2007 to October–December 2019, IQVIA (all rights reserved)
[NPDUIS Report: Generics360, 2018 – graph updated for 2019]
Figure description
This line graph and accompanying table focus on the price reductions for generic medicines from the fourth quarter of 2007 to the fourth quarter of 2019. The graph gives the price indices for all generic medicines in Canada, as well as those at 18% and 10% of their brand-reference prices and compares these with the average for the Organisation for Economic Co-operation and Development (OECD) countries over the same period. Note that the term “generic” used in this analysis includes both patented and non-patented generic medicines.
| Quarter year | Canada | Canada medicines at 18% | Canada medicines at 10% | OECD average |
|---|---|---|---|---|
2007: fourth quarter |
1.00 |
1.00 |
1.00 |
1.00 |
2008: first quarter |
0.98 |
0.97 |
0.97 |
0.99 |
2008: second quarter |
0.97 |
0.95 |
0.95 |
0.98 |
2008: third quarter |
0.96 |
0.95 |
0.94 |
0.96 |
2008: fourth quarter |
0.96 |
0.95 |
0.93 |
0.95 |
2009: first quarter |
0.96 |
0.95 |
0.93 |
0.93 |
2009: second quarter |
0.96 |
0.95 |
0.93 |
0.92 |
2009: third quarter |
0.96 |
0.95 |
0.93 |
0.91 |
2009: fourth quarter |
0.96 |
0.95 |
0.93 |
0.89 |
2010: first quarter |
0.97 |
0.97 |
0.94 |
0.88 |
2010: second quarter |
0.97 |
0.96 |
0.93 |
0.86 |
2010: third quarter |
0.88 |
0.87 |
0.82 |
0.85 |
2010: fourth quarter |
0.86 |
0.84 |
0.79 |
0.82 |
2011: first quarter |
0.84 |
0.82 |
0.77 |
0.81 |
2011: second quarter |
0.78 |
0.75 |
0.70 |
0.80 |
2011: third quarter |
0.76 |
0.74 |
0.68 |
0.78 |
2011: fourth quarter |
0.75 |
0.73 |
0.67 |
0.78 |
2012: first quarter |
0.75 |
0.73 |
0.66 |
0.76 |
2012: second quarter |
0.69 |
0.66 |
0.60 |
0.73 |
2012: third quarter |
0.65 |
0.62 |
0.56 |
0.72 |
2012: fourth quarter |
0.65 |
0.61 |
0.55 |
0.70 |
2013: first quarter |
0.61 |
0.57 |
0.53 |
0.70 |
2013: second quarter |
0.57 |
0.55 |
0.45 |
0.69 |
2013: third quarter |
0.57 |
0.55 |
0.43 |
0.68 |
2013: fourth quarter |
0.56 |
0.55 |
0.43 |
0.67 |
2014: first quarter |
0.56 |
0.55 |
0.43 |
0.66 |
2014: second quarter |
0.54 |
0.55 |
0.39 |
0.65 |
2014: third quarter |
0.54 |
0.55 |
0.39 |
0.65 |
2014: fourth quarter |
0.54 |
0.54 |
0.39 |
0.64 |
2015: first quarter |
0.54 |
0.54 |
0.39 |
0.63 |
2015: second quarter |
0.53 |
0.53 |
0.36 |
0.63 |
2015: third quarter |
0.53 |
0.53 |
0.36 |
0.63 |
2015: fourth quarter |
0.52 |
0.53 |
0.36 |
0.62 |
2016: first quarter |
0.52 |
0.53 |
0.36 |
0.62 |
2016: second quarter |
0.51 |
0.53 |
0.34 |
0.61 |
2016: third quarter |
0.51 |
0.53 |
0.34 |
0.61 |
2016: fourth quarter |
0.51 |
0.52 |
0.34 |
0.60 |
2017: first quarter |
0.51 |
0.52 |
0.34 |
0.60 |
2017: second quarter |
0.50 |
0.52 |
0.32 |
0.59 |
2017: third quarter |
0.49 |
0.52 |
0.32 |
0.59 |
2017: fourth quarter |
0.49 |
0.51 |
0.32 |
0.59 |
2018: first quarter |
0.49 |
0.51 |
0.32 |
0.58 |
2018: second quarter |
0.41 |
0.39 |
0.21 |
0.58 |
2018: third quarter |
0.41 |
0.38 |
0.21 |
0.58 |
2018: fourth quarter |
0.41 |
0.38 |
0.21 |
0.58 |
2019: first quarter |
0.40 |
0.37 |
0.20 |
0.58 |
2019: second quarter |
0.40 |
0.37 |
0.20 |
0.58 |
2019: third quarter |
0.40 |
0.37 |
0.20 |
0.58 |
2019: fourth quarter |
0.40 |
0.37 |
0.20 |
0.58 |
The accompanying table gives the associated generic price reductions from the fourth quarter of 2007 to the fourth quarter of 2019 for the Canadian markets and the OECD average, as well as for each of the PMPRB7 countries.
| Country | Generic price reduction |
|---|---|
Sweden |
24% |
Italy |
29% |
Switzerland |
31% |
France |
42% |
UK |
46% |
Germany |
54% |
US |
59% |
OECD average |
42% |
Canada: all generics |
60% |
Canada: generics at 18% |
63% |
Canada: generics at 10% |
80% |
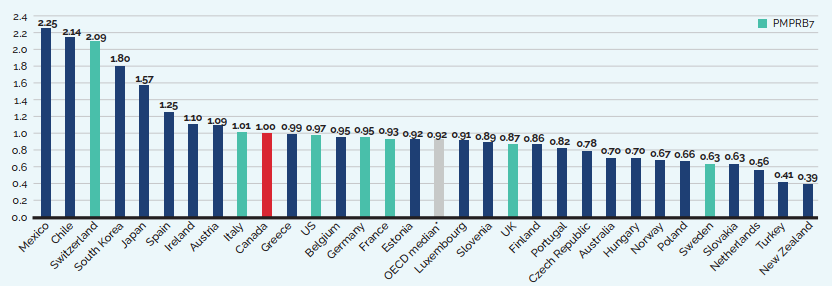
Note: The term “generic” used in this analysis includes both patented and non-patented generic medicines. Results are based on manufacturer ex-factory list prices in the national retail markets. The analysis was restricted to oral solid generic medicines that had been on the market for at least one year.
* The OECD median does not necessarily represent the median result for the individual countries reported in this graph, as it is calculated at the medicine level for generics with prices available in at least three foreign markets.
Data source: MIDAS® database, October–December 2019, IQVIA (all rights reserved)
[NPDUIS Report: Generics360, 2018 – graph updated for 2019]
Figure description
This bar graph compares the bilateral foreign-to-Canadian generic medicine price ratios for OECD countries for the fourth quarter of 2019. A value for the OECD median is also provided, calculated at medicine level for medicines with prices available in at least three foreign markets.
Note that the term “generic” used in this analysis includes both patented and non-patented generic medicines. Results are based on manufacturer ex-factory list prices in the national retail markets. The analysis was restricted to oral solid generic medicines that had been on the market for at least one year.
| Country | Foreign-to-Canadian price ratio |
|---|---|
Mexico |
2.25 |
Chile |
2.14 |
Switzerland |
2.09 |
South Korea |
1.80 |
Japan |
1.57 |
Spain |
1.25 |
Ireland |
1.10 |
Austria |
1.09 |
Italy |
1.01 |
Canada |
1.00 |
Greece |
0.99 |
US |
0.97 |
Belgium |
0.95 |
Germany |
0.95 |
France |
0.93 |
Estonia |
0.92 |
OECD median |
0.92 |
Luxembourg |
0.91 |
Slovenia |
0.89 |
UK |
0.87 |
Finland |
0.86 |
Portugal |
0.82 |
Czech Republic |
0.78 |
Australia |
0.70 |
Hungary |
0.70 |
Norway |
0.67 |
Poland |
0.66 |
Sweden |
0.63 |
Slovakia |
0.63 |
Netherlands |
0.56 |
Turkey |
0.41 |
New Zealand |
0.39 |
Multilateral Price Comparisons
Table 10 provides average foreign-to-Canadian price ratios using several multilateral measures of foreign prices. The median international price (MIP) is the median of prices observed among the PMPRB7. Other multilateral price ratios compare the minimum, maximum, and simple mean of foreign prices to their Canadian counterparts.
Focusing again on the results based on market exchange rates, the average MIP-to-Canadian price ratio was 1.16 in 2019, lower than the 1.20 ratio in 2018 (Figure 27). Note that mean foreign prices produce higher foreign-to-Canadian price ratios than MIPs do. This is due to the influence of US prices, which are typically much higher than prices elsewhere. Although US prices nearly always figure importantly in determining the mean foreign price, they have less impact on median international prices. Nevertheless, the US does exercise a significant influence over the average ratio of median international prices relative to Canadian prices, as the US is sometimes the only country with an available ex-factory price for a patented medicine sold in Canada.
Table 10. Average Foreign-to-Canadian Price Ratios, Multilateral Comparisons, 2019
| Median | Minimum | Maximum | Mean | |
|---|---|---|---|---|
Average price ratio at market exchange rates |
1.16 |
0.88 |
3.65 |
1.52 |
Average price ratio at purchasing power parities |
1.14 |
0.87 |
3.47 |
1.50 |
Number of patented medicines |
1,247 |
1,247 |
1,247 |
1,247 |
Sales ($millions) |
$16,841.12 |
$16,841.12 |
$16,841.12 |
$16,841.12 |
Data source: PMPRB
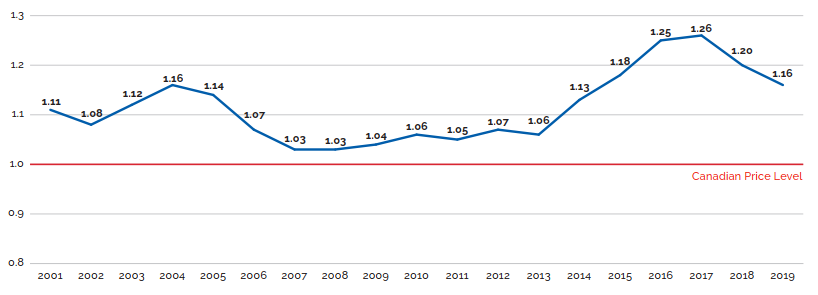
Data source: PMPRB
Figure description
This line graph depicts the trend in the average MIP-to-Canadian price ratios from 2001 to 2019 using the average transaction price (ATP) in Canada. In 2001, the average ratio of Median International Price (MIP) to Canadian price, at market exchange rates, was 1.11. In 2002: 1.08; 2003: 1.12; 2004: 1.16; 2005: 1.14; 2006: 1.07; 2007: 1.03; 2008: 1.03; 2009: 1.04; 2010: 1.06; 2011: 1.05; 2012: 1.07;
2013: 1.06; 2014: 1.13; 2015: 1.18; 2016: 1.25; 2017: 1.26; 2018: 1.20; 2019: 1.16.
Figure 28 provides alternate results for the average MIP-to-Canadian price ratio at market exchange rates in 2019. To address the point that Canadian prices are national average transaction prices whereas foreign prices are list prices, a list price to list price ratio is also calculated. Using this method, the average ratio decreases from 1.16 to 1.09. It is important to keep in mind that confidential rebates provided to payers are currently not captured in this data.
To account for the large impact of US prices in determining the median foreign price, a ratio excluding the US and a ratio including at least five countries in the calculation of the median are also provided in Figure 28. With these restrictions, the average MIP-to-Canadian price ratios drop to 0.86 and 0.89, respectively, suggesting that median foreign list prices are, on average, 14% to 11% lower than Canadian list prices. In many of the comparator countries, discounts off list prices are available to all payers, both public and private. By contrast, a large portion of the Canadian market pays list prices, or close to list prices. Furthermore, it should be noted that these are average ratios—some patentees charge Canadian consumers less than median international prices, while others charge more. For MIP-to-Canadian price ratios at the patentee level, please refer to Table 22 in Appendix 4 of this report.
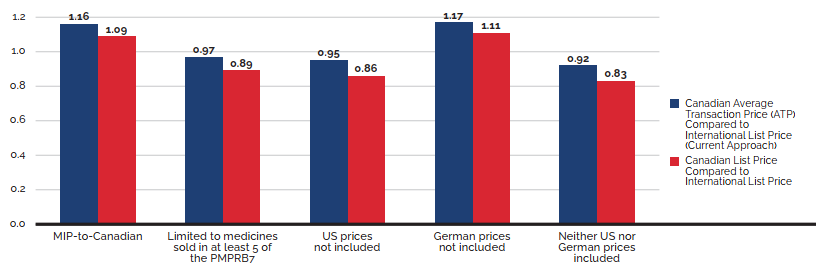
Data source: PMPRB
Figure description
This bar graph depicts the average MIP-to-Canadian price ratios at market exchange rates for 2019 using (1) the average transaction price in Canada (ATP) compared to the PMPRB7 international list price, and (2) the Canadian list price compared to the international list price.
| Ratio of the Average Transaction Price (ATP) to International List Price (Current approach) | Ratio of the Canadian List Price to International List Price | |
|---|---|---|
MIP to Canadian |
1.16 |
1.09 |
Median limited to medicines sold in at least 5 of the PMPRB7 |
0.97 |
0.89 |
US prices not included |
0.95 |
0.86 |
German prices not included |
1.17 |
1.11 |
Neither US nor German prices included |
0.92 |
0.83 |
Figure 29 offers more detail on the medicine-level MIP-to-Canadian ratios underlying the averages reported in Table 10. This figure distributes the 2019 sales of each patented medicine according to the value of its MIP-to-Canadian price ratio (more exactly, according to the range into which the ratio fell).Footnote 19 These results show substantial dispersion in medicine-level price ratios: while patented medicines with MIP-to-Canadian price ratios between 0.90 and 1.10 accounted for 36.3% of sales, those with ratios less than 0.90 accounted for 37.4% of sales, and medicines with ratios exceeding 1.10 accounted for 26.3%.
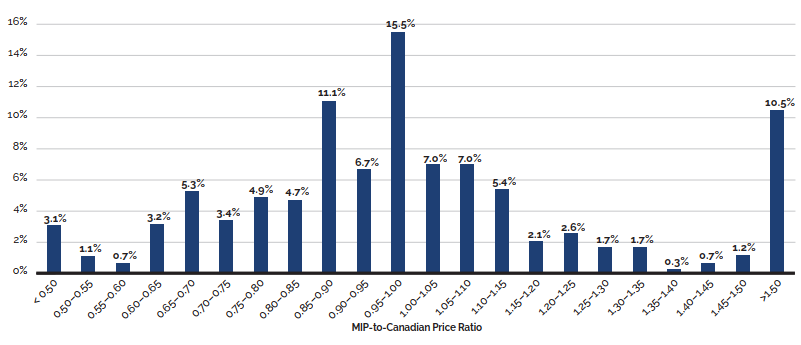
Data source: PMPRB
Figure description
This bar graph depicts the distribution of 2019 sales of patented medicines by their range of MIP-to-Canadian price ratio. Ratios between less than 0.50 and greater than 1.50 are given in increments of 0.05.
Patented medicines with price ratios less than 0.50 accounted for 3.1% of sales.
For 0.50 to 0.55: 1.1%; 0.55 to 0.60: 0.7%; 0.60 to 0.65: 3.2%; 0.65 to 0.70: 5.3%;
0.70 to 0.75: 3.4%;0.75 to 0.80: 4.9%; 0.80 to 0.85: 4.7%; 0.85 to 0.90: 11.1%;
0.90 to 0.95: 6.7%; 0.95 to 1.00: 15.5%; 1.00 to 1.05: 7.0%; 1.05 to 1.10: 7.0%;
1.10 to 1.15: 5.4%; 1.15 to 1.20: 2.1%; 1.20 to 1.25: 2.6%; 1.25 to 1.30: 1.7%;
1.30 to 1.35: 1.7%; 1.35 to 1.40: 0.3%; 1.40 to 1.45: 0.7%; 1.45 to 1.50: 1.2%;
>1.50: 10.5%.
In 2019, approximately 40% of Canadian patented medicines were priced above the median international level.Footnote 20 Table 11 shows which therapeutic categories in particular are priced above the median international levels in Canada. Medicines that share the fourth level ATC classification (“ATC4”)Footnote 21 are grouped to identify distinct chemical/pharmacological/therapeutic subgroups, allowing for a calculation of the average MIP-to-Canadian price ratios among medicines that may be used to treat the same conditions. Table 11 identifies the top 10 ATC4s in 2019 in which the difference between Canadian and median prices had the largest effect on Canadian patented medicine spending.Footnote 22 For example, had Canadian prices been in line with the international median for these classes of medicines in 2019, sales in Canada would have been reduced by approximately $1 billion (an average reduction of 14% for these ATC4s). Of the 220 DINs classified into these 10 ATC4s, 54% were priced above the median international price.
Table 11. Top 10 ATC4s* by Total Sales Greater than Median International Prices, 2019
| Description | ATC4 | No. of companies | No. of chemicals in ATC4 (No. currently under patent) | Total patented DINs | Patented DINs greater than median price | 2019 net revenue for patented DINs ($millions) | Patented DINs ATC4 share of 2019 revenues | MIP-to-Canadian ratio (min. 5) of patented DINs† | Impact of difference on patented medicines in 2019 ($millions) |
|---|---|---|---|---|---|---|---|---|---|
Antiinfectives for systemic use |
J05AX |
5 |
11 (10) |
17 |
6 |
$699.8 |
4.06% |
0.73 |
$193.3 |
Adrenergics in combination with corticosteroids or other medicines excluding anticholinergics |
R03AK |
3 |
4 (4) |
6 |
4 |
$358.6 |
2.08% |
0.55 |
$123.5 |
Selective immunosuppressants |
L04AA |
12 |
15 (15) |
30 |
24 |
$1,883.7 |
10.93% |
0.93 |
$118.6 |
Other antineoplastic agents |
L01XC |
10 |
20 (20) |
28 |
9 |
$1,448.9 |
8.41% |
0.94 |
$97.9 |
DPP-4 inhibitors |
A10BH |
4 |
4 (4) |
9 |
9 |
$334.2 |
1.94% |
0.72 |
$94.2 |
Combinations of oral blood glucose lowering medicines |
A10BD |
5 |
10 (10) |
30 |
19 |
$400.4 |
2.32% |
0.65 |
$89.9 |
Antineovascularisation agents |
S01LA |
1 |
1 (1) |
1 |
1 |
$553.6 |
3.21% |
0.85 |
$83.8 |
Other blood glucose lowering drugs, excl. insulins |
A10BX |
4 |
5 (5) |
11 |
9 |
$431.4 |
2.50% |
0.83 |
$72.4 |
Protein kinase inhibitors |
L01XE |
15 |
36 (36) |
75 |
28 |
$957.2 |
5.55% |
0.94 |
$70.7 |
Proton pump inhibitors |
A02BC |
4 |
6 (3) |
13 |
10 |
$192.1 |
1.11% |
0.44 |
$53.4 |
* Level 4 of the Anatomical Therapeutic Chemical classification system maintained by the World Health Organization.
†For cases where the Canadian average transactional price was below the median international price, the MIP-to-Canadian ratio was set to 1.
Data source: PMPRB
Brief Insights: Combination Inhalers for Asthma – Limited Generic Entry
Inhaled corticosteroid (ICS) and long-acting beta agonist (LABA) combination inhalers used in the treatment of asthma are a $577 million market in Canada, with one of the largest price differentials between Canadian and international levels.
Combination inhalers for asthma are a complex market space, with special regulatory requirements for proving bioequivalence that may complicate generic entry. There is no international consensus with regard to regulating the design, method, and evaluation of bioequivalence studies, and in Canada, there are no current guidelines that specifically apply to this class of medicines.
Although the first combination inhaler for asthma was approved in Canada over two decades ago, the first competitor offering the same combination of medicines only gained market approval in 2018, and the first true generic didn’t enter the market until 2020. Same-combination competitors were approved much earlier in all PMPRB7 countries, except Switzerland, with first recorded sales as early as 2010 in Sweden. Internationally, even where alternatives to the originator brand combination inhalers for asthma exist, the level of penetration is very different than what would be expected for an oral solid medicine, and the cost savings offered as of 2018 were often quite moderate.
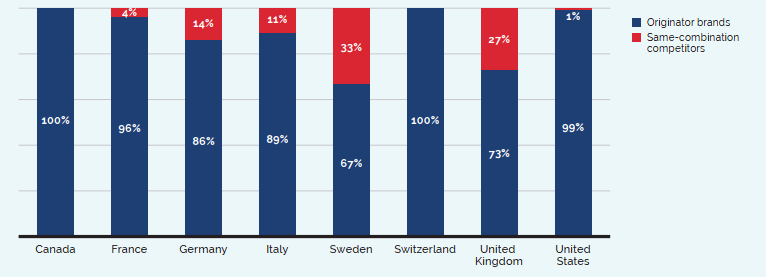
* Includes both generics and subsequent brand-name competitors for the same combination of medicinal ingredients. Although one same-combination competitor was approved in Canada in 2018, there were no recorded sales in the study year.
Data source: MIDAS® database, prescription retail and hospital markets, 2018, IQVIA (all rights reserved)
[NPDUIS Report: Market Intelligence Report: Combination Inhalers for Asthma, 2018]
Figure description
This column graph gives the combined revenue share of the originator brands Advair and Symbicort versus same-combination competitors for Canada and the PMPRB comparator countries in 2018. Same-combination competitors include both generics and subsequent brand-name competitors for the same combination of medicinal ingredients.
| Originator brands | Same-combination competitors | |
|---|---|---|
Canada |
100% |
0% |
France |
96% |
4% |
Germany |
86% |
14% |
Italy |
89% |
11% |
Sweden |
67% |
33% |
Switzerland |
100% |
0% |
United Kingdom |
73% |
27% |
United States |
99% |
1% |
Canada is a top 10 global market
Canada is an important market for pharmaceuticals representing 2% of worldwide sales. Canada spends approximately the same amount as the UK on pharmaceuticals despite having only half its population.
Utilization of Patented Medicines
The price and sales data used to calculate the PMPI also allow the PMPRB to examine trends in the quantities of patented medicines sold in Canada. The PMPRB maintains the Patented Medicines Quantity Index (PMQI) for this purpose. Figure 31 provides average rates of utilization growth, as measured by the PMQI, from 1988 through 2019. These results confirm that in recent years, growth in the utilization of patented medicines has been a primary source of rising sales.
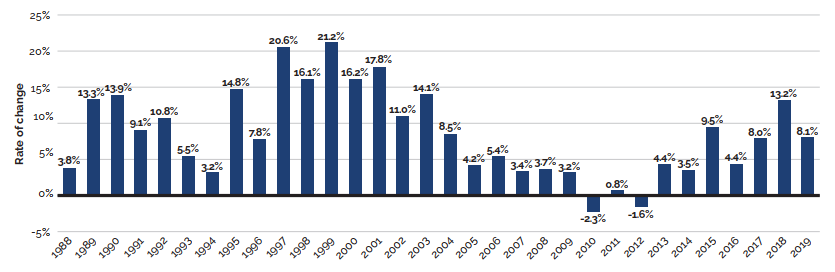
Data source: PMPRB
Figure description
This bar graph depicts the average annual rates of growth in utilization, as measured by the Patented Medicines Quantity Index (PMQI), from 1988 to 2019.
The rate of change in 1988 was 3.8%; 1989: 13.3%; 1990: 13.9%; 1991: 9.1%; 1992: 10.8%; 1993: 5.5%; 1994: 3.2%; 1995: 14.8%; 1996: 7.8%; 1997: 20.6%; 1998: 16.1%; 1999: 21.2%; 2000: 16.2%;
2001: 17.8%; 2002: 11.0%; 2003: 14.1%; 2004: 8.5%; 2005: 4.2%; 2006: 5.4%; 2007: 3.4%; 2008: 3.7%; 2009: 3.2%; 2010: -2.3%; 2011: 0.8%; 2012: -1.6%; 2013: 4.4%; 2014 : 3.5%; 2015: 9.5%; 2016: 4.4%; 2017: 8.0%; 2018: 13.2%; 2019: 8.1%.
Canadian Medicine Expenditures in the Global Context
IQVIAFootnote 23 regularly reports on medicine sales across a large number of countries. Based on sales data from this source, Figure 32 provides shares of global sales for Canada and other major national markets including the PMPRB7 countries.Footnote 24 The Canadian market accounted for 2.0% of the global market in 2019.
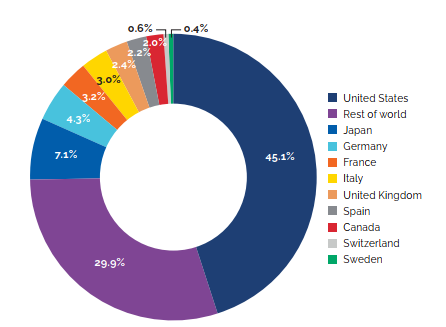
Data source: MIDAS® database, 2019, IQVIA (all rights reserved)
Figure description
This pie chart depicts the distribution of medicine sales among major global markets in 2019.
The United States market accounted for 45.1% of the global market in 2019; Japan: 7.1%;
Germany: 4.3%; France: 3.2%; Italy: 3.0%; United Kingdom: 2.4%; Spain 2.2%; Canada: 2.0%; Switzerland: 0.6%; Sweden: 0.4%; the rest of the world: 29.9%.
Figure 33 provides Canada’s share of global sales for 2005 to 2019. The Canadian share has remained between 1.9% and 2.7% throughout this period. Although 2.0% is at the low end for Canada’s average share of global sales in recent years, the US share grew from 40.4% in 2014 to 45.1% in 2019, resulting in declining shares for all other major countries.
1.8% Medicine Expenditures in Canada
In 2017, Canadians spent 1.8% of gross domestic product on medicines. This is the 2nd highest share in the PMPRB7, behind only the United States.
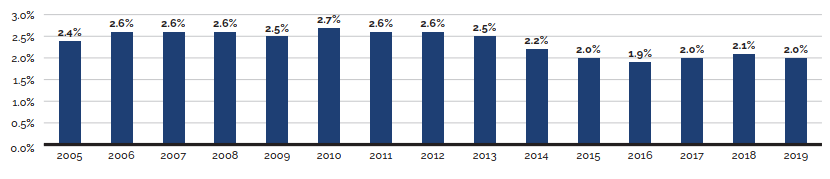
Data source: MIDAS® database, 2005–2019, IQVIA (all rights reserved)
Figure description
This bar graph depicts Canada’s share of global medicine sales from 2005 to 2019.
In 2005, Canada made up 2.4% of global sales; 2006: 2.6%; 2007: 2.6%; 2008: 2.6%; 2009: 2.5%;
2010: 2.7%; 2011: 2.6%; 2012: 2.6%; 2013: 2.5%; 2014: 2.2%; 2015: 2.0%; 2016: 1.9%; 2017: 2.0%;
2018: 2.1%; 2019: 2.0%.
Figure 34 gives the average annual rate of growth in total medicine sales for Canada and the PMPRB7, individually and collectively. From 2005 to 2019, sales of medicines in Canada rose at an average annual rate of approximately 4.6%. This is on par with the average rate of growth in medicine sales among the PMPRB7 countries over the same period, though this average is heavily skewed by the influence of US sales.
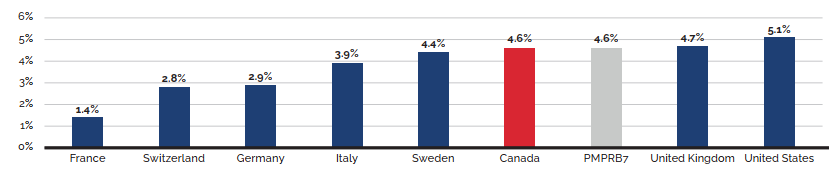
Data source: MIDAS® database, 2005–2019, IQVIA (all rights reserved)
Figure description
This bar graph depicts the average annual rate of growth in total medicine sales for Canada and the PMPRB7 comparator countries from 2005 to 2019.
In France, the average rate of growth was 1.4%; Switzerland: 2.8%; Germany: 2.9%; Italy: 3.9%;
Sweden: 4.4%; Canada: 4.6%; all of the PMPRB7: 4.6%; United Kingdom: 4.7%; United States: 5.1%.
Figure 35 compares rates of year-over-year growth in medicine sales for the entire pharmaceutical market in Canada and the PMPRB7 countries combined. In 2019, sales grew at a faster rate in Canada than in the other PMPRB7 countries.
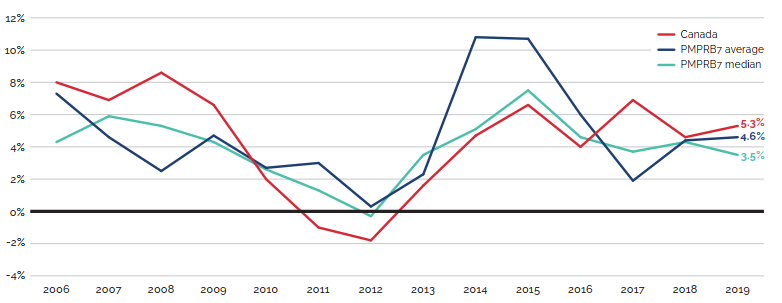
Data source: MIDAS® database, 2005–2019, IQVIA (all rights reserved)
Figure description
This line graph depicts the average annual rate of change in medicine sales, using constant 2019 market exchange rates, for Canada, the average of the PMPRB7 countries, and the PMPRB7 median from 2006 to 2019.
| Year | Canada | PMPRB7 average | PMPRB7 median |
|---|---|---|---|
2006 |
8.0 |
7.3 |
4.3 |
2007 |
6.9 |
4.6 |
5.9 |
2008 |
8.6 |
2.5 |
5.3 |
2009 |
6.6 |
4.7 |
4.3 |
2010 |
2.0 |
2.7 |
2.6 |
2011 |
-1.0 |
3.0 |
1.3 |
2012 |
-1.8 |
0.3 |
-0.3 |
2013 |
1.6 |
2.3 |
3.5 |
2014 |
4.7 |
10.8 |
5.1 |
2015 |
6.6 |
10.7 |
7.5 |
2016 |
4.0 |
6.0 |
4.6 |
2017 |
6.9 |
1.9 |
3.7 |
2018 |
4.6 |
4.4 |
4.3 |
2019 |
5.3 |
4.6 |
3.5 |
The proportion of national income allocated to the purchase of medicines provides another way to compare medicine costs across countries.Footnote 25 Figure 36 gives medicine expenditures as a share of gross domestic product (GDP) for Canada and the PMPRB7 countries based on data for 2017. Medicine expenditures absorbed between 1.1% and 2.1% of the GDP in the PMPRB7. The Canadian value of 1.8% was second only to the US.
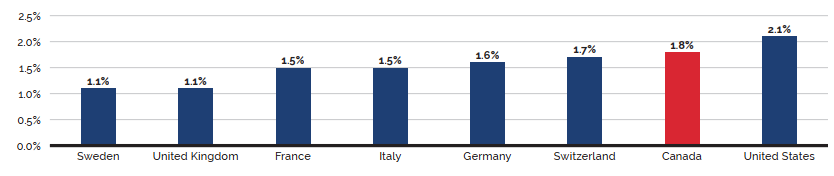
Data source: OECD
Figure description
This bar graph depicts the expenditures for medicines as a share of the gross domestic product (GDP) for Canada and the PMPRB7 comparator countries based on data for 2017.
In Sweden, medicine expenditure was 1.1% of the GDP; United Kingdom: 1.1%; France: 1.5%; Italy: 1.5%; Germany: 1.6%; Switzerland 1.7%; Canada: 1.8%; United States: 2.1%.
Table 12 provides a historical perspective on the expenditures-to-GDP ratio.Footnote 26 In 2005, Canada’s ratio was fourth highest of the PMPRB7. Since that time, Canada’s ratio has risen, while the ratios of three other countries (France, Italy, and Sweden) have declined. In 2017, Canada had the fourth highest spending per capita on medicines compared to the PMPRB7 (behind the US, Switzerland, and Germany).
Table 12. Medicine Expenditures as a Share of GDP, Canada and the PMPRB7, 2017
| Share: Medicine Expenditures/GDP 2005 | Share: Medicine Expenditures/GDP 2017 | Growth: GDP 2005-2017 | Medicine spending per capita 2005 ($US PPP) |
Medicine spending per capita 2017 ($US PPP) |
|
|---|---|---|---|---|---|
Canada |
1.64% |
1.79% |
52.9% |
$593 |
$806 |
France |
1.79% |
1.49% |
56.0% |
$545 |
$653 |
Germany |
1.58% |
1.58% |
65.1% |
$509 |
$823 |
Italy |
1.70% |
1.54% |
46.6% |
$505 |
$590 |
Sweden |
1.15% |
1.08% |
71.0% |
$396 |
$515 |
Switzerland |
1.09% |
1.66% |
94.8% |
$427 |
$963 |
United Kingdom |
1.00% |
1.14% |
45.2% |
NA |
$469 |
United States |
1.88% |
2.05% |
49.1% |
$832 |
$1,220 |
Data source: OECD
Table 13 gives the composition of patentees’ sales by therapeutic class for Canada and the PMPRB7, individually by country and as an aggregate.Footnote 27 The results suggest a remarkable degree of similarity across countries.
Table 13. Distribution of Medicine Sales by Major Therapeutic Class, Canada and the PMPRB7, 2019
| Therapeutic class | Canada | PMPRB7 | France | Germany | Italy | Sweden | Switzerland | United Kingdom | United States |
|---|---|---|---|---|---|---|---|---|---|
A: Alimentary tract and metabolism |
13.4% |
15.5% |
9.6% |
10.6% |
10.2% |
10.1% |
10.4% |
10.9% |
17.0% |
B: Blood and blood-forming organs |
4.7% |
6.6% |
8.7% |
8.3% |
9.2% |
9.4% |
6.3% |
6.7% |
6.1% |
C: Cardiovascular system |
6.6% |
4.8% |
6.6% |
6.6% |
8.0% |
4.0% |
8.8% |
5.9% |
4.2% |
D: Dermatologicals |
3.2% |
2.6% |
2.3% |
2.8% |
1.9% |
2.2% |
3.1% |
2.3% |
2.7% |
G: Genito-urinary system and sex hormones |
4.1% |
3.0% |
2.6% |
2.5% |
2.8% |
3.0% |
3.6% |
3.1% |
3.1% |
H: Systemic hormonal preparations |
1.3% |
2.5% |
2.2% |
2.0% |
1.8% |
2.0% |
1.4% |
1.8% |
2.7% |
J: General antiinfectives for systemic use |
9.2% |
11.1% |
11.1% |
8.8% |
15.8% |
11.7% |
10.1% |
11.6% |
10.9% |
L: Antineoplastics and immunomodulating agents |
23.5% |
24.0% |
25.7% |
24.9% |
23.1% |
25.4% |
24.9% |
25.3% |
23.7% |
M: Musculo-skeletal system |
3.1% |
3.3% |
2.7% |
4.1% |
3.0% |
3.9% |
5.0% |
3.1% |
3.3% |
N: Nervous system |
15.6% |
14.5% |
13.5% |
14.8% |
12.3% |
15.2% |
15.5% |
14.0% |
14.7% |
P: Antiparasitic products |
0.1% |
0.1% |
0.2% |
0.2% |
0.0% |
0.1% |
0.1% |
0.1% |
0.1% |
R: Respiratory system |
7.1% |
6.8% |
5.9% |
6.7% |
5.4% |
6.3% |
5.8% |
7.3% |
6.9% |
S: Sensory organs |
4.7% |
2.6% |
3.7% |
3.1% |
2.1% |
3.8% |
4.5% |
4.8% |
2.4% |
V: Various |
3.4% |
2.6% |
5.2% |
4.6% |
4.3% |
2.8% |
0.5% |
3.2% |
2.1% |
All therapeutic classes* |
100% |
100% |
100% |
100% |
100% |
100% |
100% |
100% |
100% |
* Values may not add to 100% due to rounding.
Data source: MIDAS® database 2019, IQVIA (all rights reserved)
National Prescription Drug Utilization Information System: Supporting Health Care Decision Making in Canada
How medications are used—where, by whom, and for what—has an impact on the amount that we spend on medicines. The PMPRB contributes to Canada’s understanding of medicine usage through the National Prescription Drug Utilization Information System (NPDUIS) initiative, generating comprehensive, accurate information to help guide decision making and support continued sustainability of our pharmaceutical system.Background
NPDUIS is a research initiative established by federal, provincial, and territorial Ministers of Health in September 2001. It is a partnership between the PMPRB and the Canadian Institute for Health Information (CIHI).
At the request of the Minister of Health pursuant to section 90 of the Patent Act, the PMPRB has the mandate to conduct analysis that provides decision makers with critical information and intelligence on price, utilization, and cost trends of patented and non-patented prescription medicines. This ensures that Canada’s healthcare system has more comprehensive and accurate information on how medicines are being used and on sources of cost pressures.
The specific research priorities and methodologies for NPDUIS are established with the guidance of the NPDUIS Advisory Committee and reflect the priorities of the participating jurisdictions. The Advisory Committee is composed of representatives from public drug plans in British Columbia, Alberta, Saskatchewan, Manitoba, Ontario, New Brunswick, Nova Scotia, Prince Edward Island, Newfoundland and Labrador, Yukon, the Non-Insured Health Benefits (NIHB) Program, and Health Canada. It also includes observers from CIHI, the Canadian Agency for Drugs and Technologies in Health (CADTH), the Ministère de la Santé et des Services sociaux du Québec (MSSS), and the pan-Canadian Pharmaceutical Alliance (pCPA) Office.
NPDUIS operates independently of the regulatory activities of the PMPRB. NPDUIS reports do not contain information that is confidential or privileged under sections 87 and 88 of the Patent Act.
Highlights
Since the start of 2019, the PMPRB has published seven analytical reports, three chartbooks, and eight posters under the NPDUIS banner.
Published Reports:
- Meds Entry Watch, 2017 (February 2019)
- Meds Pipeline Monitor, 2018 (May 2019)
- Generics360: Generic Drugs in Canada, 2018 (August 2019)
- CompassRx, 5th Edition, 2017/18 (September 2019)
- Meds Entry Watch, 2018 (January 2020)
- Meds Pipeline Monitor, 2019 (April 2020)
- Market Intelligence Report: Combination Inhalers for Asthma, 2018 (April 2020)
Chartbooks:
- The Market for Prescription Oral Solid Opioids, 2010 to 2017 (January 2019)
- Biologics in Canada
- Part 1: Market Trends, 2018 (May 2020)
- Part 2: Biosimilar Savings, 2018 (May 2020)
Poster Presentations:
- Biosimilars in Canada: Current Environment and Future Opportunity
- Early Insight into New Medicine Launches in Canadian and International Markets
- Generic Drug Pricing in Canada: Closing the Gap
- Uncovering the Forces Driving Costs in Canada's Public Drug Plans, 2017/18
- The Oncology Drug Market: A High-Growth, High-Price Therapeutic Area
- Combination Asthma Inhalers in Canada: Locked on High Prices
- Alignment of Oncology Drug Coverage Across Canada
- Pressures Behind the Rising Costs in Canadian Private Drug Plans, 2018
In addition, in June 2020, the PMPRB through the NPDUIS initiative released updated Guidelines for Conducting Pharmaceutical Budget Impact Analyses for Submission to Public Drug Plans in Canada, which were first published in 2007. These Guidelines provide a standardized approach and detailed recommendations for developing a BIA for submission to the Canadian Agency for Drugs and Technologies in Health (CADTH) or to one of the participating federal/provincial/territorial drug plans. The final recommendations are the result of a multi-year process that included extensive research and consultation with relevant stakeholders, including CADTH and participating plans.
The PMPRB continued to support and strengthen its NPDUIS engagement activities by regularly consulting with the NPDUIS Advisory Committee, participating in conferences and stakeholder committees, and organizing information sessions with interested stakeholders to share the results of the analytical studies.
Research Agenda
The NPDUIS research agenda for the 2020-21 fiscal year includes plans to publish the following analytical studies:
Annual Publications and Report Series
- CompassRx, 6th Edition, 2018/19
- Meds Entry Watch, 2019
- Meds Pipeline Monitor, 2020
- Alignment among Public Formularies in Canada, Part 2: Oncology Drugs Assessed Through the pan-Canadian Oncology Drug Review (pCODR) Process
- Alignment among Public Formularies in Canada, Part 3: Oncology Drugs Assessed Through the Common Drug Review (CDR) Process
- Market Intelligence Report: New Oral Anti-Diabetic Drugs, 2019
Chartbooks
- Oncology Medicines in Canada: Trends and International Comparisons, 2010–2019
- Expensive Drugs for Rare Diseases: Canadian and International Markets
Additional research topics may be pursued based on consultation with the NPDUIS Advisory Committee.
Analysis of Research and Development Expenditures: R&D Investment Falling Short of Target
Innovation is vital to advancing health care. In part, the provisions of Canada’s Patent Act are intended to foster an investment climate favorable to pharmaceutical research and development (R&D) in Canada. However, the ratio of R&D expenditures to sales revenues for pharmaceutical patentees in Canada has been falling since the late 1990’s and has been under the agreed-upon target of 10% since 2003. In 2019, it was at 3.9% for both all patentees and members of Innovative Medicines Canada.
3.9% The R&D-to-sales ratio
The R&D-to-sales ratio for all patentees was 3.9% in 2019. This represents a 67% decrease from a peak of 11.7% in 1995. .
Analysis of Research and Development Expenditures
The Act mandates the PMPRB to monitor and report on pharmaceutical R&D spending. This chapter provides key statistics on the current state of pharmaceutical R&D investment in Canada.
Data Sources
The statistical results in this section were entirely derived from data submitted to the PMPRB by patentees.
The Act requires each patentee to report its total gross revenues from sales of all medicines for human or veterinary use (including revenues from sales of non-patented medicines and from licensing agreements) and R&D expenditures in Canada related to medicines (both patented and non-patented for human or veterinary use). Patentees transmit this information to the PMPRB by means of its Form 3 (Revenues and Research and Development Expenditures Provided Pursuant to subsection 88(1) of the Patent Act).
The Patented Medicines Regulations (Regulations) require that each submitted Form 3 be accompanied by a certificate stating the information it contains is “true and correct”. The Board does not audit Form 3 submissions, but it does review submitted data for anomalies and inconsistencies, seeking corrections or clarifications from patentees where necessary. To confirm that PMPRB staff has correctly interpreted the data submitted, each patentee is given the opportunity to review and confirm the accuracy of its own R&D-to-sales ratio before that ratio is published.
Failure to File (Form 3)
It is a patentee’s responsibility to ensure a complete and accurate Form 3 is filed within the time frame set out in the Regulations. If a patentee fails to meet these filing requirements, the Board may issue an Order demanding compliance. No such Board Orders were issued for the 2019 reporting period.
Coverage
Note that companies without sales of patented medicines do not need to report their R&D expenditures to the PMPRB. This has two implications:
First, the statistical results reported here should not be taken to cover all pharmaceutical research conducted in Canada. For example, a company may sell only non-patented medicines but may still perform considerable research in Canada. Similarly, a company may conduct research and have no medicine sales at all.Footnote 28 The results presented below will not reflect the R&D expenditures of firms in either situation.
Second, as new patented medicines come onto the Canadian market and existing relevant patents expire, the number and identity of companies required to file R&D data may change from year to year. In 2019, 101 companies reported on their R&D activity. Of these, 32 were members of Innovative Medicines Canada.
Definition of Sales Revenues
For reporting purposes, sales revenues are defined as total gross revenues from sales in Canada of all medicines and from licensing agreements (e.g., royalties and fees accruing to the patentee related to sales in Canada by licensees).
Definition of R&D Expenditures
Pursuant to section 6 of the Regulations, patentees are required to report R&D expenditures that would have qualified for an investment tax credit in respect to scientific research and experimental development (SR&ED) under the provisions of the Income Tax Act that came into effect on December 1, 1987.Footnote 29 By this definition, R&D expenditures may include current expenditures, capital equipment costs, and allowable depreciation expenses. Market research; sales promotions; quality control or routine testing of materials, devices, or products; and routine data collection are not eligible for an investment tax credit and, therefore, are not to be included in the R&D expenditures reported by patentees.
Total Sales Revenues and R&D Expenditures
Table 14 provides an overview of reported sales revenues and R&D expenditures from 1988 to 2019.
Patentees reported total 2019 sales revenues of $23.1 billion, an increase of 1.9% from 2018. Sales revenues reported by Innovative Medicines Canada members were $16.9 billion, accounting for 73% of the total. (Less than 1% of reported sales revenues were generated by licensing agreements.)
Patentees reported R&D expenditures of $893.2 million in 2019, an increase of 0.1% over 2018. Innovative Medicines Canada members reported R&D expenditures of $652.6 million in 2019, a decrease of 9.7% over the previous year. Innovative Medicines Canada members accounted for 73% of all reported R&D expenditures in 2019.
R&D-to-Sales Ratios
Table 14 and Figure 37 also provide ratios of R&D expenditures to sales revenues. It should be noted that with the adoption of the 1987 amendments to the Act, Innovative Medicines Canada made a public commitment to increase its members’ annual R&D expenditures to 10% of sales revenues by 1996.Footnote 30 This level of R&D expenditure was reached by 1993, with the ratio exceeding 10% in some years.
The ratio of R&D expenditures to sales revenues among all patentees was 3.9% in 2019, a slight decrease from 4.0% in 2018. The overall R&D-to-sales ratio has been less than 10% for the past 19 consecutive years.
The corresponding R&D-to-sales ratio for members of Innovative Medicines Canada was also 3.9% in 2019, a decrease from 4.3% in 2018.Footnote 31 The Innovative Medicines Canada ratio has been less than 10% for the past 17 consecutive years.
Table 21 in Appendix 4 provides details on the range of 2019 R&D-to-sales ratios. Of the 101 companies reporting in 2019, 80.2% had R&D-to-sales ratios below 10%.
Table 14. Total R&D Expenditures and R&D-to-Sales Ratios of Reporting Companies, 1988 to 2019
| Year | All patentees | Innovative Medicines Canada patentees | R&D-to-sales ratio: all patentees | R&D-to-sales ratio: Innovative Medicines Canada patentees | |||||||
|---|---|---|---|---|---|---|---|---|---|---|---|
| Number of companies reporting | R&D expenditures by all patentees ($millions) |
Change from previous Year | Sales revenues ($millions) | Change from previous year | R&D expenditures by Innovative Medicines Canada patentees ($millions) | Change from previous year |
Sales revenues ($millions) | Change from previous year |
|||
2019 |
101 |
$893.2 |
0.1% |
$23,101.1 |
1.9% |
$652.6 |
-9.7% |
$16,858.8 |
0.4% |
3.9% |
3.9% |
2018 |
93 |
$892.6 |
2.4% |
$22,663.4 |
7.2% |
$723.0 |
-4.3% |
$16,789.7 |
2.7% |
4.0% |
4.3% |
2017 |
85 |
$871.4 |
-5.1% |
$21,147.2 |
1.4% |
$755.8 |
-1.8% |
$16,349.8 |
4.8% |
4.1% |
4.6% |
2016 |
78 |
$918.2 |
5.7% |
$20,855.7 |
5.9% |
$769.9 |
0.3% |
$15,599.9 |
0.2% |
4.4% |
4.9% |
2015 |
77 |
$869.1 |
9.7% |
$19,693.3 |
6.7% |
$767.4 |
7.8% |
$15,565.1 |
4.7% |
4.4% |
4.9% |
2014 |
75 |
$792.2 |
-0.8% |
$18,455.1 |
1.0% |
$711.7 |
2.0% |
$14,861.1 |
9.2% |
4.3% |
4.8% |
2013 |
81 |
$798.3 |
-14.7% |
$18,268.1 |
1.4% |
$697.5 |
-15.4% |
$13,614.8 |
3.4% |
4.4% |
5.1% |
2012 |
85 |
$936.1 |
-5.6% |
$18,021.1 |
1.3% |
$824.1 |
-8.6% |
$13,162.8 |
-2.1% |
5.2% |
6.3% |
2011 |
79 |
$991.7 |
-15.8% |
$17,798.8 |
4.7% |
$901.2 |
-9.9% |
$13,446.1 |
10.7% |
5.6% |
6.7% |
2010 |
82 |
$1,178.2 |
-7.4% |
$17,000.0 |
-0.3% |
$1,000.2 |
-11.7% |
$12,149.0 |
-11.8% |
6.9% |
8.2% |
2009 |
81 |
$1,272.0 |
-2.9% |
$17,051.9 |
4.5% |
$1,132.9 |
-3.4% |
$13,780.0 |
4.6% |
7.5% |
8.2% |
2008 |
82 |
$1,310.7 |
-1.1% |
$16,316.7 |
2.0% |
$1,172.2 |
-1.0% |
$13,178.2 |
-1.4% |
8.1% |
8.9% |
2007 |
82 |
$1,325.0 |
9.5% |
$15,991.0 |
7.3% |
$1,184.4 |
24.8% |
$13,359.8 |
20.0% |
8.3% |
8.9% |
2006 |
72 |
$1,210.0 |
-1.9% |
$14,902.0 |
4.7% |
$949.0 |
-8.8% |
$11,131.2 |
-5.8% |
8.1% |
8.5% |
2005 |
80 |
$1,234.3 |
5.5% |
$14,231.3 |
0.5% |
$1,040.1 |
3.9% |
$11,821.4 |
0.0% |
8.7% |
8.8% |
2004 |
84 |
$1,170.0 |
-2.0% |
$14,168.3 |
4.0% |
$1,000.8 |
0.8% |
$11,819.0 |
8.8% |
8.3% |
8.5% |
2003 |
83 |
$1,194.3 |
-0.4% |
$13,631.1 |
12.8% |
$992.9 |
-3.6% |
$10,865.7 |
5.2% |
8.8% |
9.1% |
2002 |
79 |
$1,198.7 |
13.0% |
$12,081.2 |
12.5% |
$1,029.6 |
10.1% |
$10,323.8 |
16.8% |
9.9% |
10.0% |
2001 |
74 |
$1,060.1 |
12.6% |
$10,732.1 |
15.3% |
$935.2 |
14.7% |
$8,835.4 |
14.3% |
9.9% |
10.6% |
2000 |
79 |
$941.8 |
5.3% |
$9,309.6 |
12.0% |
$815.5 |
4.0% |
$7,728.8 |
11.6% |
10.1% |
10.6% |
1999 |
78 |
$894.6 |
12.0% |
$8,315.5 |
19.2% |
$784.3 |
9.9% |
$6,923.4 |
22.8% |
10.8% |
11.3% |
1998 |
74 |
$798.9 |
10.2% |
$6,975.2 |
10.9% |
$713.7 |
8.6% |
$5,640.2 |
10.6% |
11.5% |
12.7% |
1997 |
75 |
$725.1 |
9.0% |
$6,288.4 |
7.4% |
$657.4 |
10.3% |
$5,098.2 |
4.9% |
11.5% |
12.9% |
1996 |
72 |
$665.3 |
6.4% |
$5,857.4 |
9.9% |
$595.8 |
6.5% |
$4,859.5 |
8.7% |
11.4% |
12.3% |
1995 |
71 |
$625.5 |
11.5% |
$5,330.2 |
7.5% |
$559.5 |
9.8% |
$4,468.8 |
1.4% |
11.7% |
12.5% |
1994 |
73 |
$561.1 |
11.4% |
$4,957.4 |
4.4% |
$509.5 |
10.4% |
$4,407.2 |
2.0% |
11.3% |
11.6% |
1993 |
70 |
$503.5 |
22.1% |
$4,747.6 |
14.0% |
$461.4 |
24.0% |
$4,321.4 |
14.4% |
10.6% |
10.7% |
1992 |
71 |
$412.4 |
9.6% |
$4,164.4 |
6.9% |
$372.1 |
9.0% |
$3,778.4 |
6.5% |
9.9% |
9.8% |
1991 |
65 |
$376.4 |
23.2% |
$3,894.8 |
18.1% |
$341.4 |
24.7% |
$3,546.9 |
19.5% |
9.7% |
9.6% |
1990 |
65 |
$305.5 |
24.8% |
$3,298.8 |
11.0% |
$273.8 |
25.8% |
$2,967.9 |
10.5% |
9.3% |
9.2% |
1989 |
66 |
$244.8 |
47.4% |
$2,973.0 |
9.4% |
$217.6 |
34.7% |
$2,685.5 |
7.3% |
8.2% |
8.1% |
1988 |
66 |
$165.7 |
— |
$2,718.0 |
— |
$161.5 |
— |
$2,502.3 |
— |
6.1% |
6.5% |
Data source: PMPRB
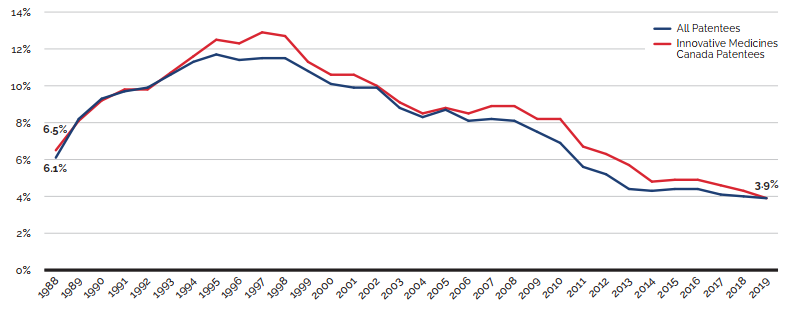
Data source: PMPRB
Figure description
This line graph depicts the annual the R&D-to-sales ratio for all patentees and members of Innovative Medicines Canada (IMC) from 1988 to 2019.
IMC Patentees: 1988, 6.5%; 1989, 8.1%; 1990, 9.2%; 1991, 9.8%; 1992, 9.8%; 1993, 10.7%; 1994, 11.6%; 1995, 12.5%; 1996, 12.3%; 1997, 12.9%; 1998, 12.7%; 1999, 11.3%; 2000, 10.6%; 2001, 10.6%;
2002, 10.0%; 2003, 9.1%; 2004, 8.5%; 2005, 8.8%; 2006, 8.5%; 2007, 8.9%; 2008, 8.9%; 2009, 8.2%; 2010, 8.2%; 2011, 6.7%; 2012, 6.3%; 2013, 5.7%; 2014, 4.8%; 2015, 4.9%; 2016, 4.9%; 2017, 4.6%;
2018, 4.3%; 2019, 3.9%.
All Patentees: 1988, 6.1%; 1989, 8.2%; 1990, 9.3%; 1991, 9.7%; 1992, 9.9%; 1993, 10.6%; 1994, 11.3%; 1995, 11.7%; 1996, 11.4%; 1997, 11.5%; 1998, 11.5%; 1999, 10.8%; 2000, 10.1%; 2001, 9.9%;
2002, 9.9%; 2003, 8.8%; 2004, 8.3%; 2005, 8.7%; 2006, 8.1%; 2007, 8.2%; 2008, 8.1%; 2009, 7.5%;
2010, 6.9%; 2011, 5.6%; 2012, 5.2%; 2013, 4.4%; 2014, 4.3%; 2015, 4.4%; 2016, 4.4%; 2017, 4.1%;
2018, 4.0%; 2019, 3.9%.
Current R&D Expenditures by Type of Research
Table 15 and Figure 38 (as well as Figure 40 in Appendix 4) provide information on the allocation of 2019 current R&D expendituresFootnote 32 among basic and applied research and other qualifying R&D.Footnote 33 Patentees reported spending $116.9 million on basic research in 2019, representing 13.5% of current R&D expenditures, an increase of 9.3% over the previous year. Patentees reported spending $520.2 million on applied research, representing 59.9% of current R&D expenditures. Clinical trials accounted for 84.6% of applied research expenditures.
Table 15. Current R&D Expenditures by Type of Research, 2019 and 2018
| Type of research | Expenditures: 2019 ($millions) | Share: 2019 | Expenditures: 2018 ($millions) | Share: 2018 | Annual change in expenditures |
|---|---|---|---|---|---|
Basic |
$116.9 |
13.5% |
$106.9 |
12.3% |
9.3% |
Chemical |
$76.2 |
8.8% |
$69.5 |
8.0% |
9.6% |
Biological |
$40.7 |
4.7% |
$37.4 |
4.3% |
8.8% |
Applied |
$520.2 |
59.9% |
$517.1 |
59.2% |
0.6% |
Manufacturing process |
$40.6 |
4.7% |
$71.0 |
8.1% |
-42.8% |
Pre-clinical trial I |
$18.6 |
2.1% |
$19.8 |
2.3% |
-6.1% |
Pre-clinical trial II |
$20.8 |
2.4% |
$26.8 |
3.1% |
-22.4% |
Clinical trial Phase I |
$40.0 |
4.6% |
$50.5 |
5.8% |
-20.8% |
Clinical trial Phase II |
$103.1 |
11.9% |
$83.1 |
9.5% |
24.1% |
Clinical trial Phase III |
$297.1 |
34.2% |
$265.9 |
30.4% |
11.7% |
Other qualifying R&D |
$231.2 |
26.6% |
$250.2 |
28.6% |
-7.6% |
Total* |
$868.3 |
100% |
$874.1 |
100% |
-0.7% |
* Values may not add to totals due to rounding.
Data source: PMPRB
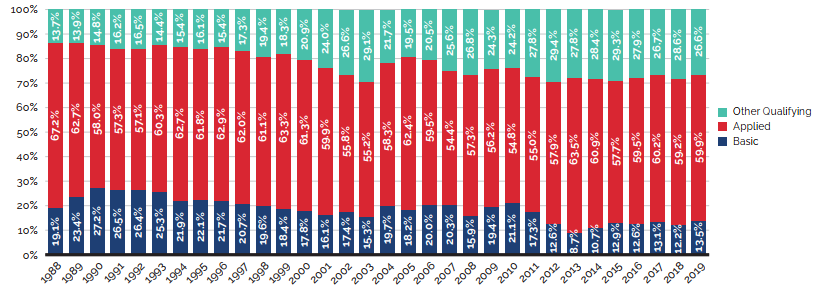
Data source: PMPRB
Figure description
This stacked bar graph depicts the share of current R&D expenditures from 1988 to 2019 by type of research: basic, applied, and other qualifying.
| Year | Basic research (%) | Applied research (%) | Other qualifying research (%) |
|---|---|---|---|
1988 |
19.1 |
67.2 |
13.7 |
1989 |
23.4 |
62.7 |
13.9 |
1990 |
27.2 |
58.0 |
14.8 |
1991 |
26.5 |
57.3 |
16.2 |
1992 |
26.4 |
57.1 |
16.5 |
1993 |
25.3 |
60.3 |
14.4 |
1994 |
21.9 |
62.7 |
15.4 |
1995 |
22.1 |
61.8 |
16.1 |
1996 |
21.7 |
62.9 |
15.4 |
1997 |
20.7 |
62.0 |
17.3 |
1998 |
19.6 |
61.1 |
19.4 |
1999 |
18.4 |
63.3 |
18.3 |
2000 |
17.8 |
61.3 |
20.9 |
2001 |
16.1 |
59.9 |
24.0 |
2002 |
17.4 |
55.8 |
26.6 |
2003 |
15.3 |
55.2 |
29.1 |
2004 |
19.7 |
58.3 |
21.7 |
2005 |
18.2 |
62.4 |
19.5 |
2006 |
20.0 |
59.5 |
20.5 |
2007 |
20.3 |
54.4 |
25.6 |
2008 |
15.9 |
57.3 |
26.8 |
2009 |
19.4 |
56.2 |
24.3 |
2010 |
21.1 |
54.8 |
24.2 |
2011 |
17.3 |
55.0 |
27.8 |
2012 |
12.6 |
57.9 |
29.4 |
2013 |
8.7 |
63.5 |
27.8 |
2014 |
10.7 |
60.9 |
28.4 |
2015 |
12.9 |
57.7 |
29.3 |
2016 |
12.6 |
59.5 |
27.9 |
2017 |
13.1 |
60.2 |
26.7 |
2018 |
12.2 |
59.2 |
28.6 |
2019 |
13.5 |
59.9 |
26.6 |
Current R&D Expenditures by Performer
Patentees report expenditures on research they conduct themselves (intramural) and research performed by other establishments, such as universities, hospitals, and other manufacturers (extramural). Table 16 shows that 45.3% of 2019 current research expenditures were intramural. Research performed by other companies on behalf of patentees made up 27.7% of current expenditures, while research conducted in universities and hospitals accounted for 18.3%.
Table 16. Current R&D Expenditures by R&D Performer, 2019 and 2018
| R&D performer | Expenditures: 2019 ($millions) | Share: 2019 | Expenditures: 2018 ($millions) | Share: 2018 | Annual change in expenditures |
|---|---|---|---|---|---|
| Intramural | |||||
Patentees |
$394.1 |
45.3% |
$429.7 |
49.2% |
-8.3% |
| Extramural | |||||
Universities and hospitals |
$158.5 |
18.3% |
$162.4 |
18.5% |
-2.4% |
Other companies |
$240.4 |
27.7% |
$207.0 |
23.7% |
16.1% |
Others |
$75.3 |
8.7% |
$75.1 |
8.6% |
0.3% |
Total* |
$868.3 |
100% |
$874.1 |
100% |
-0.7% |
* Values may not add to totals due to rounding.
Data source: PMPRB
6x GREATER The PMPRB7 average R&D ratio is almost 6x greater than in Canada
The R&D-to-sales ratio obtained by aggregating R&D spending and sales across all seven comparator countries was 24.0%.
Current R&D Expenditures by Region
Table 17 (as well as Table23 and Table 24 in Appendix 4) show current R&D expenditures by region. As in previous years, current expenditures were heavily concentrated in Ontario and Quebec in 2019, with these provinces accounting for 79.2% of total expenditures. However, while current R&D expenditures increased at a year-over-year rate of 6.5% in Ontario, 6.7% in the Atlantic provinces, and 3.3% in Western Canada, they decreased by 13.9% in Quebec.
Table 17. Current R&D Expenditures by Region, 2019 and 2018
| Region | Expenditures: 2019 ($millions) | Share: 2019 | Expenditures: 2018 ($millions) | Share: 2018 | Annual change in expenditures |
|---|---|---|---|---|---|
Atlantic provinces |
$21.1 |
2.4% |
$19.8 |
2.3% |
6.7% |
Quebec |
$246.1 |
28.3% |
$285.8 |
32.7% |
-13.9% |
Ontario |
$441.6 |
50.9% |
$414.5 |
47.4% |
6.5% |
Western provinces |
$158.8 |
18.3% |
$153.6 |
17.6% |
3.3% |
Territories |
$0.6 |
0.1% |
$0.4 |
0.0% |
68.4% |
Total* |
$868.3 |
100% |
$874.1 |
100% |
-0.7% |
* Values may not add to totals due to rounding.
Data source: PMPRB
Total R&D Expenditures by Source of Funds
Table 18 provides information on the sources of funds used by patentees to finance their R&D activity. Internal company funds remained by far the single largest source of funding in 2019, accounting for 91.2% of total expenditures. Funds received from government amounted to 0.6% of total expenditures.
Table 18. Total R&D Expenditures by Source of Funds, 2019 and 2018
| Source of funds | Expenditures: 2019 ($millions) | Share: 2019 | Expenditures: 2018 ($millions) | Share: 2018 | Annual change in expenditures |
|---|---|---|---|---|---|
Company funds |
$814.7 |
91.2% |
$812.1 |
91.0% |
0.3% |
Federal/provincial governments |
$5.2 |
0.6% |
$4.5 |
0.5% |
14.9% |
Others |
$73.3 |
8.2% |
$75.9 |
8.5% |
-3.4% |
Total* |
$893.2 |
100% |
$892.6 |
100% |
0.1% |
* Values may not add to totals due to rounding.
Data source: PMPRB
The Global Context
Figure 39 compares Canadian pharmaceutical R&D-to-sales ratios for 2000 and 2017 to those in the PMPRB7.Footnote 34 In 2000, Canada had an R&D-to-sales ratio of 10.1%, lower than all other PMPRB7 countries except for Italy at 6.2%. Switzerland had the highest ratio at 102.5%.
In 2017, Canada’s R&D-to-sales ratio was the lowest among the comparator countries at 4.1%. Italy had a slightly higher ratio of 5.7%, while all other PMPRB7 countries remained well above Canada. The ratio obtained by aggregating R&D spending and sales across all PMPRB7 countries was 24.0%, almost six times greater than in Canada.
The R&D-to-sales ratios represented in Figure 39 may be compared to the average bilateral price ratios reported in Table 9 (see the section on Comparison of Canadian Prices to Foreign Prices). A number of comparator countries with patented medicine prices that are, on average, lower than prices in Canada, have achieved much higher R&D-to-sales ratios.
As noted in previous annual reports, there are a multitude of factors that drive the location of pharmaceutical R&D. These include where companies can find the best science base at reasonable cost and ready access to a quality clinical trials infrastructure. Although price levels and intellectual property protection are often cited as an important policy lever for attracting R&D, the data has not supported this link domestically or internationally.
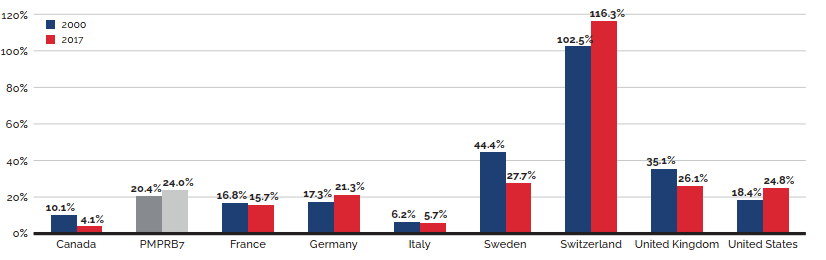
Data source: PMPRB; European Federation of Pharmaceutical Industries and Associations (EFPIA): The Pharmaceutical Industry in Figures 2019; PhRMA 2019 profile
Figure description
This bar graph depicts R&D-to-sales ratios for Canada and the PMPRB7 comparator countries for 2000 and 2017.
2000: Canada, 10.1%; PMPRB7, 20.4%; France, 16.8%; Germany, 17.3%; Italy, 6.2%;
Sweden, 44.4%; Switzerland, 102.5%; United Kingdom, 35.1%; United States, 18.4%.
2017: Canada, 4.1%; PMPRB7, 24.0%; France, 15.7%; Germany, 21.3%; Italy, 5.7%;
Sweden, 27.7%; Switzerland, 116.3%; United Kingdom, 26.1%; United States, 24.8%.
Appendix 1: Glossary
These definitions are provided for general assistance only; they have no legal force and should be read in conjunction with the applicable legislation.
Active Ingredient or Medicinal Ingredient: Chemical or biological substance responsible for the claimed pharmacologic effect of a medicine.
ATC: Anatomical Therapeutic Chemical (ATC) classification system, developed and maintained by the World Health Organization (WHO) Collaborating Centre for Drug Statistics Methodology, divides medicines into different groups according to their site of action and therapeutic and chemical characteristics. This system is used by the PMPRB as a guide for selecting comparable medicines for purposes of price review under the Guidelines.
Drug Identification Number (DIN): A registration number (drug identification number) that the Health Products and Food Branch of Health Canada assigns to each prescription and non-prescription drug product marketed under the Food and Drug Regulations. A DIN uniquely identifies the following product characteristics: manufacturer; product name; active ingredient(s); strength of active ingredient(s); pharmaceutical dosage form; route of administration. Different strengths and dosage forms of a medicine may be assigned different DINs.
Drug Product: A particular presentation of a medicine characterized by its pharmaceutical dosage form and the strength of the active ingredient(s) (see “medicine” below).
Failure to File: The complete or partial failure of a patentee to comply with regulatory filing requirements pursuant to the Patent Act and the Patented Medicines Regulations.
Failure to Report: The complete failure of a patentee to have reported a patented medicine being sold in accordance with regulatory filing requirements pursuant to the Patent Act and the Patented Medicines Regulations.
License, Voluntary: A contractual agreement between a patent holder and a licensee under which the licensee is entitled to enjoy the benefit of the patent or to exercise any rights in relation to the patent for some consideration (e.g., royalties in the form of a share of the licensee's sales).
Medicine: A medicinal ingredient and/or a substance or a mixture of substances manufactured, sold or represented for use in the diagnosis, treatment, mitigation or prevention of a disease, disorder or abnormal physical state, or its symptoms, in human beings or animals; or restoring, correcting or modifying organic functions in human beings or animals.
Notice of Compliance (NOC): Means a notice issued under section C.08.004 or C.08.004.01 of the Food and Drug Regulations. The issuance of an NOC indicates that a drug product meets the required Health Canada standards for use in humans or animals and that the manufacturer of the product is authorized to market the product in Canada.
Patent: An instrument issued by the Commissioner of Patents in the form of letters patent for an invention.
Patented Medicine Price Index (PMPI): The PMPI was developed by the PMPRB as a measure of average year-over-year change in the transaction prices of patented medicines sold in Canada, based on the price and sales information reported by patentees.
Patentee: As defined by subsection 79(1) of the Patent Act, “the person for the time being entitled to the benefit of the patent for that invention and includes, where any other person is entitled to exercise any rights in relation to that patent other than under a license continued by subsection 11(1) of the Patent Act Amendment Act, 1992, that other person in respect of those rights;”
PMPRB7: France, Germany, Italy, Sweden, Switzerland, the United Kingdom and the United States.
Research and Development (R&D): Basic or applied research for the purpose of creating new, or improving existing, materials, devices, products or processes (e.g., manufacturing processes).
Research and Development—Applied Research: R&D directed toward a specific practical application, comprising research intended to improve manufacturing processes, pre-clinical trials and clinical trials.
Research and Development—Basic Research: R&D defined as work that advances scientific knowledge without a specific application in mind.
Research and Development—Other Qualifying: Includes eligible research and development expenditures that cannot be classified into any of the preceding categories of “type of research and development”. It includes regulatory submissions, bioavailability studies and Phase IV clinical trials.
Research and Development Expenditures: For the purposes of the Patented Medicines Regulations, in particular Sections 5 and 6, research and development includes activities for which expenditures would have qualified for the investment tax credit for scientific research and experimental development under the Income Tax Act as it read on December 1, 1987.
Research and Development Expenditures–Current: Consist of the following non-capital expenses directly related to research work: (a) wages and salaries, (b) direct material,
(c) contractors and subcontractors, (d) other direct costs such as factory overhead, (e) payments to designated institutions, (f) payments to granting councils, and (g) payments to other organizations. These elements are described in greater detail in the Patentees' Guide to Reporting—Form 3, available on the PMPRB Website under Regulatory Filings.
Special Access Programme (SAP): A program operated by Health Canada to give practitioners access to medicines that are not approved or otherwise available in Canada.
Voluntary Compliance Undertaking (VCU): A written undertaking by a patentee to adjust its price to conform to the Board's Guidelines. A VCU represents a promise by a patentee geared towards a satisfactory resolution of an investigation initiated by Staff as per the Guidelines. A VCU takes into account the specific facts and underlying context of a particular case. As such, VCUs are not intended to have precedential value.
Appendix 2: Patented Medicines First Reported to the PMPRB in 2019
| Brand Name | Company | DIN | Status - Full year 2019 | Level of Theraputic Improvement |
|---|---|---|---|---|
| Actemra - 162 mg/syringe | Hoffmann-La Roche Limited, Canada | 2483327 | Within Guidelines | SN |
| Aimovig - 140 mg/milliliter | Novartis Pharmaceuticals Canada Inc. | 2487306 | Subject to Investigation | SN |
| Aimovig - 70 mg/milliliter | Novartis Pharmaceuticals Canada Inc. | 2479613 | Subject to Investigation | SN |
| AKLIEF - 50 mcg/gram | Galderma Canada Inc. | 2494175 | Under review | Under review |
| BELSOMRA - 10 mg/tab | Merck Canada Inc. | 2483513 | Within Guidelines | SN |
| BELSOMRA - 20 mg/tab | Merck Canada Inc. | 2483548 | Within Guidelines | SN |
| BELSOMRA -15 mg/tab | Merck Canada Inc. | 2483521 | Within Guidelines | SN |
| BRINEURA - 30 mg/milliliter | Biomarin Pharmaceuticals Canada Inc. | 2484013 | Within Guidelines | B |
| Brivlera - 10 mg/milliliter | UCB Pharma Canada Inc. | 2452995 | Within Guidelines | SN |
| Calquence - 100 mg/capsule | Astrazenea Canada Inc. | 2491788 | Under review | Under review |
| CRYSVITA - 10 mg/milliliter | Ultragenyx Pharmaceuticals Inc. | 2483629 | Under review | Under review |
| CRYSVITA - 20 mg/milliliter | Ultragenyx Pharmaceuticals Inc. | 2483637 | Under review | Under review |
| CRYSVITA - 30 mg/milliliter | Ultragenyx Pharmaceuticals Inc. | 2483645 | Under review | Under review |
| DELSTRIGO 100/300/300 - 700 mg/tab | Merck Canada Inc. | 2482592 | Within Guidelines | SN |
| DOVATO 50/300 - 350 mg/tab | ViiV HealthCare ULC | 2491753 | Under review | Under review |
| Dupixent - 200 mg/syringe | Sanofi-aventis Canada Inc. | 2492504 | Under review | Under review |
| Emgality - 120 mg/milliliter | Eli Lilly Canada Inc. | 2491060 | Under review | Under review |
| Emgality - 120 mg/milliliter | Eli Lilly Canada Inc. | 2491087 | Under review | Under review |
| ENGERIX-B - 1 Dose | Galderma Canada Inc. | 2487039 | Under review | Under review |
| ENGERIX-B PEDIATRIC - 1 Dose | Galderma Canada Inc. | 2487020 | Under review | Under review |
| Envarsus PA - 0.75 mg/tab | Paladin Laboratories Inc. | 2485877 | Within Guidelines | SN |
| Envarsus PA - 1 mg/tab | Paladin Laboratories Inc. | 2485885 | Within Guidelines | SN |
| Envarsus PA - 4 mg/tab | Paladin Laboratories Inc. | 2485893 | Within Guidelines | SN |
| EVENITY - 105 mg/syringe | Amgen Canada Inc. | 2489597 | Under review | Under review |
| Gamifant - 10 mg/vial | Swedish Orphan Biovitrum, SOBI AB | Under review | Under review | |
| GILENYA - 0.25 mg/capsule | Novartis Pharmaceuticals Canada Inc. | 2482533 | Within Guidelines | SN |
| Hemlibra - 105 mg/vial | Hoffmann-La Roche Limited, Canada | 2479656 | Subject to Investigation | MI-P |
| Hemlibra - 150 mg/milliliter | Hoffmann-La Roche Limited, Canada | 2479664 | Subject to Investigation | MI-P |
| Hemlibra - 30 mg/milliliter | Hoffmann-La Roche Limited, Canada | 2479621 | Subject to Investigation | MI-P |
| Hemlibra - 60 mg/vial | Hoffmann-La Roche Limited, Canada | 2479648 | Subject to Investigation | MI-P |
| IDELVION - 1000 IU/vial | CSL Behring | 2451352 | Under review | Under review |
| JETREA 1.25 mg/milliliter | ThromboGenics N.V. | 2452154 | Within Guidelines | SN |
| KYMRIAH - 1 Dose | Novartis Pharmaceuticals Canada Inc. | 2480514 | Within Guidelines | MI-P |
| Lenvima - 12 mg/day | Eisai Limited | 2484129 | Under review | Under review |
| Lenvima - 4 mg/day | Eisai Limited | 2484056 | Under review | Under review |
| LORBRENA - 100 mg/tab | Pfizer Canada Inc. | 2485974 | Within Guidelines | MI-P |
| LORBRENA - 25 mg/tab | Pfizer Canada Inc. | 2485966 | Within Guidelines | MI-P |
| Metoject Subcutaneous - 10 mg/syringe | Medexus Inc. | 2454831 | Under review | Under review |
| Metoject Subcutaneous - 12.5 mg/syringe | Medexus Inc. | 2454750 | Under review | Under review |
| Onpattro - 2 mg/milliliter | Alnylam Pharmaceuticals Inc. | 2489252 | Under review | Under review |
| ONSTRYV - 100 mg/tab | Valeo Pharma | 2484668 | Under review | Under review |
| ONSTRYV - 50 mg/tab | Valeo Pharma | 2484641 | Under review | under review |
| ORILISSA - 200 mg/tab | Abbvie | 2481340 | Within Guidelines | SN |
| ORKAMBI 100/125 - 225 mg/granule | Vertex Pharmaceuticals Canada Inc. | 2483831 | Under review | Under review |
| ORKAMBI 150/188 - 338 mg/granule | Vertex Pharmaceuticals Canada Inc. | 2483858 | Under review | Under review |
| RADICAVA - 30 mg/dose | Mitsubishi Tanabe Pharma Corporation | 2475472 | Under review | Under review |
| SIGNIFOR LAR - 10 mg/vial | Novartis Pharmaceuticals Canada Inc. | 2480425 | Does Not Trigger Investigation | SN |
| SIGNIFOR LAR - 30 mg/vial | Novartis Pharmaceuticals Canada Inc. | 2480433 | Does Not Trigger Investigation | SN |
| SKYRIZI - 75 mg/syringe | Abbvie | 2487454 | Within Guidelines | SN |
| SPINRAZA - 2.4 mg/milliliter | Biogen Canada Inc. | 2465663 | Under review | Under review |
| TASIGNA - 50 mg/capsule | Novartis Pharmaceuticals Canada Inc. | 2481715 | Within Guidelines | SN |
| TECENTRIQ - 60 mg/milliliter | Hoffmann-La Roche Limited, Canada | 2492393 | Under review | Under review |
| TEGSEDI - 189 mg/milliliter | Akcea Therapeutics Canada | 2481383 | Under review | Under review |
| TREMFYA One-Press - 100 mg/milliliter | Janssen Inc. | 2487314 | Within Guidelines | SN |
| VASCEPA - 1 g/capsule | HLS Therapeutics Inc. | 2495244 | Under review | Under review |
| Velphoro - 500 mg/tab | Vifor International AG | 2471574 | Under review | Under review |
| Veltassa - 16.8 g/sachet | Vifor International AG | 2481367 | Under review | Under review |
| Verkazia - 1 mg/milliliter | Novartis Pharmaceuticals Canada Inc. | 2484137 | Does Not Trigger Investigation | MI-S |
| VERZENIO - 100 mg/tab | Eli Lilly Canada Inc. | 2487101 | Within Guidelines | SN |
| VERZENIO - 150 mg/tab | Eli Lilly Canada Inc. | 2487128 | Within Guidelines | SN |
| VERZENIO - 200 mg/tab | Eli Lilly Canada Inc. | 2487136 | Within Guidelines | SN |
| VERZENIO - 50 mg/tab | Eli Lilly Canada Inc. | 2487098 | Within Guidelines | SN |
| VITRAKVI - 20 mg/milliliter | Bayer Inc. | 2490331 | Under review | Under review |
| VIZIMPRO - 15 mg/tab | Pfizer Canada Inc. | 2486024 | Within Guidelines | SN |
| VIZIMPRO - 30 mg/tab | Pfizer Canada Inc. | 2486032 | Within Guidelines | SN |
| VIZIMPRO - 45 mg/tab | Pfizer Canada Inc. | 2486040 | Within Guidelines | SN |
| Vyvanse - 10 mg/tab | Takeda Canada Inc. | 2490226 | Under review | Under review |
| Vyvanse - 20 mg/tab | Takeda Canada Inc. | 2490234 | Under review | Under review |
| Vyvanse - 30 mg/tab | Takeda Canada Inc. | 2490242 | Under review | Under review |
| Vyvanse - 40 mg/tab | Takeda Canada Inc. | 2490250 | Under review | Under review |
| Vyvanse - 50 mg/tab | Takeda Canada Inc. | 2490269 | Under review | Under review |
| Vyvanse - 60 mg/tab | Takeda Canada Inc. | 2490277 | Under review | Under review |
| VYZULTA - 0.24 mg/milliliter | Bausch Health, Canada Inc. | 2484218 | Within Guidelines | SN |
| Wakix - 20 mg/tab | Paladin Laboratories Inc. | Under review | Under review | |
| Wakix - 5 mg/tab | Paladin Laboratories Inc. | Under review | Under review | |
| XELJANZ - 10 mg/tab | Pfizer Canada Inc. | 2480786 | Within Guidelines | SN |
| XERMELO - 250 MG/Tab | Ipsen Biopharmaceuticals Canada Inc | 2481553 | Within Guidelines | SN |
| Xultophy - 100 unit/milliliter | Novo Nordisk Canada Inc. | 2474875 | Under review | Under review |
| Xyntha Solofuse - 500 unit/syringe | Pfizer Canada Inc. | 2374064 | Under review | Under review |
| ZEULIDE DEPOT - 22.5 mg/vial | Verity Pharmaceuticals | 2462699 | Under review | Under review |
| ZEULIDE DEPOT - 3.75 mg/dose | Verity Pharmaceuticals | 2429977 | Under review | Under review |
- SN Slight or No Improvement
- MI-S Moderate Improvement – Secondary
- MI-P Moderate Improvement – Primary
- SI Substantial Improvement
- B Breakthrough
Appendix 3: Pharmaceutical Trends - Sales
Table 19. Sales of Patented Medicines, 1990 to 2019
| Year | Patented medicine | 5-year compound annual growth rate | Sales of patented medicines as a share of all medicine sales* | Patented medicine sales per capita | Change in patented medicine sales per capita | Patented medicine sales per GDP | |
|---|---|---|---|---|---|---|---|
| Sales ($billions) | Change | ||||||
2019 |
$17.2 |
3.5% |
4.5% |
57.5% |
$458.60 |
2.7% |
0.748% |
2018 |
$16.7 |
-0.6% |
4.5% |
59.0% |
$446.30 |
-1.7% |
0.751% |
2017 |
$16.8 |
7.6% |
5.4% |
61.5% |
$454.09 |
5.4% |
0.783% |
2016 |
$15.6 |
3.3% |
3.9% |
60.8% |
$430.94 |
2.2% |
0.770% |
2015 |
$15.1 |
9.4% |
4.0% |
61.6% |
$421.80 |
8.5% |
0.760% |
2014 |
$13.8 |
3.1% |
1.2% |
59.9% |
$388.70 |
1.8% |
0.696% |
2013 |
$13.4 |
4.2% |
1.2% |
60.7% |
$381.80 |
2.7% |
0.706% |
2012 |
$12.9 |
0.1% |
1.3% |
59.2% |
$371.80 |
-1.2% |
0.708% |
2011 |
$12.9 |
3.5% |
2.0% |
58.3% |
$376.10 |
3.1% |
0.729% |
2010 |
$12.4 |
-4.3% |
2.6% |
55.8% |
$364.70 |
-5.7% |
0.746% |
2009 |
$13.0 |
2.9% |
4.4% |
59.6% |
$386.90 |
1.9% |
0.829% |
2008 |
$12.6 |
4.6% |
5.4% |
61.7% |
$379.50 |
2.9% |
0.762% |
2007 |
$12.1 |
3.2% |
6.3% |
63.2% |
$368.90 |
2.5% |
0.769% |
2006 |
$11.7 |
7.4% |
9.0% |
67.8% |
$360.00 |
6.3% |
0.784% |
2005 |
$10.9 |
4.2% |
11.6% |
70.6% |
$338.50 |
2.8% |
0.769% |
2004 |
$10.5 |
7.8% |
14.2% |
72.2% |
$329.20 |
7.2% |
0.789% |
2003 |
$9.7 |
9.0% |
17.7% |
72.7% |
$307.00 |
8.0% |
0.776% |
2002 |
$8.9 |
17.5% |
19.2% |
67.4% |
$284.30 |
16.0% |
0.748% |
2001 |
$7.6 |
18.9% |
20.4% |
65.0% |
$245.20 |
19.1% |
0.666% |
2000 |
$6.3 |
16.7% |
19.4% |
63.0% |
$205.90 |
15.9% |
0.571% |
1999 |
$5.4 |
27.0% |
17.6% |
61.0% |
$177.60 |
24.3% |
0.538% |
1998 |
$4.3 |
18.9% |
12.4% |
55.1% |
$142.90 |
15.4% |
0.459% |
1997 |
$3.7 |
22.6% |
11.0% |
52.3% |
$123.70 |
22.1% |
0.409% |
1996 |
$3.0 |
12.8% |
8.4% |
45.0% |
$101.40 |
14.2% |
0.350% |
1995 |
$2.6 |
10.8% |
8.9% |
43.9% |
$88.70 |
7.2% |
0.314% |
1994 |
$2.4 |
-2.1% |
— |
40.7% |
$82.80 |
-1.4% |
0.304% |
1993 |
$2.4 |
9.4% |
— |
44.4% |
$83.90 |
7.9% |
0.322% |
1992 |
$2.2 |
14.0% |
— |
43.8% |
$77.70 |
8.8% |
0.307% |
1991 |
$2.0 |
13.1% |
— |
43.2% |
$71.40 |
16.0% |
0.286% |
1990 |
$1.7 |
— |
— |
43.2% |
$61.60 |
— |
0.245% |
* The denominator in this ratio comprises sales of patented and non-patented brand medicines and patented and non-patented generic medicines. Starting with the estimate for 2005, this value is derived from data contained in IQVIA’s MIDAS® database. In previous years, IQVIA data was used to calculate sales of generic medicines only, while sales of non-patented brand products were estimated from data submitted by patentees. This approach was abandoned because of anomalies related to year-to-year changes in the set of companies reporting to the PMPRB. Ratios reported for years before 2005 likely overstate the patented share, but by only a small amount. This small bias in no way invalidates the strong upward trend evinced by the results for the years 1990 through 2003. Ratios since 2009 have also been revised slightly as a result of data updates from IQVIA—none of these adjustments resulted in a change greater than 0.4%.
Data source: PMPRB; MIDAS® database, 2005−2019, IQVIA (all rights reserved)
Appendix 4: Research and Development
Table 20. Range of R&D-to-Sales Ratios by Number of Reporting Companies and Total Sales Revenue, 2019 and 2018
| Range: R&D-to-sales ratio | Number of reporting companies: 2019 | Sales revenues: 2019 ($millions) | Share: 2019 (%) | Number of reporting companies: 2018 | Sales revenues: 2018 ($millions) | Share: 2018 (%) |
|---|---|---|---|---|---|---|
0% |
44 |
$3,119.4 |
13.5% |
38 |
$2,764.4 |
12.2% |
≤10% |
37 |
$17,123.6 |
74.1% |
39 |
$17,682.7 |
78.0% |
>10% |
20 |
$2,858.1 |
12.4% |
16 |
$2,216.3 |
9.8% |
Total* |
101 |
$23,101.1 |
100% |
93 |
$22,663.4 |
100% |
* Values may not add to totals due to rounding.
Data source: PMPRB
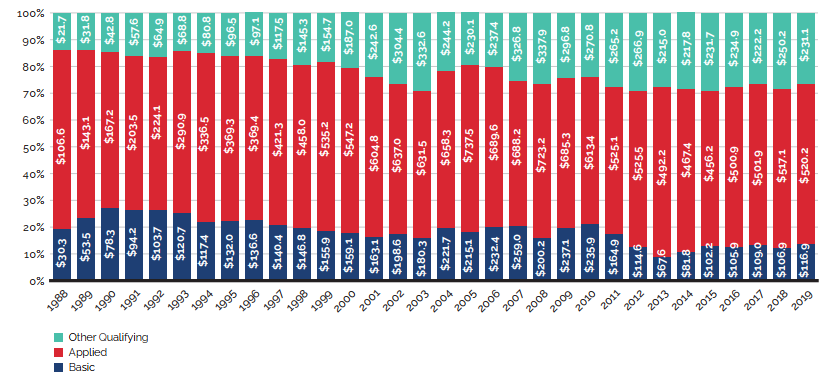
Source: PMPRB
Figure description
Table 21. Ratios of R&D Expenditures to Sales Revenue by Reporting Patentee1, 2019 and 2018
| Company | R&D-to-sales ratio 2019 | R&D-to-sales ratio 2018 | MIP-to-Cdn price ratio – 5 country limit | Canadian sales compared to PMPRB7 sales 2019 | Canadian sales compared to rest of OECD sales 2019 |
|---|---|---|---|---|---|
AbbVie Corporation2,3 |
2.9% |
2.7% |
0.95 |
2.9 |
2.5 |
Acerus Pharmaceuticals |
0.0% |
0.0% |
— |
— |
— |
Aerie Pharmaceuticals Inc. |
0.0% |
0.0% |
— |
— |
— |
Alexion Pharmaceuticals Inc.3 |
0.0% |
0.0% |
0.93 |
— |
— |
ALK-Abelló A/S |
0.0% |
0.3% |
1.14 |
3.1 |
2.4 |
Alkermes Inc. |
13,400.7% |
10,732.8% |
— |
— |
— |
Allergan Inc. |
1.6% |
1.4% |
0.73 |
1.1 |
1.0 |
Alnylam Pharmaceuticals Inc.3,4 |
0.0% |
— |
— |
— |
— |
Altius Healthcare Inc. |
23.4% |
17.8% |
— |
— |
— |
Amgen Canada Inc.2,3 |
3.9% |
3.6% |
0.89 |
2.3 |
2.1 |
Amicus Therapeutics UK Ltd |
0.0% |
0.0% |
1.92 |
— |
— |
Aralez Pharmaceuticals Inc. |
0.0% |
0.0% |
— |
— |
— |
Aspen Pharmacare Canada Inc. |
0.0% |
0.0% |
1.02 |
3.9 |
1.1 |
Astellas Pharma Canada Inc.2 |
0.3% |
1.1% |
1.44 |
3.4 |
2.1 |
AstraZeneca Canada Inc.2,3 |
10.1% |
7.7% |
0.78 |
4.8 |
3.9 |
Avir Pharma Inc.3 |
0.0% |
0.0% |
1.04 |
— |
— |
Bausch Health Canada Inc.3 |
0.4% |
0.6% |
1.08 |
1.1 |
0.9 |
Baxter Corporation |
0.1% |
0.0% |
1.42 |
0.5 |
0.3 |
Bayer Inc.2,3 |
3.5% |
5.4% |
1.01 |
14.7 |
6.4 |
BGP Pharma ULC |
0.0% |
0.0% |
— |
83.1 |
57.79 |
Biogen Idec Canada Inc.3 |
11.4% |
16.5% |
1.05 |
2.2 |
1.8 |
BioMarin Canada Inc.3 |
2.5% |
7.6% |
1.00 |
— |
— |
BioSyent Pharma Inc. |
0.0% |
0.0% |
— |
— |
— |
Bioverativ Canada Inc.3 |
3.5% |
1.7% |
1.74 |
— |
— |
Boehringer Ingelheim (Canada) Ltd2 |
1.9% |
2.2% |
0.93 |
3.3 |
2.6 |
Bristol-Myers Squibb Canada2,3 |
11.7% |
10.4% |
1.01 |
63.8 |
38.9 |
BTG International Ltd |
0.0% |
0.0% |
— |
— |
— |
Celgene Inc.3 |
1,176.4% |
1.9% |
1.02 |
0.4 |
0.3 |
Cheplapharm Arzneimittel GmbH |
0.0% |
0.0% |
0.73 |
— |
— |
Chiesi USA Inc.4 |
0.0% |
— |
— |
0.03 |
0.01 |
Cipher Pharmaceuticals Inc. |
0.9% |
1.3% |
— |
— |
— |
Covis Pharma BV4 |
0.0% |
– |
0.89 |
— |
— |
CSL Behring Canada Inc.3 |
0.2% |
0.2% |
5.32 |
— |
— |
Duchesnay Inc. |
1.3% |
0.7% |
— |
6.9 |
6.5 |
Eisai Ltd3 |
4.2% |
3.2% |
0.94 |
1.2 |
0.6 |
Eli Lilly Canada Inc. (incl. Provel Animal Health Division)2,3 |
10.1% |
7.3% |
0.98 |
1.3 |
1.2 |
EMD Serono Canada Inc.2 |
0.0% |
0.0% |
0.89 |
3.8 |
3.7 |
Ferring Pharmaceuticals Inc.3 |
0.0% |
0.0% |
0.84 |
3.6 |
2.5 |
Galderma Canada Inc. |
0.0% |
0.0% |
0.45 |
4.9 |
4.1 |
GE Healthcare Inc. |
0.0% |
0.0% |
— |
— |
— |
Gilead Sciences Canada Inc.3 |
14.8% |
10.3% |
0.83 |
2.9 |
2.3 |
GlaxoSmithKline Inc.2 |
3.3% |
5.4% |
0.69 |
59.9 |
14.7 |
Grifols Canada Ltd (Talecris Biotherapeutics Ltd)3 |
0.0% |
0.0% |
— |
— |
— |
HLS Therapeutics Inc.4 |
0.0% |
— |
— |
214.8 |
68.2 |
Hoffmann-La Roche Ltd Canada2,3 |
5.2% |
6.8% |
1.12 |
16.4 |
7.4 |
Horizon Pharma PLC 2,3 |
0.0% |
0.0% |
— |
— |
— |
Intega Skin Sciences Inc.4 |
0.0% |
— |
— |
— |
— |
Intercept Pharmaceuticals Inc. |
11.4% |
13.4% |
— |
0.2 |
0.1 |
Ipsen Biopharmaceuticals Inc.2,3 |
0.1% |
0.2% |
1.00 |
1.9 |
1.3 |
Janssen Inc.2,3 |
2.3% |
2.4% |
1.06 |
8.1 |
6.3 |
Jazz Pharmaceuticals3 |
37.9% |
9.3% |
— |
0.1 |
0.1 |
Johnson & Johnson Medical Products |
1.0% |
0.9% |
— |
3.7 |
2.0 |
Knight Therapeutics Inc.2 |
12.4% |
18.2% |
0.53 |
— |
— |
Labtician Théa. |
13.9% |
37.1% |
0.84 |
— |
— |
Lantheus MI Canada Inc. |
0.0% |
0.0% |
— |
— |
— |
LEO Pharma Inc.2 |
0.1% |
0.1% |
0.65 |
11.2 |
7.3 |
Lundbeck Canada Inc.2 |
0.5% |
0.5% |
0.67 |
8.2 |
5.5 |
Lupin Pharma Canada Ltd |
0.0% |
0.0% |
0.98 |
0.3 |
0.3 |
Medexus Inc. |
0.0% |
0.0% |
0.99 |
— |
— |
Merck Canada Inc.2,3 |
5.2% |
4.3% |
0.94 |
4.8 |
3.7 |
Merus Labs |
0.0% |
0.0% |
— |
— |
— |
Merz Pharma Canada Ltd |
0.0% |
0.0% |
0.95 |
1.9 |
1.2 |
Noden Pharma DAC |
0.0% |
0.0% |
1.14 |
2.3 |
2.1 |
Novartis Pharmaceuticals Canada Inc.2,3 |
3.2% |
3.4% |
0.92 |
5.1 |
3.4 |
Novo Nordisk Canada Inc.2,3 |
1.8% |
1.6% |
0.96 |
1.9 |
1.7 |
Octapharma Canada Inc. |
2.0% |
0.5% |
— |
— |
— |
Otsuka Canada Pharmaceutical Inc. (OCPI)2 |
0.8% |
0.2% |
0.98 |
4.2 |
2.0 |
Paladin Labs Inc.2 |
0.2% |
0.2% |
0.91 |
— |
— |
Partner Therapeutics Inc. |
0.0% |
519.6% |
— |
— |
— |
Pediapharm Inc. |
0.0% |
0.0% |
— |
— |
— |
Pfizer Canada Inc.2,3 |
0.5% |
0.3% |
1.08 |
3.6 |
2.9 |
Pharmascience Inc. |
0.0% |
12.4% |
— |
— |
— |
Pierre Fabre Dermo-Cosmétique Canada Inc. |
0.0% |
0.0% |
1.02 |
0.6 |
0.2 |
Purdue Pharma2 |
2.1% |
2.1% |
1.17 |
14.1 |
12.3 |
Sandoz Canada Inc. |
0.0% |
0.0% |
— |
11.0 |
7.2 |
Sanofi Canada Inc.2,3 |
1.7% |
1.5% |
0.85 |
27.6 |
11.7 |
Sanofi Pasteur Ltd2,3 |
44.5% |
51.7% |
0.88 |
— |
— |
Santen SAS4 |
0.0% |
— |
— |
— |
— |
Searchlight Pharma Inc.4 |
0.0% |
— |
— |
— |
— |
Seattle Genetics Inc. |
12.2% |
16.6% |
1.10 |
— |
— |
Seqirus Canada Inc.3 |
31.9% |
870.2% |
1.22 |
0.2 |
0.1 |
Servier Canada Inc.2,3 |
7.8% |
4.4% |
1.09 |
18.6 |
4.7 |
Shire Canada Inc.3 |
0.0% |
0.0% |
1.25 |
41.0 |
17.9 |
Shire Rare Disease Business Unit3 |
0.0% |
0.0% |
1.08 |
— |
— |
Sprout Pharmaceuticals Inc. |
0.0% |
0.0% |
— |
— |
— |
Sun Pharmaceutical Industries Inc.4 |
57.0% |
— |
— |
— |
— |
Sunovion Pharmaceuticals Canada Inc.2 |
0.0% |
0.0% |
0.89 |
0.9 |
0.9 |
Swedish Orphan Biovitrum AB (Sobi)3 |
0.0% |
0.0% |
1.07 |
0.05 |
0.01 |
Taiho Oncology Inc.3 |
4.6% |
0.0% |
1.04 |
3.8 |
0.7 |
Takeda Canada Inc.2,3 |
0.2% |
0.2% |
0.92 |
1.6 |
1.1 |
Theratechnologies Inc.2 |
444.5% |
0.0% |
— |
— |
— |
Teva Canada Innovation3 |
0.04% |
0.1% |
0.91 |
4.9 |
3.9 |
ThromboGenics NV |
814.4% |
359.7% |
0.98 |
— |
— |
UCB Canada Inc.3 |
35.8% |
41.5% |
1.01 |
1.3 |
1.0 |
Ultragenyx Pharmaceutical Inc.3,4 |
24.5% |
— |
— |
— |
— |
Upjohn Canada ULC2,4 |
0.0% |
— |
0.89 |
— |
— |
Valeo Pharma4 |
0.0% |
— |
0.58 |
— |
— |
Verity Pharmaceuticals Inc.4 |
0.0% |
— |
— |
— |
— |
Vertex Pharma Canada Inc.3 |
0.01% |
0.0% |
1.12 |
— |
— |
Vifor International AG4 |
0.0% |
— |
0.62 |
— |
— |
ViiV Healthcare ULC2 |
0.0% |
0.0% |
1.08 |
3.1 |
2.5 |
1 To avoid double counting sales revenues, revenues from royalties are included in calculating each company’s ratio but not included in calculating industry-wide ratios. Federal and provincial government grants are subtracted from the R&D expenditure in calculating individual R&D-to-sales ratios but are included in calculating industry-wide ratios. Differences between the list of companies filing data on prices and those filing R&D data are due to differences in the reporting practices of patentees and their affiliates or licensees. Note as well that some veterinary patentees (i.e., those without revenue from sales of products for human use) are required to file information on R&D expenditures but not price and sales information.
2 Member of Innovative Medicines Canada.
3 Member of BIOTECanada.
4 Not a patentee in 2018.
Data source: PMPRB
Table 22. Current R&D Expenditures by Province/Territory, 2019
| Province | Expenditures: All patentees ($thousands) | Regional share | Expenditures: Innovative Medicines Canada ($thousands) | Regional share |
|---|---|---|---|---|
Newfoundland and Labrador |
$2,951.52 |
0.340% |
$1,988.37 |
0.340% |
Prince Edward Island |
$4,139.76 |
0.477% |
$175.03 |
0.027% |
Nova Scotia |
$10,024.97 |
1.155% |
$8,209.17 |
1.283% |
New Brunswick |
$4,029.90 |
0.464% |
$3,351.72 |
0.524% |
Quebec |
$246,143.58 |
28.348% |
$198,465.26 |
31.009% |
Ontario |
$441,599.39 |
50.859% |
$373,726.88 |
58.393% |
Manitoba |
$5,202.75 |
0.599% |
$3,038.10 |
0.475% |
Saskatchewan |
$2,679.13 |
0.309% |
$681.66 |
0.107% |
Alberta |
$103,834.22 |
11.958% |
$21,801.20 |
3.406% |
British Columbia |
$47,067.34 |
5.421% |
$28,585.42 |
4.466% |
Territories |
$615.66 |
0.071% |
$0.00 |
0.000% |
Canada* |
$868,288.22 |
100% |
$640,022.82 |
100% |
* Provincial/territorial values may not add to totals for Canada due to rounding.
Data source: PMPRB
Table 23. Current R&D Expenditures by Performer and Province/Territory, 2019
| Province | Patentees | Other companies | Universities | Hospitals | Others | |
|---|---|---|---|---|---|---|
Newfoundland and Labrador |
Expenditure ($thousands) |
$1,035.20 |
$988.66 |
$219.86 |
$51.92 |
$655.88 |
Share |
35.1% |
33.5% |
7.4% |
1.8% |
22.2% |
|
Prince Edward Island |
Expenditure ($thousands) |
$470.03 |
$3,494.72 |
$175.00 |
$0.00 |
$0.00 |
Share |
11.4% |
84.4% |
4.2% |
0.0% |
0.0% |
|
Nova Scotia |
Expenditure ($thousands) |
$1,580.50 |
$3,844.92 |
$1,884.84 |
$249.44 |
$2,465.27 |
Share |
15.8% |
38.4% |
18.8% |
2.5% |
24.6% |
|
New Brunswick |
Expenditure ($thousands) |
$1,217.44 |
$540.10 |
$48.05 |
$234.48 |
$1,989.83 |
Share |
30.2% |
13.4% |
1.2% |
5.8% |
49.4% |
|
Quebec |
Expenditure ($thousands) |
$64,753.72 |
$112,157.11 |
$16,141.31 |
$22,302.83 |
$30,788.60 |
Share |
26.3% |
45.6% |
6.6% |
9.1% |
12.5% |
|
Ontario |
Expenditure ($thousands) |
$220,761.83 |
$92,140.81 |
$54,778.03 |
$44,679.30 |
$29,239.42 |
Share |
50.0% |
20.9% |
12.4% |
10.1% |
6.6% |
|
Manitoba |
Expenditure ($thousands) |
$2,904.88 |
$831.73 |
$267.90 |
$453.12 |
$745.12 |
Share |
55.8% |
16.0% |
5.1% |
8.7% |
14.3% |
|
Saskatchewan |
Expenditure ($thousands) |
$910.06 |
$722.00 |
$863.25 |
$38.78 |
$145.04 |
Share |
34.0% |
26.9% |
32.2% |
1.4% |
5.4% |
|
Alberta |
Expenditure ($thousands) |
$79,238.41 |
$11,610.41 |
$5,673.52 |
$3,031.74 |
$4,280.14 |
Share |
76.3% |
11.2% |
5.5% |
2.9% |
4.1% |
|
British Columbia |
Expenditure ($thousands) |
$21,172.97 |
$14,065.57 |
$5,331.51 |
$1,648.11 |
$4,849.18 |
Share |
45.0% |
29.9% |
11.3% |
3.5% |
10.3% |
|
Territories |
Expenditure ($thousands) |
$93.76 |
$0.00 |
$130.22 |
$261.68 |
$130.00 |
Share |
15.2% |
0.0% |
21.2% |
42.5% |
21.1% |
|
Canada* |
Expenditure ($thousands) |
$394,138.80 |
$240,396.05 |
$85,513.49 |
$72,951.41 |
$75,288.47 |
Share |
45.4% |
27.7% |
9.8% |
8.4% |
8.7% |
|
Note: For each jurisdiction, the share for each category represents the percentage of total R&D expenditures for the given province or territory (or nationally for the total R&D in Canada).
* Provincial/territorial expenditures may not add to totals for Canada and shares across individual rows may not add to 100% due to rounding.
Total R&D expenditures are the sum of current expenditures and capital expenditures (equipment + depreciation).
Data source: PMPRB