
CompassRx, 7th Edition
Annual Public Drug Plan Expenditure Report, 2019/20
ISSN 2369-0518
Cat. No. H79-6E-PDF
November 2021
PDF - 2.5 MB
Table of Contents
- Executive Summary
- Introduction
- Methods
- Limitations
- 1. Trends in Prescription Drug Expenditures, 2014/15 to 2019/20
- 2. The Drivers of Drug Costs, 2018/19 to 2019/20
- 3. The Drivers of Dispensing Costs, 2018/19 to 2019/20
- References
- Appendix A: Drug Reviews and Approvals
- Appendix B: Distribution of New Patients on Select DMARDs by Jurisdiction
- Appendix C: Annual Rates of Change in Drug Costs for the NIHB Program
- Appendix D: Top 50 Patented Medicines by Drug Cost
- Appendix E: Top 50 Multi-Source Generic Medicines by Drug Cost
- Appendix F: Top 50 Single-Source Non-Patented Medicines by Drug Cost
- Appendix G: Top 50 Manufacturers by Drug Cost
Acknowledgements
This report was prepared by the Patented Medicine Prices Review Board (PMPRB) as part of the National Prescription Drug Utilization Information System (NPDUIS) initiative.
The PMPRB wishes to acknowledge the members of the NPDUIS Advisory Committee for their expert oversight and guidance in the preparation of this report. Please note that the statements and findings for this report do not necessarily reflect those of the members or their organizations.
Appreciation goes to Yvonne Zhang for leading this project, and to Tanya Potashnik, Jeffrey Menzies, and Caroline Peterson for their oversight in the development of the report. The PMPRB also wishes to acknowledge the contribution of the analytical staff Ai Chau and Ian Detta and editorial staff Sarah Parker, Shirin Paynter, and Laura Fortune.
This report is dedicated to the memory of Ai Chau who sadly passed away in March 2021. He was a valued employee of the PMPRB for over 20 years and an integral part of the development of the CompassRx reports. Ai is greatly missed and fondly remembered by his friends and colleagues.
Disclaimer
NPDUIS operates independently of the regulatory activities of the Board of the PMPRB. The research priorities, data, statements, and opinions expressed or reflected in NPDUIS reports do not represent the position of the PMPRB with respect to any regulatory matter. NPDUIS reports do not contain information that is confidential or privileged under sections 87 and 88 of the Patent Act, and the mention of a medicine in an NPDUIS report is not and should not be understood as an admission or denial that the medicine is subject to filings under sections 80, 81, or 82 of the Patent Act or that its price is or is not excessive under section 85 of the Patent Act.
Although based in part on data provided by the Canadian Institute for Health Information (CIHI), the statements, findings, conclusions, views, and opinions expressed in this report are exclusively those of the PMPRB and are not attributable to CIHI.
Contact Information
Patented Medicine Prices Review Board
Standard Life Centre
Box L40
333 Laurier Avenue West Suite 1400
Ottawa, ON K1P 1C1
Tel.: 1-877-861-2350
TTY 613-288-9654
Email: PMPRB.Information-Renseignements.CEPMB@pmprb-cepmb.gc.ca
Executive Summary
Prescription drug expenditures for the NPDUIS public drug plans rose to $12.5 billion in 2019/20, an increase of 3.7% over spending in 2018/19. While new restrictions on eligibility requirements in Ontario’s OHIP+ program had a significant impact on costs, the overall growth in prescription drug expenditures continued to be primarily driven by notable increases in the use of higher-cost drugs.
The PMPRB’s CompassRx report monitors and analyzes the cost pressures driving changes in prescription drug expenditures in Canadian public drug plans. This seventh edition of CompassRx provides insight into the factors driving growth in drug and dispensing costs in 2019/20, as well as a retrospective review of recent trends in public drug plan costs and utilization.
The main data source for this report is the National Prescription Drug Utilization Information System (NPDUIS) Database at the Canadian Institute for Health Information (CIHI), which includes data for the following jurisdictions: British Columbia, Alberta, Saskatchewan, Manitoba, Ontario, New Brunswick, Nova Scotia, Prince Edward Island, Newfoundland and Labrador, Yukon, and the Non-Insured Health Benefits Program.
The findings from this report will inform policy discussions and aid decision makers in anticipating and responding to evolving cost pressures.
Key findings
Prescription drug expenditures for the NPDUIS public drug plans increased by 3.7% in 2019/20, bringing annual spending to $12.5 billion.
- Between 2014/15 and 2019/20, the total prescription drug expenditures for Canada’s public drug plans rose by $3.1 billion, for a compound annual growth rate of 5.5%.
- Drug costs, which represent 80% of prescription drug expenditures, grew by 4.3% from 2018/19 to 2019/20, while dispensing costs, which account for the remaining 20% of expenditures, grew by 1.4%.
- The NPDUIS public drug plans paid an average of 87% of the total prescription costs for 300 million prescriptions dispensed to almost 7 million active beneficiaries in 2019/20.
- Changes to the OHIP+ program accounted for a 4.8% decrease in total prescription drug expenditures for Ontario in 2019/20 and a 2.9% pull on spending for all NPDUIS public drug plans.
Drug cost growth for the NPDUIS public plans in 2019/20 was primarily driven by a greater use of higher-cost drugs and was offset in part by the decreasing use of DAAs for hepatitis C and plan design changes in Ontario.
- The increased use of higher-cost drugs continued to be the most pronounced driver in 2019/20, pushing costs upward by 5.8%, while declining use of direct-acting antivirals (DAAs) for hepatitis C had a pull effect of -1.6%.
- Nearly 60% of the total drug costs in 2019/20 were attributable to just 5% of public drug plan beneficiaries. High-cost drugs, which were used by 2% of beneficiaries, accounted for more than one third of costs.
- The overall increase in costs was tempered by changes in eligibility for Ontario’s program for those age 24 and younger. Without OHIP+, the 4.3% total drug cost growth in all NPDUIS public drug plans would have been 7.8%.
- Changes in the size of beneficiary populations pushed costs up by 3.0% in 2019/20, due in large part to the expansion of British Columbia’s income-based plan.
- Following a substantial 6.2% pull on costs from generic pricing initiatives in 2018/19, price reductions and generic and biosimilar substitution had a very slight -1.2% effect in 2019/20.
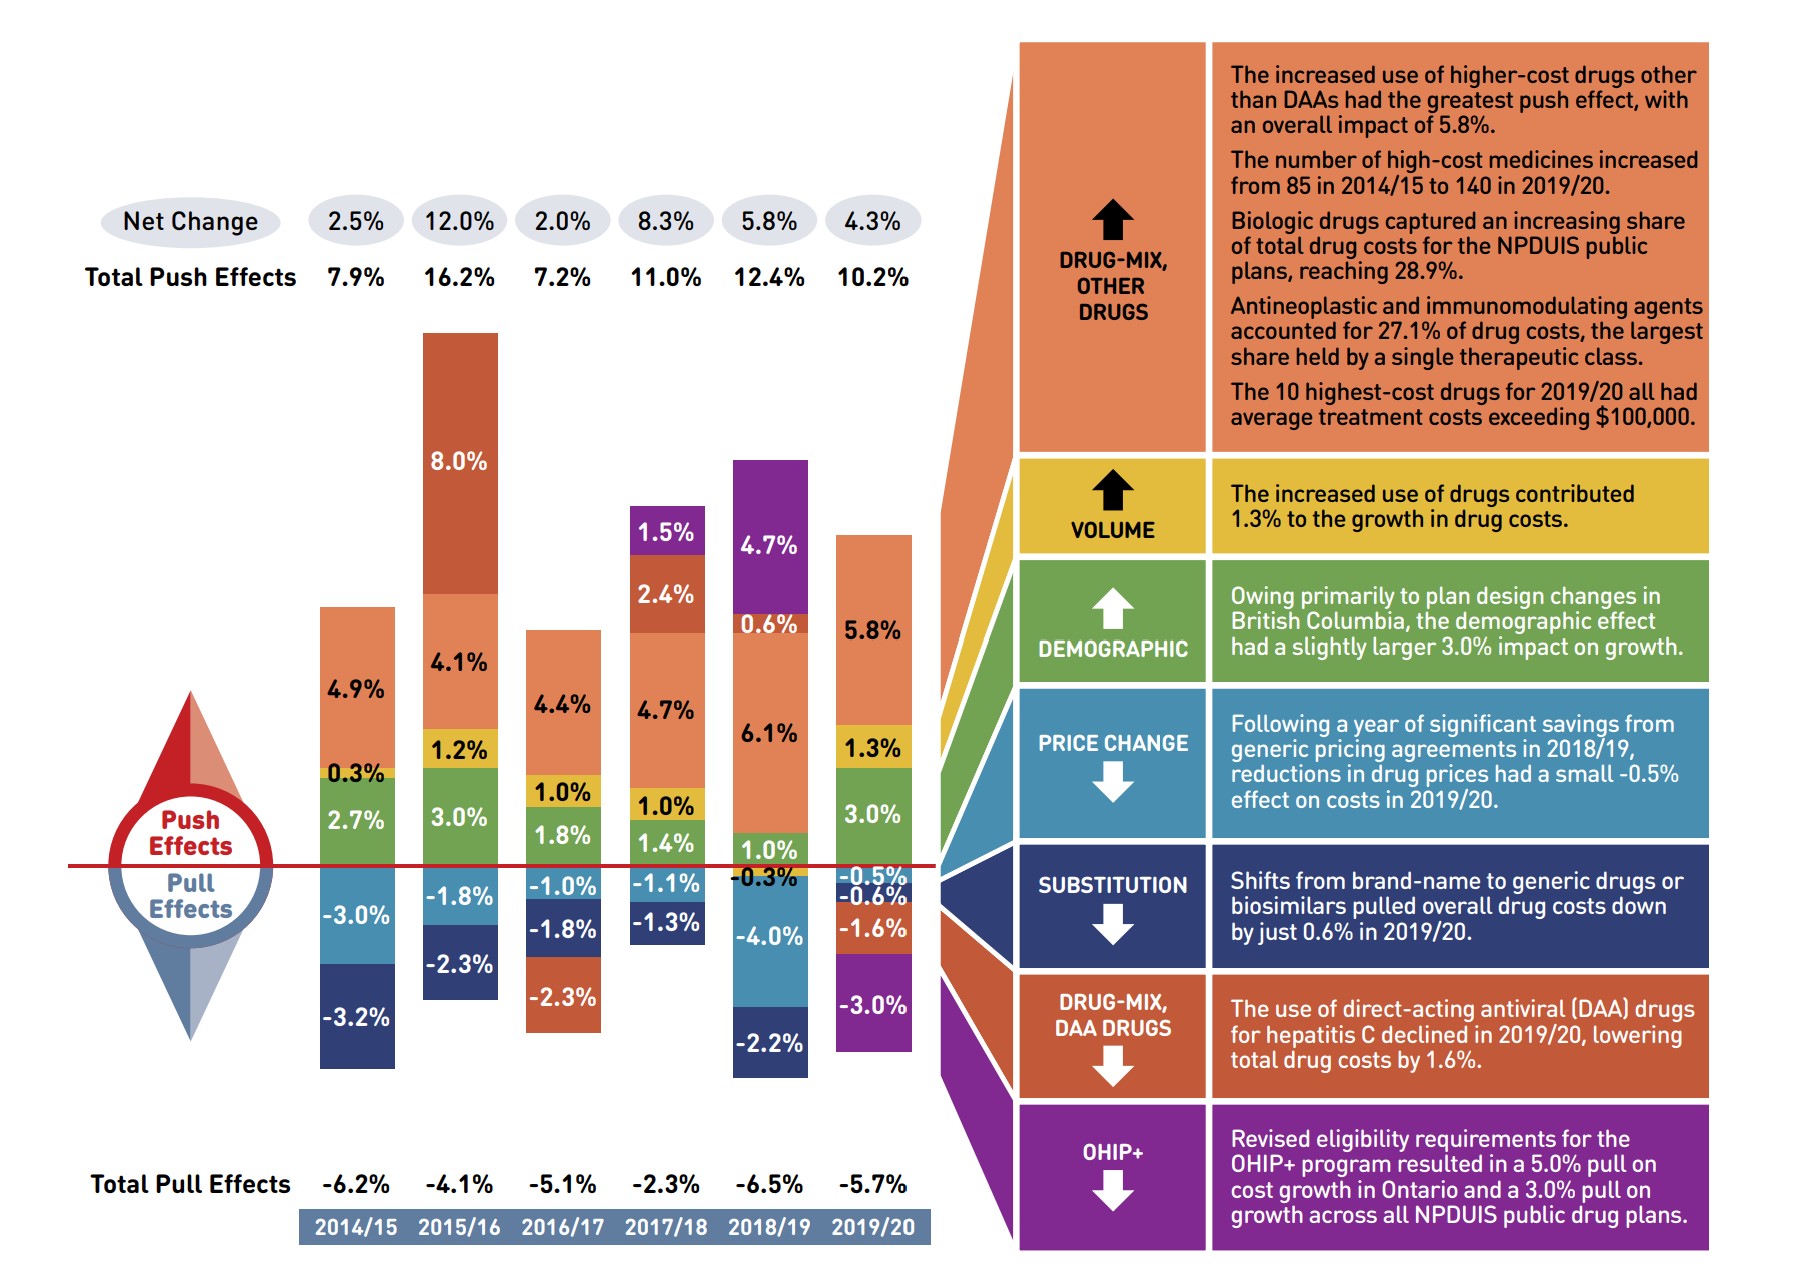
Figure description
This column graph describes the key factors or effects that impacted the rates of change in drug costs across all NPDUIS public drug plans for each year from 2014/15 to 2019/20. Each column is broken out to give the positive or negative contribution of each effect: drug-mix; volume; demographic; price change; and substitution. The drug-mix effect for direct-acting antiviral (DAA) drugs for the treatment of hepatitis C is shown separately, as is the effect of the Ontario Health Insurance Plan Plus (OHIP+) initiative. Separate rows above and below the bar graph show the total positive push effect, negative pull effect, and net change for each year.
| 2014/15 | 2015/16 | 2016/17 | 2017/18 | 2018/19 | 2019/20 | |
|---|---|---|---|---|---|---|
OHIP+ |
- |
- |
- |
1.5% |
4.7% |
-3.0% |
Drug-mix, direct-acting antiviral (DAA) drugs |
- |
8.0% |
-2.3% |
2.4% |
0.6% |
-1.6% |
Drug mix, other drugs |
4.9% |
4.1% |
4.4% |
4.7% |
6.1% |
5.8% |
Volume |
0.3% |
1.2% |
1.0% |
1.0% |
-0.3% |
1.3% |
Demographic |
2.7% |
3.0% |
1.8% |
1.4% |
1.0% |
3.0% |
Price change |
-3.0% |
-1.8% |
-1.0% |
-1.1% |
-4.0% |
-0.5% |
Substitution |
-3.2% |
-2.3% |
-1.8% |
-1.3% |
-2.2% |
-0.6% |
Total push effect |
7.9% |
16.2% |
7.2% |
11.0% |
12.4% |
10.2% |
Total pull effect |
-6.2% |
-4.1% |
-5.1% |
-2.3% |
-6.5% |
-5.7% |
Net change |
2.5% |
12.0% |
2.0% |
8.3% |
5.8% |
4.3% |
A table to the right of the graph provides additional information for each effect in 2019/20.
Drug-mix, other drugs |
The increased use of higher-cost drugs other than DAAs had the greatest push effect, with an overall impact of 5.8%. The number of high-cost medicines increased from 85 in 2014/15 to 140 in 2019/20. Biologic drugs captured an increasing share of total drug costs for the NPDUIS public plans, reaching 28.9%. Antineoplastic and immunomodulating agents accounted for 27.1% of drug costs, the largest share held by a single therapeutic class. The 10 highest-cost drugs for 2019/20 all had average treatment costs exceeding $100,000. |
Volume |
The increased use of drugs contributed 1.3% to the growth in drug costs. |
Demographic |
Owing primarily to plan design changes in British Columbia, the demographic effect had a slightly larger 3.0% impact on growth. |
Price change |
Following a year of significant savings from generic pricing agreements in 2018/19, reductions in drug prices had a small -0.5% effect on costs in 2019/20. |
Substitution |
Shifts from brand-name to generic drugs or biosimilars pulled overall drug costs down by just 0.6% in 2019/20. |
Drug-mix, |
The use of direct-acting antiviral (DAA) drugs for hepatitis C declined in 2019/20, lowering total drug costs by 1.6%. |
OHIP+ |
Revised eligibility requirements for the OHIP+ program resulted in a 5.0% pull on cost growth in Ontario and a 3.0% pull on growth across all NPDUIS public drug plans. |
Note: This analysis is based on publicly available pricing information. It does not reflect confidential drug price discounts negotiated by the pan-Canadian Pharmaceutical Alliance on behalf of the public plans.
Values for 2016/17 onward reflect a revised methodology; previous results have not been updated, as there would have been no notable change in the relative contribution of each effect. Data for Yukon is also included from 2016/17 onward.
Values may not add to totals due to rounding and the cross effect.
Data source: National Prescription Drug Utilization Information System Database, Canadian Institute for Health Information.
Dispensing costs in the NPDUIS public plans increased slightly to $2.5 billion in 2019/20 due to opposing forces from plan design changes in British Columbia and Ontario.
- The overall growth in dispensing costs was 1.4% (or $35.4 million) in 2019/20, a more modest increase than the 5.1% growth observed in 2018/19, though results varied among individual plans.
- Modifications to the OHIP+ program had a significant impact on the growth in dispensing costs, pulling costs down by 2.3% ($56.3 million) nationally and by 4.1% in Ontario.
- An increase in the number of active beneficiaries pushed overall costs up by 2.7% in 2019/20 as a result of demographic changes in British Columbia.
- Changes in prescription size and the volume of units dispensed to patients pushed costs upward by 2.3%, while there was no change in the overall average dispensing fee per prescription.
Introduction
Canadian public drug plan expenditures represent a significant portion of the overall healthcare budget. The Canadian Institute for Health Information (CIHI) estimated the total cost of prescription drugs in Canada to be $34.3 billion in 2019, with the largest component financed by the public drug plans (43.6%) and the remainder paid by private plans (36.9%) or out of pocket by households and individuals (19.9%).Reference 1
CompassRx is an annual PMPRB publication that explores trends in prescription drug expenditures in Canadian public drug plans. It focuses on the pressures that contribute to the annual change in drug and dispensing costs, including the switch in use between lower- and higher-priced drugs and changes in the beneficiary population, drug prices, and the volume of drugs used, as well as other key factors.
This edition of the report focuses on the 2019/20 fiscal year, with a retrospective look at recent trends. The results of this study aid stakeholders in anticipating and responding to the evolving cost pressures that affect Canada’s public drug plans.
The analysis focuses on the public drug plans participating in the National Prescription Drug Utilization Information System (NPDUIS) initiative, which includes all provincial public plans (with the exception of Quebec), Yukon, and the Non-Insured Health Benefits (NIHB) Program. These plans account for approximately one third of the total annual spending on prescription drugs in Canada.
Each public drug plan reimburses eligible beneficiaries according to its own specific plan design and implements policies related to the reimbursement of drug prices and dispensing fees. Summaries of the plan designs and policies are available on the PMPRB website.
Health Canada, the PMPRB, and the Canadian Agency for Drugs and Technologies in Health (CADTH) are responsible for drug approvals, price reviews, and health technology assessments, respectively. Details of the 2019/20 approvals and reviews are provided in Appendix A of this report.
Methods
The main data source for this report is the National Prescription Drug Utilization Information System (NPDUIS) Database, developed by the Canadian Institute for Health Information (CIHI). This database houses pan-Canadian information on public drug programs, including anonymous claims-level data collected from the plans that participate in the NPDUIS initiative. Data is reported on a fiscal year basis.
Results are presented for the following public drug plans: British Columbia, Alberta, Saskatchewan, Manitoba, Ontario, New Brunswick, Nova Scotia, Prince Edward Island, Newfoundland and Labrador, Yukon, and the Non-Insured Health Benefits (NIHB) Program.
The analysis focuses exclusively on data for beneficiaries that met their deductible and received public reimbursement. Results reported for Saskatchewan and Manitoba include the accepted prescription drug expenditures for individuals who are eligible for coverage but have not submitted an application and, therefore, do not have a defined deductible. Results reported for New Brunswick include the number of active beneficiaries enrolled in the Medavie Blue Cross Seniors’ Prescription Drug Program and their related drug expenditures, which are offset by monthly premiums.
In Ontario, long-term care (LTC) prescriptions were separated out from the dispensing costs analysis, as their dispensing patterns may differ from those of the general beneficiary population.
In British Columbia, claims for the NIHB were included in national totals but excluded from the analysis where the NIHB is reported individually as data from the First Nation Health Authority (FNHA) in British Columbia was unavailable. Unlike most NPDUIS public drug plans, the NIHB program covers a significant range of medical supplies and equipment (MS&E). Cost growth results excluding MS&E claims are provided in Appendix C.
The analysis of drug and dispensing cost drivers follows the methodological approach detailed in the PMPRB’s The Drivers of Prescription Drug Expenditures: A Methodological Report.Reference 2 Drug costs include any associated markups. Analyses of the average prescription size, as well as pricing, are limited to oral solids to avoid data reporting inconsistencies that may exist in the days’ supply and unit reporting of other formulations. Anatomical Therapeutic Chemical (ATC) levels reported here are based on CIHI NPDUIS data and reflect the ATC classification system maintained by the World Health Organization Collaborating Centre for Drug Statistics Methodology. Vaccines and pharmacy services are not represented in this report.
In this edition, the multi-source generics market segment was redefined as multi-source non-patented medicines, which captures not only generics and their reference brand-name drugs, but also biosimilars and their originator biologics. Multiple-source generics are presented as a sub-segment of the multi-source non-patented segment where required.
The methodological approach used in CompassRx is reviewed on an annual basis and updated as needed to respond to changes in the pharmaceutical landscape and data access. Thus, the scope of the report and the data analyzed may vary slightly from year to year. New changes to the methodology are detailed in Methods and Limitations sections of each edition.
A glossary of terms for NPDUIS studies is available on the PMPRB website.
Limitations
Expenditure and utilization levels vary widely among the jurisdictions and cross comparisons of the results are limited by differences in the plan designs and policies of the individual public drug plans, as well as the demographic and disease profiles of the beneficiary populations.
For example, public drug plans in British Columbia, Saskatchewan, and Manitoba provide universal income-based coverage, while other provincial public drug plans offer specific programs for seniors, income assistance recipients, and other select patient groups, and the NIHB provides universal care to its entire population. As Yukon is a small jurisdiction, any plan design changes will result in more significant fluctuations in their rates of growth.
The NPDUIS Database includes select sub-plan data specific to particular jurisdictions, such as Alberta, Nova Scotia, and Prince Edward Island. This further limits the comparability of results across plans. A comprehensive summary of the sub-plans available in the database, along with their eligibility criteria, is available on the PMPRB website.
Drug claims for beneficiaries in Ontario who also have coverage through the NIHB are primarily reimbursed by the Ontario Drug Benefit program, with any remaining drug costs covered by the NIHB. Therefore, claims reported for the NIHB include those coordinated with the Ontario Drug Benefit program.
Totals for the NPDUIS public drug plans are heavily skewed toward Ontario due to its size, and as such, the introduction and subsequent revision of the OHIP+ program for Ontario residents age 24 years or younger had a notable influence on the overall trends for 2018/19 and 2019/20.
High-cost medicines are defined as having an annual treatment cost greater than $10,000. If medicines reach this threshold in any given year, they are included in the count for all other years. Thus, the number and composition of high-cost medicines in any given year may vary depending on the time of analysis.
Drug costs reported are the amounts accepted toward reimbursement by the public plans, which may not reflect the amounts paid by the plan/program and do not reflect off-invoice price rebates or price reductions resulting from confidential product listing agreements.
The prescription drug expenditure data for the public drug plans reported in this study represents only one segment of the Canadian pharmaceutical market, and hence, the findings should not be extrapolated to the overall marketplace.
This edition of CompassRx reports on data up to and including the 2019/20 fiscal year. Any plan changes or other developments that have taken place since then will be captured in future editions.
1. Trends in Prescription Drug Expenditures, 2014/15 to 2019/20
Prescription drug expenditures for public plans increased by 3.7% in 2019/20. High-cost patented medicines (other than DAAs for hepatitis C) continued to be the most significant contributor to the growth in public plan drug costs, offset in part by a decline in the use of new hepatitis C drugs as well as changes to the eligibility requirements for Ontario’s OHIP+ program.
Brief Insights: Drug Plan Designs
The expenditure and utilization levels reported in this study depend on the specific plan design and policies of each jurisdiction, as well as the demographic and disease profiles of the beneficiary population. This affects the comparability of results across plans.
Changes in plan designs or policies can have a significant effect on trends in any given year. For instance, British Columbia lowered its income threshold for beneficiaries of the Fair Pharmacare program in January 2019 and Ontario made significant changes to the eligibility requirements for OHIP+ in April of the same year. Both of these changes had notable impacts on expenditures for the 2019/20 fiscal year.
Supplementary reference documents providing information on individual public drug plan designs, policies governing markups and dispensing fees, and a glossary of terms are available on the PMPRB website.
Prescription Drug Expenditures = Drug Costs (80%) + Dispensing Costs (20%)
Between 2014/15 and 2019/20, annual prescription drug expenditures for the public drug plans grew at a compound annual growth rate of 5.5%, rising from $9.4 billion to $12.5 billion, with $1.1 billion of this growth seen over the last two years (Figure 1.1).
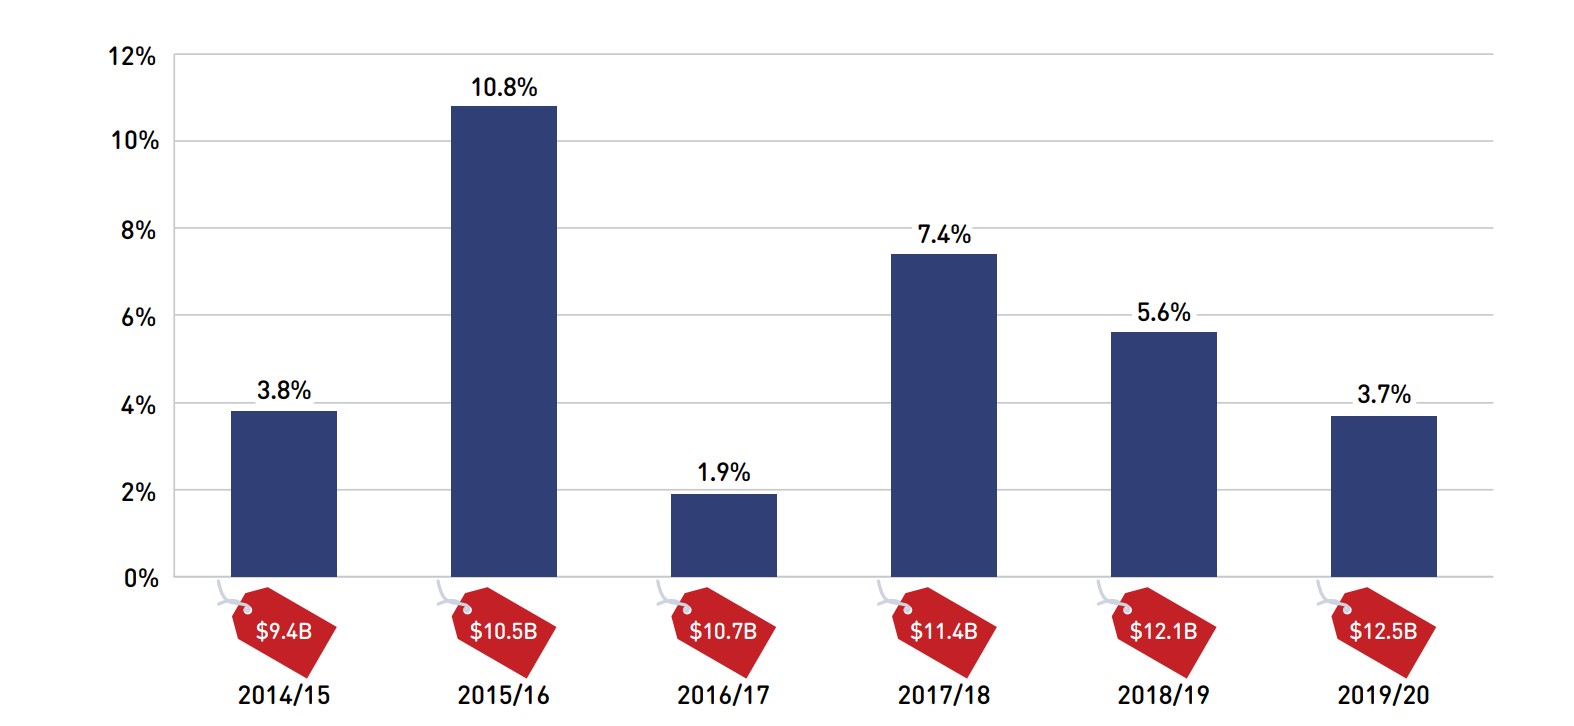
Figure description
This column graph shows the trend in the annual rates of change for prescription drug expenditures from 2014/15 to 2019/20. Price tags below each bar show the annual prescription drug cost in billions of dollars.
| 2014/15 | 2015/16 | 2016/17 | 2017/18 | 2018/19 | 2019/20 | |
|---|---|---|---|---|---|---|
Rate of change |
3.8% |
10.8% |
1.9% |
7.4% |
5.6% |
3.7% |
Prescription drug expenditure (billions of dollars) |
$9.4 |
$10.5 |
$10.7 |
$11.4 |
$12.1 |
$12.5 |
Note: This analysis only includes data for beneficiaries that met their deductible and received public reimbursement.
* British Columbia, Alberta, Saskatchewan, Manitoba, Ontario, New Brunswick, Nova Scotia, Prince Edward Island, Newfoundland and Labrador, Yukon, and the Non-Insured Health Benefits Program.
Data source: National Prescription Drug Utilization Information System Database, Canadian Institute for Health Information.
The prescription drug expenditures reported in this section represent the total amounts accepted for reimbursement by the NPDUIS public drug plans, including drug costs (with any associated markups) and dispensing costs. The overall growth in expenditures in 2019/20 consists of a 4.3% growth in drug costs and a 1.4% increase in dispensing costs. Due to the disparity in their rates of growth, the drug cost component continued to capture a greater share of overall expenditures (80.3%), while the dispensing costs share dropped slightly below 20% (19.7%) (Figure 1.2).
These amounts reflect both the plan-paid portions of prescription costs as well as the beneficiary-paid portions, such as co-payments and deductibles.
In 2019/20, public plans paid an average of 87% of the total expenditures for prescription drugs that were eligible for reimbursement, with the remainder paid by the beneficiaries either out of pocket or through a third-party private insurer. The beneficiary-paid share varied across jurisdictions, ranging from 9% to 34%.
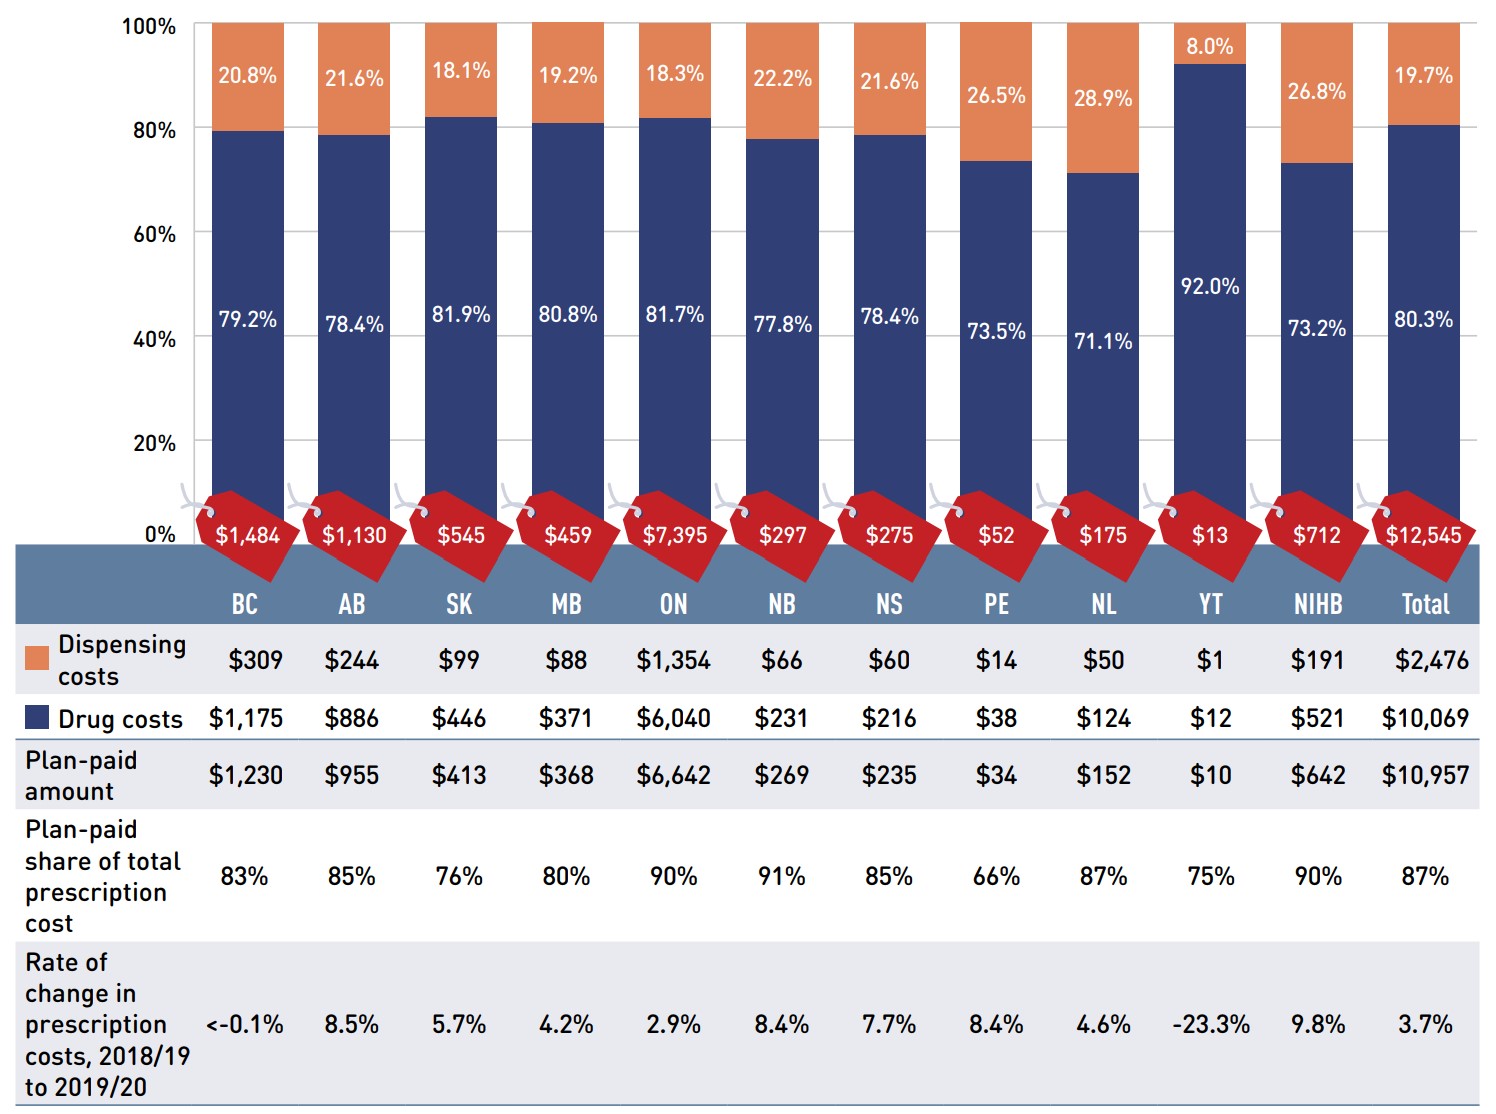
Figure description
This stacked column graph shows the total prescription drug expenditure in 2019/20 for each NPDUIS public drug plan broken out by percent shares of drug costs and dispensing costs, along with the total costs across all plans. A table below provides absolute values for the drug and dispensing costs in millions of dollars, as well as the plan-paid shares of the total prescription costs and the rate of change since 2018/19.
| British Columbia | Alberta | Saskatchewan | Manitoba | Ontario | New Brunswick | Nova Scotia | Prince Edward Island | Newfoundland and Labrador | Yukon | Non-Insured Health Benefits | Total | |
|---|---|---|---|---|---|---|---|---|---|---|---|---|
Total prescription cost (millions of dollars) |
$1,484 |
$1,130 |
$545 |
$459 |
$7,395 |
$297 |
$275 |
$52 |
$175 |
$13 |
$712 |
$12,545 |
Dispensing cost share |
20.8% |
21.6% |
18.1% |
19.2% |
18.3% |
22.2% |
21.6% |
26.5% |
28.9% |
8.0% |
26.8% |
19.7% |
Drug cost share |
79.2% |
78.4% |
81.9% |
80.8% |
81.7% |
77.8% |
78.4% |
73.5% |
71.1% |
92.0% |
73.2% |
80.3% |
Dispensing costs (millions of dollars) |
$309 |
$244 |
$99 |
$88 |
$1,354 |
$66 |
$60 |
$14 |
$50 |
$1 |
$191 |
$2,476 |
Drug costs (millions of dollars) |
$1,175 |
$886 |
$446 |
$371 |
$6,040 |
$231 |
$216 |
$38 |
$124 |
$12 |
$521 |
$10,069 |
Plan-paid amount (millions of dollars) |
$1,230 |
$955 |
$413 |
$368 |
$6,642 |
$269 |
$235 |
$34 |
$152 |
$10 |
$642 |
$10,957 |
Plan-paid share of total prescription cost |
83% |
85% |
76% |
80% |
90% |
91% |
85% |
66% |
87% |
75% |
90% |
87% |
Rate of change in prescription costs, 2018/19 to 2019/20 |
<-0.1% |
8.5% |
5.7% |
4.2% |
2.9% |
8.4% |
7.7% |
8.4% |
4.6% |
-23.3% |
9.8% |
3.7% |
Note: This analysis only includes data for beneficiaries that met their deductible and received public reimbursement. Markup amounts are captured in the drug costs. Values may not add to totals due to rounding.
Data source: National Prescription Drug Utilization Information System Database, Canadian Institute for Health Information.
The annual growth in prescription expenditures is a function of increases in the number of active beneficiaries and their drug costs. While the size of the beneficiary population in most jurisdictions remained somewhat stable in 2019/20, the overall NPDUIS public plan beneficiary population declined by 13.1%, mainly due to a 22.0% decrease in Ontario following the revision of eligibility requirements for the OHIP+ program. For more details on this change, see the program summary at the end of this section.
In 2019/20, almost 7 million active beneficiaries filled approximately 300 million prescriptions that were accepted towards a deductible or paid for (in full or in part) by the NPDUIS public drug plans. The distribution of beneficiaries by senior and non-senior populations has been impacted by changes in the number of patients covered under the OHIP+ program over recent years. As the number of beneficiaries age 24 and under in Ontario decreased in 2019/20, seniors once again made up the majority (55%) of the total active beneficiaries, though this share varied greatly across jurisdictions as a result of differences in plan design, eligibility, and the demographics of the beneficiary population (Figure 1.3).

Figure description
This stacked column graph shows the percent share of utilization in senior and non-senior populations for each of the NPDUIS public drug plans in 2019/20, along with the totals across all plans. A table below gives the number of active beneficiaries in thousands, the change in beneficiary population from 2018/19 to 2019/20, the number of active beneficiaries as share of the population, and the total number of prescriptions, in millions.
| British Columbia | Alberta | Saskatchewan | Manitoba | Ontario | New Brunswick | Nova Scotia | Prince Edward Island | Newfoundland and Labrador | Yukon | Non-Insured Health Benefits | Total | |
|---|---|---|---|---|---|---|---|---|---|---|---|---|
Seniors |
45.0% |
82.9% |
42.9% |
39.6% |
59.2% |
62.8% |
88.7% |
60.0% |
53.5% |
74.6% |
9.4% |
55.1% |
Non-seniors |
55.0% |
17.1% |
57.1% |
60.4% |
40.8% |
37.2% |
11.3% |
40.0% |
46.5% |
25.4% |
90.6% |
44.9% |
Beneficiaries (thousands) |
809.7 |
649.8 |
279.8 |
137.9 |
4,019.0 |
132.3 |
146.0 |
46.9 |
102.3 |
5.2 |
561.3 |
6,912.6 |
Percent change in the beneficiary population from 2018/19 to 2019/20 |
6.5% |
4.0% |
0.0% |
0.3% |
-22.0% |
1.6% |
2.3% |
3.5% |
0.2% |
-7.5% |
4.1% |
-13.1% |
Beneficiary share of population |
15.8% |
14.8% |
23.7% |
10.0% |
27.4% |
17.0% |
15.0% |
29.6% |
19.5% |
12.5% |
65.6% |
22.9% |
Total number of prescriptions (millions) |
43.5 |
17.3 |
8.9 |
10.7 |
181.8 |
6.3 |
5.1 |
1.2 |
4.1 |
0.1 |
20.8 |
299.9 |
Note: This analysis only includes data for beneficiaries that met their deductible and received public reimbursement. Not all of the sub-plan data for the jurisdictions is reported to NPDUIS, which may impact the distribution of senior and non-senior shares.
Data source: National Prescription Drug Utilization Information System Database, Canadian Institute for Health Information; Statistics Canada, CANSIM Table 051-0005; Non-Insured Health Benefits Program Annual Report, 2018/19.
Prescription Drug Expenditures = Drug Costs (80%) + Dispensing Costs (20%)
Drug costs, including markups, represent the largest component of prescription drug expenditures and have the greatest influence on overall trends. Following an increase of 5.8% in 2018/19, drug costs rose by an additional 4.3% in 2019/20. The average rate of change over the last three years was 6.1% across the public plans.
Figure 1.4 reports the annual rate of change in drug costs for each NPDUIS drug plan from 2017/18 to 2019/20. Many plans experienced positive rates of change in 2019/20, ranging from 4.1% in Manitoba and Ontario to 9.9% in New Brunswick. Drug costs in British Columbia and Yukon declined by 1.4% and 24.9% respectively.
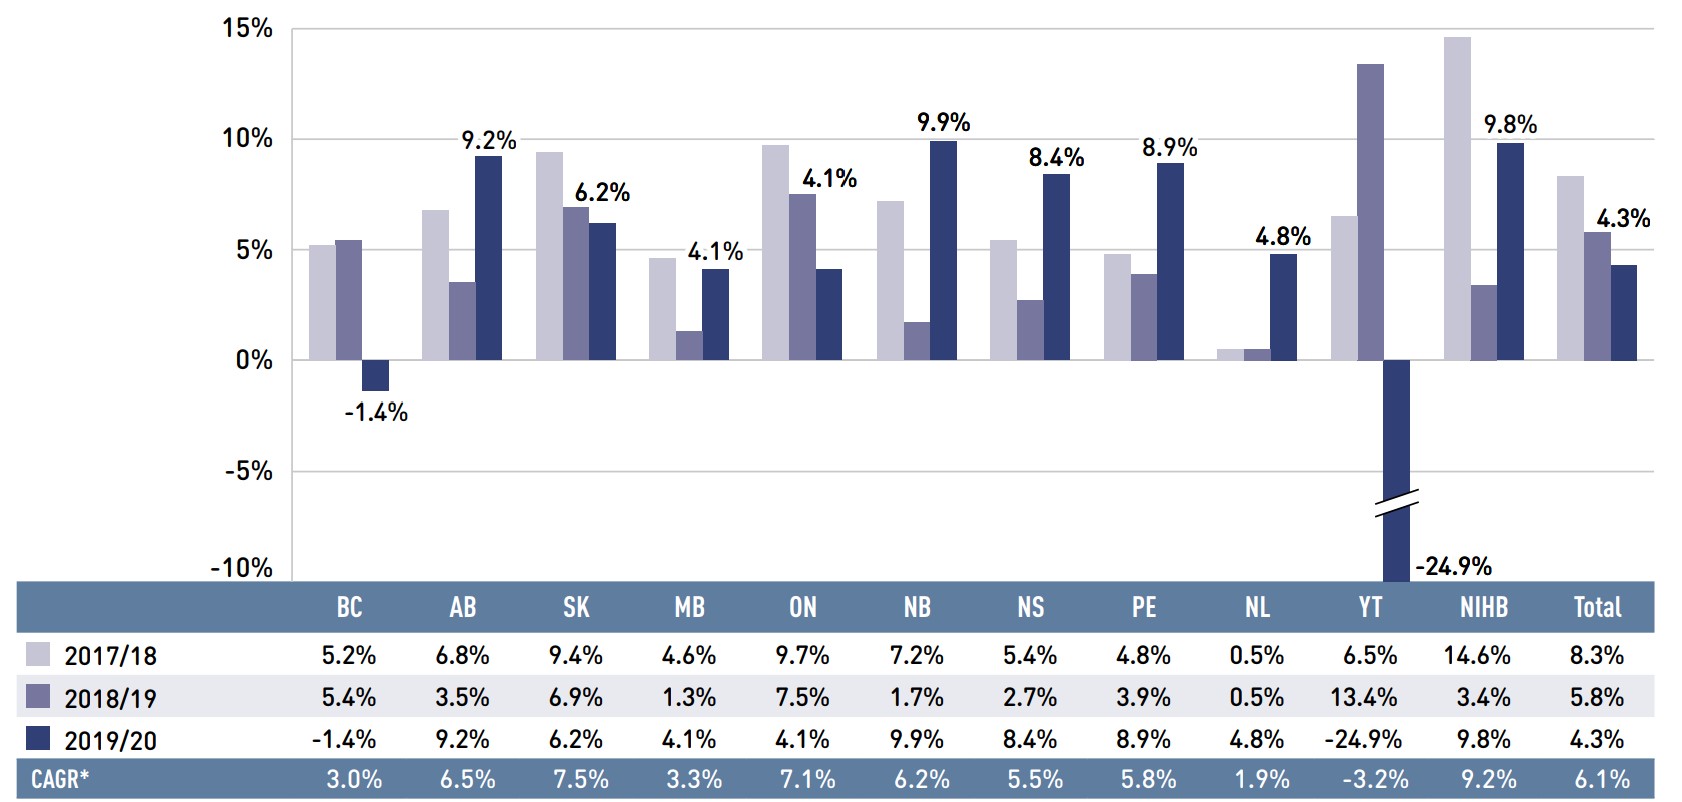
Figure description
This column graph illustrates the trend in annual rates of change in drug costs from 2017/18 to 2019/20 for each of the NPDUIS drug plans. Total annual results for all plans are included. The compound annual growth rates for the period are given in a table below the graph.
| British Columbia | Alberta | Saskatchewan | Manitoba | Ontario | New Brunswick | Nova Scotia | Prince Edward Island | Newfoundland and Labrador | Yukon | Non-Insured Health Benefits | Total | |
|---|---|---|---|---|---|---|---|---|---|---|---|---|
2017/18 |
5.2% |
6.8% |
9.4% |
4.6% |
9.7% |
7.2% |
5.4% |
4.8% |
0.5% |
6.5% |
14.6% |
8.3% |
2018/19 |
5.4% |
3.5% |
6.9% |
1.3% |
7.5% |
1.7% |
2.7% |
3.9% |
0.5% |
13.4% |
3.4% |
5.8% |
2019/20 |
-1.4% |
9.2% |
6.2% |
4.1% |
4.1% |
9.9% |
8.4% |
8.9% |
4.8% |
-24.9% |
9.8% |
4.3% |
Compound annual growth rate |
3.0% |
6.5% |
7.5% |
3.3% |
7.1% |
6.2% |
5.5% |
5.8% |
1.9% |
-3.2% |
9.2% |
6.1% |
Note: This analysis only includes data for beneficiaries that met their deductible and received public reimbursement.
* Compound annual growth rate.
Data source: National Prescription Drug Utilization Information System Database, Canadian Institute for Health Information.
Figure 1.5 breaks down the annual rate of change in drug costs from 2018/19 to 2019/20 by market segment (bar chart) and gives the corresponding market share in 2019/20 for each (pie chart). These results provide a snapshot of how the distribution of sales across market segments has shifted over the last year. As the market status of a medicine is dynamic, the medicines contributing to any one segment may differ from year to year.
Patented medicines represent the largest segment of the market, capturing 57.5% of public plan drug costs in 2019/20. Since 2018/19, some of the top-selling patented medicines in Canada have shifted from the patented market segment to either the single-source or multi-source non-patented segments. In addition, costs for direct-acting antivirals (DAAs) for hepatitis C decreased by 5.6% in 2019/20, reflecting a decline in the use of these medicines. Despite these pulls, the patented market segment still increased slightly by 0.2%, driven mainly by the use of high-cost medicines—those with an average annual cost per beneficiary greater than $10,000, other than DAAs—which grew by a considerable 10.8%.
The single-source non-patented market experienced substantial 94.0% growth in 2019/20 as a handful of commonly used medicines changed patent status. The anti-VEGF biologic medicine Lucentis (ranibizumab) and the diabetes treatment Tresiba (insulin degludec) both moved from the patented market to the single-source non-patented market over the course of 2018/19, becoming the top medicines in the segment in 2019/20 with over $272 million in sales. The high rate of increase among single-source non-patented medicines had a limited impact on the overall growth given their relatively small share of total drug costs (9.7%).
Costs for multi-source non-patented medicines, which include generics and their reference brand-name drugs as well as biosimilars and their originator biologics, increased by 1.2% in 2019/20, now accounting for 28.8% of drug costs. This segment can be broken out into two distinct sub-segments: multi-source generic medicines made up 17.5% ($1,753 million) of drug costs in 2019/20 but had nearly no growth, while the remaining medicines, consisting mainly of off-patent biologics and biosimilars, grew by 3.1% to reach 11.4% ($1,148 million) of drug costs. Multi-source non-patented biologics are expected to be an important group of medicines to monitor in future years as biosimilars gain traction in the public plans.

Figure description
This graph consists of two parts: a horizontal bar chart on the left breaks down the annual rate of change in drug costs between 2018/19 and 2019/20 by market segment and a pie chart on the right displays the market share of the total drug cost for each segment. Both represent the combined totals for NPDUIS public drug plans.
The bar chart is divided into three parts. The first gives the annual rate of change for all drugs; the second displays the growth rates for the three main market segments; and the third focuses on the patented medicine segment. Results indicate whether they include or exclude the direct-acting antiviral (DAA) drugs for the treatment of hepatitis C. High-cost drugs have an annual treatment cost greater than $10,000 and include both biologics and non-biologics. Total drug costs for each segment in 2019/20 are also given.
Annual rates of change
| Rate of change in drug costs from 2018/19 to 2019/20 | Total drug costs in 2019/20, in millions of dollars | |
|---|---|---|
All drugs |
4.3% |
$10,061 |
All drugs excluding DAA drugs |
5.9% |
$9,518 |
Market segments |
||
Patented |
0.2% |
$5,790 |
Patented excluding DAA drugs |
2.9% |
$5,247 |
Multi-source non-patented |
1.2% |
$2,901 |
Single-source non-patented |
94.0% |
$972 |
Patented medicines |
||
High-cost drugs‡ excluding DAA drugs |
10.8% |
$2,997 |
DAA drugs |
-5.6% |
$542 |
Biologics |
-5.9% |
$1,804 |
Non-biologics excluding DAA drugs |
7.3% |
$3,443 |
Share of drug cost
| Market segment | Share of drug cost |
|---|---|
Patented† |
57.5% |
Multi-source non-patented: generic |
17.5% |
Multi-source non-patented: non-generic |
11.4% |
Single-source non-patented |
9.7% |
Other§ |
4.0% |
Note: This analysis only includes data for beneficiaries that met their deductible and received public reimbursement.
DAA drugs are direct-acting antivirals used in the treatment of hepatitis C.
A glossary of terms with information on each of the market segments is available on the PMPRB website.
* British Columbia, Alberta, Saskatchewan, Manitoba, Ontario, New Brunswick, Nova Scotia, Prince Edward Island, Newfoundland and Labrador, Yukon, and the Non-Insured Health Benefits Program.
† The patented medicines market segment includes all medicines that had patent protection in the period of study, whether or not the patent expired during that period. As such, the rate of growth does not reflect the loss of patent exclusivity for medicines over the course of the fiscal year.
‡ High-cost drugs have an average annual treatment cost greater than $10,000 and include both biologics and non-biologics.
§ This market segment includes devices, compounded drugs, and other products that are reimbursed by public drug plans but do not have a Health Canada assigned Drug Identification Number (DIN).
Data source: National Prescription Drug Utilization Information System Database, Canadian Institute for Health Information.
Prescription Drug Expenditures = Drug Costs (80%) + Dispensing Costs (20%)
Dispensing costs make up an important part of prescription drug expenditures. Overall, dispensing costs in the NPDUIS public plans grew modestly by 1.4% in 2019/20, for a compound annual growth rate of 3.4% over the last three years. Figure 1.6 reports the annual rate of change in dispensing costs for each NPDUIS drug plan from 2017/18 to 2019/20. Jurisdictional variations may be due to changes in dispensing fee policies and plan designs, as well as changes in the number of prescriptions and their size, among other factors.
Brief Insights: Dispensing Fees
Ontario was the only public plan to launch notable changes regarding pharmacy services and fees in 2019/20. A new long-term care (LTC) capitation funding model was implemented, including a shift in the payment model for professional pharmacy services (dispensing fee and professional pharmacy services) for LTC homes from fee-for-service to a fixed per-patient amount. As such, ODB-eligible prescription claims submitted for residents of LTC homes reflect a zero-dollar dispensing fee.
A summary of dispensing fee policies for each of the public drug plans is available on the PMPRB website.
Beginning March/April 2020, most NPDUIS public drug plans introduced temporary changes to policies associated with dispensing frequency during the COVID-19 pandemic. These changes will be reflected in future editions of CompassRx.
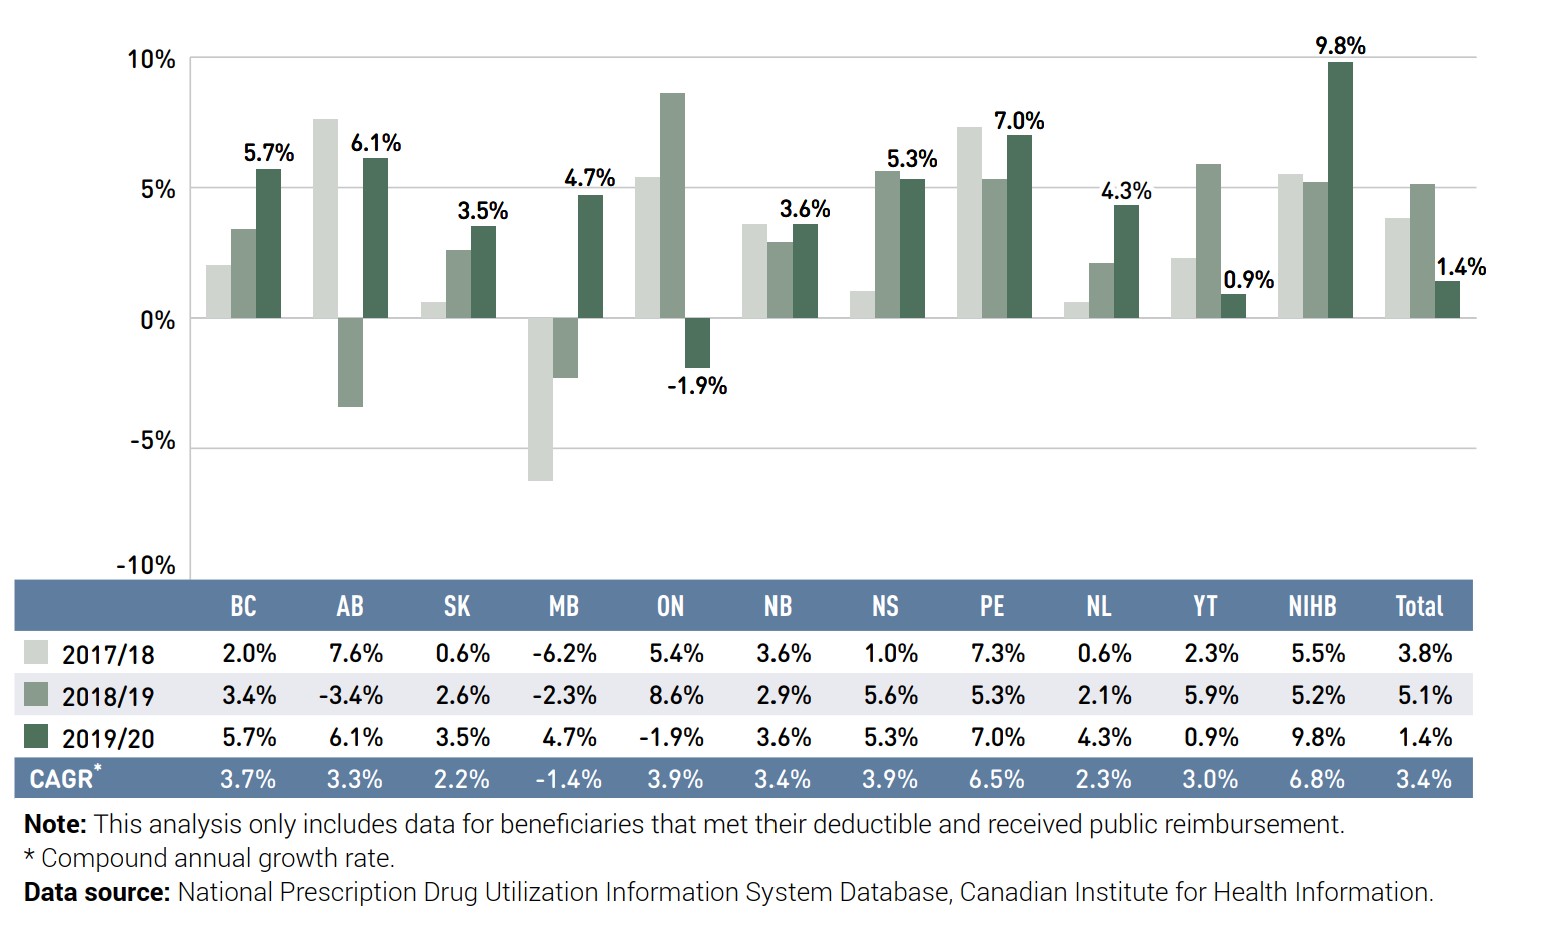
Figure description
This column graph illustrates the trend in annual rates of change for dispensing costs from 2017/18 to 2019/20 for each of the NPDUIS public drug plans. Total annual results for all plans are included. Compound annual growth rates for the period are given in a table below.
| British Columbia | Alberta | Saskatchewan | Manitoba | Ontario | New Brunswick | Nova Scotia | Prince Edward Island | Newfoundland and Labrador | Yukon | Non-Insured Health Benefits | Total | |
|---|---|---|---|---|---|---|---|---|---|---|---|---|
2017/18 |
2.0% |
7.6% |
0.6% |
-6.2% |
5.4% |
3.6% |
1.0% |
7.3% |
0.6% |
2.3% |
5.5% |
3.8% |
2018/19 |
3.4% |
-3.4% |
2.6% |
-2.3% |
8.6% |
2.9% |
5.6% |
5.3% |
2.1% |
5.9% |
5.2% |
5.1% |
2019/20 |
5.7% |
6.1% |
3.5% |
4.7% |
-1.9% |
3.6% |
5.3% |
7.0% |
4.3% |
0.9% |
9.8% |
1.4% |
Compound annual growth rate |
3.7% |
3.3% |
2.2% |
-1.4% |
3.9% |
3.4% |
3.9% |
6.5% |
2.3% |
3.0% |
6.8% |
3.4% |
Note: This analysis only includes data for beneficiaries that met their deductible and received public reimbursement.
* Compound annual growth rate.
Data source: National Prescription Drug Utilization Information System Database, Canadian Institute for Health Information.
As dispensing costs have grown at a slower rate than drug costs over the last three years, their share of overall prescription drug expenditures has declined slightly from 20.2% in 2018/19 to 19.7% in 2019/20.
Figure 1.7 depicts the trend in the dispensing cost share of total prescription expenditures for each NPDUIS drug plan from 2017/18 to 2019/20.
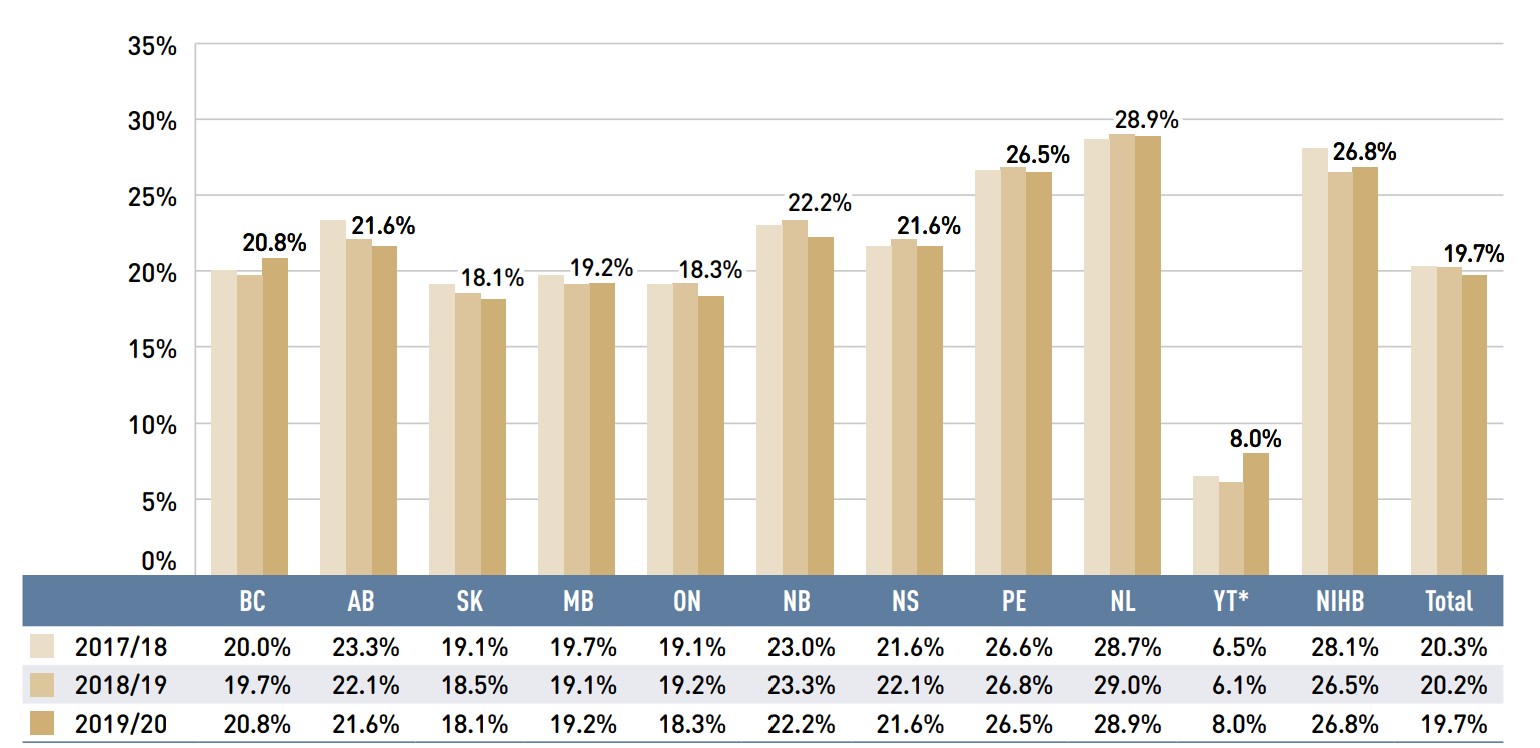
Figure description
This column graph shows the trend in annual dispensing costs as a share of the total prescription expenditures from 2017/18 to 2019/20 for each of the NPDUIS public drug plans. Total annual results for all plans are included.
| British Columbia | Alberta | Saskatchewan | Manitoba | Ontario | New Brunswick | Nova Scotia | Prince Edward Island | Newfoundland and Labrador | Yukon* | Non-Insured Health Benefits | Total | |
|---|---|---|---|---|---|---|---|---|---|---|---|---|
2017/18 |
20.0% |
23.3% |
19.1% |
19.7% |
19.1% |
23.0% |
21.6% |
26.6% |
28.7% |
6.5% |
28.1% |
20.3% |
2018/19 |
19.7% |
22.1% |
18.5% |
19.1% |
19.2% |
23.3% |
22.1% |
26.8% |
29.0% |
6.1% |
26.5% |
20.2% |
2019/20 |
20.8% |
21.6% |
18.1% |
19.2% |
18.3% |
22.2% |
21.6% |
26.5% |
28.9% |
8.0% |
26.8% |
19.7% |
Note: This analysis only includes data for beneficiaries that met their deductible and received public reimbursement.
* Yukon allows for markups of up to 30%; as such, dispensing costs account for a smaller share of their total expenditures.
Data source: National Prescription Drug Utilization Information System Database, Canadian Institute for Health Information.
Brief Insights: OHIP+
On January 1, 2018, the Ontario government introduced the OHIP+ program, which offered prescription drug coverage to all children and youth age 24 and younger, regardless of family income. The program was subsequently redesigned to focus exclusively on children and youth without private coverage, starting April 1, 2019.
For the 2019/20 period, the significant impact of the OHIP+ program design change extended not only to results for Ontario, but also to the total drug expenditures for all NPDUIS public drug plans, given Ontario’s relative size. These effects were assessed by measuring the difference between inclusion and exclusion of the program.
- The prescription drug expenditure of the OHIP+ program fell from $658 million in 2018/19 to $313 million in 2019/20. Despite this drop, the program accounted for a sizable 4.2% of the total expenditures for Ontario and 2.5% of all expenditures for the NPDUIS public drug plans over the entire fiscal year.
- Nearly 1 million active beneficiaries filled more than five and a half million prescriptions accepted for reimbursement by the OHIP+ program in 2019/20, less than half the totals seen in 2018/19. Without this downward pull from OHIP+, the overall beneficiary population would have increased by 2.9% in Ontario and 3.1% in all NPDUIS public plans, compared to the 22.0% and 13.1% decreases reported in Figure 1.3.
- The change in design of the OHIP+ program resulted in a decrease in the share of the non-senior beneficiary population in the Ontario public drug plan from 55% to 41%.
- Had OHIP+ been excluded from the analysis, total prescription drug expenditures would have risen more significantly by 8.5% in Ontario and 7.0% in all NPDUIS public drug plans in 2019/20, in contrast to the actual growth rates of 2.9% and 3.7%, respectively. Using the same scenario, drug costs in Ontario would have risen by 10.0%, compared to the actual rate of 4.1%, while the drug cost growth in all NPDUIS public drug plans would have been 7.8% instead of 4.3%.
2. The Drivers of Drug Costs, 2018/19 to 2019/20
Drug cost increases in the NPDUIS public plans in 2019/20 were characterized by a decrease in the use of DAA drugs and a continued rise in the use of other higher-cost medicines. Growth in the number of active beneficiaries and their utilization patterns added to the push on drug costs while plan design changes in Ontario pulled costs down, resulting in an overall increase of 4.3%.
In this section, a comprehensive cost driver analysis is used to determine how much public plan drug costs would have changed between 2018/19 and 2019/20 if only one factor (e.g., the price of drugs) was considered while all the others remained the same.Footnote i
Changes in drug costs are driven by a number of “push” and “pull” effects. The net effect of these opposing forces yields the overall rate of change.
Price change effect: Changes in the prices of both brand-name and generic drugs, determined at the molecule, strength, and form level.
Substitution effect: Shifts from brand-name to generic drugs, as well as shifts to biosimilar use.
Demographic effect: Changes in the number of active beneficiaries, as well as shifts in the distribution of age or gender.
Volume effect: Changes in the number of prescriptions dispensed to patients, the average number of units of a drug dispensed per prescription, and/or shifts in the use of various strengths or forms of a medicine.
Drug-mix effect: Shifts in use between lower- and higher-cost drugs, including those entering, exiting, or remaining in the market during the time period analyzed.
In addition to the standard annual effects, Ontario's OHIP+ program is treated as a separate factor in the cost driver analysis, encompassing all effects associated with the program (e.g., volume and demographic changes). As such, the OHIP+ effect isolates the overall impact from plan design changes.
Figure 2.1 provides insight into the pressures driving the rates of change in drug costs from 2014/15 to 2019/20.
Annual changes in the patient population and the volume of drugs used generally exert a slight to moderate upward pressure on drug costs. Over the past two years, these costs have been significantly impacted by the addition and subsequent redesign of the OHIP+ program in Ontario. In 2019/20, Ontario revised the program by omitting residents age 24 and younger who were already covered by private insurance, which resulted in a pull-down effect of 3.0% on total drug costs for the NPDUIS public plans. The demographic effect, which excludes the effects of OHIP+, contributed 3.0% to the rise on costs in 2019/20. In comparison with its 1.0% impact the year before, this rate of change indicates a more pronounced growth in the number of active beneficiaries over the past year. Following a slight decrease in 2018/19, the volume effect returned to a steady contribution to growth of 1.3% in 2019/20.
The most pronounced upward push on costs can be attributed to the use of higher-cost medicines (other than DAAs for hepatitis C), which contributed a consistent 4% to 5% to annual growth between 2014/15 to 2017/18 and an average of 6% over the past two years. The use of DAAs, however, decreased in 2019/20, pulling drug costs down by 1.6%. The combined effects of DAAs and other higher-cost drugs still added a sizable 4.2% upward pressure on drug costs in NPDUIS public plans.
Counterbalancing these upward cost pressures, generic and biosimilar substitutions and price reductions generally exert a downward pull on costs. The magnitude of these effects can vary from year to year depending on the timing of generic and biosimilar market entries and the implementation of policies lowering generic prices. In 2019/20, the pull-down effect from substitutions and price reductions diminished from a combined rate of 6.2% in 2018/19 to a historical low of 1.1%.
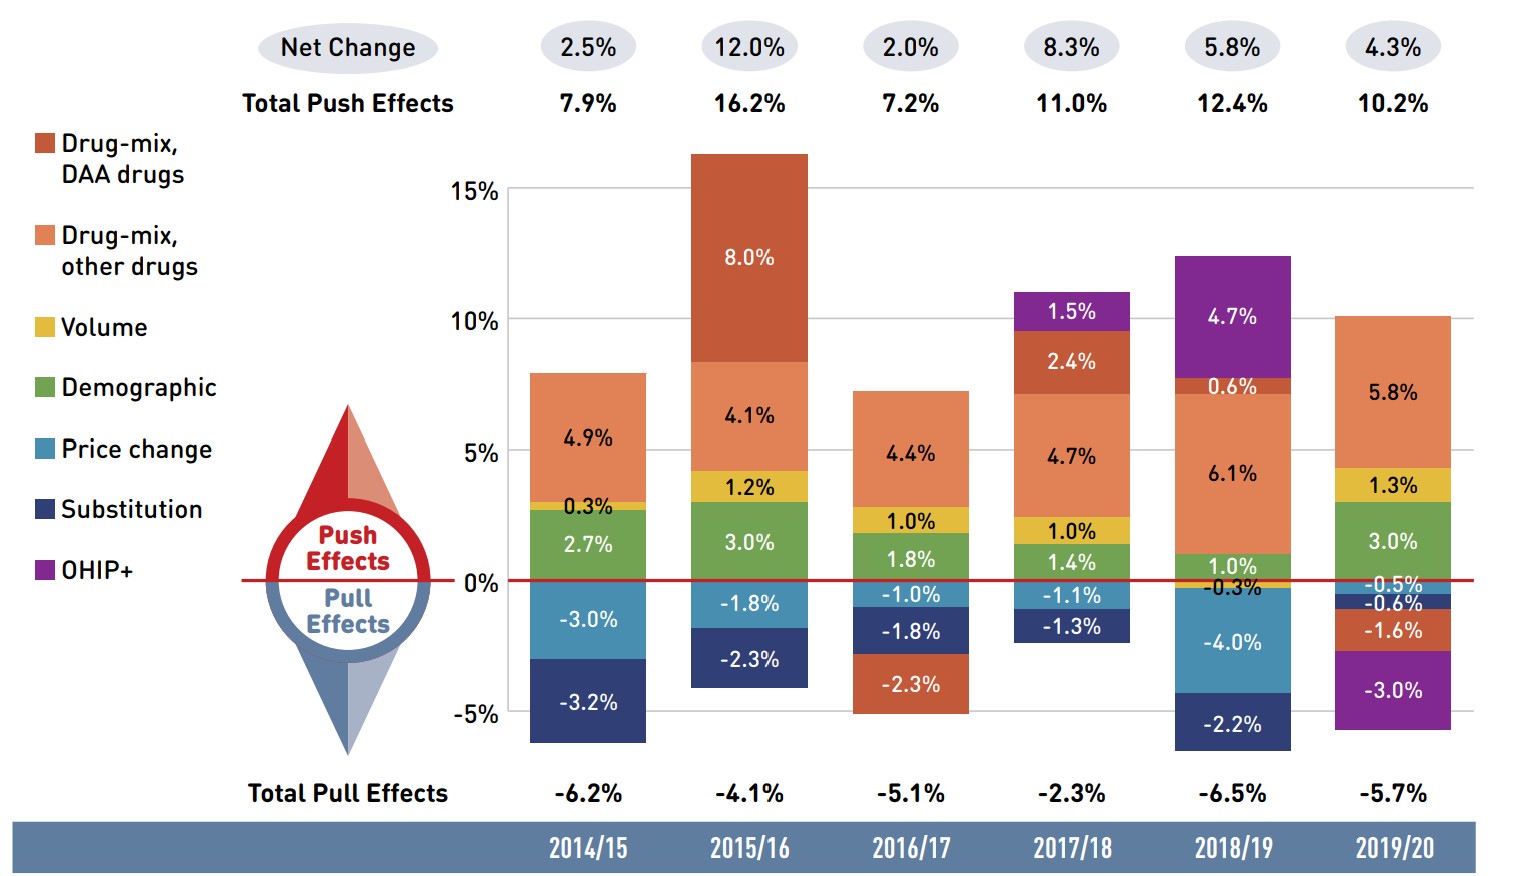
Figure description
This column graph describes the key factors or effects that impacted the rates of change in drug costs across all NPDUIS public drug plans for each year from 2014/15 to 2019/20. Each column is broken out to give the positive or negative contribution of each effect: drug-mix; volume; demographic; price change; and substitution. The drug-mix effect of direct-acting antiviral (DAA) drugs for hepatitis C is shown separately, as are the effects of the Ontario Health Insurance Plan Plus (OHIP+) initiative. The total positive push effect, negative pull effect, and net change are given for each year.
| 2014/15 | 2015/16 | 2016/17 | 2017/18 | 2018/19 | 2019/20 | |
|---|---|---|---|---|---|---|
OHIP+ |
– |
– |
– |
1.5% |
4.7% |
-3.0% |
Drug-mix, direct-acting antiviral (DAA) drugs |
– |
8.0% |
-2.3% |
2.4% |
0.6% |
-1.6% |
Drug mix, other drugs |
4.9% |
4.1% |
4.4% |
4.7% |
6.1% |
5.8% |
Volume |
0.3% |
1.2% |
1.0% |
1.0% |
-0.3% |
1.3% |
Demographic |
2.7% |
3.0% |
1.8% |
1.4% |
1.0% |
3.0% |
Price change |
-3.0% |
-1.8% |
-1.0% |
-1.1% |
-4.0% |
-0.5% |
Substitution |
-3.2% |
-2.3% |
-1.8% |
-1.3% |
-2.2% |
-0.6% |
Total push effect |
7.9% |
16.2% |
7.2% |
11.0% |
12.4% |
10.2% |
Total pull effect |
-6.2% |
-4.1% |
-5.1% |
-2.3% |
-6.5% |
-5.7% |
Net change |
2.5% |
12.0% |
2.0% |
8.3% |
5.8% |
4.3% |
Note: Historic values are reported for 2014/15 to 2015/16.
This analysis is based on publicly available pricing information. It does not reflect confidential price discounts negotiated by the pCPA on behalf of the public plans.
Values may not add to totals due to rounding and the cross effect. Results for Yukon were included from 2016/17 onward.
* British Columbia, Alberta, Saskatchewan, Manitoba, Ontario, New Brunswick, Nova Scotia, Prince Edward Island, Newfoundland and Labrador, Yukon, and the Non-Insured Health Benefits Program.
Data source: National Prescription Drug Utilization Information System Database, Canadian Institute for Health Information.
The overall 4.3% increase in drug costs in 2019/20 represents an absolute growth of $417 million, with varying rates of growth among the public drug plans ranging from approximately -1% to 10%, apart from a 25% decrease in Yukon (Figure 2.2). These variations were mainly due to differences in the magnitude of the opposing components of change. Jurisdictions with higher overall growth rates included New Brunswick (9.9%), the NIHB (9.8%), and Alberta (9.2%).
The increased use of higher-cost drugs other than DAAs had the greatest push effect, with an overall impact of 5.8% ($562 million), ranging from 0.6% to 7.7% across jurisdictions. A decline in the use of DAA drugs for hepatitis C drove costs down by 1.6% ($151 million). Differences in the drug-mix effect across public drug plans may be related to plan designs, formulary listing decisions, or the disease profiles of the population, among other determinants. The overall declining impact of DAA drugs also varied, with the largest downward pull in British Columbia (-6.0%), followed by Yukon (-4.1%) and Manitoba (-2.6%). The use of DAAs in Newfoundland and Labrador and New Brunswick pushed costs upward very slightly (0.4% and 0.1%).
The OHIP+ program redesign in Ontario reduced drug costs by $289 million in 2019/20, pulling costs downward by 5.0% in Ontario and 3.0% across all NPDUIS plans.
The demographic effect boosted drug costs in the NPDUIS public plans by 3.0% ($289 million) in 2019/20, completely offsetting the pull from OHIP+. This increase in the active beneficiary population may be the result of growth in the overall population of a jurisdiction, an increase in the number of Canadians eligible for senior coverage (65+), and/or plan design changes that expanded coverage to new population or patient groups. For example, effective January 1, 2019, British Columbia lowered the threshold of their income-based coverage, thereby increasing the population eligible for inclusion. Note that demographic changes due to OHIP+ are presented separately.
The volume effect continued to have a relatively small impact on growth in 2019/20, pushing overall drug costs by 1.3%, or $129 million. This effect was an important driver in the NIHB (3.8%), Prince Edward Island (3.4%), and Saskatchewan (2.9%).
The cost-saving effects of generic and biosimilar substitution (-0.6% or -$61 million) and price reductions (-0.5% or -$52 million) were almost equal in magnitude in 2019/20 and were relatively uniform across jurisdictions. The exception was British Columbia, which had a more pronounced substitution effect of -2.4% as a result of its recent non-medical biosimilar switching initiative. Together, these two drivers represented a -1.1% (-$112 million) counterweight for the public drug costs in 2019/20, markedly below their -6.2% impact the year before.
The key effects for 2019/20—price change, substitution, and drug-mix—are explored in more detail in the following section.
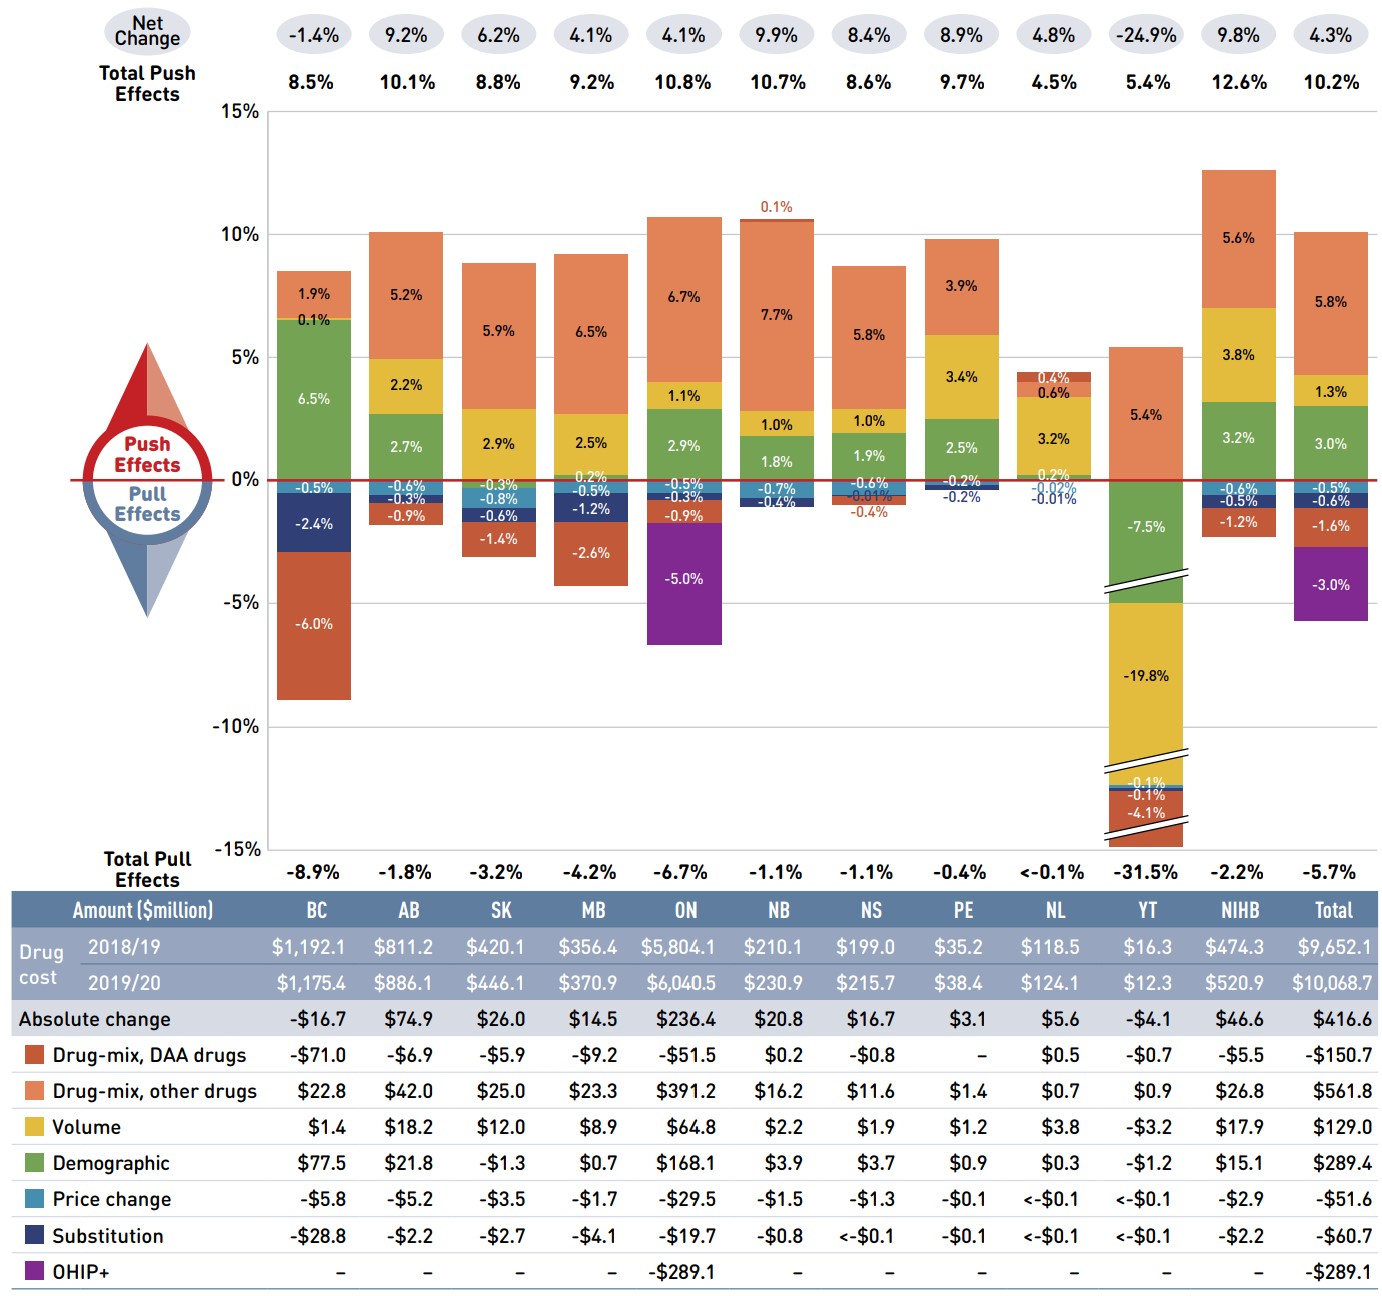
Figure description
This column graph and table describe the key factors or effects that impacted the rates of change in drug costs for each of the NPDUIS public drug plans from 2018/19 to 2019/20. Each column is broken out to give the positive or negative contribution of each effect: drug-mix; volume; demographic; price change; and substitution. The drug-mix effect of direct-acting antiviral (DAA) drugs for hepatitis C is shown separately, as are the effects of the Ontario Health Insurance Plan Plus (OHIP+) initiative. The total positive push effect, negative pull effect and net change are given for each year. Total results for all plans are also included.
| British Columbia | Alberta | Saskatchewan | Manitoba | Ontario | New Brunswick | Nova Scotia | Prince Edward Island | Newfoundland and Labrador | Yukon | Non-Insured Health Benefits | Total | |
|---|---|---|---|---|---|---|---|---|---|---|---|---|
OHIP+ |
– |
– |
– |
– |
-5.0% |
– |
– |
– |
– |
– |
– |
-3.0% |
Drug-mix, direct-acting antiviral (DAA) drugs |
-6.0% |
-0.9% |
-1.4% |
-2.6% |
-0.9% |
0.1% |
-0.4% |
– |
0.4% |
-2.0% |
-1.2% |
-1.6% |
Drug-mix, other drugs |
1.9% |
5.2% |
5.9% |
6.5% |
6.7% |
7.7% |
5.8% |
3.9% |
0.6% |
5.4% |
5.6% |
5.8% |
Volume |
0.1% |
2.2% |
2.9% |
2.5% |
1.1% |
1.0% |
1.0% |
3.4% |
3.2% |
-7.5% |
3.8% |
1.3% |
Demographic |
6.5% |
2.7% |
-0.3% |
0.2% |
2.9% |
1.8% |
1.9% |
2.5% |
0.2% |
-5.0% |
3.2% |
3.0% |
Price change |
-0.5% |
-0.6% |
-0.8% |
-0.5% |
-0.5% |
-0.7% |
-0.6% |
-0.2% |
-0.1% |
-0.1% |
-0.6% |
-0.5% |
Substitution |
-2.4% |
-0.3% |
-0.6% |
-1.2% |
-0.3% |
-0.4% |
<-0.1% |
-0.2% |
-0.1% |
-0.1% |
-0.5% |
-0.6% |
Total push effect |
8.5% |
10.1% |
8.8% |
9.2% |
10.8% |
10.7% |
8.6% |
9.7% |
4.5% |
5.4% |
12.6% |
10.2% |
Total pull effect |
-8.9% |
-1.8% |
-3.2% |
-4.2% |
-6.7% |
-1.1% |
-1.1% |
-0.4% |
<-0.1% |
-31.5% |
-2.2% |
-5.7% |
Net change |
-1.4% |
9.2% |
6.2% |
4.1% |
4.1% |
9.9% |
8.4% |
8.9% |
4.8% |
-24.9% |
9.8% |
4.3% |
An accompanying table gives the corresponding changes in millions of dollars, as well as the total drugs costs in 2018/19 and 2019/20 and the absolute change for each plan.
| British Columbia | Alberta | Saskatchewan | Manitoba | Ontario | New Brunswick | Nova Scotia | Prince Edward Island | Newfoundland and Labrador | Yukon | Non-Insured Health Benefits | Total | |
|---|---|---|---|---|---|---|---|---|---|---|---|---|
Drug cost 2018/19 |
$1,192.1 |
$811.2 |
$420.1 |
$356.4 |
$5,804.1 |
$210.1 |
$199.0 |
$35.2 |
$118.5 |
$16.3 |
$474.3 |
$9,652.1 |
Drug cost 2019/20 |
$1,175.4 |
$886.1 |
$446.1 |
$370.9 |
$6,040.5 |
$230.9 |
$215.7 |
$38.4 |
$124.1 |
$12.3 |
$520.9 |
$10,068.7 |
Absolute change |
-$16.7 |
$74.9 |
$26.0 |
$14.5 |
$236.4 |
$20.8 |
$16.7 |
$3.1 |
$5.6 |
-$4.1 |
$46.6 |
$416.6 |
Drug-mix, direct-acting antiviral (DAA) drugs |
-$71.0 |
-$6.9 |
-$5.9 |
-$9.2 |
-$51.5 |
$0.2 |
-$0.8 |
- |
$0.5 |
-$0.7 |
-$5.5 |
-$150.7 |
Drug-mix, other drugs |
$22.8 |
$42.0 |
$25.0 |
$23.3 |
$391.2 |
$16.2 |
$11.6 |
$1.4 |
$0.7 |
$0.9 |
$26.8 |
$561.8 |
Volume |
$1.4 |
$18.2 |
$12.0 |
$8.9 |
$64.8 |
$2.2 |
$1.9 |
$1.2 |
$3.8 |
-$3.2 |
$17.9 |
$129.0 |
Demographic |
$77.5 |
$21.8 |
-$1.3 |
$0.7 |
$168.1 |
$3.9 |
$3.7 |
$0.9 |
$0.3 |
-$1.2 |
$15.1 |
$289.4 |
Price change |
-$5.8 |
-$5.2 |
-$3.5 |
-$1.7 |
-$29.5 |
-$1.5 |
-$1.3 |
-$0.1 |
<-$0.1 |
<-$0.1 |
-$2.9 |
-$51.6 |
Substitution |
-$28.8 |
-$2.2 |
-$2.7 |
-$4.1 |
-$19.7 |
-$0.8 |
<-$0.1 |
-$0.1 |
<-$0.1 |
<-$0.1 |
-$2.2 |
-$60.7 |
OHIP+ |
– |
– |
– |
– |
-$289.1 |
– |
– |
– |
– |
– |
– |
-$289.1 |
Note: This analysis is based on publicly available pricing information. It does not reflect confidential drug price discounts negotiated by the pCPA on behalf of the public plans. Values may not add to totals due to rounding and the cross effect.
Data source: National Prescription Drug Utilization Information System Database, Canadian Institute for Health Information.
Price Change Effect
This effect captures changes in the prices of both brand-name and generic medicines. Since the significant one-time drop in generic prices resulting from the implementation of the pan-Canadian Generic Price Initiative in April 2018, the influence of this driver has diminished. In 2019/20, reductions in drug prices pulled the overall cost levels down by a modest 0.5% ($52 million).
An analysis by market segment suggests that the downward pull was mainly due to a reduction in the average unit costs reimbursed in the multi-source non-patented category, as the average unit costs of patented medicines remained relatively stable while the costs of single-source non-patented medicines increased.
Figure 2.3 reports long-term trends in average unit costs from 2009/10 to 2019/20 by market segment for (a) patented medicines; (b) multi-source generic medicines; and (c) single-source non-patented medicines, along with their corresponding 2019/20 market shares. The results are presented as an index, with the base year (2009/10) set to one and subsequent years reported relative to this value. The findings are a cost-weighted average of changes in the reimbursed unit costs for individual medicines. The analysis was restricted to oral solid formulations to ensure unit consistency.
From 2009/10 to 2019/20, the prices of patented medicines were relatively stable while prices of single-source non-patented medicines increased by an average of 29%, mainly due to the change in patent status of two top-selling drugs, Lucentis (ranibizumab) and Tresiba (insulin degludec). Despite the significant rise, the impact of this segment was limited due to its small size: single-source non-patented medicines make up just 9.7% of the market, while patented medicines represent a 57.5% share.
The multi-source generics market shows a similar trend across all NPDUIS public drug plans that is tied to the various waves of generic price reforms. Average unit costs declined rapidly in the first few years after the initial wave of reforms and then decreased more gradually from 2014/15 to 2016/17 as generic prices stabilized. Following the most recent pricing initiatives, prices declined by an average of 3% in 2017/18 before a more notable 11% drop in 2018/19, then remained steady in 2019/20. As a result, the average multi-source generic unit cost across all jurisdictions in 2019/20 was less than half of the 2009/10 average.
Brief Insights: pCPA Initiatives
Through the pan-Canadian Pharmaceutical Alliance (pCPA), the provinces, territories, and federal government have been working collectively to achieve greater value for generic and brand-name medicines for Canada’s publicly funded drug programs.
Generic medicines:
Between April 1, 2015, and April 1, 2016, the prices of 18 commonly used generic medicines were reduced to 18% of their brand-name reference products. In addition, a one-year bridging period was initiated on April 1, 2017, which further reduced the prices of six of the molecules to 15% of the brand reference price.
As of April 1, 2018, a five-year joint agreement between the pCPA and the Canadian Generic Pharmaceutical Association (CGPA) reduced the prices of 67 of the most commonly prescribed generic medicines in Canada by 25% to 40%, resulting in overall discounts of up to 90% off the price of their brand-name equivalents.
Brand-name medicines:
As of June 30, 2021, 417 joint negotiations or product listing agreements (PLAs) for brand-name drugs had been completed by the pCPA, with another 41 negotiations underway. The impact of the negotiated prices is not reflected in this analysis.
For more details, see the overview of generic pricing policies and pCPA initiatives available on the PMPRB website.
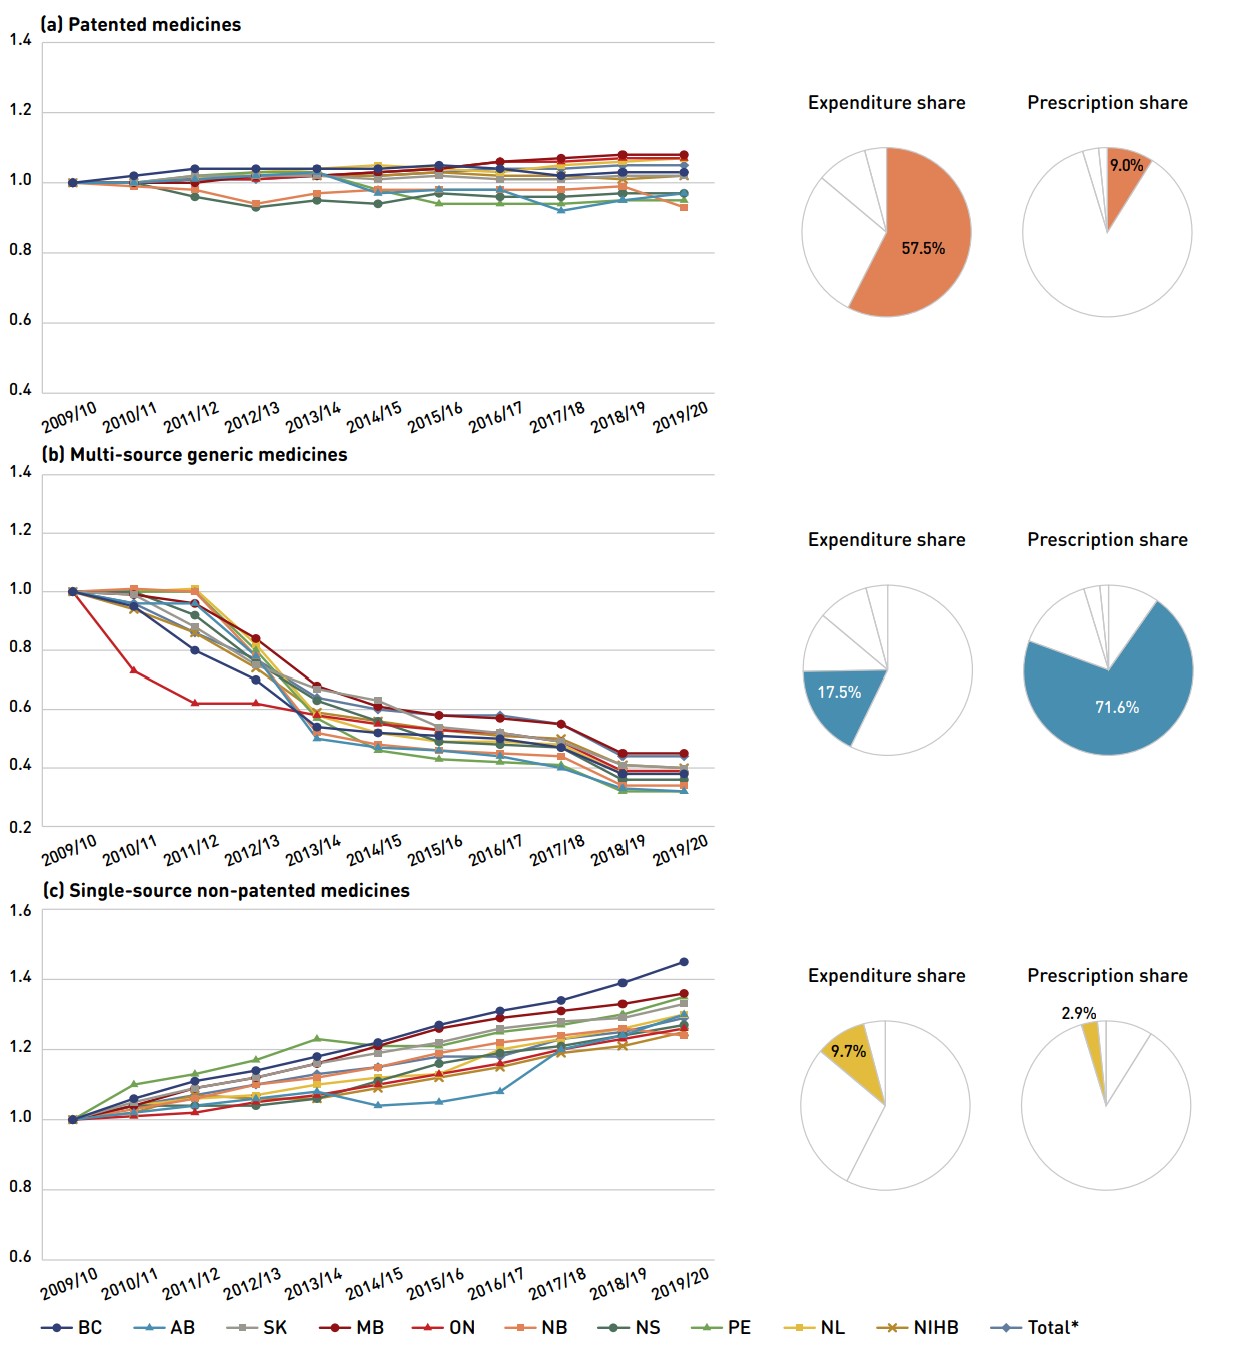
Figure description
This figure has three sections, each with a line graph depicting the average unit cost index from 2009/10 to 2019/20 for (a) patented medicines, (b) multi-source generic medicines, and (c) single-source non-patented medicines. Results are given for each NPDUIS drug plan, as well as the total for all plans. Expenditure and prescription shares for 2018/19 are shown in pie charts beside each graph.
(a) Patented medicines
Expenditure share: 57.5%
Prescription share: 9.0%
| 2009/10 | 2010/11 | 2011/12 | 2012/13 | 2013/14 | 2014/15 | 2015/16 | 2016/17 | 2017/18 | 2018/19 | 2019/20 | |
|---|---|---|---|---|---|---|---|---|---|---|---|
British Columbia |
1.00 |
1.02 |
1.04 |
1.04 |
1.04 |
1.04 |
1.05 |
1.04 |
1.02 |
1.03 |
1.03 |
Alberta |
1.00 |
1.00 |
1.01 |
1.02 |
1.03 |
0.97 |
0.98 |
0.98 |
0.92 |
0.95 |
0.97 |
Saskatchewan |
1.00 |
1.00 |
1.02 |
1.02 |
1.02 |
1.01 |
1.02 |
1.01 |
1.01 |
1.02 |
1.02 |
Manitoba |
1.00 |
1.00 |
1.00 |
1.02 |
1.02 |
1.03 |
1.04 |
1.06 |
1.07 |
1.08 |
1.08 |
Ontario |
1.00 |
1.00 |
1.01 |
1.01 |
1.02 |
1.03 |
1.04 |
1.06 |
1.06 |
1.07 |
1.07 |
New Brunswick |
1.00 |
0.99 |
0.98 |
0.94 |
0.97 |
0.98 |
0.98 |
0.98 |
0.98 |
0.99 |
0.93 |
Nova Scotia |
1.00 |
1.00 |
0.96 |
0.93 |
0.95 |
0.94 |
0.97 |
0.96 |
0.96 |
0.97 |
0.97 |
Prince Edward Island |
1.00 |
1.00 |
1.02 |
1.03 |
1.03 |
0.98 |
0.94 |
0.94 |
0.94 |
0.95 |
0.95 |
Newfoundland and Labrador |
1.00 |
1.00 |
1.01 |
1.03 |
1.04 |
1.05 |
1.04 |
1.03 |
1.05 |
1.06 |
1.07 |
Non-Insured Health Benefits |
1.00 |
1.00 |
1.01 |
1.02 |
1.02 |
1.02 |
1.03 |
1.02 |
1.02 |
1.01 |
1.02 |
Total* |
1.00 |
1.00 |
1.01 |
1.01 |
1.02 |
1.02 |
1.03 |
1.04 |
1.04 |
1.05 |
1.05 |
(b) Multi-source generic medicines
Expenditure share: 17.5%
Prescription share: 71.6%
| 2009/10 | 2010/11 | 2011/12 | 2012/13 | 2013/14 | 2014/15 | 2015/16 | 2016/17 | 2017/18 | 2018/19 | 2019/20 | |
|---|---|---|---|---|---|---|---|---|---|---|---|
British Columbia |
1.00 |
0.95 |
0.80 |
0.70 |
0.54 |
0.52 |
0.51 |
0.50 |
0.47 |
0.38 |
0.38 |
Alberta |
1.00 |
0.96 |
0.96 |
0.78 |
0.50 |
0.47 |
0.46 |
0.44 |
0.40 |
0.33 |
0.32 |
Saskatchewan |
1.00 |
0.99 |
0.88 |
0.75 |
0.67 |
0.63 |
0.54 |
0.52 |
0.49 |
0.41 |
0.40 |
Manitoba |
1.00 |
0.99 |
0.96 |
0.84 |
0.68 |
0.61 |
0.58 |
0.57 |
0.55 |
0.45 |
0.45 |
Ontario |
1.00 |
0.73 |
0.62 |
0.62 |
0.58 |
0.55 |
0.53 |
0.52 |
0.49 |
0.39 |
0.39 |
New Brunswick |
1.00 |
1.01 |
1.00 |
0.78 |
0.52 |
0.48 |
0.46 |
0.45 |
0.44 |
0.34 |
0.34 |
Nova Scotia |
1.00 |
1.00 |
0.92 |
0.76 |
0.63 |
0.56 |
0.49 |
0.48 |
0.47 |
0.36 |
0.36 |
Prince Edward Island |
1.00 |
1.00 |
1.00 |
0.80 |
0.57 |
0.46 |
0.43 |
0.42 |
0.41 |
0.32 |
0.32 |
Newfoundland and Labrador |
1.00 |
1.00 |
1.01 |
0.82 |
0.58 |
0.52 |
0.49 |
0.49 |
0.48 |
0.38 |
0.38 |
Non-Insured Health Benefits |
1.00 |
0.94 |
0.86 |
0.74 |
0.59 |
0.56 |
0.53 |
0.51 |
0.50 |
0.41 |
0.40 |
Total* |
1.00 |
0.96 |
0.86 |
0.77 |
0.64 |
0.60 |
0.58 |
0.58 |
0.55 |
0.44 |
0.44 |
(c) Single-source non-patented medicines
Expenditure share: 9.7%
Prescription share: 2.9%
| 2009/10 | 2010/11 | 2011/12 | 2012/13 | 2013/14 | 2014/15 | 2015/16 | 2016/17 | 2017/18 | 2018/19 | 2019/20 | |
|---|---|---|---|---|---|---|---|---|---|---|---|
British Columbia |
1.00 |
1.06 |
1.11 |
1.14 |
1.18 |
1.22 |
1.27 |
1.31 |
1.34 |
1.39 |
1.45 |
Alberta |
1.00 |
1.02 |
1.04 |
1.06 |
1.08 |
1.04 |
1.05 |
1.08 |
1.20 |
1.24 |
1.30 |
Saskatchewan |
1.00 |
1.05 |
1.09 |
1.12 |
1.16 |
1.19 |
1.22 |
1.26 |
1.28 |
1.29 |
1.33 |
Manitoba |
1.00 |
1.04 |
1.09 |
1.12 |
1.16 |
1.21 |
1.26 |
1.29 |
1.31 |
1.33 |
1.36 |
Ontario |
1.00 |
1.01 |
1.02 |
1.05 |
1.07 |
1.10 |
1.13 |
1.16 |
1.20 |
1.23 |
1.26 |
New Brunswick |
1.00 |
1.03 |
1.06 |
1.10 |
1.12 |
1.15 |
1.19 |
1.22 |
1.24 |
1.26 |
1.24 |
Nova Scotia |
1.00 |
1.04 |
1.04 |
1.04 |
1.06 |
1.11 |
1.16 |
1.19 |
1.21 |
1.24 |
1.27 |
Prince Edward Island |
1.00 |
1.10 |
1.13 |
1.17 |
1.23 |
1.21 |
1.21 |
1.25 |
1.27 |
1.30 |
1.35 |
Newfoundland and Labrador |
1.00 |
1.04 |
1.06 |
1.07 |
1.10 |
1.12 |
1.13 |
1.20 |
1.23 |
1.26 |
1.30 |
Non-Insured Health Benefits |
1.00 |
1.02 |
1.07 |
1.06 |
1.06 |
1.09 |
1.12 |
1.15 |
1.19 |
1.21 |
1.25 |
Total* |
1.00 |
1.04 |
1.07 |
1.10 |
1.13 |
1.15 |
1.18 |
1.18 |
1.23 |
1.25 |
1.29 |
Note: This analysis only includes data for beneficiaries that met their deductible and received public reimbursement.
Yukon is not reported due to data limitations. The findings are a cost-weighted average of changes in the reimbursed unit costs for individual medicines. The analysis was limited to data for oral solid formulations. The remaining share of prescriptions and expenditures includes devices, compounded drugs, and other products that are reimbursed by public drug plans but do not have a Health Canada assigned Drug Identification Number (DIN).
* Total results for the drugs plans captured in this figure.
Data source: National Prescription Drug Utilization Information System Database, Canadian Institute for Health Information.
Substitution Effect
Shifts from brand-name to generic or biosimilar medicines pulled overall drug costs down by 0.6% in 2019/20, translating to a savings of $61 million for the NPDUIS public plans. The modest change indicates that there were no launches of high-selling generics in 2019/20 and year-over-year savings offered by biosimilars remained slow and steady. The top three generic contributors to the substitution effect, which included two antipsychotics (aripiprazole and quetiapine) and one antiepileptic (lacosamide), offered just 0.2% in savings. The total savings from biosimilars rose slightly, with two immunosuppressants, one insulin, and two immunostimulants making a small but growing difference in overall drug costs: Inflectra/Renflexis (-0.2%), Brenzys/Erelzi (-0.1%), Basaglar (-0.04%), Grastofil (-0.01%), and Lapelga (<-0.01%).
The share of prescriptions for multi-source non-patented medicines in public plans increased to 86.5% in 2019/20, a significant rise over 83.0% in 2015/16, while their corresponding share of total drug costs decreased over the same period, from 29.9% to 28.8%. This six-year trend reflects the implementation of generic pricing policies, as well as the genericization of a number of commonly used medicines that lost patent protection in recent years. Multi-source generics alone accounted for 71.6% of prescriptions and 17.5% of drug costs on 2019/20.
Patented medicines accounted for a decreasing share of prescriptions in 2019/20, dropping from 11.5% to 9.0% since 2015/16. Their share of total public plan drug costs also fell slightly to 57.5% due to changes to the patent status of a few top-selling medicines. Despite the loss of patent for a few significant medicines, this segment has held relatively steadily around 60% as a result of the increased use of high-cost drugs such as biologics and oral oncology medicines and the introduction of new high-use drugs such as antidiabetics.
Figure 2.4 reports the 2014/15 to 2019/20 trends in market shares by market segment: patented, multi-source non-patented, and single-source non-patented medicines.
Brief Insights: Biosimilars
In April 2016, the pCPA issued the First Principles for Subsequent Entry Biologics to guide negotiations and inform expectations for biologics and biosimilars. This was followed by the creation of the Biologics Policy Directions in September 2018 to further guide and define the process by which biologic and biosimilar products are negotiated and considered for reimbursement by Canada’s public drug plans.
Additionally, the pCPA recently partnered with Cancer Care Ontario on a joint oncology biosimilars initiative that recognizes the unique considerations in the implementation of oncology biosimilars. As of June 2019, biosimilars are no longer subjected to CADTH review and are instead filed directly with the jurisdictions and the pCPA. The pCPA subsequently engaged the Canadian Agency for Drugs and Technologies in Health (CADTH) to conduct an extensive stakeholder consultation and engagement exercise on the implementation and expanded use of biosimilars in Canada. A final summary report from the consultation was released in February 2021.
Many Canadian payers, including public plans in British Columbia, Alberta, Manitoba, Ontario, Quebec, and New Brunswick, have recently undertaken or announced initiatives to prompt switching to available biosimilars and to encourage biosimilar uptake.
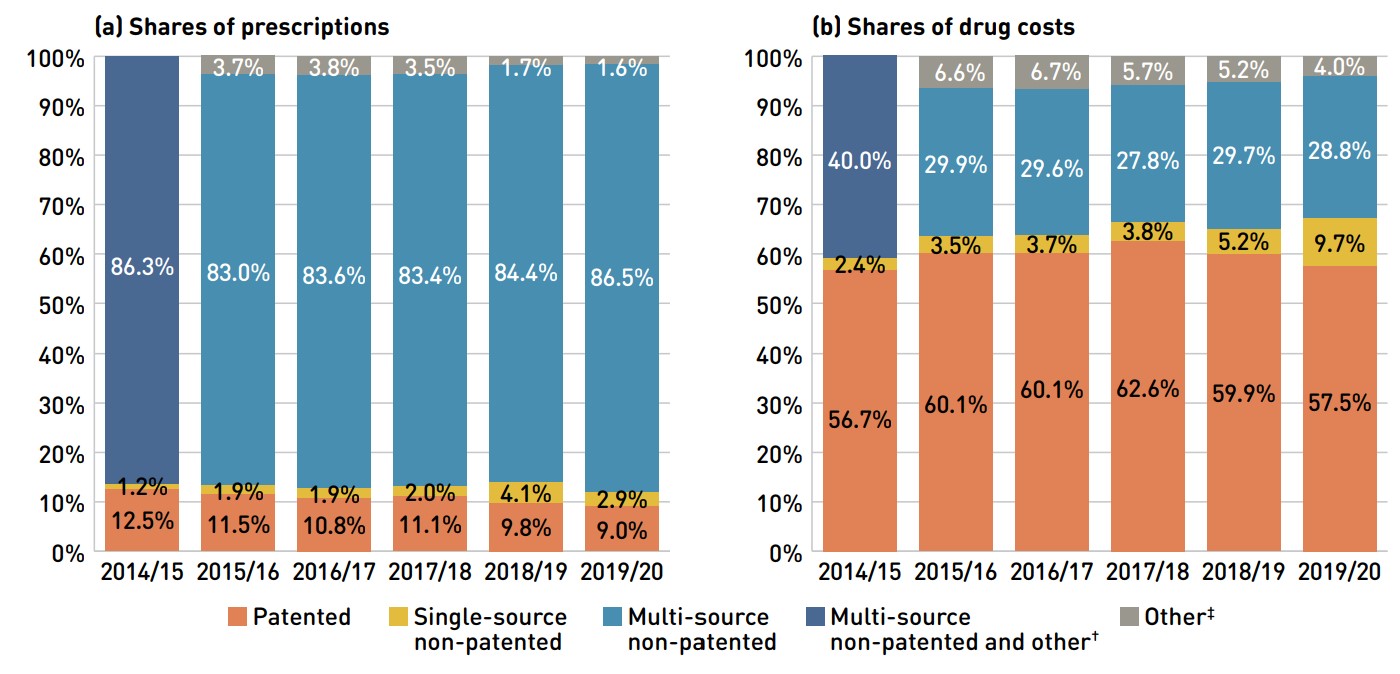
Figure description
This figure shows two complementary stacked column graphs. Graph (a) shows the share of prescriptions by market segment from 2014/15 to 2019/20 for all NPDUIS public drug plans. Graph (b) shows the share of drug costs by market segment for the same period. Due to data availability issues, “multi-source non-patented” and “other” were combined for 2014/15.
(a) Share of prescriptions
| Market segment | 2014/15 | 2015/16 | 2016/17 | 2017/18 | 2018/19 | 2019/20 |
|---|---|---|---|---|---|---|
Patented |
12.5% |
11.5% |
10.8% |
11.1% |
9.8% |
9.0% |
Single-source non-patented |
1.2% |
1.9% |
1.9% |
2.0% |
4.1% |
2.9% |
Multi-source non-patented |
- |
83.0% |
83.6% |
83.4% |
84.4% |
86.5% |
Other‡ |
- |
3.7% |
3.8% |
3.5% |
1.7% |
1.6% |
| Mulit-source non-patented and other | 86.3% | - | - | - | - | - |
(b) Share of drug costs
| Market segment | 2014/15 | 2015/16 | 2016/17 | 2017/18 | 2018/19 | 2019/20 |
|---|---|---|---|---|---|---|
Patented |
56.7% |
60.1% |
60.1% |
62.6% |
59.9% |
57.5% |
Single-source non-patented |
2.4% |
3.5% |
3.7% |
3.8% |
5.2% |
9.7% |
Multi-source non-patented |
- |
29.9% |
29.6% |
27.8% |
29.7% |
28.8% |
Other‡ |
- |
6.6% |
6.7% |
5.7% |
5.2% |
4.0% |
| Mulit-source non-patented and other | 40.0% | - | - | - | - | - |
Note: This analysis only includes data for beneficiaries that met their deductible and received public reimbursement.
* British Columbia, Alberta, Saskatchewan, Manitoba, Ontario, New Brunswick, Nova Scotia, Prince Edward Island, Newfoundland and Labrador, Yukon, and the Non-Insured Health Benefits Program.
† Due to data availability issues, “multi-source non-patented” and “other” were combined for 2014/15.
‡ This market segment includes devices, compounded drugs, and other products that are reimbursed by public drug plans but do not have a Health Canada assigned Drug Identification Number (DIN).
Data source: National Prescription Drug Utilization Information System Database, Canadian Institute for Health Information.
Compared to traditional generic drug markets, the savings from biosimilars have been limited by slower initial uptake and smaller price discounts from their originator products. The biosimilars market is a more complex space; unlike generics, biosimilars are not identical to their originator biologics, but are rather highly similar versions, making it more difficult to exchange one drug for another.Footnote ii
Table 2.1 provides an overview of the biosimilars recently approved in Canada. Inflectra, which was approved in Canada in 2014 and marketed publicly in 2016, was one of the first biosimilars available on the Canadian market and has the highest list price discount. Inflectra and Renflexis, approved in 2017, are both indicated for most of the same autoimmune inflammatory diseases as their originator infliximab product Remicade, but despite having list prices set at approximately half that of Remicade, their initial market uptake was slow. Over the last year, Inflectra and Renflexis have doubled their share of the infliximab market, now capturing 18.4% of prescriptions.
Brenzys and Erelzi, biosimilars of another anti-TNF-α drug Enbrel (etanercept), were approved for market in Canada in 2016 and 2017, respectively. At approximately two thirds of the list price of their originator biologic, they had captured 30.6% of the prescription share of the etanercept market by 2019/20.
To explore the impact of biosimilar entry in a key therapeutic market, Figure 2.5 assesses the distribution of patients receiving anti-TNF-α drugs in the public plans before and after the introduction of biosimilars. Although this market has grown considerably over the last several years, patients on originator biologics without available biosimilars continued to make up the majority (53%) of anti-TNF-α beneficiaries in 2019/20. Although the number of beneficiaries in this class has increased, the introduction of new biosimilars and ongoing initiatives to improve biosimilar uptake have stabilized spending on these medicines.
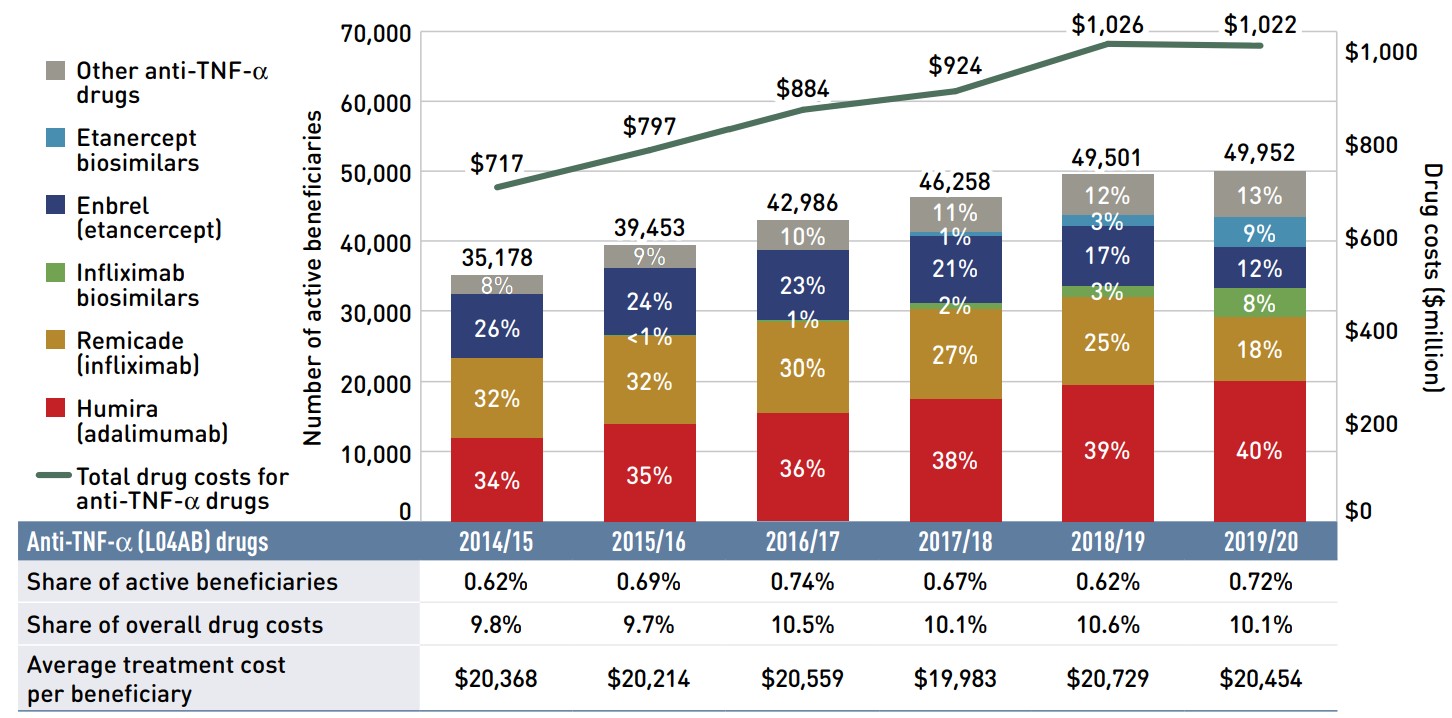
Figure description
A bar graph gives the number of active beneficiaries using anti-TNF-α drugs in the NPDUIS public plans by drug in each year from 2014/15 to 2019/20. Results are given by number of beneficiaries as well as by share of total anti-TNF-α beneficiaries. The total annual drug costs for the class are given in a line above the bars, in millions of dollars.
| Humira (adalimumab) | Remicade (infliximab) | Infliximab biosimilars | Enbrel (etancercept) | Etanercept biosimilars | Other anti-TNF-α drugs | Total anti-TNF-α beneficiaries | Total drug costs for anti-TNF-α drugs, in millions of dollars | |
|---|---|---|---|---|---|---|---|---|
2014/15 |
11,919 (34%) |
11,192 (32%) |
– |
9,234 (26%) |
– |
2,833 (8%) |
35,178 (100%) |
$717 |
2015/16 |
13,940 (35%) |
12,453 (32%) |
23 (<1%) |
9,647 (24%) |
– |
3,390 (9%) |
39,453 (100%) |
$797 |
2016/17 |
15,430 (36%) |
12,947 (30%) |
322 (1%) |
9,908 (23%) |
– |
4,379 (10%) |
42,986 (100%) |
$884 |
2017/18 |
17,523 (38%) |
12,670 (27%) |
949 (2%) |
9,542 (21%) |
541 (1%) |
5,033 (11%) |
46,258 (100%) |
$924 |
2018/19 |
19,552 (39%) |
12,367 (25%) |
1,645 (3%) |
8,538 (17%) |
1,623 (3%) |
5,776 (12%) |
49,501 (100%) |
$1,026 |
2019/20 |
20,057 (40%) |
9,079 (18%) |
4,120 (8%) |
5,815 (12%) |
4,322 (9%) |
6,560 (13%) |
49,952 (100%) |
$1,022 |
A table below the graph gives the share of total NPDUIS plan active beneficiaries held by anti-TNF-α patients in each year, as well as the anti-TNF-α share of overall drug costs and the average anti-TNF-α treatment cost per beneficiary.
| 2014/15 | 2015/16 | 2016/17 | 2017/18 | 2018/19 | 2019/20 | |
|---|---|---|---|---|---|---|
Anti-TNF-α share of active beneficiaries |
0.62% |
0.69% |
0.74% |
0.67% |
0.62% |
0.72% |
Anti-TNF-α share of overall drug costs |
9.8% |
9.7% |
10.5% |
10.1% |
10.6% |
10.1% |
Average anti-TNF-α treatment cost per beneficiary |
$20,368 |
$20,214 |
$20,559 |
$19,983 |
$20,729 |
$20,454 |
Note: Other anti-TNF-α drugs included Simponi and Cimzia.
Results do not distinguish between indications.
Data source: National Prescription Drug Utilization Information System Database, Canadian Institute for Health Information.
It has been observed that biosimilars used to treat acute indications often have a significantly higher rate of uptake than those used for chronic indications. Grastofil and the recently approved Lapelga, biosimilars of the white blood cell stimulator Neupogen (filgrastim) and Neulasta (pegfilgrastim), respectively, have the highest uptake in the public plans, at 94.0% and 94.4% in 2019/20, despite the latter having been available in NPDUIS plans for only one year (Table 2.1). However, their 25% discount from the originator biologic list price places them at the bottom of the biosimilars in terms of price discounts.
Table 2.1 Biosimilars recently approved in Canada, NPDUIS public drug plans*, 2019/20
| Originator biologic | Biosimilar | |||||
|---|---|---|---|---|---|---|
| Trade name (medicinal ingredient) | Drug cost, $million (% share) | Trade name | Market approval | First reimbursement | Price discount† from originator biologic | Share of prescriptions for medicinal ingredient |
Remicade (infliximab) |
$372.0 (3.7%) |
Inflectra |
15-Jan-14 |
Q1-2016 |
46.8% |
18.4% |
Renflexis |
01-Dec-17 |
Q3-2018 |
50.1% |
|||
Enbrel (etanercept) |
$119.3 (1.2%) |
Brenzys |
31-Aug-16 |
Q3-2017 |
33.7% |
30.6% |
Erelzi |
06-Apr-17 |
Q4-2017 |
37.2% |
|||
Lantus |
$117.3 (1.2%) |
Basaglar |
01-Sep-15 |
Q3-2017 |
25.0% |
15.3% |
Neupogen (filgrastim) |
$4.2 (<0.1%) |
Grastofil |
07-Dec-15 |
Q4-2016 |
25.0% |
94.0% |
Neulasta (pegfilgrastim) |
$1.7 (<0.1%) |
Lapelga |
05-Apr-18 |
Q2-2019 |
25.0%‡ |
94.4% |
* British Columbia, Alberta, Saskatchewan, Manitoba, Ontario, New Brunswick, Nova Scotia, Prince Edward Island, Newfoundland and Labrador, Yukon, and the Non-Insured Health Benefits Program.
† Based on Ontario Drug Benefit formulary listing price at the time of the biosimilar entry. This price may change over time; for example, the list price for Brenzys was recently lowered to match Erelzi.
‡ Based on the value reported in CADTH’s Biosimilar Summary Dossier, which sourced prices from Alberta’s Health Formulary as Alberta was the only CDR-participating jurisdiction with publicly available pricing for Neulasta at the time of the biosimilar entry.
Data source: National Prescription Drug Utilization Information System Database, Canadian Institute for Health Information.
Recently, Canadian payers, including public drug plans in Manitoba, British Columbia, Alberta, and New Brunswick, have undertaken or proposed a number of initiatives to increase biosimilar uptake. For more information on the market distribution of biosimilars and their originator biologics in each jurisdiction, see Appendix B. Future editions of this report will continue to follow the impact of these initiatives as they are implemented.
Drug-Mix Effect
Shifts in use between lower- and higher-cost drugs pushed overall cost levels for the NPDUIS drug plans up by 5.8% ($562 million) in 2019/20. The separately reported DAA drugs for the treatment of hepatitis C, which have had significant impacts on public plan drug costs trends over the last few years, cost $151 million less in 2019/20 than they did in 2018/19, pulling overall costs downward by 1.6%.
Figure 2.6 reports the 10 medicines that made the greatest contribution to the drug-mix effect in 2019/20, together accounting for an upward push of 2.8% on overall drug costs. Three medicines made their first appearance on this list in 2019/20, within two years of receiving market authorization: Ozempic (semaglutide); Biktarvy (bictegravir); and Neulasta/Lapelga (pegfilgrastim), which was largely attributable to the addition of its 2018 biosimilar.
The top three contributors to the drug-mix effect in 2019/20 were diabetes treatments, led by the long-acting insulin Tresiba (insulin degludec), which received market authorization from Health Canada three years prior. Three of the other top contributors were oral oncology products and immunosuppressants with average annual treatment costs ranging from $16,902 to $74,346 and the remaining four were either high-use drugs or had relatively low annual treatment costs.
Revlimid, Humira, and Janumet, which were reported as top contributors in the 2018/19 report, continued to have a sizable impact on the drug-mix effect and remained among the top 20 contributors in 2019/20.
The share of total drug costs for each of the top contributors is reported in the accompanying table. Note that this value differs from the contribution to the drug-mix effect, which measures the growth (increase or decrease in costs over time) rather than the costs themselves.
Spotlight on DAA drugs for hepatitis C
Direct-acting antiviral (DAA) drugs for hepatitis C have had a significant but variable impact on public plan drug costs over the last few years. Pricing agreements for most of these medicines were reached between 2014 and 2016 through the pan-Canadian Pharmaceutical Alliance (pCPA) and were expanded in 2017 with a multi-stakeholder agreement that included several new drugs along with those that were already being reimbursed.
The number of active beneficiaries using DAA drugs spiked in 2015/16 and declined sharply the following year. With the subsequent entry of newer DAAs and expanded treatment criteria, the beneficiary group increased by nearly 60% to reach 11,920 in 2017/18 and continued to rise through 2018/19, bringing the total number of active beneficiaries to 13,019. Although DAAs continued to hold a sizable share (5.4%) of drug costs in NPDUIS public drug plans in 2019/20, the number of active beneficiaries using DAA drugs fell to 10,887, representing a $151 million reduction in overall costs for the fiscal year.
As these medicines are curative treatments and have now been on the market for several years, it is not unexpected that the number of active beneficiaries using DAA drugs is declining. Given their diminishing impact on the growth in spending for public plans, DAAs may no longer be presented separately in future editions of this report.
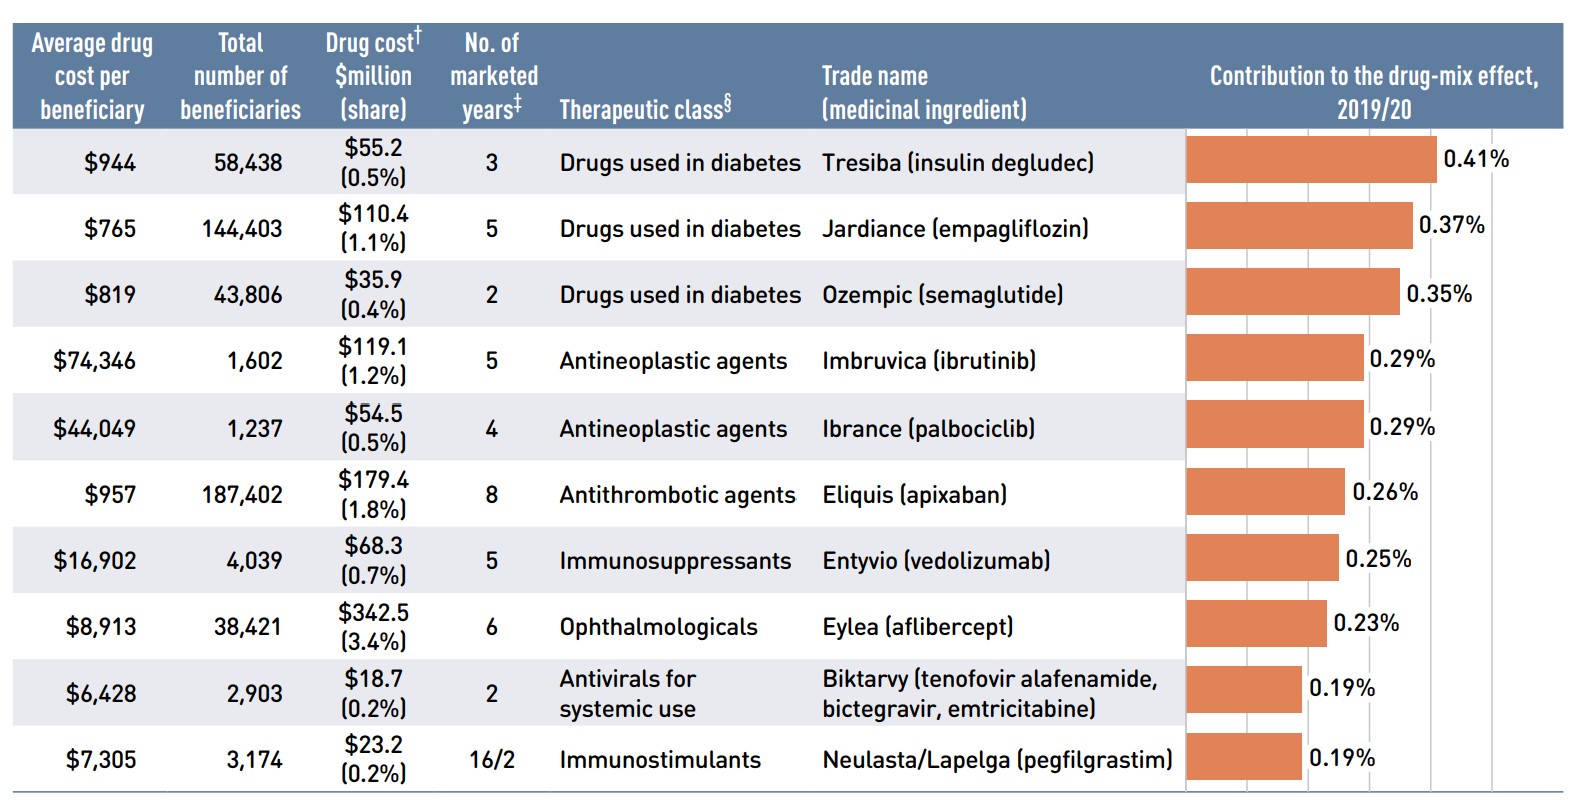
Figure description
A horizontal bar graph depicts the top 10 drugs that contributed to the drug-mix effect in the NPDUIS public drug plans in 2019/20. An accompanying table gives the average cost per beneficiary; total number of beneficiaries; drug cost in millions of dollars; share of the total drug cost; number of years the drug has been marketed in Canada; therapeutic class; and trade name and medicinal ingredient for each drug.
| Average drug cost per beneficiary | Total number of beneficiaries | Drug cost†, in millions of dollars (share) | Number of marketed years‡ | Therapeutic class§ | Trade name (medicinal ingredient) | Contribution to the drug-mix effect, 2019/20 |
|---|---|---|---|---|---|---|
$944 |
58,438 |
$55.2 (0.5%) |
3 |
Drugs used in diabetes |
Tresiba (insulin degludec) |
0.41% |
$765 |
144,403 |
$110.4 (1.1%) |
5 |
Drugs used in diabetes |
Jardiance (empagliflozin) |
0.37% |
$819 |
43,806 |
$35.9 (0.4%) |
2 |
Drugs used in diabetes |
Ozempic (semaglutide) |
0.35% |
$74,346 |
1,602 |
$119.1 (1.2%) |
5 |
Antineoplastic agents |
Imbruvica (ibrutinib) |
0.29% |
$44,049 |
1,237 |
$54.5 (0.5%) |
4 |
Antineoplastic agents |
Ibrance (palbociclib) |
0.29% |
$957 |
187,402 |
$179.4 (1.8%) |
8 |
Antithrombotic agents |
Eliquis (apixaban) |
0.26% |
$16,902 |
4,039 |
$68.3 (0.7%) |
5 |
Immunosuppressants |
Entyvio (vedolizumab) |
0.25% |
$8,913 |
38,421 |
$342.5 (3.4%) |
6 |
Ophthalmologicals |
Eylea (aflibercept) |
0.23% |
$6,428 |
2,903 |
$18.7 (0.2%) |
2 |
Antivirals for systemic use |
Biktarvy (tenofovir alafenamide, bictegravir, emtricitabine) |
0.19% |
$7,305 |
3,174 |
$23.2 (0.2%) |
16/2 |
Immunostimulants |
Neulasta/Lapelga (pegfilgrastim) |
0.19% |
Note: This analysis only includes data for beneficiaries that met their deductible and received public reimbursement.
* British Columbia, Alberta, Saskatchewan, Manitoba, Ontario, New Brunswick, Nova Scotia, Prince Edward Island, Newfoundland and Labrador, Yukon, and the Non-Insured Health Benefits Program.
† All of the top contributors to the drug-mix effect are associated with product listing agreements (PLAs) from pCPA negotiations for one or multiple indications; however, reported drug costs do not reflect price reductions resulting from confidential PLAs.
‡ The number of years since the drug was authorized for market by Health Canada, as of 2019/20.
§ The therapeutic class is based on ATC level 2. Jurisdictions that have special programs for ophthalmological drugs are not captured in the results.
Data source: National Prescription Drug Utilization Information System Database, Canadian Institute for Health Information.
A growing number of high-cost drugs have been reimbursed by NPDUIS public plans in recent years, often targeting relatively small patient populations. The number of medicines with an average annual cost per beneficiary exceeding $10,000 increased significantly from 85 in 2014/15 to 140 in 2019/20. These drugs, which accounted for 19.4% of the overall NPDUIS drug costs in 2014/15, made up 33.9% of costs in 2019/20, while representing only a very small percentage of active beneficiaries (2.1%).
Although there has been a sustained growth in the drug cost share of all high-cost drugs in recent years, the steepest increase has been among those in the highest cost band ($50,000+), other than DAAs. Figure 2.7 reports on trends in the market for high-cost drugs from 2014/15 to 2019/20 by average annual drug cost per active beneficiary determined at the medicinal ingredient level: $10,000–$20,000; $20,000–$50,000; and $50,000 or more.
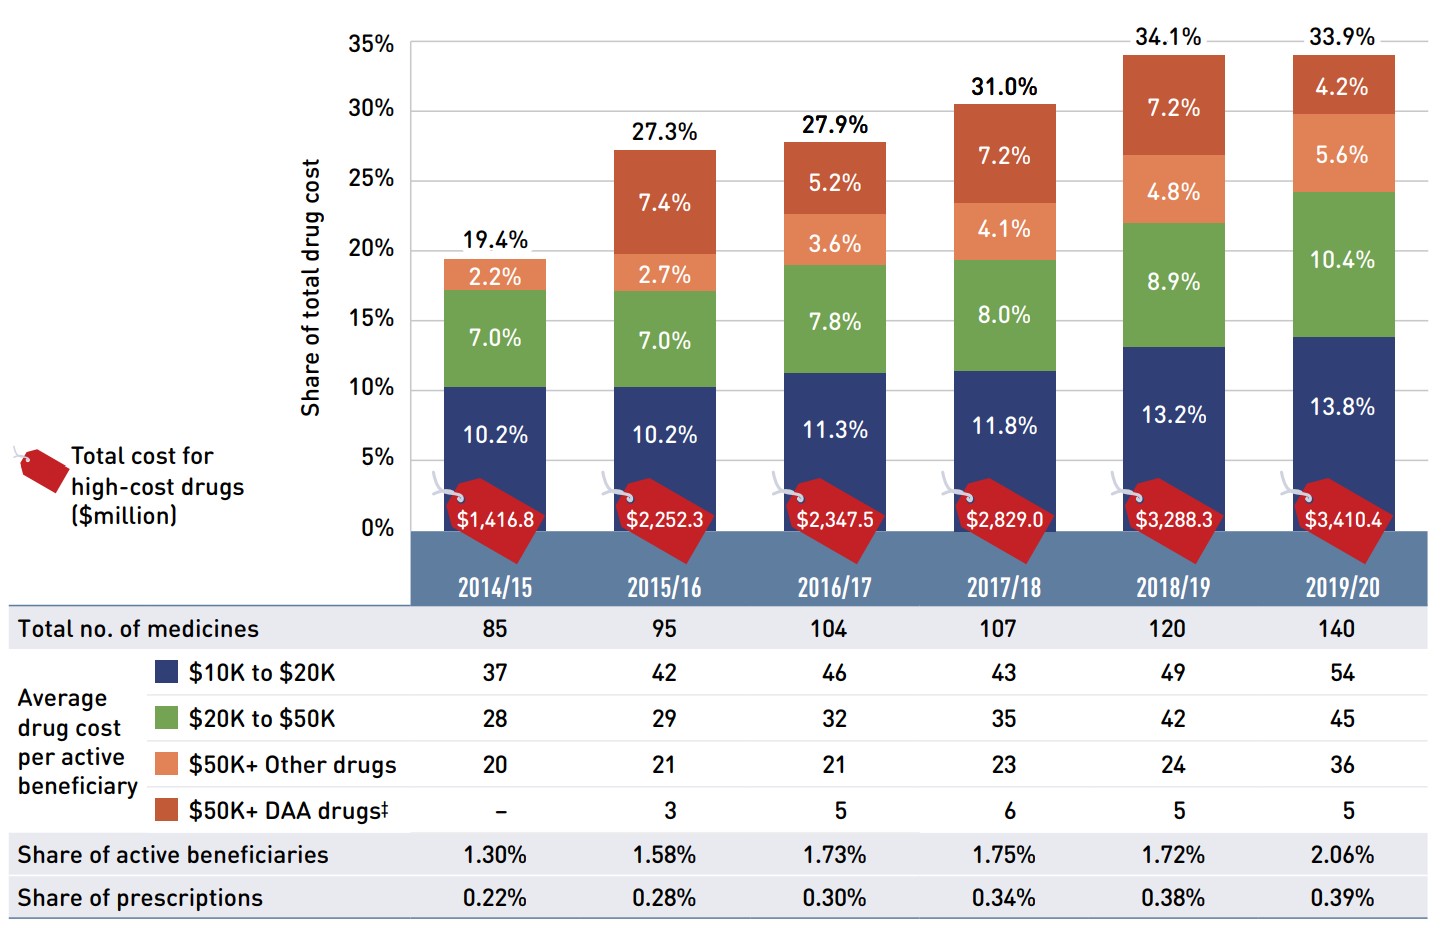
Figure description
This stacked column graph and accompanying table give the trends in high-cost drugs from 2014/15 to 2019/20. A graph reports the share of drug costs for high-cost drugs broken out by average cost per active beneficiary: $10,000‒20,000; $20,000–$50,000; and greater than $50,000. The share associated with new direct-acting antiviral drugs for hepatitis C is reported separately. The table gives the total number of high-cost medicines, the number of medicines in each cost band, the share of beneficiaries using these medicines, and the share of prescriptions that they represent.
| 2014/15 | 2015/16 | 2016/17 | 2017/18 | 2018/19 | 2019/20 | |
|---|---|---|---|---|---|---|
Total number of medicines |
85 |
95 |
104 |
107 |
120 |
140 |
Total drug cost for all high-cost drugs, in millions of dollars |
$1,416.8 |
$2,252.3 |
$2,347.5 |
$2,829.0 |
$3,288.3 |
$3,410.4 |
Average cost per active beneficiary of $10,000‒20,000: share of total drug cost |
10.2% |
10.2% |
11.3% |
11.8% |
13.2% |
13.8% |
Average cost per active beneficiary of $10,000‒20,000: number of medicines |
37 |
42 |
46 |
43 |
49 |
54 |
Average cost per active beneficiary of $20,000–$50,000: share of total drug cost |
7.0% |
7.0% |
7.8% |
8.0% |
8.9% |
10.4% |
Average cost per active beneficiary of $20,000–$50,000: number of medicines |
28 |
29 |
32 |
35 |
42 |
45 |
Average cost per active beneficiary of greater than $50,000: share of total drug cost for other drugs |
2.2% |
2.7% |
3.6% |
4.1% |
4.8% |
5.6% |
Average cost per active beneficiary of greater than $50,000: number of medicines for other drugs |
20 |
21 |
21 |
23 |
24 |
36 |
Average cost per active beneficiary of greater than $50,000: share of total drug cost for direct-acting antiviral drugs |
– |
7.4% |
5.2% |
7.2% |
7.2% |
4.2% |
Average cost per active beneficiary of greater than $50,000: number of medicines for direct-acting antiviral drugs |
– |
3 |
5 |
6 |
5 |
5 |
High-cost drugs – share of total drug cost |
19.4% |
27.3% |
27.9% |
31.0% |
34.1% |
33.9% |
High-cost drugs – share of active beneficiaries |
1.30% |
1.58% |
1.73% |
1.75% |
1.72% |
2.06% |
High-cost drugs – share of total prescriptions |
0.22% |
0.28% |
0.30% |
0.34% |
0.38% |
0.39% |
Note: This analysis only includes data for beneficiaries that met their deductible and received public reimbursement. These results may be underestimated, as some high-cost drugs are reimbursed through special public drug plan programs that are not captured in the NPDUIS data. The methodology for this analysis was revised for the 2018/19 report, and as such, historical results may not match those reported in previous editions.
* Average annual drug costs per active beneficiary exceeding $10,000.
† British Columbia, Alberta, Saskatchewan, Manitoba, Ontario, New Brunswick, Nova Scotia, Prince Edward Island, Newfoundland and Labrador, Yukon, and the Non-Insured Health Benefits Program.
‡ Direct-acting antiviral (DAA) drugs used in the treatment of hepatitis C.
Data source: National Prescription Drug Utilization Information System Database, Canadian Institute for Health Information.
Figure 2.8 provides a more detailed breakdown of the share of high-cost drugs by jurisdiction in 2019/20. High-cost drugs account for a greater share of costs in income- and premium-based programs; for example, they make up approximately half of the total drug costs for public plans in British Columbia (46.5%) and Manitoba (56.2%). These types of programs require beneficiaries to be responsible for a portion of prescription costs, either as a percentage of income or a premium. As such, plan spending is more heavily skewed toward beneficiaries with higher overall costs, and therefore high-cost drugs.
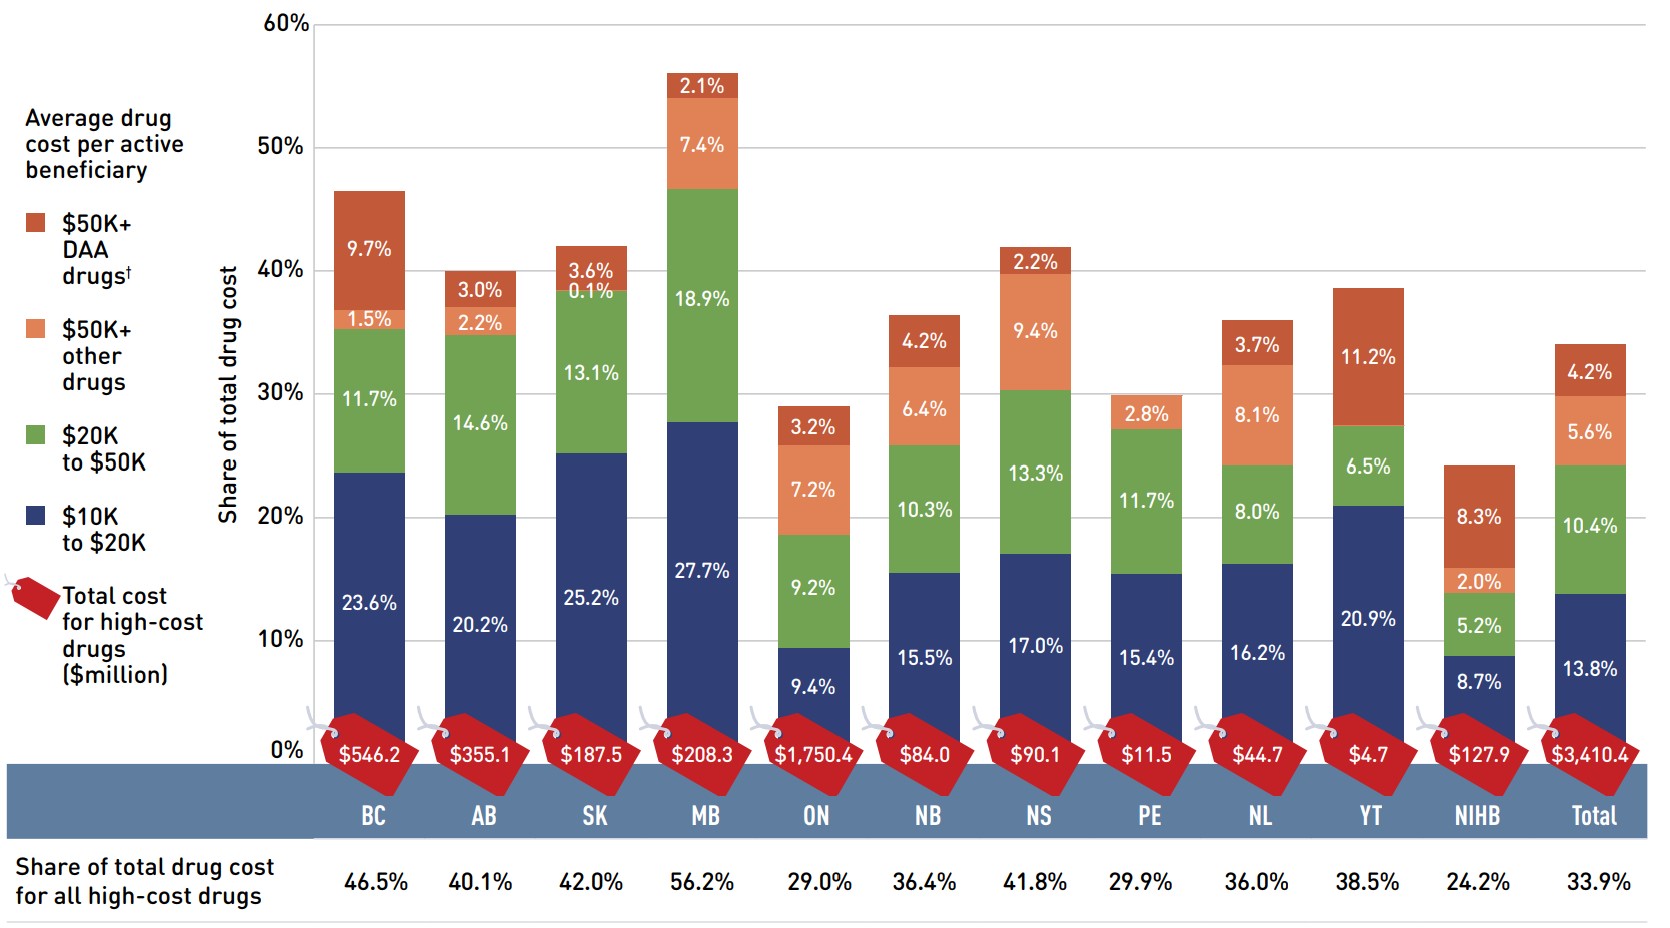
Figure description
This stacked column graph and accompanying table give the share of high-cost drugs for the total drug cost of each NPDUIS public drug plan in 2019/20. The share of high-cost drugs is broken out by average cost per active beneficiary: $10,000‒20,000; $20,000–$50,000; and greater than $50,000. The share associated with new direct-acting antiviral drugs for hepatitis C is reported separately. Price tags below the bars give the total costs for all high-cost drugs, and a table lists the total share for all high-costs drugs in each jurisdiction.
| British Columbia | Alberta | Saskatchewan | Manitoba | Ontario | New Brunswick | Nova Scotia | Prince Edward Island | Newfoundland and Labrador | Yukon | Non-Insured Health Benefits | Total | |
|---|---|---|---|---|---|---|---|---|---|---|---|---|
Total drug cost for all high-cost drugs, in millions of dollars |
$546.2 |
$355.1 |
$187.5 |
$208.3 |
$1,750.4 |
$84.0 |
$90.1 |
$11.5 |
$44.7 |
$4.7 |
$127.9 |
$3,410.4 |
Average cost per beneficiary of $10,000‒20,000: share of total drug cost |
23.6% |
20.2% |
25.2% |
27.7% |
9.4% |
15.5% |
17.0% |
15.4% |
16.2% |
20.9% |
8.7% |
13.8% |
Average cost per beneficiary of $20,000–$50,000: share of total drug cost |
11.7% |
14.6% |
13.1% |
18.9% |
9.2% |
10.3% |
13.3% |
11.7% |
8.0% |
6.5% |
5.2% |
10.4% |
Average cost per beneficiary of greater than $50,000: share of total drug cost for other drugs |
1.5% |
2.2% |
0.1% |
7.4% |
7.2% |
6.4% |
9.4% |
2.8% |
8.1% |
0.0% |
2.0% |
5.6% |
Average cost per beneficiary of greater than $50,000: share of total drug cost for direct-acting antiviral drugs |
9.7% |
3.0% |
3.6% |
2.1% |
3.2% |
4.2% |
2.2% |
0.0% |
3.7% |
11.2% |
8.3% |
4.2% |
High-cost drugs share of total drug cost |
46.5% |
40.1% |
42.0% |
56.2% |
29.0% |
36.4% |
41.8% |
29.9% |
36.0% |
38.5% |
24.2% |
33.9% |
Note: This analysis only includes data for beneficiaries that met their deductible and received public reimbursement. These results may be underestimated, as some high-cost drugs are reimbursed through special public drug plan programs that are not captured in the NPDUIS data.
* Average annual drug costs per active beneficiary exceeding $10,000.
† Direct-acting antiviral (DAA) drugs used in the treatment of hepatitis C.
Data source: National Prescription Drug Utilization Information System Database, Canadian Institute for Health Information.
NPDUIS public plans have paid the majority of drug costs for a relatively small number of high-cost beneficiaries in recent years. As shown in Figure 1.2, NPDUIS public plans paid an average of 87% of total prescription costs in 2019/20, while the remaining 13% was paid by the beneficiaries either out of pocket or through a private insurer. To understand to what extent the plan-paid and beneficiary-paid portions of prescription costs are associated with the beneficiary’s total annual drug costs, Figure 2.9 provides a breakdown of the plan-paid share of NPDUIS drug plan expenditures by average beneficiary annual drug cost level in 2019/20. Beneficiaries are grouped into five cost tiers: less than $5,000; $5,000–$10,000; $10,000–$20,000; $20,000–$50,000; and $50,000 or more.
The figure shows that plans paid a larger portion of prescription costs for higher-cost beneficiaries. In 2019/20, the 5% of beneficiaries that had annual drug costs over $5,000 accounted for nearly 60% of overall drug costs for the public plans. For beneficiaries in the highest cost band—those with annual costs over $50,000—the plan-paid share of costs ranged from 97% to close to 100%.
There were considerable jurisdictional differences in plan-paid shares due to variations in plan design, eligibility, and other factors.
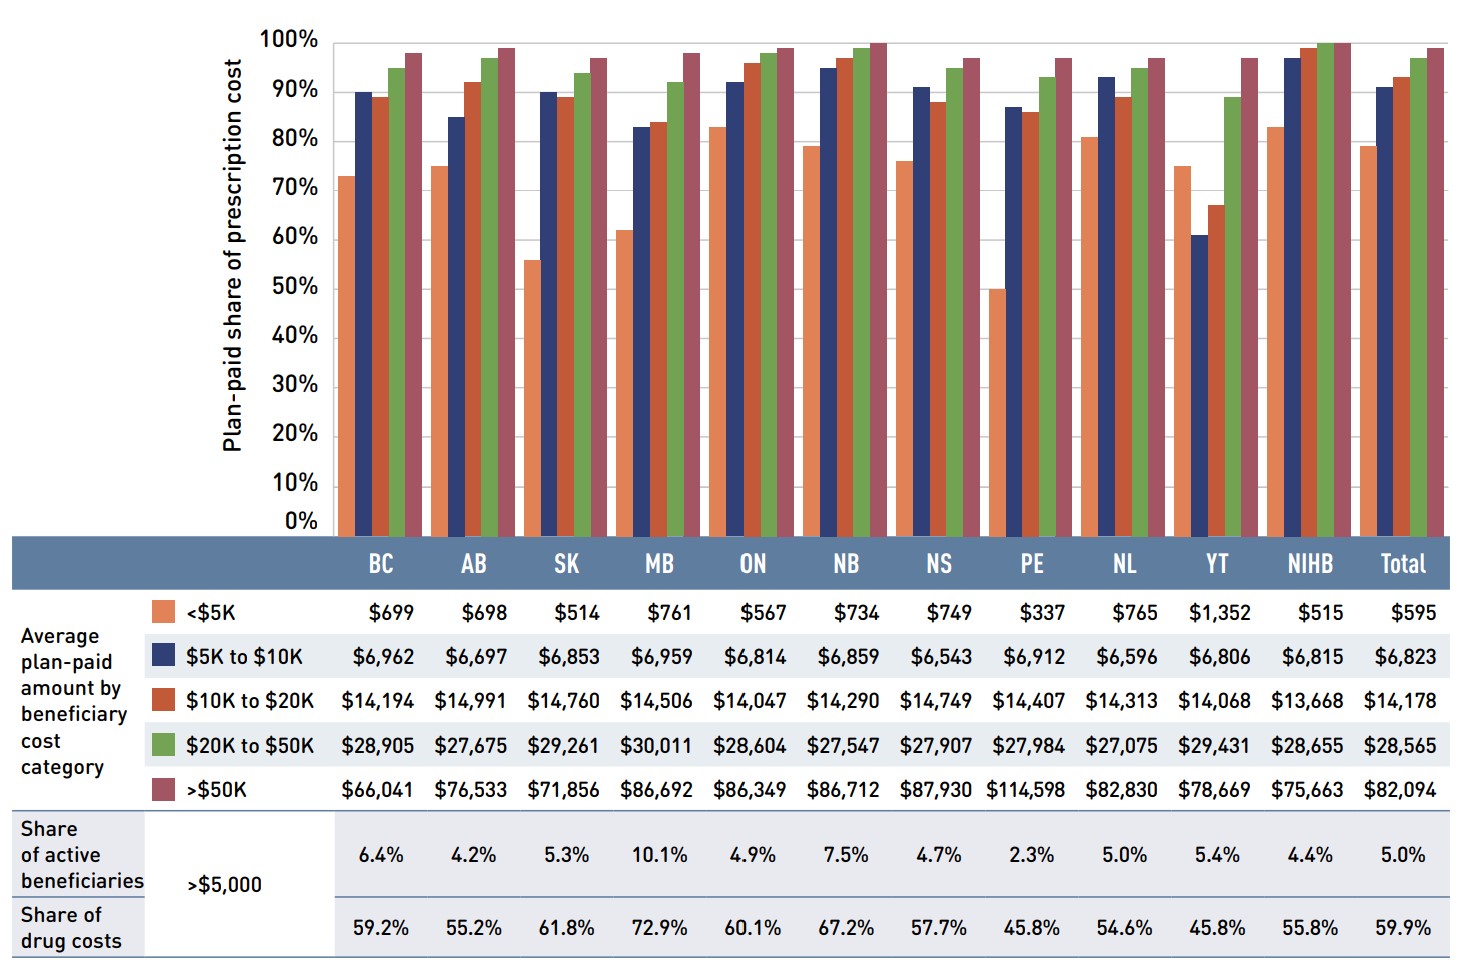
Figure description
This column graph gives the percentage of prescription costs paid by the public drug plans in 2019/20 by beneficiary drug cost. Beneficiary cost categories are based on the amount that a drug program paid per year: less that $5,000; $5,000–$10,000; $10,000–$20,000; $20,000–$50,000; and greater than $50,000.
| Beneficiary cost category | British Columbia | Alberta | Saskatchewan | Manitoba | Ontario | New Brunswick | Nova Scotia | Prince Edward Island | Newfoundland and Labrador | Yukon | Non-Insured Health Benefits | Total | |
|---|---|---|---|---|---|---|---|---|---|---|---|---|---|
Plan-paid share of prescription cost |
Less than $5,000 |
73% |
75% |
56% |
62% |
83% |
79% |
76% |
50% |
81% |
75% |
83% |
79% |
$5,000–$10,000 |
90% |
85% |
90% |
83% |
92% |
95% |
91% |
87% |
93% |
61% |
97% |
91% |
|
$10,000–$20,000 |
89% |
92% |
89% |
84% |
96% |
97% |
88% |
86% |
89% |
67% |
99% |
93% |
|
$20,000–$50,000 |
95% |
97% |
94% |
92% |
98% |
99% |
95% |
93% |
95% |
89% |
100% |
97% |
|
Greater than $50,000 |
98% |
99% |
97% |
98% |
99% |
100% |
97% |
97% |
97% |
97% |
100% |
99% |
A table below the graph gives the plan-paid amounts in absolute values, as well as the total share of active beneficiaries with annual drug costs over $5,000 and their share of drug costs in each jurisdiction.
| Beneficiary cost category | British Columbia | Alberta | Saskatchewan | Manitoba | Ontario | New Brunswick | Nova Scotia | Prince Edward Island | Newfoundland and Labrador | Yukon | Non-Insured Health Benefits | Total | |
|---|---|---|---|---|---|---|---|---|---|---|---|---|---|
Average plan-paid amount |
Less than $5,000 |
$699 |
$698 |
$514 |
$761 |
$567 |
$734 |
$749 |
$337 |
$765 |
$1,352 |
$515 |
$595 |
$5,000–$10,000 |
$6,962 |
$6,697 |
$6,853 |
$6,959 |
$6,814 |
$6,859 |
$6,543 |
$6,912 |
$6,596 |
$6,806 |
$6,815 |
$6,823 |
|
$10,000–$20,000 |
$14,194 |
$14,991 |
$14,760 |
$14,506 |
$14,047 |
$14,290 |
$14,749 |
$14,407 |
$14,313 |
$14,068 |
$13,668 |
$14,178 |
|
$20,000–$50,000 |
$28,905 |
$27,675 |
$29,261 |
$30,011 |
$28,604 |
$27,547 |
$27,907 |
$27,984 |
$27,075 |
$29,431 |
$28,655 |
$28,565 |
|
Greater than $50,000 |
$66,041 |
$76,533 |
$71,856 |
$86,692 |
$86,349 |
$86,712 |
$87,930 |
$114,598 |
$82,830 |
$78,669 |
$75,663 |
$82,094 |
|
Share of active beneficiaries |
Greater than $5,000 |
6.4% |
4.2% |
5.3% |
10.1% |
4.9% |
7.5% |
4.7% |
2.3% |
5.0% |
5.4% |
4.4% |
5.0% |
Share of drug costs |
59.2% |
55.2% |
61.8% |
72.9% |
60.1% |
67.2% |
57.7% |
45.8% |
54.6% |
45.8% |
55.8% |
59.9% |
* Beneficiaries were categorized based on the amount that a drug program paid per year.
Data source: National Prescription Drug Utilization Information System Database, Canadian Institute for Health Information.
Table 2.2 reports the 10 highest-cost drugs reimbursed by the NPDUIS public plans in 2019/20 ranked by their average annual drug cost per active beneficiary. All 10 drugs were indicated to treat rare diseases and had treatment costs exceeding $100,000. Note that although Table 2.2 presents the overall results for all NPDUIS public drug plans, there are significant variations at the individual plan level.
Table 2.2 Top 10 drugs with the highest average annual drug cost per active beneficiary, NPDUIS public drug plans*, 2019/20
| Trade name (medicinal ingredient) | Therapeutic class, ATC level 2 | Average drug cost per beneficiary† | No. of marketed years‡ |
|---|---|---|---|
Myozyme (alglucosidase alfa) |
Other alimentary tract and metabolism products |
$578,860 |
14 |
Vimizim (elosulfase alfa) |
Other alimentary tract and metabolism products |
$487,686 |
6 |
Soliris (eculizumab) |
Immunosuppressants |
$459,649 |
11 |
Spinraza (nusinersen) |
Other drugs for disorders of the musculo-skeletal system |
$372,605 |
3 |
Kalydeco (ivacaftor) |
Other respiratory system products |
$257,354 |
7 |
Revestive (teduglutide) |
Other alimentary tract and metabolism products |
$250,169 |
5 |
Vpriv (velaglucerase alfa) |
Other alimentary tract and metabolism products |
$240,444 |
10 |
Ravicti (glycerol phenylbutyrate) |
Other alimentary tract and metabolism products |
$160,463 |
4 |
Remodulin (treprostinil) |
Antithrombotic agents |
$134,215 |
18 |
Zavesca (miglustat) |
Other alimentary tract and metabolism products |
$112,551 |
16 |
Note: This analysis only includes data for beneficiaries that met their deductible and received public reimbursement. This list of drugs does not include high-cost drugs reimbursed through special programs, which are not captured in the NPDUIS data.
* British Columbia, Alberta, Saskatchewan, Manitoba, Ontario, New Brunswick, Nova Scotia, Prince Edward Island, Newfoundland and Labrador, Yukon, and the Non-Insured Health Benefits Program.
† Represents the total drug cost divided by the total number of beneficiaries and, thus, may include beneficiaries with incomplete treatment costs.
‡ The number of years since the drug was authorized for market by Health Canada, as of 2019/20.
Data source: National Prescription Drug Utilization Information System Database, Canadian Institute for Health Information.
Over the past few years, biologic medicines have captured an increasing share of the total drug costs for the NPDUIS public plans. In 2019/20, the biologics market share grew by 7.3% to reach 28.9% ($2.9 billion) of total drug costs. The top four biologic medicines—Remicade and biosimilars (infliximab), Humira (adalimumab), Eylea (aflibercept), and Lucentis (ranibizumab)—were responsible for 13.3% of total NPDUIS drug costs.
Figure 2.10 reports on trends in the biologic share of total drug costs for the NPDUIS public drug plans, along with the growth in drug costs for this market segment and the current list of top 10 biologic medicines.
Alberta and Saskatchewan had the highest levels of biologics-related costs relative to total drug costs in 2019/20 (38.6% and 38.5%, respectively), while New Brunswick and Prince Edward Island had the highest rates of growth (16.6% and 15.1%, respectively). Variations among plans may be driven by differing plan designs, eligibility for reimbursement, the disease profiles of the population, and the size of the plan, among other considerations.
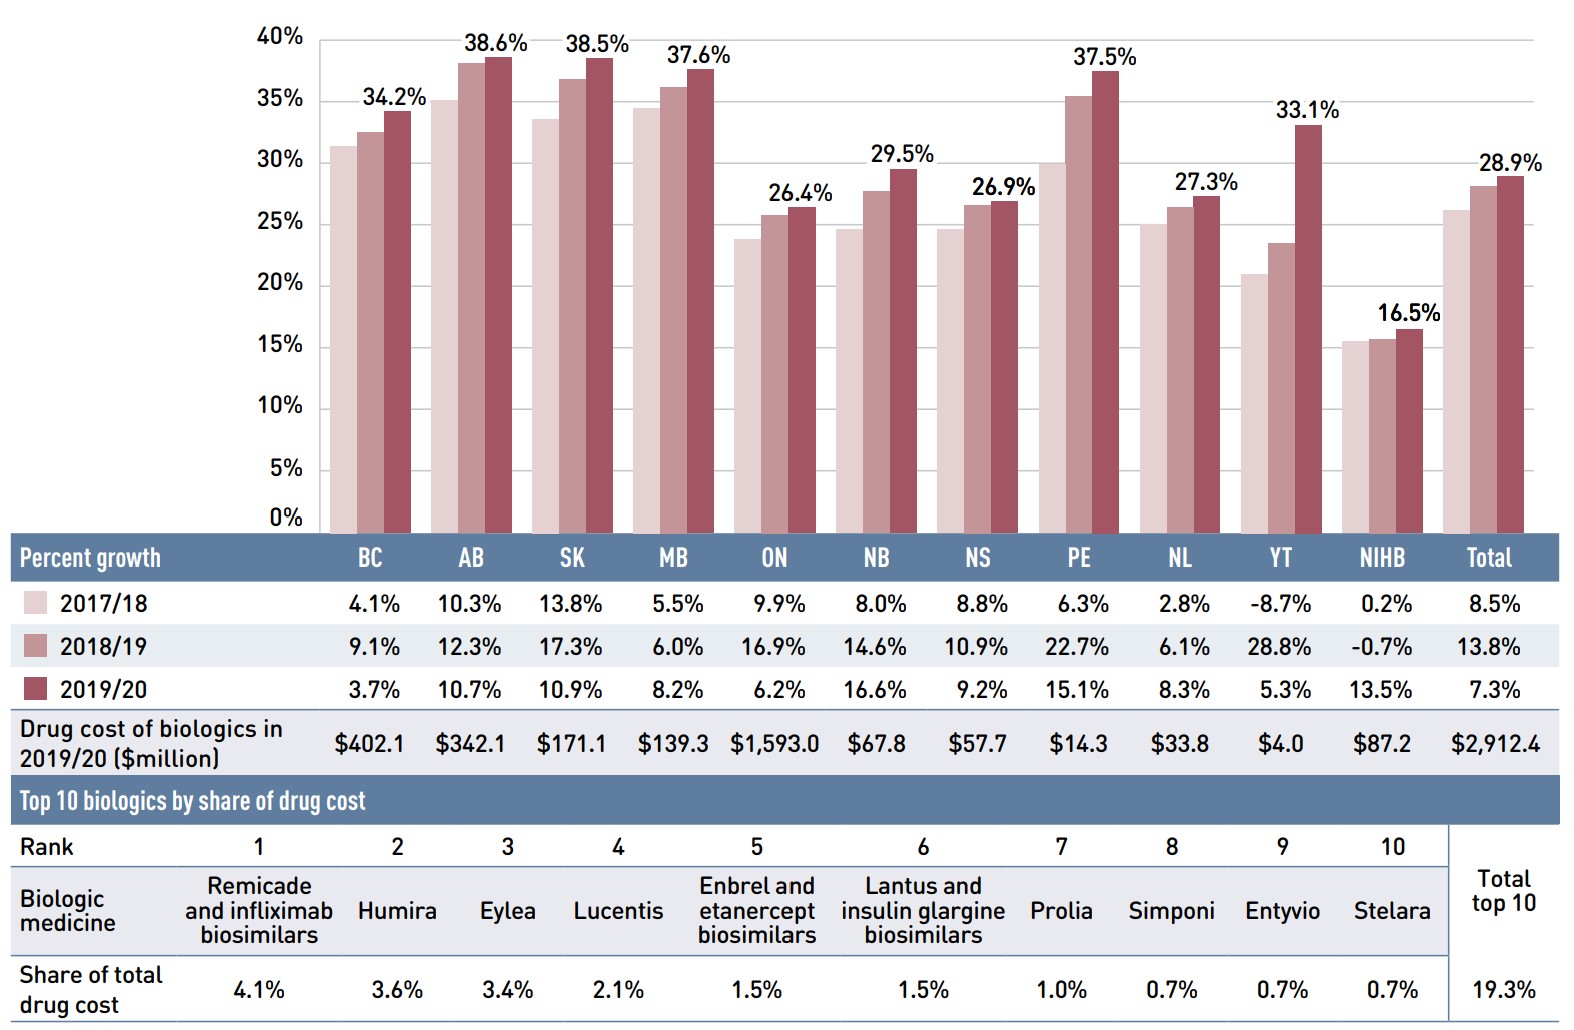
Figure description
This column graph gives the biologic drug share of the total drug costs for the NPDUIS public drug plans from 2017/18 to 2019/20. The table below the graph gives the percent year-over-year growth in biologic drug costs over three years and the total cost of biologics in millions of dollars for 2019/20 for each NPDUIS plan. A second table lists the top ten biologics by share of drug cost for all plans in 2019/20.
| British Columbia | Alberta | Saskatchewan | Manitoba | Ontario | New Brunswick | Nova Scotia | Prince Edward Island | Newfoundland and Labrador | Yukon | Non-Insured Health Benefits | Total | |
|---|---|---|---|---|---|---|---|---|---|---|---|---|
| Biologic share of total drug cost by year | ||||||||||||
2017/18 |
31.4% |
35.1% |
33.6% |
34.5% |
23.8% |
24.6% |
24.6% |
29.9% |
25.0% |
21.0% |
15.5% |
26.2% |
2018/19 |
32.5% |
38.1% |
36.8% |
36.2% |
25.8% |
27.7% |
26.6% |
35.4% |
26.4% |
23.5% |
15.7% |
28.1% |
2019/20 |
34.2% |
38.6% |
38.5% |
37.6% |
26.4% |
29.5% |
26.9% |
37.5% |
27.3% |
33.1% |
16.5% |
28.9% |
| Year-over-year growth | ||||||||||||
2017/18 |
4.1% |
10.3% |
13.8% |
5.5% |
9.9% |
8.0% |
8.8% |
6.3% |
2.8% |
-8.7% |
0.2% |
8.5% |
2018/19 |
9.1% |
12.3% |
17.3% |
6.0% |
16.9% |
14.6% |
10.9% |
22.7% |
6.1% |
28.8% |
-0.7% |
13.8% |
2019/20 |
3.7% |
10.7% |
10.9% |
8.2% |
6.2% |
16.6% |
9.2% |
15.1% |
8.3% |
5.3% |
13.5% |
7.3% |
Drug cost of biologics in 2019/20, in millions of dollars |
$402.1 |
$342.1 |
$171.1 |
$139.3 |
$1,593.0 |
$67.8 |
$57.7 |
$14.3 |
$33.8 |
$4.0 |
$87.2 |
$2,912.4 |
Top 10 biologics by share of drug cost
| Rank | 1 | 2 | 3 | 4 | 5 | 6 | 7 | 8 | 9 | 10 | Total top 10 |
|---|---|---|---|---|---|---|---|---|---|---|---|
Biologic medicine |
Remicade and infliximab biosimilars |
Humira |
Eylea |
Lucentis |
Enbrel and etanercept biosimilars |
Lantus and insulin glargine biosimilars |
Prolia |
Simponi |
Entyvio |
Stelara |
|
Share of total drug cost |
4.1% |
3.6% |
3.4% |
2.1% |
1.5% |
1.5% |
1.0% |
0.7% |
0.7% |
0.7% |
19.3% |
Note: This analysis only includes data for beneficiaries that met their deductible and received public reimbursement.
Data source: National Prescription Drug Utilization Information System Database, Canadian Institute for Health Information.
An analysis by therapeutic area suggests that over two thirds of the total drug costs in 2019/20 were concentrated in just five classes. Antineoplastic and immunomodulating agents topped the list of therapeutic classes at 27.1% of drug costs in 2019/20, reflecting a shift towards oral oncology medicines and a higher use of immunomodulating drugs. Alimentary tract and metabolism medicines held the second highest share of costs (13.5%), due in part to the newer antidiabetic therapies in the class. The drug cost share held by cardiovascular medicines, which include relatively low-cost drugs used by a large number of active beneficiaries, decreased from 13.5% in 2014/15 to 7.4% in 2019/20, primarily due to significant increases in other therapeutic areas.
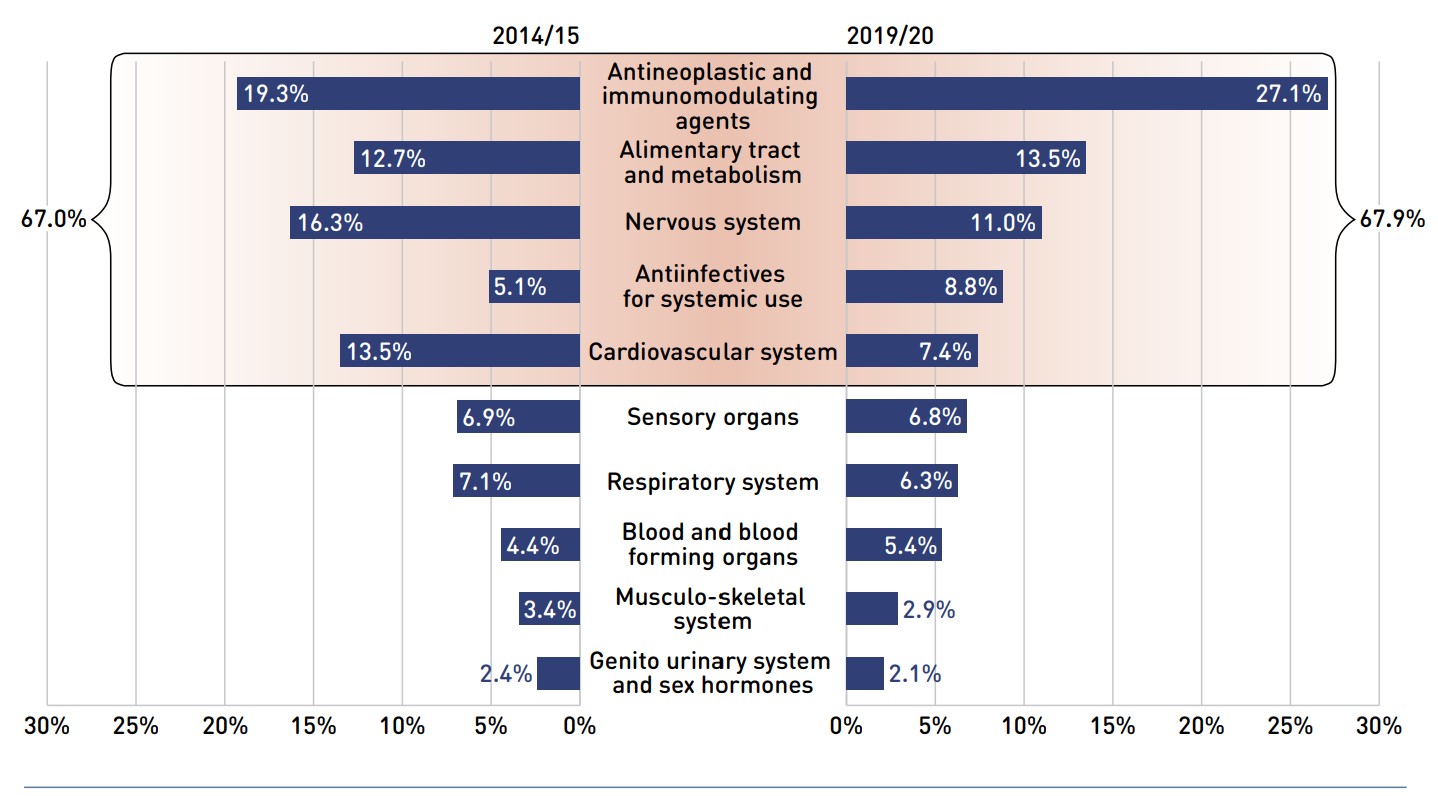
Figure description
This butterfly-shaped figure is composed of two bar graphs depicting the share of total drug costs in the NPDUIS public drug plans for each of the top 10 therapeutic classes in level 1 of the Anatomical Therapeutic Chemical classification system. The shares for 2014/15 are shown on the left and shares for 2019/20 on the right. The top five classes in 2019/20 accounted for 67.0% of costs in 2014/15 and 67.9% of costs in 2019/20.
| Top 10 therapeutic classes | 2014/15 | 2019/20 |
|---|---|---|
Antineoplastic and immunomodulating agents |
19.3% |
27.1% |
Alimentary tract and metabolism |
12.7% |
13.5% |
Nervous system |
16.3% |
11.0% |
Antiinfectives for systemic use |
5.1% |
8.8% |
Cardiovascular system |
13.5% |
7.4% |
Sensory organs |
6.9% |
6.8% |
Respiratory system |
7.1% |
6.3% |
Blood and blood forming organs |
4.4% |
5.4% |
Musculo-skeletal system |
3.4% |
2.9% |
Genito urinary system and sex hormones |
2.4% |
2.1% |
Note: This analysis only includes data for beneficiaries that met their deductible and received public reimbursement.
* Anatomical Therapeutic Chemical (ATC) classification system maintained by the World Health Organization.
† British Columbia, Alberta, Saskatchewan, Manitoba, Ontario, New Brunswick, Nova Scotia, Prince Edward Island, Newfoundland and Labrador, Yukon, and the Non-Insured Health Benefits Program.
Data source: National Prescription Drug Utilization Information System Database, Canadian Institute for Health Information.
3. The Drivers of Dispensing Costs, 2018/19 to 2019/20
The rate of change in dispensing costs in 2019/20 was decidedly lower than the growth in drug costs. Upward cost pressures from a rise in the number of active beneficiaries, smaller prescription sizes, and an increase in the volume of units dispensed over the fiscal year were counterbalanced by a significant downward pull from Ontario’s redesign of the OHIP+ program.
In this section, a comprehensive cost driver analysis is used to determine how much public plan dispensing costs would have changed between 2018/19 and 2019/20 if only one factor (e.g., the average dispensing fee) was considered while all the others remained the same.Footnote iii
Like drug costs, changes in dispensing costs are driven by a number of “push” and “pull” effects. The net effect of these opposing forces yields the overall rate of change.
Demographic effect: Changes in the number of active beneficiaries, as well as shifts in the age or gender distribution.
Drug volume effect: Changes in the number of units dispensed to patients.
Fee effect: Changes in the average dispensing fee per prescription.
Prescription size effect: Changes in the number of units dispensed per prescription.
In addition to the standard annual effects, Ontario’s OHIP+ program is treated as a separate factor in the cost driver analysis, encompassing all effects associated with the OHIP+ program (e.g., volume and demographic changes). As such, the OHIP+ effect isolates the overall impact from plan design changes.
Long-term care (LTC) prescriptions in Ontario have been excluded from the dispensing costs analysis since 2017/18, as their dispensing patterns may differ from those of the general beneficiary population. LTC prescriptions typically contribute less than 0.1% to growth and are therefore not presented in the cost drivers figure; however, as the effect is greater for 2019/20, they have been included as a separate factor.
Dispensing costs in the NPDUIS public plans increased by 1.4% or $35.4 million in 2019/20, reaching a total of $2.5 billion. This growth rate was markedly lower than the 5.1% reported in 2018/19.
The modification of Ontario’s OHIP+ program to cover only Ontario residents age 24 and younger who do not have private insurance reduced dispensing costs by $56.3 million in 2019/20, pulling costs downward by 4.1% in Ontario and 2.3% across all the NPDUIS public drug plans.
Figure 3.1 provides insight into the pressures driving changes in dispensing costs from 2014/15 to 2019/20. The demographic effect, which excludes any impact from OHIP+, was responsible for the largest annual contribution to dispensing cost growth in 2019/20, pushing costs up by 2.7%. The prescription size effect contributed a 1.4% upward pressure on the growth in dispensing costs, while the volume effect exerted an upward push of 0.9%, reflecting an increased quantity of drugs dispensed to patients. The average dispensing fee per prescription remained virtually unchanged in 2019/20.
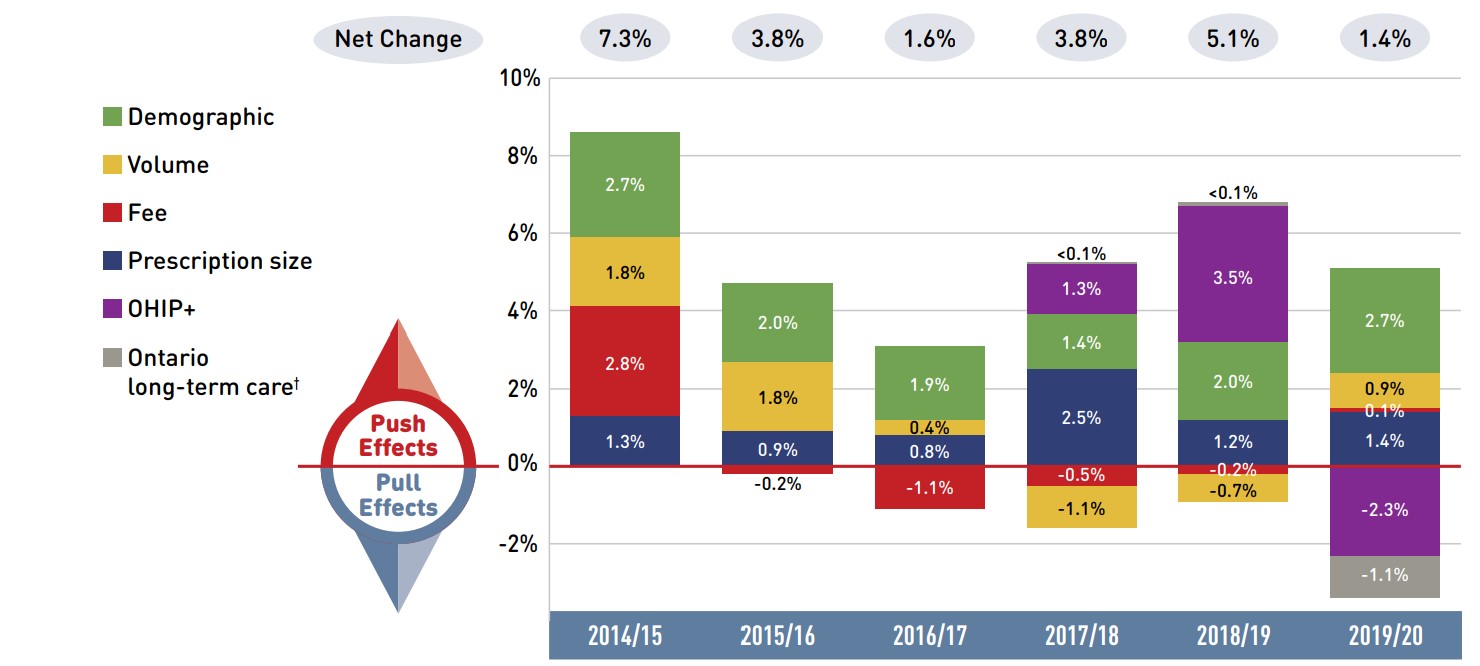
Figure description
This column graph describes the key factors or effects that impacted the rates of change in dispensing costs across all NPDUIS public drug plans for each year from 2014/15 to 2019/20. Each column is broken out to give the positive or negative contribution of each effect: demographic; volume; fee; and prescription size. From 2017/18 onward, the effects of Ontario long term care and the recently introduced Ontario Health Insurance Plan Plus (OHIP+) program are shown separately. The net change is given for each year.
| 2014/15 | 2015/16 | 2016/17 | 2017/18 | 2018/19 | 2019/20 | |
|---|---|---|---|---|---|---|
Demographic |
2.7% |
2.0% |
1.9% |
1.4% |
2.0% |
2.7% |
Volume |
1.8% |
1.8% |
0.4% |
-1.1% |
-0.7% |
0.9% |
Fee |
2.8% |
-0.2% |
-1.1% |
-0.5% |
-0.2% |
0.1% |
Prescription size |
1.3% |
0.9% |
0.8% |
2.5% |
1.2% |
1.4% |
OHIP+ |
– |
– |
– |
1.3% |
3.5% |
-2.3% |
Ontario long-term care |
– |
– |
– |
<0.1% |
<0.1% |
-1.1% |
Net change |
7.3% |
3.8% |
1.6% |
3.8% |
5.1% |
1.4% |
Note: Values may not add to totals due to rounding and the cross effect.
* British Columbia, Alberta, Saskatchewan, Manitoba, Ontario, New Brunswick, Nova Scotia, Prince Edward Island, Newfoundland and Labrador, Yukon, and the Non-Insured Health Benefits Program.
† Long-term care (LTC) prescriptions in Ontario have been excluded from the dispensing costs analysis since 2017/18, as their dispensing patterns may differ from those of the general beneficiary population.
Data source: National Prescription Drug Utilization Information System Database, Canadian Institute for Health Information.
The overall rate of change in dispensing costs varied widely among individual plans, from a high of 9.8% in the NIHB, to a low of -1.9% in Ontario (Figure 3.2). The high growth in the NIHB was driven by a steady increase in all factors. In Ontario, the reduction in dispensing costs resulted mainly from the redesign of OHIP+, without which dispensing costs would have increased moderately by 2.3%.
Long-term care (LTC) prescriptions were separated out from Ontario results in this cost driver analysis as they may not have a typical dispensing frequency, e.g., a significantly higher number of prescriptions per patient than in the general beneficiary population due to the more specialized needs of their patients. LTC patients account for a small portion of all beneficiaries and typically contribute less than 0.1% to the growth in Ontario dispensing costs. However, as the result of a new LTC capitation funding model introduced in the last quarter of 2019/20, the LTC program pulled Ontario dispensing costs down by 2.0%, contributing -1.1% to the growth of dispensing costs to the total NPDUIS public plans. The impact of this change is expected to continue into 2020/21.
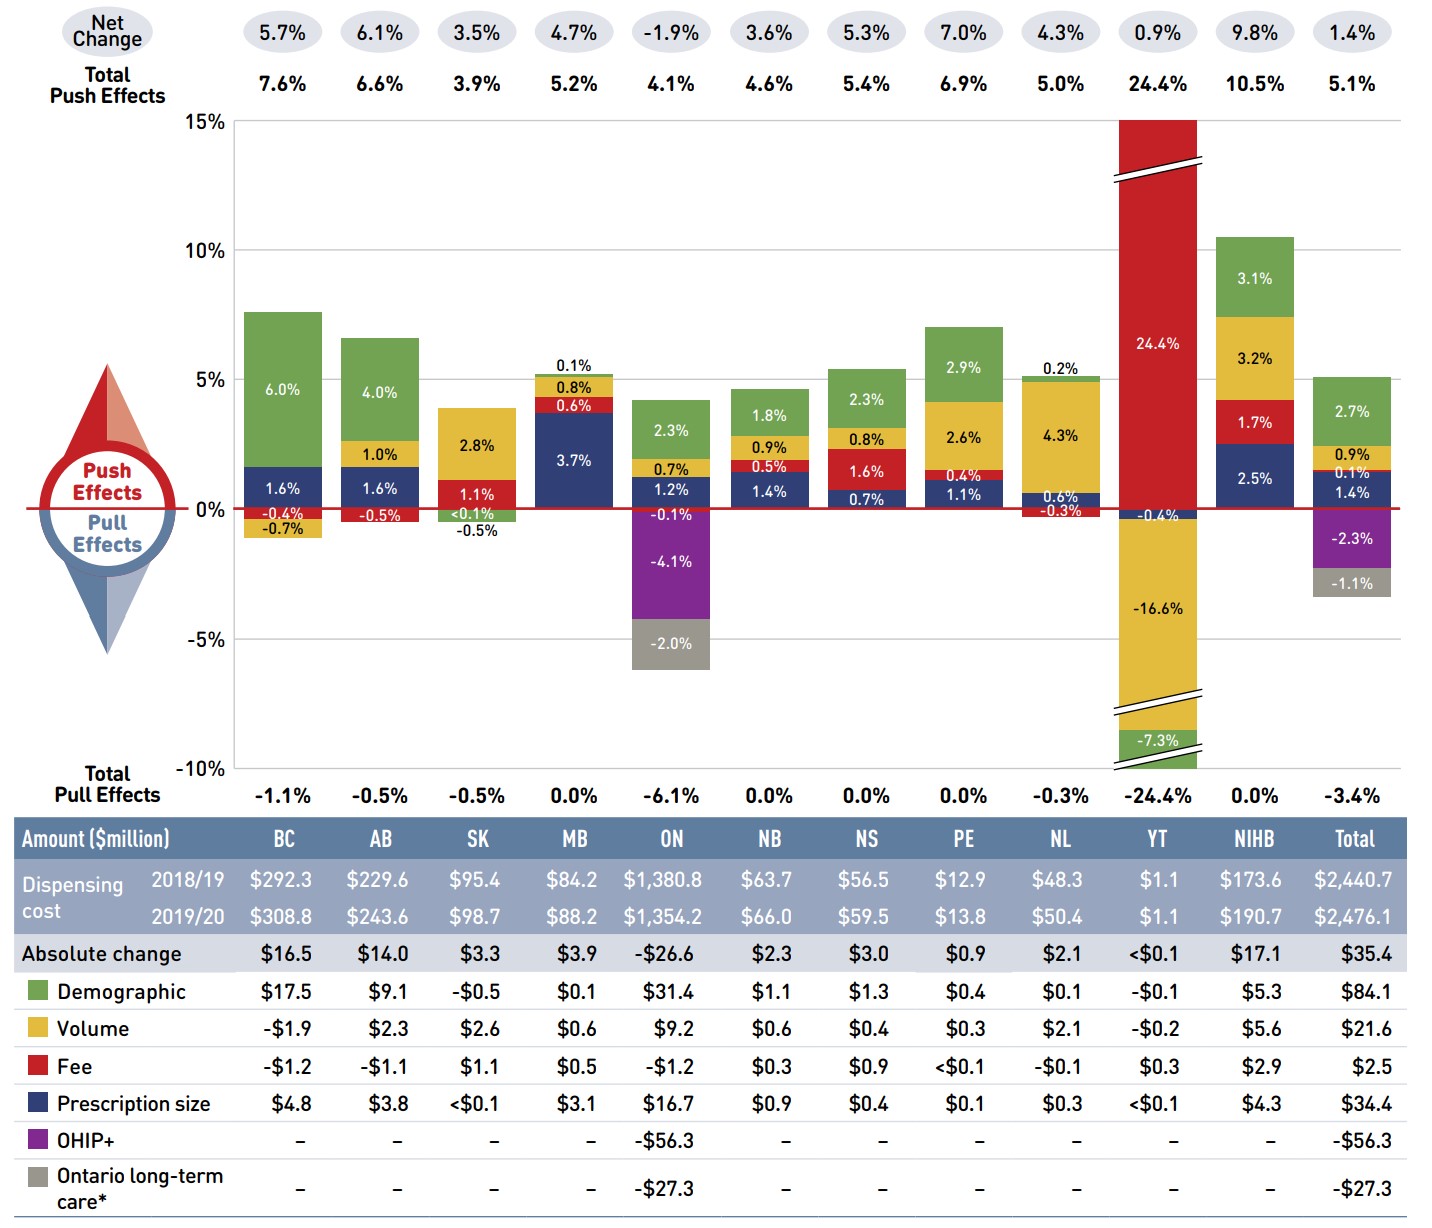
Figure description
This column graph and table describe the key factors or effects that impacted the rates of change in dispensing costs for each of the NPDUIS public drug plans from 2018/19 to 2019/20. Each column is broken out to give the positive or negative contribution of each effect: demographic; volume; fee; and prescription size. The effects of Ontario long-term care and the recently introduced Ontario Health Insurance Plan Plus (OHIP+) program are shown separately. The total positive push effect, negative pull effect, and net change are given for each year.
| British Columbia | Alberta | Saskatchewan | Manitoba | Ontario | New Brunswick | Nova Scotia | Prince Edward Island | Newfoundland and Labrador | Yukon | Non-Insured Health Benefits | Total | |
|---|---|---|---|---|---|---|---|---|---|---|---|---|
Demographic |
6.0% |
4.0% |
-0.5% |
0.1% |
2.3% |
1.8% |
2.3% |
2.9% |
0.2% |
-7.3% |
3.1% |
2.7% |
Volume |
-0.7% |
1.0% |
2.8% |
0.8% |
0.7% |
0.9% |
0.8% |
2.6% |
4.3% |
-16.6% |
3.2% |
0.9% |
Fee |
-0.4% |
-0.5% |
1.1% |
0.6% |
-0.1% |
0.5% |
1.6% |
0.4% |
-0.3% |
24.4% |
1.7% |
0.1% |
Prescription size |
1.6% |
1.6% |
<0.1% |
3.7% |
1.2% |
1.4% |
0.7% |
1.1% |
0.6% |
-0.4% |
2.5% |
1.4% |
OHIP+ |
– |
– |
– |
– |
-4.1% |
– |
– |
– |
– |
– |
– |
-2.3% |
Ontario long-term care |
– |
– |
– |
– |
-2.0% |
– |
– |
– |
– |
– |
– |
-1.1% |
Total push effect |
7.6% |
6.6% |
3.9% |
5.2% |
4.1% |
4.6% |
5.4% |
6.9% |
5.0% |
24.4% |
10.5% |
5.1% |
Total pull effect |
-1.1% |
-0.5% |
-0.5% |
0.0% |
-6.1% |
0.0% |
0.0% |
0.0% |
-0.3% |
-24.4% |
0.0% |
-3.4% |
Net change |
5.7% |
6.1% |
3.5% |
4.7% |
-1.9% |
3.6% |
5.3% |
7.0% |
4.3% |
0.9% |
9.8% |
1.4% |
An accompanying table gives the corresponding changes in millions of dollars, as well as the total dispensing costs in 2018/19 and 2019/20 and the absolute change for each plan.
| British Columbia | Alberta | Saskatchewan | Manitoba | Ontario | New Brunswick | Nova Scotia | Prince Edward Island | Newfoundland and Labrador | Yukon | Non-Insured Health Benefits | Total | |
|---|---|---|---|---|---|---|---|---|---|---|---|---|
Dispensing cost 2018/19 |
$292.3 |
$229.6 |
$95.4 |
$84.2 |
$1,380.8 |
$63.7 |
$56.5 |
$12.9 |
$48.3 |
$1.1 |
$173.6 |
$2,440.7 |
Dispensing cost 2019/20 |
$308.8 |
$243.6 |
$98.7 |
$88.2 |
$1,354.2 |
$66.0 |
$59.5 |
$13.8 |
$50.4 |
$1.1 |
$190.7 |
$2,476.1 |
Absolute change |
$16.5 |
$14.0 |
$3.3 |
$3.9 |
-$26.6 |
$2.3 |
$3.0 |
$0.9 |
$2.1 |
<$0.1 |
$17.1 |
$35.4 |
Demographic |
$17.5 |
$9.1 |
-$0.5 |
$0.1 |
$31.4 |
$1.1 |
$1.3 |
$0.4 |
$0.1 |
-$0.1 |
$5.3 |
$84.1 |
Volume |
-$1.9 |
$2.3 |
$2.6 |
$0.6 |
$9.2 |
$0.6 |
$0.4 |
$0.3 |
$2.1 |
-$0.2 |
$5.6 |
$21.6 |
Fee |
-$1.2 |
-$1.1 |
$1.1 |
$0.5 |
-$1.2 |
$0.3 |
$0.9 |
<$0.1 |
-$0.1 |
$0.3 |
$2.9 |
$2.5 |
Prescription size |
$4.8 |
$3.8 |
<$0.1 |
$3.1 |
$16.7 |
$0.9 |
$0.4 |
$0.1 |
$0.3 |
<$0.1 |
$4.3 |
$34.4 |
OHIP+ |
– |
– |
– |
– |
-$56.3 |
– |
– |
– |
– |
– |
– |
-$56.3 |
Ontario long-term care |
– |
– |
– |
– |
-$27.3 |
– |
– |
– |
– |
– |
– |
-$27.3 |
Note: Values may not add to totals due to rounding and the cross effect.
* Long-term care (LTC) prescriptions in Ontario have been excluded from the dispensing costs analysis since 2017/18, as their dispensing patterns may differ from those of the general beneficiary population.
Data source: National Prescription Drug Utilization Information System Database, Canadian Institute for Health Information.
The contribution of the fee effect, which reflects changes in the average dispensing fee per prescription, is directly related to the reimbursement policies of each public drug plan.
In 2019/20, the rates of change in the average dispensing fee per prescription varied across NPDUIS drug plans. Most plans showed modest changes ranging from -0.5% to 1.7%, with the exception of Yukon. Over the past five years, Yukon, Prince Edward Island, and the NIHB have had a relatively high growth in fees, with compound annual growth rates of 4.4%, 2.3%, and 1.0%, respectively.
Table 3.1 reports the average dispensing fee per prescription from 2014/15 to 2019/20, along with the rate of growth between 2018/19 and 2019/20 and the compound annual growth rate for the entire period. The results are an average across all prescriptions and include a range of dispensing fees. An overview of the dispensing fee policies of the NPDUIS public drug plans is available on the PMPRB website.
Table 3.1 Average dispensing fee per prescription, NPDUIS public drug plans, 2014/15 to 2019/20
| Jurisdiction | 2014/15 | 2015/16 | 2016/17 | 2017/18 | 2018/19 | 2019/20 | Growth rate, 2018/19 to 2019/20 | CAGR*, 2014/15 to 2019/20 |
|---|---|---|---|---|---|---|---|---|
British Columbia |
$7.35 |
$7.30 |
$7.26 |
$7.18 |
$7.13 |
$7.10 |
-0.4% |
-0.7% |
Alberta |
$14.13 |
$14.29 |
$14.33 |
$14.45 |
$14.18 |
$14.11 |
-0.5% |
<-0.1% |
Saskatchewan |
$10.82 |
$10.91 |
$10.97 |
$10.92 |
$10.92 |
$11.04 |
1.1% |
0.4% |
Manitoba |
$9.19 |
$9.35 |
$9.48 |
$8.82 |
$8.19 |
$8.24 |
0.6% |
-2.1% |
Ontario† |
$7.72 |
$7.72 |
$7.59 |
$7.55 |
$7.58 |
$7.58 |
-0.1% |
-0.4% |
New Brunswick |
$10.41 |
$10.54 |
$10.54 |
$10.48 |
$10.43 |
$10.48 |
0.5% |
0.1% |
Nova Scotia |
$11.31 |
$11.19 |
$11.25 |
$11.32 |
$11.48 |
$11.67 |
1.6% |
0.6% |
Prince Edward Island |
$10.21 |
$10.93 |
$11.03 |
$11.23 |
$11.38 |
$11.42 |
0.4% |
2.3% |
Newfoundland and Labrador |
$12.19 |
$12.34 |
$12.39 |
$12.38 |
$12.41 |
$12.37 |
-0.3% |
0.3% |
Yukon |
$5.77 |
$5.76 |
$5.80 |
$5.81 |
$5.76 |
$7.16 |
24.4% |
4.4% |
NIHB |
$8.71 |
$8.76 |
$8.92 |
$8.97 |
$9.02 |
$9.17 |
1.7% |
1.0% |
Note: This analysis only includes data for beneficiaries that met their deductible and received public reimbursement.
* Compound annual growth rate.
† Ontario long-term care (LTC) sub-plan prescriptions were excluded from all years of this analysis as their dispensing patterns may differ from those of the general beneficiary population. The addition of Ontario’s OHIP+ program, implemented in the last quarter of 2017/18, was also excluded from this analysis to allow for comparison with historical results.
Data source: National Prescription Drug Utilization Information System Database, Canadian Institute for Health Information.
Various plans have specific policies in place related to fill frequency and compensation. The average dispensing fee per prescription is also related to prescription size: plans with lower average dispensing fees generally reimburse prescriptions with shorter days’ supply and vice versa. Manitoba, the NIHB, British Columbia, and Ontario, which had some of the lowest dispensing fees in 2019/20, generally reimbursed prescriptions with relatively small average sizes. Decreases in the average days’ supply per prescription can exert an upward pressure on dispensing costs, as a greater number of prescriptions are required to dispense the same volume of drugs.
The results for the average days’ supply per prescription suggest that prescription size declined in all public drug plans from 2018/19 to 2019/20. Manitoba and Prince Edward Island had the largest proportional decreases in average prescription size, at -4.7% and -3.3%, respectively.
Figure 3.3 depicts the trend in average days’ supply per prescription from 2014/15 to 2019/20. The results represent the average across all prescriptions for oral solid formulations and encompass brand-name and generic medicines for both acute and maintenance therapies.
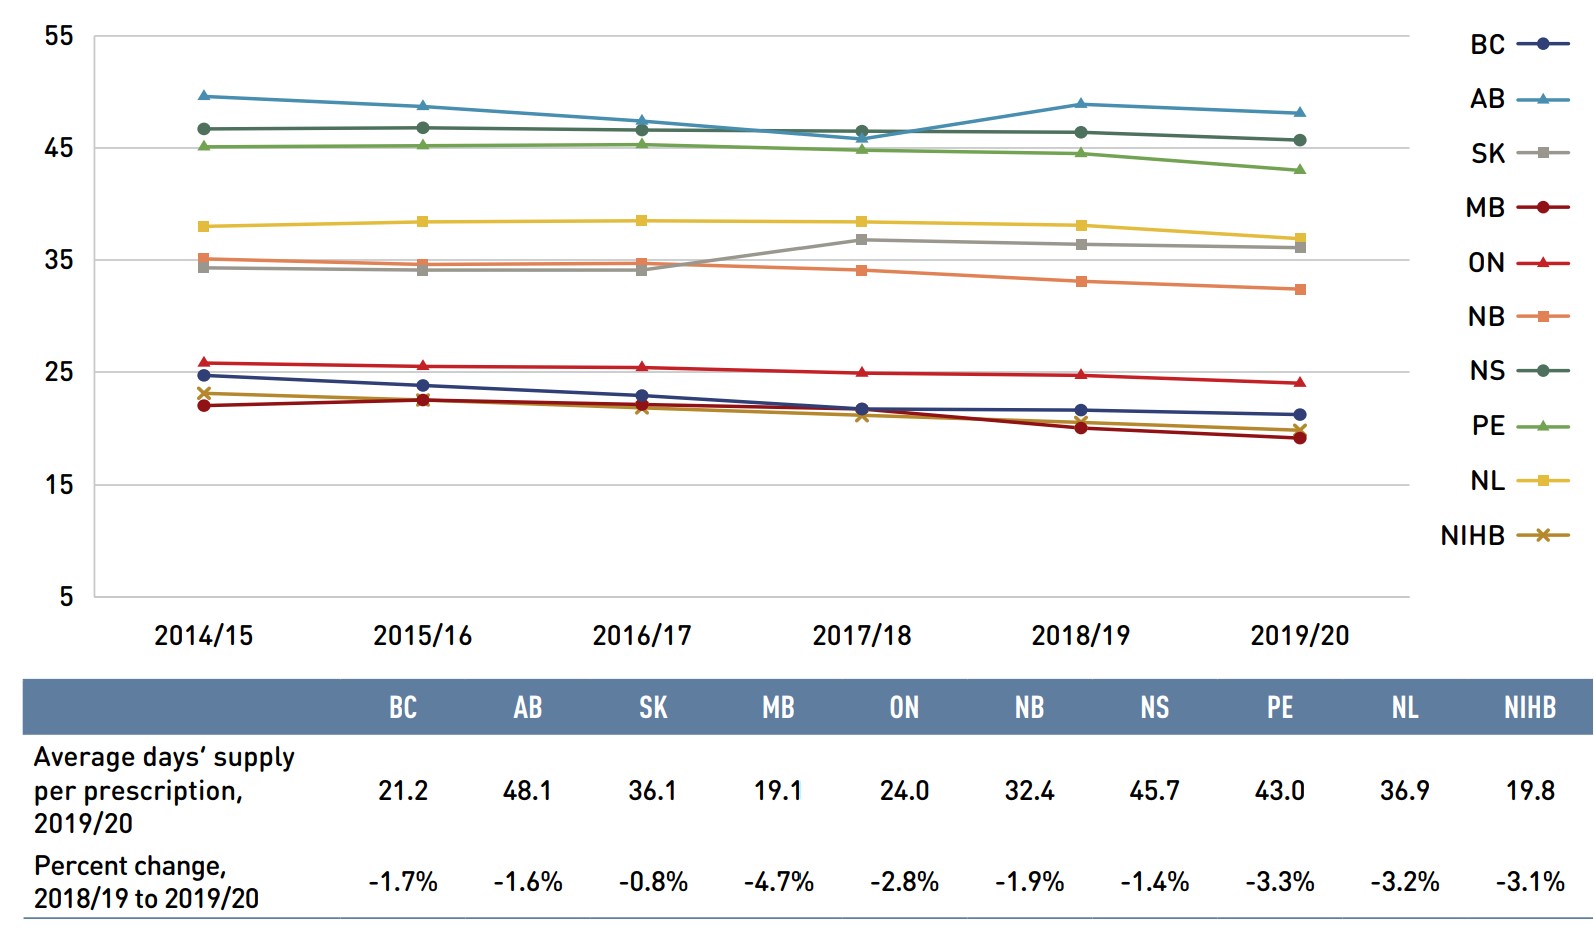
Figure description
This line graph shows the trend in average days’ supply per prescription 2014/15 to 2019/20 for each NPDUIS public drug plan. A table below the graph shows the average days’ supply per prescription for 2019/20 and the percent change from 2018/19 to 2019/20.
| 2014/15 | 2015/16 | 2016/17 | 2017/18 | 2018/19 | 2019/20 | Percent change, 2018/19 to 2019/20 | |
|---|---|---|---|---|---|---|---|
British Columbia |
24.7 |
23.8 |
22.9 |
21.7 |
21.6 |
21.2 |
-1.7% |
Alberta |
49.6 |
48.7 |
47.4 |
45.8 |
48.9 |
48.1 |
-1.6% |
Saskatchewan |
34.3 |
34.1 |
34.1 |
36.8 |
36.4 |
36.1 |
-0.8% |
Manitoba |
22.0 |
22.5 |
22.1 |
21.7 |
20.0 |
19.1 |
-4.7% |
Ontario |
25.8 |
25.5 |
25.4 |
24.9 |
24.7 |
24.0 |
-2.8% |
New Brunswick |
35.1 |
34.6 |
34.7 |
34.1 |
33.1 |
32.4 |
-1.9% |
Nova Scotia |
46.7 |
46.8 |
46.6 |
46.5 |
46.4 |
45.7 |
-1.4% |
Prince Edward Island |
45.1 |
45.2 |
45.3 |
44.8 |
44.5 |
43.0 |
-3.3% |
Newfoundland and Labrador |
38.0 |
38.4 |
38.5 |
38.4 |
38.1 |
36.9 |
-3.2% |
Non-Insured Health Benefits |
23.1 |
22.5 |
21.8 |
21.1 |
20.5 |
19.8 |
-3.1% |
Note: This analysis only includes data for beneficiaries that met their deductible and received public reimbursement.
The analysis was limited to data for oral solid formulations. Yukon is not reported due to data limitations.
Data source: National Prescription Drug Utilization Information System Database, Canadian Institute for Health Information.
Although the average days’ supply and dispensing fee per prescription are useful measures for comparison, the roster of medicines covered by each plan also factors into the average dispensing cost. Comparing the dispensing costs for the same suite of medicines can provide greater insight into the differences between plans.
Figure 3.4 compares the dispensing costs across jurisdictions for the generic medicines reduced to 10% (previously 18%) of their brand-name reference price through the 2018 pCPA–CGPA agreement. Dispensing costs for one million tablets of each medicine are given for two fiscal years: 2014/15 and 2019/20. These medicines collectively accounted for 17.9% and 19.9% of the total NPDUIS public drug plan dispensing costs in 2014/15 and 2019/20, respectively.
Dispensing costs for the select medicines were stable or increased between 2014/15 and 2018/19 in most provinces, although the size of the changes varied considerably. The highest rates of increase were observed in the NIHB and Prince Edward Island, while Saskatchewan experienced a notable decrease. In more than half of the NPDUIS plans—British Columbia, Saskatchewan, Manitoba, New Brunswick, Newfoundland and Labrador, and the NIHB—dispensing costs for one million tablets exceeded $200,000 in 2019/20.
While the same medicines were studied across all plans, the disease profile of the beneficiary populations and the type of therapy for which the medicines were prescribed (acute or maintenance) influenced the average days’ supply and, hence, the overall dispensing costs for each jurisdiction.
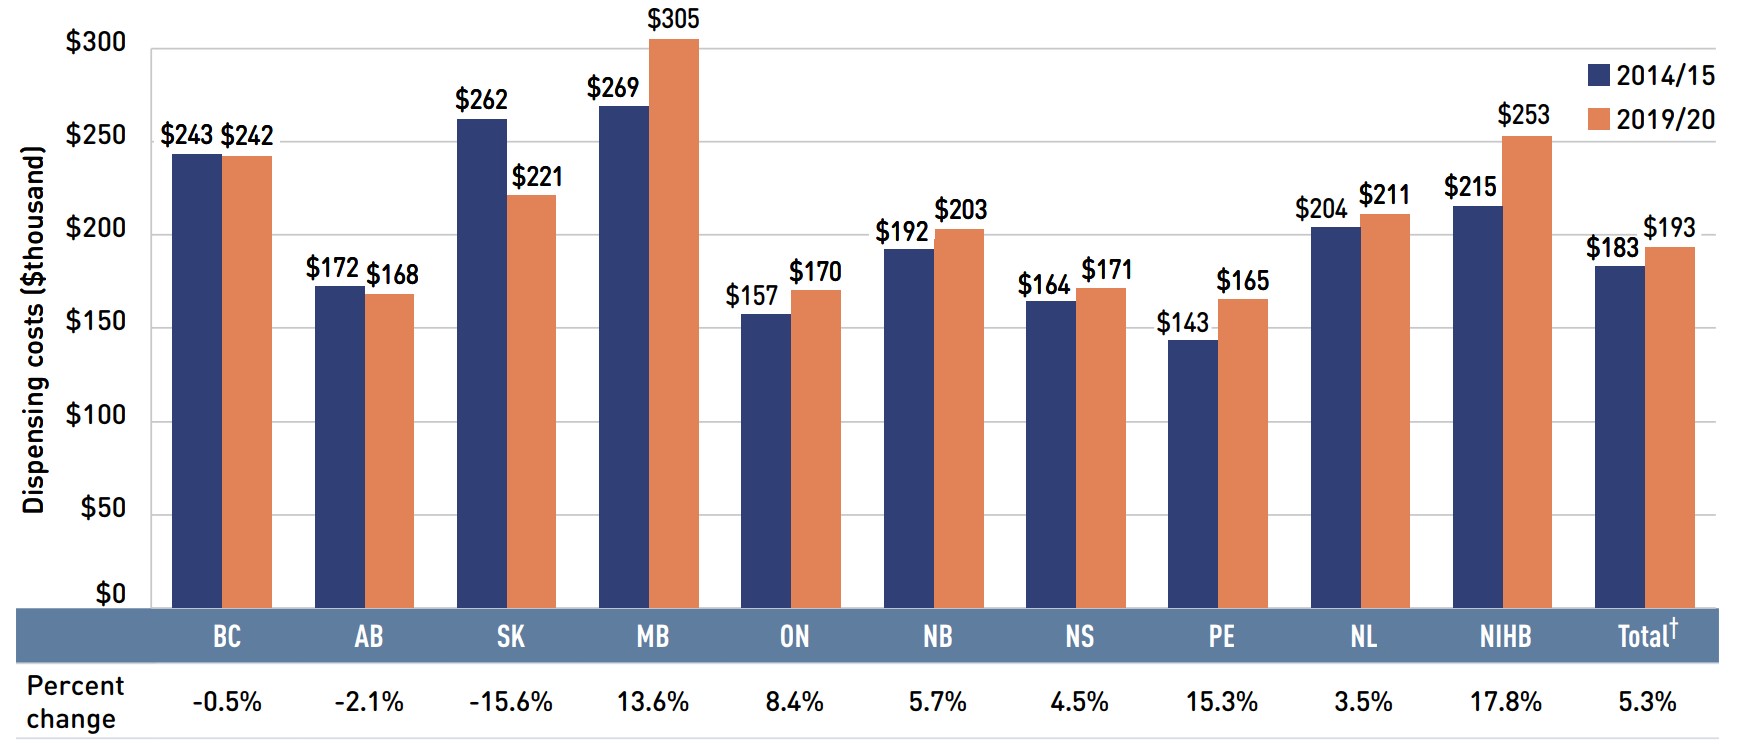
Figure description
This bar graph shows the dispensing cost in thousands of dollars for one million tablets of the generic medicines reduced to 10% of their brand reference price through recent pan-Canadian Pharmaceutical Alliance policy initiative. The dispensing costs are given for 2014/15 and 2019/20 for each NPDUIS public drug plan, as well as total results for all plans. A table below the graph gives the percent change over the period.
| British Columbia | Alberta | Saskatchewan | Manitoba | Ontario | New Brunswick | Nova Scotia | Prince Edward Island | Newfoundland and Labrador | Non-Insured Health Benefits | Total† | |
|---|---|---|---|---|---|---|---|---|---|---|---|
2014/15 |
$243 |
$172 |
$262 |
$269 |
$157 |
$192 |
$164 |
$143 |
$204 |
$215 |
$183 |
2019/20 |
$242 |
$168 |
$221 |
$305 |
$170 |
$203 |
$171 |
$165 |
$211 |
$253 |
$193 |
Percent change |
-0.5% |
-2.1% |
-15.6% |
13.6% |
8.4% |
5.7% |
4.5% |
15.3% |
3.5% |
17.8% |
5.3% |
Note: Long-term care homes were excluded from this analysis, as they may not have a typical dispensing frequency due to the more specialized needs of their patients. The following sub-plans were not included in the analysis: BC: Permanent Residents of Licensed Residential Care Facilities; MB: Personal Home Care/Nursing Homes; NB: Individuals in Licensed Residential Facilities, Nursing Home Residents; ON: Long Term Care, Home Care and Homes for Special Care. Yukon is not reported due to data limitations.
* Subject to the pCPA–CGPA agreement that reduced the prices of these medicines to 10% of their brand-name reference price: atorvastatin, ramipril, venlafaxine, amlodipine, omeprazole, rabeprazole, rosuvastatin, pantoprazole, citalopram, simvastatin, clopidogrel, gabapentin, metformin, olanzapine, olanzapine ODT, donepezil, ezetimibe, quetiapine, ranitidine, and zopiclone.
† Total results for the drug plans captured in this figure.
Data source: National Prescription Drug Utilization Information System Database, Canadian Institute for Health Information.
Appendix A: Drug Reviews and Approvals
In Canada, Health Canada, the Patented Medicine Prices Review Board (PMPRB), and the Canadian Agency for Drugs and Technologies in Health (CADTH) are responsible for drug approvals, price reviews, and health technology assessments, respectively. This appendix provides an overview of recent trends in drug reviews and approvals.Footnote iv
Health Canada
Health Canada grants the authority to market a drug in Canada by issuing a Notice of Compliance (NOC) once it has met the regulatory requirements for safety, efficacy, and quality. In 2019, Health Canada issued NOCs for 35 new active substances: 10 biologics and 25 small molecule pharmaceuticals.
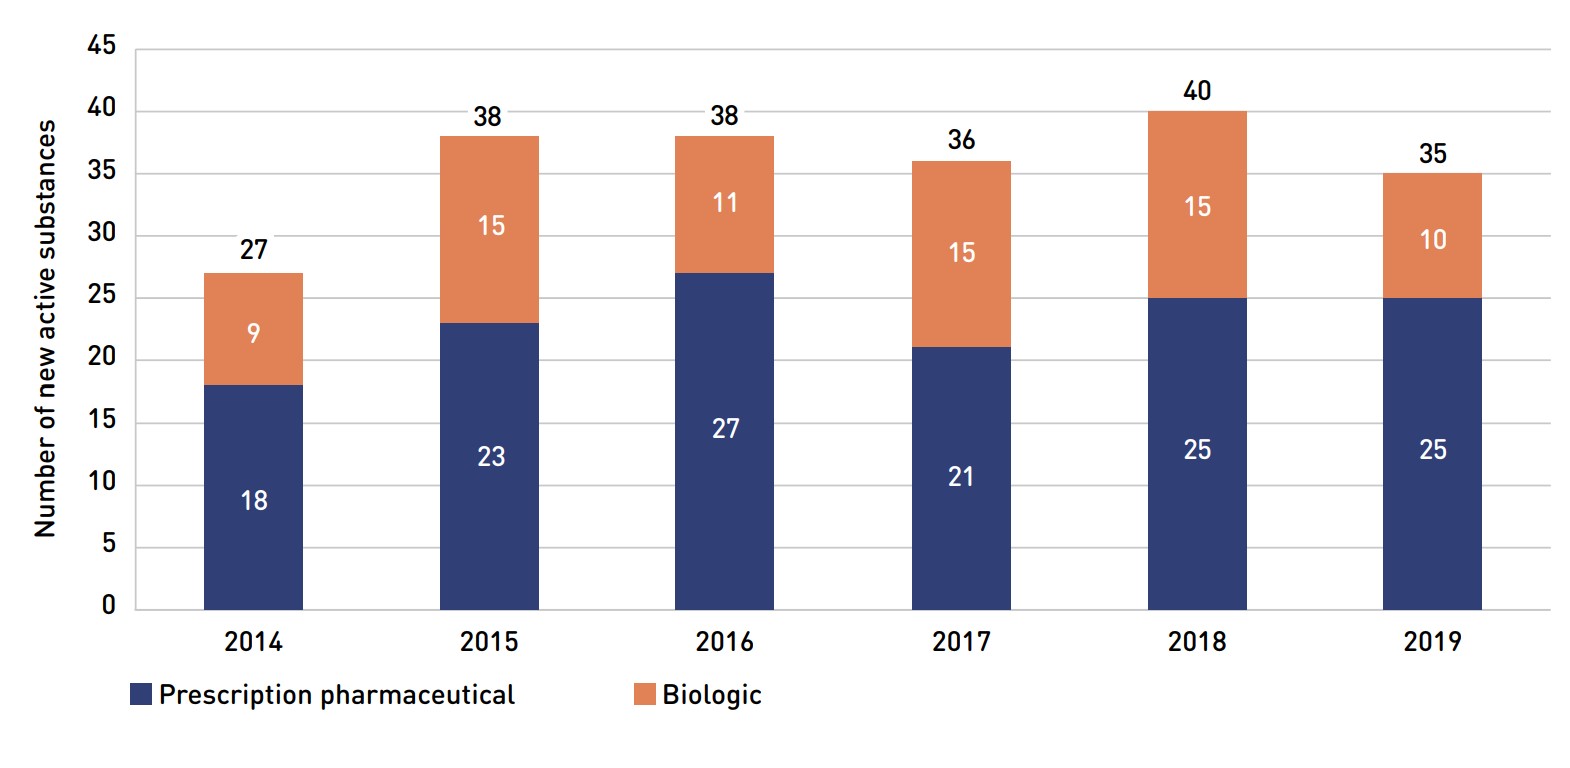
Figure description
This stacked column graph shows the number of new active substances approved by Health Canada from 2014 to 2019. The number of prescription pharmaceuticals and biologics are given for each year.
| Prescription pharmaceutical | Biologic | Total | |
|---|---|---|---|
2014 |
18 |
9 |
27 |
2015 |
23 |
15 |
38 |
2016 |
27 |
11 |
38 |
2017 |
21 |
15 |
36 |
2018 |
25 |
15 |
40 |
2019 |
25 |
10 |
35 |
Note: “Prescription pharmaceutical” and “biologic” are terms used to define product types when submitting a Notice of Compliance (NOC) to Health Canada.
Data source: Notice of Compliance Database, Health Canada.
Patented Medicine Prices Review Board
The PMPRB reviews the factory-gate prices of patented medicines sold in Canada and ensures that they are not excessive. As part of the current price review process, the PMPRB’s Human Drug Advisory Panel (HDAP) evaluates each new medicine and assigns a recommended level of therapeutic improvement.
The PMPRB completed scientific reviews for 179 of the 214 medicines approved by Heath Canada between 2014 and 2019. Over this six-year period, only 8% were classified in the Substantial Improvement or Breakthrough categories. Three quarters of the medicines reviewed demonstrated Slight or No Improvement over existing therapies, while 17% were classified in the Moderate Improvement category (Figure A2).
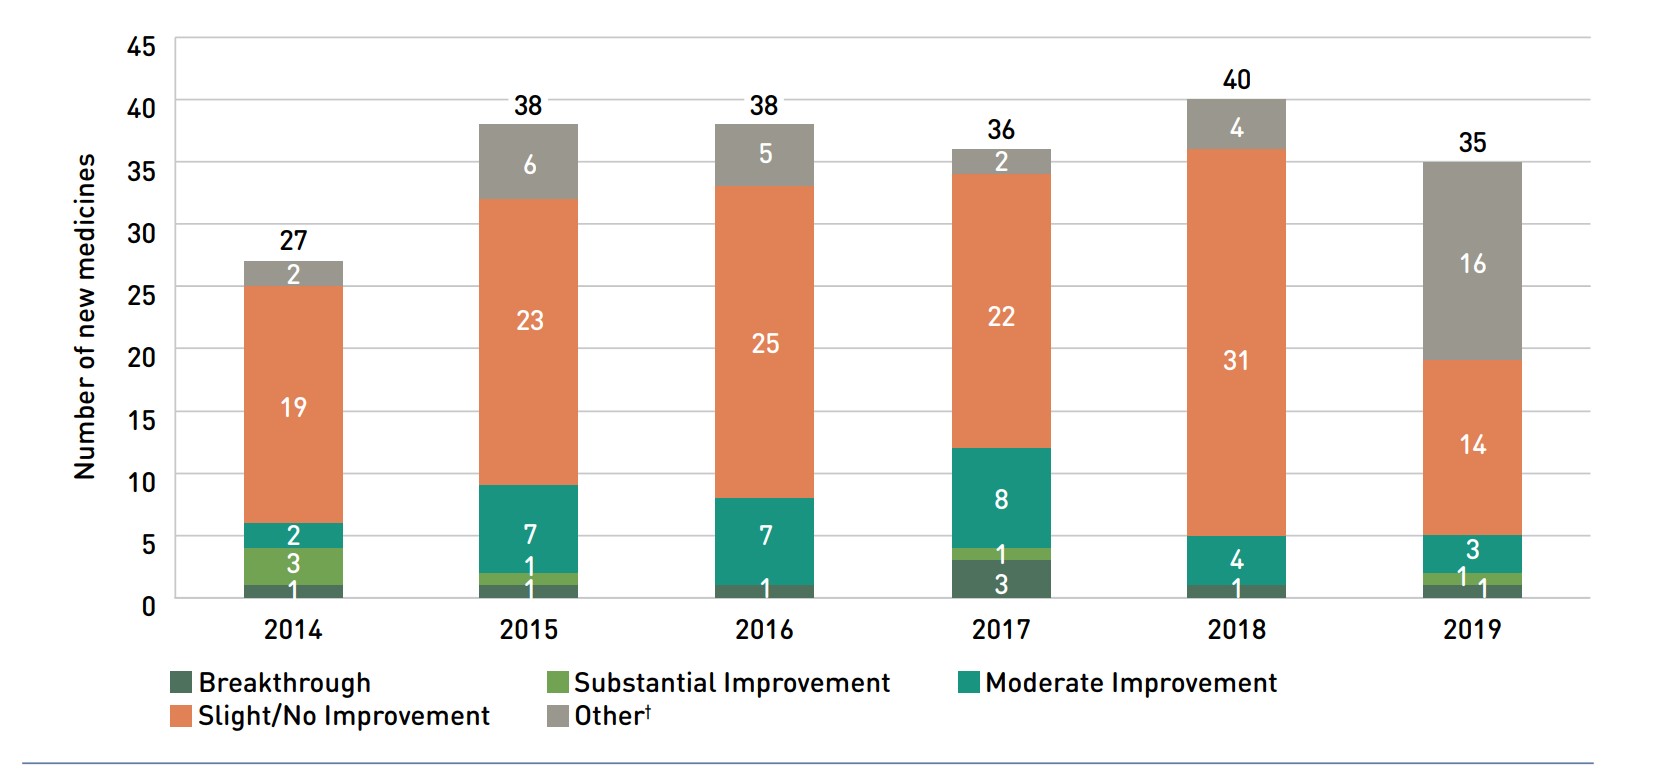
Figure description
This stacked column graph gives the distribution of new medicines reviewed by the Patented Medicine Prices Review Board from 2014 to 2019 by their assessed level of therapeutic improvement.
| Breakthrough | Substantial Improvement | Moderate Improvement | Slight or No Improvement | Other† | Total | |
|---|---|---|---|---|---|---|
2014 |
1 |
3 |
2 |
19 |
2 |
27 |
2015 |
1 |
1 |
7 |
23 |
6 |
38 |
2016 |
1 |
0 |
7 |
25 |
5 |
38 |
2017 |
3 |
1 |
8 |
22 |
2 |
36 |
2018 |
1 |
0 |
4 |
31 |
4 |
40 |
2019 |
1 |
1 |
3 |
14 |
16 |
35 |
* The year of reporting reflects the year in which the Notice of Compliance was issued (Figure A1) rather than the year that the PMPRB conducted its price review.
† New medicines not reported to the PMPRB as of the 2019 Annual Report.
Data source: Notice of Compliance Database, Health Canada; Patented Medicine Prices Review Board (PMPRB).
Canadian Agency for Drugs and Technologies in Health
CADTH’s Common Drug Review (CDR) provides reimbursement recommendations and advice to Canada’s publicly funded drug plans (except for Quebec) based on an evaluation of the clinical, economic, and patient evidence of drugs marketed in Canada. The jurisdictions take these recommendations under advisement when making formulary listing decisions and in price negotiations.
Figure A3 summarizes the CDR recommendations for fiscal years 2014/15 to 2019/20.Footnote v The total number of CDR recommendations has varied from year to year, with a high of 51 in 2016/17. In 2019/20, 31 recommendations were issued: 26 medicines were recommended as “reimburse with clinical criteria and/or conditions” and five received a “do not reimburse” recommendation.
In October 2020, CADTH consolidated its multiple-pathway product review processes (e.g., the pan-Canadian Oncology Drug Review and the Common Drug Review programs) into one pathway. Future editions of this report will reflect the newly aligned CADTH Drug Reimbursement Review process.
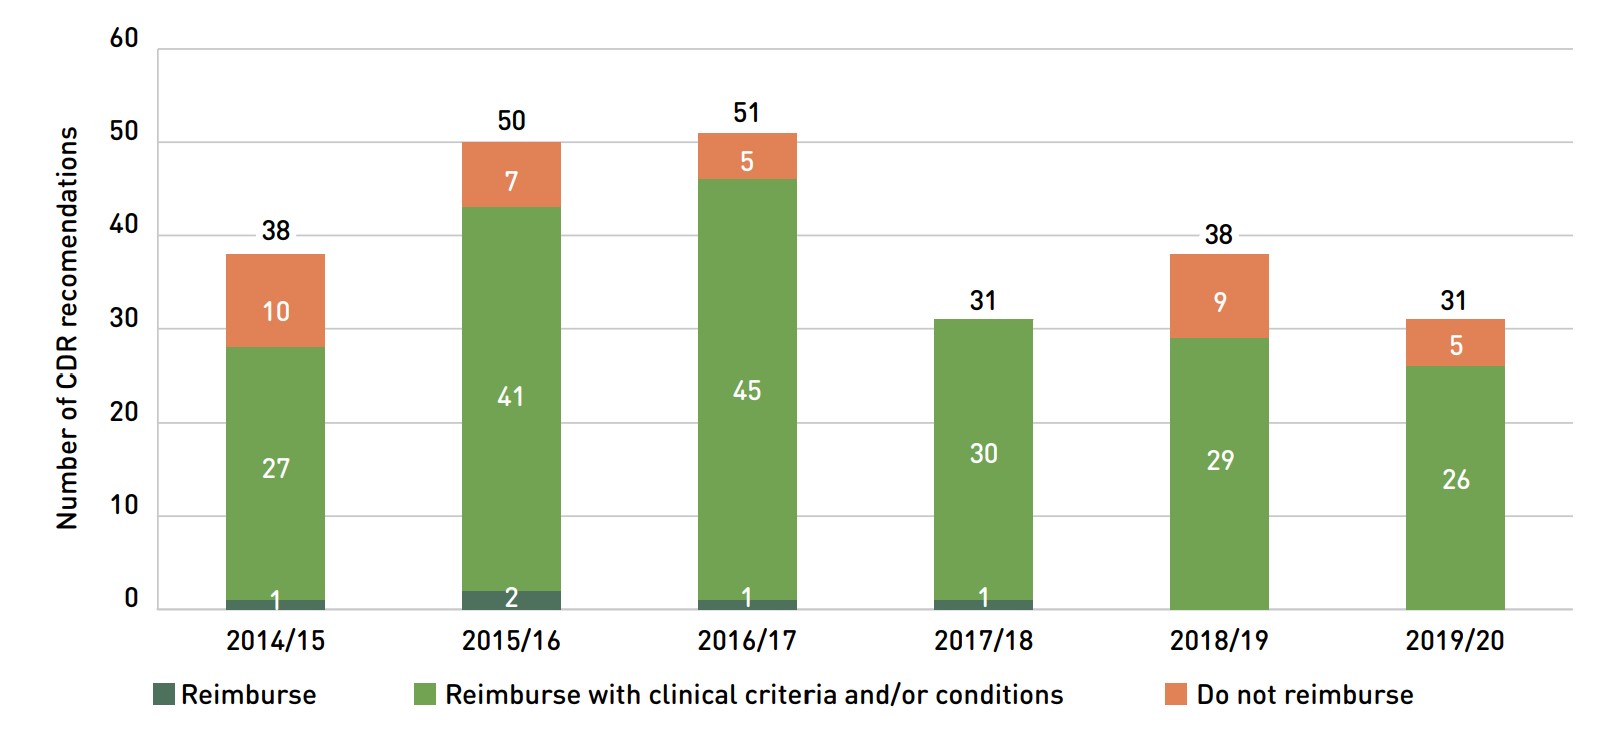
Figure description
The column graph shows the total number of Common Drug Review reimbursement recommendations from 2014/15 to 2019/20 broken out by category of recommendation.
| Reimburse | Reimburse with clinical criteria and/or conditions | Do not reimburse | Total | |
|---|---|---|---|---|
2014/15 |
1 |
27 |
10 |
38 |
2015/16 |
2 |
41 |
7 |
50 |
2016/17 |
1 |
45 |
5 |
51 |
2017/18 |
1 |
30 |
– |
31 |
2018/19 |
– |
29 |
9 |
38 |
2019/20 |
– |
26 |
5 |
31 |
Note: Drugs may have multiple recommendations if they are reviewed for more than one indication. CADTH currently uses three possible recommendation categories to guide the reimbursement decisions of participating jurisdictions. For this analysis, “Reimburse with clinical criteria and/or conditions” includes recommendations completed prior to May 2016 for “List with clinical criteria and/or conditions,” “List in a similar manner to other drugs in class,” and “Do not list at submitted price”. “Reimburse” is equivalent to the previous “List” category, and likewise, “Do not reimburse” corresponds to “Do not list”.
Data source: CADTH Common Drug Review Reports.
Appendix B: Distribution of Patients on Biosimilar Initiative Medicines by Jurisdiction, 2019/20
Recently, numerous Canadian public payers have announced or undertaken initiatives to increase biosimilar uptake. In 2019, British Columbia became the first Canadian province to initiate a switch to biosimilar medicines for patients covered under the PharmaCare program. Since its launch in May 2019, the two-phase non-medical switching policy in British Columbia has required originator biologic patients on Remicade (infliximab), Enbrel (etanercept), and Lantus (insulin glargine, 100 IU/ml) for select indications to switch to a biosimilar.
To monitor the uptake of biosimilars and explore the early impact of switching policies in the public drug plans, Figures B1 and B2 present the distribution of public plan patients on anti-TNF-α drugs and insulin glargine by NPDUIS jurisdiction. Future editions of this report will continue to monitor the impact of these initiatives as they take effect.
Figure description
A stacked bar graph breaks down the distribution of patients on an anti-tumor necrosis factor (TNF)-alpha drug for each of the NPDUIS public plans in 2019/20. The distribution is also given for the total across all plans. A table below the graph shows the total number of patients for this class of medicines.
| British Columbia | Alberta | Saskatchewan | Manitoba | Ontario | New Brunswick | Nova Scotia | Prince Edward Island | Newfoundland and Labrador | Yukon | Non-Insured Health Benefits | Total | |
|---|---|---|---|---|---|---|---|---|---|---|---|---|
Humira (adalimumab) |
44% |
40% |
35% |
43% |
37% |
37% |
42% |
49% |
48% |
40% |
37% |
40% |
Remicade (infliximab) |
5% |
26% |
31% |
20% |
21% |
23% |
23% |
27% |
18% |
13% |
8% |
18% |
Infliximab biosimilars |
20% |
5% |
1% |
7% |
5% |
2% |
1% |
<1% |
1% |
8% |
3% |
8% |
Enbrel (etanercept) |
1% |
11% |
13% |
17% |
17% |
14% |
17% |
11% |
8% |
9% |
21% |
12% |
Etanercept biosimilars |
18% |
4% |
4% |
4% |
7% |
3% |
2% |
2% |
2% |
15% |
10% |
9% |
Other anti-TNF-α drugs |
11% |
12% |
17% |
9% |
13% |
21% |
15% |
10% |
22% |
15% |
21% |
13% |
Total number of anti-TNF-α patients |
12,411 |
8,381 |
3,496 |
3,136 |
17,033 |
1,299 |
1,453 |
318 |
740 |
84 |
1,601 |
49,952 |
Note: Other anti-TNF-α drugs included Simponi and Cimzia.
Results do not distinguish between indications.
Totals may not add to 100% due to rounding
Data source: National Prescription Drug Utilization Information System Database, Canadian Institute for Health Information.
Figure description
A stacked bar graph breaks down the distribution of patients on insulin glargine by originator biologic (Lantus) and biosimilars for each of the NPDUIS public plans in 2019/20. The distribution is also given for the total across all plans. A table below the graph shows the total number of public plan patients using insulin glargine.
| British Columbia | Alberta | Saskatchewan | Manitoba | Ontario | New Brunswick | Nova Scotia | Prince Edward Island | Newfoundland and Labrador | Yukon | Non-Insured Health Benefits | Total | |
|---|---|---|---|---|---|---|---|---|---|---|---|---|
Lantus |
14% |
93% |
97% |
91% |
98% |
33% |
32% |
13% |
4% |
17% |
97% |
82% |
Insulin glargine biosimilars |
86% |
7% |
3% |
9% |
2% |
67% |
68% |
87% |
96% |
83% |
3% |
18% |
Total number of patients |
18,778 |
21,782 |
11,331 |
4,116 |
92,695 |
4,896 |
5,412 |
1,455 |
3,786 |
184 |
17,169 |
181,604 |
Note: Totals may not add to 100% due to rounding.
* For comparison purposes, this analysis only considers patients using the 100 IU/ml strength of insulin glargine; those using 300 IU/ml or a multi-strength 100 IU/ml + 300 IU/ml were excluded.
Data source: National Prescription Drug Utilization Information System Database, Canadian Institute for Health Information.
Appendix C: Annual Rates of Change in Drug Costs for the Non-Insured Health Benefits (NIHB) Program, 2017/18 to 2019/20
Unlike most NPDUIS public drug plans, the NIHB program covers a significant range of medical supplies and equipment (MS&E). To isolate the growth in NIHB drug costs for pharmaceuticals, Table C1 provides the annual rates of increase including and excluding MS&E.
Table C1 Annual rates of change in drug costs for the Non-Insured Health Benefits (NIHB) Program, 2017/18 to 2019/20
Total NIHB program |
NIHB program without MS&Es* |
NIHB MS&Es |
|
2017/18 |
14.6% |
15.1% |
9.9% |
2018/19 |
3.4% |
2.3% |
13.8% |
2019/20 |
9.8% |
9.7% |
10.9% |
CAGR† |
9.2% |
8.9% |
11.5% |
* Medical supplies and equipment (MS&E) were identified based on the PDIN ATC Level 3 code Z99 (pharmaservices, devices, misc. MS&Es), as assigned by the Canadian Institute for Health Information (CIHI). Diabetic supplies were not included in MS&E.
† Compound annual growth rate.
Data source: National Prescription Drug Utilization Information System Database, Canadian Institute for Health Information.
Appendix D: Top 50 Patented Medicines by Drug Cost, NPDUIS Public Drug Plans, 2019/20 ($million)
| Rank | Trade name (medicinal ingredient) | Manufacturer | Total | BC | AB | SK | MB | ON | NB | NS | PE | NL | YT | NIHB |
|---|---|---|---|---|---|---|---|---|---|---|---|---|---|---|
1 |
Humira (adalimumab) |
AbbVie Corporation |
$361.49 |
$101.18 |
$53.81 |
$28.07 |
$30.99 |
$109.26 |
$8.21 |
$11.40 |
$2.61 |
$5.68 |
$0.80 |
$9.49 |
2 |
Eylea (aflibercept) |
Bayer Inc. |
$342.64 |
– |
$5.88 |
$5.21 |
– |
$320.59 |
$6.12 |
– |
$1.12 |
$0.47 |
$0.28 |
$2.96 |
3 |
Epclusa (sofosbuvir/velpatasvir) |
Gilead Sciences Canada Inc. |
$327.85 |
$89.37 |
$21.09 |
$12.18 |
$5.78 |
$156.01 |
$3.01 |
$1.45 |
– |
$4.61 |
$0.84 |
$33.50 |
4 |
Revlimid (lenalidomide) |
Celgene Inc. |
$212.01 |
– |
– |
– |
$13.29 |
$172.87 |
$7.23 |
$9.97 |
$1.06 |
$5.62 |
$0.22 |
$1.75 |
5 |
Eliquis (apixaban) |
Bristol-Myers Squibb Canada |
$179.45 |
$15.58 |
$19.58 |
$5.60 |
$3.56 |
$129.61 |
$1.87 |
$1.46 |
$0.24 |
$0.20 |
$0.09 |
$1.66 |
6 |
Xarelto (rivaroxaban) |
Bayer Inc. |
$128.01 |
$12.29 |
$16.24 |
$5.18 |
$3.26 |
$82.39 |
$2.97 |
$2.27 |
$0.38 |
$0.70 |
$0.01 |
$2.32 |
7 |
Imbruvica (ibrutinib) |
Janssen Inc. |
$119.09 |
– |
– |
– |
$6.43 |
$101.72 |
$3.16 |
$3.74 |
$0.12 |
$3.17 |
$0.13 |
$0.62 |
8 |
Maviret (glecaprevir/pibrentasvir) |
AbbVie Corporation |
$118.21 |
$30.08 |
$5.42 |
$8.13 |
$2.80 |
$56.88 |
$0.91 |
$0.96 |
– |
– |
– |
$13.01 |
9 |
Janumet (sitagliptin / metformin hydrochloride) |
Merck Canada Inc. |
$117.44 |
$0.01 |
$7.56 |
$1.12 |
$0.11 |
$103.14 |
$1.07 |
$0.24 |
<$0.01 |
$0.01 |
– |
$4.19 |
10 |
Lantus (insulin glargine) |
Sanofi-Aventis Canada Inc. |
$117.34 |
$7.77 |
$15.23 |
$9.18 |
$2.88 |
$66.24 |
$1.54 |
$1.73 |
$0.12 |
$0.17 |
$0.04 |
$12.42 |
11 |
Januvia (sitagliptin) |
Merck Canada Inc. |
$116.94 |
$0.01 |
$8.81 |
$2.49 |
$1.43 |
$92.71 |
$2.63 |
$0.76 |
$0.03 |
$0.09 |
$0.01 |
$7.99 |
12 |
Enbrel (etanercept) |
Immunex Corporation |
$112.78 |
$13.58 |
$17.41 |
$7.54 |
$10.82 |
$49.23 |
$3.14 |
$4.12 |
$0.58 |
$1.03 |
$0.24 |
$5.09 |
13 |
Jardiance (empagliflozin) |
Boehringer Ingelheim |
$110.52 |
$3.91 |
$9.84 |
$2.38 |
$1.03 |
$85.29 |
$1.02 |
$0.59 |
$0.07 |
$0.02 |
$0.02 |
$6.34 |
14 |
Advair (salmeterol / fluticasone propionate) |
GlaxoSmithKline Inc. |
$106.32 |
$11.23 |
$12.97 |
$3.43 |
$4.10 |
$62.85 |
$3.39 |
$2.41 |
$0.16 |
$1.24 |
$0.22 |
$4.32 |
15 |
Invega Sustenna (paliperidone) |
Janssen Inc. |
$94.55 |
$19.07 |
$1.40 |
$4.19 |
$2.33 |
$52.89 |
$3.26 |
$0.68 |
$0.17 |
$0.58 |
$0.03 |
$9.95 |
16 |
Prolia (denosumab) |
Amgen Canada Inc. |
$92.35 |
$1.29 |
$2.71 |
$1.11 |
$0.34 |
$86.26 |
$0.19 |
$0.22 |
$0.02 |
$0.02 |
$0.02 |
$0.17 |
17 |
Symbicort (formoterol fumarate dihydrate / budesonide) |
AstraZeneca Canada Inc. |
$84.97 |
$7.36 |
$11.48 |
$2.80 |
$2.16 |
$54.51 |
$1.28 |
$2.19 |
$0.19 |
$0.67 |
$0.08 |
$2.24 |
18 |
Simponi (golimumab) |
Janssen Inc. |
$71.86 |
$13.00 |
$11.70 |
$7.38 |
$4.53 |
$23.06 |
$3.65 |
$2.39 |
$0.41 |
$2.18 |
$0.19 |
$3.37 |
19 |
Entyvio (vedolizumab) |
Takeda Canada Inc. |
$69.94 |
$26.32 |
$9.33 |
$11.31 |
$5.41 |
$12.42 |
$2.00 |
$1.89 |
$0.16 |
$0.50 |
– |
$0.60 |
20 |
Stelara (ustekinumab) |
Janssen Inc. |
$69.59 |
$8.61 |
$12.65 |
$11.53 |
$4.43 |
$24.60 |
$3.12 |
$2.36 |
$0.34 |
$1.00 |
– |
$0.96 |
21 |
Trajenta (linagliptin) |
Boehringer Ingelheim |
$59.60 |
$7.29 |
$3.65 |
$1.05 |
$0.61 |
$44.73 |
$0.68 |
$0.04 |
$0.02 |
$0.01 |
– |
$1.53 |
22 |
Xeljanz (tofacitinib) |
Pfizer Canada ULC |
$59.31 |
$10.05 |
$5.03 |
$2.77 |
$2.70 |
$32.96 |
$0.76 |
$2.04 |
$0.15 |
$0.59 |
$0.12 |
$2.13 |
23 |
Triumeq (abacavir/lamivudine/dolutegravir) |
ViiV Healthcare ULC |
$55.02 |
– |
– |
$1.99 |
$2.99 |
$44.29 |
$1.38 |
– |
– |
$0.23 |
$0.12 |
$4.00 |
24 |
Flovent HFA (fluticasone propionate) |
GlaxoSmithKline Inc. |
$54.84 |
$6.21 |
$2.29 |
$2.58 |
$1.18 |
$29.18 |
$2.31 |
$1.78 |
$0.31 |
$2.28 |
$0.09 |
$6.64 |
25 |
Ibrance (palbociclib) |
Pfizer Canada ULC |
$54.49 |
– |
– |
– |
$1.99 |
$46.52 |
$1.64 |
$2.18 |
$0.21 |
$1.17 |
– |
$0.78 |
26 |
Zytiga (abiraterone acetate) |
Janssen Inc. |
$52.06 |
– |
– |
– |
$2.66 |
$44.25 |
$1.54 |
$2.51 |
$0.26 |
$0.44 |
$0.04 |
$0.37 |
27 |
Breo Ellipta (vilanterol / fluticasone furoate) |
GlaxoSmithKline Inc. |
$50.00 |
$4.77 |
$5.33 |
$1.93 |
$1.56 |
$32.50 |
$1.07 |
$0.88 |
$0.21 |
$0.49 |
$0.04 |
$1.22 |
28 |
Tecfidera (dimethyl fumarate) |
Biogen Canada Inc. |
$48.18 |
$9.51 |
$9.74 |
$6.32 |
$3.61 |
$12.69 |
$2.24 |
$1.64 |
$0.14 |
$1.50 |
$0.20 |
$0.58 |
29 |
Janumet XR (sitagliptin / metformin hydrochloride) |
Merck Canada Inc. |
$47.60 |
– |
$2.39 |
$0.27 |
$0.10 |
$42.09 |
$0.30 |
$0.04 |
<$0.01 |
<$0.01 |
– |
$2.41 |
30 |
Genvoya (emtricitabine/elvitegravir/cobicistat) |
Gilead Sciences Canada Inc. |
$46.55 |
– |
– |
$3.35 |
$2.13 |
$35.37 |
$1.08 |
– |
– |
$0.43 |
$0.15 |
$4.04 |
31 |
Zepatier (grazoprevir/elbasvir) |
Merck Canada Inc. |
$45.94 |
$13.00 |
$3.12 |
$2.15 |
$2.19 |
$19.30 |
$0.45 |
$0.23 |
– |
$0.09 |
– |
$5.41 |
32 |
Abilify Maintena (aripiprazole) |
Otsuka Pharmaceutical Co., Ltd |
$45.94 |
$12.48 |
$0.61 |
$2.34 |
$0.60 |
$25.02 |
$1.22 |
$0.30 |
$0.07 |
$0.30 |
$0.01 |
$2.98 |
33 |
Invokana (canagliflozin) |
Janssen Inc. |
$45.20 |
<$0.01 |
$3.86 |
$1.10 |
$0.51 |
$36.03 |
$0.33 |
$0.01 |
<$0.01 |
$0.01 |
<$0.01 |
$3.33 |
34 |
Soliris (eculizumab) |
Alexion Pharma GmbH |
$45.07 |
– |
$6.42 |
– |
$1.78 |
$34.32 |
$0.54 |
– |
$0.46 |
– |
– |
$1.55 |
35 |
Botox (onabotulinumtoxina) |
Allergan Inc. |
$44.15 |
$6.00 |
$7.05 |
$1.12 |
$1.12 |
$26.52 |
$0.36 |
$0.93 |
– |
– |
$0.07 |
$0.98 |
36 |
Xolair (omalizumab) |
Novartis Pharmaceuticals Canada Inc. |
$43.22 |
$2.80 |
$7.45 |
$1.97 |
$1.68 |
$26.65 |
$0.48 |
$0.74 |
– |
$0.40 |
$0.02 |
$1.02 |
37 |
Entresto (sacubitril/valsartan) |
Novartis Pharmaceuticals Canada Inc. |
$42.11 |
$4.71 |
$3.37 |
$1.14 |
$0.46 |
$29.80 |
$1.01 |
$0.65 |
$0.02 |
$0.14 |
$0.03 |
$0.76 |
38 |
Spiriva (tiotropium) |
Boehringer Ingelheim |
$41.87 |
$2.29 |
$5.83 |
$1.64 |
$0.69 |
$27.13 |
$1.16 |
$1.12 |
$0.15 |
$0.36 |
$0.10 |
$1.40 |
39 |
Orencia (abatacept) |
Bristol-Myers Squibb Canada |
$40.97 |
$12.19 |
$6.51 |
$2.69 |
$1.42 |
$13.96 |
$0.70 |
$1.39 |
$0.27 |
$0.34 |
$0.05 |
$1.46 |
40 |
Jakavi (ruxolitinib) |
Novartis Pharmaceuticals Canada Inc. |
$40.50 |
– |
– |
– |
$1.83 |
$35.05 |
$1.97 |
$1.20 |
– |
$0.28 |
$0.09 |
$0.09 |
41 |
Esbriet (pirfenidone) |
Hoffmann-La Roche Ltd |
$40.45 |
$2.49 |
$6.52 |
$1.13 |
$2.49 |
$23.11 |
$1.24 |
$1.56 |
$0.26 |
$0.89 |
$0.03 |
$0.73 |
42 |
Ofev (nintedanib) |
Boehringer Ingelheim |
$39.19 |
$5.02 |
$5.57 |
$0.81 |
$2.11 |
$21.90 |
$0.79 |
$1.23 |
$0.59 |
$0.41 |
– |
$0.77 |
43 |
Sandostatin LAR (octreotide) |
Novartis Pharmaceuticals Canada Inc. |
$39.19 |
$0.04 |
$6.50 |
$0.54 |
$3.41 |
$25.60 |
$1.03 |
$0.84 |
– |
$0.49 |
– |
$0.75 |
44 |
Vyvanse (lisdexamfetamine dimesylate) |
Takeda Canada Inc. |
$36.74 |
$1.96 |
$2.10 |
$2.23 |
$1.71 |
$24.05 |
$0.50 |
$0.14 |
$0.08 |
$0.14 |
$0.02 |
$3.81 |
45 |
Xtandi (enzalutamide) |
Astellas Pharma Canada Inc. |
$36.52 |
– |
– |
– |
$2.79 |
$28.28 |
$1.70 |
$1.78 |
$0.51 |
$0.87 |
$0.14 |
$0.46 |
46 |
Ozempic (semaglutide) |
Novo Nordisk Canada Inc. |
$35.98 |
– |
$4.02 |
– |
– |
$29.37 |
$0.02 |
– |
$0.12 |
<$0.01 |
– |
$2.46 |
47 |
Lumigan RC (bimatoprost) |
Allergan Inc. |
$34.77 |
$2.87 |
$2.08 |
$1.06 |
$0.64 |
$25.37 |
$0.61 |
$0.95 |
$0.26 |
$0.40 |
$0.01 |
$0.51 |
48 |
Actemra (tocilizumab) |
Hoffmann-La Roche Ltd |
$34.12 |
$6.41 |
$5.63 |
$2.52 |
$2.05 |
$14.38 |
$0.27 |
$0.70 |
$0.04 |
$0.44 |
$0.14 |
$1.53 |
49 |
Myrbetriq (mirabegron) |
Astellas Pharma Canada Inc. |
$33.31 |
<$0.01 |
$3.18 |
$0.74 |
$0.80 |
$26.92 |
$0.61 |
$0.55 |
$0.03 |
$0.11 |
$0.01 |
$0.33 |
50 |
Actonel DR (risedronate sodium) |
Allergan Inc. |
$32.54 |
– |
– |
$0.15 |
– |
$32.39 |
– |
– |
– |
– |
– |
– |
|
|
Total |
$4,278.77 |
$470.77 |
$351.37 |
$172.43 |
$153.50 |
$2,732.25 |
$87.78 |
$76.26 |
$11.94 |
$40.79 |
$4.69 |
$176.97 |
|
|
Share of all patented medicines |
74% |
74% |
74% |
74% |
69% |
74% |
74% |
74% |
74% |
73% |
66% |
73% |
Data source: National Prescription Drug Utilization Information System Database, Canadian Institute for Health Information.
Appendix E: Top 50 Multi-Source Generic Medicines by Drug Cost, NPDUIS Public Drug Plans, 2019/20 ($million)
| Rank | Medicinal ingredient | Total | BC | AB | SK | MB | ON | NB | NS | PE | NL | YT | NIHB |
|---|---|---|---|---|---|---|---|---|---|---|---|---|---|
1 |
Atorvastatin |
$62.90 |
$6.99 |
$7.37 |
$2.10 |
$1.34 |
$38.43 |
$1.29 |
$1.68 |
$0.37 |
$0.85 |
$0.12 |
$2.35 |
2 |
Pantoprazole |
$53.15 |
$3.26 |
$8.41 |
$2.15 |
$0.70 |
$31.88 |
$2.54 |
$0.89 |
$0.42 |
$0.46 |
$0.04 |
$2.39 |
3 |
Rosuvastatin |
$52.48 |
$4.03 |
$6.08 |
$2.02 |
$0.65 |
$33.56 |
$1.33 |
$1.75 |
$0.39 |
$1.06 |
$0.04 |
$1.58 |
4 |
Amlodipine |
$43.01 |
$4.75 |
$5.00 |
$1.65 |
$0.91 |
$26.49 |
$0.84 |
$1.20 |
$0.31 |
$0.37 |
$0.06 |
$1.44 |
5 |
Duloxetine |
$34.89 |
$0.49 |
$3.87 |
$1.53 |
$0.89 |
$25.88 |
$0.28 |
$0.17 |
$0.01 |
$0.01 |
$0.04 |
$1.71 |
6 |
Pregabalin |
$32.25 |
$0.09 |
$1.41 |
$1.54 |
$0.45 |
$26.62 |
$0.60 |
$0.46 |
$0.04 |
$0.12 |
$0.03 |
$0.90 |
7 |
Gabapentin |
$26.92 |
$5.15 |
$2.87 |
$1.09 |
$1.20 |
$9.77 |
$0.87 |
$0.50 |
$0.16 |
$0.09 |
$0.03 |
$5.19 |
8 |
Perindopril |
$25.89 |
$0.56 |
$2.15 |
$0.80 |
$0.27 |
$19.71 |
$0.59 |
$0.57 |
$0.08 |
$0.29 |
$0.01 |
$0.86 |
9 |
Escitalopram |
$23.82 |
$4.29 |
$2.04 |
$0.45 |
$0.24 |
$15.03 |
$0.19 |
$0.23 |
$0.04 |
$0.12 |
$0.01 |
$1.18 |
10 |
Sertraline |
$22.14 |
$3.51 |
$1.40 |
$1.17 |
$0.85 |
$11.43 |
$0.80 |
$0.77 |
$0.20 |
$0.63 |
$0.02 |
$1.36 |
11 |
Candesartan |
$22.01 |
$2.29 |
$2.54 |
$1.13 |
$0.25 |
$13.67 |
$0.38 |
$0.62 |
$0.11 |
$0.45 |
$0.03 |
$0.54 |
12 |
Hydromorphone |
$22.00 |
$4.53 |
$1.19 |
$1.22 |
$0.72 |
$11.79 |
$0.53 |
$0.55 |
$0.13 |
$0.22 |
$0.03 |
$1.09 |
13 |
Perindopril and diuretics |
$21.39 |
– |
$2.87 |
$1.61 |
$0.40 |
$13.08 |
$1.01 |
$0.83 |
$0.09 |
$0.45 |
$0.01 |
$1.06 |
14 |
Ramipril |
$19.79 |
$4.23 |
$1.93 |
$0.80 |
$0.47 |
$9.64 |
$0.40 |
$0.43 |
$0.16 |
$0.39 |
$0.07 |
$1.25 |
15 |
Aripiprazole |
$18.78 |
$2.79 |
$0.35 |
$0.27 |
$0.78 |
$13.33 |
$0.20 |
$0.08 |
$0.02 |
$0.02 |
<$0.01 |
$0.93 |
16 |
Nabilone |
$18.23 |
$2.50 |
$1.01 |
$0.02 |
$0.95 |
$11.83 |
$0.77 |
$0.45 |
<$0.01 |
$0.24 |
<$0.01 |
$0.44 |
17 |
Lansoprazole |
$17.86 |
$0.33 |
$1.66 |
$0.13 |
$0.09 |
$14.84 |
$0.13 |
$0.05 |
<$0.01 |
$0.01 |
$0.01 |
$0.61 |
18 |
Quetiapine |
$17.83 |
$3.24 |
$0.72 |
$1.16 |
$0.65 |
$9.60 |
$0.67 |
$0.37 |
$0.05 |
$0.36 |
$0.01 |
$1.01 |
19 |
Clozapine |
$17.67 |
$9.30 |
$0.53 |
$1.83 |
$2.73 |
– |
$0.77 |
– |
$0.04 |
$0.59 |
$0.01 |
$1.87 |
20 |
Salbutamol |
$17.39 |
$2.35 |
$0.71 |
$0.77 |
$0.57 |
$9.50 |
$0.67 |
$0.62 |
$0.14 |
$0.48 |
$0.03 |
$1.56 |
21 |
Metoprolol |
$16.91 |
$2.24 |
$2.42 |
$1.24 |
$0.80 |
$6.88 |
$0.59 |
$1.05 |
$0.19 |
$0.79 |
$0.02 |
$0.68 |
22 |
Tamsulosin |
$16.89 |
$1.82 |
$3.19 |
$0.86 |
$0.35 |
$8.94 |
$0.45 |
$0.40 |
$0.13 |
$0.33 |
$0.03 |
$0.37 |
23 |
Olanzapine |
$16.82 |
$2.72 |
$0.54 |
$0.59 |
$0.82 |
$9.62 |
$0.83 |
$0.30 |
$0.10 |
$0.25 |
$0.01 |
$1.05 |
24 |
Levodopa and decarboxylase inhibitor |
$16.44 |
$1.63 |
$1.91 |
$0.65 |
$0.40 |
$10.57 |
$0.28 |
$0.43 |
$0.09 |
$0.22 |
$0.02 |
$0.24 |
25 |
Metformin |
$16.21 |
$2.15 |
$1.93 |
$0.95 |
$0.46 |
$8.02 |
$0.40 |
$0.55 |
$0.15 |
$0.34 |
$0.03 |
$1.24 |
26 |
Diltiazem |
$15.92 |
$2.23 |
$1.40 |
$0.63 |
$0.46 |
$9.39 |
$0.63 |
$0.51 |
$0.12 |
$0.17 |
$0.02 |
$0.36 |
27 |
Rabeprazole |
$15.69 |
$1.54 |
$0.42 |
$1.03 |
$0.40 |
$9.19 |
$0.18 |
$1.24 |
$0.06 |
$0.78 |
$0.01 |
$0.84 |
28 |
Oxycodone/paracetamol |
$15.46 |
$0.65 |
$0.68 |
<$0.01 |
$0.51 |
$11.54 |
$0.47 |
$0.17 |
$0.09 |
$0.36 |
<$0.01 |
$0.99 |
29 |
Venlafaxine |
$15.45 |
$2.85 |
$1.37 |
$0.85 |
$0.63 |
$7.15 |
$0.63 |
$0.48 |
$0.12 |
$0.49 |
$0.02 |
$0.88 |
30 |
Epinephrine |
$14.89 |
$1.27 |
$0.81 |
$1.02 |
$0.32 |
$9.48 |
$0.20 |
$0.12 |
<$0.01 |
$0.06 |
$0.01 |
$1.59 |
31 |
Clopidogrel |
$14.82 |
$1.03 |
$1.37 |
$0.58 |
$0.40 |
$9.59 |
$0.42 |
$0.54 |
$0.10 |
$0.35 |
$0.01 |
$0.42 |
32 |
Valproic acid |
$13.89 |
$2.97 |
$0.47 |
$0.76 |
$0.60 |
$7.18 |
$0.51 |
$0.20 |
$0.11 |
$0.40 |
$0.01 |
$0.69 |
33 |
Fluoxetine |
$13.70 |
$2.91 |
$1.03 |
$0.95 |
$0.67 |
$6.01 |
$0.36 |
$0.26 |
$0.09 |
$0.33 |
$0.01 |
$1.08 |
34 |
Buprenorphine combinations |
$13.60 |
$2.86 |
$0.32 |
$0.23 |
$0.26 |
$7.02 |
$0.31 |
$0.18 |
$0.16 |
$0.79 |
<$0.01 |
$1.46 |
35 |
Mycophenolic acid |
$12.92 |
$1.11 |
– |
$0.98 |
$0.56 |
$9.18 |
$0.16 |
$0.08 |
<$0.01 |
<$0.01 |
$0.07 |
$0.77 |
36 |
Ondansetron |
$12.74 |
$1.37 |
$2.92 |
$0.11 |
$1.48 |
$4.87 |
$0.17 |
$0.21 |
<$0.01 |
$0.02 |
<$0.01 |
$1.59 |
37 |
Risperidone |
$12.64 |
$2.35 |
$0.40 |
$0.84 |
$0.73 |
$6.30 |
$0.61 |
$0.25 |
$0.10 |
$0.34 |
$0.01 |
$0.70 |
38 |
Methotrexate |
$12.59 |
$1.96 |
$2.19 |
$0.63 |
$0.39 |
$5.64 |
$0.35 |
$0.38 |
$0.07 |
$0.19 |
$0.02 |
$0.76 |
39 |
Risedronic acid |
$12.02 |
$0.20 |
$1.54 |
$0.29 |
$0.07 |
$9.07 |
$0.20 |
$0.36 |
$0.03 |
$0.09 |
<$0.01 |
$0.16 |
40 |
Methadone |
$11.90 |
$0.20 |
$0.08 |
– |
$0.31 |
$9.32 |
$0.02 |
– |
– |
$0.62 |
– |
$1.36 |
41 |
Omeprazole |
$11.89 |
$0.23 |
$1.07 |
$0.41 |
$1.09 |
$5.48 |
$0.66 |
$0.94 |
$0.17 |
$0.51 |
$0.07 |
$1.27 |
42 |
Irbesartan |
$11.81 |
$0.37 |
$2.23 |
$0.46 |
$0.38 |
$7.35 |
$0.15 |
$0.34 |
$0.07 |
$0.09 |
<$0.01 |
$0.38 |
43 |
Gliclazide |
$11.71 |
$0.62 |
$1.12 |
$0.50 |
$0.53 |
$6.37 |
$0.32 |
$0.63 |
$0.16 |
$0.43 |
$0.02 |
$1.00 |
44 |
Fentanyl |
$11.00 |
$1.55 |
$0.92 |
$1.06 |
$0.67 |
$6.15 |
$0.23 |
$0.20 |
$0.02 |
$0.05 |
$0.02 |
$0.13 |
45 |
Telmisartan |
$10.78 |
$0.70 |
$1.61 |
$0.30 |
$0.19 |
$7.04 |
$0.23 |
$0.28 |
$0.15 |
$0.06 |
$0.01 |
$0.22 |
46 |
Levetiracetam |
$10.31 |
$1.49 |
$1.01 |
$0.61 |
$0.46 |
$5.25 |
$0.23 |
$0.23 |
$0.06 |
$0.18 |
$0.02 |
$0.78 |
47 |
Mirtazapine |
$9.95 |
$1.38 |
$0.55 |
$0.39 |
$0.63 |
$5.65 |
$0.26 |
$0.29 |
$0.05 |
$0.34 |
<$0.01 |
$0.42 |
48 |
Leflunomide |
$9.85 |
$1.27 |
$1.18 |
$0.47 |
$0.43 |
$5.39 |
$0.12 |
$0.14 |
$0.02 |
$0.07 |
$0.01 |
$0.75 |
49 |
Ezetimibe |
$9.81 |
$0.03 |
$0.60 |
$0.35 |
$0.09 |
$7.93 |
$0.23 |
$0.22 |
$0.01 |
$0.14 |
<$0.01 |
$0.20 |
50 |
Glyceryl trinitrate |
$9.69 |
$1.30 |
$1.09 |
$0.45 |
$0.25 |
$5.23 |
$0.32 |
$0.48 |
$0.09 |
$0.21 |
$0.01 |
$0.26 |
|
Total |
$968.71 |
$109.67 |
$90.44 |
$41.63 |
$30.44 |
$572.89 |
$25.39 |
$23.69 |
$5.30 |
$16.20 |
$1.08 |
$51.97 |
|
Share of all multi-source generic medicines |
57% |
57% |
55% |
55% |
50% |
60% |
56% |
52% |
54% |
51% |
48% |
54% |
Data source: National Prescription Drug Utilization Information System Database, Canadian Institute for Health Information.
Appendix F: Top 50 Single-Source Non-Patented Medicines by Drug Cost, NPDUIS Public Drug Plans, 2019/20 ($thousand)
| Rank | Trade name (medicinal ingredient) | Manufacturer | Total | BC | AB | SK | MB | ON | NB | NS | PE | NL | YT | NIHB |
|---|---|---|---|---|---|---|---|---|---|---|---|---|---|---|
1 |
Lucentis (ranibizumab) |
Novartis Pharmaceuticals Canada Inc. |
$215,950 |
– |
$7,426 |
$1,593 |
– |
$193,416 |
$8,435 |
– |
$396 |
$2,531 |
$13 |
$2,140 |
2 |
Tresiba (insulin degludec) |
Novo Nordisk Canada Inc. |
$55,777 |
– |
$5,786 |
$2,175 |
$1,173 |
$37,692 |
$1,931 |
$1,899 |
$1,188 |
$908 |
$5 |
$3,020 |
3 |
Humalog mix (insulin lispro / insulin lispro protamine suspension) |
Eli Lilly Canada Inc. |
$47,135 |
$4,480 |
$4,176 |
$3,941 |
$2,201 |
$25,577 |
$1,092 |
$515 |
$675 |
$211 |
$76 |
$4,192 |
4 |
Novorapid (insulin aspart) |
Novo Nordisk Canada Inc. |
$39,008 |
$3,072 |
$3,712 |
$912 |
$1,245 |
$23,150 |
$830 |
$1,536 |
$537 |
$1,664 |
$38 |
$2,312 |
5 |
Aubagio (teriflunomide) |
Sanofi Genzyme, a division of Sanofi-Aventis Canada Inc. |
$33,085 |
$7,696 |
$2,691 |
$2,874 |
$1,440 |
$13,657 |
$1,844 |
$1,643 |
$304 |
$560 |
$53 |
$324 |
6 |
Fragmin (dalteparin sodium) |
Pfizer Canada ULC |
$29,242 |
$5,949 |
$1,474 |
$487 |
$1,856 |
$16,578 |
$614 |
$1,461 |
$24 |
$2 |
$158 |
$639 |
7 |
Levemir penfill (insulin detemir) |
Novo Nordisk Canada Inc. |
$23,612 |
$2,632 |
$3,398 |
$794 |
$151 |
$14,520 |
$230 |
$755 |
$31 |
$127 |
$20 |
$954 |
8 |
Zoladex LA (goserelin) |
TerSera Therapeutics LLC |
$23,401 |
$16 |
– |
$11 |
$27 |
$20,269 |
$705 |
$1,488 |
$228 |
$224 |
$122 |
$311 |
9 |
Aranesp HSA-free (darbepoetin alfa) |
Amgen Canada Inc. |
$18,450 |
– |
$8,400 |
$658 |
– |
$4,975 |
$1,261 |
– |
– |
$984 |
$47 |
$2,125 |
10 |
Nucala (mepolizumab) |
GlaxoSmithKline Inc. |
$15,430 |
$869 |
$3,867 |
$912 |
$668 |
$7,756 |
$572 |
$349 |
– |
$23 |
– |
$415 |
11 |
Innohep (tinzaparin sodium) |
Leo Pharma Inc. |
$13,174 |
$395 |
$6,564 |
$1,683 |
$13 |
$3,940 |
– |
$8 |
– |
$5 |
$10 |
$556 |
12 |
Mirena (levonorgestrel) |
Bayer Inc. |
$12,105 |
$1,891 |
$257 |
$497 |
$333 |
$5,742 |
$158 |
$47 |
$18 |
$169 |
– |
$2,992 |
13 |
Fucidin (fusidic acid) |
Leo Pharma Inc. |
$11,874 |
$1,041 |
$502 |
$295 |
$217 |
$8,697 |
$127 |
$186 |
$22 |
$141 |
$2 |
$646 |
14 |
Lovenox with preservative (enoxaparin sodium) |
Sanofi-Aventis Canada Inc. |
$9,434 |
$456 |
$791 |
$402 |
$30 |
$6,908 |
$275 |
$52 |
$14 |
$150 |
$5 |
$350 |
15 |
Remodulin (treprostinil) |
United Therapeutics Corporation |
$8,153 |
$2,119 |
– |
$46 |
$325 |
$4,160 |
$1,147 |
– |
– |
– |
– |
$357 |
16 |
NovoMix (insulin aspart / insulin aspart protamine) |
Novo Nordisk Canada Inc. |
$7,113 |
$252 |
– |
– |
– |
$6,861 |
– |
– |
– |
– |
– |
– |
17 |
Premarin vaginal (conjugated estrogens) |
Pfizer Canada ULC |
$6,627 |
$1,031 |
$1,094 |
$407 |
$126 |
$3,177 |
$169 |
$144 |
$49 |
$145 |
$14 |
$272 |
18 |
Lemtrada (alemtuzumab) |
Sanofi Genzyme, a division of Sanofi-Aventis Canada Inc. |
$6,485 |
$3,428 |
$1,580 |
$564 |
$40 |
$635 |
– |
$77 |
$43 |
– |
– |
$119 |
19 |
Protopic (tacrolimus) |
Leo Pharma Inc. |
$5,182 |
$101 |
$82 |
$55 |
$58 |
$4,488 |
$24 |
$15 |
$2 |
$2 |
– |
$355 |
20 |
Lamisil (terbinafine hydrochloride) |
Novartis Pharmaceuticals Canada Inc. |
$4,958 |
– |
$357 |
$128 |
$4 |
$4,092 |
$56 |
$63 |
– |
$61 |
$4 |
$194 |
21 |
Elmiron (pentosan polysulfate sodium) |
Janssen Inc. |
$3,895 |
$1,726 |
$400 |
$99 |
$199 |
$408 |
$273 |
$488 |
$30 |
$101 |
– |
$171 |
22 |
Ravicti (glycerol phenylbutyrate) |
Horizon Pharma Ireland Ltd |
$3,859 |
$272 |
$173 |
$437 |
– |
$2,462 |
$101 |
– |
– |
– |
– |
$414 |
23 |
Emend Tri-Pack (aprepitant/aprepitant) |
Merck Canada Inc. |
$3,836 |
$790 |
$442 |
– |
$313 |
$2,127 |
$69 |
$22 |
– |
– |
$12 |
$62 |
24 |
Vimizim (elosulfase alfa) |
BioMarin International Ltd |
$3,414 |
– |
– |
– |
– |
$2,207 |
– |
– |
– |
– |
– |
$1,207 |
25 |
Fluanxol Depot (flupentixol decanoate) |
Lundbeck Canada Inc. |
$3,386 |
$529 |
$75 |
$221 |
$135 |
$2,076 |
$57 |
$72 |
$1 |
$49 |
$3 |
$169 |
26 |
Depo-Provera (medroxyprogesterone acetate) |
Pfizer Canada ULC |
$3,197 |
$332 |
$27 |
$239 |
$122 |
$1,181 |
$95 |
$18 |
$14 |
$111 |
– |
$1,058 |
27 |
Pentoxifylline SR (pentoxifylline) |
AA Pharma Inc. |
$3,170 |
$361 |
$329 |
$92 |
$39 |
$2,085 |
$36 |
$34 |
$14 |
$91 |
$2 |
$88 |
28 |
Elidel (pimecrolimus) |
Bausch Health, Canada Inc. |
$2,911 |
$15 |
– |
$27 |
$7 |
$2,751 |
– |
– |
– |
– |
– |
$110 |
29 |
Elaprase (idursulfase) |
Shire Human Genetic Therapies Inc. |
$2,872 |
– |
– |
– |
– |
$2,872 |
– |
– |
– |
– |
– |
– |
30 |
Firmagon (degarelix) |
Ferring Inc. |
$2,852 |
– |
– |
– |
– |
$2,551 |
$62 |
$142 |
$6 |
$55 |
$12 |
$25 |
31 |
Ferriprox (deferiprone) |
Chiesi Canada Corp. |
$2,775 |
$598 |
$244 |
– |
– |
$1,811 |
$54 |
$67 |
– |
– |
– |
– |
32 |
Sinequan (doxepin) |
AA Pharma Inc. |
$2,723 |
$341 |
$14 |
$115 |
$71 |
$1,721 |
$103 |
$144 |
$21 |
$42 |
$1 |
$150 |
33 |
Cytomel (liothyronine) |
Pfizer Canada ULC |
$2,708 |
$1,744 |
$658 |
$6 |
$96 |
$9 |
$57 |
$37 |
– |
$15 |
$15 |
$71 |
34 |
Solu-Medrol (methylprednisolone) |
Pfizer Canada ULC |
$2,668 |
$211 |
$139 |
$52 |
$10 |
$1,908 |
$39 |
$81 |
$69 |
$57 |
$4 |
$99 |
35 |
Tobradex (dexamethasone/tobramycin) |
Novartis Pharmaceuticals Canada Inc. |
$2,649 |
$303 |
$317 |
$188 |
$22 |
$1,493 |
$48 |
$77 |
$5 |
$62 |
$2 |
$133 |
36 |
Qvar (beclomethasone dipropionate |
Valeant Canada LP/Valeant Canada S.E.C. |
$2,212 |
$209 |
$270 |
$379 |
$73 |
$941 |
$43 |
$35 |
$3 |
$4 |
$1 |
$255 |
37 |
One Alpha (alfacalcidol) |
Leo Pharma Inc. |
$2,153 |
$675 |
$67 |
$139 |
$5 |
$1,010 |
$54 |
$61 |
<$0.01 |
$29 |
$1 |
$113 |
38 |
Clopixol Depot (zuclopenthixol decanoate) |
Lundbeck Canada Inc. |
$2,140 |
$645 |
$44 |
$237 |
$50 |
$813 |
$74 |
$22 |
<$0.01 |
$68 |
$1 |
$186 |
39 |
Lotriderm (clotrimazole/betamethasone) |
Merck Canada Inc. |
$2,066 |
– |
$824 |
$405 |
$1 |
– |
$147 |
$320 |
– |
$40 |
$1 |
$330 |
40 |
Mepron (atovaquone) |
GlaxoSmithKline Inc. |
$2,021 |
$24 |
$604 |
$46 |
$47 |
$1,113 |
$29 |
$5 |
– |
$18 |
- |
$134 |
41 |
Mestinon SR (pyridostigmine bromide) |
Bausch Health, Canada Inc. |
$1,956 |
$253 |
$230 |
$124 |
$101 |
$1,017 |
$43 |
$83 |
$14 |
$33 |
$2 |
$56 |
42 |
Multi (vitamin A/vitamin B12/vitamin D) |
Sandoz Canada Inc. |
$1,937 |
– |
– |
– |
– |
$1,937 |
– |
– |
– |
– |
– |
– |
43 |
Lomotil (diphenoxylate hydrochloride / atropine sulfate) |
Pfizer Canada ULC |
$1,880 |
$135 |
$354 |
$94 |
$25 |
$1,116 |
$46 |
$44 |
$2 |
$58 |
<$0.01 |
$7 |
44 |
Megestrol (megestrol acetate) |
AA Pharma Inc. |
$1,856 |
$97 |
$33 |
$9 |
$258 |
$1,090 |
$174 |
$102 |
$9 |
$20 |
– |
$64 |
45 |
pdp-Amantadine Hydrochloride (amantadine hydrochloride) |
Pendopharm,a division of Pharmascience Inc. |
$1,850 |
$262 |
$181 |
$224 |
$50 |
$939 |
$41 |
$56 |
$15 |
$29 |
$3 |
$50 |
46 |
Efudex (fluorouracil) |
Valeant Canada LP/Valeant Canada S.E.C. |
$1,624 |
$145 |
$221 |
$53 |
$18 |
$1,090 |
$36 |
$35 |
$12 |
$5 |
$2 |
$6 |
47 |
Firazyr (icatibant) |
Shire Human Genetic Therapies Inc. |
$1,584 |
$246 |
$95 |
$77 |
$336 |
$718 |
$26 |
– |
– |
– |
– |
$86 |
48 |
Kineret (anakinra) |
Swedish Orphan Biovitrum AB |
$1,485 |
$421 |
$50 |
$137 |
$195 |
$444 |
$94 |
$94 |
– |
– |
$20 |
$31 |
49 |
Serevent Diskus (salmeterol) |
GlaxoSmithKline Inc. |
$1,436 |
$197 |
$204 |
$66 |
$71 |
$730 |
$32 |
$19 |
$5 |
$5 |
$11 |
$98 |
50 |
Thyrogen (thyrotropin alfa) |
Sanofi Genzyme, a division of Sanofi-Aventis Canada Inc. |
$1,406 |
– |
$411 |
– |
– |
$890 |
$15 |
$46 |
– |
– |
– |
$44 |
Total |
$660,718 |
$45,957 |
$58,562 |
$21,899 |
$12,149 |
$447,798 |
$21,317 |
$12,342 |
$3,750 |
$8,797 |
$657 |
$27,491 |
||
Share of all single-source non-patented medicines |
93% |
85% |
92% |
87% |
84% |
95% |
93% |
90% |
94% |
88% |
92% |
84% |
||
Data source: National Prescription Drug Utilization Information System Database, Canadian Institute for Health Information.
Appendix G: Top 50 Manufacturers by Drug Cost, NPDUIS Public Drug Plans, 2019/20 ($million)
| Rank | Company | Total | BC | AB | SK | MB | ON | NB | NS | PE | NL | YT | NIHB |
|---|---|---|---|---|---|---|---|---|---|---|---|---|---|
1 |
Janssen Inc. |
$998.48 |
$117.15 |
$119.78 |
$81.52 |
$58.29 |
$512.09 |
$27.07 |
$23.20 |
$4.12 |
$12.35 |
$1.10 |
$41.81 |
2 |
Novartis Pharmaceuticals Canada Inc. |
$572.12 |
$34.50 |
$46.20 |
$12.49 |
$18.79 |
$415.01 |
$18.18 |
$8.89 |
$0.92 |
$7.11 |
$0.45 |
$9.58 |
3 |
Bayer Inc. |
$528.44 |
$16.79 |
$25.83 |
$14.22 |
$6.56 |
$433.57 |
$10.86 |
$4.06 |
$1.74 |
$3.64 |
$0.35 |
$10.82 |
4 |
AbbVie Corporation |
$527.37 |
$133.07 |
$61.02 |
$36.60 |
$35.57 |
$203.64 |
$10.05 |
$13.57 |
$2.75 |
$6.41 |
$0.87 |
$23.82 |
5 |
Gilead Sciences Canada Inc. |
$457.78 |
$102.17 |
$24.24 |
$19.97 |
$8.87 |
$239.20 |
$7.10 |
$1.74 |
– |
$5.28 |
$1.59 |
$47.62 |
6 |
Apotex Inc. |
$454.46 |
$43.87 |
$31.70 |
$13.44 |
$12.07 |
$301.67 |
$11.44 |
$7.16 |
$1.77 |
$6.59 |
$0.41 |
$24.35 |
7 |
Merck Canada Inc. |
$396.54 |
$18.28 |
$28.43 |
$8.58 |
$5.03 |
$303.28 |
$6.66 |
$2.82 |
$0.23 |
$0.83 |
$0.07 |
$22.32 |
8 |
Boehringer Ingelheim |
$362.94 |
$32.40 |
$36.28 |
$9.57 |
$7.12 |
$249.64 |
$5.85 |
$6.00 |
$1.27 |
$1.97 |
$0.22 |
$12.63 |
9 |
Teva Canada Ltd |
$313.34 |
$34.18 |
$30.47 |
$15.90 |
$12.78 |
$178.11 |
$8.73 |
$7.34 |
$1.73 |
$6.22 |
$0.48 |
$17.40 |
10 |
GlaxoSmithKline Inc. |
$285.22 |
$30.49 |
$30.00 |
$11.84 |
$9.02 |
$168.48 |
$8.36 |
$6.44 |
$0.93 |
$4.54 |
$0.40 |
$14.72 |
11 |
Sandoz Canada Inc. |
$282.61 |
$34.25 |
$25.46 |
$12.59 |
$7.00 |
$173.17 |
$5.35 |
$6.55 |
$1.22 |
$4.11 |
$0.38 |
$12.52 |
12 |
AstraZeneca Canada Inc. |
$247.73 |
$16.97 |
$27.41 |
$6.88 |
$6.58 |
$173.81 |
$2.90 |
$3.98 |
$0.47 |
$1.21 |
$0.15 |
$7.38 |
13 |
Bristol-Myers Squibb Canada |
$239.90 |
$27.88 |
$26.18 |
$8.32 |
$6.90 |
$158.16 |
$3.63 |
$3.53 |
$0.69 |
$0.93 |
$0.14 |
$3.54 |
14 |
Celgene Inc. |
$232.88 |
$0.01 |
– |
– |
$14.48 |
$189.58 |
$7.81 |
$11.16 |
$1.23 |
$6.62 |
$0.22 |
$1.78 |
15 |
Pfizer Canada ULC |
$217.45 |
$24.58 |
$13.00 |
$6.30 |
$10.70 |
$138.31 |
$5.04 |
$7.87 |
$0.67 |
$3.21 |
$0.36 |
$7.41 |
16 |
Novo Nordisk Canada Inc. |
$196.12 |
$9.93 |
$23.60 |
$4.98 |
$3.76 |
$125.44 |
$4.07 |
$7.04 |
$2.15 |
$4.31 |
$0.15 |
$10.69 |
17 |
Sanofi-Aventis Canada Inc. |
$188.24 |
$10.65 |
$18.27 |
$11.75 |
$3.54 |
$117.85 |
$2.99 |
$3.65 |
$0.52 |
$1.13 |
$0.05 |
$17.84 |
18 |
Pharmascience Inc. |
$176.68 |
$22.49 |
$14.21 |
$9.11 |
$6.29 |
$100.98 |
$3.64 |
$4.29 |
$0.95 |
$3.99 |
$0.12 |
$10.61 |
19 |
Sanis Health Inc. |
$151.59 |
$19.88 |
$20.68 |
$8.30 |
$6.59 |
$71.29 |
$6.64 |
$5.79 |
$0.99 |
$3.71 |
$0.41 |
$7.29 |
20 |
Allergan Inc. |
$148.02 |
$12.34 |
$12.37 |
$3.49 |
$2.40 |
$109.37 |
$1.39 |
$2.52 |
$0.35 |
$0.87 |
$0.11 |
$2.81 |
21 |
Hoffmann-La Roche Ltd. |
$146.40 |
$27.37 |
$20.80 |
$10.01 |
$10.62 |
$61.83 |
$2.83 |
$4.00 |
$0.39 |
$1.98 |
$0.38 |
$6.20 |
22 |
Amgen Canada Inc. |
$140.33 |
$3.93 |
$13.03 |
$2.04 |
$0.41 |
$114.43 |
$1.79 |
$0.50 |
$0.02 |
$1.17 |
$0.08 |
$2.92 |
23 |
Immunex Corporation |
$119.28 |
$14.62 |
$18.61 |
$7.86 |
$11.15 |
$51.94 |
$3.17 |
$4.61 |
$0.59 |
$1.11 |
$0.26 |
$5.38 |
24 |
Eli Lilly Canada Inc. |
$111.01 |
$23.10 |
$7.45 |
$7.18 |
$6.40 |
$44.61 |
$4.43 |
$4.49 |
$1.47 |
$4.88 |
$0.30 |
$6.68 |
25 |
Astellas Pharma Canada Inc. |
$108.39 |
$0.02 |
$3.20 |
$3.04 |
$6.70 |
$85.05 |
$3.49 |
$2.33 |
$0.54 |
$0.97 |
$0.17 |
$2.88 |
26 |
Biogen Canada Inc. |
$94.41 |
$14.04 |
$17.41 |
$7.76 |
$9.47 |
$35.34 |
$3.71 |
$2.13 |
$0.27 |
$1.98 |
$0.35 |
$1.94 |
27 |
Takeda Canada Inc. |
$87.32 |
$28.70 |
$12.33 |
$13.80 |
$7.14 |
$15.21 |
$2.63 |
$2.08 |
$0.24 |
$0.50 |
$0.02 |
$4.67 |
28 |
Sivem Pharmaceuticals ULC |
$83.73 |
$16.98 |
$26.12 |
$7.11 |
$7.81 |
– |
$4.90 |
$7.70 |
$2.14 |
$2.77 |
– |
$8.21 |
29 |
Purdue Pharma |
$80.72 |
$5.31 |
$7.57 |
$5.21 |
$3.36 |
$52.26 |
$2.43 |
$1.72 |
$0.23 |
$0.60 |
$0.06 |
$1.97 |
30 |
Mylan Pharmaceuticals ULC |
$76.80 |
$11.25 |
$8.29 |
$3.68 |
$4.99 |
$36.85 |
$2.85 |
$1.94 |
$0.48 |
$1.83 |
$0.10 |
$4.55 |
31 |
ViiV Healthcare ULC |
$72.64 |
– |
– |
$2.97 |
$3.94 |
$56.72 |
$1.81 |
– |
– |
$0.36 |
$0.12 |
$6.71 |
32 |
AA Pharma Inc. |
$71.89 |
$15.75 |
$5.65 |
$4.17 |
$2.52 |
$33.21 |
$2.33 |
$2.32 |
$0.46 |
$1.85 |
$0.07 |
$3.56 |
33 |
Auro Pharma Inc. |
$71.55 |
$7.05 |
$4.90 |
$1.64 |
$1.07 |
$52.14 |
$0.55 |
$0.80 |
$0.16 |
$0.40 |
$0.07 |
$2.78 |
34 |
Sanofi Genzyme, a division of Sanofi-Aventis Canada Inc. |
$58.32 |
$11.12 |
$4.68 |
$4.09 |
$4.00 |
$28.13 |
$1.91 |
$2.01 |
$0.35 |
$0.56 |
$0.05 |
$1.41 |
35 |
Otsuka Pharmaceutical Co., Ltd |
$52.04 |
$12.86 |
$1.10 |
$2.39 |
$0.75 |
$29.72 |
$1.25 |
$0.31 |
$0.07 |
$0.30 |
$0.01 |
$3.28 |
36 |
Leo Pharma Inc. |
$49.42 |
$3.16 |
$8.66 |
$3.12 |
$0.41 |
$29.48 |
$0.48 |
$0.36 |
$0.04 |
$0.46 |
$0.03 |
$3.21 |
37 |
Taro Pharmaceuticals Inc. |
$49.02 |
$4.89 |
$2.76 |
$1.86 |
$1.75 |
$31.71 |
$0.90 |
$1.24 |
$0.30 |
$0.77 |
$0.08 |
$2.78 |
38 |
Alexion Pharma GmbH |
$48.31 |
– |
$8.10 |
– |
$1.78 |
$35.88 |
$0.54 |
– |
$0.46 |
– |
– |
$1.55 |
39 |
Valeant Canada LP/Valeant Canada S.E.C. |
$45.06 |
$4.45 |
$5.57 |
$1.58 |
$0.84 |
$27.76 |
$1.24 |
$0.95 |
$0.18 |
$0.68 |
$0.03 |
$1.78 |
40 |
BGP Pharma ULC |
$42.12 |
$6.02 |
$5.84 |
$1.92 |
$1.40 |
$22.31 |
$1.33 |
$1.35 |
$0.25 |
$0.48 |
$0.06 |
$1.17 |
41 |
Shire Pharma Canada ULC |
$40.34 |
$3.34 |
$1.17 |
$1.35 |
$0.43 |
$31.98 |
$0.27 |
$0.22 |
$0.03 |
$0.27 |
$0.02 |
$1.26 |
42 |
Celltrion Healthcare Co., Ltd |
$35.12 |
$15.28 |
$3.75 |
$0.62 |
$3.41 |
$10.81 |
$0.26 |
$0.13 |
$0.02 |
$0.07 |
$0.07 |
$0.70 |
43 |
Mint Pharmaceuticals Inc. |
$33.56 |
$3.77 |
$3.54 |
$1.47 |
$0.70 |
$20.71 |
$0.40 |
$0.82 |
$0.13 |
$0.26 |
$0.16 |
$1.59 |
44 |
JAMP Pharma Corporation |
$31.76 |
$3.02 |
$3.26 |
$1.40 |
$0.76 |
$19.10 |
$0.74 |
$0.47 |
$0.22 |
$0.29 |
$0.03 |
$2.45 |
45 |
UCB Canada Inc. |
$30.92 |
$7.47 |
$2.76 |
$2.26 |
$0.63 |
$14.46 |
$0.44 |
$1.17 |
$0.13 |
$0.29 |
$0.08 |
$1.23 |
46 |
Indivior UK Ltd |
$27.05 |
$5.82 |
$0.85 |
$0.29 |
$0.02 |
$5.16 |
$0.14 |
$0.07 |
$0.05 |
$0.10 |
– |
$14.54 |
47 |
Sun Pharma Canada Inc. |
$25.75 |
$2.32 |
$1.86 |
$0.56 |
$0.25 |
$18.62 |
$0.39 |
$0.35 |
$0.07 |
$0.23 |
$0.03 |
$1.05 |
48 |
Samsung Bioepis Co., Ltd |
$24.91 |
$11.37 |
$1.02 |
$1.16 |
$1.19 |
$8.25 |
$0.32 |
$0.21 |
$0.03 |
$0.12 |
$0.10 |
$1.13 |
49 |
Marcan Pharmaceuticals Inc. |
$24.18 |
$2.52 |
$2.26 |
$0.89 |
$0.62 |
$14.77 |
$0.55 |
$0.77 |
$0.11 |
$0.54 |
$0.04 |
$1.13 |
50 |
TerSera Therapeutics, LLC |
$23.40 |
$0.02 |
– |
$0.01 |
$0.03 |
$20.27 |
$0.71 |
$1.49 |
$0.23 |
$0.22 |
$0.12 |
$0.31 |
|
Total |
$8,883.66 |
$1,007.41 |
$817.69 |
$397.28 |
$336.88 |
$5,371.33 |
$206.55 |
$184.14 |
$34.37 |
$111.10 |
$10.95 |
$405.96 |
Data source: National Prescription Drug Utilization Information System Database, Canadian Institute for Health Information.