
Drug Shortages in Canada and their Impact on Public Drug Plans, 2017/18 to 2019/20
Table of Contents
Acknowledgements
This report was prepared by the PMPRB as part of the NPDUIS initiative.
The PMPRB wishes to acknowledge the members of the NPDUIS Advisory Committee for their expert oversight and guidance in the preparation of this report. Please note that the statements and findings for this report do not necessarily reflect those of the members or their organizations.
Appreciation goes to Dr. Étienne Gaudette for leading this project, and to Tanya Potashnik, Jeffrey Menzies, Brian O’Shea, Jared Berger, and Kevin Pothier for their oversight in the development of the report. The PMPRB also wishes to acknowledge the contribution of the analytical staff Yvonne Zhang, Jun Yu, Ai Chau, and Ian Detta, and editorial staff Sarah Parker, Laura Fortune, Angela Wright, and Ronja Francoeur.
Disclaimer
NPDUIS operates independently of the regulatory activities of the Board of the PMPRB. The research priorities, data, statements, and opinions expressed or reflected in NPDUIS reports do not represent the position of the PMPRB with respect to any regulatory matter. NPDUIS reports do not contain information that is confidential or privileged under sections 87 and 88 of the Patent Act, and the mention of a medicine in an NPDUIS report is not and should not be understood as an admission or denial that the medicine is subject to filings under sections 80, 81, or 82 of the Patent Act or that its price is or is not excessive under section 85 of the Patent Act.
Although this information is based in part on data obtained under license from the MIDAS® database proprietary to IQVIA Solutions Canada Inc. and/or its affiliates (“IQVIA”), the statements, findings, conclusions, views, and opinions expressed in this report are exclusively those of the PMPRB and are not attributable to IQVIA.
Contact Information
Patented Medicine Prices Review Board
Standard Life Centre
Box L40
333 Laurier Avenue West
Suite 1400
Ottawa, ON
K1P 1C1
Tel.: 1-877-861-2350
TTY 613-957-4373
Email: PMPRB.Information-Renseignements.CEPMB@pmprb-cepmb.gc.ca
Suggested Citation
Suggested citation: Patented Medicine Prices Review Board. (2022). Drug Shortages in Canada and their Impact on Public Drug Plans, 2017/18 to 2019/20. Ottawa: PMPRB.
Executive Summary
This study provides insight into the impact of drug shortages in Canada, focusing on the effects on Canadian public drug plans and their beneficiaries. Drawing on data from fiscal years 2017/18 to 2019/20, the analysis examines trends in the number, market segment, therapeutic area, and duration of drug shortages in Canada and explores their impact on public drug plan beneficiaries as well as on public plan spending.
Disruptions in the availability of medications are an international issue with wide-ranging impacts across global and domestic healthcare systems. Canada’s Food and Drug Regulations define a drug shortage as a situation in which a market authorization holder (manufacturer) is unable to meet the demand for the drug in its entirety and on time. This may arise under several different circumstances, including production issues, sole source contracting, unexpected surges in demand for a drug, and difficulties accessing raw supplies.Footnote 1
The Food and Drug Regulations require manufacturers of certain drugs to report when they are not able to meet demand for a product or when they stop selling a product.Footnote 2 These shortages or discontinuations are published on the Drug Shortages Canada website, the primary data source used by the report. Compliance and enforcement activities related to these reporting requirements are overseen by the Regulatory Operations and Enforcement Branch, Health Canada. The public drug plan information used in the report comes from the Canadian Institute for Health Information’s (CIHI) National Prescription Drug Utilization Information System (NPDUIS) database, which includes data for the following jurisdictions: British Columbia, Alberta, Saskatchewan, Manitoba, Ontario, New Brunswick, Nova Scotia, Prince Edward Island, Newfoundland and Labrador, Yukon, and the Non-Insured Health Benefits Program.
This report provides a broad overview of the issue of drug shortages in Canada using the Drug Shortages Canada website. Its study period, which precedes the COVID-19 pandemic and its associated complexities, will provide useful reference information to understand the effects of the pandemic and the multiple efforts to prevent and mitigate shortages since its onset. Although the report uses a wide perspective, the deleterious impact of drug shortages on individual patients and the health care system should not be overlooked, particularly when substitutions are not possible or when variations in strength and formulation are not interchangeable.
The information provided in this report is of value to all those affected by shortages, including Canadian patients, healthcare providers, pharmacists, and public and private payers.
Key Findings
- Between April 1, 2017, and March 31, 2020, a total of 8,558 shortage reports were filed by Canadian manufacturers, for an average of 238 new reports per month.
- In 2019/20, shortages were reported for 29% of the medicines sold in Canada. Generic drugs and drugs with a low treatment cost (<$10,000/year) had higher rates of drug shortages. No association was found between the relative international price of drugs and shortage rates in Canada.
- The vast majority (91%) of shortage reports concerned multi-source non-patented medicines, for which substitutions to the same pharmaceutical ingredients from another manufacturer were possible in most cases. Patented medicines and single-source non-patented medicines accounted for 7% and 2% of reports, respectively.
- Over half (55%) of the drug shortages reported were resolved within three months of their onset. About three quarters of shortages (74%) were updated to “resolved” within six months. Shortages of patented and single-source non-patented medicines were resolved faster than those of multi-source non-patented medicines.
- Of the drugs with a shortage reported, 70% had fewer than 1,000 monthly NPDUIS public drug plan beneficiaries before the shortage, while just 5% had over 10,000 monthly beneficiaries.
- At the drug level, 40% of shortages were followed by a steep decline (>20%) in public plan beneficiaries. However, when considering chemical subgroups of drugs (groups of similar chemicals that can be used as substitutes for drugs in shortage), only 8% of shortages were associated with a steep beneficiary decline.
- Shortages associated with a steep decline in beneficiaries primarily occurred in chemical subgroups of drugs with small market sizes, characterized by low spending, small numbers of public plan beneficiaries, and few generic drugs available for substitution. On average, these shortages lasted three months longer than those with a modest decline in beneficiaries.
- Most shortages did not significantly disrupt spending patterns for public plans. When accounting for substitutions to other drugs, less than a quarter of shortages (19%) resulted in a shift in spending greater than 20%. Shortages were associated with significant spending decreases as often as increases (9% and 10% of shortages, respectively).
Introduction
Shortages in the supply of medications have become an issue of great importance to Canadian patients, healthcare providers, manufacturers, distributors, group purchasing organizations, pharmacists, and insurers. A 2020 study estimated that shortages affected nearly 25% of drugs marketed in Canada between 2017 and 2018 (Zhang et al. 2020). In cases where substitutions are unavailable or ineffective, these disruptions can pose a significant health risk to patients.
In recent years, multiple efforts were made to prevent and mitigate drug shortages in Canada. Key among them were the creation of the Multi-Stakeholder Committee on Drug Shortages in 2012 to address shortages in a collaborative and coordinated manner (MSSC, 2017) and the requirement for market access holders to report to the Drug Shortages Canada website since March 2017 (Donelle et al., 2018). Measures were also implemented within the context of the early COVID-19 pandemic and have since remained in place, such as the public disclosure of “Tier 3” drug shortages, which have the greatest potential impact on Canada’s drug supply and health care system (Health Canada, 2022a), and the framework for the exceptional importation of drugs not otherwise licensed in Canada in response to such shortages (Drug Shortages Division, 2022; Health Canada, 2022b).
To inform these efforts and provide further details on the implications of drug shortages for the healthcare system, this report presents an overview of drug shortages in Canada and their impact, with a focus on the effects on publicly insured Canadians and public drug plans. The analysis draws from data collected on the Drug Shortages Canada website, which is maintained by Health Canada, as well as sales and utilization information from the IQVIA MIDAS® database and the Canadian Institute for Health Information’s (CIHI) National Prescription Drug Utilization Information System (NPDUIS) database. Findings are focused on the three-year period spanning from fiscal year 2017/18 to 2019/20, which precedes most of the disruptions of the COVID-19 pandemic.
The report consists of five sections: Section A presents high-level trends in drug shortages reported by Canadian manufacturers; Section B documents the types of drugs most likely to be impacted by shortages; Section C analyzes the resolution rates and duration of shortages; Section D explores the impact of shortages for beneficiaries of Canadian public insurance plans; and Section E examines the impact of shortages on public plan spending. This report may be considered a starting point, or benchmark, in the monitoring of the issue of drug shortages and its impact for Canadians.
Methods
The key data source used for the report is the Drug Shortages Canada website, to which manufacturers to whom a drug market authorization was issued by Health Canada are required to report when they are not able to meet demand for a product and when they discontinue a product (Drug Shortages Canada, [n.d.]; Health Products Compliance Directorate, 2017). The requirement concerns prescription drugs for human use, drugs listed in Schedules D and C of the Food and Drug Act, drugs included in Schedules I to V of the Controlled Drugs and Substances Act, and certain non-prescription drugs administered under a practitioner’s supervision (Health Products Compliance Directorate, 2017). These reports are made publicly available on the Drug Shortages Canada website database, which holds records dating back to March 10, 2017. For simplicity, this report will use the term “manufacturers” to refer to market authorization holders in the remainder of the text.
In-depth: Shortage reports
Shortage reports accessible on the Drug Shortages Canada website feature detailed drug information including the drug identification number (DIN), brand name, common name, company name, active ingredient(s), strength, dosage form, route, packaging size, and World Health Organization Anatomical Therapeutic Chemical classification system (ATC) code. Information specific to shortages includes the reason for the shortage, shortage status as of the most recent report update, and start and end dates of the shortage. Because shortages are reported at the DIN and packaging-size levels, each distinct strength, form, brand name, and package size of a pharmaceutical ingredient in shortage are reported separately.
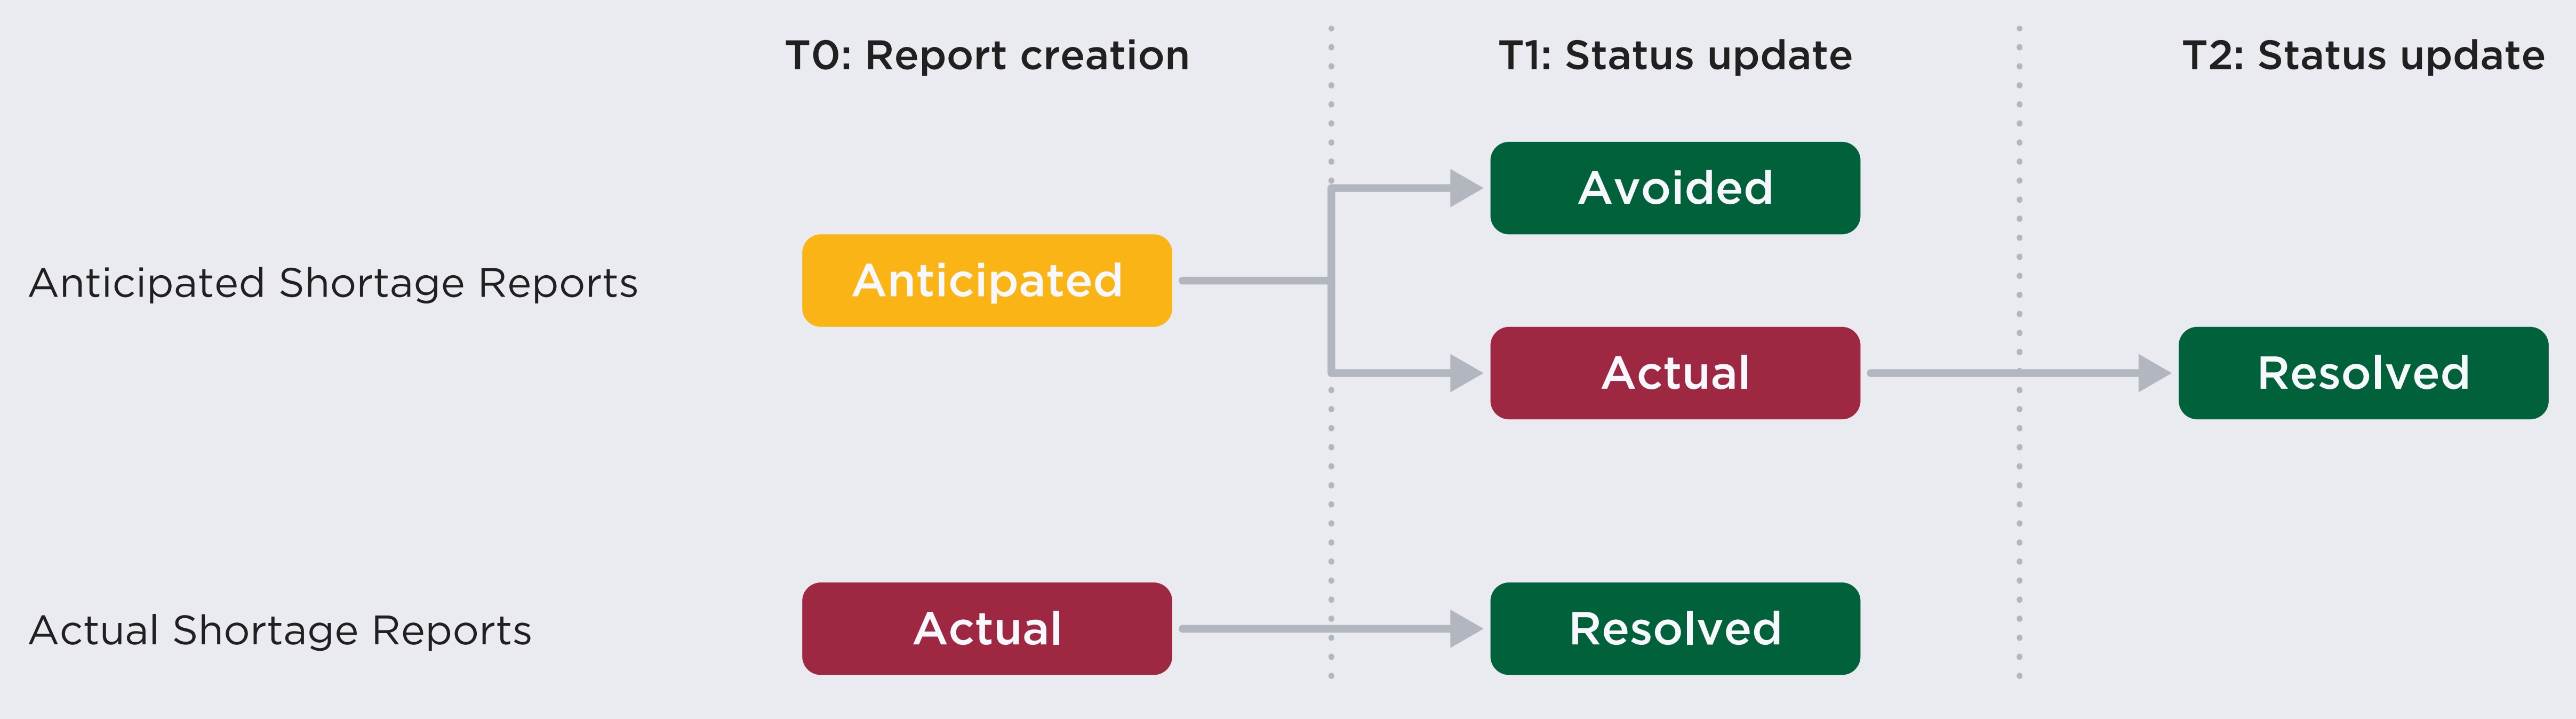
Figure description
This flowchart illustrates the path of drug shortage reporting from report creation through status updates on the Drug Shortages Canada website for anticipated and actual shortage reports.
Anticipated shortage reports are listed as “anticipated” at report creation. Their status may be updated to either “avoided” or “actual.” Those that move to “actual” may then be marked as “resolved” in a future update.
Actual shortage reports are listed as “actual” at report creation, after which their status would be updated to “resolved.”
The status of a shortage report can change over time. When a report is first created, a shortage can be either “actual” or “anticipated”. Companies can update the status of shortages at any time, and they can transition from their initial status to “actual”, “avoided”, or “resolved”. In some cases, an “avoided” or “resolved” shortage status is accompanied by the creation of a discontinuation report, meaning that the drug is no longer sold by the manufacturer.
This report uses a May 2020 extract of the Drug Shortages Canada website data and contains information on the reports created from the website’s launch until 30 April 2020. The majority of the analyses performed in this report use the 8,558 shortage reports created between April 1, 2017, and March 31, 2020, the study period. Shortages with a start date prior to the website creation in March 2017 were considered out of scope of the report.
Using these data, the report provides an analysis of pre-COVID-19 pandemic trends in Canadian shortages and their characteristics, including an analysis of the new shortage reports created monthly during the study period, the reasons most associated with shortages, and shortage duration.
To provide a sense of the scale of drug shortages within the Canadian pharmaceutical ecosystem, the report uses data from the IQVIA MIDAS® database (all rights reserved). MIDAS data reflects the national retail and hospital sectors in Canada and internationally, including payers in all market segments (public, private, and out-of-pocket). Sales and volume data encompass all versions of a drug available, produced by any manufacturer in any strength and form. Matching shortage reports with MIDAS data allows assessing the proportion of drugs available in Canada impacted by shortages and whether these are correlated with relative international prices.
Finally, to provide an assessment of the consequences of shortages for publicly insured Canadians and public payers, Sections D and E of the report conduct analyses using the Canadian Institute for Health Information’s (CIHI) National Prescription Drug Utilization Information System (NPDUIS) database. The NPDUIS database houses pan-Canadian prescription claims-level data, focusing primarily on publicly financed drug benefit programs: British Columbia, Alberta, Saskatchewan, Manitoba, Ontario, New Brunswick, Nova Scotia, Prince Edward Island, Newfoundland and Labrador, and Yukon, as well as Indigenous Services Canada’s Non-Insured Health Benefits (NIHB) drug plan.
Throughout, shortages are defined as a situation in which a drug or a drug within a chemical subgroup are reported as being in “actual” shortage. A drug is defined as a unique combination of a manufacturer, an ingredient or combination of ingredients, a strength, and a formulation (e.g., tablet). Chemical subgroups are defined based on the fourth level of the World Health Organization’s Anatomical Therapeutic Chemical classification system, as detailed in In-depth box “Drug substitutions during shortages,” in Section D. Ingredients in shortage are defined as distinct pharmaceutical ingredients for which drugs representing at least 90% of annual sales had a shortage report with an “actual” status. For analyses that use the IQVIA MIDAS® database, shortages are matched to drugs with sales in Canada using the ingredient, strength, form, and manufacturer listed on shortage reports. When the NPDUIS database is used, shortages are matched to claim using the DINs listed on shortage reports. Shortage rates are defined as the percent of drugs with sales in Canada that were matched with an “actual” shortage report, either at a specific date (Section A) or at any point during the 2019/20 fiscal year (Section B).
For market segment analyses, a medicine is classified as “patented” if the associated DIN was patent-protected in the year of the report’s creation. A non-patented medicine is classified as “single-source non-patented” if its medicinal ingredient had a single manufacturer with sales in Canada during the year; “multi-source non-patented” indicates that the ingredient was available through multiple manufacturers.
Treatment costs are based on the IQVIA Private Drug Plan database and defined as the ratio between annual spending on a drug and the number of claimants. Oral solid medicines are drugs with a “tablet” or “capsule” formulation.
In sections D and E, the percent change in the number of active public drug plan beneficiaries and spending during shortages is calculated using the ratio of the average monthly number of beneficiaries and spending during the shortage and up to six months prior to the shortage. An active beneficiary is a public plan enrollee who filed at least one claim in a given month. The period during the shortage excludes the onset month of the shortage. These calculations are restricted to the shortages for which NPDUIS claims were made both prior to the shortage and during the shortage.
Foreign-to-Canadian price ratios (FTCs) presented in this report are expressed as an index with the Canadian price set to a value of one and the international median reported relative to this value. Prices and sales in foreign currencies are converted into Canadian dollars using the average exchange rate for the year. International markets examined include Australia, Belgium, France, Germany, Italy, Japan, the Netherlands, Norway, Spain, Sweden, and the United Kingdom (UK), which will comprise the PMPRB Schedule countries (“PMPRB11”).
For more details on how Foreign-to-Canadian price ratios are calculated or for more information on the MIDAS Database, the NPDUIS database and other NPDUIS source materials, see the Resources Section of the Analytical Studies page on the PMPRB website.
Limitations
This study relies on reports featured in the Drug Shortages Canada database to represent the issue of shortages in Canada. However, while manufacturers are mandated to report shortages, the degree of compliance with the mandate has not been assessed and the true number of shortages could be greater than those reported on the website. In some cases, imperfect reporting could also mean that resolved shortages were not updated and continued to show as “actual” on the website after their resolution.
In addition, the self-reported nature of the data may suggest that reporting practices could differ from manufacturer to manufacturer and over time, for example regarding the reporting of “anticipated shortages” (which appeared to become less prominent during the study period) and selecting a reason for shortages.
Because shortages with a start date prior to March 10, 2017, were considered out of scope of the report, the number of drugs in shortage in Figures A2 and A3 is underestimated in the first half of 2017/18, during which time only the most recent shortages are included. Given the typical duration and resolution rates of shortages described in Section C, results from the second half of 2017/18 onward are more accurate in those figures.
Because the IQVIA MIDAS® database does not identify drugs using DINs, shortage reports were matched with this database using the ingredient, strength, form, and manufacturer listed on reports. For 10.2% of reports (N=878), drugs mentioned by reports could not be matched with MIDAS equivalents based on those fields, which suggests that shortage rates presented in Sections A and B underestimate true shortage rates.
Sections D and E document the change in the number of active beneficiaries and spending during shortages. These analyses are observational in nature and variations may be caused by other factors. For example, macroeconomic fluctuations and policy changes during the analysis may have impacted the population eligible for coverage and thus the number of active beneficiaries and spending.
The chemical subgroup analyses capture substitutions within the chemical subgroup and do not capture potential valid alternatives from other subgroups. The analyses may also underestimate the impact of shortages in cases where the drugs in shortage represent a small portion of the chemical subgroup and the remainder of the subgroup does not provide valid substitutes. Additionally, although analyses conducted at the chemical subgroup level aim to account for substitutions during shortages, these substitutions may be underestimated as they do not capture all cases where drugs are compounded to fill the need created by the shortage. This limitation is explored in further detail in Appendix 1.
A. Trends in Canadian drug shortage reports, 2017/18 to 2019/20
This section provides an overview of the drug shortages reported in Canada between 2017/18 and 2019/20, finding a sizeable number of shortage reports from manufacturers during this period. In addition to the number of total drug shortages reported, this section also examines trends in the monthly number of reports created, as well as the number of ingredients mentioned, the number of “actual” shortages, and the reasons cited by manufacturers.
Between April 1, 2017, and March 31, 2020, a total of 8,558 shortage reports were created by manufacturers, for an average of 238 new reports per month. As manufacturers are mandated to report all formulations and pack sizes in shortage separately, these 238 new reports correspond to an average of 143 distinct pharmaceutical ingredients mentioned in reports each month (Figure A1). This indicates that an average of 40% of reports were for ingredients mentioned by other reports.
As shown in Figure A1, the number of new shortage reports decreased during 2017/18, stabilizing through 2018/19 and 2019/20. The number of ingredients mentioned by reports remained stable throughout this period.

Data source: www.drugshortagescanada.ca.
Figure description
A line graph shows the monthly trends in the number of drug shortages reported to the Drug Shortages Canada website from fiscal years 2017/18 to 2019/20. Trends are given for both the number of shortage reports and the number of ingredients mentioned by shortage reports during this period. The top line represents the number of shortage reports and the bottom line represents the number of ingredients.
| Fiscal year | Month | Number of reports | Number of ingredients |
|---|---|---|---|
2017/18 |
April |
369 |
178 |
May |
305 |
164 |
|
June |
250 |
148 |
|
July |
265 |
168 |
|
August |
242 |
150 |
|
September |
319 |
161 |
|
October |
209 |
143 |
|
November |
357 |
166 |
|
December |
189 |
123 |
|
January |
266 |
164 |
|
February |
261 |
149 |
|
March |
231 |
164 |
|
2018/19 |
April |
228 |
138 |
May |
204 |
139 |
|
June |
139 |
86 |
|
July |
231 |
127 |
|
August |
165 |
112 |
|
September |
133 |
92 |
|
October |
267 |
145 |
|
November |
200 |
122 |
|
December |
169 |
125 |
|
January |
305 |
165 |
|
February |
262 |
151 |
|
March |
246 |
142 |
|
2019/20 |
April |
210 |
131 |
May |
230 |
144 |
|
June |
249 |
153 |
|
July |
203 |
131 |
|
August |
193 |
131 |
|
September |
228 |
129 |
|
October |
272 |
161 |
|
November |
237 |
147 |
|
December |
181 |
133 |
|
January |
303 |
175 |
|
February |
159 |
113 |
|
March |
281 |
165 |
Although the number of new reports filed every month was relatively stable between 2018/19 and 2019/20, a breakdown of reports with “actual” and “anticipated” status shows a steady increase in the number of actual shortages since October 2018 (Figure A2). This indicates that there were more new shortages added to the website during this period than shortages reported as “resolved”. By the end of the study period, there were 1,738 reports with an “actual” status. Meanwhile, the number of reports with an “anticipated shortage” status has declined over time and accounted for only 3% of unresolved reports as of the end of 2019/20.
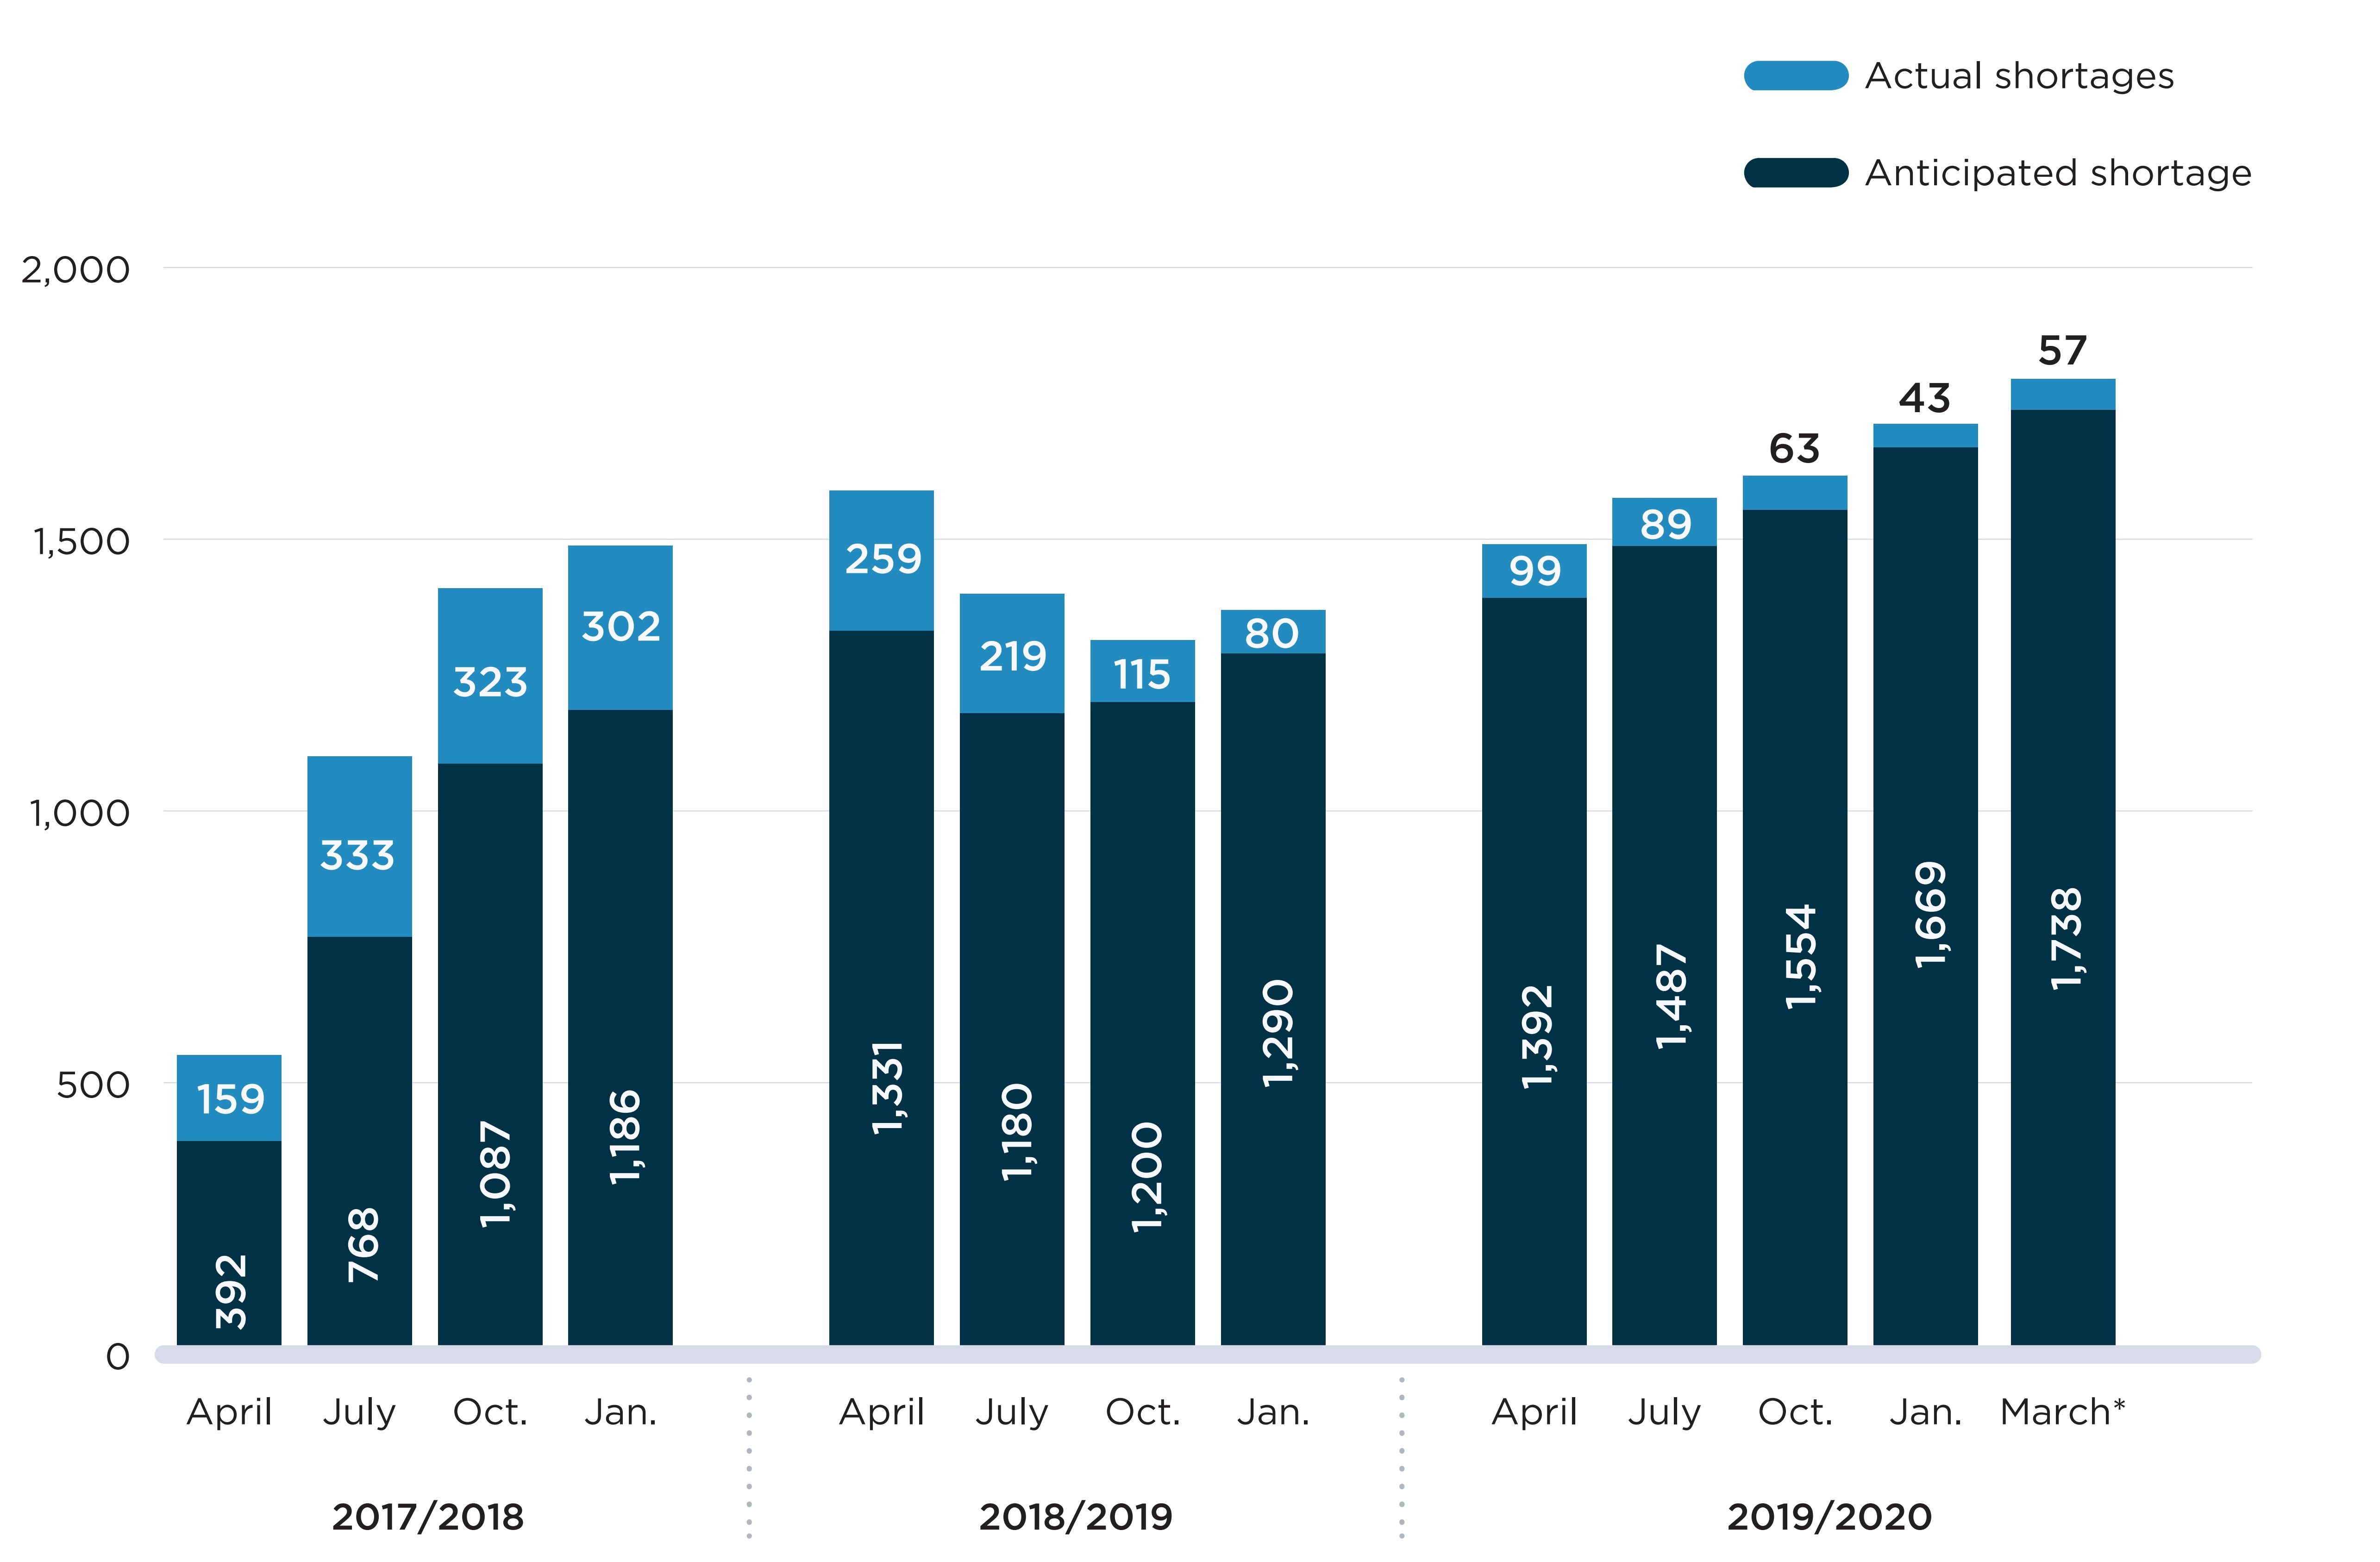
Note: Actual/anticipated shortages are the number of shortage reports with an “actual”/”anticipated” status on the first day of the month. These are determined using the report creation date, shortage start date, and shortage avoided/end date listed in the reports.
* The March 2020 values correspond to the shortages on March 31, 2020, which was the last day of the study period.
Data source: www.drugshortagescanada.ca.
Figure description
A stacked bar graph shows the distribution of shortage reports listed on the Drug Shortages Canada website between 2017/18 and 2019/20 fiscal years by “actual” and “anticipated” shortages. Results are given quarterly (April, July, October, January) for each fiscal year. “Anticipated” shortages are stacked on top of “actual” shortages.
| Fiscal year | Month | Number of actual shortages | Number of anticipated shortages | Total number of shortages |
|---|---|---|---|---|
2017/18 |
April |
392 |
159 |
551 |
July |
768 |
333 |
1,101 |
|
October |
1,087 |
323 |
1,410 |
|
January |
1,186 |
302 |
1,488 |
|
2018/19 |
April |
1,331 |
259 |
1,590 |
July |
1,180 |
219 |
1,399 |
|
October |
1,200 |
115 |
1,315 |
|
January |
1,290 |
80 |
1,370 |
|
2019/20 |
April |
1,392 |
99 |
1,491 |
July |
1,487 |
89 |
1,576 |
|
October |
1,554 |
63 |
1,617 |
|
January |
1,669 |
43 |
1,712 |
|
End of fiscal year |
1,738 |
57 |
1,795 |
To put these reports into perspective, Figure A3 gives the proportion of distinct drugs on the market in Canada that were impacted by an “actual” shortage. The results mirror the trend in the number of shortages observed in Figure A2, showing a steady increase in shortage rates since October 2018. By the end of the study period, 17% of drugs sold in Canada were reported as being in “actual” shortage.
In many cases, the same ingredient can remain available for sale during a shortage because the ingredient is offered in the same formulation and strength from a different manufacturer. Also, the same ingredient can be available to patients in a different strength or formulation, although such variations are not always interchangeable. As such, the proportion of drugs in shortage is not necessarily representative of pharmaceutical ingredients with limited access. To better reflect the proportion of ingredients with possible access issues, Figure A3 shows the proportion of ingredients for which drugs impacted by shortages represented over 90% of sales for the given ingredient. These situations are significantly rarer and have remained stable since August 2017, at levels between 1.7% and 2.5% of ingredients sold in Canada.
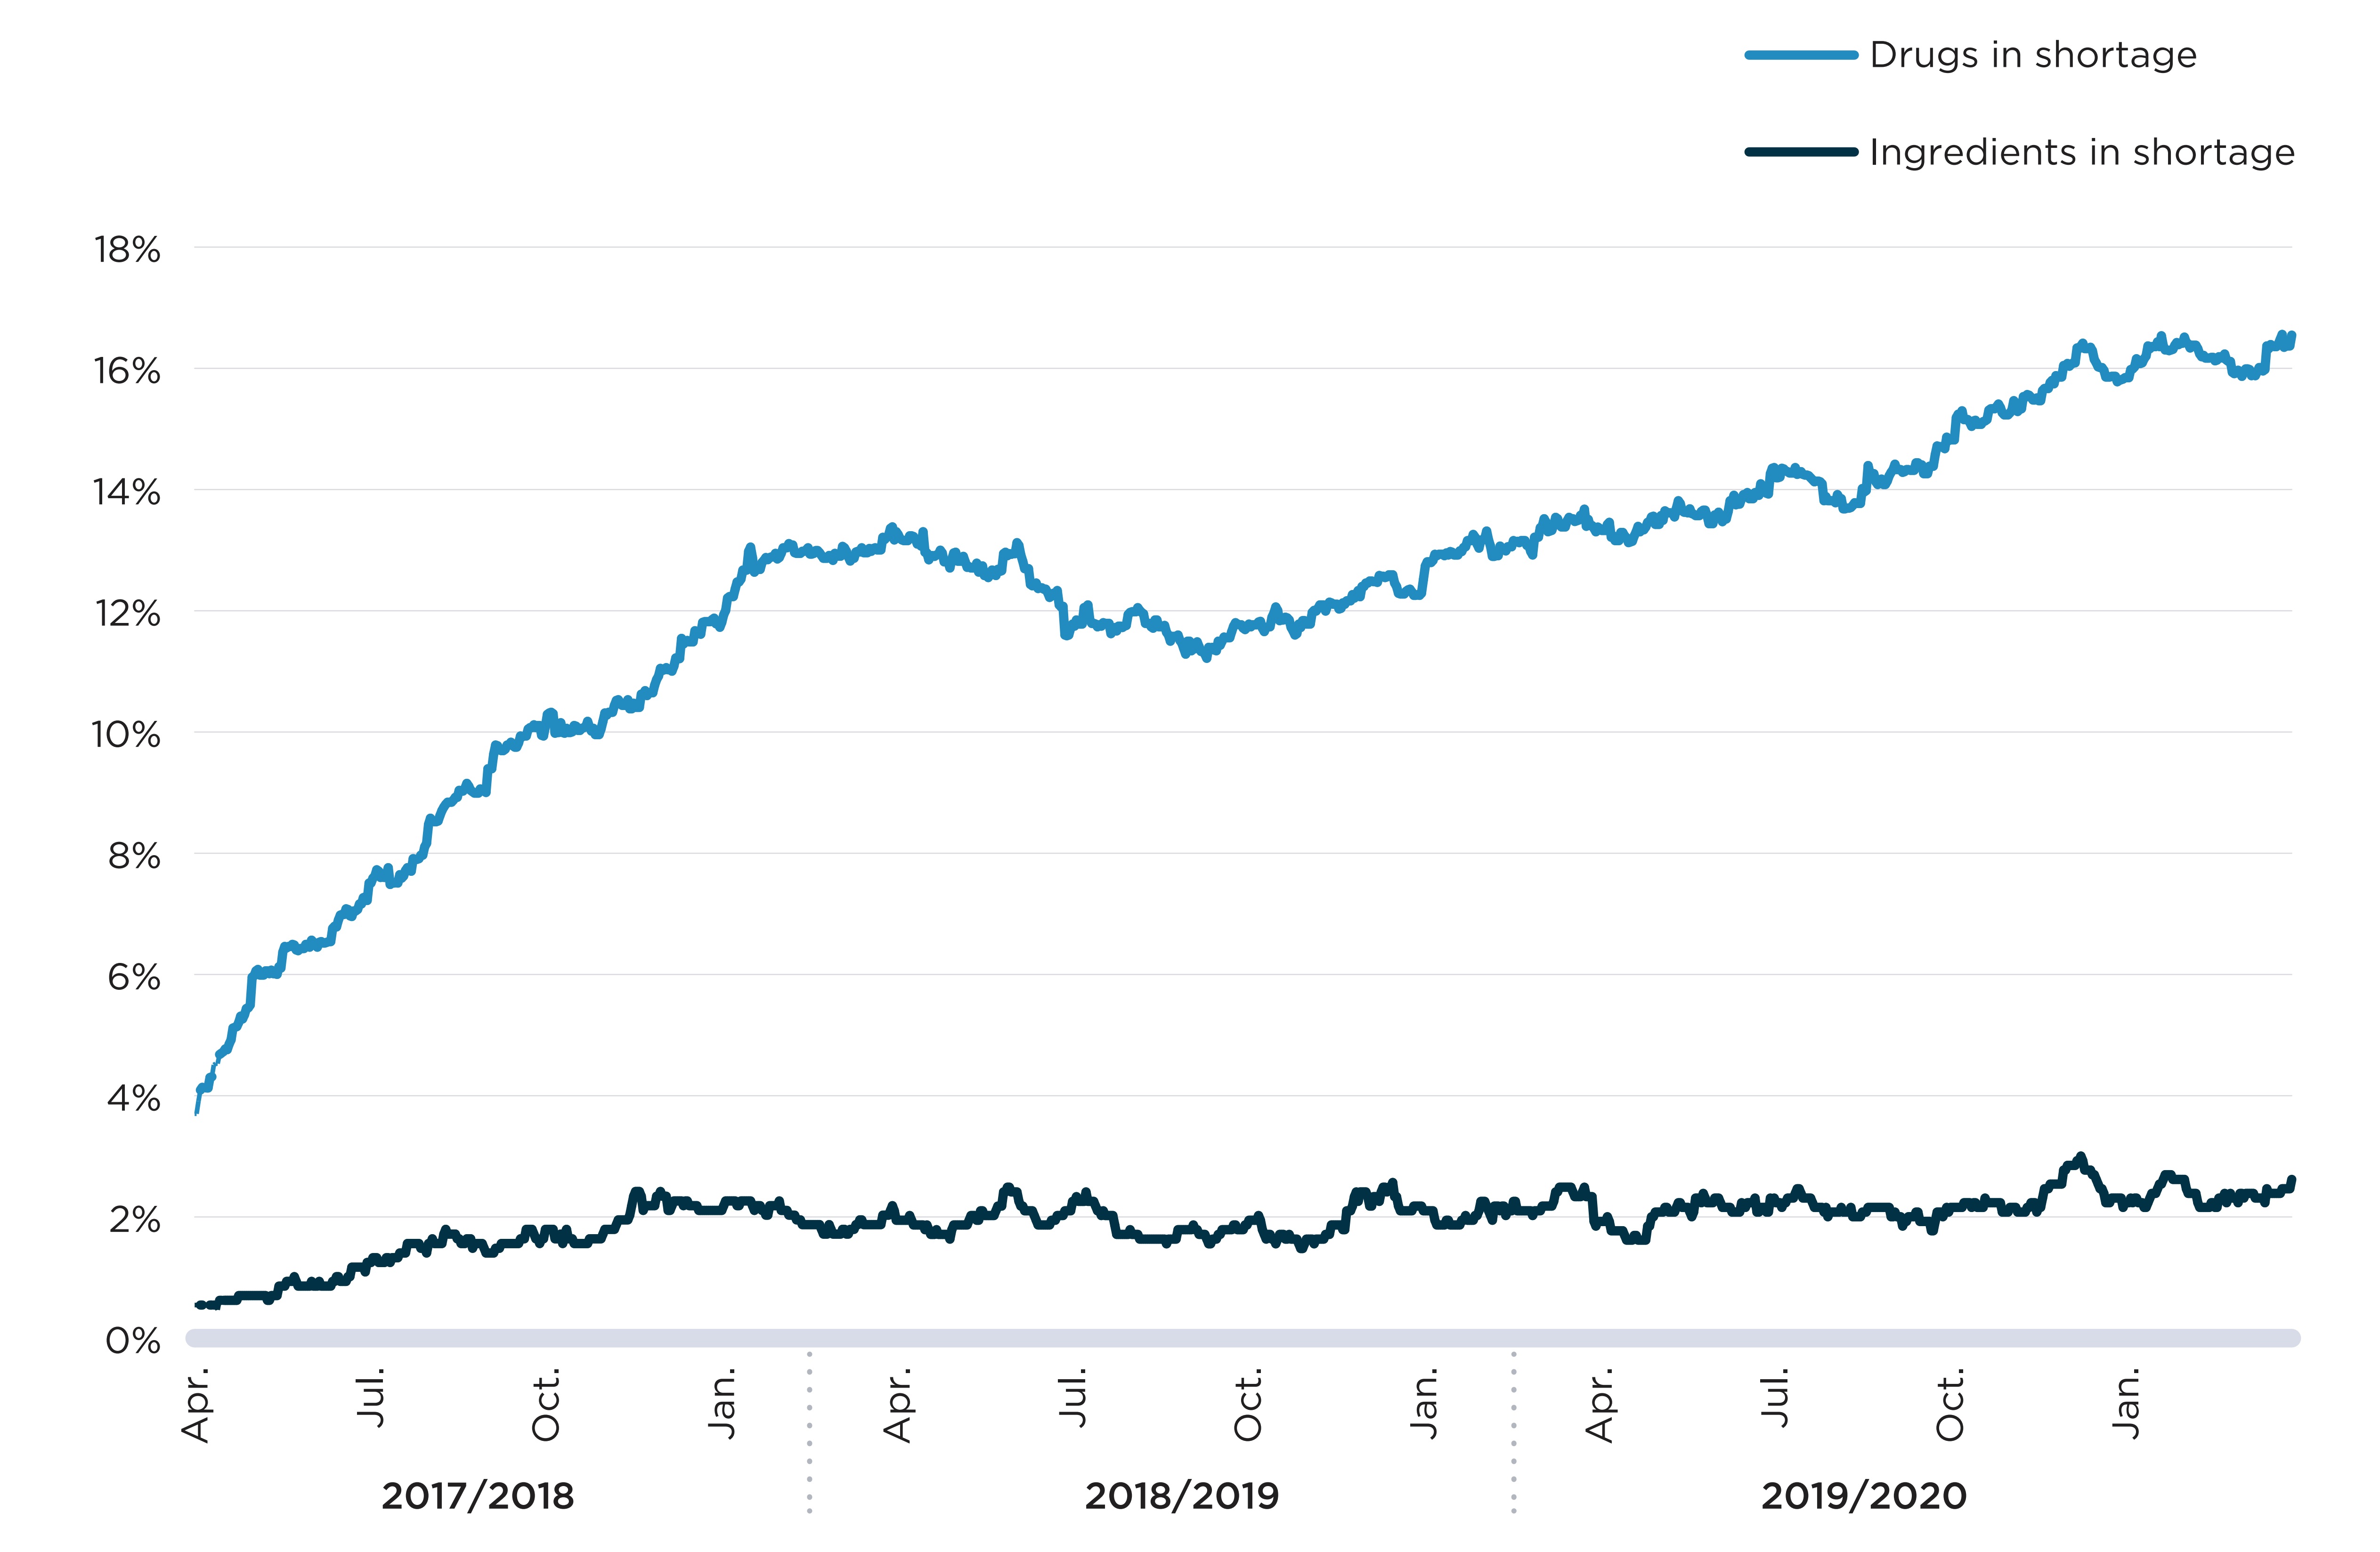
Note: Rates of drugs in shortage correspond to the percent of drugs with sales in Canada for which a shortage report had an "actual" status on a given day. Rates of ingredients in shortage correspond to the percent of distinct pharmaceutical ingredients or combination of ingredients for which drugs representing at least 90% of annual sales had a shortage report with an "actual" status on a given day.
Data source: www.drugshortagescanada.ca; IQVIA MIDAS® database; PMPRB.
Figure description
A line graph shows the trend in the proportion of drugs and medicinal ingredients in shortage from fiscal years 2017/18 to 2019/20. Drugs in shortage correspond to the drugs (defined at the ingredient, strength, form, and company level) with sales in Canada for which a shortage report had an “actual” shortage status on a given day. Ingredients in shortage correspond to the distinct pharmaceutical ingredients with sales in Canada for which medicines representing at least 90% of annual sales had a shortage report with an “actual” status on a given day. The top line represents the share of drugs in shortage and the bottom line represents the share of ingredients in shortage. There is a significant increase in the share of drugs in shortage over the period covered by this graph.
| Fiscal year | Month | Share of drugs in shortage | Share of ingredients in shortage |
|---|---|---|---|
2017/18 |
April |
3.7% |
0.5% |
May |
6.0% |
0.7% |
|
June |
6.6% |
0.9% |
|
July |
7.5% |
1.2% |
|
August |
8.5% |
1.6% |
|
September |
9.4% |
1.4% |
|
October |
10.1% |
1.8% |
|
November |
10.3% |
1.8% |
|
December |
11.0% |
2.3% |
|
January |
11.8% |
2.1% |
|
February |
12.9% |
2.1% |
|
March |
12.9% |
1.7% |
|
2018/19 |
April |
13.2% |
2.1% |
May |
12.9% |
1.8% |
|
June |
12.9% |
2.4% |
|
July |
11.6% |
2.1% |
|
August |
11.9% |
1.7% |
|
September |
11.5% |
1.8% |
|
October |
11.7% |
1.9% |
|
November |
11.8% |
1.6% |
|
December |
12.4% |
2.4% |
|
January |
12.3% |
2.2% |
|
February |
13.2% |
2.3% |
|
March |
13.2% |
2.1% |
|
2019/20 |
April |
13.4% |
1.9% |
May |
13.5% |
2.0% |
|
June |
13.4% |
2.2% |
|
July |
13.9% |
2.1% |
|
August |
13.8% |
2.0% |
|
September |
14.1% |
2.2% |
|
October |
14.7% |
2.1% |
|
November |
15.2% |
2.1% |
|
December |
15.9% |
2.5% |
|
January |
15.8% |
2.3% |
|
February |
16.4% |
2.6% |
|
March |
15.9% |
2.3% |
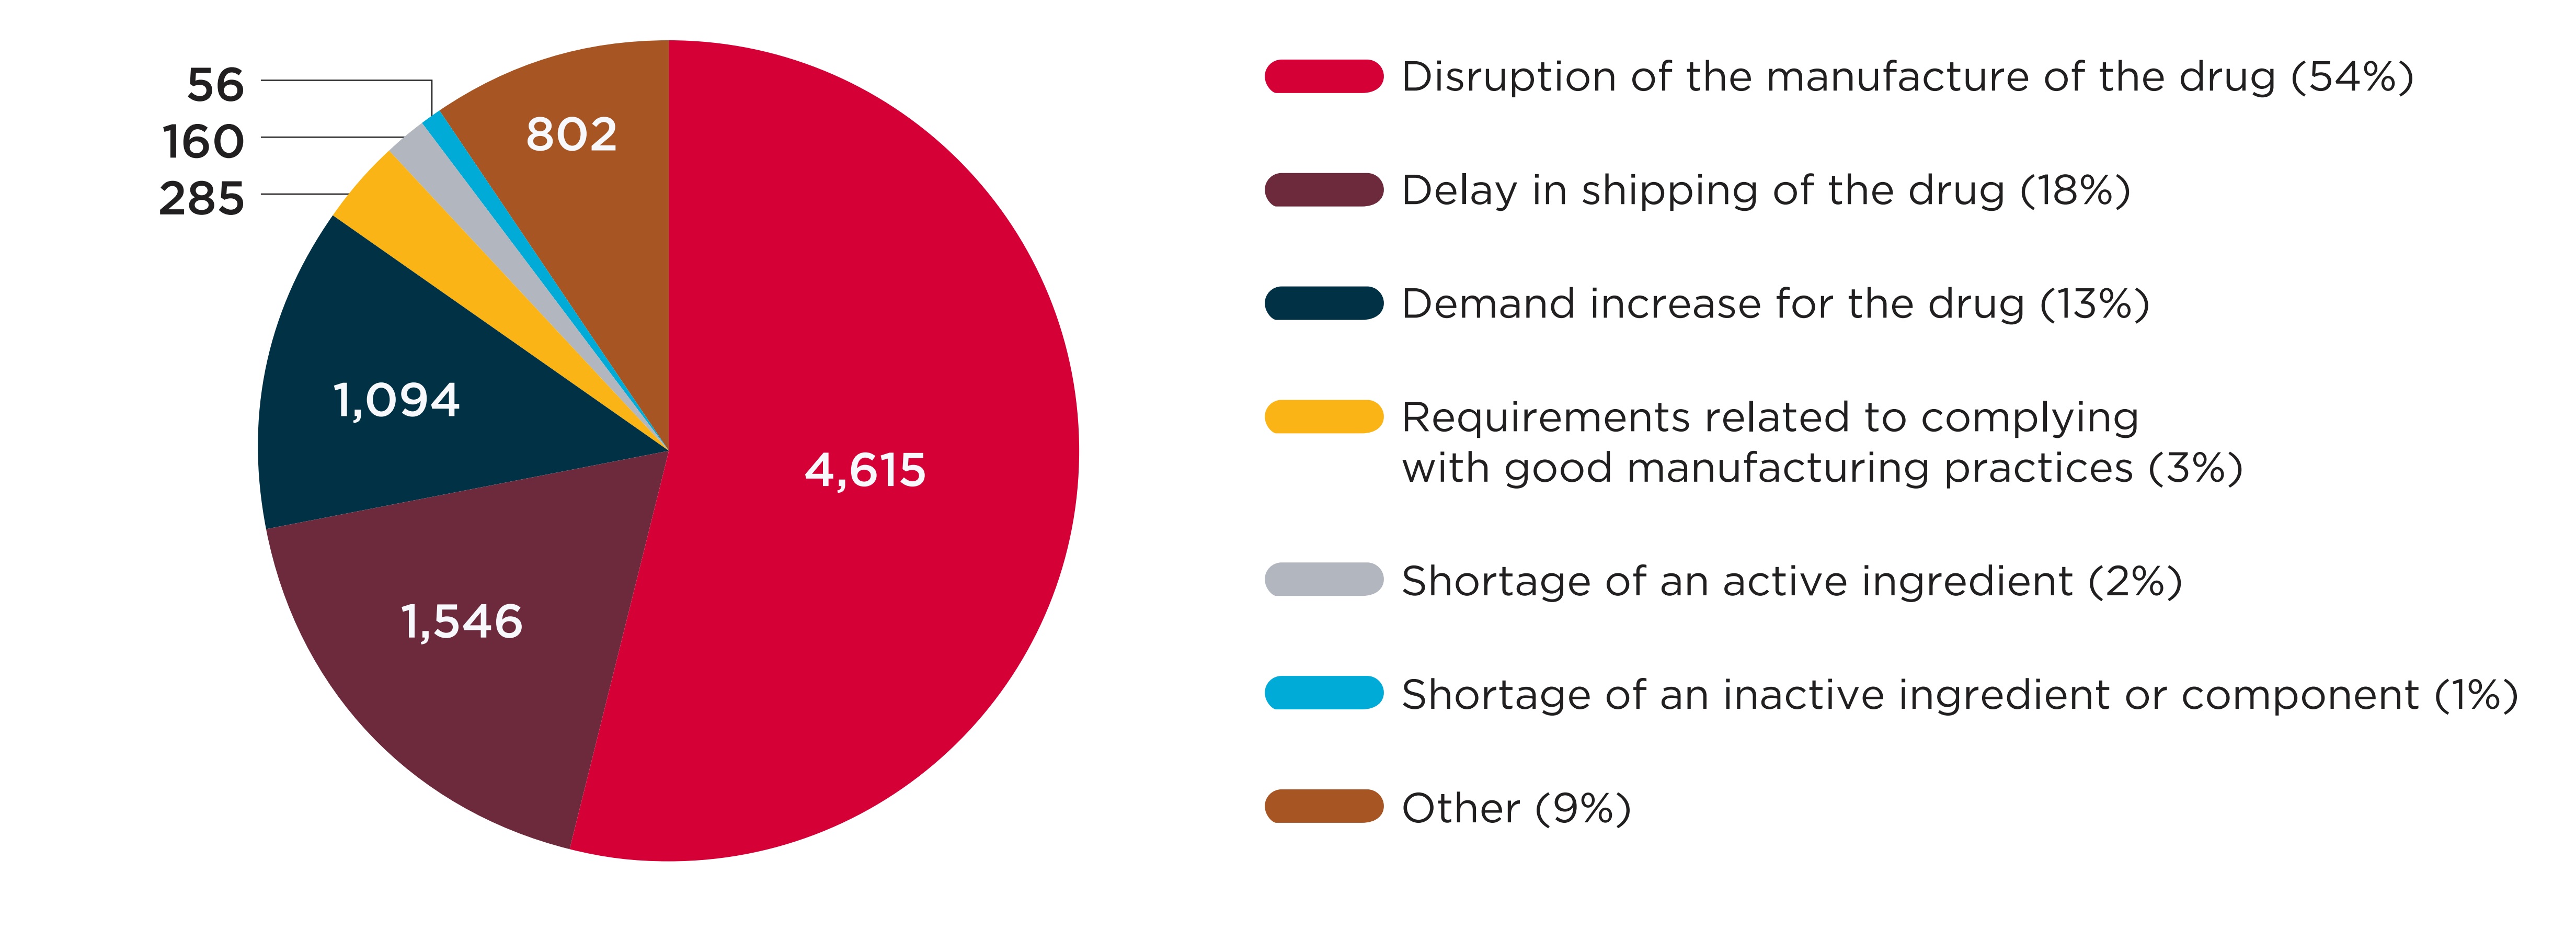
Figure A4 breaks down the distribution of shortages by the reasons cited in the manufacturer’s report. Most reports identified supply-side causes, with “disruption in the manufacture of the drugs” being cited by over half (54%) of reports. In 13% of reports, the reason for shortage was cited as “demand increase for the drug,” the only demand-side cause available in the reporting template.
Data source: www.drugshortagescanada.ca.
Figure description
A pie chart shows the distribution of drug shortage reports split by the reason cited by the manufacturer when the report was created, for reports issued from 2017/18 to 2019/20. The distribution is shown in terms of the total number of shortages as well as each reason’s share of total shortages for the entire period.
| Reason cited | Number of shortages | Share of shortages |
|---|---|---|
Disruption of the manufacture of the drug |
4,615 |
54% |
Delay in shipping of the drug |
1,546 |
18% |
Demand increase for the drug |
1,094 |
13% |
Requirements related to complying with good manufacturing practices |
285 |
3% |
Shortage of an active ingredient |
160 |
2% |
Shortage of an inactive ingredient or component |
56 |
1% |
Other |
802 |
9% |
B. The drugs with the highest shortage rates
This section details the drugs that were most impacted by shortages between 2017/18 and 2019/20. It reports on trends in the annual shortage rate, defined as the proportion of drugs with sales in Canada for which at least one “actual” shortage was reported during the year. Shortage rates are further broken down by market segment, drug characteristic, therapeutic class, and international price levels. The findings show that while no group of drugs is shortage-free, certain types of drugs are more likely to be in shortage than others.
Exploring the market segments affected by drug shortages can provide important insight into the potential implications for patients. When shortages affect patented or single-source non-patented medicines—that is, non-patented medicines sold by a single manufacturer—there is a greater risk that patient access to the pharmaceutical ingredient will be compromised because no direct substitute is available. In contrast, when shortages concern multi-source non-patented medicines—that is, non-patented medicines offered by multiple competing manufacturers—there is a greater likelihood that patients will be able to access the same ingredient in another product with the same formulation and strength.
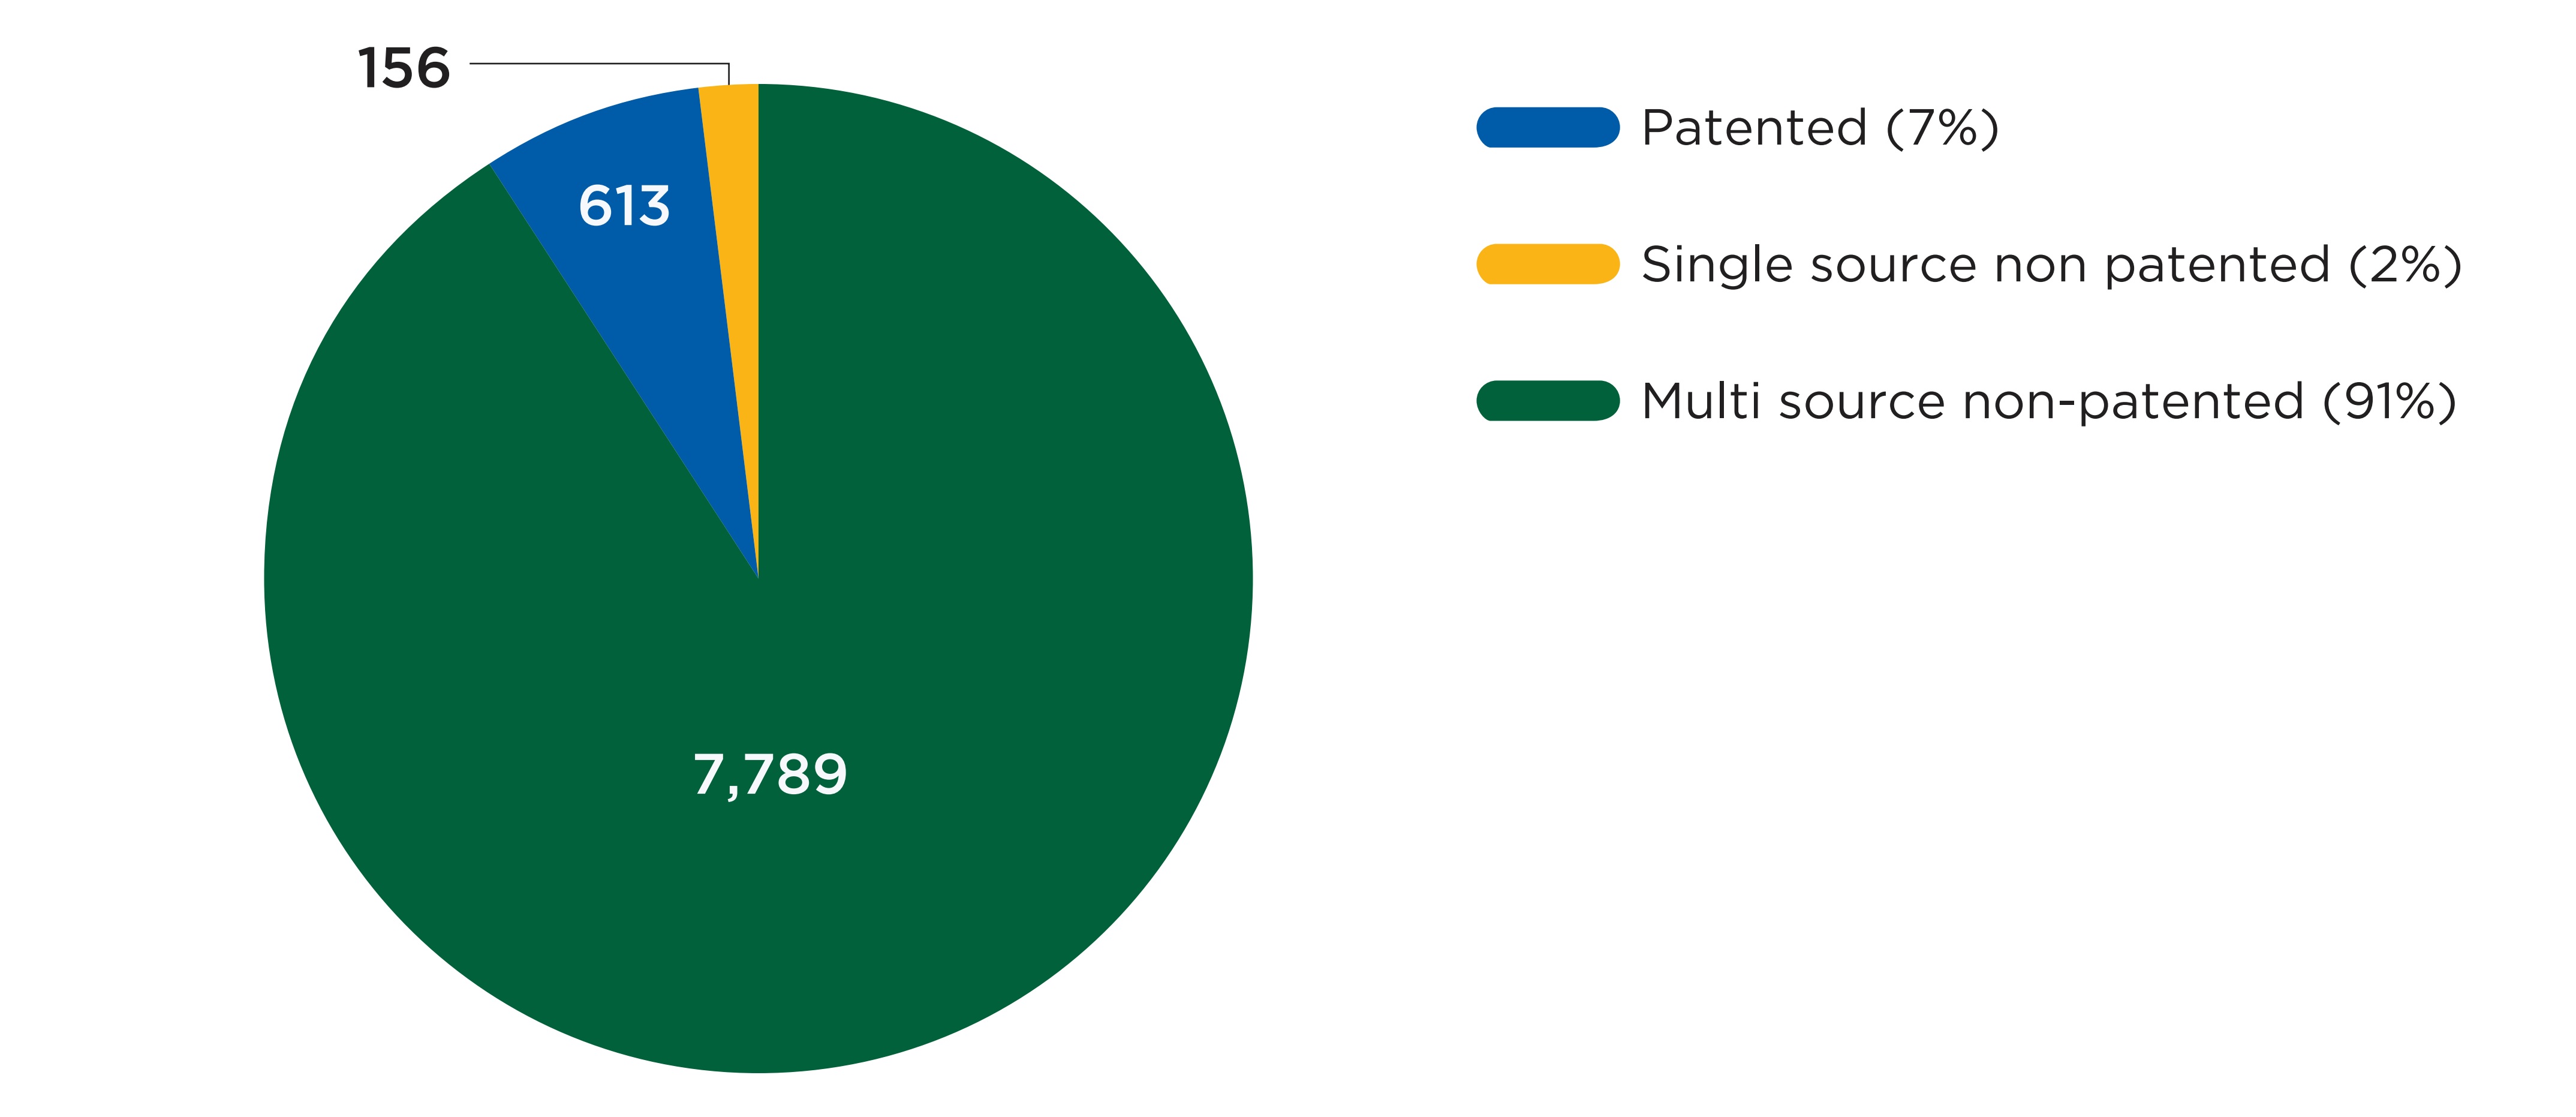
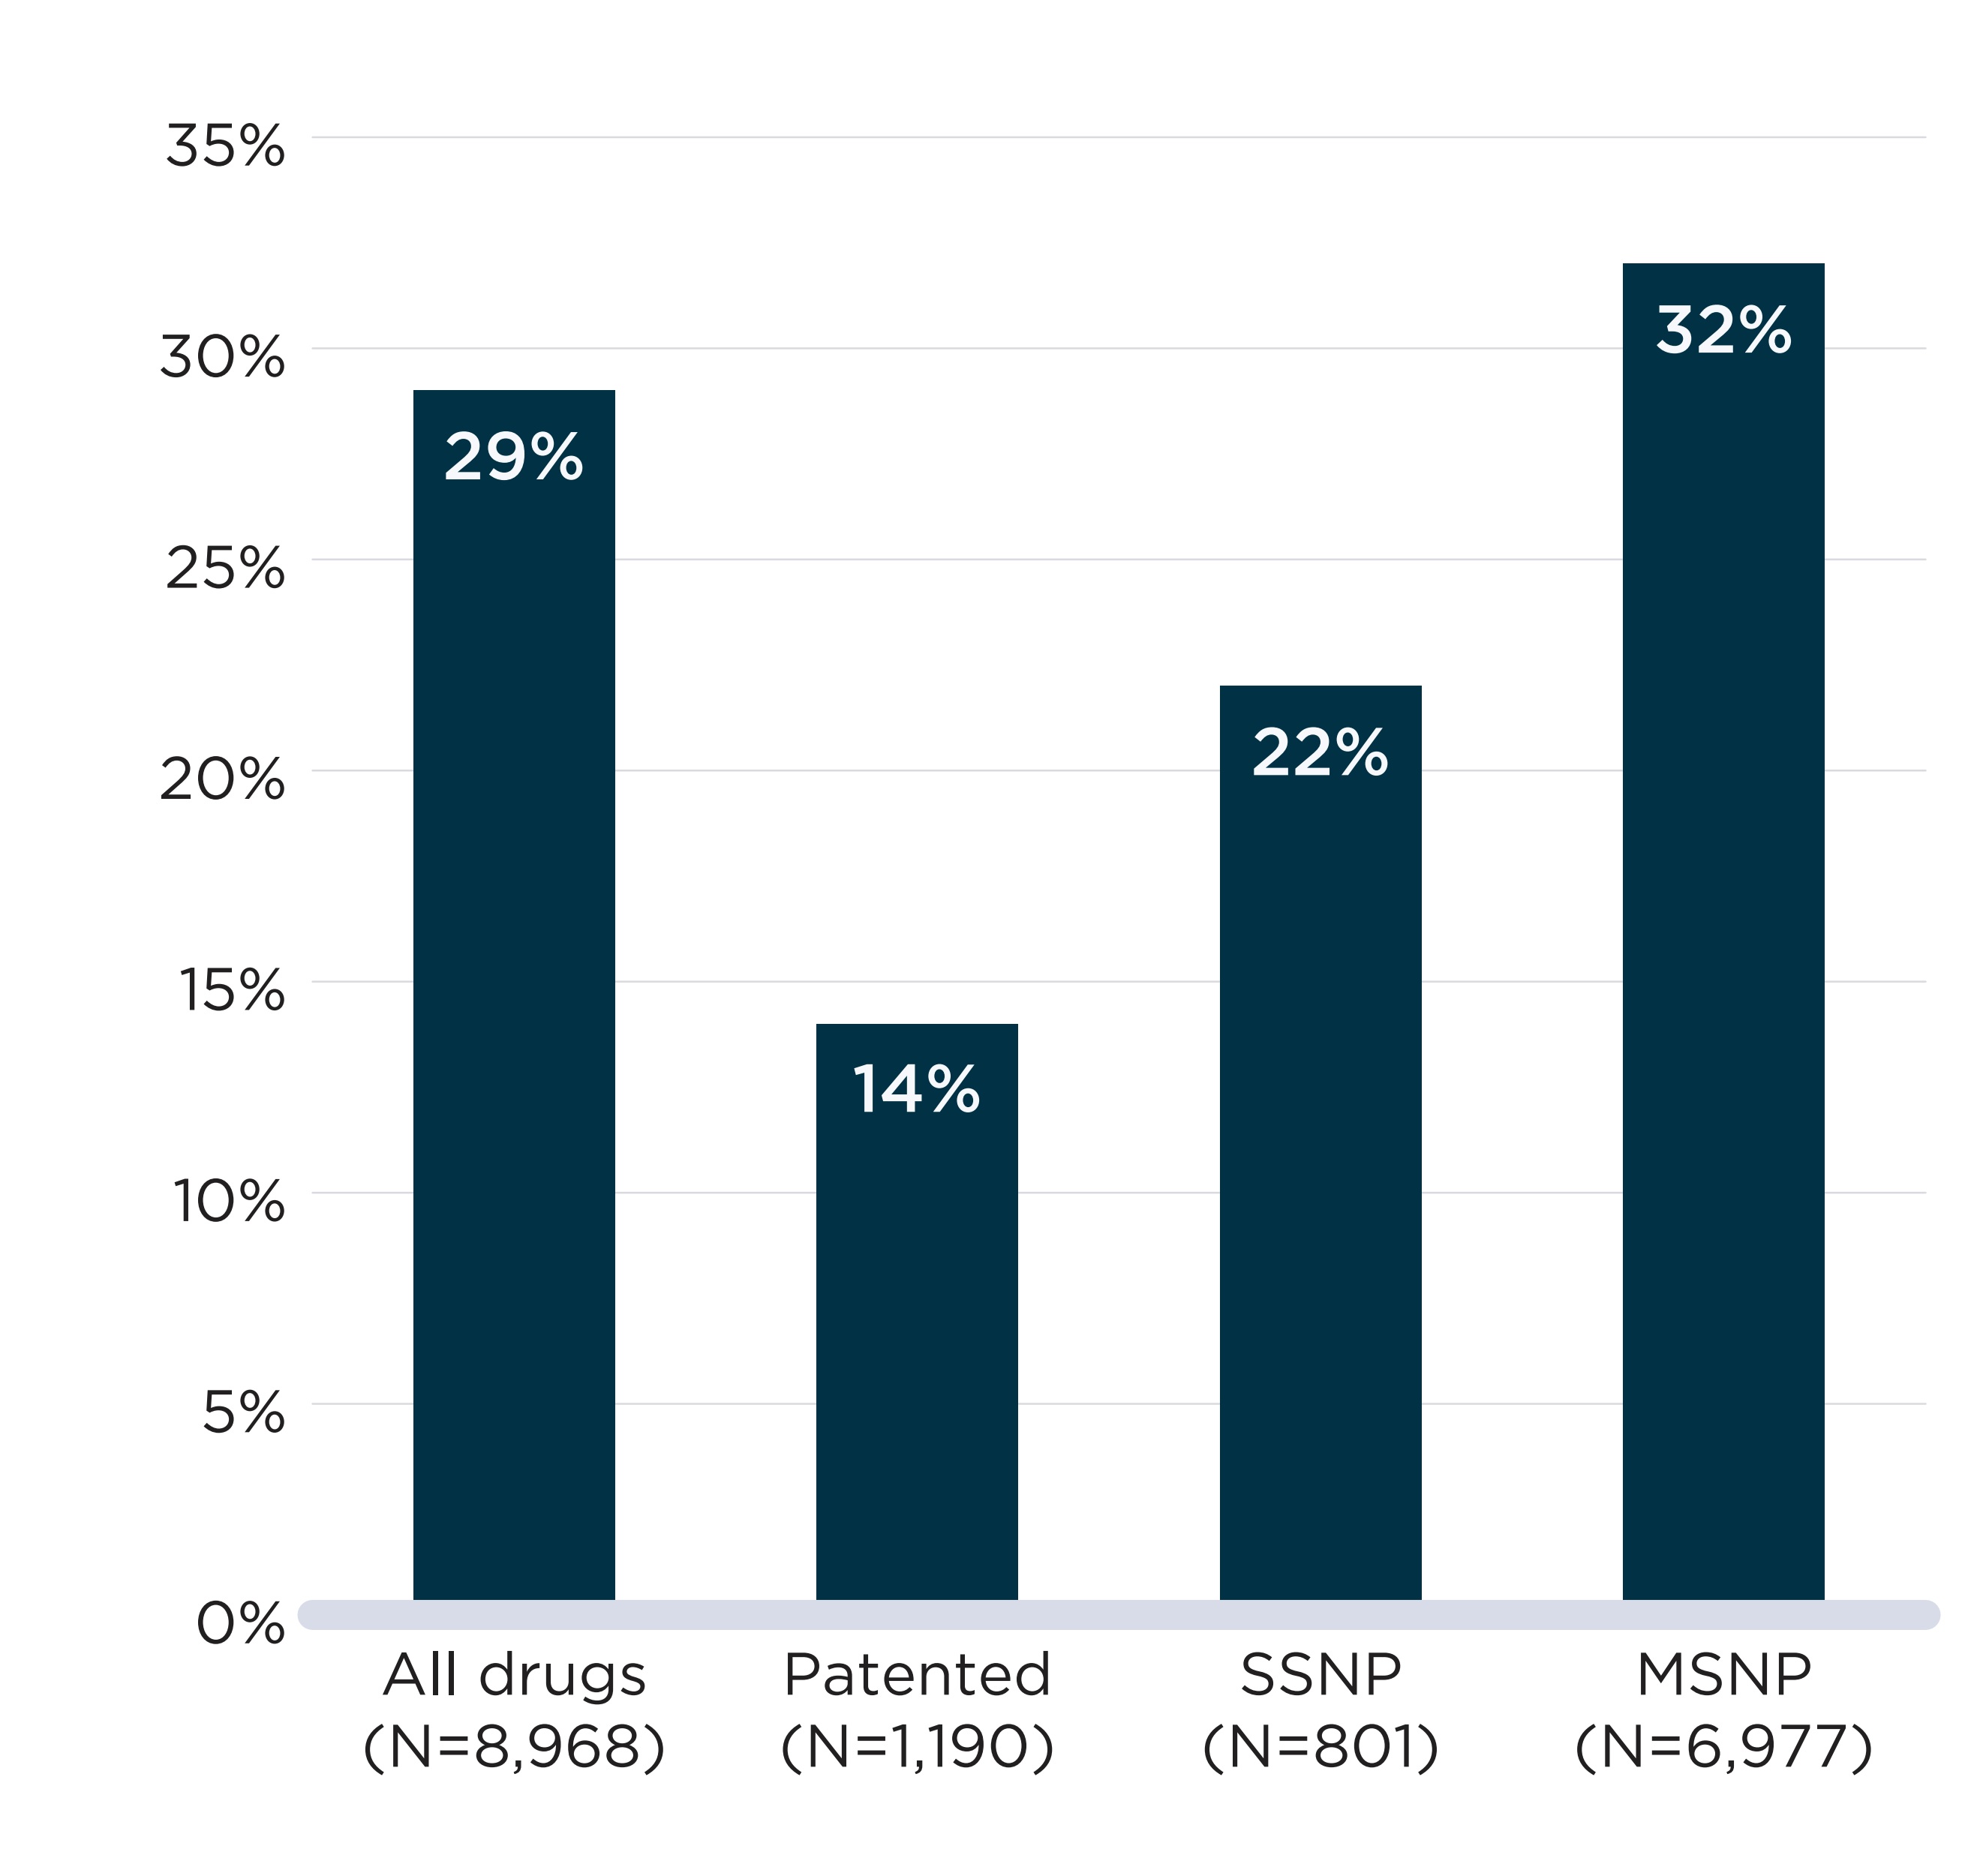
As shown in Figure B1, a vast majority (91%) of the shortage reports created from 2017/18 to 2019/20 concerned multi-source non-patented medicines. Patented medicines and single-source non-patented medicines accounted for 7% and 2% of reports, respectively. This suggests that direct substitutions were available to patients in most cases when a drug was reported as being in shortage. Figure B2 complements these results with an analysis of the annual shortage rates by market segment in 2019/20. It shows that patented medicines and single-source non-patented medicines had a markedly lower likelihood of being in shortage during the 2019/20 fiscal year than their multi-source counterparts.
Data source: www.drugshortagescanada.ca; IQVIA MIDAS® database; PMPRB.
Figure description
A pie chart gives the distribution of drug shortages reports from fiscal years 2017/18 to 2019/20 by three market segments: patented, single-source non-patented, and multi-source non-patented. The distribution is shown in terms of the number of shortages as well as the share of total shortages for the entire period.
| Market segment | Number of shortages | Share of shortages |
|---|---|---|
Patented |
613 |
7% |
Single-source non-patented |
156 |
2% |
Multi-source non-patented |
7,789 |
91% |
Note: SSNP: Single-source non-patented. MSNP: Multi-source non-patented.
Data source: www.drugshortagescanada.ca; IQVIA MIDAS® database; PMPRB.
Figure description
A bar graph shows the rates of drugs in shortage in fiscal year 2019/20 by four market segments: all drugs, patented, single-source non-patented (SSNP), and multi-source non-patented (MSNP). Rates correspond to the proportion of medicines with sales in Canada for which a shortage report had an “actual shortage” status in 2019/20.
| Market segment | Total number of medicines in the segment | Share of medicines in shortage |
|---|---|---|
All drugs |
8,968 |
29% |
Patented |
1,190 |
14% |
Single-source non-patented |
801 |
22% |
Multi-source non-patented |
6,977 |
32% |
In Table B1, 2019/20 shortage rates are presented for multiple groups of drugs. In addition to market segment, several other characteristics are associated with higher shortage rates:
- Generic drugs were twice as likely as brand drugs to be in shortage (34% vs. 16%);
- Drugs with an annual treatment cost below $10,000 had shortage rates three times higher than that of those with a treatment cost over $10,000 (30% vs. 11%);
- Oral solid drugs had higher shortage rates (32% for tablets and 29% for capsules) than solutions (20%); and
- Drugs that were primarily provided by community pharmacies were more likely to be in shortage than those mainly provided in a hospital setting (30% vs. 18%).
The table also gives results for shortage rates by market size and by whether the medicinal ingredients were listed on the WHO list of essential medicines,Footnote 3 though no notable variations were found for either measure.
Table B1. Drug shortage rates by drug characteristics, 2019/20
| Group | Drugs | Drugs with a shortage report | Share of drugs in shortage |
|---|---|---|---|
All drugs |
8,968 |
2,571 |
29% |
Segment |
|||
Patented |
1,190 |
169 |
14% |
Single-source non-patented |
801 |
178 |
22% |
Multi-source non-patented |
6,977 |
2,224 |
32% |
Generic status |
|||
Generic |
6,180 |
2,099 |
34% |
Brand |
2,254 |
362 |
16% |
Non-categorized |
534 |
110 |
21% |
Treatment cost |
|||
Treatment cost < 10,000$ |
8,508 |
2,520 |
30% |
Treatment cost ≥ 10,000 |
460 |
51 |
11% |
Setting for majority of revenues |
|||
Community |
7,763 |
2,350 |
30% |
Hospital |
1,205 |
221 |
18% |
WHO essential medicine list |
|||
Listed |
2,762 |
819 |
30% |
Not listed |
6,206 |
1,752 |
28% |
Formulation |
|||
Tablet |
4,929 |
1,562 |
32% |
Solution |
1,440 |
294 |
20% |
Capsule |
1,180 |
343 |
29% |
Other |
1,419 |
372 |
26% |
Market size for the molecule |
|||
Less than $1M |
2,553 |
609 |
24% |
$1M to $5M |
3,124 |
938 |
30% |
$5M to $10M |
1,240 |
404 |
33% |
$More than $10M |
2,051 |
620 |
30% |
Number of manufacturers for the molecule |
|||
1 manufacturer |
1,458 |
245 |
17% |
2 |
669 |
153 |
23% |
3 |
770 |
213 |
28% |
4 |
579 |
176 |
30% |
5 |
519 |
162 |
31% |
6+ manufacturers |
4,973 |
1,622 |
33% |
Note: WHO: World Health Organization. The World Health Organization essential medicine list status was assigned based on whether the drug’s pharmaceutical ingredients were listed in the 21st model list of essential medicines (World Health Organization 2019).
Data source: www.drugshortagescanada.ca; IQVIA MIDAS® database; IQVIA Private Drug Plan database; PMPRB.
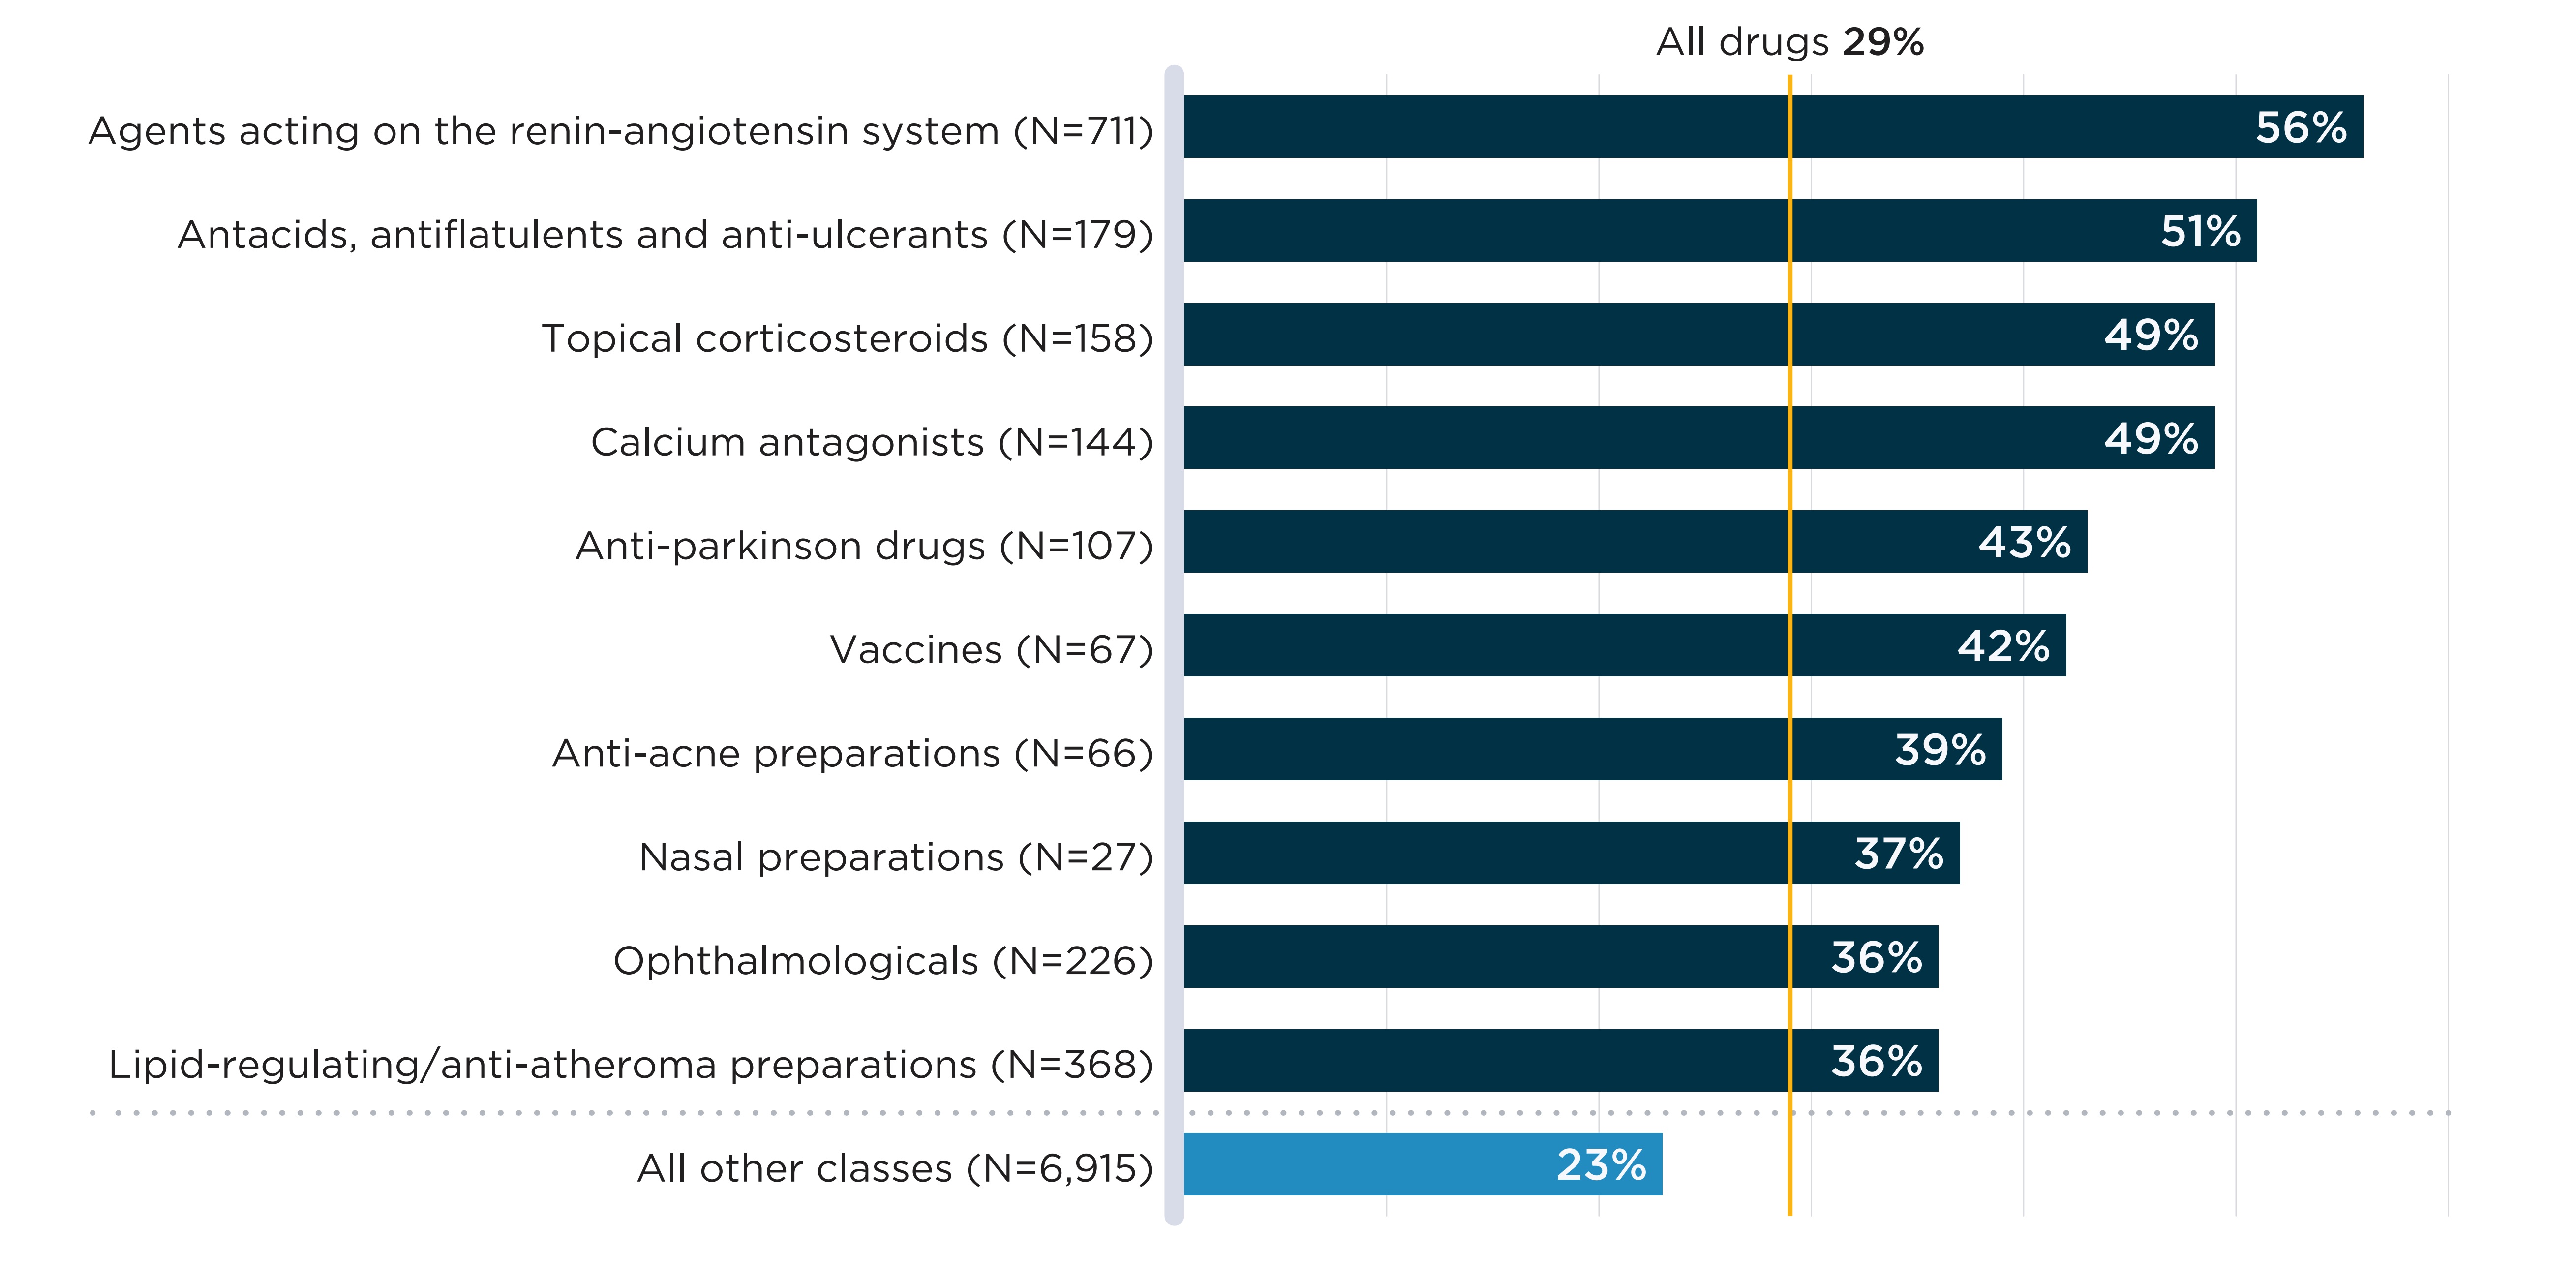
Some therapeutic classes are also more frequently in shortage than others. Figure B3 shows the 10 classes with the highest annual shortage rate in 2019/20. Seven of these classes had over 100 drugs with sales in Canada during the year, suggesting that substitution within the therapeutic class was possible in many cases. Six classes displayed shortage rates higher than 40%, meaning that at least 4 in 10 drugs within these classes were in shortage at some time during the year.
Therapeutic classes are defined based on the second level of the European Pharmaceutical Market Research Association (EphMRA) Anatomical Classification of Pharmaceutical Products. Therapeutic classes with fewer than 20 drugs with sales in Canada are excluded from the figure. Detailed results are presented in Appendix 2.
Data source: www.drugshortagescanada.ca; IQVIA MIDAS® database.
Figure description
A bar graph shows the 10 therapeutic classes with the highest share of drugs in shortage in fiscal year 2019/20 as well as the share of all other classes.
Of all drugs with sales in Canada in 2019/20, 29% were in shortage in fiscal year 2019/20. This number is listed above the chart and is not represented by a bar graph.
Rates correspond to the proportion of medicines with sales in Canada for which a shortage report had an “actual shortage” status in fiscal year 2019/20. Therapeutic classes are defined based on the second level of the European Pharmaceutical Market Research Association (EphMRA) Anatomical Classification of Pharmaceutical Products.
| Therapeutic class | Number of medicines in the class | Share of medicines in shortage |
|---|---|---|
Agents acting on renin-angiotensin system |
711 |
56% |
Antiacids, antiflatulents and anti-ulcerants |
179 |
51% |
Topical corticosteroids |
158 |
49% |
Calcium antagonists |
144 |
49% |
Antiparkinson drugs |
107 |
43% |
Vaccines |
67 |
42% |
Anti-acne preparations |
66 |
39% |
Nasal preparations |
27 |
37% |
Ophthalmologicals |
226 |
36% |
Lipid-regulating/anti-atheroma preparations |
368 |
36% |
All other classes |
6,915 |
23% |
As shown in Figure A4, most reasons cited for Canadian shortages during the study period concerned supply disruptions, with disruptions in the manufacture of the drug and shipping delays cited as the reason for over 70% of shortages.
Because the supply chain of drugs where those disruptions and delays occur is global in nature (Multi-Stakeholder Committee on Drug Shortages 2017), it is worth investigating whether the relative international prices of drugs are correlated with shortages. If global supply chains prioritized countries with high prices when production disruptions occurred, we would observe higher shortage rates in Canada for drugs with low prices relative to other countries, and lower rates for drugs with high prices relative to other countries.
In-depth: International prices and drug shortages
To study relative prices, the PMPRB uses foreign-to-Canadian (FTC) price ratios, in which the prices of medicines in other countries are expressed as a ratio of the price in Canada. For example, the German FTC ratio for a given drug is:
FTC = Unit price of aspirin Germany / Unit price of aspirin Canada
Because the foreign price is the numerator of the ratio, an FTC ratio above 1 indicates a situation in which the Canadian price is lower than that of other countries; an FTC ratio below 1 indicates a situation in which the Canadian price is higher than that of other countries; and an FTC ratio of 1 indicates a situation in which the Canadian price is perfectly aligned with that of other countries.
To investigate the association between international prices and drug shortages, the median FTC ratio across PMPRB11 comparator countries for all oral solid drugs with sales in Canada in 2019/20 was estimated using the IQVIA MIDAS® database. The shortage rates of drugs with three or more comparator countries were then compared by median FTC ratio level. A description of the sample used for this analysis is presented in Appendix 2 (Table 2.1).
These comparisons are used to test whether, on average, drugs with a relatively low Canadian price have higher shortage rates. Graphically, this would present as a strong positive association between FTC ratios and shortage rates.
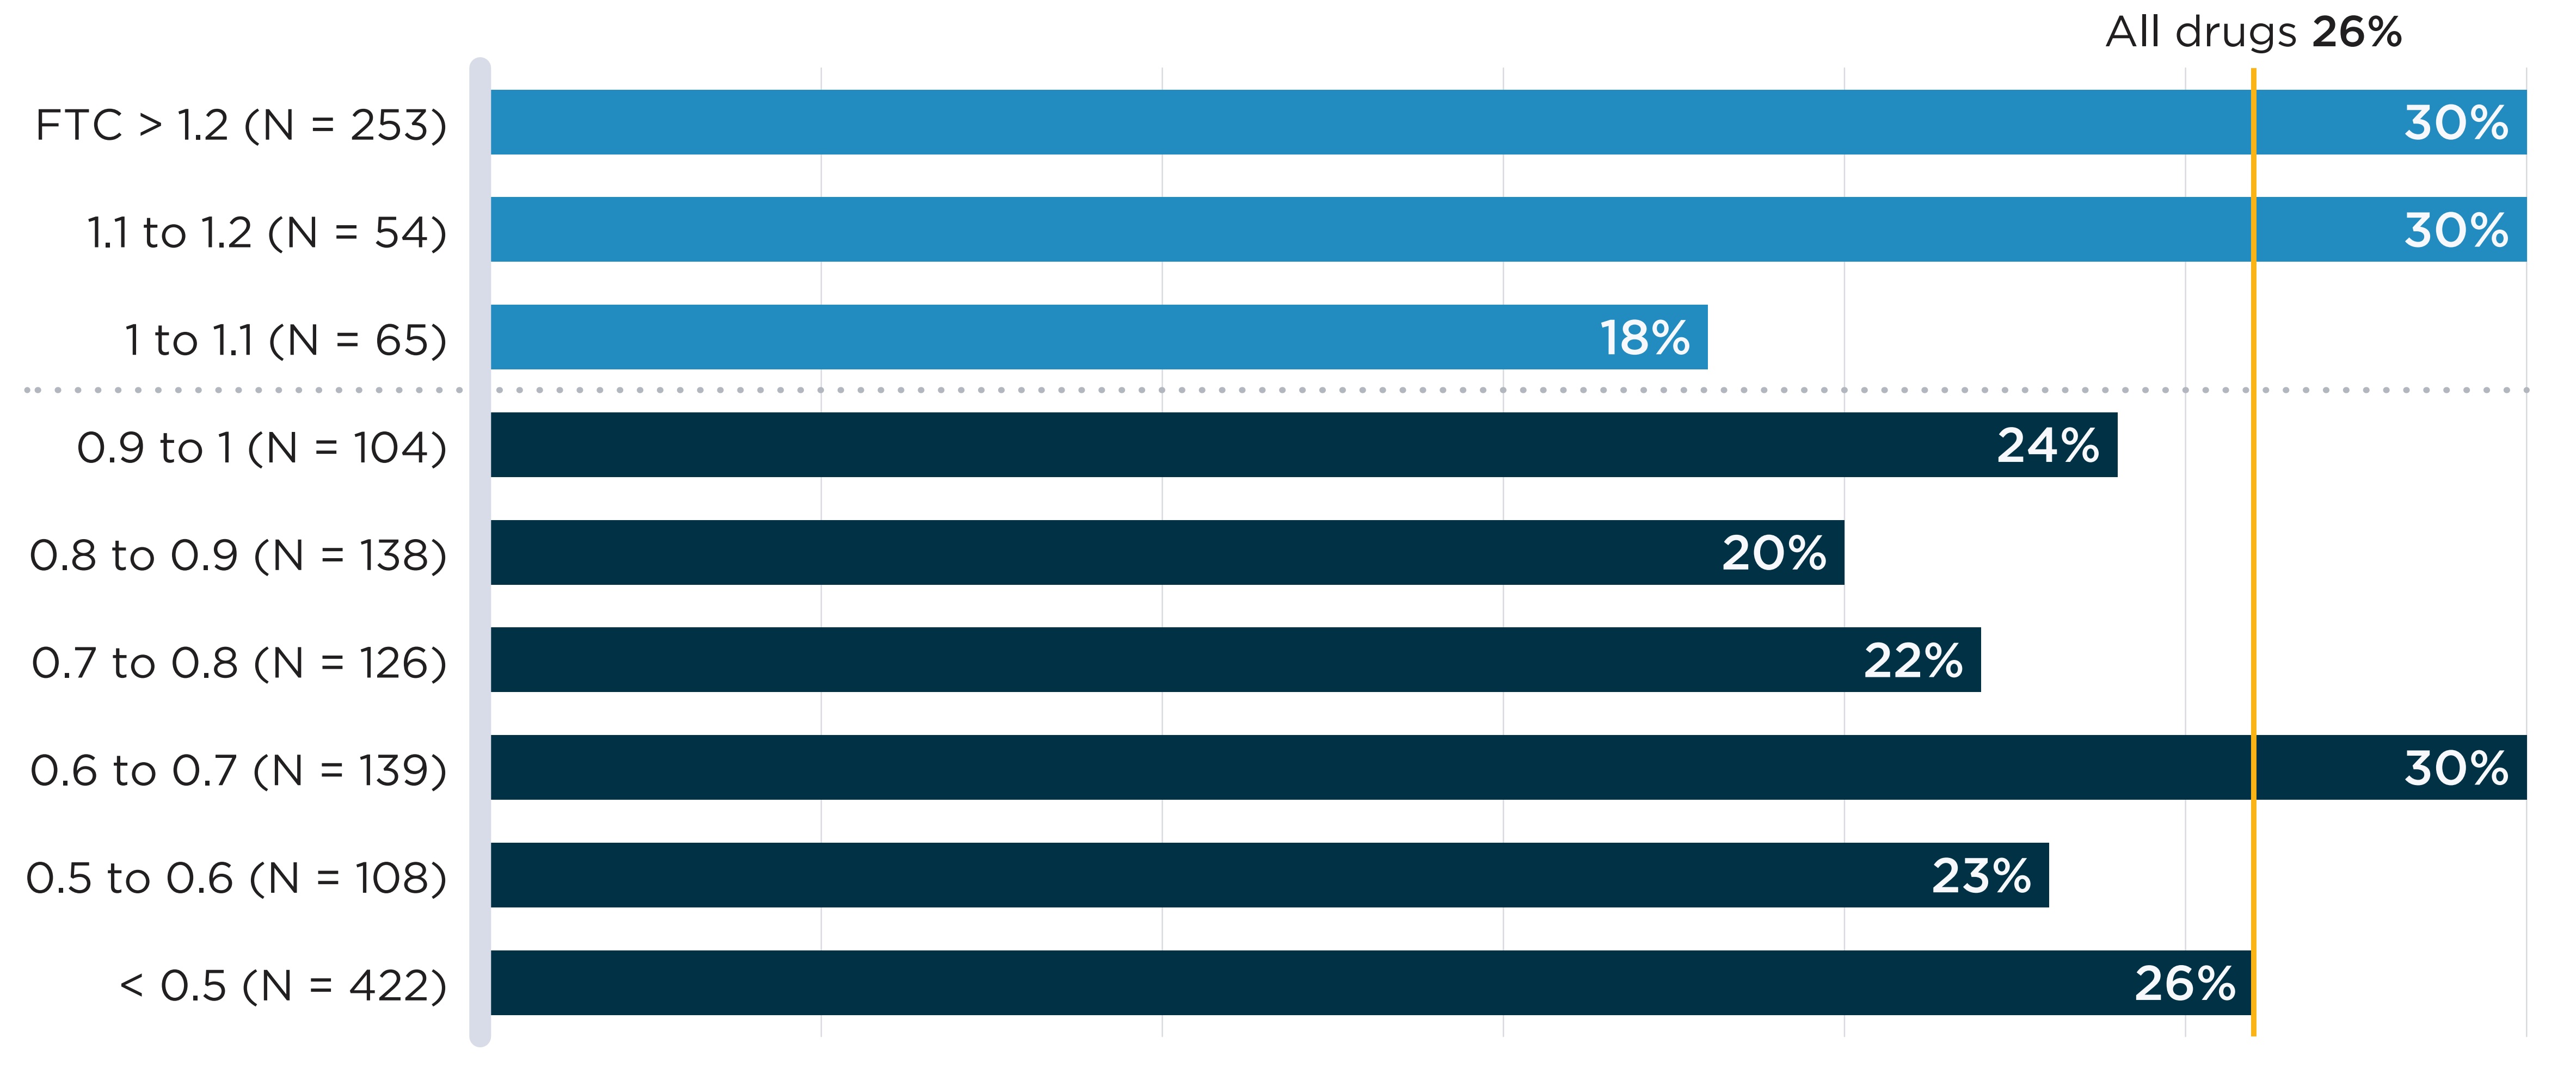
In Figure B4, annual shortage rates of oral solid drugs with sales in Canada are plotted against the median list price FTC ratio across the PMPRB11 comparator countries. No clear association is found between higher foreign prices and shortage rates. To explore whether results differ between market segments, Appendix 1 presents the same analysis separately for patented and non-patented medicines. In both cases, no association is apparent between relative prices and shortage rates. However, it is worth noting that these figures show average shortage rates over aggregated groups of drugs; lower relative prices may still contribute to shortages in specific cases.
Note: PMPRB11: Australia, Belgium, France, Germany, Italy, Japan, the Netherlands, Norway, Spain, Sweden, and the United Kingdom.
FTCs are the median foreign-to-Canadian price ratios calculated across PMPRB11 comparator countries (see In-depth: International prices and drug shortages box for details).
Data source: www.drugshortagescanada.ca; IQVIA MIDAS® database.
Figure description
A bar graph shows the share of oral solid medicines in shortage in fiscal year 2019/20 by tiers of median foreign-to-Canadian (FTC) price ratios. Price ratios are calculated by comparing the median price in the 11 PMPRB comparator countries to the price in Canada with the Canadian price set to a value of 1.00. Ratios over 1.00 indicate a higher international price. Ratios below 1.00 indicate a lower international price. A share for all oral solid medicines (26%) is also given. The share for all oral solid medicines is listed in the title of the bar graph and is represented by a vertical dashed line drawn down the length of the graph. This makes it easier to compare each tier to the share for all oral solid medicines.
| Foreign-to-Canadian price ratio | Total number of drugs | Share of drugs in shortage |
|---|---|---|
Greater than 1.2 |
253 |
30% |
1.1 to 1.2 |
54 |
30% |
1.0 to 1.1 |
65 |
18% |
0.9 to 1.1 |
104 |
24% |
0.8 to 0.9 |
138 |
20% |
0.7 to 0.8 |
126 |
22% |
0.6 to 0.7 |
139 |
30% |
0.5 to 0.6 |
108 |
23% |
All oral solid medicines |
1,409 |
26% |
C. Resolution rates and duration of shortages
This section documents resolution rates of shortages during the year following their onset by measuring the proportion of shortages that achieved a “resolved” status by a given date. Most shortages were resolved within a 3-month period, but some groups of drugs displayed slower resolution than others and a minority remained unresolved a year after the shortage’s onset.
Based on the reports filed by manufacturers, most drug shortages are resolved within three months of their onset. As shown in Figure C1, 55% of reports were updated to “resolved” by the company that filed the report within a three-month period and about three quarters (74%) were updated to “resolved” within a six-month period.
Two factors were associated with faster shortage resolution. Shortages that were anticipated (i.e., shortage reports that had an “anticipated” status at creation) were resolved faster than unexpected shortages (i.e., those with an “actual” status at creation). By one month after the shortage onset, “anticipated” shortages were seven percentage points more likely to be resolved than unexpected shortages. Shortages of drugs with fewer competitors were also resolved faster. Shortages of patented and single-source non-patented medicines had greater resolution rates at one, three, and six months after onset than those of multi-source non-patented medicines.
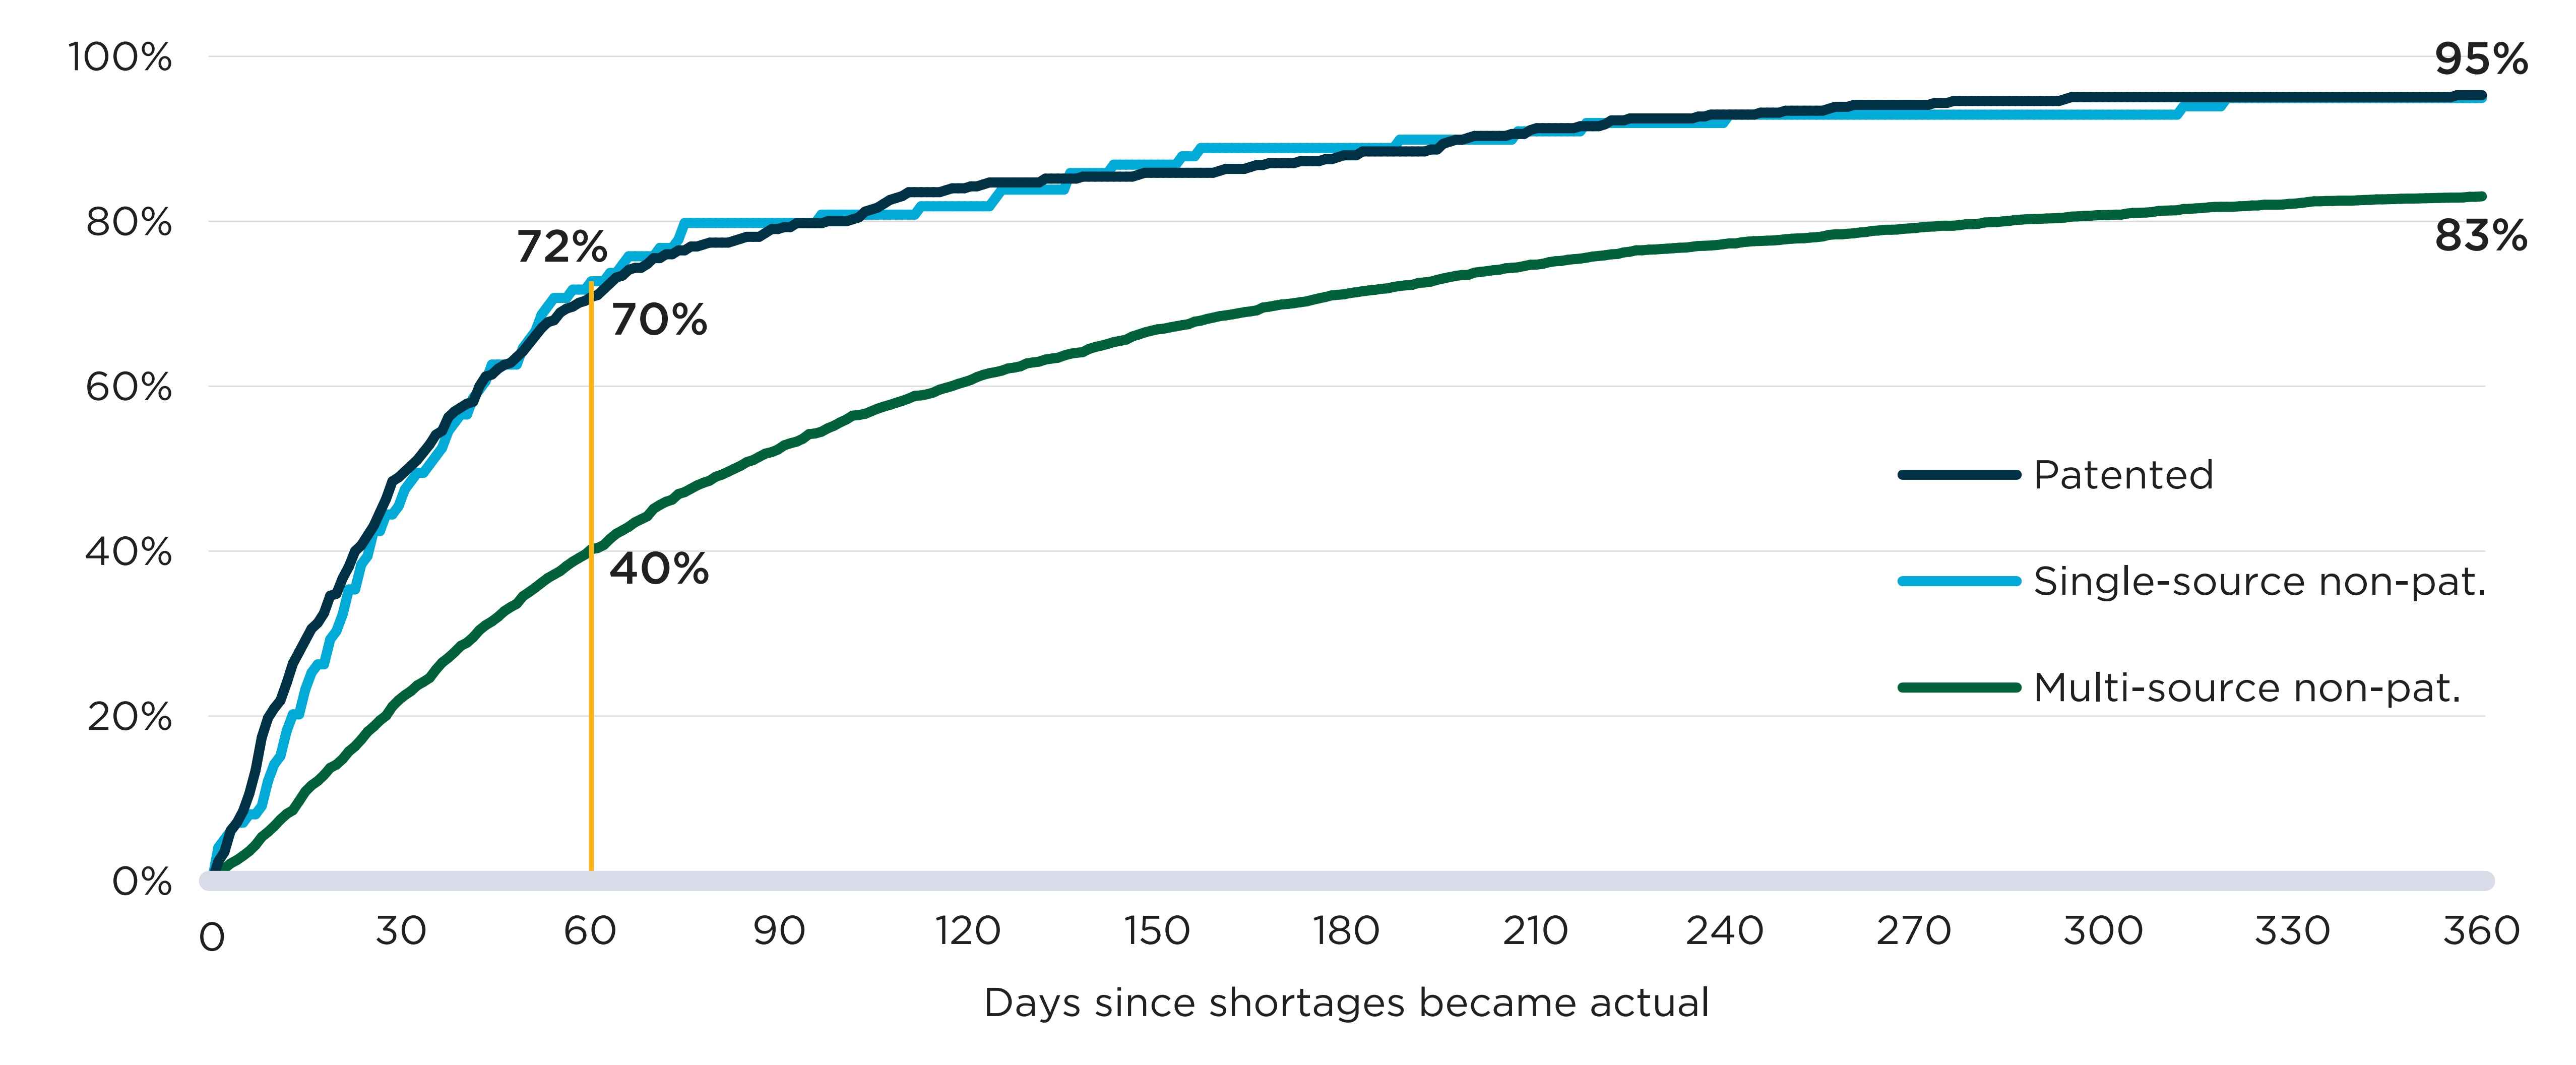
Figure C2 shows cumulative resolution rates for drug shortages in the year after their onset. The first 60 days after onset had the steepest rates of resolution for all market segments shown, with the pace slowing in the following months. Throughout, resolution rates were markedly lower for multi-source non-patented medicines, and their end-of-year resolution rate (83%) was below the rate for patented and single-source non-patented medicines (96%).

Note: The figure excludes shortages with an onset less than six months prior to the data export as well as those for drugs with a discontinuation report created within one month of the report being resolved.
Data source: www.drugshortagescanada.ca; IQVIA MIDAS® database; PMPRB.
Figure description
A stacked horizontal bar graph shows the distribution of drug shortages reported from fiscal years 2017/18 to 2019/20 by the time to reach the resolved status. They are sorted by three timeframes: one month, one to three months, and three to six months after onset. Results are presented for all shortages; anticipated and unexpected shortages; and by patented, single-source non-patented, and multi-source non-patented market segments.
| Share resolved within one month of onset | Share resolved between one and three months of onset | Share resolved between three and six months of onset | Total share resolved within six months of onset | |
|---|---|---|---|---|
All shortages |
24% |
31% |
19% |
74% |
Anticipated shortages |
29% |
30% |
18% |
78% |
Unexpected shortages |
22% |
31% |
19% |
72% |
Patented |
48% |
30% |
10% |
87% |
Single-source non-patented |
43% |
35% |
12% |
90% |
Multi-source non-patented |
22% |
31% |
20% |
72% |
Note: The figure excludes shortages with an onset less than 365 days prior to the data export as well as shortages for drugs with a discontinuation report created within one month of the report being resolved.
Data source: www.drugshortagescanada.ca; IQVIA MIDAS® database; PMPRB.
Figure description
A line graph shows the cumulative share of drug shortages resolved up to 365 days after onset. Results are given by market segment: patented, single-source non-patented, and multi-source non-patented.
| Number of days after onset | Share of shortages for patented medicines resolved | Share of shortages for single-source non-patented medicines resolved | Share of shortages for multi-source non-patented medicines resolved |
|---|---|---|---|
0 |
0% |
0% |
0% |
10 |
21% |
14% |
7% |
20 |
35% |
30% |
14% |
30 |
49% |
45% |
22% |
40 |
57% |
57% |
29% |
50 |
64% |
65% |
35% |
60 |
70% |
72% |
40% |
70 |
75% |
76% |
44% |
80 |
77% |
80% |
49% |
90 |
79% |
80% |
52% |
100 |
80% |
81% |
55% |
110 |
83% |
81% |
58% |
120 |
84% |
82% |
60% |
130 |
85% |
84% |
62% |
140 |
85% |
86% |
64% |
150 |
86% |
87% |
67% |
160 |
86% |
89% |
68% |
170 |
87% |
89% |
70% |
180 |
88% |
89% |
71% |
190 |
88% |
89% |
72% |
200 |
90% |
90% |
73% |
210 |
91% |
91% |
74% |
220 |
92% |
91% |
75% |
230 |
92% |
92% |
76% |
240 |
93% |
92% |
77% |
250 |
93% |
93% |
78% |
260 |
94% |
93% |
78% |
270 |
94% |
93% |
79% |
280 |
95% |
93% |
79% |
290 |
95% |
93% |
80% |
300 |
95% |
93% |
81% |
310 |
95% |
93% |
81% |
320 |
95% |
94% |
82% |
330 |
95% |
95% |
82% |
340 |
95% |
95% |
82% |
350 |
95% |
95% |
83% |
360 |
95% |
95% |
83% |
D. Impact of shortages on public plan beneficiaries
This section documents the change in public plan beneficiaries during shortages by comparing the number of active monthly beneficiaries for a given drug before and during the shortage. Shortages are considered at the drug level and at the chemical subgroup level, which accounts for substitutions made to similar drugs within the same therapeutic class. At the drug level, 40% of shortages were followed by a steep decline (>20%) in beneficiaries. However, when considering the chemical subgroup of drugs impacted by shortages, only 8% of shortages were associated with a similar decline.
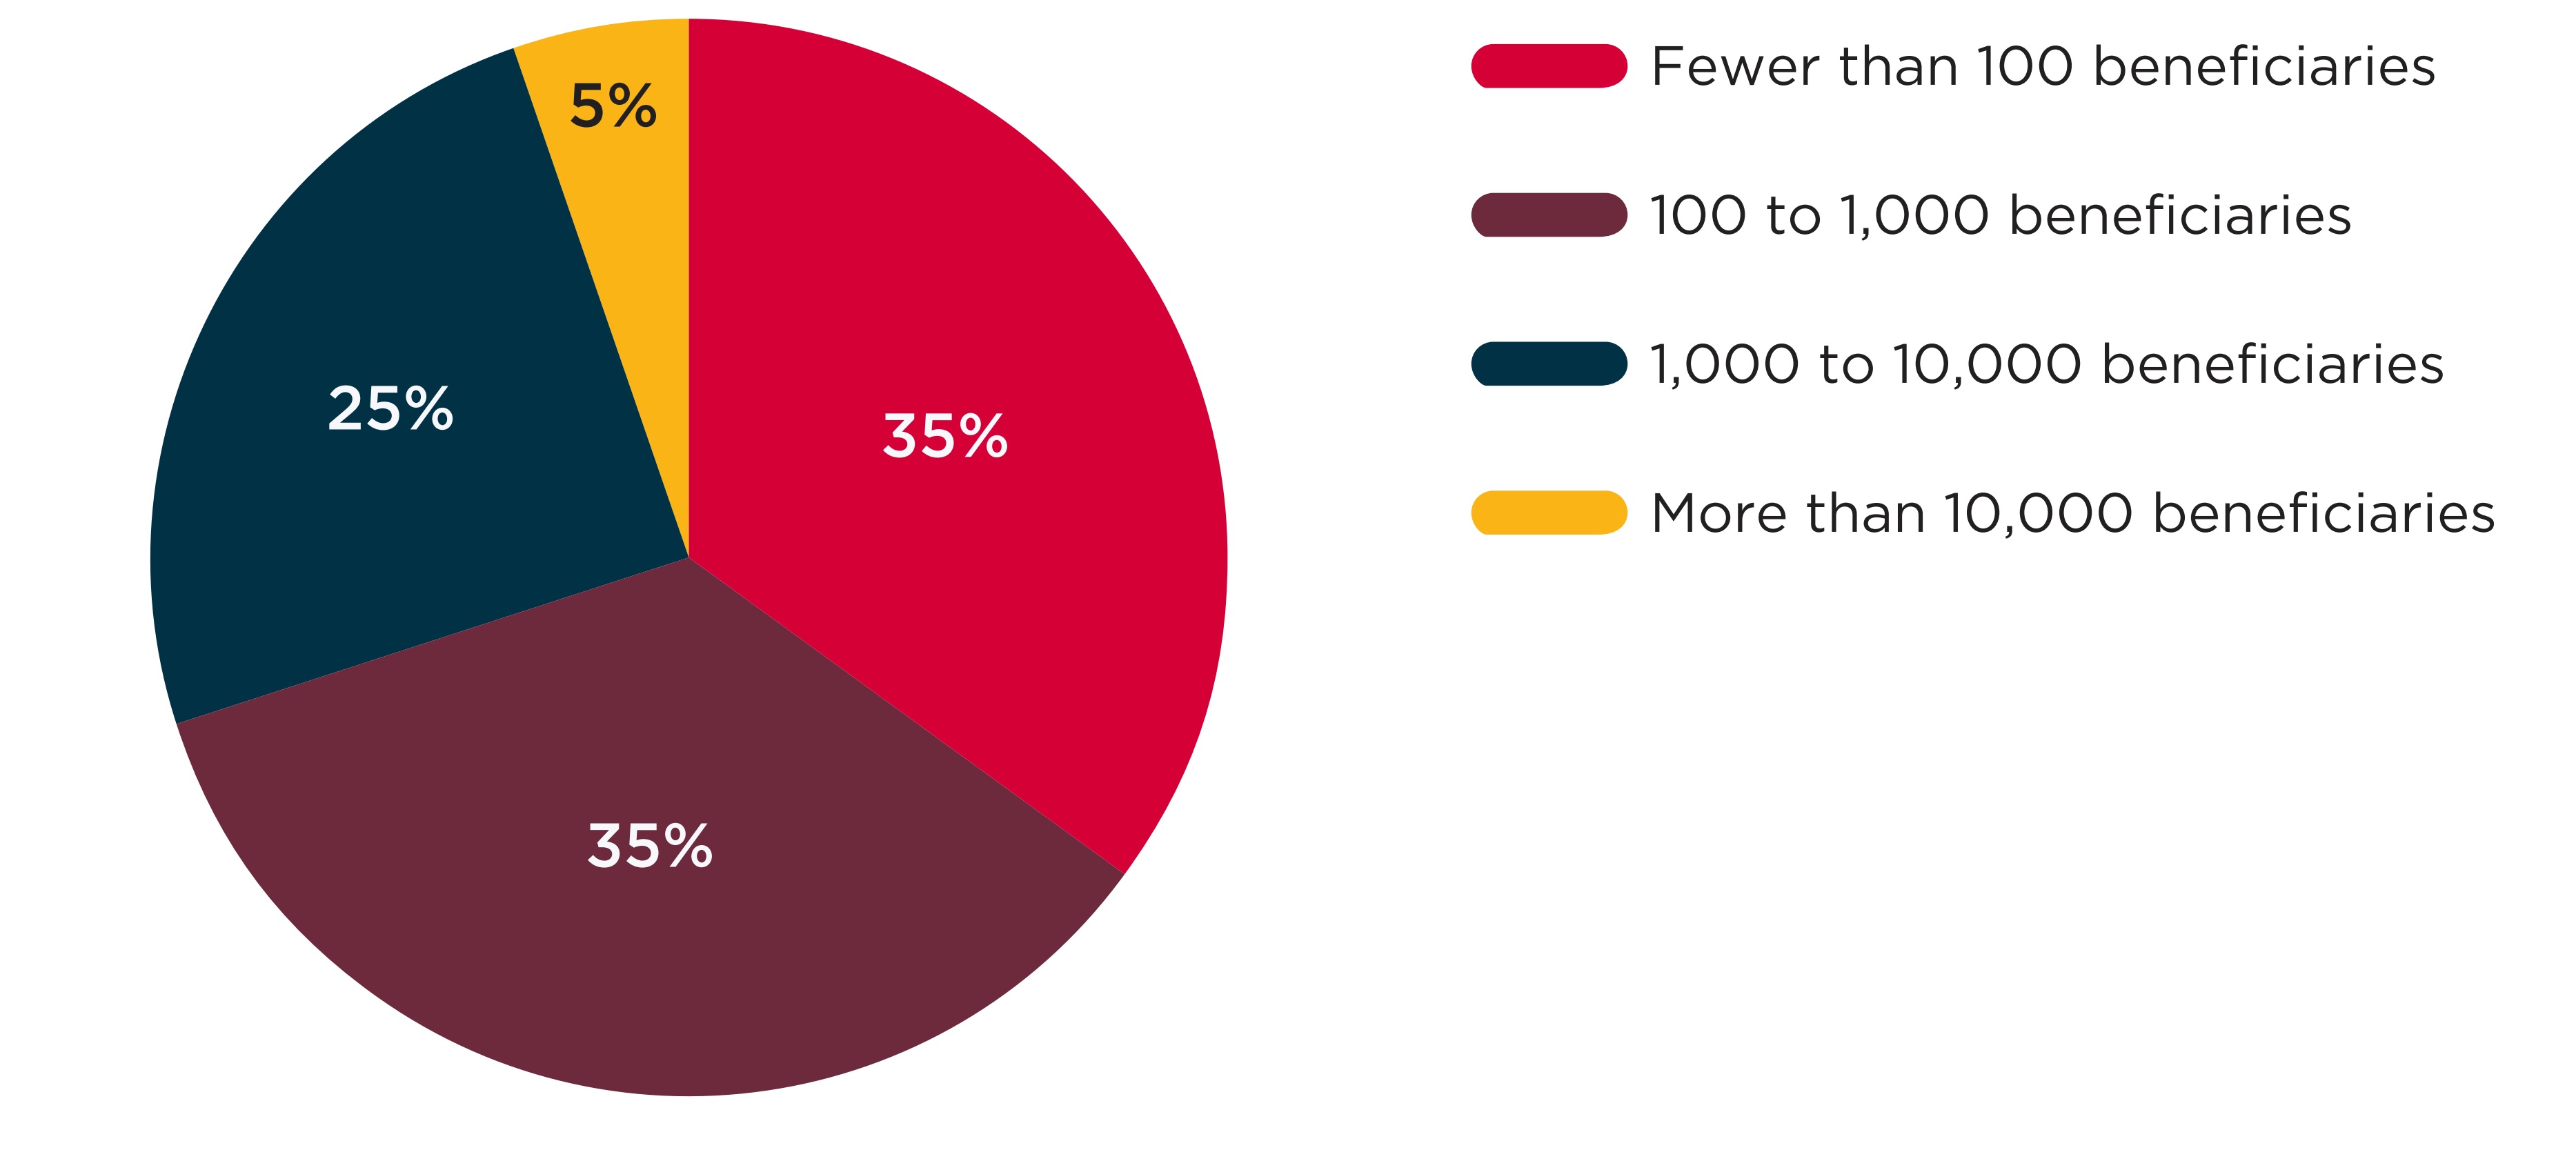
Between 2017/18 and 2019/20, most of the drugs that experienced a shortage had relatively few beneficiaries in Canadian public plans. As seen in Figure D1, 70% of the drugs for which a shortage was reported had fewer than 1,000 monthly beneficiaries prior to the shortage, while just 5% of drugs with a shortage had over 10,000 monthly beneficiaries.
The implications of these results are two-sided: fewer beneficiaries may be directly impacted by a shortage for a drug with a lower number of active users, but drugs with fewer users often have fewer competitors, offering limited substitution options for those affected.
Note: This figure shows the 3,431 DINs with at least one shortage and at least one claim in the NPDUIS database one month prior to the shortage. When multiple shortages were reported for the same DIN, only the first was counted.
Data source: www.drugshortagescanada.ca; NPDUIS Database, Canadian Institute for Health Information (CIHI).
Figure description
A pie chart shows the distribution of shortages by the number of active beneficiaries using the drug in shortage in the month before the shortage onset. Shortages are shown for fiscal years 2017/18 to 2019/20. Numbers of active beneficiaries are split into four categories: fewer than 100 beneficiaries; 100 to 1,000 beneficiaries; 1,000 to 10,000 beneficiaries; and more than 10,000 beneficiaries.
| Number of beneficiaries | Share of shortages |
|---|---|
Fewer than 100 |
35% |
100 to 1,000 |
35% |
1,000 to 10,000 |
25% |
More than 10,000 |
5% |
In-depth: Drug substitutions during shortages
In some cases, drug shortages can be managed by substituting the drug in shortage for the same medicine with a different package size, strength, or form, or the same package size, strength, and form but supplied by another manufacturer. In those cases, the impact of shortages for beneficiaries is likely to be less severe than when there is no substitute available.
To better distinguish the shortages with fewer substitutes, this section studies two different levels of shortages. The first is shortages at the drug level, which considers outcomes at the drug identification number (DIN) level for shortage reports with an “actual” status. In most cases, shortages are expected to lead to a decline in the number of beneficiaries for the drug. However, if different package sizes for the same DIN exist or if the shortage is caused by an increase in the demand for the drug, there may not be a decline despite the shortage.
The second is shortages at the chemical subgroup level, which occur when shortages with an “actual” status are reported for at least one DIN within a group of drugs defined by the fourth level of the World Health Organization’s Anatomical Therapeutic Chemical classification system (ATC4). The ATC4 classification level is the most granular level prior to chemical substance and includes drugs with similar chemical components used to treat identical or related indications. DINs for the same ingredient and indication but with different manufacturers, strengths, or forms are all included in the same ATC4.
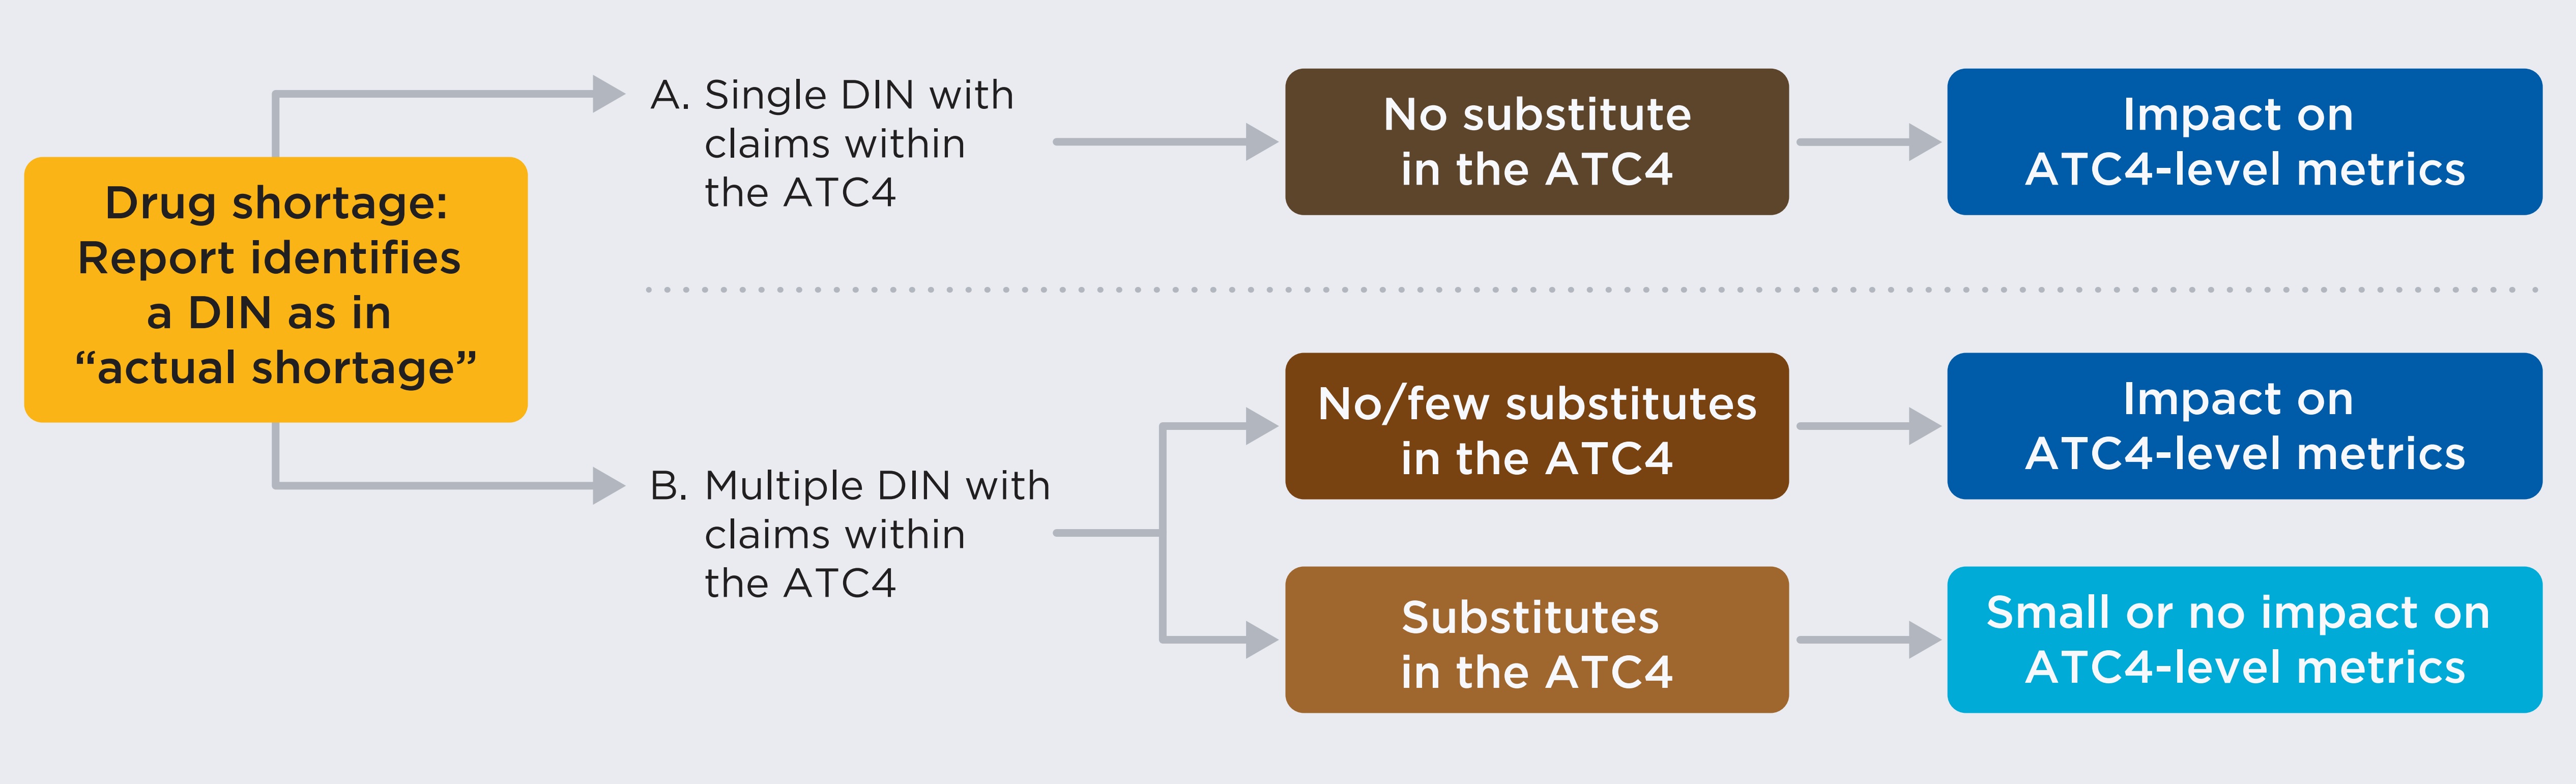
Figure description
A flowchart describes the implications of multiple shortage scenarios as measured at the chemical subgroup level by the World Health Organization’s Anatomical Therapeutic Chemical classification system (ATC4).
Starting with a drug shortage where a drug in a report is identified by drug identification number (DIN) as in “actual shortage.” Scenario A posits a single DIN with claims within the ATC4. In this case, there would be no substitutes possible within the chemical subgroup and the impact of the shortage would be seen using ATC4-level metrics. Scenario B posits multiple DINs within claims in the same ATC4. In Scenario B, outcome 1, there are either no or few substitutes possible in the ATC4 (the impact would be seen in the ATC4-level metrics). In Scenario B, outcome 2, substitutes are available (a small or no impact would be seen in the ATC4-level metrics).
As shown in the diagram, shortages impacting DINs with no or few substitutes are expected to impact both drug- and the ATC4-level metrics, while shortages impacting DINs with many substitutes are not expected to translate to important impact at the ATC4-level.
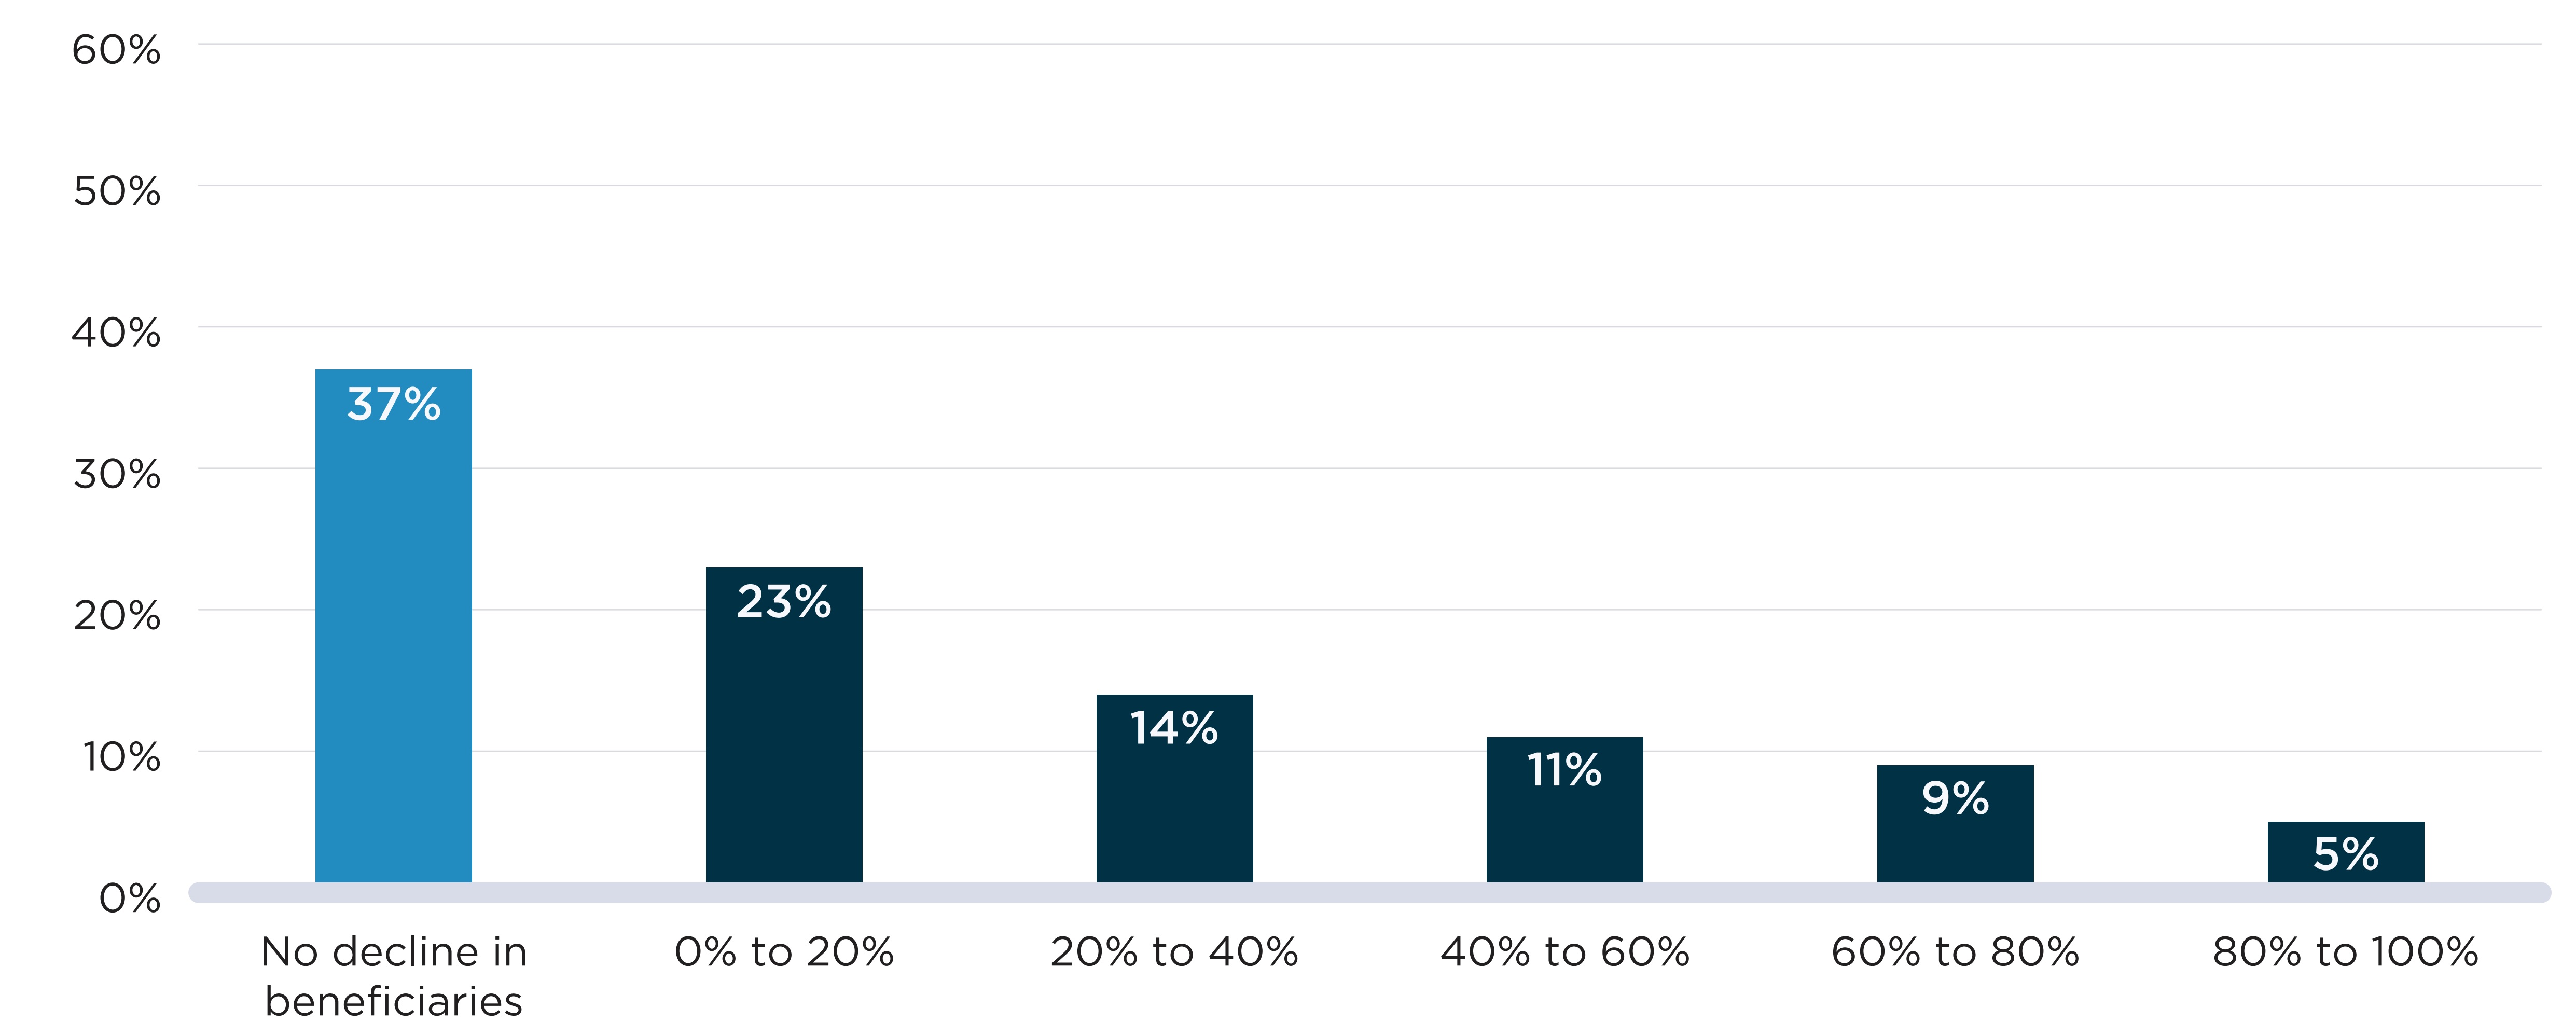
Figure D2 presents the distribution of shortages by the decline in active beneficiaries observed during the shortage relative to the months prior. Figure D2(a) shows the declines seen at the DIN level when a shortage report is created. For all but 37% of cases, shortages were accompanied by a decline in the number of active beneficiaries. For 23% of shortages, the decline was relatively modest (less than 20%), while the remaining 40% of shortages were associated with a decline of at least 20% of beneficiaries, meaning that at least 1 in 5 beneficiaries who expected to fill a prescription during the shortage had to find a substitute or go without treatment.
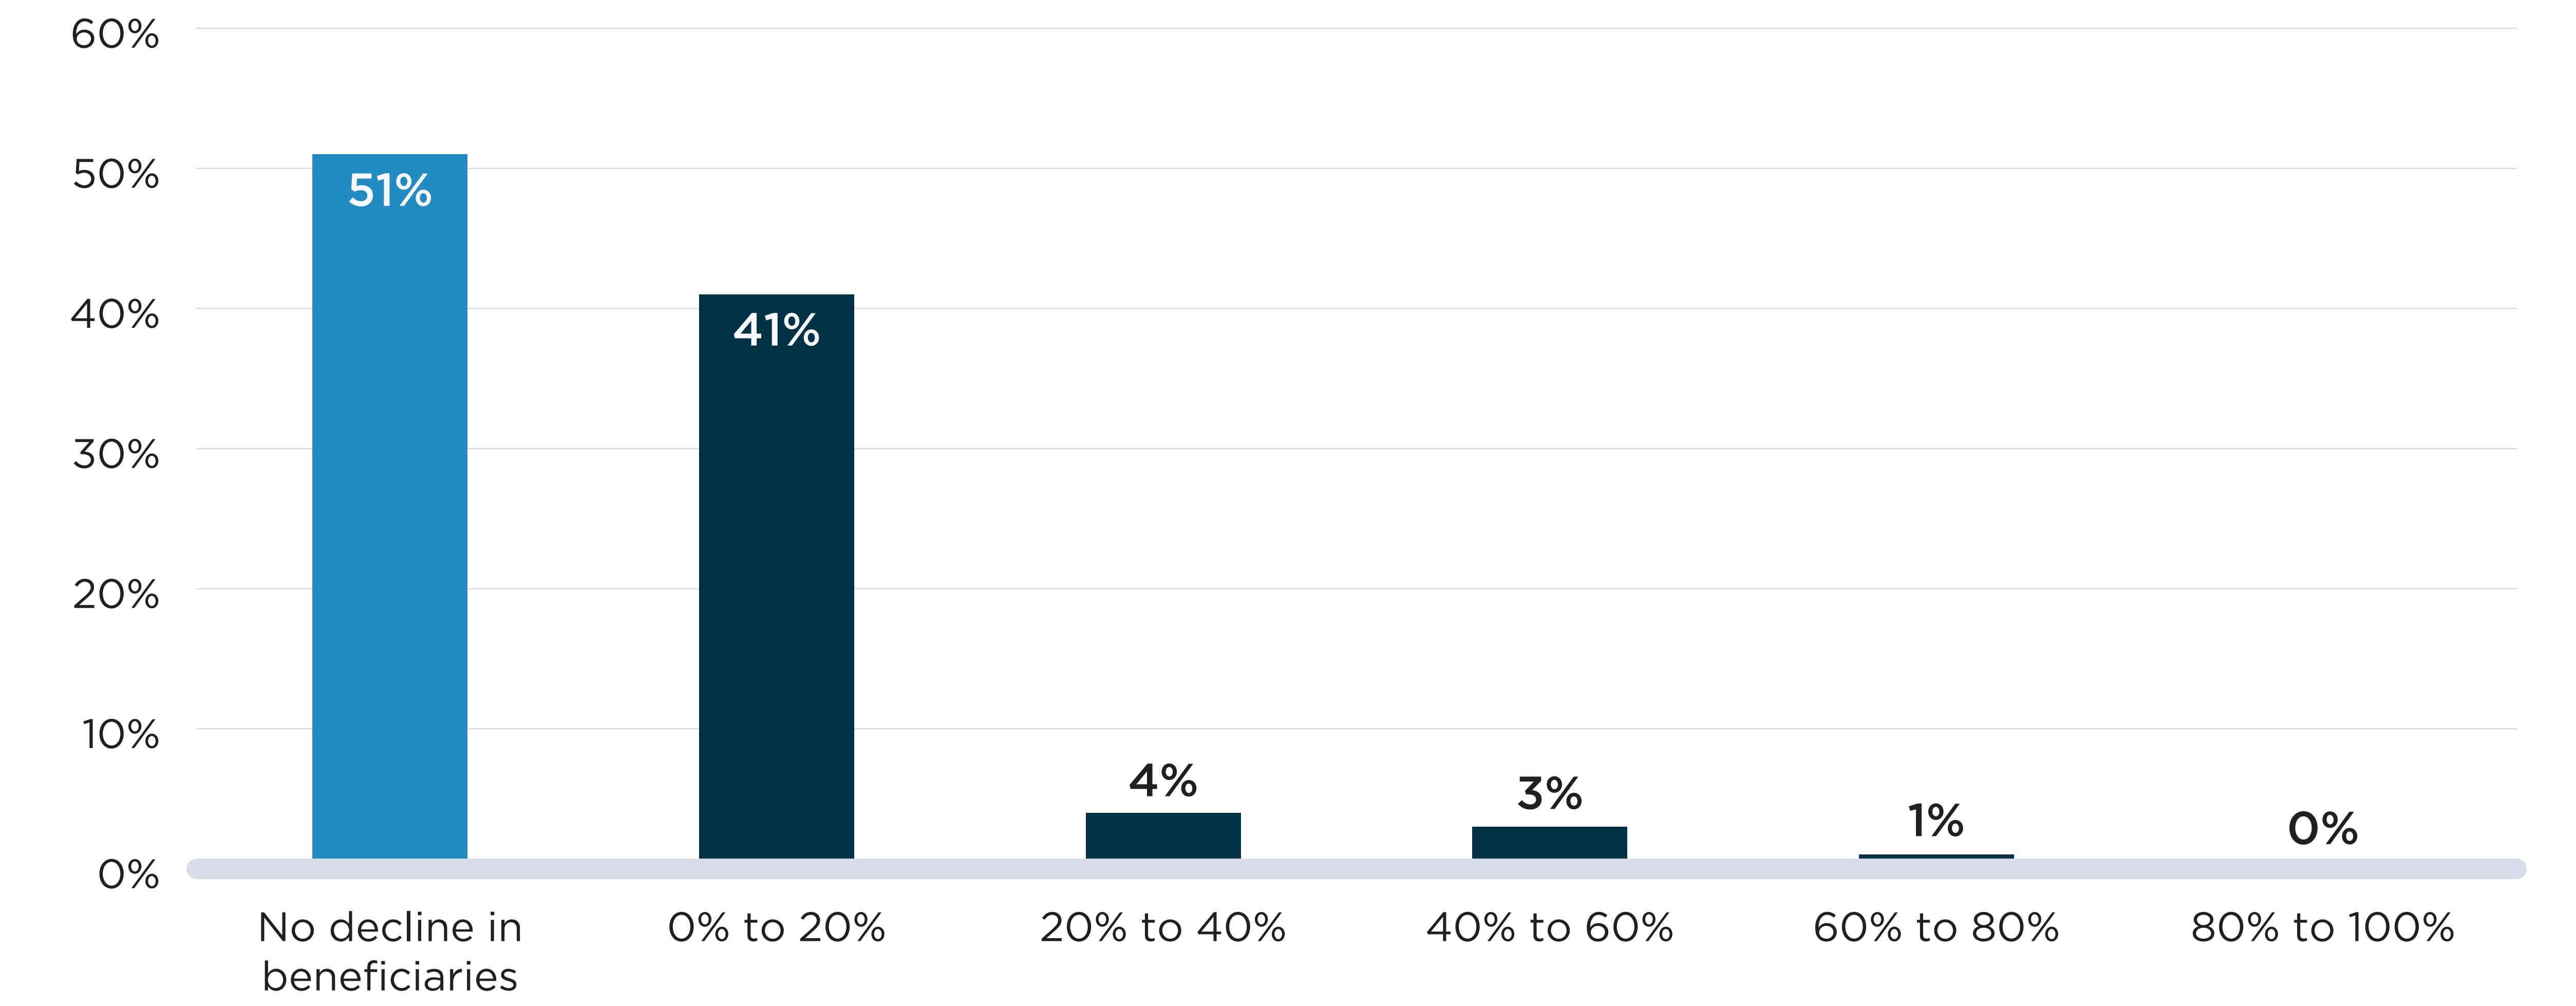
In Figure D2(b), shortages defined at the chemical subgroup (i.e., ATC4) level showed fewer and less severe declines in the number of beneficiaries impacted. About half (51%) of shortages were not accompanied by a decline in the number of beneficiaries of the ATC4s impacted. For another 41% of shortages, there was a modest decline (less than 20%) in the number of beneficiaries.
Declines in the number of beneficiaries were less severe when analyzed at the chemical subgroup level because beneficiaries can substitute other drugs within the subgroup and remain active beneficiaries of the ATC4 and because, within the larger frame of the subgroup, the beneficiaries of an affected drug make up a smaller fraction of the total. These factors are most impactful for ATC4 classes that include more drugs.
Figure D2. Distribution of drug shortages by percent decline in active beneficiaries during the shortage, 2017/18 to 2019/20
Note: Shortages shown here are a situation in which either a (a) DIN or (b) DIN within an ATC4 is mentioned by at least one shortage report with an “actual” status during the study period. The percent decline in active beneficiaries compares the average monthly number of beneficiaries during the shortage and up to six months prior to the shortage.
Data source: www.drugshortagescanada.ca; NPDUIS Database, Canadian Institute for Health Information (CIHI).
Figure description
Two bar graphs show the distribution of drug shortages by the decline in the number of active beneficiaries during the shortage at two levels: the drug level and the chemical subgroup (ATC4) level. The decline in beneficiaries is measured as a percent decrease in the number of beneficiaries relative to the six months prior to the onset of the shortage. Shortages reported between 2017/18 and 2019/20 fiscal years are assessed for this analysis with a total of 4,858 shortages at the drug level and 532 shortages at the ATC4 level.
| Percent decline in beneficiaries | Share of shortages at the drug level | Share of shortages at the ATC4 level |
|---|---|---|
No decline |
37% |
51% |
0% to 10% |
13% |
33% |
10% to 20% |
10% |
8% |
20% to 30% |
7% |
2% |
30% to 40% |
7% |
2% |
40% to 50% |
6% |
2% |
50% to 60% |
6% |
1% |
60% to 70% |
5% |
1% |
70% to 80% |
4% |
<1% |
80% to 90% |
3% |
<1% |
90% to 100% |
2% |
<1% |
Of the 532 ATC4-level shortages shown in Figure D2(b), 41 shortages (8%) showed declines greater than 20% in the number of active beneficiaries. Table D1 compares characteristics of these shortages against shortages associated with more modest beneficiary declines or no decline at all. On average, the shortages that had the steepest declines in beneficiaries occurred in ATC4s with less spending and fewer beneficiaries prior to the shortage than shortages with more modest or no declines in beneficiaries. The shortages with steep declines in beneficiaries also impacted ATC4s with fewer DINs and more brand and single-source drugs, meaning fewer generic options that could be used as substitutes. These shortages also lasted longer, with an average duration of 10.4 months compared to 8.3 months for shortages with no decline and 7.2 months for shortages with modest declines. “Analgesics” were the most common therapies with steep beneficiary declines, with six shortages impacting over 20% of beneficiaries, while “antibacterials for systemic use” were most represented in shortages impacting fewer patients.
The 41 shortages with declines greater than 20% in the number of active beneficiaries are described in further detail in Appendix 2.
Table D1. Descriptive statistics of chemical subgroup level shortages by decline in beneficiaries, 2017/18 to 2019/20
| Shortages with no decline in beneficiaries | Shortages with 0% to 20% decline in beneficiaries | Shortages with decline in beneficiaries greater than 20% | |
|---|---|---|---|
Number of shortages (N) |
273 |
218 |
41 |
Spending prior to the shortage ($, mean) |
1,913,286 |
1,158,360 |
227,128 |
Number of beneficiaries prior to the shortage (mean) |
26,275 |
16,749 |
6,345 |
Spending per beneficiary prior to the shortage ($, mean) |
337 |
490 |
163 |
Shortage duration in months (mean) |
8.3 |
7.2 |
10.4 |
Characteristics of the chemical subgroups impacted |
|||
Number of DINs (mean) |
24.6 |
18.4 |
11.6 |
Proportion of the chemical subgroup composed of: |
|||
Oral solid drugs |
50% |
46% |
49% |
Branded drugs |
33% |
38% |
45% |
Single-source drugs |
19% |
23% |
32% |
Patented medicines |
11% |
11% |
2% |
Therapeutic classes most impacted |
|||
1 |
Antibacterials for systemic use (N=18) |
Antibacterials for systemic use (N=16) |
Analgesics (N=6) |
2 |
Antineoplastic agents (N=17) |
Ophthalmologicals (N=12) |
Sex hormones and modulators of the genital system (N=4) |
3 |
Sex hormones and modulators of the genital system (N=14) |
Psycholeptics (N=11) |
Anti-acne preparations (N=3) |
4 |
Ophthalmologicals (N=13) |
Sex hormones and modulators of the genital system (N=10) |
Drugs for functional gastrointestinal disorders (N=3) |
5 |
Drugs for obstructive airway diseases (N=12) |
Antivirals for systemic use (N=9) |
Ophthalmologicals (N=3) |
Note: Shortages are defined here as a situation in which a DIN within an ATC4 is mentioned by at least one shortage report with an “actual” status during the study period. The decline in active beneficiaries compares the average monthly number of beneficiaries during the shortage and up to six months prior to the shortage. Proportions of drugs by formulation and market segment are calculated as the percentage of DINs with claims within the ATC4 with these attributes. Drugs for which the attributes are unknown are counted as not having the attribute.
Data source: www.drugshortagescanada.ca; NPDUIS Database, Canadian Institute for Health Information (CIHI).
Case Study: Alpha-glucosidase inhibitors
The ATC4 class of alpha-glucosidase inhibitors (A10BF), which are used to treat type 2 diabetes, can offer an example of a shortage that impacted a large proportion of active beneficiaries and public plan spending.
Acarbose was the only drug within this class with public drug plan claims during the study period. For most of the period, there were only two DINs with claims: a 50 mg strength version and a 100 mg strength, both sold by the same manufacturer. On average, there were 2,898 active monthly beneficiaries of the drugs in NPDUIS plans in the six months prior to the shortage.
The 50 mg strength option was reported as having gone into shortage on January 15, 2019, because of a “disruption of the manufacture of the drug.” This report was followed by a sharp decline in the number of active beneficiaries for the DIN, from 1,932 per month in the six months prior to the shortage to an average of 891 during the shortage.
During the first two months of the shortage, beneficiaries were able to substitute their prescriptions with the 100 mg strength version of the same drug. However, on March 26, 2019, the 100 mg version also went into shortage due to a manufacture disruption. From March to July 2019, both strengths were simultaneously in shortage and the number of active beneficiaries of acarbose fell to 1,096 in July 2019, 62% lower than prior to the shortage.
Active beneficiaries of alpha-glucosidase inhibitors, October 2017 to March 2020
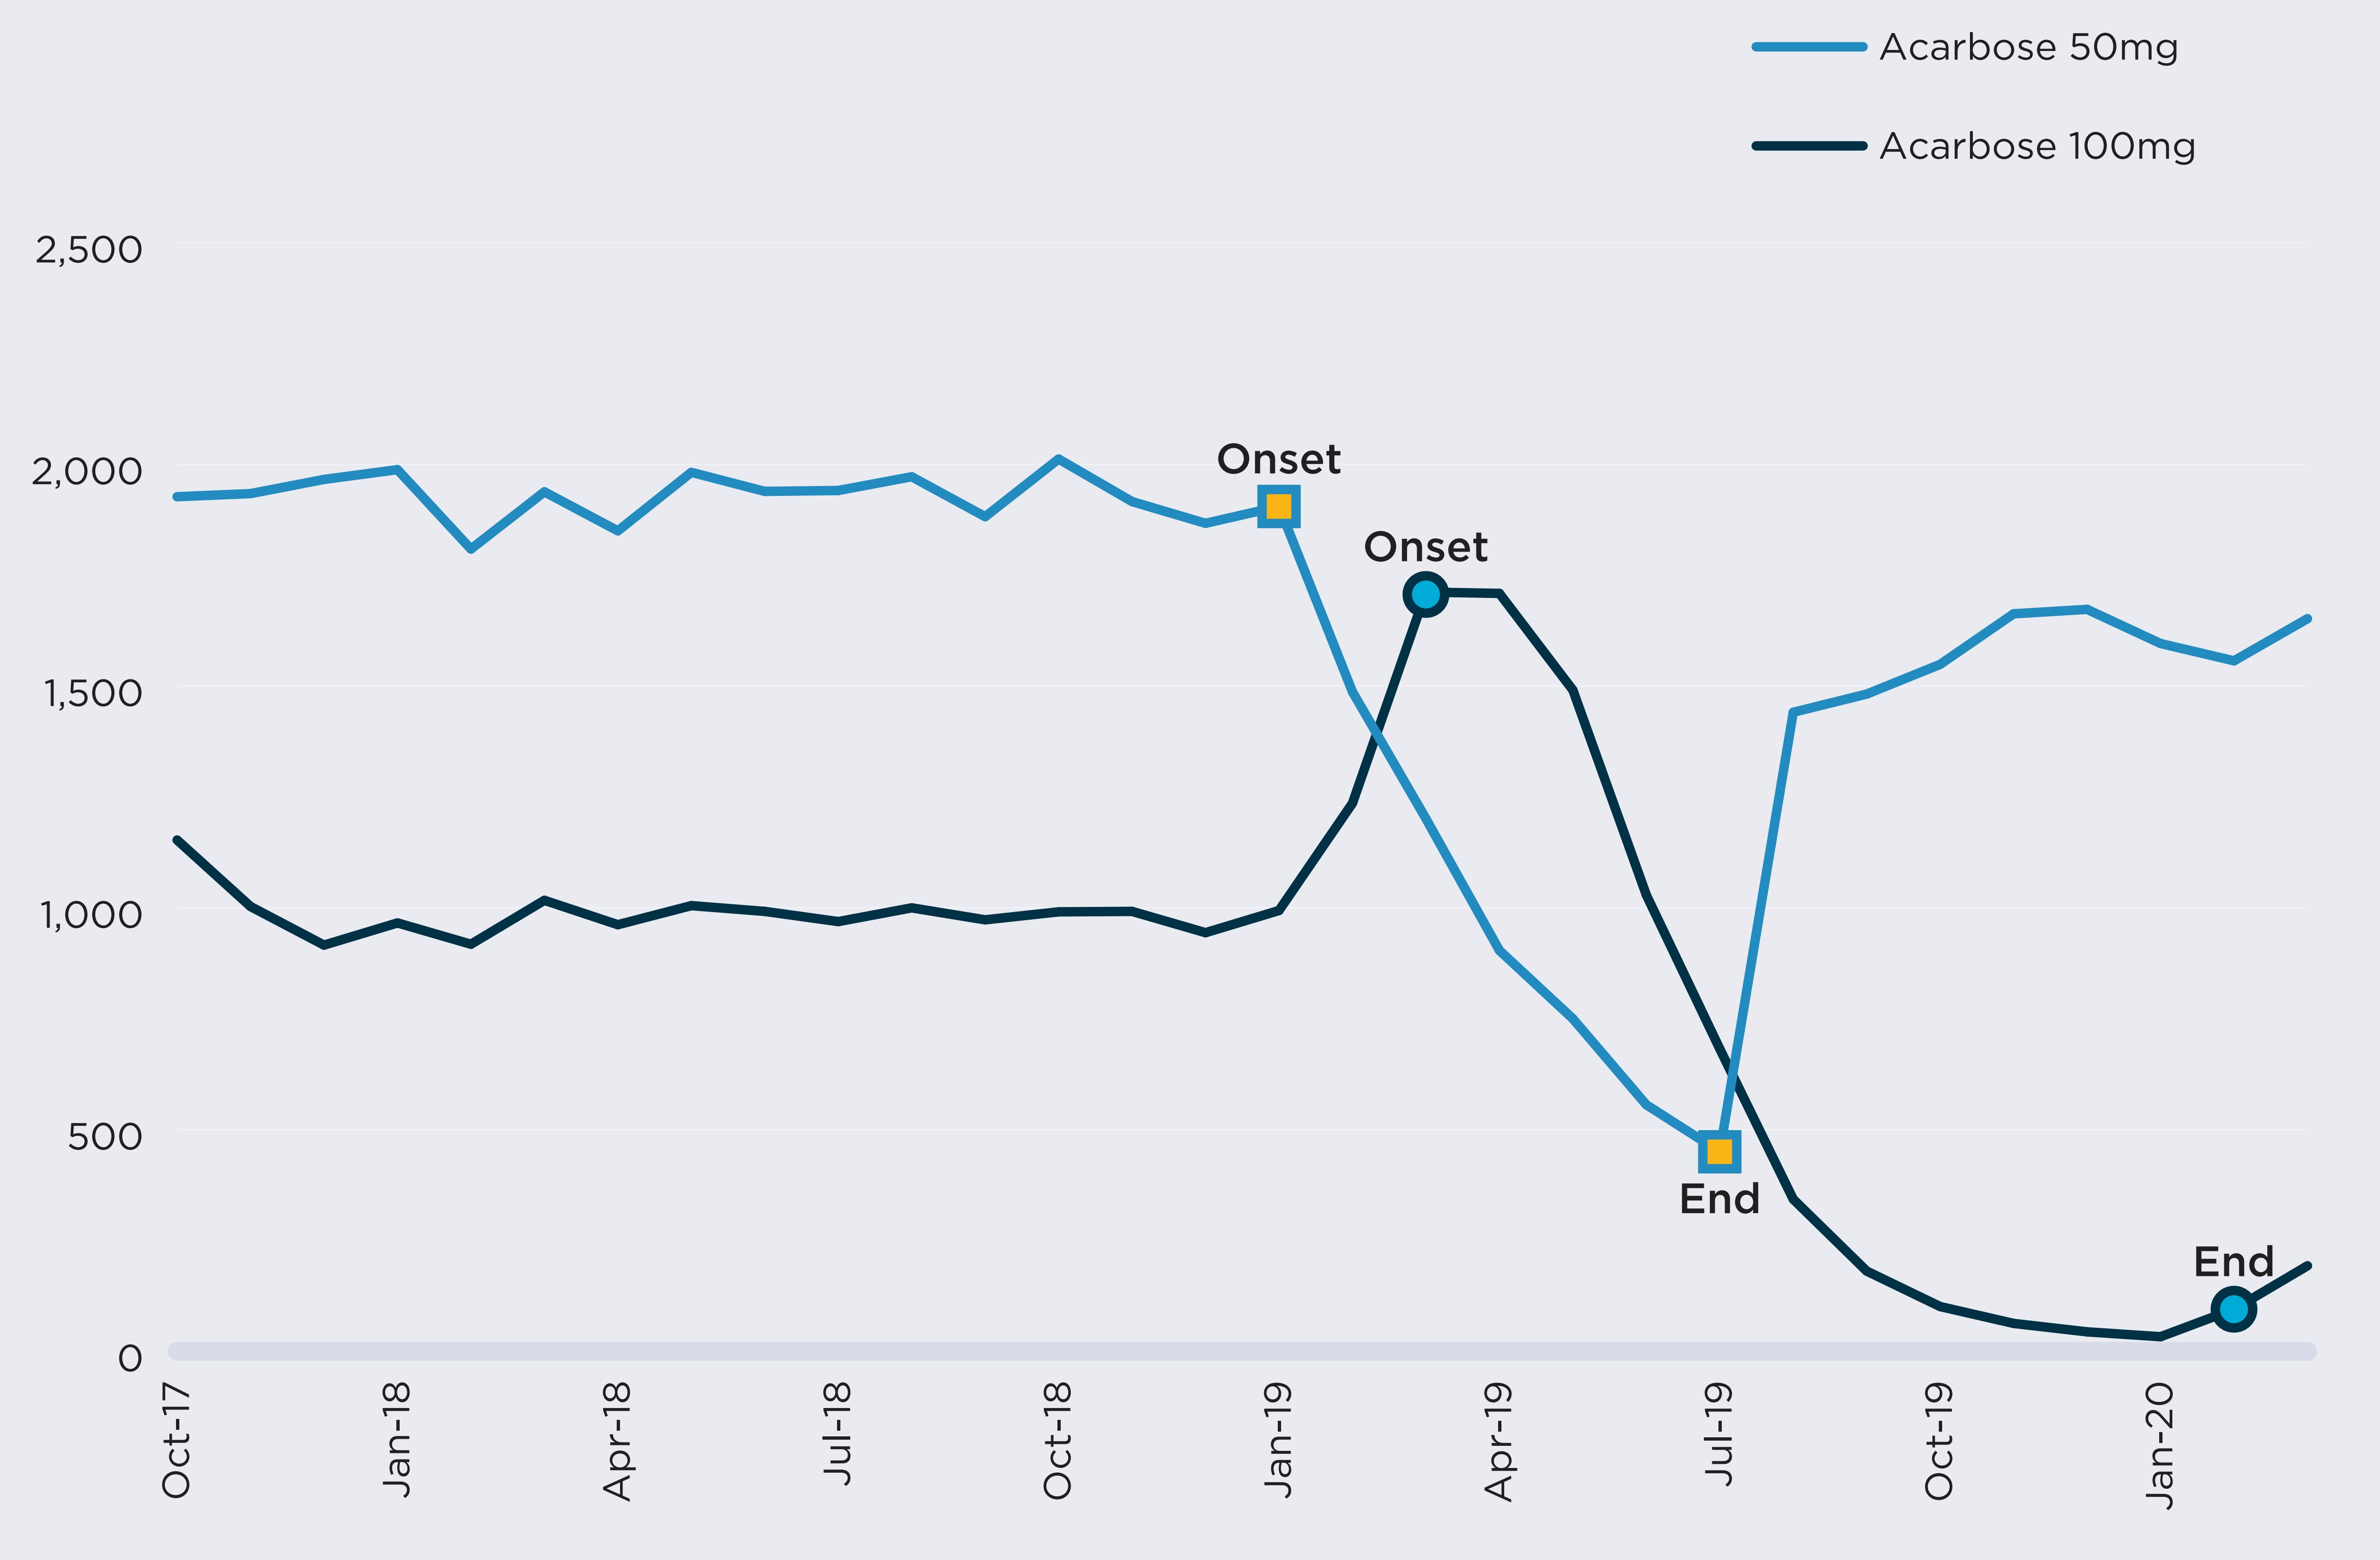
Figure description
A line graph illustrates the effects of a shortage of alpha-glucoside inhibitors on the number of active beneficiaries from October 2017 to March 2020. Results are given separately for acarbose at 50 mg strength, which was in shortage from January 2019 to July 2019, and acarbose at 100 mg strength, which was in shortage from March 2019 to February 2020. The number of beneficiaries plunges during the period of both of these shortages.
| Month | Number of beneficiaries using acarbose 50 mg | Number of beneficiaries using acarbose 100 mg |
|---|---|---|
October 2017 |
1,927 |
1,153 |
November 2017 |
1,934 |
1,003 |
December 2017 |
1,966 |
916 |
January 2018 |
1,988 |
966 |
February 2018 |
1,809 |
918 |
March 2018 |
1,938 |
1,017 |
April 2018 |
1,850 |
962 |
May 2018 |
1,982 |
1,005 |
June 2018 |
1,939 |
992 |
July 2018 |
1,941 |
969 |
August 2018 |
1,972 |
1,000 |
September 2018 |
1,882 |
973 |
October 2018 |
2,012 |
991 |
November 2018 |
1,916 |
992 |
December 2018 |
1,867 |
944 |
January 2019 |
1,905 |
994 |
February 2019 |
1,487 |
1,236 |
March 2019 |
1,201 |
1,712 |
April 2019 |
904 |
1,709 |
May 2019 |
750 |
1,491 |
June 2019 |
556 |
1,029 |
July 2019 |
450 |
682 |
August 2019 |
1,441 |
343 |
September 2019 |
1,482 |
181 |
October 2019 |
1,549 |
101 |
November 2019 |
1,663 |
63 |
December 2019 |
1,673 |
44 |
January 2020 |
1,596 |
33 |
February 2020 |
1,557 |
95 |
March 2020 |
1,652 |
193 |
Data source: www.drugshortagescanada.ca; NPDUIS Database, Canadian Institute for Health Information (CIHI).
During the 13 months encompassing both drug-level shortages, from January 2019 to February 2020, monthly beneficiaries and spending for the chemical subgroup (ATC4) were 35% and 36% lower than their pre-shortage figures, respectively. The shortages of both strengths were resolved by February 2020, but beneficiaries did not immediately return to pre-shortage levels.
In February 2020, a new generic competitor offering both strengths entered the market and started recording claims. The introduction of more products into the chemical subgroup lowered the risk of all options being simultaneously in shortage.
Declines in beneficiaries and spending observed during the shortage
| DIN-level Shortages | ATC4-level Shortage | ||
|---|---|---|---|
| 2190885 Acarbose 50mg | 02190893 Acarbose 100mg | A10BF Alpha glucosidase inhibitors | |
Shortage timeline |
|
|
|
Onset |
1/15/2019 |
3/26/2019 |
1/15/2019 |
End |
7/24/2019 |
2/5/2020 |
2/5/2020 |
Duration (days) |
190 |
316 |
386 |
Monthly active beneficiaries (mean) |
|||
Prior to the shortage |
1,932 |
1,022 |
2,898 |
During the shortage |
891 |
525 |
1,878 |
Decline (%) |
54% |
49% |
35% |
Monthly spending (mean, $) |
|||
Prior to the shortage |
87,300 |
62,900 |
147,900 |
During the shortage |
34,000 |
21,200 |
94,400 |
Decline (%) |
61% |
66% |
36% |
Note: Shortages shown here are a situation in which a DIN or DIN within an ATC4 group is mentioned by at least one shortage report with an “actual” status. The percent decline in active beneficiaries compares the average monthly number of beneficiaries during the shortage and during the six months prior to the shortage.
Data source: www.drugshortagescanada.ca; NPDUIS Database, Canadian Institute for Health Information (CIHI).
E. Impact of shortages on public plan spending
Complementing the above analysis on public plan beneficiaries, this section documents changes in public spending by comparing drug spending by NPDUIS plans before and during a shortage. Shortages are considered at the drug level (by DIN) and at the chemical subgroup level (by ATC4). At the drug level, 62% of shortages were accompanied by an increase or decrease in spending greater than 20%. However, when considering the chemical subgroup, only 18% of shortages were associated with a similar shift in plan spending.
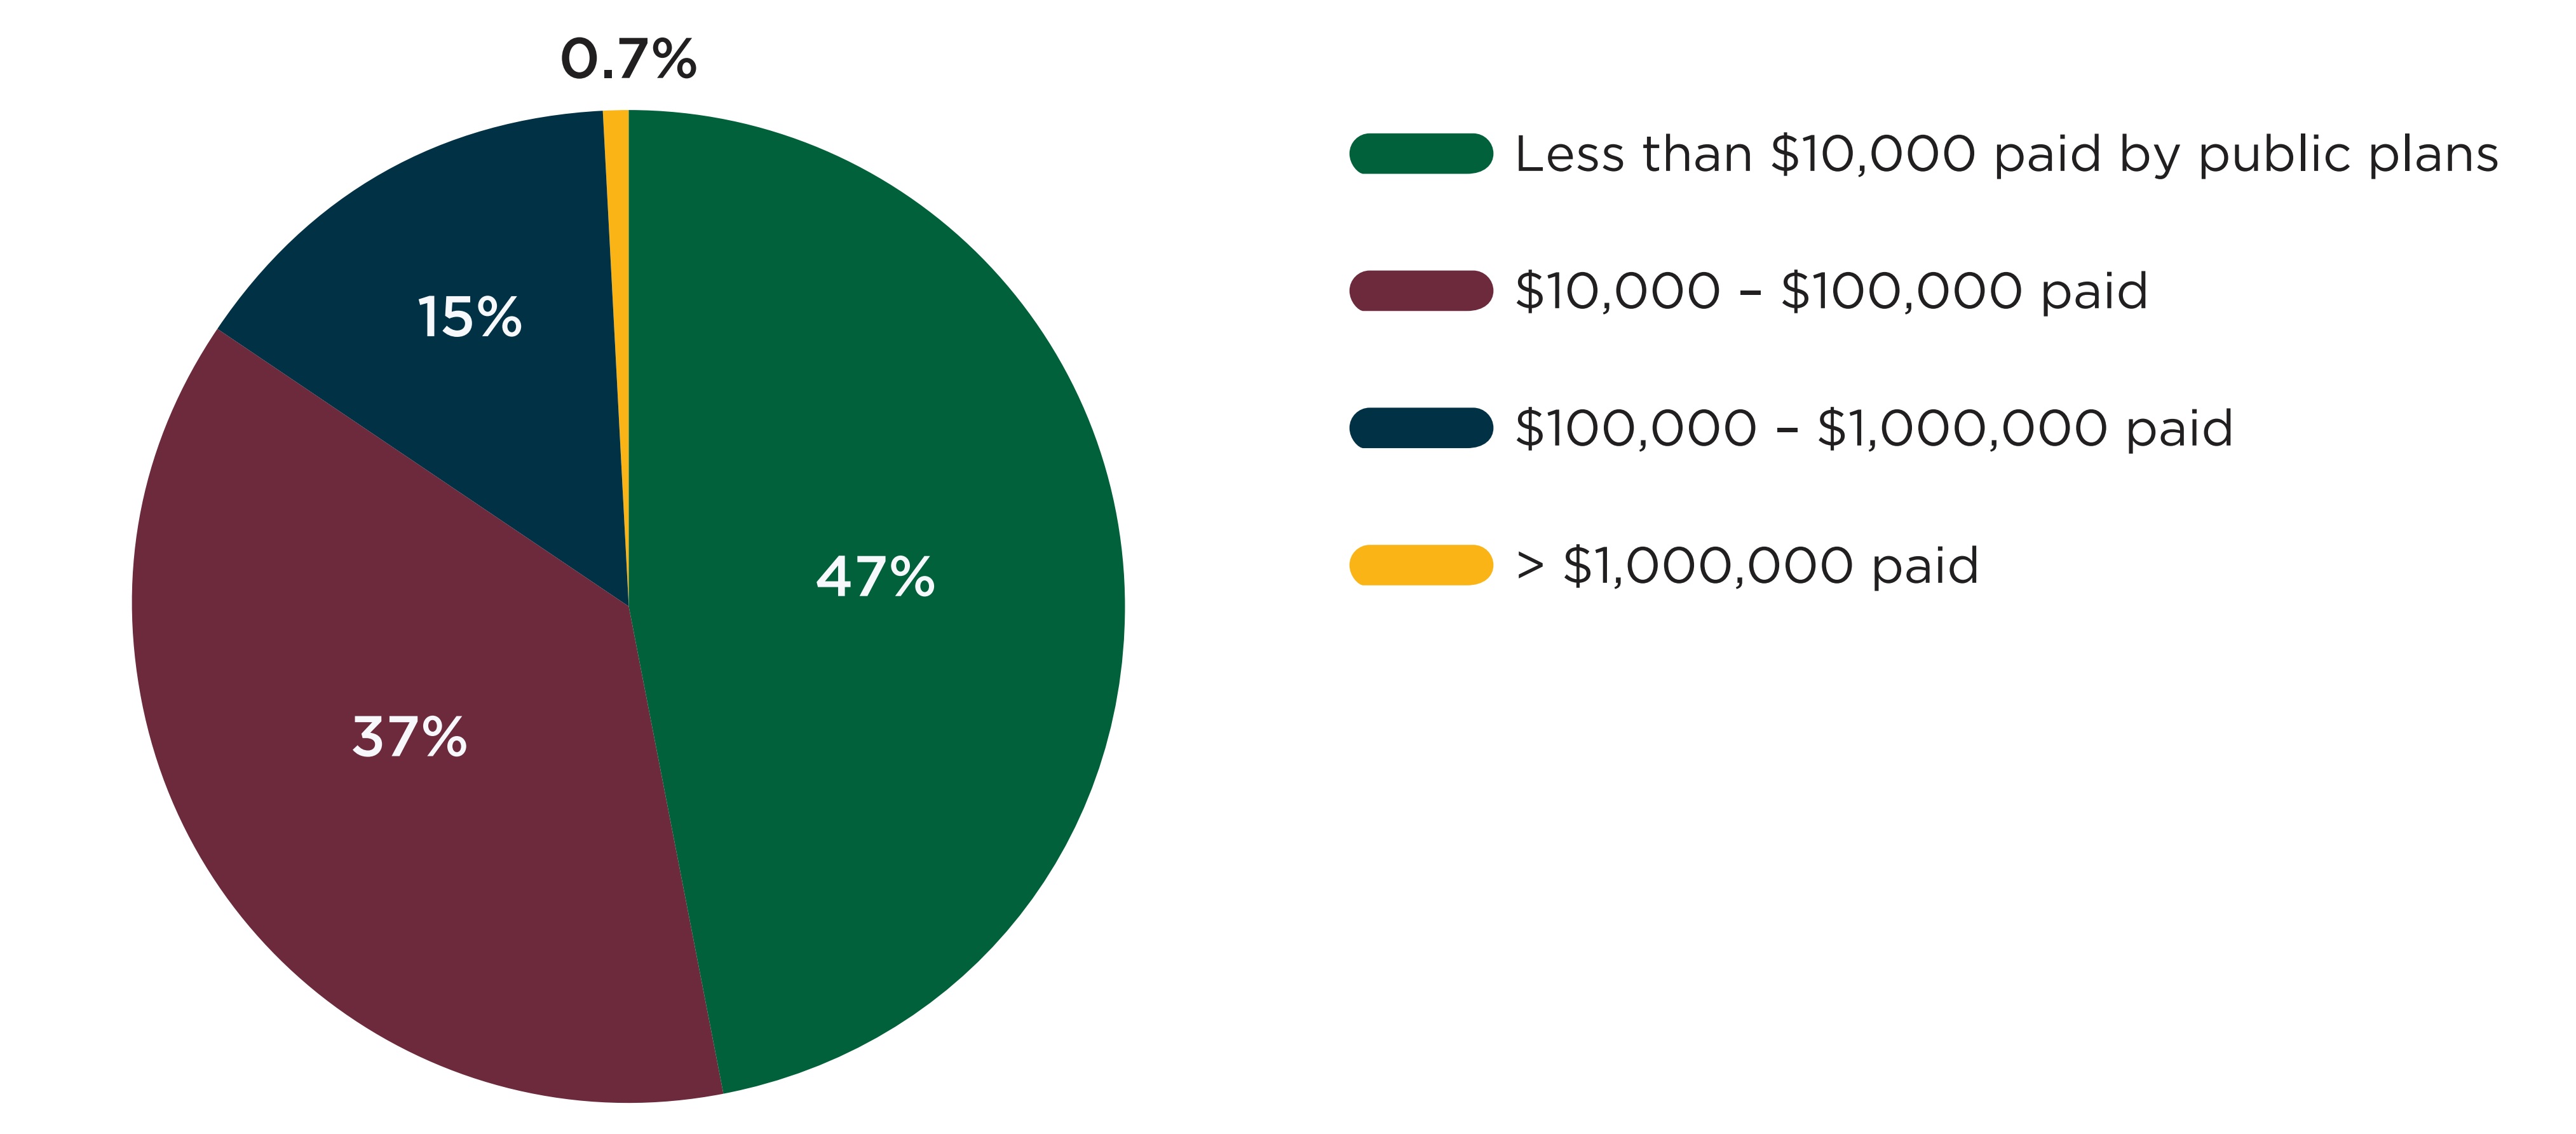
Figure E1 shows the distribution of drugs with a shortage between 2017/18 and 2019/20 by monthly public plan spending prior to the shortage. Approximately half of drugs (47%) had less than $10,000 in monthly spending across NPDUIS plans before the onset of their shortage, while less than 1% (23 drugs) had over $1 million in monthly plan spending.
Note: This figure shows the 3,431 DINs with at least one shortage and at least one claim in the NPDUIS database one month prior to the shortage. When multiple shortages were reported for the same DIN, only the first was counted.
Data source: www.drugshortagescanada.ca; NPDUIS Database, Canadian Institute for Health Information (CIHI).
Figure description
A pie chart shows the distribution of shortages by public drug plan spending on the drug in shortage in the month before the shortage onset, for shortage reported between 2017/18 and 2019/20 fiscal years. Spending is split into four categories: less than $10,000; $10,000 to $100,000; $100,000 to $1,000,000; and more than $1,000,000.
| Number of beneficiaries | Share of shortages |
|---|---|
Less than $10,000 |
47% |
$10,000 to $100,000 |
37% |
$100,000 to $1,000,000 |
15% |
More than $1,000,000 |
0.7% |
Drug shortages can result in a net increase, no significant change, or a decrease in public plan spending. In most cases, the most direct effect of shortages is a decline in utilization for the impacted drugs, which, excluding other factors, lowers spending. Substitutions can also lower spending in some cases, for instance when a generic drug is used as a substitute for a brand drug in shortage.
However, three factors can lead to a spending increase during a shortage. First, as shown in Figure A4, 13% of shortages reported by Canadian manufacturers cite a demand increase for the drug as a cause for the shortage, in which case there may be more utilization and spending during the shortage than prior. Second, shortages can lead to increases in the unit price of drugs impacted. Finally, substitutions can lead to higher spending, for instance when a branded drug is used as a substitute for a generic drug in shortage.
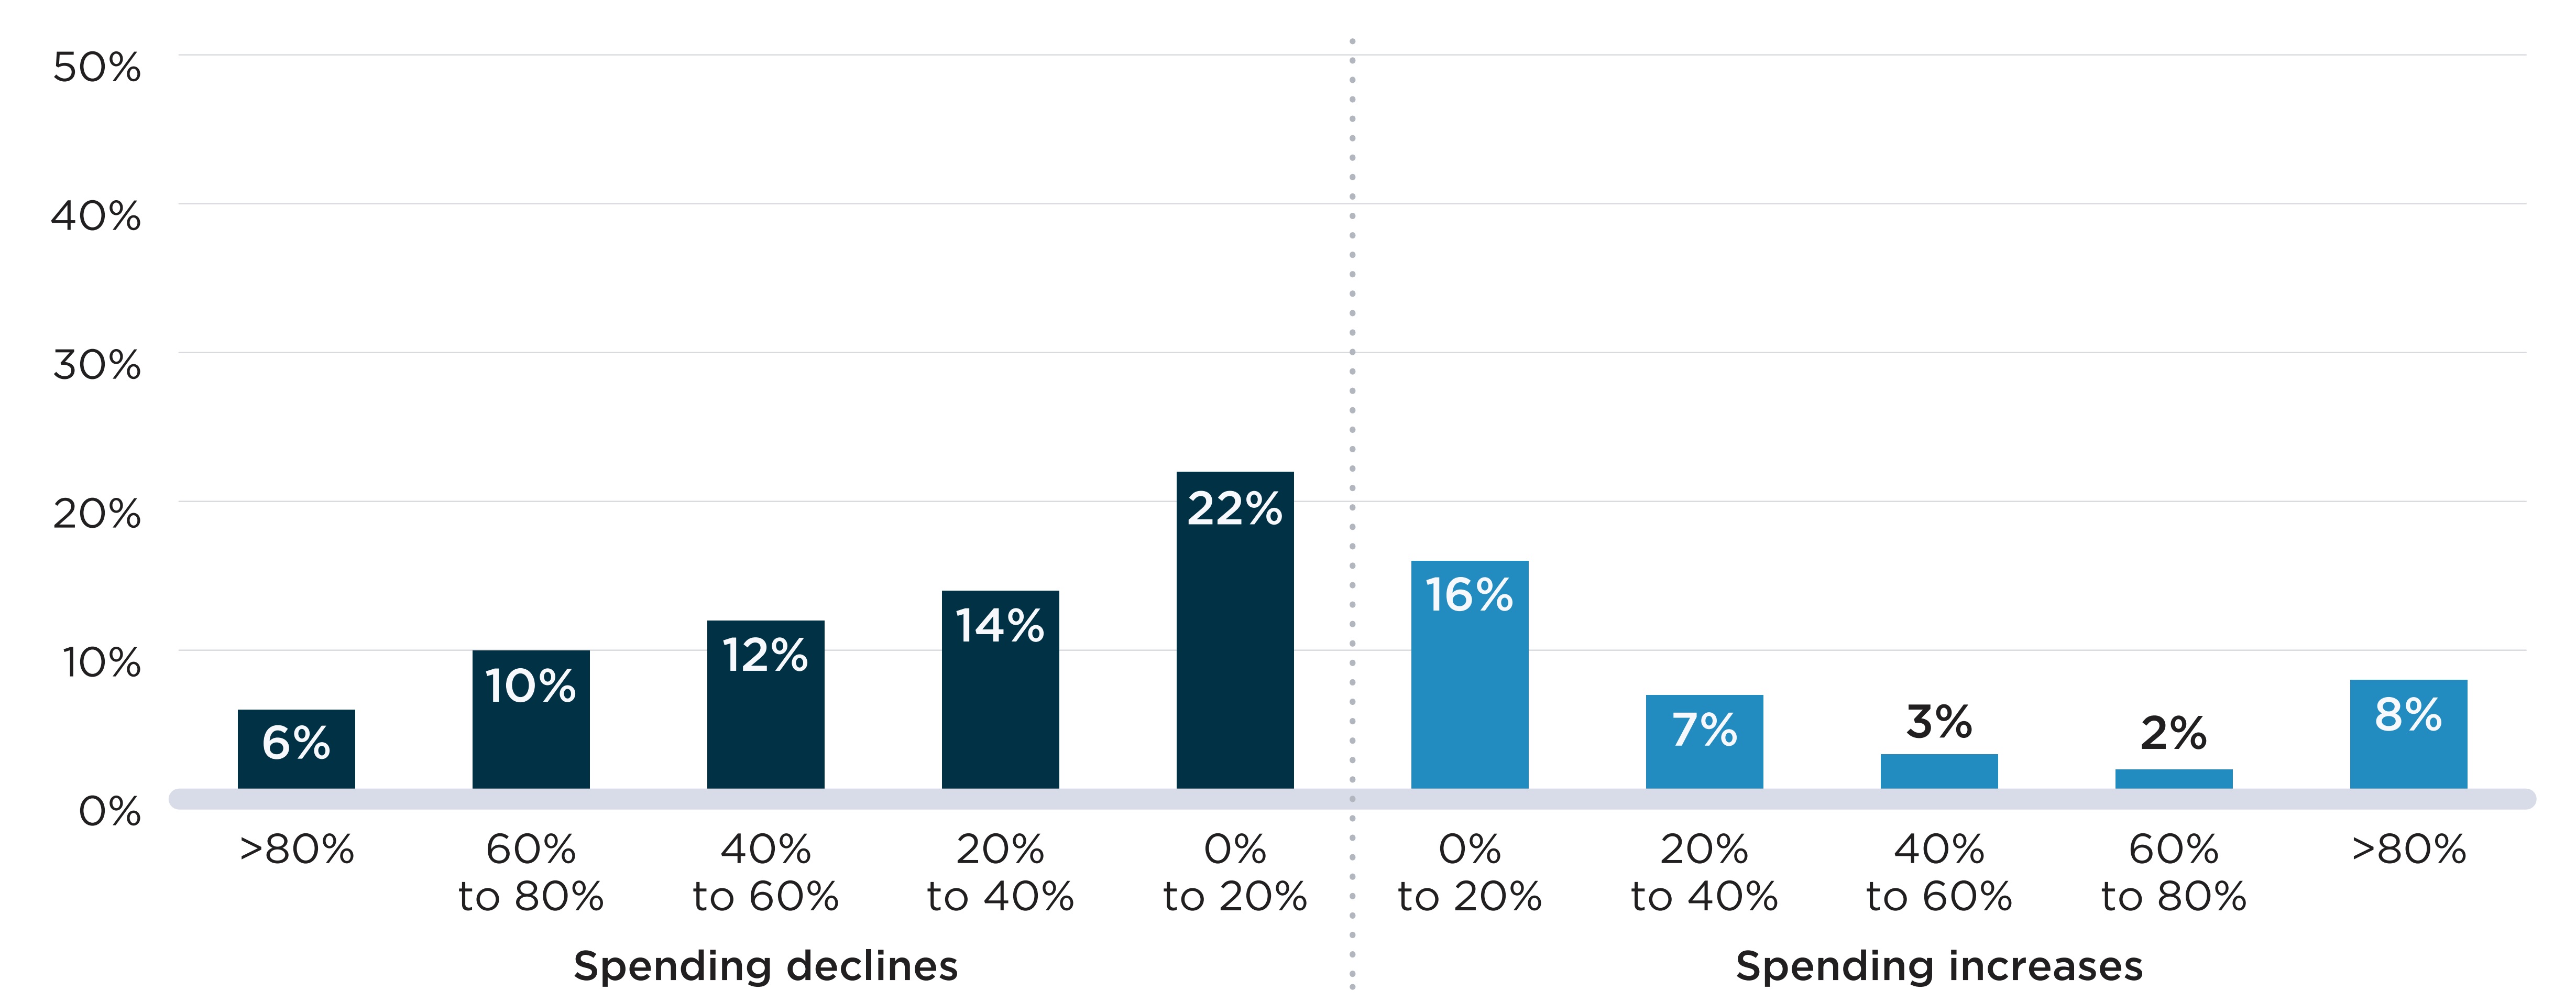
Figure E2 shows the distribution of shortages by the percent variation in public plan spending during the shortage relative to the months prior. Figure E2(a) shows the spending variations at the drug level (by DIN). In 65% of cases, shortages were associated with a decline in spending, with 43% of shortages leading to a decline of over 20%. The remaining 35% of shortages were associated with an increase in spending at the drug level. For 1 in 5 shortages (20%), the increase in spending was greater than 20% of pre-shortage spending.
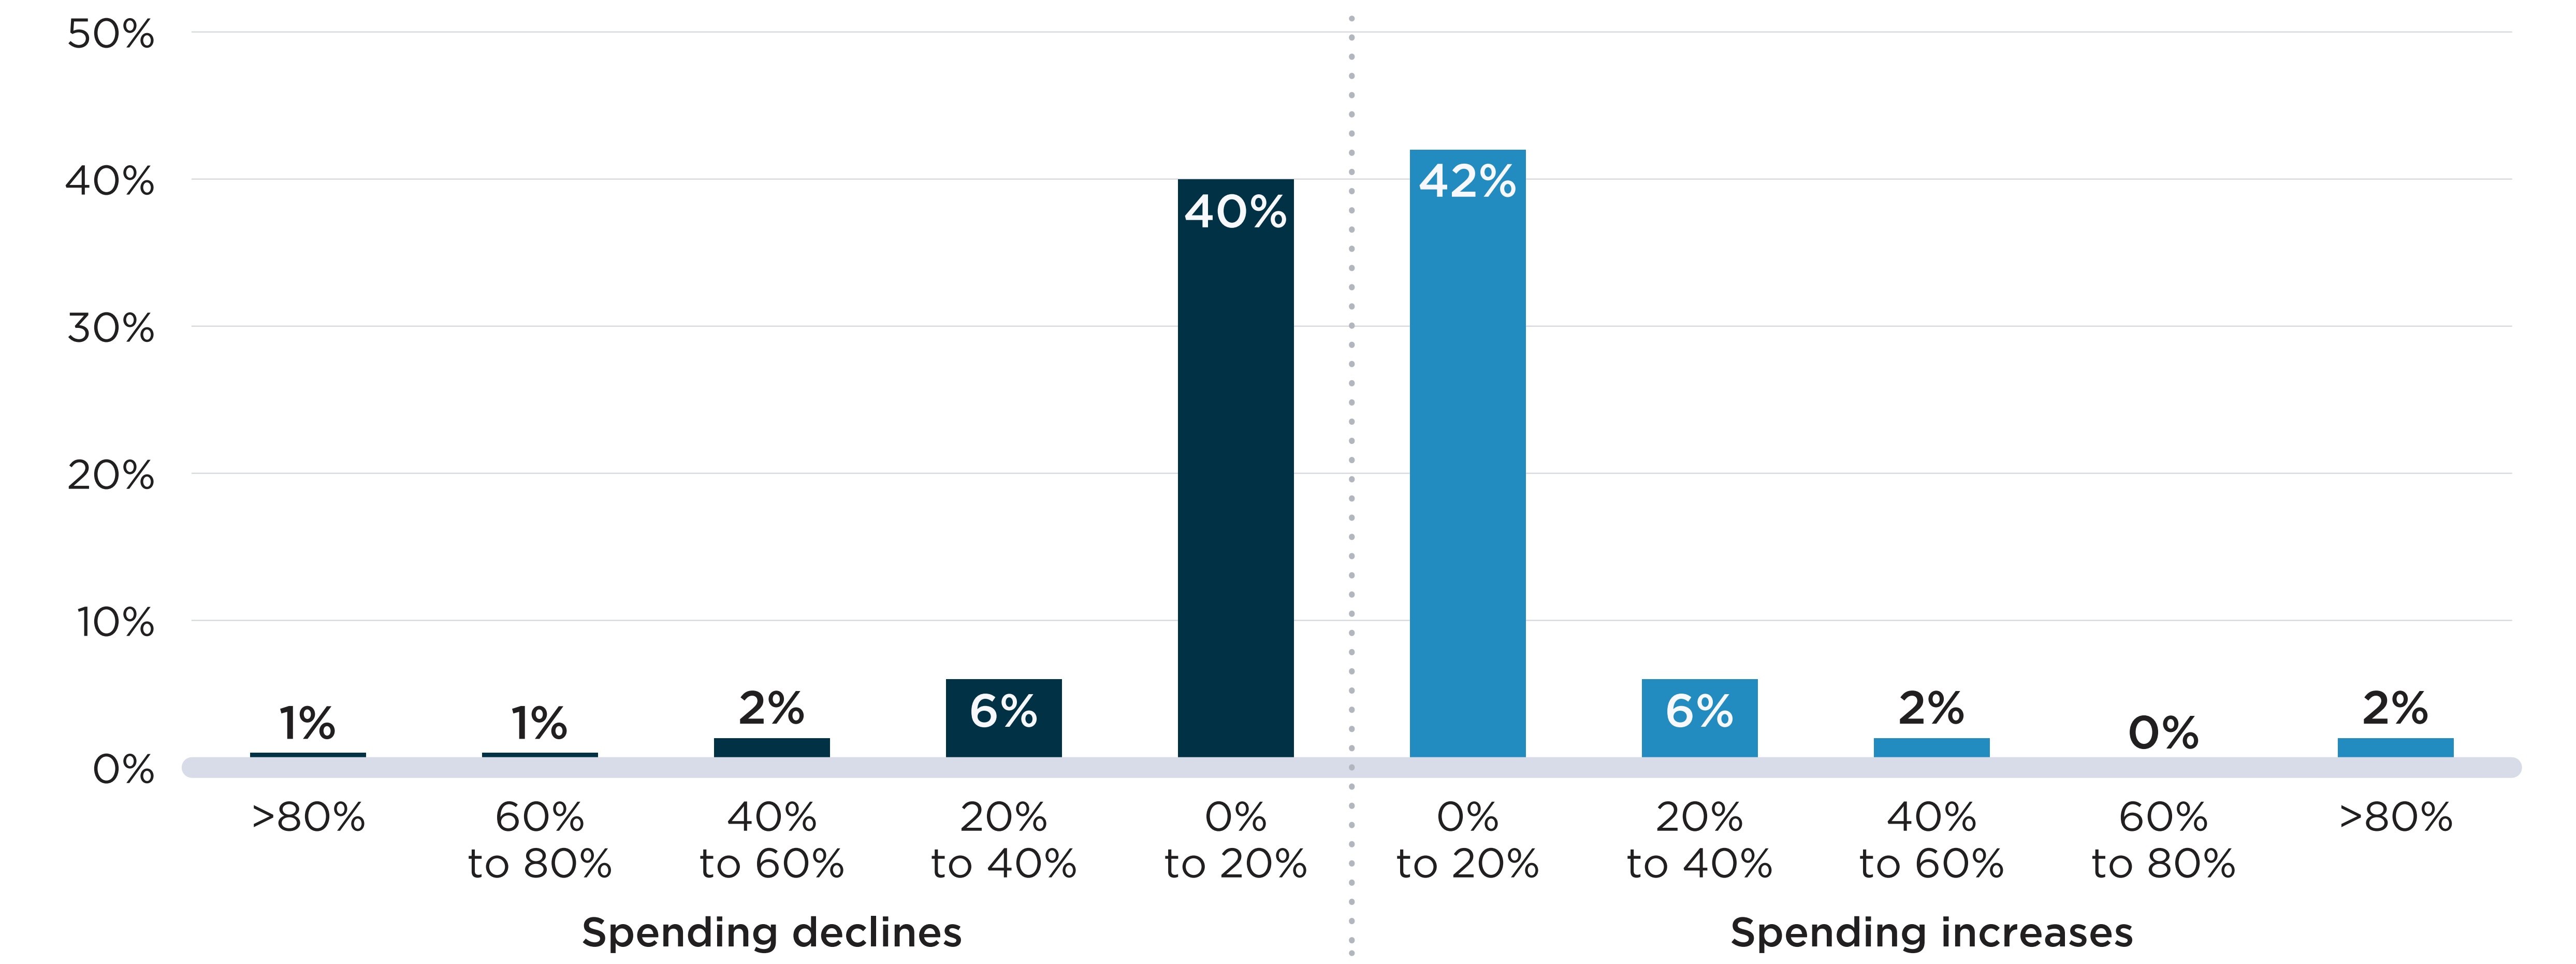
As seen in Figure E2(b), few shortages had a major impact on spending at the chemical subgroup level (by ATC4). Only 10% and 9% of shortages were accompanied by increases and declines in spending greater than 20% of pre-shortage levels, respectively. As was the case in Section D, the less pronounced variations in spending can be attributed to two factors: substitutions may have been made to other drugs with the same ATC4, which would limit the effect on spending for the class, and the drugs in shortage likely account for a relatively small proportion of the spending within the chemical subgroup, leading to smaller degrees of variation overall.
Figure E2. Distribution of drug shortages by change in spending during the shortage, 2017/18 to 2019/20
Shortages are defined here as a situation in which a DIN (Panel A) or DIN within an ATC4 group (Panel B) is mentioned by at least one shortage report with an “actual” status during the study period. The percent change in spending compares the average monthly spending during the shortage and up to six months prior to the shortage.
Data source: www.drugshortagescanada.ca; NPDUIS Database, Canadian Institute for Health Information (CIHI).
Figure description
Two bar graphs show the distribution of drug shortages by the change in public drug plan spending during the shortage at the two levels: drug level and chemical subgroup (ATC4) level. The change in spending is measured as a percent increase or decrease relative to spending in the six months prior to the shortage onset. Shortages reported between fiscal years 2017/18 and 2019/20 are assessed for this analysis, for a total of 4,858 shortages at the drug level and 532 shortages at the ATC4 level. For each graph, figures representing spending declines are on the left while figures representing spending increases are on the right.
| Percent change in spending | Share of shortages at the drug level | Share of shortages at the ATC4 level |
|---|---|---|
Greater than 80% decrease |
6% |
1% |
60% to 80% decrease |
10% |
1% |
40% to 60% decrease |
12% |
2% |
20% to 40% decrease |
14% |
6% |
0% to 20% decrease |
22% |
40% |
0% to 20% increase |
16% |
42% |
20% to 40% increase |
7% |
6% |
40% to 60% increase |
3% |
2% |
60% to 80% increase |
2% |
<1% |
Greater than 80% increase |
8% |
2% |
Table E1 takes a closer look at the 100 ATC4-level shortages with an increase or decline in spending greater than 20%. Shortages that were accompanied by a large decline in spending tended to feature lower spending prior to the shortage, more brand and single-source medicines, and fewer DINs. Conversely, shortages that showed an increase in spending tended to have higher spending prior to the shortage, fewer brand drugs in the subgroup and a relatively high number of DINs to use as substitutes.
Detailed characteristics of the 44 ATC4-level shortages with spending variations greater than 40% are shown in Appendix 2.
Table E1. Descriptive statistics of chemical subgroup level shortages by change in spending, 2017/18 to 2019/20
| Shortages with declines in spending | Shortages with increases in spending | |||
|---|---|---|---|---|
| Greater than 20% | 0% to 20% | 0% to 20% | Greater than 20% | |
Number of shortages (N) |
48 |
211 |
221 |
52 |
Spending prior to the shortage (mean) |
393,653 |
1,098,734 |
2,092,515 |
1,365,153 |
Number of beneficiaries prior to the shortage (mean) |
12,280 |
17,520 |
27,547 |
13,655 |
Spending per beneficiary prior to the shortage ($, mean) |
132 |
488 |
351 |
361 |
Shortage duration in months (mean) |
10.5 |
7.8 |
7.1 |
10.8 |
Characteristics of the chemical subgroups impacted |
||||
Number of DINs (mean) |
15.0 |
18.0 |
25.1 |
21.9 |
Proportion of the chemical subgroup composed of: |
||||
Oral solid drugs |
52% |
45% |
51% |
46% |
Branded drugs |
44% |
38% |
34% |
28% |
Single-source drugs |
33% |
23% |
18% |
23% |
Patented medicines |
6% |
11% |
11% |
12% |
Therapeutic classes most impacted |
||||
1 |
Analgesics (N=6) |
Antibacterials for systemic use (N=20) |
Ophthalmologicals (N=12) |
Antibacterials for systemic use (N=6) |
2 |
Ophthalmologicals (N=5) |
Psycholeptics (N=11) |
Psycholeptics (N=11) |
Antineoplastic agents (N=5) |
3 |
Anti-acne preparations (N=3) |
Sex hormones and modulators of the genital system (N=10) |
Sex hormones and modulators of the genital system (N=11) |
Sex hormones and modulators of the genital system (N=4) |
4 |
Antiinflammatory and antirheumatic products (N=3) |
Antivirals for systemic use (N=8) |
Antineoplastic agents (N=10) |
Drugs for obstructive airway diseases (N=3) |
5 |
Drugs for obstructive airway diseases (N=3) |
Ophthalmologicals (N=8) |
Drugs for obstructive airway diseases (N=9) |
Ophthalmologicals (N=3) |
Note: Shortages are defined here as a situation in which a DIN within an ATC4 group is mentioned by at least one shortage report with an “actual” status during the study period. The decline in active beneficiaries compares the average monthly number of beneficiaries during the shortage and up to six months prior to the shortage. Proportions of drugs by formulation and market segment are calculated as the percentage of DINs with claims within the ATC4 with these attributes. Drugs for which the attributes are unknown are counted as not having the attribute.
Data source: www.drugshortagescanada.ca; NPDUIS Database, Canadian Institute for Health Information (CIHI).
References
Multi-Stakeholder Committee on Drug Shortages. 2017. Guidance Document to Mitigate Drug Shortages through Contracting and Procurement. Available at: https://www.drugshortagescanada.ca/files/MSSC_Contracting_and_Procurement_2017.pdf.
Donelle, J. Duffin, J. Pipitone, J. and White-Guay, B. 2018. Assessing Canada’s Drug Shortage Problem (Commentary No. 515). C.D. Howe Institute. Retrieved from https://www.cdhowe.org/sites/default/files/attachments/research_papers/mixed/Commentary_515.pdf.
Drug Shortages Division. 2022. Drug shortages in Canada: Regulations and guidance. Retrieved from: https://www.canada.ca/en/health-canada/services/drugs-health-products/drug-products/drug-shortages/regulations-guidance.html
Health Canada. 2022a. Tier 3 drug shortages. Retrieved from: https://www.canada.ca/en/health-canada/services/drugs-health-products/drug-products/drug-shortages/tier-3-shortages.html
Health Canada. 2022b. List of drugs for exceptional importation and sale. Retrieved from: https://www.canada.ca/en/health-canada/services/drugs-health-products/drug-products/drug-shortages/list.html
Drug Shortages Canada. Drug shortages homepage. Available at: https://www.drugshortagescanada.ca
Health Products Compliance Directorate. 2017. Guide to reporting drug shortages and discontinuations. Available at: https://www.drugshortagescanada.ca/files/GUI%200120%20Drug%20Shortage%20Guidance_2017.pdf.
US Food and Drug Administration. 2018. Compounding and the FDA: Questions and Answers. Available at: https://www.fda.gov/drugs/human-drug-compounding/compounding-and-fda-questions-and-answers.
World Health Organization. 2019. World Health Organization Model List of Essential Medicines, 21st List, 2019. Geneva: WHO. License: CC BY-NC-SA 3.0 IGO.
Zhang W., Guh D.P., Sun H., Lynd L.D., Hollis A., Grootendorst P., and Anis A.H. 2020. Factors associated with drug shortages in Canada: a retrospective cohort study. CMAJOpen. 8(3):E535-E544. DOI: 10.9778/cmajo.20200036Appendix 1: Compounding
In Sections D and E, the impact of drug shortages on beneficiaries and spending are analyzed at the drug level (by DIN) and chemical subgroup (by ATC4) levels. The latter set of analyses aims to account for substitutions made during shortages. However, these substitutions may still be underestimated as they do not capture all cases where drugs were compounded to fill the need created by the shortage. Compounding is typically the process of combining or altering ingredients to create a medication tailored to an individual patient’s need (U.S. Food and Drug Administration, 2018), but this process is also used to alleviate shortages when no marketed substitutes are available.
Because compounded drugs do not originate from a licensed manufacturer, they do not have DINs and cannot be directly linked to shortage reports. They are typically coded using artificial identifiers created by public plans to report claims with no matching DIN in Health Canada’s Drug Product Database.
Of the compounded drugs that can be identified in the data, the majority are assigned a World Health Organization Anatomical Therapeutic Chemical Classification System (ATC)code. This code identifies exactly which ingredient, strength, and form was compounded. In those cases, the chemical subgroup analysis correctly captures substitutions to compounds. However, when the ATC code is not available, substitutions can be missed in the analysis.
Table 1.1 gives the number of NPDUIS claims that mentioned a compound between 2017/18 and 2019/20. Of 1.9 million claims attributable to compounds during the three-year period, 1.1 million (58%) had an ATC code.
Figure 1.1 provides perspective on the volume of compounds relative to the number of drugs in shortage. In 2019/20, both claims and spending for compounds were dwarfed by those for drugs in shortage. However, because compounds are not coded systematically in the database, their true volume is unknown.
Table 1.1 Claims and plan spending for compounded drugs, 2017/18 to 2019/20
|
2017/18 | 2018/19 | 2019/20 | Total |
|---|---|---|---|---|
Claims |
|
|
|
|
Compounds |
592,266 |
630,385 |
671,217 |
1,893,868 |
Compounds with an ATC code |
329,694 |
369,789 |
406,313 |
1,105,796 |
Plan spending ($M) |
||||
Compounds |
$22.3 |
$25.9 |
$29.1 |
$77.3 |
Compounds with an ATC code |
$9.4 |
$11.7 |
$14.0 |
$35.2 |
Note: ATC: World Health Organization Anatomical Therapeutic Chemical Classification System. Compounds are identified based on a “compound” or “medicine in shortage” mention in the description of the claim. Data source: NPDUIS database, Canadian Institute for Health Information (CIHI).
Figure 1.1 Comparison of claims and plan spending for drugs in shortage and for compounded drugs, 2019/20
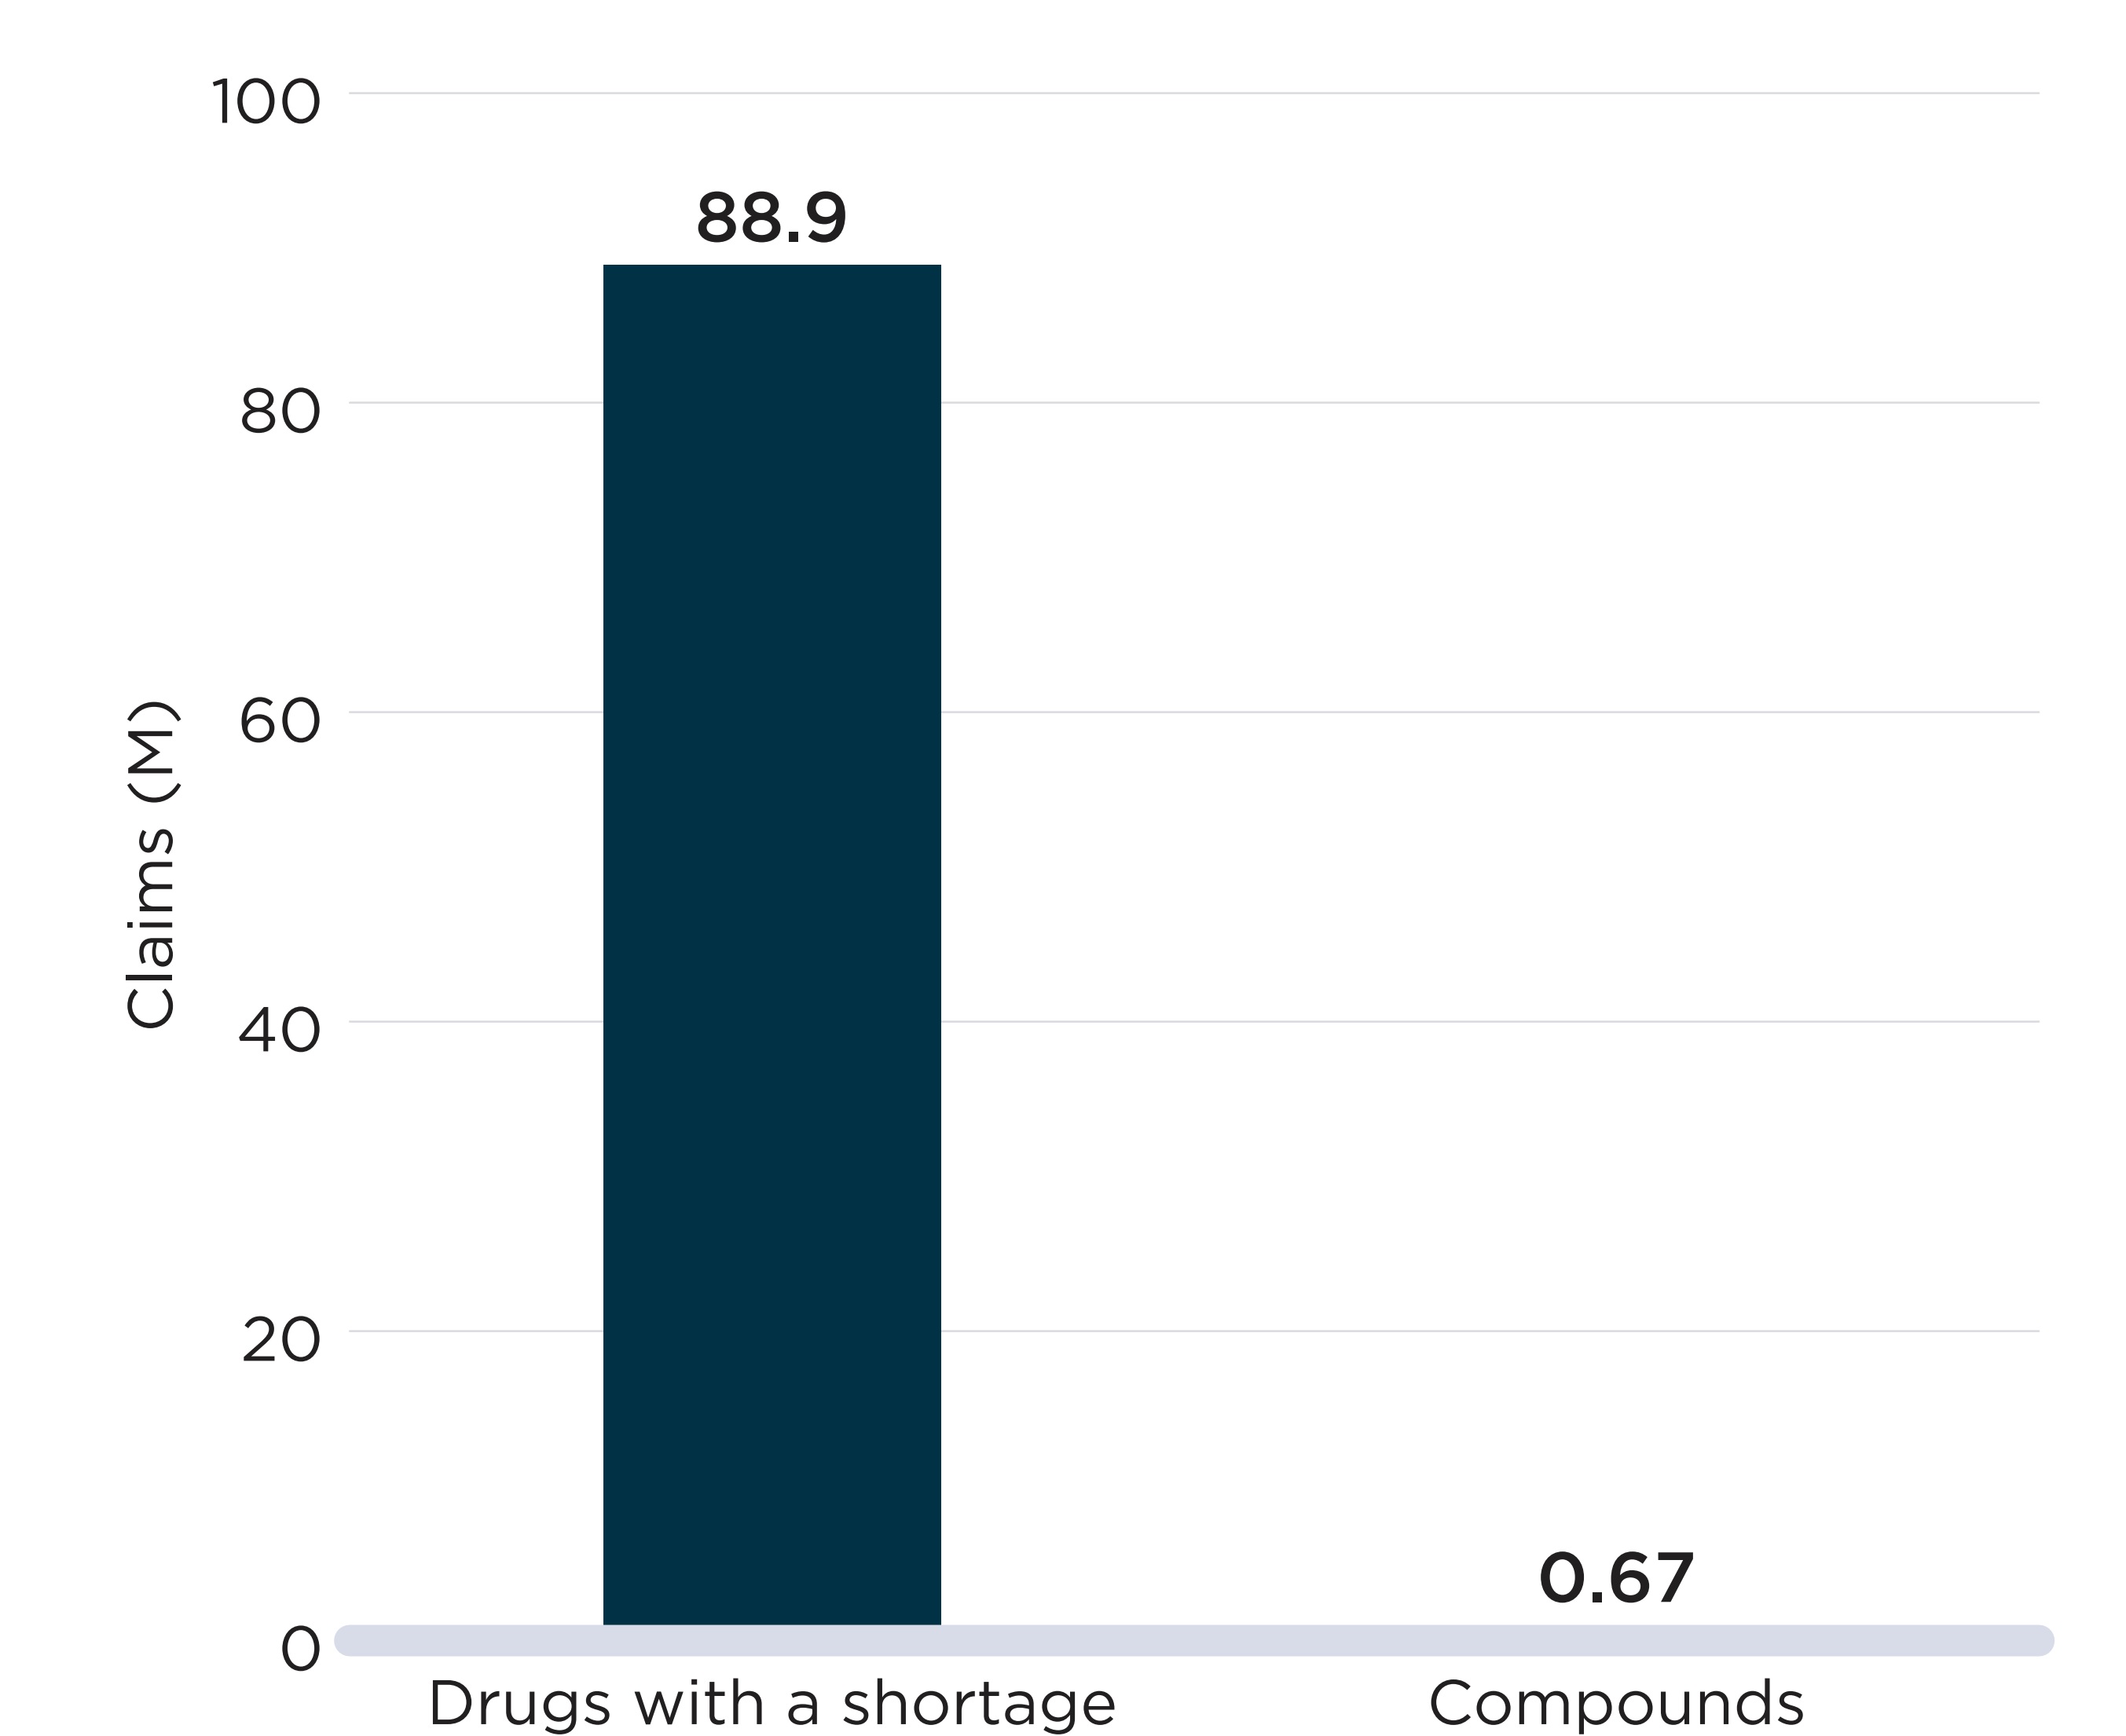
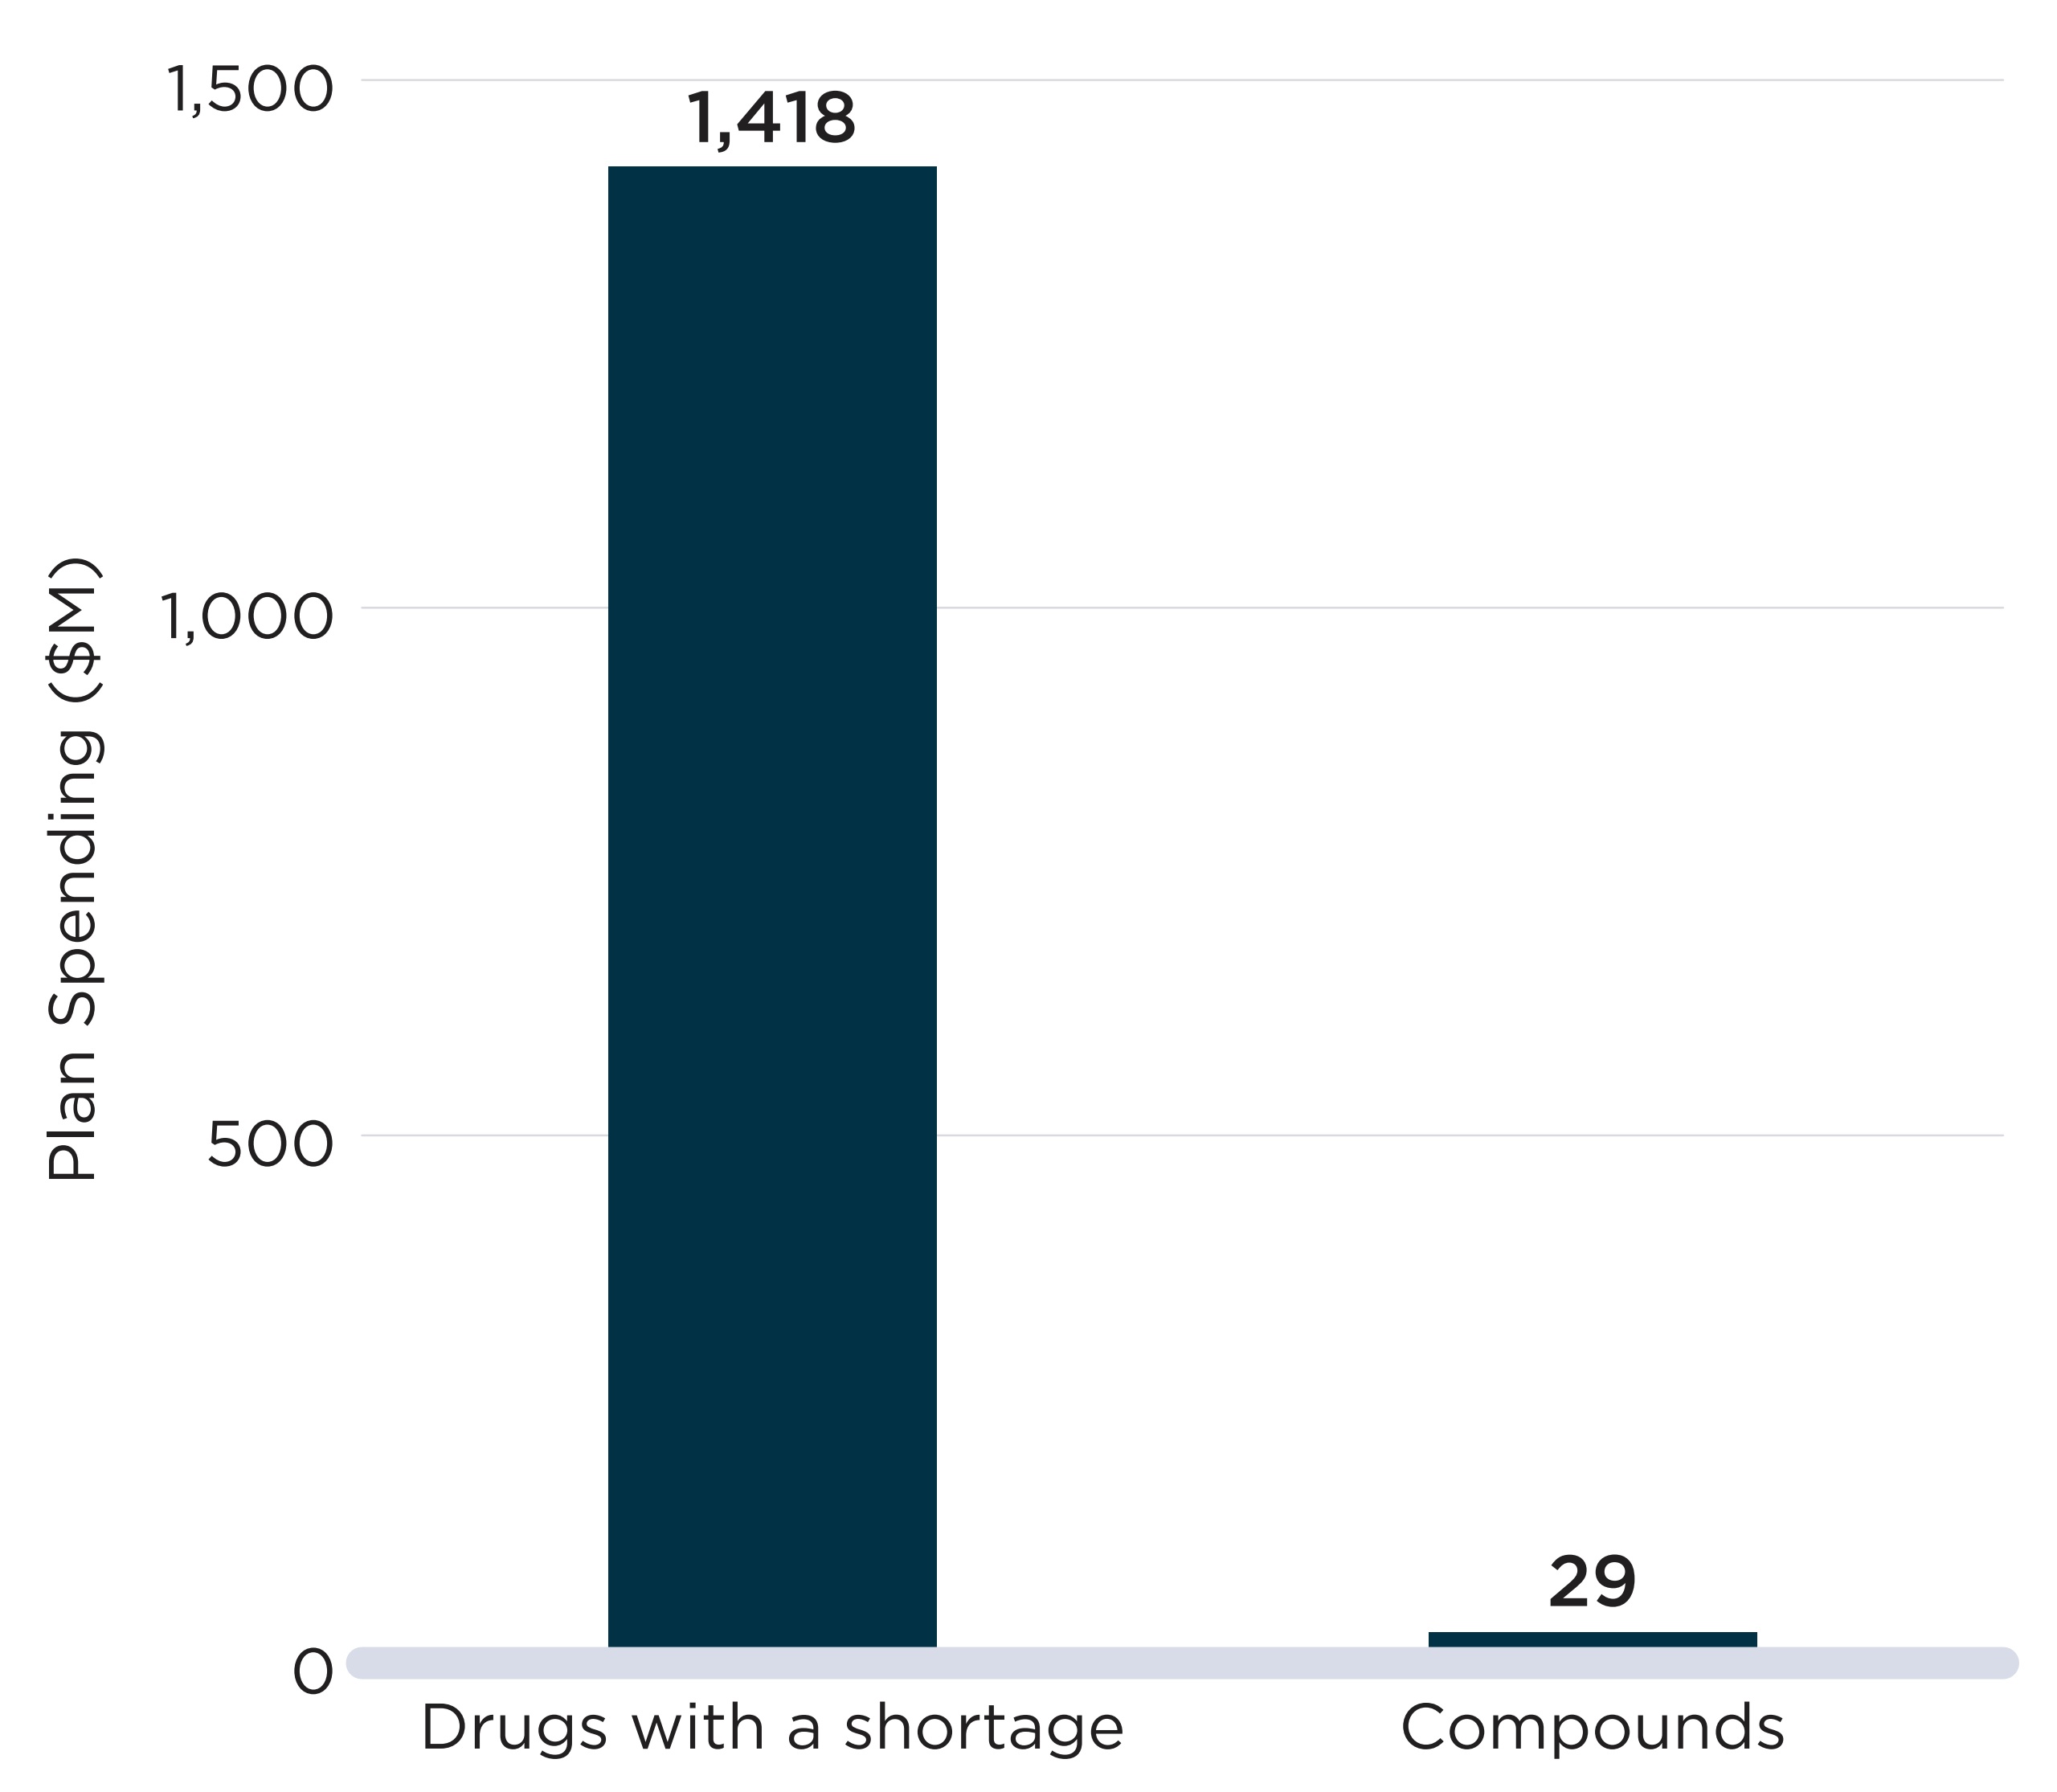
Note: Compounds are identified based on a “compound” or “medicine in shortage” mention in the description of the claim. Drugs with a shortage are drugs for which a shortage report had an “actual” status in 2019/20.
Data source: www.drugshortagescanada.ca; NPDUIS database, Canadian Institute for Health Information (CIHI).
Figure description
Two bar graphs compare the number of claims and public drug plan spending for medicines with an “actual” shortage and compounded medicines in 2019. Claims are given in millions, while spending is given in millions of dollars.
| Percent change in spending | Number of claims, in millions | Public drug plan spending, in millions of dollars |
|---|---|---|
Drugs with a shortage |
88.9 |
1,418 |
Compounded medicines |
0.67 |
29 |
Appendix 2: Additional Exhibits
Table 2.1 Descriptive statistics of the sample used for the FTC analysis, 2019/20
| All oral solid drugs with sales in Canada | Included in analysis: oral solid drugs with 3+ international price comparisons | |||
|---|---|---|---|---|
| N | % | N | % | |
Total count |
6,098 |
100% |
1,409 |
100% |
Market segment |
||||
Patented |
726 |
12% |
471 |
33% |
Single-source non patented |
261 |
4% |
50 |
4% |
Multi-source non patented |
5,111 |
84% |
888 |
63% |
Generic status |
||||
Generic |
4,768 |
78% |
665 |
47% |
Brand |
1,199 |
20% |
737 |
52% |
Uncategorized |
131 |
2% |
7 |
0% |
Market size (molecule level) |
||||
Less than $1M |
1,261 |
21% |
258 |
18% |
$1M to $5M |
2,152 |
35% |
469 |
33% |
$5M to $10M |
1,010 |
17% |
234 |
17% |
$10M and over |
1,645 |
27% |
448 |
32% |
Form |
||||
Tablet |
4,923 |
81% |
1,139 |
81% |
Capsule |
1,175 |
19% |
270 |
19% |
Total revenue ($B) |
13.5 |
|
8.3 |
|
Note: The 1,409 drugs with sales in Canada and three or more countries among the PMPRB11 were included in the international price analysis.
Data source: www.drugshortagescanada.ca; IQVIA MIDAS® database; IQVIA Private Drug Plan database; PMPRB.
Figure 2.1 Subgroup analysis: proportion of oral solid drugs in shortage by median foreign-to-Canadian (FTC) price ratio and patented status, PMPRB11, 2019/20
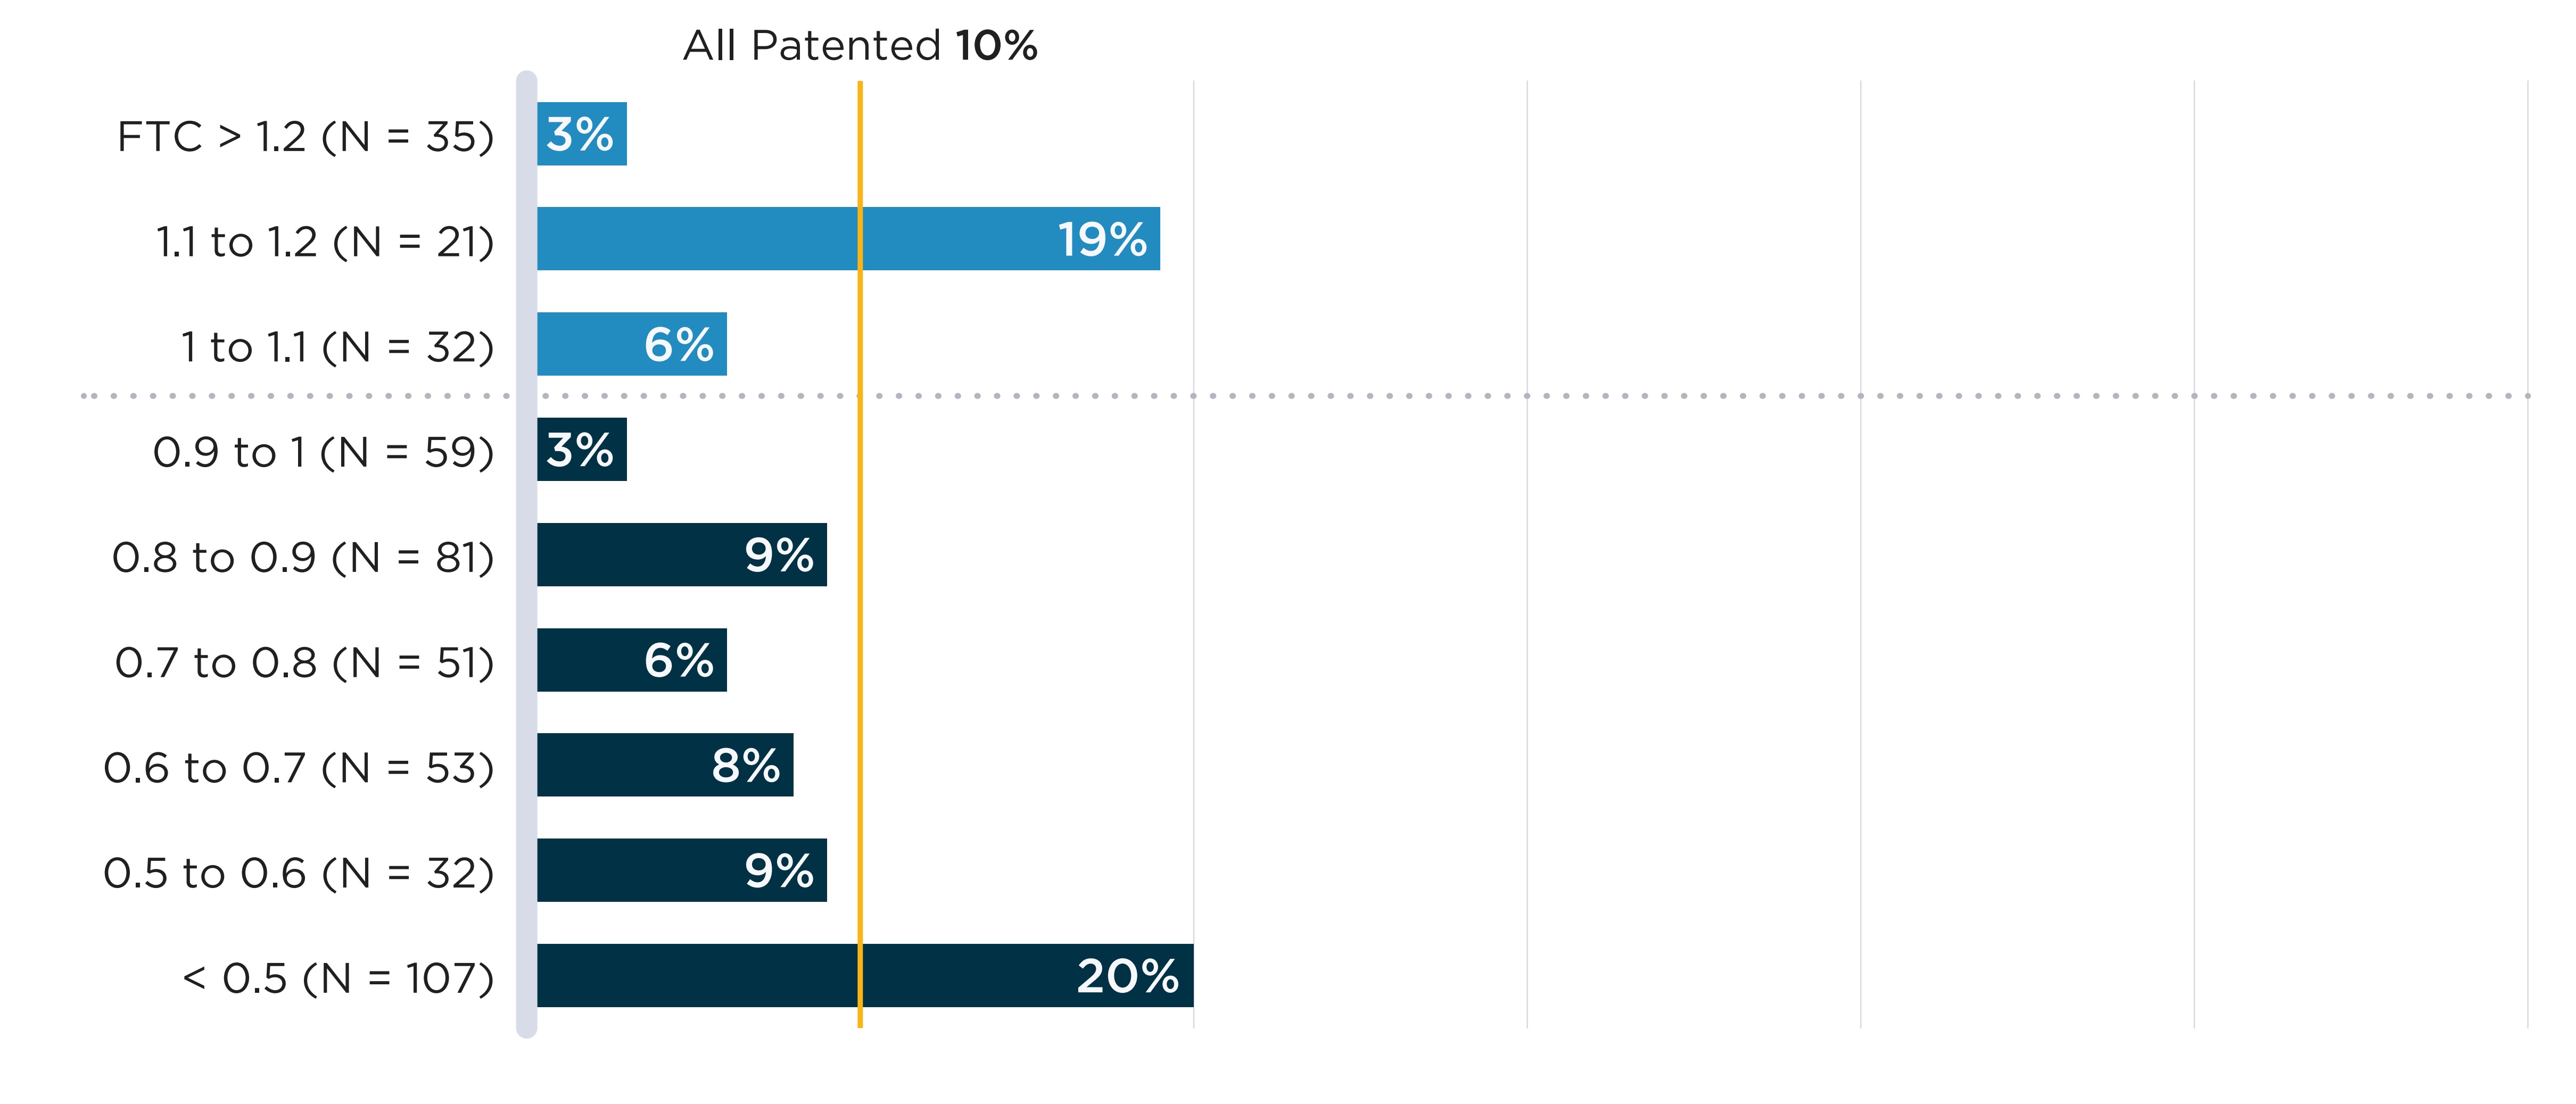
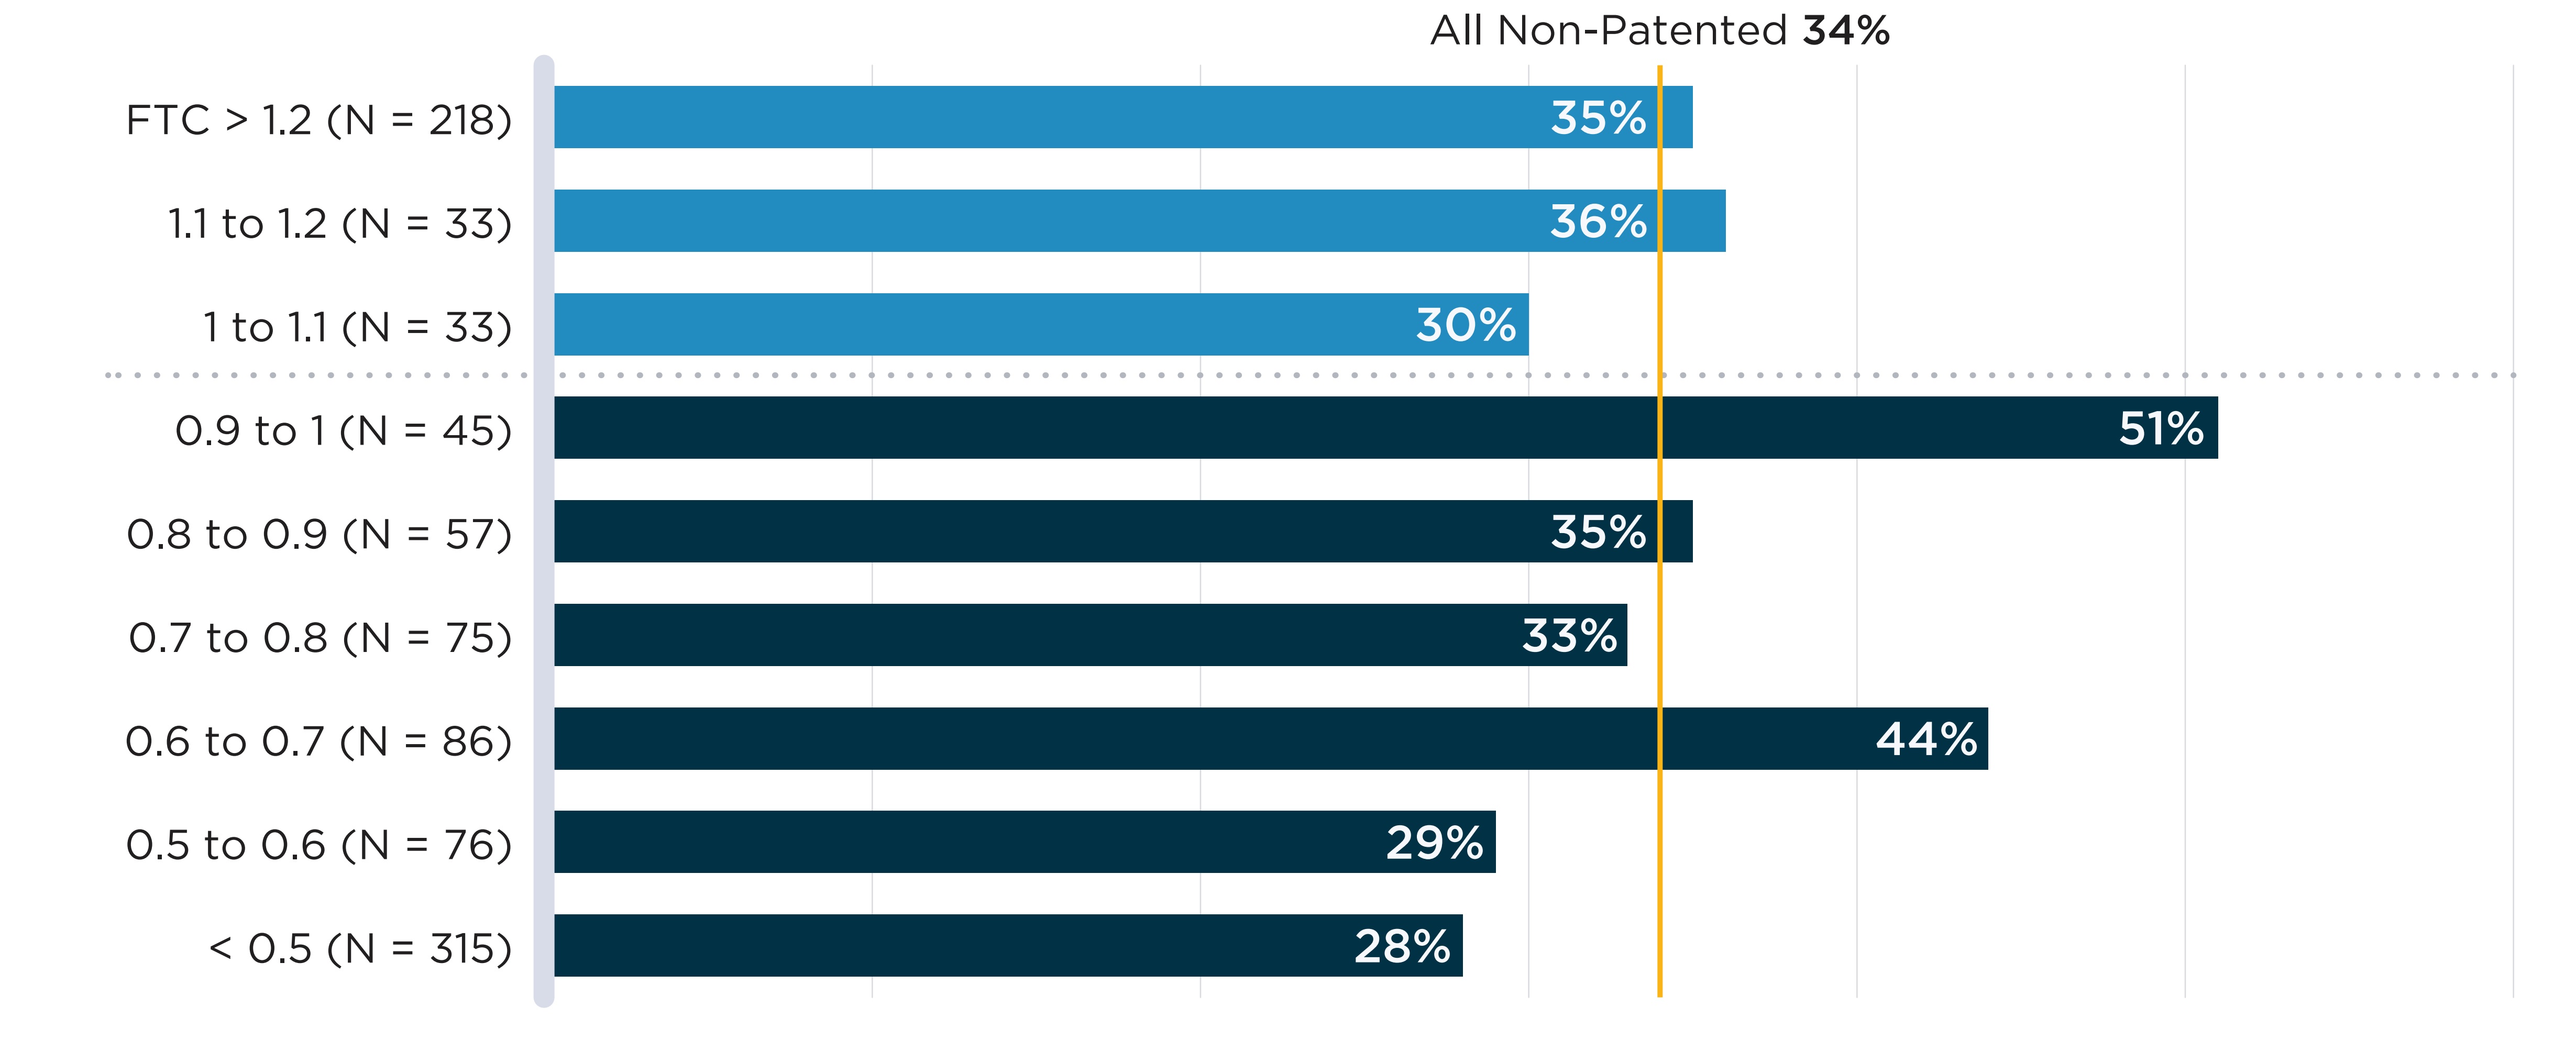
Data source: www.drugshortagescanada.ca; IQVIA MIDAS® database.
Figure description
A. Patented medicines
A bar graph shows the share of patented oral solid medicines in shortage in fiscal year 2019/20 by tiers of median foreign-to-Canadian (FTC) price ratios. Price ratios are calculated by comparing the median price in the 11 PMPRB comparator countries to the price in Canada, with the Canadian price set to a value of 1.00. Ratios over 1.00 indicate a higher international price; ratios below 1.00 indicate a lower international price. A share for all patented oral solid medicines (10%) is also given. The share for all patented oral solid medicines is listed in the title of the bar graph and is represented by a vertical dashed line drawn down the length of the graph. This makes it easier to compare each tier to the share for all oral solid medicines.
| Foreign-to-Canadian price ratio | Total number of medicines | Share of medicines in shortage |
|---|---|---|
Greater than 1.2 |
35 |
3% |
1.1 to 1.2 |
21 |
19% |
1.0 to 1.1 |
32 |
6% |
0.9 to 1.1 |
59 |
3% |
0.8 to 0.9 |
81 |
9% |
0.7 to 0.8 |
51 |
6% |
0.6 to 0.7 |
53 |
8% |
0.5 to 0.6 |
32 |
9% |
All patented oral solid medicines |
471 |
10% |
B. Non-patented medicines
A bar graph shows the share of non-patented oral solid medicines in shortage in fiscal year 2019/20 by tiers of median foreign-to-Canadian (FTC) price ratios. Price ratios are calculated by comparing the median price in the 11 PMPRB comparator countries to the price in Canada, with the Canadian price set to a value of 1.00. Ratios over 1.00 indicate a higher international price; ratios below 1.00 indicate a lower international price. A share for all non-patented oral solid medicines (34%) is also given. The share for all non-patented oral solid medicines is listed in the title of the bar graph and is represented by a vertical dashed line drawn down the length of the graph. This makes it easier to compare each tier to the share for all oral solid medicines.
| Foreign-to-Canadian price ratio | Total number of medicines | Share of medicines in shortage |
|---|---|---|
Greater than 1.2 |
218 |
35% |
1.1 to 1.2 |
33 |
36% |
1.0 to 1.1 |
33 |
30% |
0.9 to 1.1 |
45 |
51% |
0.8 to 0.9 |
57 |
35% |
0.7 to 0.8 |
75 |
33% |
0.6 to 0.7 |
86 |
44% |
0.5 to 0.6 |
76 |
29% |
All non-patented oral solid medicines |
938 |
34% |
Table 2.2 Shortage rates by therapeutic class, 2019/20
| Therapeutic class | Drugs | Drugs with a shortage report | % |
|---|---|---|---|
Agents acting on the renin-angiotensin system | 711 | 395 | 56% |
Drugs for acid related disorders | 179 | 92 | 51% |
Topical corticosteroids | 158 | 78 | 49% |
Calcium channel blockers | 144 | 70 | 49% |
Anti-Parkinson drugs | 107 | 46 | 43% |
Vaccines | 67 | 28 | 42% |
Anti-acne preparations | 66 | 26 | 39% |
Nasal preparations | 27 | 10 | 37% |
Ophthalmologicals | 226 | 82 | 36% |
Lipid modifying agents | 368 | 131 | 36% |
Endocrine therapy | 93 | 32 | 34% |
Urologicals | 246 | 83 | 34% |
Antivaricosis/anti-haemorrhoidal preparations | 33 | 11 | 33% |
Antibacterials for systemic use | 472 | 141 | 30% |
Antimycotics for systemic use | 61 | 18 | 30% |
Other nervous system drugs | 282 | 83 | 29% |
Corticosteroids for systemic use | 63 | 18 | 29% |
Sex hormones and modulators of the genital system | 147 | 42 | 29% |
Antiinflammatory and antirheumatic products | 207 | 59 | 29% |
Vitamins | 36 | 10 | 28% |
All other therapeutic products | 88 | 23 | 26% |
Psychoanaleptics | 601 | 157 | 26% |
Antipsoriatics | 39 | 10 | 26% |
Antithrombotic agents | 160 | 40 | 25% |
Drugs for treatment of bone diseases | 92 | 23 | 25% |
Anti-asthmatics | 162 | 40 | 25% |
Cough and cold preparations | 41 | 10 | 24% |
Antihypertensives | 37 | 9 | 24% |
Antiepileptics | 437 | 104 | 24% |
Psycholeptics | 659 | 156 | 24% |
Thyroid therapy | 31 | 7 | 23% |
Drugs used in diabetes | 244 | 55 | 23% |
Antivirals for systemic use | 210 | 47 | 22% |
Drugs for functional gastrointestinal disorders | 51 | 11 | 22% |
Antidiarrheals, intestinal antiinflammatory/antiin | 42 | 9 | 21% |
Muscle relaxants | 57 | 12 | 21% |
Antineoplastic agents | 439 | 91 | 21% |
Antiemetics and antinauseants | 79 | 16 | 20% |
Anesthetics | 159 | 32 | 20% |
Antibiotics and chemotherapeutics for dermatologic | 20 | 4 | 20% |
Beta blocking agents | 194 | 37 | 19% |
Analgesics | 476 | 89 | 19% |
Immunosuppressive agents | 91 | 16 | 18% |
Diuretics | 73 | 12 | 16% |
Antigout preparations | 26 | 4 | 15% |
Cardiac therapy | 127 | 19 | 15% |
Antiprotozoals | 27 | 4 | 15% |
Other gynecologicals | 30 | 4 | 13% |
Other hormones | 74 | 9 | 12% |
Diagnostic tests | 27 | 3 | 11% |
Immunomodulating agents | 20 | 2 | 10% |
Antianemic preparations | 44 | 4 | 9% |
Antihistamines for systemic use | 24 | 2 | 8% |
Pituitary and hypothalamic hormones | 34 | 2 | 6% |
Other cardiovascular products | 35 | 2 | 6% |
Antihemorrhagics | 38 | 2 | 5% |
Cardiovascular multitherapy combination products | 24 | 1 | 4% |
Intravenous solutions | 43 | 1 | 2% |
ATC2 classes with n < 20 (30 classes) | 220 | 47 | 21% |
Note: Therapeutic classes are defined based on the second level of the Anatomical Therapeutic Chemical (ATC) Classification System maintained by the World Health Organization (WHO). Therapeutic classes with fewer than 20 drugs with sales in Canada are presented in the last row.
Data source: www.drugshortagescanada.ca; IQVIA MIDAS® database.
Table 2.3 Detailed statistics of shortages defined at the chemical subgroup (ATC4) level with a decline greater than 20% in the number of public plan active beneficiaries during the shortage
| Chemical Subgroup (ATC4) | Therapeutic Class (ATC2) | Shortage onset date | Shortage duration (months) | DINs | Active beneficiaries prior to the shortage | Decline in active beneficiaries during the shortage | Oral Solid (%) | Brand (%) | Single-source (%) | Patented (%) |
|---|---|---|---|---|---|---|---|---|---|---|
S01AD |
Ophthalmologicals |
Jun-17 |
33 |
1 |
386 |
88% |
0% |
100% |
92% |
0% |
H05BA |
Calcium homeostasis |
Dec-18 |
6 |
1 |
32 |
76% |
0% |
100% |
95% |
0% |
M01CB |
Antiinflammatory and antirheumatic products |
Dec-17 |
19 |
4 |
216 |
75% |
25% |
100% |
95% |
0% |
A03ED |
Drugs for functional gastrointestinal disorders |
Oct-17 |
8 |
1 |
31 |
68% |
100% |
100% |
95% |
0% |
A03BB |
Drugs for functional gastrointestinal disorders |
Jan-18 |
19 |
3 |
4,547 |
67% |
33% |
67% |
0% |
0% |
N02AD |
Analgesics |
Oct-18 |
6 |
1 |
31 |
62% |
100% |
100% |
91% |
0% |
S01FA |
Ophthalmologicals |
Feb-18 |
8 |
12 |
3,669 |
54% |
0% |
25% |
26% |
0% |
D10AA |
Anti-acne preparations |
Jan-19 |
2 |
1 |
26 |
54% |
0% |
100% |
98% |
0% |
G03AB |
Sex hormones and modulators of the genital system |
Mar-19 |
13 (ongoing) |
19 |
25,199 |
51% |
89% |
79% |
21% |
11% |
G03GA |
Sex hormones and modulators of the genital system |
Feb-19 |
5 |
1 |
<5 |
50% |
0% |
0% |
56% |
0% |
P02BA |
Anthelmintics |
Jan-18 |
4 |
1 |
<5 |
50% |
100% |
100% |
64% |
0% |
S01HA |
Ophthalmologicals |
Aug-17 |
2 |
2 |
<5 |
50% |
0% |
50% |
0% |
0% |
D10BA |
Anti-acne preparations |
Apr-19 |
2 |
8 |
6,270 |
50% |
100% |
75% |
0% |
0% |
N02BA |
Analgesics |
Aug-19 |
8 (ongoing) |
38 |
1,980 |
46% |
92% |
3% |
0% |
0% |
N05CM |
Psycholeptics |
Jan-19 |
3 |
6 |
1,783 |
45% |
0% |
0% |
93% |
0% |
D10BA |
Anti-acne preparations |
Jul-19 |
9 (ongoing) |
8 |
5,607 |
45% |
100% |
75% |
0% |
0% |
M01AX |
Antiinflammatory and antirheumatic products |
Oct-17 |
11 |
3 |
113 |
45% |
67% |
0% |
32% |
0% |
L01CB |
Antineoplastic agents |
Sep-18 |
7 |
4 |
103 |
43% |
25% |
25% |
18% |
0% |
N02BA |
Analgesics |
Jul-17 |
13 |
38 |
13,495 |
41% |
92% |
3% |
0% |
0% |
P02CC |
Anthelmintics |
Dec-17 |
5 |
4 |
84 |
40% |
50% |
0% |
41% |
0% |
C09BB |
Agents acting on the renin-angiotensin system |
May-19 |
2 |
1 |
<5 |
40% |
100% |
100% |
0% |
0% |
G03AA |
Sex hormones and modulators of the genital system |
Dec-18 |
16 (ongoing) |
53 |
77,575 |
37% |
98% |
57% |
11% |
7% |
R03BC |
Drugs for obstructive airway diseases |
Nov-17 |
2 |
3 |
22 |
36% |
0% |
0% |
32% |
0% |
G03XA |
Sex hormones and modulators of the genital system |
Sep-18 |
18 |
4 |
203 |
36% |
100% |
100% |
72% |
0% |
M05BB |
Drugs for treatment of bone diseases |
Sep-17 |
31 (ongoing) |
10 |
26,394 |
36% |
80% |
30% |
1% |
0% |
A10BF |
Drugs used in diabetes |
Jan-19 |
14 |
4 |
2,898 |
35% |
100% |
50% |
35% |
17% |
J02AA |
Antimycotics for systemic use |
Apr-18 |
14 |
4 |
10 |
34% |
0% |
50% |
0% |
0% |
N02AF |
Analgesics |
Jul-17 |
3 |
2 |
16 |
31% |
0% |
50% |
50% |
0% |
J01XA |
Antibacterials for systemic use |
Nov-17 |
8 |
18 |
84 |
29% |
11% |
0% |
0% |
0% |
A03AA |
Drugs for functional gastrointestinal disorders |
May-17 |
19 |
11 |
1,959 |
26% |
91% |
36% |
18% |
0% |
C08DA |
Calcium channel blockers |
Sep-18 |
19 (ongoing) |
23 |
8,459 |
24% |
87% |
13% |
0% |
0% |
A07EA |
Antidiarrheals, intestinal antiinflammatory/antiinfective agents |
Jul-18 |
21 (ongoing) |
7 |
1,285 |
24% |
29% |
86% |
22% |
8% |
J01XD |
Antibacterials for systemic use |
May-17 |
11 |
9 |
77 |
24% |
22% |
11% |
7% |
0% |
N02BA |
Analgesics |
Mar-19 |
4 |
38 |
3,278 |
24% |
92% |
3% |
0% |
0% |
N02AX |
Analgesics |
Jan-18 |
2 |
22 |
21 |
24% |
100% |
73% |
13% |
8% |
R05DA |
Cough and cold preparations |
May-18 |
3 |
36 |
25,238 |
23% |
33% |
22% |
2% |
0% |
R03CB |
Drugs for obstructive airway diseases |
Jan-19 |
4 |
1 |
1,823 |
23% |
0% |
0% |
95% |
0% |
D07AA |
Corticosteroids, dermatological preparations |
Apr-19 |
12 (ongoing) |
36 |
45,691 |
22% |
0% |
22% |
0% |
3% |
R01AX |
Nasal preparations |
Jun-19 |
2 |
22 |
1,007 |
22% |
0% |
14% |
8% |
0% |
R05CB |
Cough and cold preparations |
Oct-18 |
18 (ongoing) |
7 |
513 |
22% |
0% |
29% |
14% |
14% |
N06DX |
Psychoanaleptics |
Aug-17 |
21 |
8 |
17 |
21% |
100% |
13% |
0% |
13% |
Note: Shortages are defined here as a situation in which a DIN within an ATC4 group is mentioned by at least one shortage report with an “actual” status during the study period. The decline in active beneficiaries compares the average monthly number of beneficiaries during the shortage and up to six months prior to the shortage.
Data source: www.drugshortagescanada.ca; NPDUIS Database, Canadian Institute for Health Information (CIHI).
Table 2.4 Detailed statistics of shortages defined at the chemical subgroup (ATC4) level for which public plan spending changed by more than 40% during the shortage
A. Shortages accompanied by spending increases larger than 40% (N=22)
| Chemical Subgroup (ATC4) | Therapeutic Class (ATC2) | Shortage onset date | Shortage duration (months) | DINs | Monthly spending prior to the shortage ($) | Change in spending during the shortage (%) | Oral Solid (%) | Brand (%) | Single-source (%) | Patented (%) |
|---|---|---|---|---|---|---|---|---|---|---|
G03AA |
Sex hormones and modulators of the genital system |
Jan-18 |
10 |
53 |
710,400 |
272% |
98% |
57% |
11% |
7% |
G03AB |
Sex hormones and modulators of the genital system |
Jan-18 |
2 |
19 |
333,100 |
240% |
89% |
79% |
21% |
11% |
M09AB |
Other drugs for disorders of the musculo-skeletal system |
Nov-18 |
2 |
1 |
1,200 |
172% |
0% |
0% |
0% |
0% |
G03XB |
Sex hormones and modulators of the genital system |
Jul-17 |
7 |
2 |
98,200 |
150% |
50% |
100% |
97% |
47% |
V04CF |
Diagnostic agents |
Jun-17 |
2 |
1 |
50 |
149% |
0% |
0% |
42% |
0% |
L01AB |
Antineoplastic agents |
Dec-19 |
2 |
1 |
400 |
123% |
100% |
0% |
100% |
0% |
S01FB |
Ophthalmologicals |
Aug-17 |
2 |
3 |
20 |
118% |
0% |
0% |
23% |
0% |
A16AA |
Other alimentary tract and metabolism products |
Oct-19 |
2 |
19 |
114,000 |
104% |
11% |
42% |
31% |
4% |
C01CA |
Cardiac therapy |
Sep-17 |
31 (ongoing) |
22 |
1,128,600 |
85% |
18% |
27% |
3% |
0% |
B05XA |
Blood substitutes and perfusion solutions |
Jun-17 |
34 (ongoing) |
27 |
9,600 |
84% |
0% |
0% |
18% |
0% |
L01XX |
Antineoplastic agents |
Dec-18 |
16 (ongoing) |
27 |
800,400 |
78% |
70% |
56% |
35% |
30% |
V03AB |
All other therapeutic products |
Apr-19 |
4 |
21 |
1,127,800 |
67% |
0% |
10% |
3% |
0% |
J01AA |
Antibacterials for systemic use |
May-17 |
35 (ongoing) |
30 |
379,900 |
58% |
93% |
7% |
5% |
2% |
H01BA |
Pituitary and hypothalamic hormones and analogues |
May-17 |
16 |
19 |
212,900 |
54% |
68% |
63% |
0% |
31% |
R03CB |
Drugs for obstructive airway diseases |
Mar-18 |
2 |
1 |
22,200 |
53% |
0% |
0% |
95% |
0% |
N06DX |
Psychoanaleptics |
Nov-19 |
3 |
8 |
1,000 |
48% |
100% |
13% |
0% |
13% |
J01DC |
Antibacterials for systemic use |
Jan-18 |
27 (ongoing) |
43 |
379,000 |
46% |
47% |
26% |
1% |
5% |
S01EE |
Ophthalmologicals |
Sep-18 |
2 |
25 |
2,895,600 |
45% |
0% |
44% |
4% |
14% |
B05CB |
Blood substitutes and perfusion solutions |
May-17 |
5 |
13 |
9,000 |
44% |
0% |
0% |
2% |
0% |
L01CB |
Antineoplastic agents |
May-19 |
4 |
4 |
67,600 |
43% |
25% |
25% |
18% |
0% |
H05BX |
Calcium homeostasis |
Jan-18 |
13 |
18 |
88,400 |
42% |
100% |
17% |
0% |
15% |
D11AF |
Other dermatological preparations |
May-18 |
3 |
11 |
2,200 |
41% |
0% |
36% |
0% |
0% |
Note: Shortages are defined here as a situation in which a DIN within an ATC4 group is mentioned by at least one shortage report with an “actual” status during the study period. The percent change in spending compares the average monthly spending during the shortage and up to six months prior to the shortage.
Data source: www.drugshortagescanada.ca; NPDUIS Database, Canadian Institute for Health Information (CIHI).
B. Shortages accompanied by spending declines larger than 40% (N=22)
| Chemical Subgroup (ATC4) | Therapeutic Class (ATC2) | Shortage onset date | Shortage duration (months) | DINs | Monthly spending prior to the shortage ($) | Change in spending during the shortage (%) | Oral Solid (%) | Brand (%) | Single-source (%) | Patented (%) |
|---|---|---|---|---|---|---|---|---|---|---|
S01AD |
Ophthalmologicals |
Jun-17 |
33 |
1 |
12,400 |
-89% |
0% |
100% |
92% |
0% |
V04CF |
Diagnostic agents |
Jun-18 |
2 |
1 |
200 |
-88% |
0% |
0% |
42% |
0% |
H05BA |
Calcium homeostasis |
Dec-18 |
6 |
1 |
9,400 |
-86% |
0% |
100% |
95% |
0% |
A03ED |
Drugs for functional gastrointestinal disorders |
Oct-17 |
8 |
1 |
3,500 |
-74% |
100% |
100% |
95% |
0% |
C09BB |
Agents acting on the renin-angiotensin system |
May-19 |
2 |
1 |
200 |
-70% |
100% |
100% |
0% |
0% |
N02AD |
Analgesics |
Oct-18 |
6 |
1 |
2,800 |
-69% |
100% |
100% |
91% |
0% |
A03BB |
Drugs for functional gastrointestinal disorders |
Jan-18 |
19 |
3 |
141,400 |
-68% |
33% |
67% |
0% |
0% |
D10AA |
Anti-acne preparations |
Jan-19 |
2 |
1 |
600 |
-62% |
0% |
100% |
98% |
0% |
M01CB |
Antiinflammatory and antirheumatic products |
Dec-17 |
19 |
4 |
25,400 |
-59% |
25% |
100% |
95% |
0% |
N05CM |
Psycholeptics |
Jan-19 |
3 |
6 |
110,800 |
-56% |
0% |
0% |
93% |
0% |
D10BA |
Anti-acne preparations |
Apr-19 |
2 |
8 |
676,500 |
-55% |
100% |
75% |
0% |
0% |
D10BA |
Anti-acne preparations |
Jul-19 |
9 (ongoing) |
8 |
603,500 |
-52% |
100% |
75% |
0% |
0% |
G03AB |
Sex hormones and modulators of the genital system |
Mar-19 |
13 (ongoing) |
19 |
1,206,100 |
-51% |
89% |
79% |
21% |
11% |
S01HA |
Ophthalmologicals |
Aug-17 |
2 |
2 |
30 |
-50% |
0% |
50% |
0% |
0% |
N02BA |
Analgesics |
Aug-19 |
8 (ongoing) |
38 |
17,900 |
-46% |
92% |
3% |
0% |
0% |
M01AX |
Antiinflammatory and antirheumatic products |
Oct-17 |
11 |
3 |
5,200 |
-43% |
67% |
0% |
32% |
0% |
P02CC |
Anthelmintics |
Dec-17 |
5 |
4 |
1,700 |
-41% |
50% |
0% |
41% |
0% |
Note: Shortages are defined here as a situation in which a DIN within an ATC4 group is mentioned by at least one shortage report with an “actual” status during the study period. The percent change in spending compares the average monthly spending during the shortage and up to six months prior to the shortage.
Data source: www.drugshortagescanada.ca; NPDUIS Database, Canadian Institute for Health Information (CIHI).