
Canadian generic market trends and international comparison, 2018–2024
Brian O’Shea
Presented at the 29th Annual CAPT conference, September 22-23, 2025
Objective
In Canada, over 75% of the annual volume of prescription drugs sold are generic medicines, representing an important cost control option for payers. In recent years, generic pricing policies have been implemented by several individual provinces, and a 2018 agreement between the pan-Canadian Pharmaceutical Alliance (pCPA) and the Canadian Generic Pharmaceutical Association (CGPA) aimed to further lower prices.Footnote 1 The purpose of this study is to analyze trends in utilization, spending, and pricing of generics in Canada and international markets from 2018 to 2024.
Approach
This analysis is based on the PMPRB NPDUIS research initiative’s Generics360Footnote 2 report series, which provides analysis to inform discussions and support evidence-based decision making for policy makers, the pharmaceutical industry, and patients.
We used international sales data to compare generic sales in Canada with Australia, Belgium, France, Germany, Italy, Japan, the Netherlands, Norway, Spain, Sweden, the United Kingdom, and the United States. For each year from 2018 to 2024, metrics were compiled related to the sales, utilization, and price levels of generic drugs in these countries.
Data and Methodology
Data sources: The primary data source is the IQVIA MIDAS® database, 2018 to 2024 (all rights reserved). MIDAS® data reflects the national retail and hospital sectors in Canada and internationally. Population, exchange rates, and consumer price index information are obtained from the OECD and World Bank.
Definitions: Drugs are defined as unique arrangements of prescription-bound pharmaceutical ingredients and strengths. The term “generic” used in this analysis includes both patented and non-patented generic medicines as classified in MIDAS®.
Outcomes: Sales metrics of all prescription-bound generics are calculated using manufacturer ex-factory list prices in the national retail markets. The generic share of units was defined as the proportion of Standard Units for each dosage and formulation that were generic in each year.
In Figures 4 and 5, sales-weighted price levels and bilateral price ratios in Canada and comparator countries are calculated for each quarter using a basket of select oral solid generic drugs. Inclusion requires a drug to have been on the Canadian market for at least one year with estimated annual retail sales of at least $1 million. In each year of the study period, the basket of drugs ranged between 75–79% of generic sales. Price indexes for each country are calculated using the local currency and country-specific sales weights for the select generics.
For international comparisons, medicines are required to have the same form and strength as were available in Canada. The international markets examined include the United States as well as the PMPRB11 countries listed in the Schedule to the Patented Medicines Regulations.Footnote 3Results
1. Generic sales growth in Canada was in line with comparator countries
- Adjusting for inflation, generic sales in Canada increased 20.2% from 2018 to 2024 (Figure 1).
- Canadian generic sales growth was fifth highest of the countries studied, after Norway, the Netherlands, Sweden, and Australia.
- Compared to the PMPRB11 median sales index of 1.12, Canada’s sales index grew 67% faster over the study period.
Figure 1. Real sales index for generic medicines, 2018–2024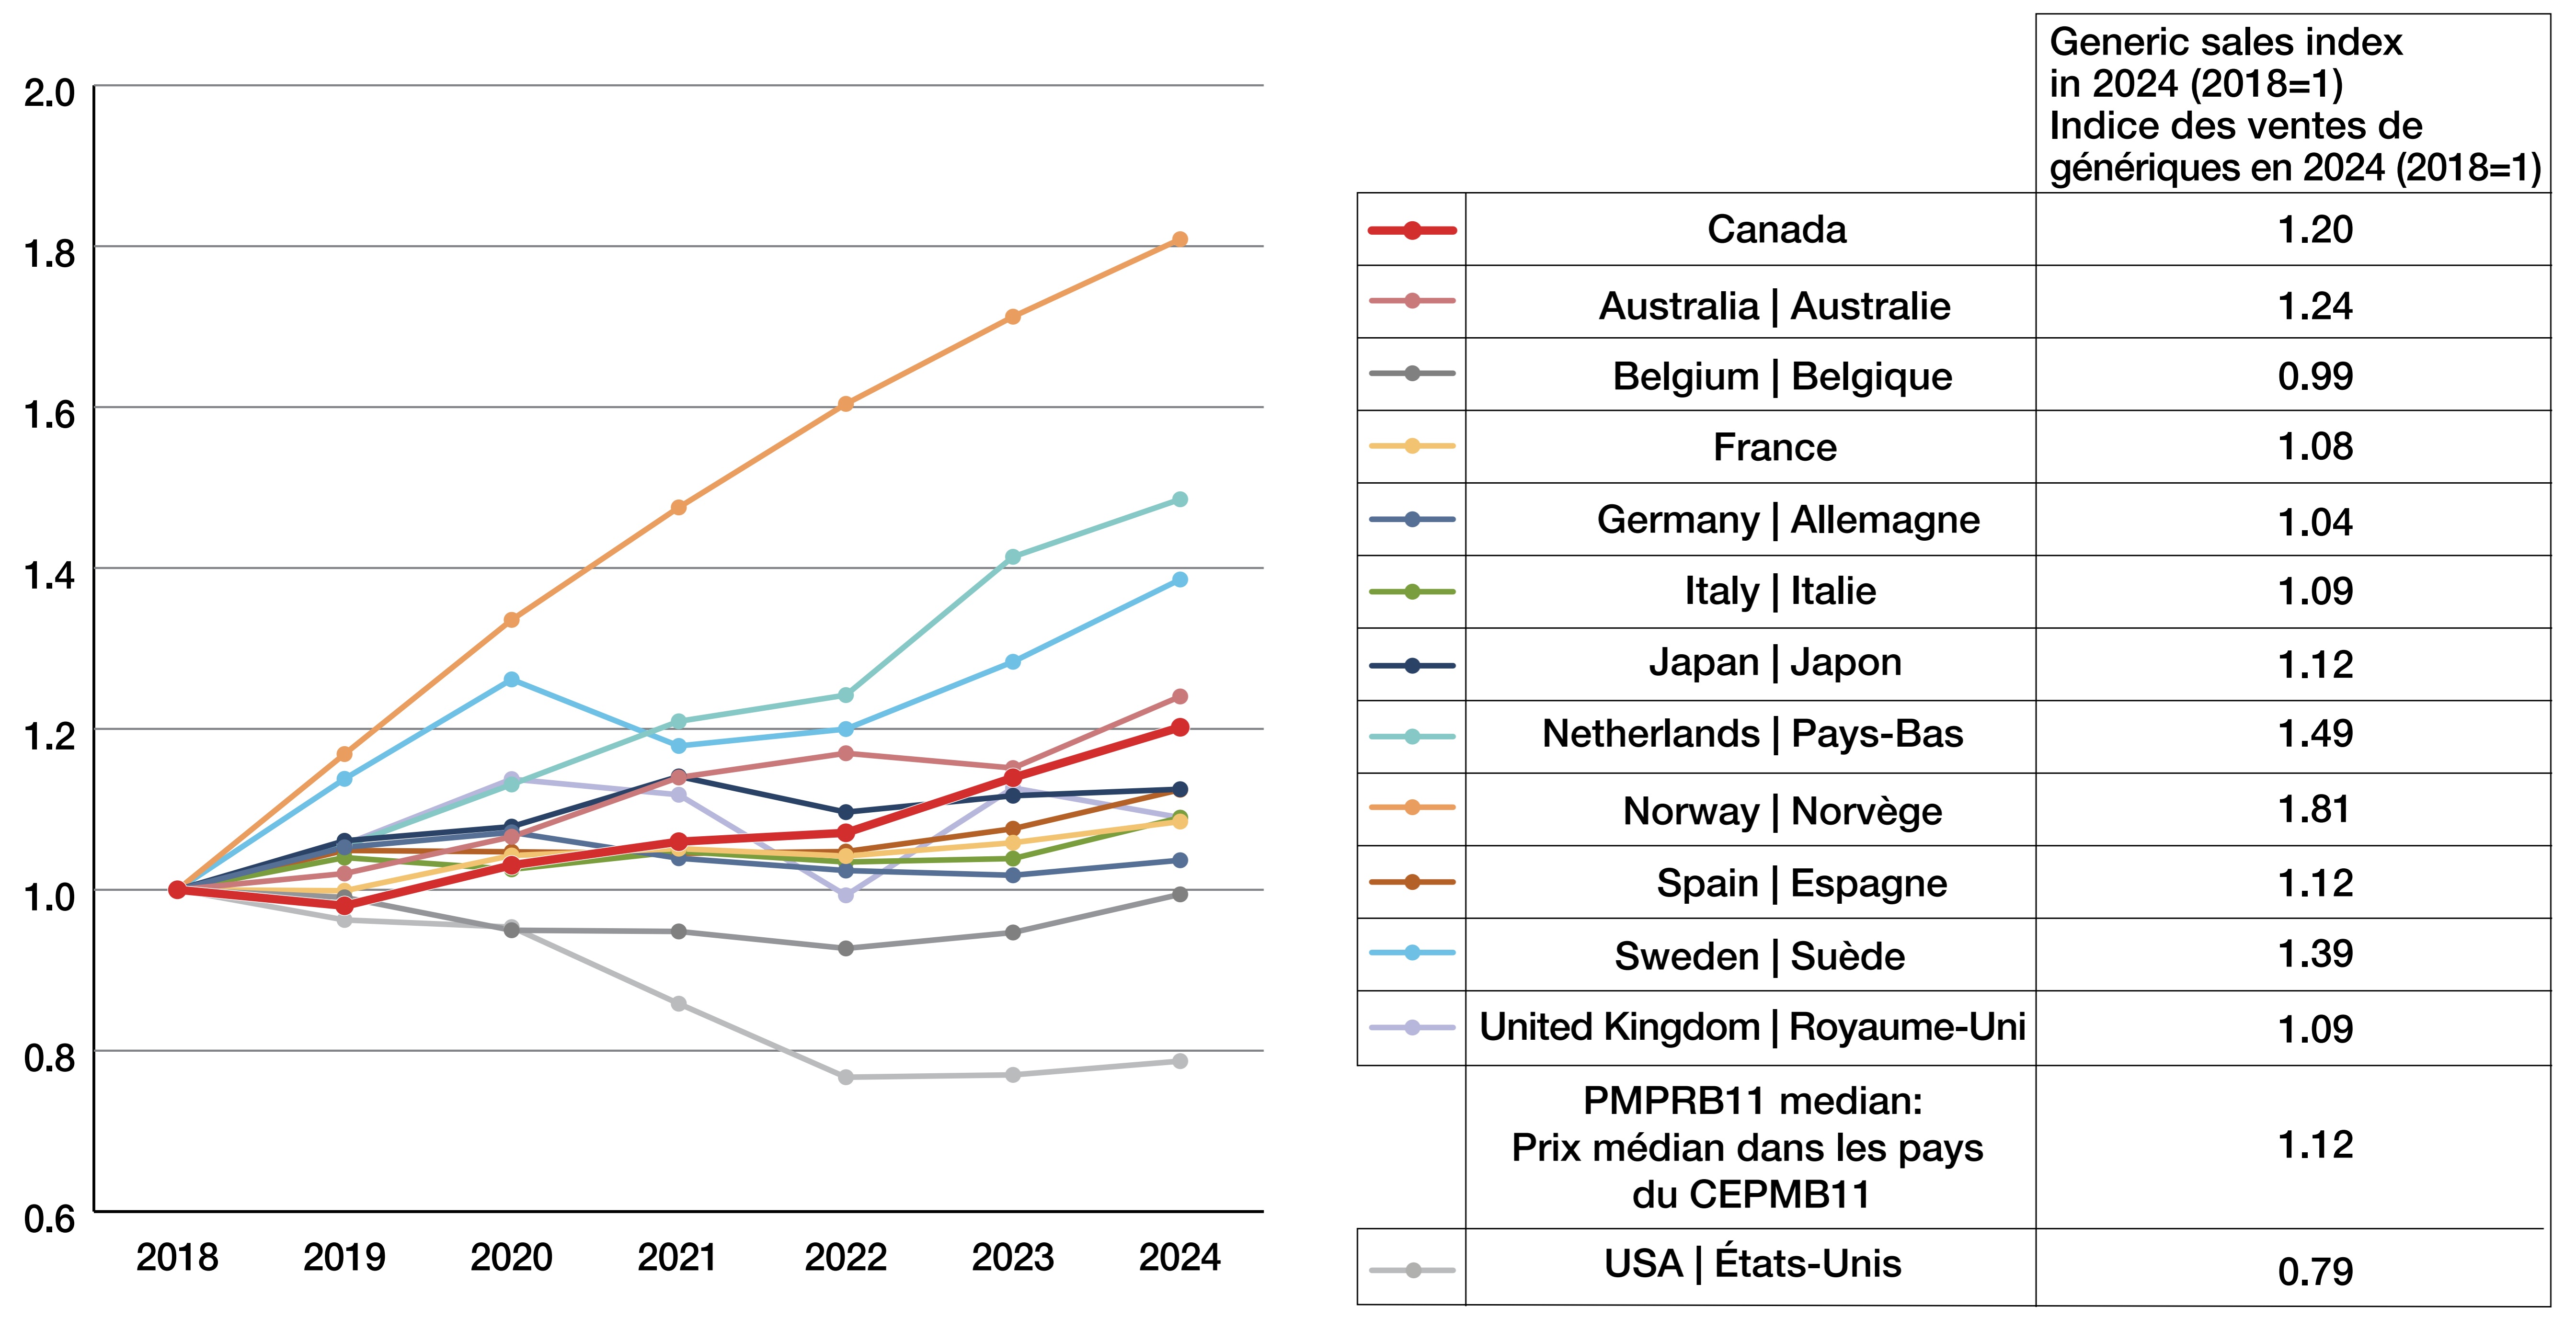
Figure - Text version
| Generic sales index in 2024 (2018=1) | |
|---|---|
Canada |
1.20 |
Australia |
1.24 |
Belgium |
0.99 |
France |
1.08 |
Germany |
1.04 |
Italy |
1.09 |
Japan |
1.12 |
Netherlands |
1.49 |
Norway |
1.81 |
Spain |
1.12 |
Sweden |
1.39 |
United Kingdom |
1.09 |
PMPRB11 median |
1.12 |
USA |
0.79 |
2. The generic share of units sold in Canada was second highest of all comparator countries in 2024, while the share of sales has decreased slightly since 2018 (Figure 2)
- The generic share of units in Canada increased every year from 2018 to 2024, trailing only the US by the end of the study period.
- Canada was one of six countries where the share of generic sales decreased over the study period.
Figure 2a. Generic share of units, 2018 and 2024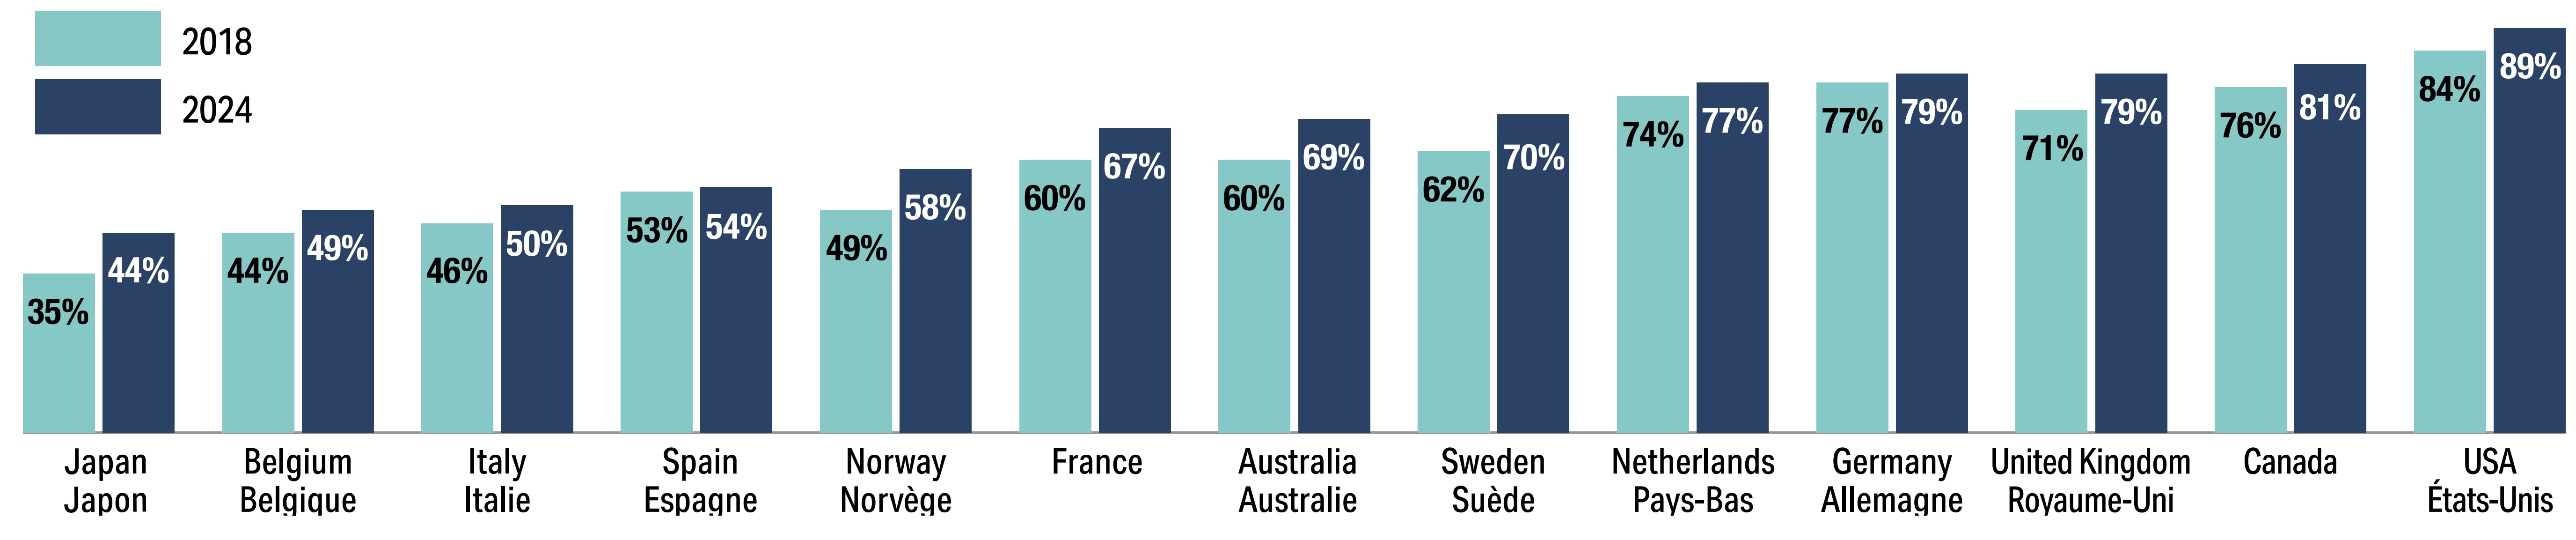
Figure - Text version
| 2018 | 2024 | |
|---|---|---|
Japan |
35% |
44% |
Belgium |
44% |
49% |
Italy |
46% |
50% |
Spain |
53% |
54% |
Norway |
49% |
58% |
France |
60% |
67% |
Australia |
60% |
69% |
Sweden |
62% |
70% |
Netherlands |
74% |
77% |
Germany |
77% |
79% |
United Kingdom |
71% |
79% |
Canada |
76% |
81% |
USA |
84% |
89% |
Figure 2b. Generic share of sales, 2018 and 2024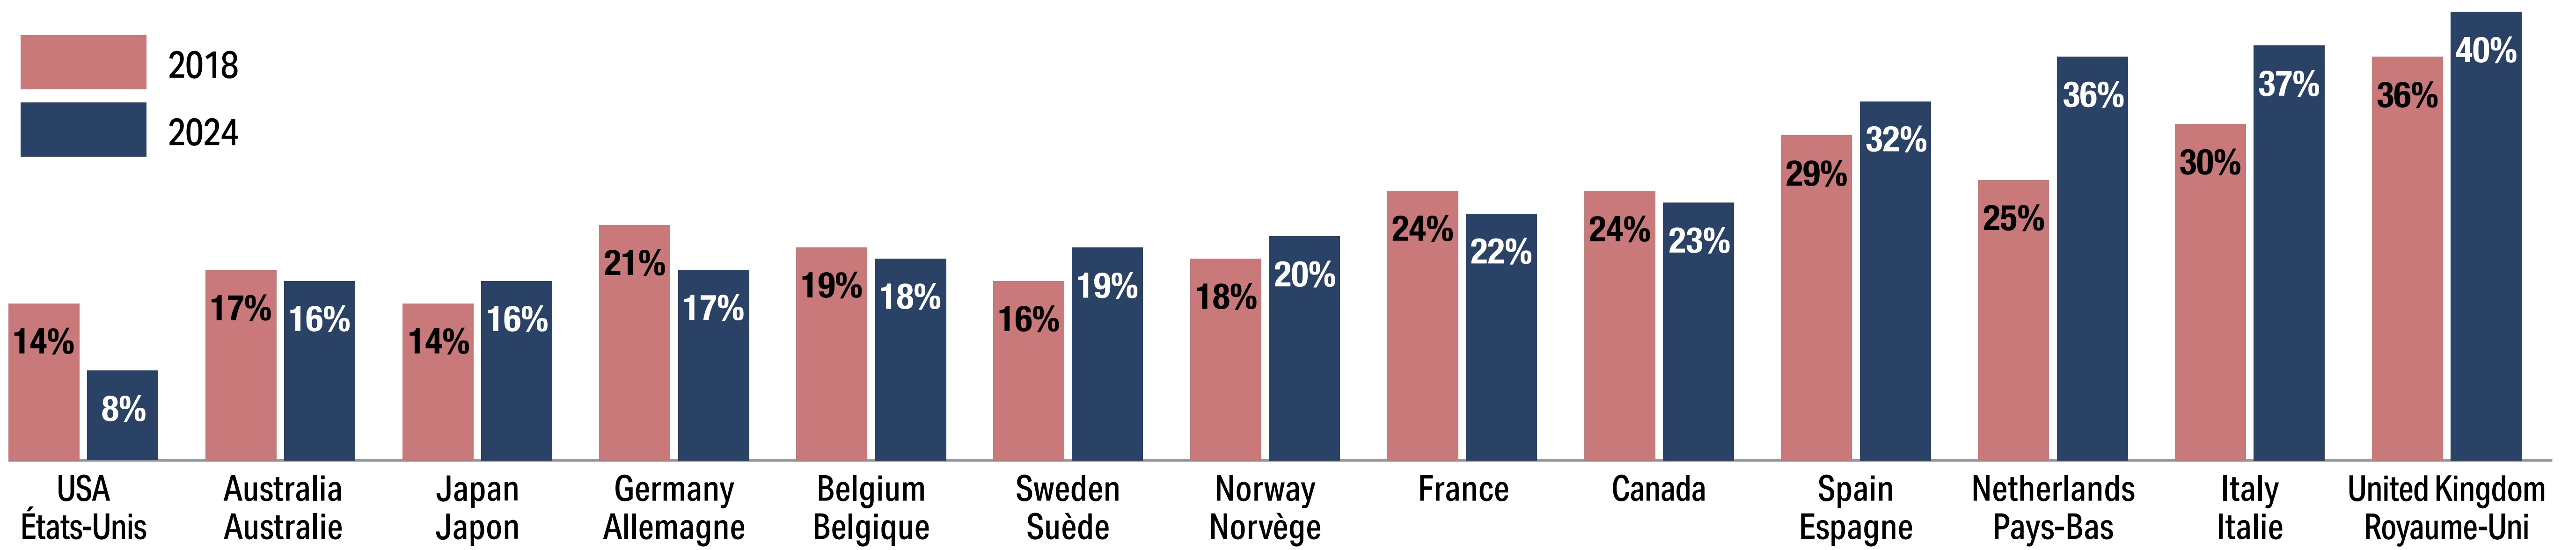
Figure - Text version
| 2018 | 2024 | |
|---|---|---|
USA |
14% |
8% |
Australia |
17% |
16% |
Japan |
14% |
16% |
Germany |
21% |
17% |
Belgium |
19% |
18% |
Sweden |
16% |
19% |
Norway |
18% |
20% |
France |
24% |
22% |
Canada |
24% |
23% |
Spain |
29% |
32% |
Netherlands |
25% |
36% |
Italy |
30% |
37% |
United Kingdom |
36% |
40% |
3. Canadian per capita spending on generics in 2024 was second highest in terms of market exchange rates and third highest in purchasing power parity
- Canada had the second-highest per capita generic spending at market exchange rates in each year of the study period, trailing only the US (Figure 3a).
- Accounting for purchasing power differences, Canada per capita generic spending was third highest in 2024, behind Spain and the US (Figure 3b).
Figure 3a. Per capita generic spending (CAD), market exchange rates, 2018 and 2024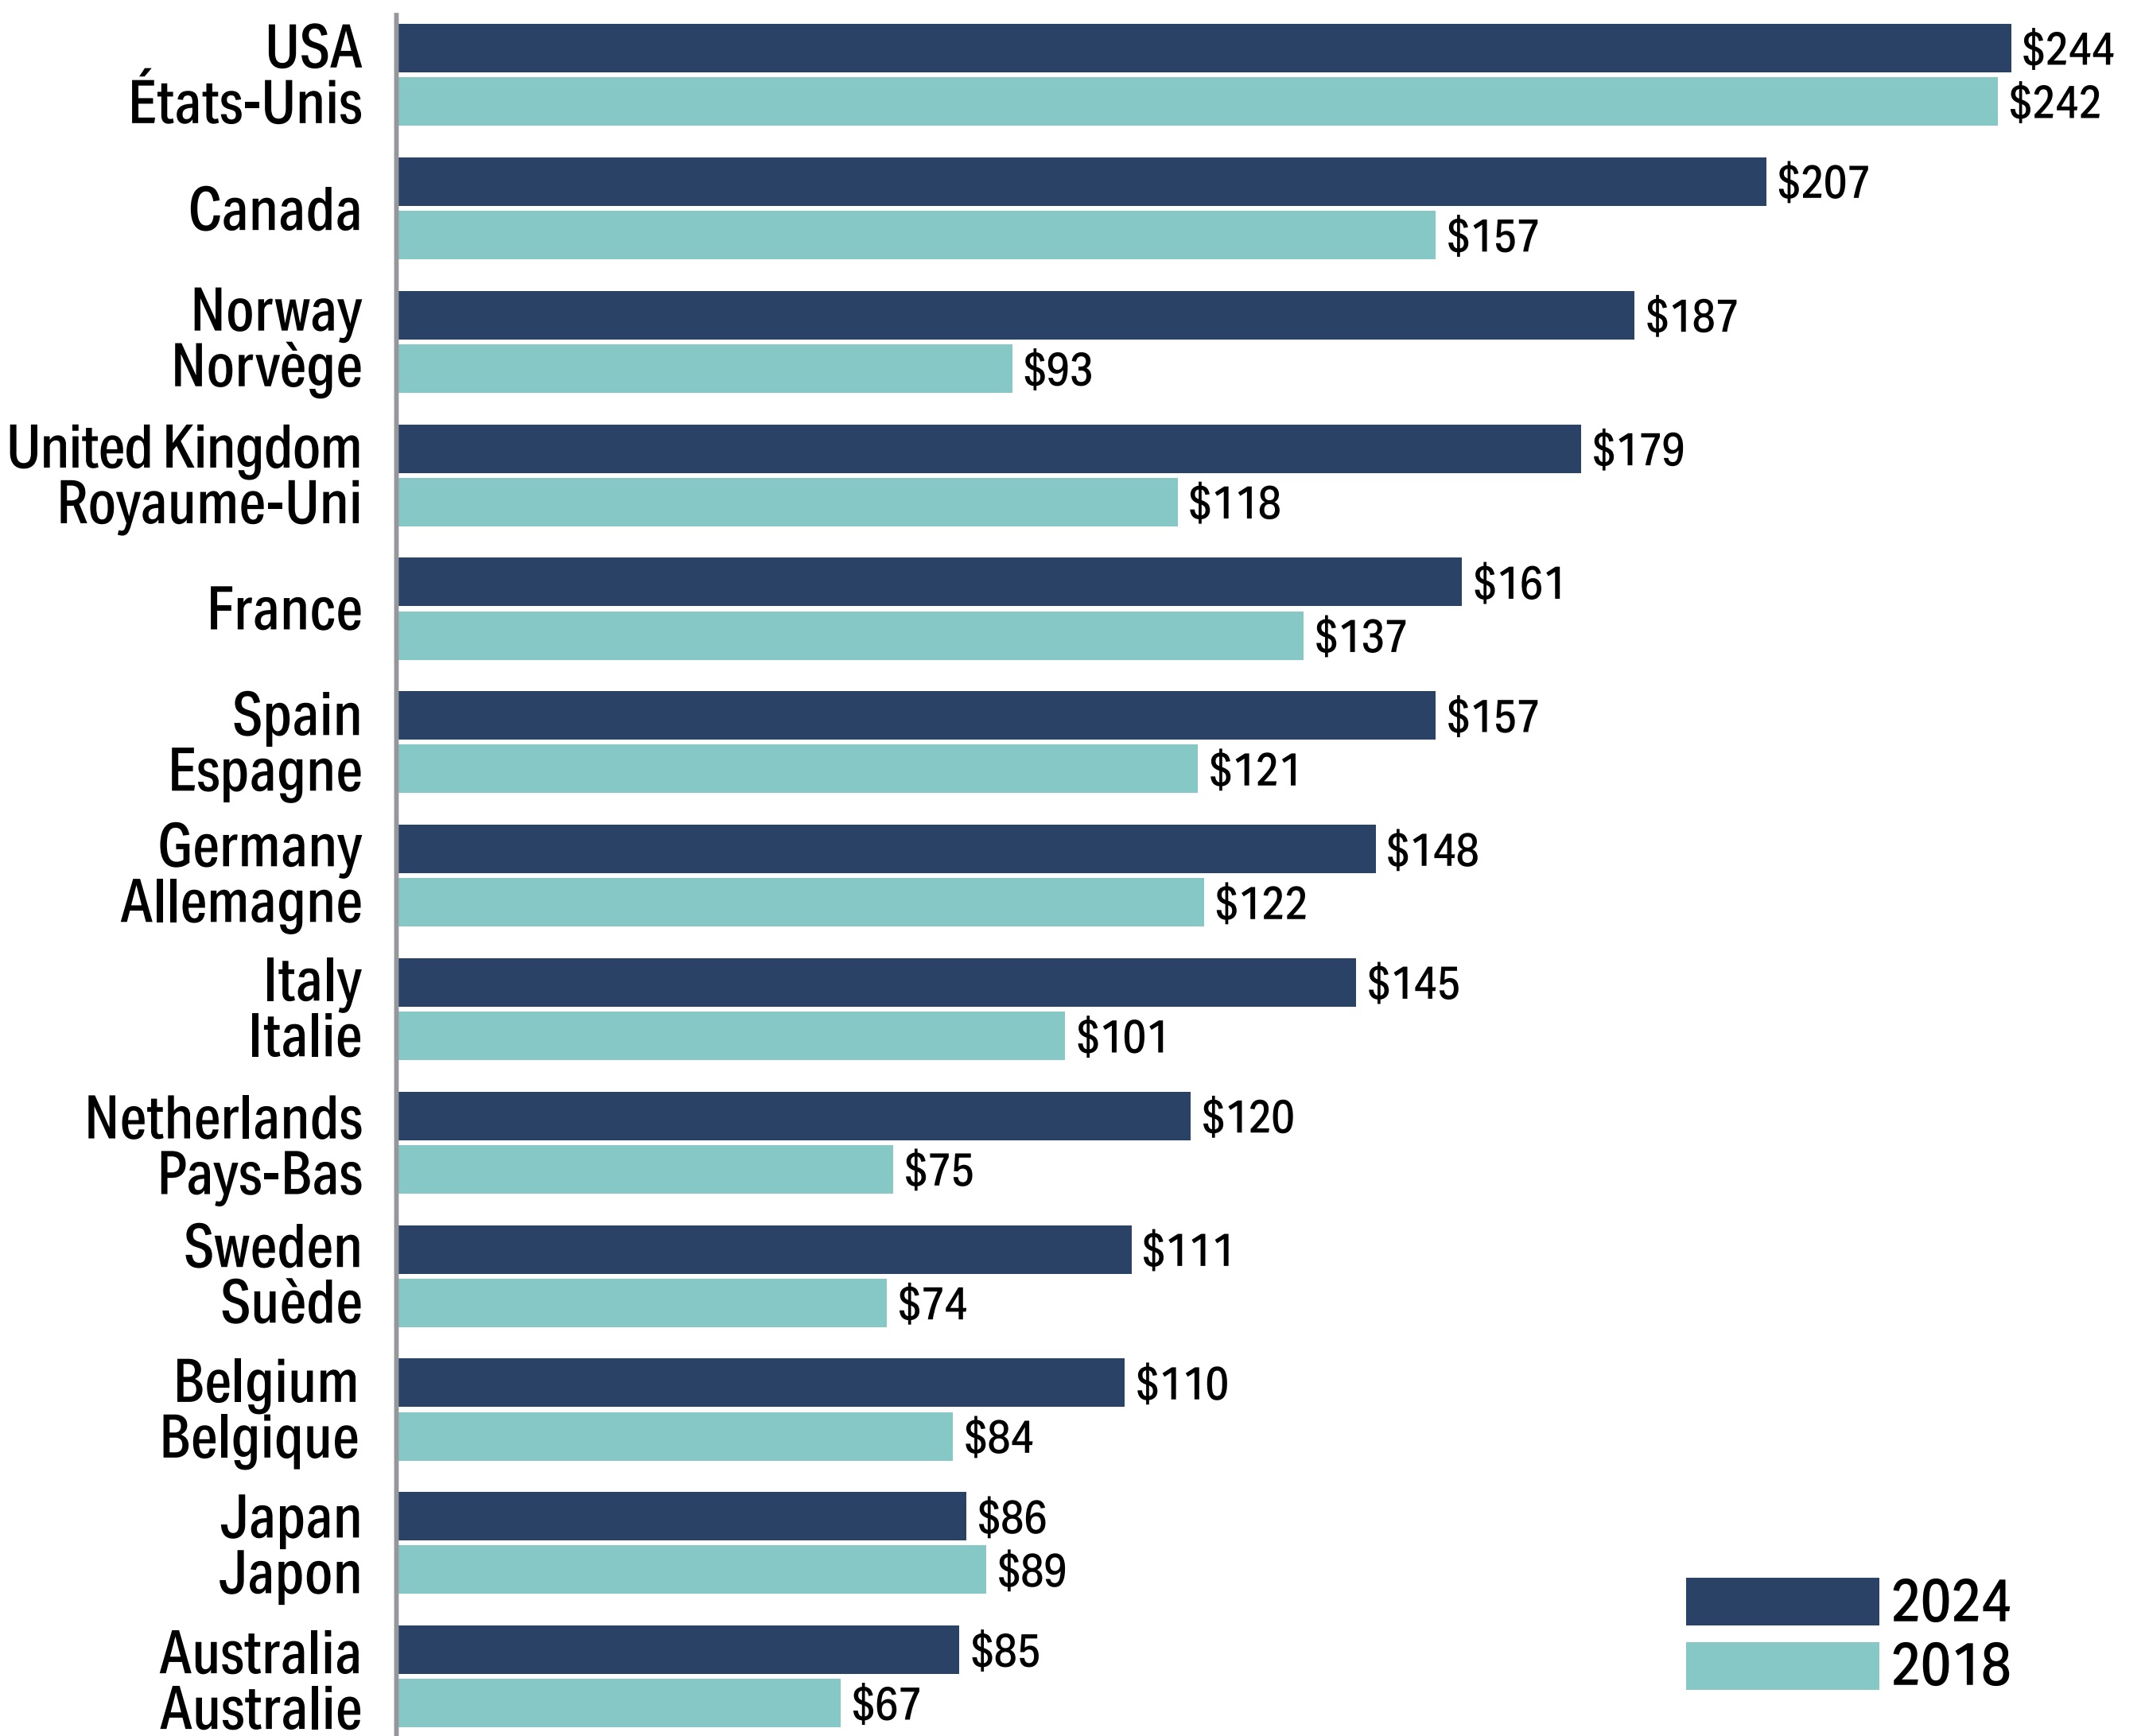
Figure - Text version
| 2018 | 2024 | |
|---|---|---|
Australia |
$ 67 |
$ 85 |
Japan |
$ 89 |
$ 86 |
Belgium |
$ 84 |
$ 110 |
Sweden |
$ 74 |
$ 111 |
Netherlands |
$ 75 |
$ 120 |
Italy |
$ 101 |
$ 145 |
Germany |
$ 122 |
$ 148 |
Spain |
$ 121 |
$ 157 |
France |
$ 137 |
$ 161 |
United Kingdom |
$ 118 |
$ 179 |
Norway |
$ 93 |
$ 187 |
Canada |
$ 157 |
$ 207 |
USA |
$ 242 |
$ 244 |
Figure 3b. Per capita generic spending (CAD), purchasing power parity, 2018 and 2024
Figure - Text version
| 2018 | 2024 | |
|---|---|---|
Australia |
$ 57 |
$ 79 |
Japan |
$ 88 |
$ 117 |
Sweden |
$ 68 |
$ 118 |
Belgium |
$ 86 |
$ 124 |
Netherlands |
$ 76 |
$ 128 |
Germany |
$ 131 |
$ 166 |
United Kingdom |
$ 120 |
$ 179 |
France |
$ 143 |
$ 189 |
Italy |
$ 117 |
$ 190 |
Norway |
$ 73 |
$ 193 |
Canada |
$ 157 |
$ 207 |
USA |
$ 225 |
$ 208 |
Spain |
$ 151 |
$ 216 |
Note: Purchasing power parity measures the relative cost of a standard “basket” of goods and services to offer a simple way to account for the differences in overall national price levels across countries.
4. Price levels for select oral solid generics in Canada have been steady following substantial decreases in 2018
- Following substantial price decreases in the first half of 2018, the Canadian price index for the select oral solid generics have been steady at 81-83% of initial levels (Figure 4).
- Generic drugs set to 18% and 10% of their brand prices by the pCPA-CGPA joint agreements showed even larger decreases and also have been steady over the study period.
- Only in Japan and the US did the price index for the select oral solid list fall below 60% of the starting value.
Figure 4. Sales-weighted price index, select oral solid generics, 2018–2024
Figure - Text version
| Country | 2024-Q4 price index |
|---|---|
Sweden |
1.56 |
Norway |
1.38 |
Netherlands |
1.32 |
Italy |
0.97 |
Spain |
0.94 |
Belgium |
0.90 |
France |
0.84 |
Canada |
0.82 |
United Kingdom |
0.79 |
Germany |
0.76 |
Australia |
0.72 |
CAN18* |
0.71 |
CAN10* |
0.65 |
Japan |
0.57 |
USA |
0.52 |
*CAN18 and CAN10 refer to the 67 generic medicines reduced to 18% and 10% of their brand reference prices through the pCPA–CGPA pricing agreement effective April 2018.
5. Bilateral foreign-to-Canadian price ratios for select oral solid generics have decreased in most countries since 2018-Q4 (Figure 5)
- Bilateral ratios for the select oral solid generics list, weighted by the Canadian distribution of sales, show Canada below Spain and within 10% of the price ratio for four other countries including the US.
- The range of price ratios has tightened over the study period, from 0.53-1.67 in 2018-Q4 to 0.59-1.18 in 2024-Q4.
Figure 5. Foreign-to-Canadian bilateral price ratios for select oral solid generics, 2018-Q4 to 2024-Q4 
Figure - Text version
| Average price ratio | |||
|---|---|---|---|
| 2018-Q4 | 2024-Q4 | ||
United Kingdom |
0.78 |
0.81 |
Foreign price ratio increased |
Norway |
0.77 |
0.83 |
|
Netherlands |
0.53 |
0.86 |
|
Sweden |
0.60 |
0.59 |
Foreign price ratio decreased |
Australia |
0.71 |
0.64 |
|
Germany |
0.93 |
0.77 |
|
France |
0.99 |
0.83 |
|
Belgium |
0.97 |
0.91 |
|
Japan |
1.67 |
0.92 |
|
USA |
1.05 |
0.99 |
|
Italy |
1.02 |
0.99 |
|
Spain |
1.30 |
1.18 |
|
Conclusion
The generic market in Canada continues to show high utilization and per capita spending compared to other countries. Price levels for generics covered by the 2018 pCPA-CGPA agreement have been steady, while total generic sales growth is in line with other countries.
Limitations
The IQVIA MIDAS® Database does not capture confidential discounts resulting from off-invoice price rebates, managed entry agreements, or other agreements used in Canadian and foreign markets. As a result, price levels may be overestimated depending on the level of discounts present.
Disclaimer
Although based in part on data obtained under license from the MIDAS® database proprietary to IQVIA Solutions Canada Inc. and/or its affiliates ("IQVIA"), the statements, findings, conclusions, views, and opinions expressed in this presentation are exclusively those of the PMPRB and are not attributable to IQVIA.