
International Generic Availability Improvements Between 2010 and 2021
Presented at ISPOR 2023, May 7-10, 2023 and at CAPT 2023, October 23-24, 2023
Étienne Gaudette, PhD, and Kevin R. Pothier, BSc Pharm, RPh
On this page
Download or print a PDF of the Poster
Introduction
Background and objective: Although expensive new medicines occupy much policy attention, older and less expensive generic drugs make up the majority of drugs used internationally and are vital to population health. Studies have shown generic drugs to be particularly impacted by drug shortages, a problem which has gained increasing attention over the last decade and is now considered a crisis (FDA, 2019). In many cases, shortages can be mitigated by a competitive generic market, which provides multiple offerings of products that can be used interchangeably for the drugs in shortage (PMPRB, 2022). This research aims to compare the generic drug market vitality of a group of countries with similar pharmaceutical environments and study how generic availability and competition have evolved in recent years.
Approach: We use oral solid drug sales data from IQVIA’s MIDAS database for the period 2010-2021. We investigate trends in the distribution of medicines sold by number of available generics, the number of companies selling generics, and generic sales. We compare the generic markets of the United States, Australia, Belgium, Canada, France, Germany, Italy, Japan, Netherlands, Norway, Spain, Sweden, and the United Kingdom.
Data
Sales data: The IQVIA MIDAS® database (all rights reserved) was the primary source used for the analysis. MIDAS data reflects the national retail and hospital sectors in Canada and internationally, including payers in all market segments (public, private, and out-of-pocket). The data elements used for this study were the medicinal ingredient(s), strength, manufacturer name, generic indicator, and annual sales by country expressed in USD. Data were aggregated at fiscal years (Apr. to Mar.). Population data from the OECD and the Bureau of Labor Statistics’ All Urban Consumers Price Index were used to compute sales per capita expressed in constant dollars.
Definitions and inclusion criteria: Drugs were defined at the medicinal ingredient(s) and strength level. Only oral solid prescription drugs for which at least one generic product was available internationally were included in the study. These criteria were used to facilitate comparisons between products and remove patent-protected products from the analysis sample. A generic company was a manufacturer showing sales of at least 25 generic drugs. The threshold was chosen to count companies with a significant portfolio of drugs and exclude niche companies selling only a few generics. We found that companies meeting this threshold account for 95% of oral solid generics sold in Canada in 2021.
Results
1. Generic availability greatly improved internationally since 2010
Between 2010 and 2021, all 13 countries investigated saw an increase in the proportion of oral solid drugs sold with at least one generic option marketed (Figure 1).
The USA showed the highest generic availability in all years, while Belgium ranked last.
The international median improved from 61% in 2010 to 73% in 2021, a 12 pp gain.
Figure 1: Generic Availability
Percent of oral solid drugs with at least one generic offering
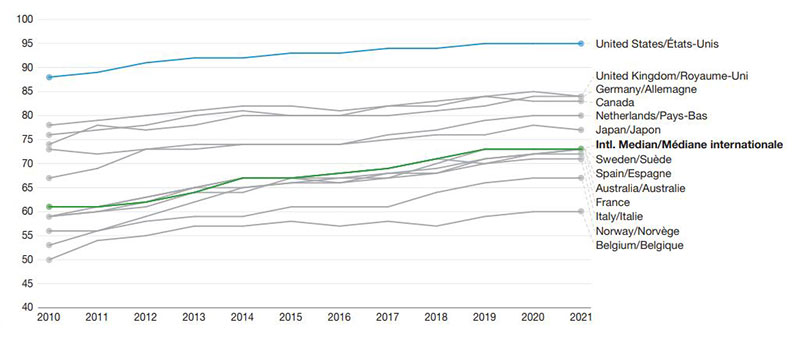
Figure 1 - Text version
A line graph shows the annual trends in the number of oral solid drugs with one or more generics from fiscal years 2010/11 to 2021/22. Trends are given for Australia, Belgium, Canada, France, Germany, Italy, Japan, Netherlands, Norway, Spain, Sweden, the United Kingdom, and the United States. All countries present an upward trend in the metric, with about 35 percentage points separating the highest country (the United States) from the bottom country (Belgium).
| Country | 2010 | 2011 | 2012 | 2013 | 2014 | 2015 | 2016 | 2017 | 2018 | 2019 | 2020 | 2021 |
|---|---|---|---|---|---|---|---|---|---|---|---|---|
| Australia | 59% | 60% | 61% | 64% | 67% | 67% | 68% | 69% | 71% | 70% | 72% | 73% |
| Belgium | 50% | 54% | 55% | 57% | 57% | 58% | 57% | 58% | 57% | 59% | 60% | 60% |
| Canada | 78% | 79% | 80% | 81% | 82% | 82% | 81% | 82% | 83% | 84% | 83% | 83% |
| France | 59% | 61% | 62% | 64% | 64% | 67% | 66% | 68% | 69% | 71% | 72% | 72% |
| Germany | 76% | 77% | 78% | 80% | 81% | 80% | 80% | 80% | 81% | 82% | 84% | 84% |
| Italy | 59% | 60% | 62% | 65% | 65% | 66% | 67% | 67% | 68% | 70% | 71% | 71% |
| Japan | 73% | 72% | 73% | 74% | 74% | 74% | 74% | 75% | 76% | 76% | 78% | 77% |
| Netherlands | 67% | 69% | 73% | 73% | 74% | 74% | 74% | 76% | 77% | 79% | 80% | 80% |
| Norway | 56% | 56% | 58% | 59% | 59% | 61% | 61% | 61% | 64% | 66% | 67% | 67% |
| Spain | 61% | 61% | 63% | 65% | 67% | 67% | 67% | 68% | 68% | 71% | 72% | 73% |
| Sweden | 53% | 56% | 59% | 62% | 65% | 66% | 66% | 67% | 70% | 73% | 73% | 73% |
| United Kingdom | 74% | 78% | 77% | 78% | 80% | 80% | 80% | 82% | 82% | 84% | 85% | 84% |
| United States | 88% | 89% | 91% | 92% | 92% | 93% | 93% | 94% | 94% | 95% | 95% | 95% |
| International median | 61% | 61% | 63% | 65% | 67% | 67% | 68% | 69% | 71% | 73% | 73% | 73% |
Data source: MIDAS® database, 2010-2021, IQVIA (all rights reserved).
2. Between 2010 and 2021, most countries saw more companies selling generics and more drugs with competing generics
Eleven of the 13 countries studied showed an increase in the number of companies selling 25+ generics (Table 1).
Belgium stood out with 5 fewer generic companies in 2021 than in 2010, while the international median had 13 more companies.
Twelve of the 13 countries saw an increase in the percent of oral solid drugs for which at least 2 competing generics recorded sales (Table 2). The international median increased by 10 pp.
The US led both metrics, with 251 companies selling generics and 78% of its oral solids available in two or more generic variants in 2021.
Table 1: Generic companies
Distinct companies selling 25+ oral solid generics
| Country | 2010 | 2021 | Difference |
|---|---|---|---|
| United States | 108 | 151 | 43 |
| Germany | 99 | 105 | 6 |
| Italy | 92 | 103 | 11 |
| Spain | 85 | 85 | 0 |
| United Kingdom | 69 | 90 | 21 |
| Japan | 62 | 64 | 2 |
| France | 39 | 52 | 13 |
| Sweden | 39 | 52 | 13 |
| Canada | 33 | 41 | 8 |
| Norway | 33 | 42 | 9 |
| Netherlands | 32 | 38 | 6 |
| Belgium | 28 | 23 | -5 |
| Australia | 25 | 36 | 11 |
| International median | 39 | 52 | 13 |
Data source: MIDAS® database, 2010-2021, IQVIA (all rights reserved).
Note: Company names featuring suffixes and regional designations were truncated to avoid double counting (eg, "Teva Canada LTD" was replaced with "Teva").
Table 2: Generic competition
Proportion of oral solid drugs with generic versions available from multiple (2+) companies
| Country | 2010 | 2021 | Difference |
|---|---|---|---|
| United States | 70% | 78% | 8pp |
| United Kingdom | 56% | 64% | 8pp |
| Germany | 56% | 60% | 4pp |
| Japan | 54% | 57% | 3pp |
| Canada | 53% | 52% | -1pp |
| Netherlands | 49% | 61% | 12pp |
| Australia | 44% | 45% | 1pp |
| France | 42% | 54% | 13pp |
| Sweden | 36% | 54% | 18pp |
| Spain | 35% | 51% | 16pp |
| Italy | 35% | 48% | 14pp |
| Belgium | 33% | 36% | 3pp |
| Norway | 24% | 27% | 3pp |
| International median | 44% | 54% | 10pp |
Data source: MIDAS® database, 2010-2021, IQVIA (all rights reserved).
Note: An adjustment was made to Canada's 2010 data to prevent double counting of generic products for which the license was sold from Apotex Inc to AA Pharma Inc and recorded sales from both companies during the year ("Apotex, Largest Canadian", 2010).
3. Between 2010 and 2021, the generic share of sales grew in all countries, despite generic spending per person decreases in high-spending countries
In all countries investigated, the generic share of oral solid sales grew at a rapid pace between 2010 and 2021 (Table 3).
When adjusting for inflation, 5 of the 7 countries with the highest annual generic spending per capita in 2010 saw a decline in spending by 2021 (Figure 2). Meanwhile, countries with lower generic spending in 2010 saw an increase in spending.
The overall result was a shrinking of the cross-country standard deviation in spending, from $41 per capita in 2010 to $18 in 2021.
Table 3: Generic market share
Sales of generics as a percent of all oral solid drug sales
| Country | 2010 | 2021 | Difference |
|---|---|---|---|
| Canada | 47% | 62% | 15pp |
| Germany | 41% | 56% | 15pp |
| United Kingdom | 40% | 52% | 12pp |
| France | 33% | 59% | 27pp |
| Norway | 29% | 46% | 17pp |
| Netherlands | 28% | 70% | 42pp |
| United States | 27% | 44% | 17pp |
| Australia | 26% | 45% | 19pp |
| Belgium | 25% | 34% | 9pp |
| Sweden | 25% | 48% | 24pp |
| Spain | 25% | 40% | 15pp |
| Italy | 19% | 33% | 14pp |
| Japan | 7% | 35% | 27pp |
| International Median | 27% | 46% | 20pp |
Data sources: MIDAS® database, 2010-2021, IQVIA (all rights reserved).
Figure 2: Generic spending per capita
Sales of oral solid generics per person (2021 dollars)
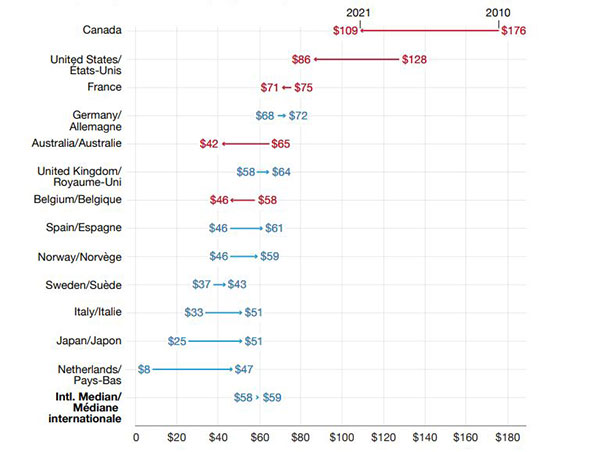
Figure 2 - Text version
An arrow plot shows the change in oral solid generic spending per capita between fiscal years 2010/11 and 2021/22, expressed in 2021 Canadian dollars. Values are given for Australia, Belgium, Canada, France, Germany, Italy, Japan, Netherlands, Norway, Spain, Sweden, the United Kingdom, and the United States. Three countries (Canada, the United States, and Australia) showed a decline in spending per capita, while the remaining 10 countries showed an increase in spending.
| Country | 2010 | 2021 |
|---|---|---|
| Canada | $176 | $109 |
| United States | $128 | $86 |
| France | $75 | $71 |
| Germany | $68 | $72 |
| Australia | $65 | $42 |
| United Kingdom | $58 | $64 |
| Belgium | $58 | $46 |
| Spain | $46 | $61 |
| Norway | $45 | $59 |
| Sweden | $37 | $43 |
| Italy | $33 | $51 |
| Japan | $25 | $51 |
| Netherlands | $8 | $47 |
| International median | $58 | $59 |
Data sources: MIDAS® database, 2010-2021, IQVIA (all rights reserved), OECD, US Bureau of Labor Statistics.
4. As of the beginning of the current decade, significant cross-country differences remained in generic availability, with smaller countries ranking lower in most metrics
In 2021, the US market featured 9 times more generic products than Norway’s and about three times more of its drugs had 2+ competing generics (Table 4).
The wide variance seen between countries likely reflects differences in market size, barriers to entry for generic companies, and pharmaceutical policy (e.g., generic switching policies and negotiated agreements).
Table 4: Generic indicators, 2021
Snapshot of international oral solid generic availability and sales at the beginning of the decade
| Countries | Generics | Generics per oral solid medication | Oral solids with generics | Oral solids with 2+ competing generics | Generic companies | Generic companies per 1 million people | Generic sales (millions of dollars) | Generic sales per person (dollars) | Generic share of sales |
|---|---|---|---|---|---|---|---|---|---|
United States |
12,851 |
6.6 |
95% |
78% |
151 |
0.5 |
28,511 |
86 |
44% |
Germany |
9,425 |
5.4 |
84% |
60% |
105 |
1.3 |
5,980 |
72 |
56% |
Spain |
6,849 |
5.3 |
73% |
51% |
85 |
1.8 |
2,909 |
61 |
40% |
Japan |
6,564 |
5.8 |
77% |
57% |
64 |
0.5 |
6,426 |
51 |
35% |
United Kingdom |
6,038 |
3.8 |
84% |
64% |
90 |
1.3 |
4,333 |
64 |
52% |
France |
5,603 |
4.5 |
72% |
54% |
52 |
0.8 |
4,781 |
71 |
59% |
Italy |
5,284 |
4.0 |
71% |
48% |
103 |
1.7 |
3,025 |
51 |
33% |
Canada |
4,365 |
3.4 |
83% |
52% |
41 |
1.1 |
4,177 |
109 |
62% |
Netherlands |
3,484 |
2.8 |
80% |
61% |
38 |
2.2 |
829 |
47 |
70% |
Sweden |
3,021 |
3.0 |
73% |
54% |
52 |
5.0 |
447 |
43 |
48% |
Australia |
2,680 |
2.5 |
73% |
45% |
36 |
1.4 |
1,075 |
42 |
45% |
Belgium |
1,754 |
1.6 |
60% |
36% |
23 |
2.0 |
537 |
46 |
34% |
Norway |
1,356 |
1.1 |
67% |
27% |
42 |
7.8 |
319 |
59 |
46% |
International Median |
5,284 |
3.8 |
73% |
54% |
52 |
1.4 |
3,025 |
59 |
46% |
Data sources: MIDAS® database, 2021, IQVIA (all rights reserved), OECD, US Bureau of Labor Statistics.
Conclusions
Between 2010 and 2021, there was a marked improvement in generic availability and competition metrics in most countries analyzed. For the majority of metrics surveyed, the US ranked favorably relative to other countries, showing greater than median generic availability, competition, and sales.
Despite these international improvements, most countries continued to feature only one or no generic offering for at least 40% of oral solids in 2021, placing patients using these drugs at risk of going without treatment when drug shortages take place. Countries aiming to further improve generic competition and reduce these risks may need to carefully balance competing policy goals, such as ensuring the sustainability of pharmaceutical spending. However, the concurrent decline in spending per capita of high-spending countries and competition improvements in most of these countries since 2010 show that an increase in generic availability and competition may not necessitate higher spending.
Limitations
Generic company counts did not group subsidiary companies with their parent companies except for cases where the source data identified the subsidiary status in the company’s name. Patent protection timelines may differ by country, such that a drug is counted in the denominator of some countries in Figures 1 and 2 (oral solids with sales) while still under patent protection in that country.
References
- Apotex, Largest Canadian Owned Pharmaceutical Company Sells Group of Products to AA Pharma Inc (Aug. 3, 2010). Fierce Pharma. Retrieved from: https://www.fiercepharma.com/pharma/apotex-largest-canadian-owned-pharmaceutical-company-sells-group-of-products-to-aa-pharma.
- Patented Medicine Prices Review Board. (2022). Drug Shortages in Canada and their Impact on Public Drug Plans, 2017/18 to 2019/20. Ottawa: PMPRB.
- US Food and Drug Administration (2019). Drug Shortages: Root Causes and Potential Solutions. Retrieved from: https://www.fda.gov/drugs/drug-shortages/report-drug-shortages-root-causes-and-potential-solutions.