
Private Drug Plans in Canada: Expenditure Report, 2018–2023
February 2025
ISBN 978-0-660-74770-5
Cat. No.: H82-55/2025E-PDF
Table of Contents
- Executive Summary
- Introduction
- Methods
- Limitations
- Analyses
- Section 1
Trends in Prescription Drug Expenditures, 2018 to 2023 - Section 2
The Drivers of Drug Costs, 2018 to 2023 - Section 3
Private Drug Plan Management - Appendix A
Annual Drug Cost Trends by Therapeutic Class - Appendix B
Utilization Comparison: Private Drug Plans (Excluding Quebec) versus NPDUIS Public Drug Plans - Appendix C
Plan Sponsor Size and High-Cost Drug Use - Appendix D
50 Top-Selling Medicines (Most Utilized Molecule/Strength/Form) by Drug Cost Share, Private Drug Plans, 2023 (%)
About the PMPRB
The Patented Medicine Prices Review Board (PMPRB) protects and informs Canadian consumers by reviewing the prices of patented medicines sold in Canada, and by reporting on pharmaceutical trends. The PMPRB is an independent quasi-judicial body that is part of the Health portfolio, and operates at arm’s-length from the Minister of Health.
The NPDUIS research initiative
The National Prescription Drug Utilization Information System (NPDUIS) research initiative was established by federal, provincial, and territorial Ministers of Health in September 2001. It is a partnership between the PMPRB and the Canadian Institute for Health Information (CIHI).
Pursuant to section 90 of the Patent Act, the PMPRB has the mandate to conduct analysis that provides decision makers with critical information and intelligence on price, utilization, and cost trends so that Canada’s healthcare system has more comprehensive and accurate information on how medicines are being used and on sources of cost pressures.
The specific research priorities and methodologies for the NPDUIS research initiative are established with the guidance of the NPDUIS Advisory Committee and reflect the priorities of the participating jurisdictions, as identified in the NPDUIS Research Initiative Agenda. The Advisory Committee is composed of representatives from public drug plans in British Columbia, Alberta, Saskatchewan, Manitoba, Ontario, New Brunswick, Nova Scotia, Prince Edward Island, Newfoundland and Labrador, Yukon, the Non-Insured Health Benefits (NIHB) Program, and Health Canada. It also includes observers from CIHI, Canada’s Drug Agency (CDA-AMC), the Ministère de la Santé et des Services sociaux du Québec (MSSS), and the pan-Canadian Pharmaceutical Alliance (pCPA) Office.
Acknowledgements
This report was prepared by the Patented Medicine Prices Review Board (PMPRB) as part of the National Prescription Drug Utilization Information System (NPDUIS) research initiative.
The PMPRB wishes to acknowledge the members of the NPDUIS Advisory Committee for their expert oversight and guidance in the preparation of this report. Please note that the statements and findings for this report do not necessarily reflect those of the members or their organizations.
Appreciation goes to Yvonne Zhang for leading this project, and to Kevin Pothier, Dianne Breau, and Brian O’Shea for their oversight in the development of the report. The PMPRB also wishes to acknowledge the contributions of Jun Yu and Lokanadha Cheruvu to the analysis and the editorial contributions of Shirin Paynter.
Disclaimer
The NPDUIS research initiative operates independently of the regulatory activities of the Board of the PMPRB. The research priorities, data, statements, and opinions expressed or reflected in NPDUIS reports do not represent the position of the PMPRB with respect to any regulatory matter. NPDUIS reports do not contain information that is confidential or privileged under sections 87 and 88 of the Patent Act, and the mention of a medicine in an NPDUIS report is not and should not be understood as an admission or denial that the medicine is subject to filings under sections 80, 81, or 82 of the Patent Act or that its price is or is not excessive under section 85 of the Patent Act.
Although based in part on data obtained under license from the IQVIA™ Private Pay Direct Drug Plan Database and from the Canadian Institute for Health Information (CIHI), the statements, findings, conclusions, views, and opinions expressed in this report are exclusively those of the PMPRB and are not attributable to IQVIA or CIHI.
Suggested Citation
Patented Medicine Prices Review Board. (2025). Private Drug Plans in Canada: Expenditure Report, 2018–2023. Ottawa: PMPRB.
Executive Summary
This report provides a comprehensive analysis of trends in prescription drug expenditures from the perspective of Canadian private drug plans. From 2018 to 2023, private pay-direct drug plans experienced a compound annual growth rate of 7.1%, with a significant 12.9% increase in 2023. This growth in 2023 was uneven across its two main components: drug costs (which saw an increase of 14.1%) and dispensing costs (which saw an increase of 4.5%). Over past years, rising expenditures in private plans were consistently driven primarily by significant increases in the use of newer and higher-cost drugs. A comparative analysis with Canadian public drug plans is also included in the report.
The PMPRB’s Private Drug Plans in Canada series monitors and analyzes the cost pressures driving changes in prescription drug expenditures in Canadian private drug plans. This edition of Private Drug Plans in Canada: Expenditure Report provides insight into the factors driving growth in prescription drug costs in 2023, as well as a retrospective review of trends in private drug plan costs and utilization since 2018.
The main data source for this report is the IQVIA™ Private Pay Direct Drug Plan Database. The results for private plans are compared with select public drug plans in the National Prescription Drug Utilization Information System (NPDUIS) Database at the Canadian Institute for Health Information (CIHI).
Key Findings
The key findings cover the three areas of analysis in Private Drug Plans in Canada: Expenditure Report (see Analyses): the trends in prescription drug expenditures; the drivers of drug costs; and plan management.
Prescription drug expenditures
Prescription drug expenditures for private plans rose by 12.9% in 2023, returning to the pre-pandemic growth trend.
- Between 2018 and 2023, prescription drug expenditures in private drug plans grew at a compound annual growth rate of 7.1%.
- Drug costs, accounting for 88% of prescription drug expenditures, increased by 14.1% from 2022 to 2023, while dispensing costs, representing the remaining 12%, grew by 4.5%. Private insurers typically covered 88% of the total prescription costs, leaving beneficiaries responsible for the remaining 12%.
- Over the decade spanning 2013–2023, drug costs showed the fastest growth among drug utilization measures, rising by 92% and outpacing growth in the number of claimants (30%) and claims (39%).
- Claimants aged 25–64 made up 66% of the private drug plan population, but accounted for 77% of drug costs in 2023, mainly due to higher annual treatment costs per claimant. Males consistently incurred higher treatment costs than females within their respective age groups, though more females made claims.
Drug costs
Drug costs jumped by 14.1% in 2023, rebounding from three years of moderate increases (4–5%) during the pandemic.
- The primary driver was the increased use of higher-cost medicines (the drug-mix effect), averaging 6.3% over the six years from 2018 to 2023 and peaking at 9.2% in 2023.
- By 2023, medicines costing over $10,000 and $25,000 annually represented one third and one sixth of total drug costs, respectively. Though a growing number of these high-cost drugs were reimbursed by private plans, they were used by only 1.5% and 0.4% of claimants, respectively. Notably, the top 5% high-cost claimants accounted for nearly two thirds of total drug costs in private plans.
- Cost-mitigating measures, including generic and biosimilar substitutions and price reductions, decreased costs by 1% to 4% annually. In 2023, the substitution effect gained traction, pulling costs down (-2.0%), while price change had a minimal impact (0.5%).
- The impact of demographics and associated claim changes fluctuated between -3% and 7%. In 2023, a significant rebound in the number of claimants resulted in an upward 8.9% demographic push effect, while a slower growth in drug use per claimant led to a -1.9% pull-down effect.
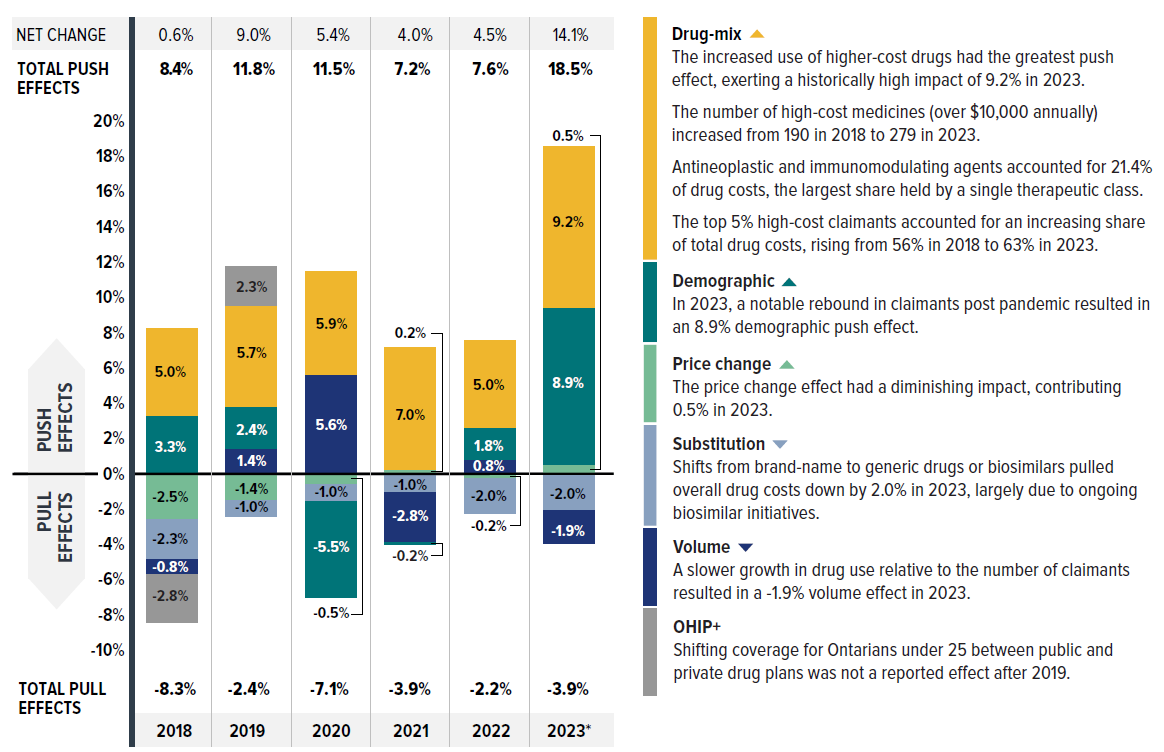
Figure description
| 2018 | 2019 | 2020 | 2021 | 2022 | 2023 | |
| Drug-mix | 5.0% | 5.7% | 5.9% | 7.0% | 5.0% | 9.2% |
|---|---|---|---|---|---|---|
| Demographic | 3.3% | 2.4% | -5.5% | -0.2% | 1.8% | 8.9% |
| Price change | -2.5% | -1.4% | -0.5% | 0.2% | -0.2% | 0.5% |
| Volume | -0.8% | 1.4% | 5.6% | -2.8% | 0.8% | -1.9% |
| Substitution | -2.3% | -1.0% | -1.0% | -1.0% | -2.0% | -2.0% |
| OHIP+ | -2.8% | 2.3% | - | - | - | - |
| Total push effects | 8.4% | 11.8% | 11.5% | 7.2% | 7.6% | 18.5% |
| Total pull effects | -8.3% | -2.4% | -7.1% | -3.9% | -2.2% | -3.9% |
| Net change | 0.6% | 9.0% | 5.4% | 4.0% | 4.5% | 14.1% |
| Drug-mix |
|
|---|---|
| Demographic |
|
| Price change |
|
| Volume |
|
| Substitution |
|
| OHIP+ |
|
Note: This analysis is based on publicly available pricing information. It does not reflect any rebates, price discounts or confidential agreements that may affect the actual costs.
Values may not add to totals due to rounding and the cross effect.
*The 2023 demographic effect is based on projected claimant data to adjust for claimant double counting in the raw data.
Data source: IQVIA™ Private Pay Direct Drug Plan Database (capture rate: 79.9% to 85.7% of the private pay-direct market in Canada, varying by year).
Plan management
Private drug plans typically reimburse prescriptions with a longer days’ supply than NPDUIS public plans, with claimants making fewer claims and incurring lower costs annually. However, claimants pay more out-of-pocket costs than active beneficiaries in public plans.
- Private drug plans typically reimbursed larger prescription sizes, with an average 37-day supply per claim versus 25 days in NPDUIS public drug plans, leading to lower dispensing costs and share. This suggests that extending days’ supply where appropriate could reduce fill frequency and generate savings from lower dispensing costs.
- Private drug plans reimbursed 84% of new active substances (NAS) approved during the 2017–2022 period by 2023, with approximately 80% of NAS receiving coverage within one year post-market approval. For the same cohort and timeframe, 55% of NAS were listed in at least one public plan, reflecting distinct differences in reimbursement pathways.
- About 1.1% of private drug plan claimants incurred annual prescription costs over $10,000, compared to 3.3% in NPDUIS public plans; however, the high-cost beneficiaries in private drug plans paid a greater out-of-pocket share and amount than those in public plans.
- In 2023, small plan sponsors (fewer than 50 claimants) made up 68% of plan sponsors, while large plans (more than 1,000 claimants) represented only 8% of plans but accounted for 90% of claimants and 89% of total drug costs. Notably, medium-sized plans often incurred higher annual drug costs per claimant.
Introduction
Prescription drugs in Canada, when used outside the hospital setting, are covered through a combination of public drug plans (42%), private insurers (38%) and out-of-pocket by households and individuals (20%) as shown in Figure 0.1. The Canadian Institute for Health Information (CIHI) reported that the total cost of prescription drugs in Canada reached $42.1 billion in 2023. Private insurance represents the second-largest market, accounting for an estimated 38% of prescribed drug spending, or $15.8 billion. This is just 4.7% less, or $2.0 billion lower than the largest payer, the public sector. Despite public funding being the primary source of coverage in terms of expenditures, a great number of Canadians are covered by private insurers,Footnote I with 64% of the population (25 million people) enrolled in private drug plans.Footnote II As key stakeholders in the healthcare system, private drug plans play an important role in drug reimbursement in Canada and drug plan costs are a major concern for plan sponsors.
This report delves into the expenditures of private drug plans in 2023, with a retrospective look at trends back to 2018. The findings of this study will aid stakeholders in anticipating and responding to the evolving cost pressures that affect Canada’s private drug plans. This report adopts a format similar to the CompassRx report, serving as a resource for insights into drug plan expenditure trends.
The report is organized into three main sections. Section 1 presents the overall trends in prescription drug expenditures in private drug plans, including demographic considerations such as age and gender. Section 2 offers detailed insights into the factors driving drug costs within private plans, with a focus on high-cost drugs and cost implications. Section 3 discusses the management of private drug plans, featuring comparisons with NPDUIS public plans and highlighting areas where further research is needed.
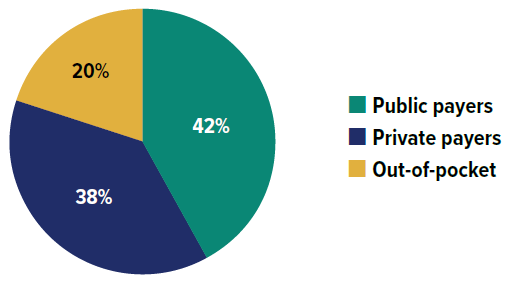
Figure description
| Source of finance | Share of prescription drug expenditures |
|---|---|
| Public payers | 42% |
| Private payers | 38% |
| Out-of-pocket | 20% |
Data source: Canadian Institute for Health Information. National Health Expenditure Trends, 2024: Data Tables — Series G.
Ottawa, ON: CIHI; 2024. Accessed November 2024.
Backgrounder: Private Drug Plans in Canada
Private drug plans play an important role in drug reimbursement in Canada and are key stakeholders in the healthcare system.
Prescription drug costs in Canada are covered by a blend of public and private drug plans, as well as out-of-pocket payers. While all provinces and territories provide prescription drug coverage to specific population groups (typically seniors, lower-income earners or those with high drug costs in relation to their income), for the most part, private drug plans cover working-age beneficiaries and their dependants.
Drug coverage is only one component of the privately delivered supplementary health benefits, which also include hospital accommodation, vision care, travel insurance, paramedical services and dental care. Employers balance all their benefits to attract and retain employees, as well as to ensure a healthy and productive workforce.
Canadians can purchase private insurance directly or they can receive coverage through their employer benefits package (the more usual option). Employers can choose different coverage structures: (i) fully insured—the risk rests with the insurer; (ii) administrative services only (A.S.O.)—the risk rests with the employer; or (iii) hybrid plans—insurer and employer share the risk.
Private plans may cover all prescription drugs or operate with a defined formulary. Cost sharing structures take the form of co-insurance, co-payments, deductibles, and maximums. Recent concerns over the long-term sustainability of private plans in Canada have resulted in an increased use of cost management mechanisms, such as mandatory generic substitution, greater use of managed formularies, prior authorization and multi-tiering (promoting the use of more cost-effective medicines), preferred pharmacy networks, increased cost sharing, pooling of high-cost beneficiaries and the elimination of retiree benefits, among others.
The data reported in this study pertains to a large sample of Canadian private pay-direct drug plans, covering 167 million prescriptions and $13.5 billion in total prescription cost (drug cost, markup and dispensing fees) in 2023.
Methods
The main data source for this report is the IQVIA™ Private Pay Direct Drug Plan Database,Footnote III including prescription claim-level data collected from a large sample of Canadian pay-direct private drug plans. All Canadian provinces are included in this dataset. This data is used to report on results at the national and provincial levels for the private drug plans for the calendar years 2018 through 2023.
Analysis values in Section 1 are primarily extrapolated to represent 100% of the private pay-direct market to provide a comprehensive view of market dynamics; specific figures with exceptions to this approach are flagged accordingly. Section 2 and 3 present analyses in actual values, to allow for more targeted and in-depth study. Variations in capture rates over the study period may result in inconsistencies in the growth rates given in Sections 1 and 2, notably in the drug cost drivers analysis. However, any deviations due to these capture rate differences are generally incorporated into the demographic and volume effects.
Due to substantial differences in the sizes of private drug plans, direct reporting of absolute prescription drug expenditures may not yield meaningful insights for individual plan sponsors. To facilitate a more equitable comparison across different contexts, values were standardized to an average plan size of 1,000 claimants where applicable. This approach allows for more consistent and comparable analysis of prescription drug expenditures across various provinces and plan sizes.
The report also analyzes information contained in the National Prescription Drug Utilization Information System (NPDUIS) Database, developed by the Canadian Institute for Health Information (CIHI). This database houses pan-Canadian information on public drug programs, including claims-level data collected from the plans that participate in the NPDUIS initiative. Results are restricted to the public drug plans whose data was available at the time of the study: British Columbia, Alberta, Saskatchewan, Manitoba, Ontario, New Brunswick, Nova Scotia, Prince Edward Island, Newfoundland and Labrador and Yukon.
Terms and definitions of this report largely align with the equivalent concepts in the CompassRx report. The primary distinction is that private drug plan data were available by calendar year (January to December), while NPDUIS public drug plan annual data were aggregated by fiscal year (April to March). Note that the terms “claimants” and “active beneficiaries” both refer to individuals with at least one prescription drug claim accepted for reimbursement, with “claimants” used primarily for private plans and “active beneficiaries” aligning with public plan terminology.
The report analyzes various measures of costs. Drug costs include the cost of the drug and markup accepted for reimbursement by the private or public plans analyzed, excluding the dispensing costs. The prescription cost includes all cost components associated with a prescription—drug costs with associated markups and dispensing costs, reflecting both plan-paid and patient-paid portions.
The analysis of drug cost drivers follows the methodological approach detailed in the PMPRB’s The Drivers of Prescription Drug Expenditures: A Methodological Report.Footnote IV Analysis of the average cost per unit in Section 2 is restricted to oral solid drugs due to the inconsistency in unit reporting for other types of formulations (e.g., inhalers, infusions, etc.). The therapeutic classification used in the analysis is based on the World Health Organization Anatomical Therapeutic Chemical Classification System (ATC). Vaccines and pharmaceutical services are generally not represented in this report.
A glossary of terms for NPDUIS studies is available on the PMPRB website.
Limitations
The IQVIA™ Private Pay Direct Drug Plan Database sources data from pay-direct private insurers in Canada. While each supplier’s data is complete, not all Canadian insurers are included in this database. In Section 1, values are extrapolated to represent 100% of the private pay-direct market, based on the annual national capture rates, though provincial capture rates vary across Canada.
Private drug plan data covers all provinces; however, NPDUIS public drug plan data is available for all provinces except Quebec. While private drug plan data is reported by calendar year, NPDUIS public drug plan annual data is aggregated by fiscal year. Consequently, comparisons of utilization and cost metrics between private drug plans and NPDUIS public plans represent a snapshot of the respective plan types.
In the relevant comparisons, NPDUIS public drug plan data only includes beneficiaries that met their deductible and received public reimbursement. Once identified, all claims associated with these beneficiaries within a given year were included in this analysis. In contrast, private drug plans may account for claims with expenditures counted as deductibles paid before beneficiaries are eligible for public coverage. This is particularly relevant for provinces with a universal plan approach, such as British Columbia, Saskatchewan, and Manitoba. For lower-cost beneficiaries who did not reach their required deductible, and thus were not eligible for public plan coverage in a given year, drug utilization is captured only in private plans or as out-of-pocket expenses. Consequently, NPDUIS public plan results may reflect a skew towards higher‑cost beneficiaries.
Private-to-private coordination of benefits (COB) claims were excluded per IQVIA’s standard data rules to avoid overcounting claims submitted to a second private plan solely as a COB benefit. However, for private-to-public coordination, private drug plan data may reflect incomplete utilization and costs for claimants, namely seniors (65+), who coordinate with publicly reimbursed benefits.
The study accesses the database at an aggregated level, which may result in a slight skew towards females. This limitation is due to the unfeasibility of excluding cohorts of female claimants included solely due to claims for oral contraceptives. Additionally, the 2023 claimant count was adjusted to correct for double counting in the raw data.
The results presented may vary by province and plan partly due to differences in the demographic and disease profiles of the active beneficiary populations. The variation in the availability of specific sub-plans in the public data also limits the comparability of the results across plans.
Reported dollar amounts represent nominal spending, and are not adjusted for inflation. The drug costs reflect the amounts accepted toward reimbursement by the drug plans, which may differ from the actual amounts paid by the plan or program. Additionally, these costs do not account for any rebates, price discounts or confidential agreements that may affect the final expenditures.
This report includes data up to and including the year 2023.
Analyses
The components that make up prescription drug expenditures can be expressed from two perspectives: cost-sharing and pharmaceutical.
From a pharmaceutical pricing perspective, the cost of a prescription drug plan in this section is measured by the total of two components: the cost of the prescription drugs (including associated markups) and the cost for dispensing the prescription drugs, represented by this formula:
From a cost-sharing perspective, the expenditures reported in this study represent the total amount accepted for reimbursement by the private drug plans. These amounts reflect both the plan-paid and beneficiary-paid portions of the prescription costs, such as co-payments and deductibles, represented by this formula:
The following sections explore both perspectives but emphasize the two pharmaceutical pricing perspective components—drug costs and dispensing costs—by analyzing data trends and adding greater context in the form of Brief Insights.
Section 1: Trends in Prescription Drug Expenditures, 2018 to 2023
Prescription drug expenditures for private plans increased by 12.9% in 2023, returning to the pre-pandemic growth trend of 2019. That year saw an 8.8% increase before the onset of the COVID-19 pandemic in 2020. Despite dynamic factors such as the pandemic, the increased use of higher-cost medicines has consistently been the most significant contributor to growth in private drug plans.
Quick Reference: Section 1
The IQVIA™ Private Pay Direct Drug Plan Database houses private drug plan administrative data obtained from pay-direct private insurers. While each supplier’s data is complete, not all Canadian insurers are included in this database and coverage varies across provinces.
Analysis values in this section are primarily extrapolated to represent 100% of the private pay-direct market to provide a comprehensive view of market dynamics; specific figures with exceptions to this approach are flagged accordingly.
Due to substantial differences in the sizes of private drug plans, direct reporting of absolute prescription drug expenditures may not yield meaningful insights for individual plan sponsors. To facilitate a more equitable comparison across different contexts, values were standardized to per average plan of 1,000 claimants where applicable. This approach allows for a more consistent and comparable analysis of prescription drug expenditures across various provinces and plan sizes.
Prescription drug expenditures
Between 2018 and 2023, annual prescription drug expenditures for private drug plans grew at a compound annual growth rate (CAGR) of 7.1%. The period from 2018 to 2019, which involved shifting coverage for Ontarians under the age of 25Footnote V between public and private drug plans, contributed to a modest 4.2% growth for private drug plans in 2018 followed by a more substantial increase of 8.8% in 2019. From 2020 to 2022, growth slowed due to the COVID-19 pandemic, with annual increases ranging from 4.4% to 6.7%. However, in 2023, spending levels jumped by 12.9%, fully rebounding to the pre-pandemic growth trend as though uninterrupted (Figure 1.1).
The overall growth in expenditures in 2023 consists of a disparity in the rates of growth between components, with a 14.1% growth in drug costs (including associated markups) and a 4.5% increase in dispensing costs. The drug cost component captured a significantly greater share of overall expenditures at 88%, while dispensing costs represented a modest 12%.
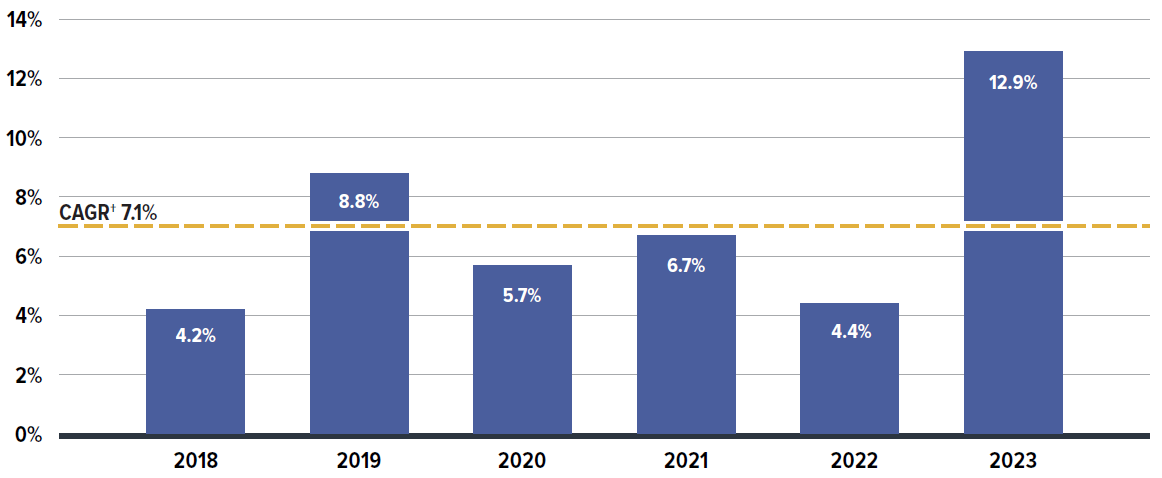
Figure description
| Annual rate of change | Compound annual growth rate | |
|---|---|---|
| 2018 | 4.2% | 7.1% |
| 2019 | 8.8% | |
| 2020 | 5.7% | |
| 2021 | 6.7% | |
| 2022 | 4.4% | |
| 2023 | 12.9% |
* Results are based on values extrapolated from the IQVIA™ Private Pay Direct Drug Plan database to represent 100% of the private pay-direct market in Canada.
† Compound annual growth rate.
Data source: IQVIA™ Private Pay Direct Drug Plan Database.
The expenditures reflect both the plan-paid portions of prescription costs and the beneficiary-paid portions, such as co-payments and deductibles.
Beneficiary share of prescription drug expenditures
In 2023, private drug plans paid an average of 88% of the total expenditures for prescription drugs eligible for reimbursement, with the remaining 12% paid by the beneficiaries. The details of plan eligibility and cost-sharing mechanisms will be further explored in Section 3.
Prescription drug utilization trends
While the primary focus of this report is on the six-year period from 2018 to 2023, Figure 1.2 offers a longer historical perspective, extending the timeline back to 2013. It continues from the period analyzed in the PMPRB report Private Drug Plans in Canada – Part 1: Generic Market 2005–2013. The expanded timeline involved several waves of generic pricing reforms initiated by the pan-Canadian Pharmaceutical Alliance (pCPA) starting in April 2013. The pCPA generic pricing polices were transparent and, although only intended for public drug plans, were also adopted by many private drug plans.
Over this decade, drug costs showed the strongest growth among all drug utilization measures. The drug cost component (including associated markups) of prescription drug expenditures rose by 92%, nearly doubling between 2013 to 2023. Drug costs grew at almost twice the pace of dispensing costs, which increased by 51%. Moreover, the growth in drug costs outpaced the rise in the number of claimants (30%) and claims (39%) in private drug plans. Further insights into the growth trends of drug costs, claimants, and claims in recent years (2018 onward) are provided in Section 2.
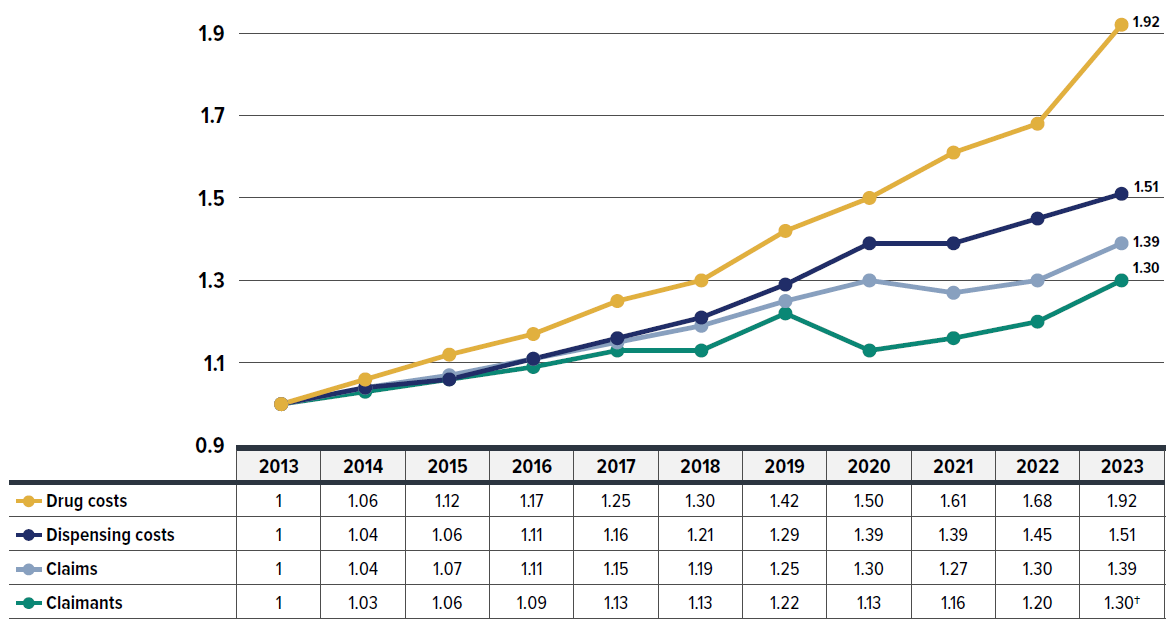
Figure description
| 2013 | 2014 | 2015 | 2016 | 2017 | 2018 | 2019 | 2020 | 2021 | 2022 | 2023 | |
|---|---|---|---|---|---|---|---|---|---|---|---|
| Drug costs | 1 | 1.06 | 1.12 | 1.17 | 1.25 | 1.30 | 1.42 | 1.50 | 1.61 | 1.68 | 1.92 |
| Dispensing costs | 1 | 1.04 | 1.06 | 1.11 | 1.16 | 1.21 | 1.29 | 1.39 | 1.39 | 1.45 | 1.51 |
| Claims | 1 | 1.04 | 1.07 | 1.11 | 1.15 | 1.19 | 1.25 | 1.30 | 1.27 | 1.30 | 1.39 |
| Claimants | 1 | 1.03 | 1.06 | 1.09 | 1.13 | 1.13 | 1.22 | 1.13 | 1.16 | 1.20 | 1.30 |
* Results are based on values extrapolated from the IQVIA™ Private Pay Direct Drug Plan Database to represent 100% of the private pay-direct market in Canada.
† The 2023 value is projected to adjust for the claimant double counting involved in the raw data. Data source: IQVIA™ Private Pay Direct Drug Plan Database.
Data source: IQVIA™ Private Pay Direct Drug Plan Database.
Prescription drug expenditures by province and demographic breakdown
The annual growth in prescription expenditures is influenced by factors such as the number of active beneficiaries and their associated drug costs. Given the significant variation in private drug plan sizes, direct reporting of absolute prescription drug expenditures may not yield meaningful insights for individual plan sponsors. For a more equitable comparison, Figure 1.3 presents an overview of prescription drug expenditures, standardized per plan of 1,000 claimants for 2023, across different provinces.
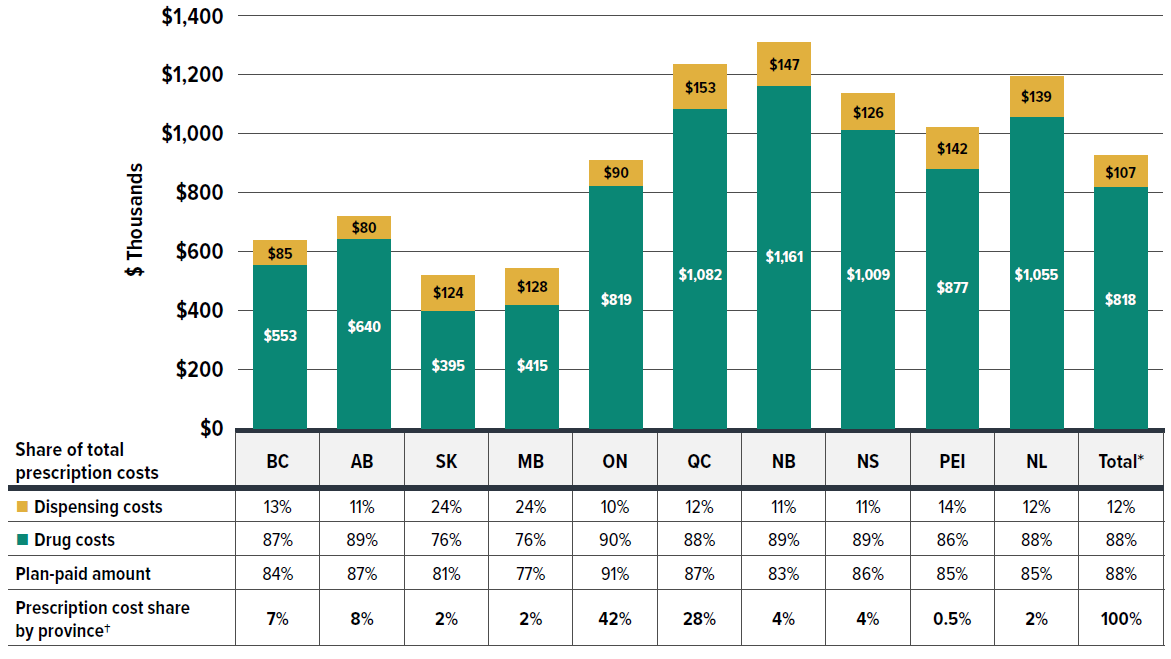
Figure description
| Drug costs (in thousands of dollars) | Drug costs’ share of total prescription costs | Dispensing costs (in thousands of dollars) | Dispensing costs’ share of total prescription costs | Plan-paid amount | Prescription cost share by province† | |
|---|---|---|---|---|---|---|
| British Columbia | $553 | 87% | $85 | 13% | 84% | 7% |
| Alberta | $640 | 89% | $80 | 11% | 87% | 8% |
| Saskatchewan | $395 | 76% | $124 | 24% | 81% | 2% |
| Manitoba | $415 | 76% | $128 | 24% | 77% | 2% |
| Ontario | $819 | 90% | $90 | 10% | 91% | 42% |
| Québec | $1,082 | 88% | $153 | 12% | 87% | 28% |
| New Brunswick | $1,161 | 89% | $147 | 11% | 83% | 4% |
| Nova Scotia | $1,009 | 89% | $126 | 11% | 86% | 4% |
| Prince Edward Island | $877 | 86% | $142 | 14% | 85% | 0.5% |
| Newfoundland and Labrador | $1,055 | 88% | $139 | 12% | 85% | |
| Total* | $818 | 88% | $107 | 12% | 88% | 100% |
* The total includes a small amount of data beyond the 10 provinces displayed, including claims from territories and those with unknown geographic information in the data, which collectively account for less than 1% of the total prescription costs.
† The share reflects the data captured in the IQVIA™ Private Pay Direct Drug Plan Database. It may not indicate the exact private plan drug spending distribution by province due to differences in capture rates.
Data source: IQVIA™ Private Pay Direct Drug Plan Database.
In 2023, private drug plans paid an average of 88% of total prescription drug expenditures, similar to the plan-paid share observed in NPDUIS public plans. However, this share varied across jurisdictions. For private plans as a whole, drug costs accounted for 88% of total expenditures, while dispensing costs represented 12%.
Private drug plans in Ontario accounted for the largest share of overall expenditures at 42%, followed by Quebec at 28%. Prescription drug expenditures per plan of 1,000 claimants ranged from $519,700 in Saskatchewan to $1,307,800 in New Brunswick. These significant provincial variations can be attributed to different policy approaches, such as universal versus population-defined drug coverage, leading to a unique mix of public and private plans in each province.
Provinces with a universal plan approach, such as British Columbia, Saskatchewan, and Manitoba, typically showed lower costs per claimant, possibly due to deductibles before eligibility for public coverage being counted into expenditures covered by private plans. While New Brunswick showed higher prescription costs per claimant, this was likely driven by higher-cost seniors covered by private plans as the first payer. For further analysis distinguishing seniors and non-seniors, refer to Figure 1.5 later in this section.
Beneficiary demographics have a strong influence on the growth of prescription drug costs. Figure 1.4 illustrates the impact of demographic factors such as age and sex on spending patterns in private drug plans.
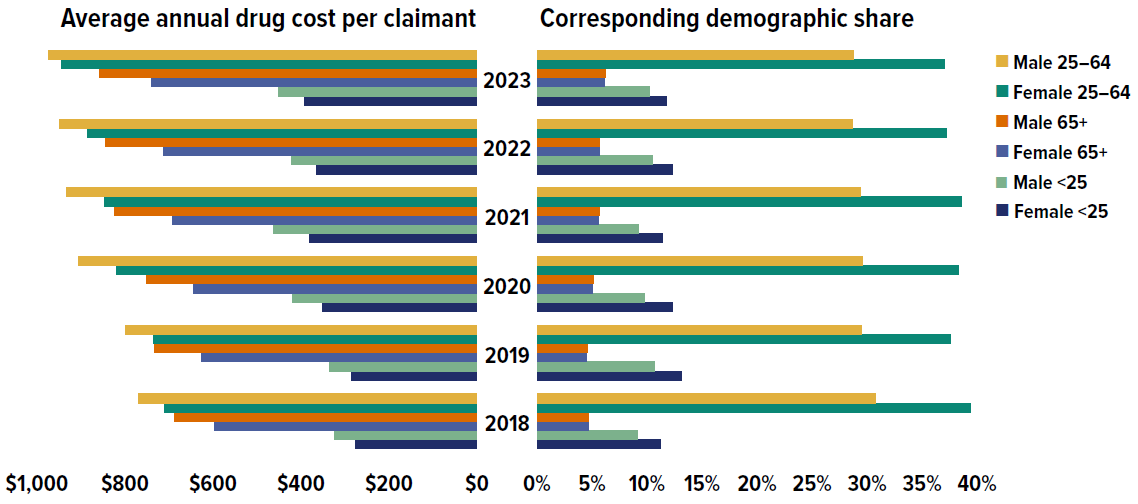
Figure description
| Average annual drug cost per claimant | Female under 25 | Male under 25 | Female 25 to 64 | Male 25 to 64 | Female 65 and over | Male 65 and over |
|---|---|---|---|---|---|---|
| 2018 | $275 | $323 | $709 | $769 | $596 | $688 |
| 2019 | $286 | $336 | $736 | $799 | $627 | $733 |
| 2020 | $350 | $420 | $820 | $905 | $643 | $750 |
| 2021 | $381 | $462 | $846 | $932 | $691 | $824 |
| 2022 | $364 | $422 | $884 | $949 | $712 | $845 |
| 2023 | $391 | $452 | $945 | $974 | $740 | $858 |
| Demographic share of claimants | Female under 25 | Male under 25 | Female 25 to 64 | Male 25 to 64 | Female 65 and over | Male 65 and over |
|---|---|---|---|---|---|---|
| 2018 | 11.2% | 9.1% | 39.4% | 30.8% | 4.7% | 4.7% |
| 2019 | 13.1% | 10.7% | 37.6% | 29.5% | 4.5% | 4.6% |
| 2020 | 12.3% | 9.8% | 38.3% | 29.6% | 5.0% | 5.1% |
| 2021 | 11.4% | 9.2% | 38.6% | 29.4% | 5.6% | 5.7% |
| 2022 | 12.3% | 10.5% | 37.2% | 28.7% | 5.7% | 5.7% |
| 2023 | 11.8% | 10.2% | 37.0% | 28.8% | 6.1% | 6.2% |
* Drug cost component (including associated markups) of prescription drug expenditures. Data source: IQVIA™ Private Pay Direct Drug Plan Database.
Data source: IQVIA™ Private Pay Direct Drug Plan Database.
From 2018 to 2023, the average annual drug cost per claimant rose across all age and sex groups. On average, males consistently had higher annual treatment costs than females in the same age group. However, more females made drug claims than males, except in the senior (65+) group. The higher overall proportion of female claimants (55%), particularly in the working-age (25–64) and youth (under 25) groups, may be skewed by the inclusion of claims for oral contraceptives, as explained in the Limitations section of this report. This could also slightly lower the calculated average annual drug cost for female claimants. Additional factors such as health-seeking behavior and treatment adherence may also contribute to the higher proportion of female claimants.
Males and females in the 25–64 age group had the highest annual drug costs and accounted for the largest share of claimants, making them the primary contributors to overall drug spending. In 2023, males aged 25–64 incurred the highest annual treatment costs at $974, followed by females in the same age group at $945.
Seniors (age 65+) had the smallest proportion of claimants but the second-highest annual costs. However, their relatively low annual costs compared to the 25–64 age group in private drug plans may not fully capture their true expenditures, as the data may reflect incomplete utilization and costs due to coordination with their publicly reimbursed benefits.
The share of claimants aged 65+ has increased slightly over time, while the number of claimants aged 25–64 has been decreasing, which indicates an aging demographic composition in private plans. The share of claimants under 25 fluctuated over the years captured, possibly due to policy changes and pandemic-related interventions.
Different policy approaches have led to unique blends of public and private drug coverage across Canada, resulting in notable provincial variations in demographic factors, as shown in Figure 1.5.
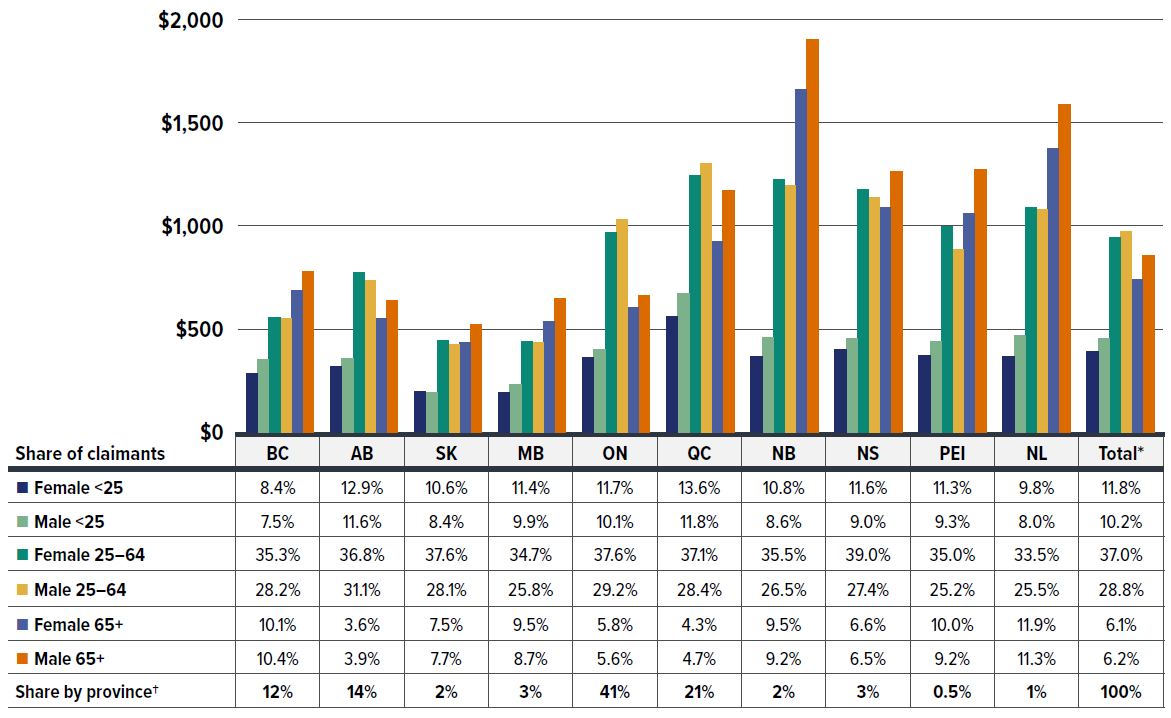
Figure description
| Average annual drug cost per claimant | Female under 25 | Male under 25 | Female 25 to 64 | Male 25 to 64 | Female 65 and over | Male 65 and over |
|---|---|---|---|---|---|---|
| British Columbia | $285 | $352 | $556 | $552 | $686 | $781 |
| Alberta | $319 | $358 | $773 | $734 | $551 | $636 |
| Saskatchewan | $198 | $194 | $445 | $425 | $434 | $523 |
| Manitoba | $191 | $231 | $438 | $433 | $537 | $647 |
| Ontario | $361 | $403 | $968 | $1,033 | $606 | $662 |
| Québec | $563 | $671 | $1,243 | $1,302 | $924 | $1,170 |
| New Brunswick | $365 | $457 | $1,225 | $1,194 | $1,662 | $1,904 |
| Nova Scotia | $400 | $452 | $1,176 | $1,136 | $1,089 | $1,262 |
| Prince Edward Island | $372 | $441 | $997 | $885 | $1,061 | $1,272 |
| Newfoundland and Labrador | $368 | $470 | $1,088 | $1,078 | $1,376 | $1,588 |
| Total* | $391 | $452 | $945 | $974 | $740 | $858 |
| Demographic share of claimants | Female under 25 | Male under 25 | Female 25 to 64 | Male 25 to 64 | Female 65 and over | Male 65 and over | Share by province† |
|---|---|---|---|---|---|---|---|
| British Columbia | 8.4% | 7.5% | 35.3% | 28.2% | 10.1% | 10.4% | 12% |
| Alberta | 12.9% | 11.6% | 36.8% | 31.1% | 3.6% | 3.9% | 14% |
| Saskatchewan | 10.6% | 8.4% | 37.6% | 28.1% | 7.5% | 7.7% | 2% |
| Manitoba | 11.4% | 9.9% | 34.7% | 25.8% | 9.5% | 8.7% | 3% |
| Ontario | 11.7% | 10.1% | 37.6% | 29.2% | 5.8% | 5.6% | 41% |
| Québec | 13.6% | 11.8% | 37.1% | 28.4% | 4.3% | 4.7% | 21% |
| New Brunswick | 10.8% | 8.6% | 35.5% | 26.5% | 9.5% | 9.2% | 2% |
| Nova Scotia | 11.6% | 9.0% | 39.0% | 27.4% | 6.6% | 6.5% | 3% |
| Prince Edward Island | 11.3% | 9.3% | 35.0% | 25.2% | 10.0% | 9.2% | 0.5% |
| Newfoundland and Labrador | 9.8% | 8.0% | 33.5% | 25.5% | 11.9% | 11.3% | 1% |
| Total* | 11.8% | 10.2% | 37.0% | 28.8% | 6.1% | 6.2% | 100% |
* The total includes a small amount of data beyond the 10 provinces displayed, including claims from territories and those with unknown geographic information in the data, which collectively account for less than 1% of the total prescription costs.
† The share reflects the data captured in the IQVIA™ Private Pay Direct Drug Plan Database. It may not indicate the exact private plans drug spending distribution by province due to differences in capture rates.
Data source: IQVIA™ Private Pay Direct Drug Plan Database.
In 2023, male claimants generally incurred slightly higher annual treatment costs than females. This difference was particularly pronounced in the senior (65+) group, which was evenly split between males and females in the private plans.
In provinces with population-defined, mixed-approach drug plans where public plans are typically the first payer for seniors (such as Ontario, Alberta, and QuebecFootnote VI), working-age claimants (25–64) had the highest annual drug costs in the private drug plans. However, in provinces with universal drug plans that cover all residents regardless of age (such as British Columbia, Saskatchewan, and Manitoba), seniors (65+) incurred slightly higher drug costs than the 25–64 age group. Notably, New Brunswick and Newfoundland and Labrador, where private plans are the primary payer for seniors, had the highest annual drug costs for claimants aged 65 and older.
Despite the cost variations across provinces, claimants aged 25–64 made up two thirds of the private drug plan population and contributed the highest overall annual costs. Youth (under 25) and seniors (65+) together accounted for the remaining one third of claimants, with seniors having a smaller share but incurring higher costs compared to the younger group.
For corresponding demographic trends in public plans, including senior and non-senior compositions by province, refer to the latest edition of the CompassRx report.
Section 2: The Drivers of Drug Costs, 2018 to 2023
In 2023, private drug plans saw a substantial growth of 14.1% in drug costs—the largest component of prescription drug expenditures. Costs in 2023 rebounded from three years of more moderate annual increases of 4%–5% during the COVID-19 pandemic (2020 to 2022). Over the six-year period from 2018 to 2023, increased use of higher-cost medicines was the primary driver, consistently pushing costs up by 5%–9% annually. Cost-mitigating measures such as generic and biosimilar substitutions and price reductions had downward effects ranging between -1% and -4%, but were not enough to offset rising costs. The impact of demographics and associated claim changes fluctuated between -3% and 7%, driven by policy and plan design changes, COVID-19 interventions, and data capture inconsistencies, along with natural patient population and volume growth.
Quick Reference: Section 2
In this section, a comprehensive cost driver analysis is used to determine how much private plan drug costs would have changed year over year from 2018 to 2023 if only one factor (e.g., the price of drugs) was considered while all the others remained the same.Footnote VII
Changes in drug costs are driven by a number of push and pull effects. The net effect of these opposing forces yields the overall rate of change.
Price change effect: Changes in the prices of both brand-name and generic drugs, determined at the molecule, strength, and form level.
Substitution effect: Shifts from brand-name to generic drugs, as well as shifts to biosimilar use.
Demographic effect: Changes in the number of active beneficiaries, as well as shifts in the distribution of age or gender.
Volume effect: Changes in the number of prescriptions dispensed to patients, the average number of units of a drug dispensed per prescription, and/or shifts in the use of various strengths or forms of a medicine.
Drug-mix effect: Shifts in use between lower- and higher-cost drugs, including those entering, exiting, or remaining in the market during the time period analyzed.
Figure 2.1 provides insight into the pressures driving the rates of change in drug costs from 2018 to 2023.
Typically, changes in the patient population and the volume of drugs prescribed exert a slight to moderate increase in drug costs. In 2018 and 2019 (the years before the COVID-19 pandemic), the combined impact of demographic and volume changes was around 3%. During this period, apart from the standard demographic effect, shifting coverage for Ontarians under the age of 25 between public and private drug plans caused opposing effects, offsetting costs from -2.5% to 2.3%.
However, the pandemic significantly disrupted these baseline trends starting in 2020. The initial impact of COVID-19 led to a notable decrease in the number of claimants in 2020, exerting a -5.5% downward demographic effect in 2020. By 2021, the decline in claimants had halted, leading to a neutral demographic effect (-0.2%). In 2022, claimant numbers continued to recover, pushing costs up by a modest 1.8%, though still below pre-pandemic growth levels and partially influenced by minor data capture inconsistencies. By 2023, the number of claimants surged, fully rebounding to levels consistent with pre-pandemic growth trends as though uninterrupted, resulting in a significant demographic push effect of 8.9%.
Meanwhile, the volume effect exerted a minor inverse force relative to the demographic effect. In 2020, despite the decline in claimants, a sizable increase in the number of claims per patient pushed overall spending upward by 5.6%. However, slower growth in drug use relative to the rebounding number of claimants led to neutral or even downward forces, ranging from 0.8% to -2.8%, countering the demographic effect in subsequent years up to 2023.
The most pronounced upward push on costs can be attributed to the use of higher-cost medicines, known as the drug-mix effect, which maintained an average of 6.3% between 2018 and 2023. In 2023, this effect reached a historical high, exerting a 9.2% upward push on drug costs in private drug plans, highlighting its growing impact.
Counterbalancing these upward cost pressures, generic and biosimilar substitution and price reductions generally exert a downward pull on costs. The magnitude of these effects can vary from year to year depending on the timing of generic and biosimilar market entries and the implementation of relevant policies or initiatives. The offsetting influences of generic price reductions and brand-name price increases had a modest net impact on drug cost growth, from a -2.5% pull-down effect related to the pan-Canadian Generic Price Initiative in 2018, diminishing to a minimal contribution (0.5%) by 2023. Conversely, shifts from brand-name to generic or biosimilar medicines had an increasingly pronounced pull-down effect. In 2023, the substitution effect (boosted by biosimilar switching initiatives) reduced private plan drug costs by 2.0%. This trend is expected to continue as the availability of biosimilars expands.
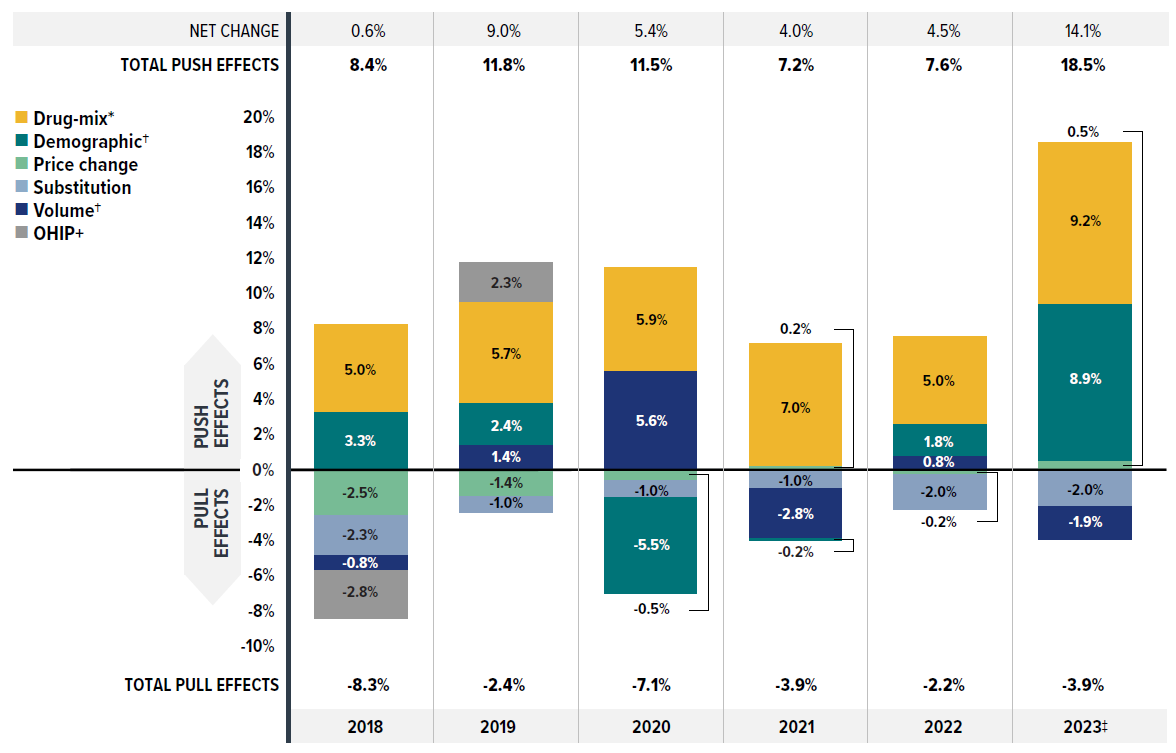
Figure description
| 2018 | 2019 | 2020 | 2021 | 2022 | 2023 | |
|---|---|---|---|---|---|---|
| Drug-mix* | 5.0% | 5.7% | 5.9% | 7.0% | 5.0% | 9.2% |
| Demographic† | 3.3% | 2.4% | -5.5% | -0.2% | 1.8% | 8.9% |
| Price change | -2.5% | -1.4% | -0.5% | 0.2% | -0.2% | 0.5% |
| Substitution | -2.3% | -1.0% | -1.0% | -1.0% | -2.0% | -2.0% |
| Volume† | -0.8% | 1.4% | 5.6% | -2.8% | 0.8% | -1.9% |
| OHIP+ | -2.8% | 2.3% | - | - | - | - |
| Total push effects | 8.4% | 11.8% | 11.5% | 7.2% | 7.6% | 18.5% |
| Total pull effects | -8.3% | -2.4% | -7.1% | -3.9% | -2.2% | -3.9% |
| Net change | 0.6% | 9.0% | 5.4% | 4.0% | 4.5% | 14.1% |
Note: This analysis is based on publicly available pricing information. It does not reflect any rebates, price discounts or confidential agreements that may affect the actual costs.
Values may not add to totals due to rounding and the cross effect.
* The drug-mix effect does not separate the impact of direct-acting antiviral (DAA) drugs for hepatitis C, due to their negligeable impact on private drug plan spending for the reported period 2018–2023.
† Partial data discontinuity from the private drug plan data supplier in 2021 and 2022 influenced the results for the demographic and volume effects.
‡ The 2023 demographic effect is based on projected claimant data to adjust for claimant double counting in the raw data.
Data source: IQVIA™ Private Pay Direct Drug Plan Database (capture rate: 79.9% to 85.7% of the private pay-direct market in Canada, varying by year).
Brief Insights: Drug Cost Drivers of NPDUIS Public Drug Plans
The largest component (43%Footnote VIII) of the total cost of prescription drugs in Canada is financed by the public drug plans. From 2017/18 to 2022/23, NPDUIS public plans saw a substantial growth in drug costs, with a compound annual growth rate of 6.7%. Drug costs rose by 7.9% in NPDUIS public plans in 2022/23.
The increasing use of higher-cost drugs (drug-mix effect) is the primary cost driver for Canadian public plans. Over the past several years, higher-cost medicines have exerted a consistent and significant upward pressure on expenditures, accounting for a 7.1% contribution toward drug costs in public plans in 2022/23.
Cost-mitigating measures, including pronounced savings from generic and biosimilar substitution—boosted by biosimilar switching initiatives, and combined with minor price reductions—lowered drug costs by 4.2% in public plans in 2022/23, but were not enough to counterbalance the drug-mix effect.
The COVID-19 pandemic caused shifts in claims for public plans: first a downward demographic effect in 2020/21 due to fewer reimbursed beneficiaries; then a rebound surpassing pre-pandemic levels in 2021/22 and 2022/23. Meanwhile, the volume effect, partly tied to pandemic-related temporary prescription size limits, exerted a minor inverse force.
Ontario’s OHIP+ spending stabilized and has had little impact since 2019/20. The effect of direct acting antiviral (DAA) drugs for hepatitis C has also diminished and is not shown separately since 2020/21.
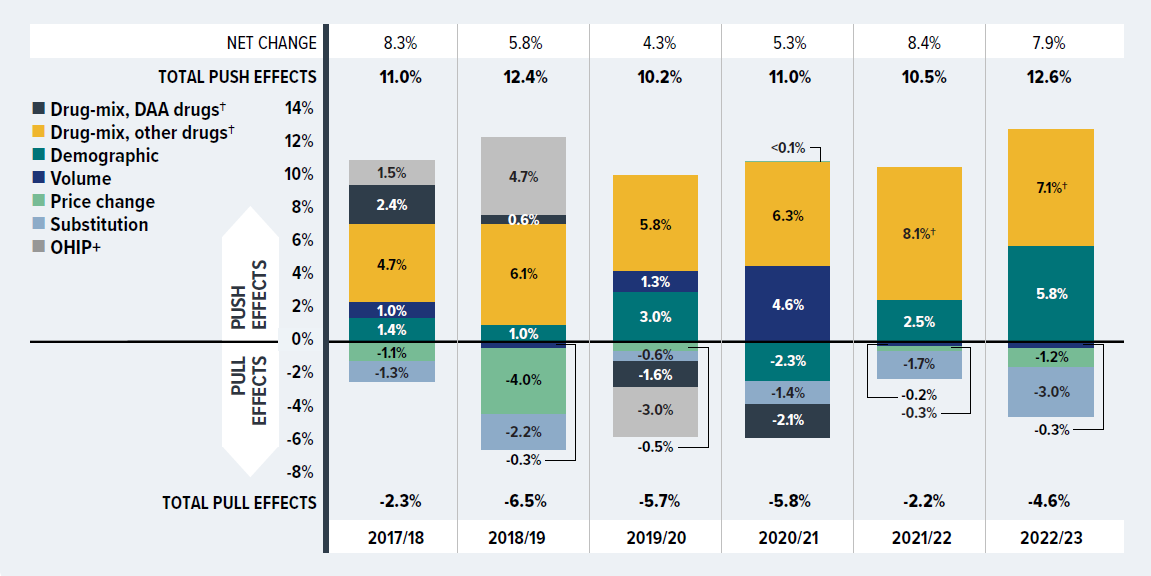
Figure description
| 2017/18 | 2018/19 | 2019/20 | 2020/21 | 2021/22 | 2022/23 | |
|---|---|---|---|---|---|---|
| Drug-mix, other drugs† | 4.7% | 6.1% | 5.8% | 6.3% | 8.1% | 7.1% |
| Demographic | 1.4% | 1.0% | 3.0% | -2.3% | 2.5% | 5.8% |
| Volume | 1.0% | -0.3% | 1.3% | 4.6% | -0.2% | -0.3% |
| Price change | -1.1% | -4.0% | -0.5% | 0.04% | -0.3% | -1.2% |
| Substitution | -1.3% | -2.2% | -0.6% | -1.4% | -1.7% | -3.0% |
| Drug-mix, DAA drugs† | 2.4% | 0.6% | -1.6% | -2.1% | - | - |
| OHIP+ | 1.5% | 4.7% | -3.0% | - | - | - |
| Total push effects | 11.0% | 12.4% | 10.2% | 11.0% | 10.5% | 12.6% |
| Total pull effects | -2.3% | -6.5% | -5.7% | -5.8% | -2.2% | -4.6% |
| Net change | 8.3% | 5.8% | 4.3% | 5.3% | 8.4% | 7.9% |
Note: This analysis is based on publicly available pricing information. It does not reflect confidetial price discounts negotiated by the pCPA on behalf of the public plans. Values may not add to totals due to rounding and the cross effect.
* British Columbia, Alberta, Saskatchewan, Manitoba, Ontario, New Brunswick, Nova Scotia, Prince Edward Island, Newfoundland and Labrador, Yukon, and the Non-Insured Health Benefits (NIHB) Program. Results for 2020–21 onward do not include the NIHB program.
† The Drug-mix, DAA drugs effect has diminished and is not shown separately since 2020/21.
Data source: National Prescription Drug Utilization Information System Database, Canadian Institute for Health Information (fiscal year data); NPDUIS Report: CompassRx, 10th edition: Annual Public Drug Plan Expenditure Report, 2022/23 (pre-publication results).
Price change effect
This effect captures changes in the prices of both brand-name and generic medicines. Following the significant one-time drop in generic prices resulting from the implementation of the pan-Canadian Generic Price Initiative in April 2018 (which was only intended for public drug plans but was also adopted by many private drug plans), its influence on private plans has gradually diminished, contributing minimally by 2023.
Figure 2.2 reports the trends in average unit costs for generic medicines from 2017 to 2023, along with their corresponding shares of total private plan prescriptions and drug costs. The results are presented as an index, with 2017 chosen as the base year (set to one) to capture the immediate impact of the 2018 generic pricing initiative, with subsequent years reported relative to the 2017 base value. The findings are a cost-weighted average of changes in the reimbursed unit costs for individual medicines. The analysis was restricted to oral solid formulations to ensure unit consistency.
Following the 2018 generic pricing initiative, generics’ average unit cost dropped substantially by 11% from 2017 to 2018, with a further average decline of 5% in 2019. Since then, prices remained steady without any further decrease from 2019 to 2023 across most provinces. However, Quebec was a notable exception, contributing to a slight overall increase of 3% in 2023 due to its status outside of the pan-Canadian Generic Price Initiative.Footnote IX As a result, the average generic unit cost in private plans for 2023 was 86% of the pre-policy level in 2017.
Over the same period, the share of prescriptions for the generic medicines analyzed in private plans increased, reaching over 60% in 2023, a significant rise from 55% in 2017. However, their corresponding share of total drug costs decreased slightly from 20.3% to 18.5%. This trend reflects both the diminishing impact of generic price reductions and the stronger cost growth in the more expensive non-generic segment, despite the increased use of generic medicines.
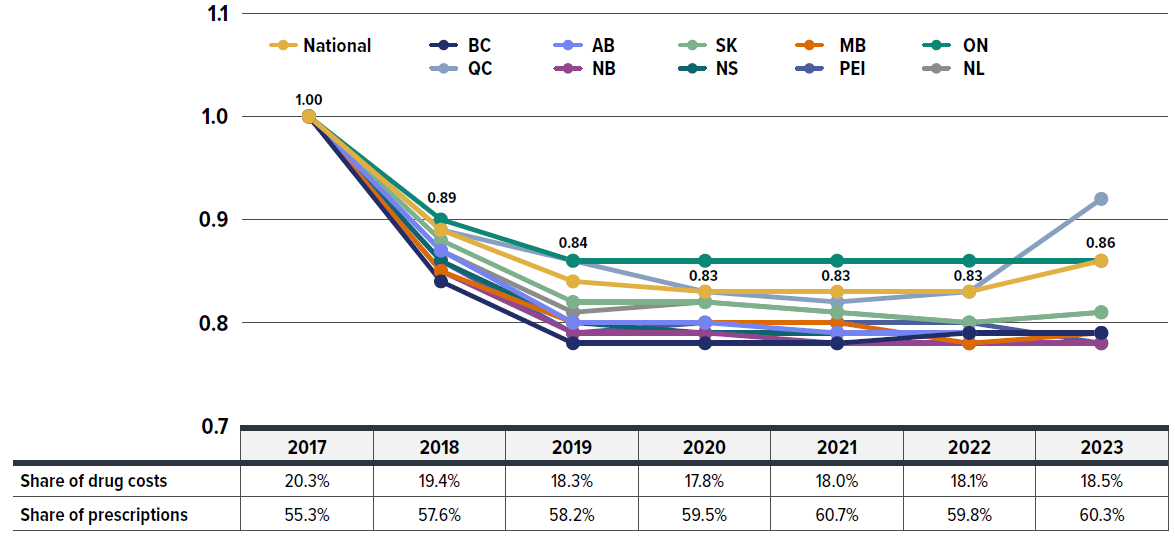
Figure description
| Average unit cost index, generic drugs | 2017 | 2018 | 2019 | 2020 | 2021 | 2022 | 2023 |
|---|---|---|---|---|---|---|---|
| National | 1 | 0.89 | 0.84 | 0.83 | 0.83 | 0.83 | 0.86 |
| British Columbia | 1 | 0.84 | 0.78 | 0.78 | 0.78 | 0.79 | 0.79 |
| Alberta | 1 | 0.87 | 0.80 | 0.80 | 0.79 | 0.79 | 0.79 |
| Saskatchewan | 1 | 0.88 | 0.82 | 0.82 | 0.81 | 0.80 | 0.81 |
| Manitoba | 1 | 0.85 | 0.80 | 0.80 | 0.80 | 0.78 | 0.79 |
| Ontario | 1 | 0.90 | 0.86 | 0.86 | 0.86 | 0.86 | 0.86 |
| Québec | 1 | 0.89 | 0.86 | 0.83 | 0.82 | 0.83 | 0.92 |
| New Brunswick | 1 | 0.85 | 0.79 | 0.79 | 0.78 | 0.78 | 0.78 |
| Nova Scotia | 1 | 0.86 | 0.80 | 0.79 | 0.79 | 0.79 | 0.79 |
| Prince Edward Island | 1 | 0.86 | 0.79 | 0.80 | 0.80 | 0.80 | 0.78 |
| Newfoundland and Labrador | 1 | 0.87 | 0.81 | 0.82 | 0.81 | 0.80 | 0.81 |
| 2017 | 2018 | 2019 | 2020 | 2021 | 2022 | 2023 | |
| Generic drugs’ share of drug costs | 20.3% | 19.4% | 18.3% | 17.8% | 18.0% | 18.1% | 18.5% |
| Generic drugs’ share of prescriptions | 55.3% | 57.6% | 58.2% | 59.5% | 60.7% | 59.8% | 60.3% |
Note: The findings are a cost-weighted average of changes in the reimbursed unit costs for individual medicines. The results are presented as an index, with 2017 chosen as the base year (set to 1), reflecting the period just before the generic pricing initiative. This allows for capturing the immediate impact starting from 2018, with subsequent years reported relative to the base year value.
* The analysis was limited to data for oral solid formulations to ensure consistency in units.
Data source: IQVIA™ Private Pay Direct Drug Plan Database.
Brief Insights: pCPA Initiatives
Through the pan-Canadian Pharmaceutical Alliance (pCPA), the provinces, territories, and federal government have been working collectively to achieve greater value for generic and brand-name medicines for Canada’s publicly funded drug programs. Although only intended for public drug plans, the pCPA generic pricing polices were transparent and subsequently adopted by many private drug plans.
Generic medicines:
Between April 1, 2015, and April 1, 2016, the prices of 18 commonly used generic medicines were reduced to 18% of their brand-name reference products. In addition, a one-year bridging period was initiated on April 1, 2017, which further reduced the prices of six of the molecules to 15% of the brand reference price.
As of April 1, 2018, a five-year joint agreement between the pCPA and the Canadian Generic Pharmaceutical Association (CGPA) reduced the prices of 67 of the most prescribed generic medicines in Canada by 25% to 40%, resulting in overall discounts of up to 90% off the price of their brand-name equivalents.
Effective April 1, 2022, the Historical Products Policy developed by pCPA and CGPA addresses concerns regarding assessments for generic products whose brand reference product has been cancelled post market.
A new three-year pricing initiative between the pCPA and the Canadian Generic Pharmaceutical Association (CGPA) came into effect on October 1, 2023, with the option to extend for an additional two years. Québec is now included as a participant in the new agreement. Under this initiative, newly launched single-source generics are subject to an automatic price drop to 55 per cent of the brand reference price after three months of public funding.
For more details, see the overview of generic pricing policies and pCPA initiatives available on the PMPRB website.
Substitution effect
Shifts from brand-name to generic or biosimilar medicines consistently pulled overall drug costs down, with the substitution effect ranging between -1.0% and -2.3% annually from 2018 to 2023. This impact varied depending on the timing of generic and biosimilar market entries and the implementation of relevant policies or initiatives. Unlike the diminishing price change effect, the substitution effect became a key driver of cost savings. In 2023, this effect—strengthened by biosimilar switching initiatives—reduced drug costs in private plans by 2.0%.
Figure 2.3 presents the top contributors to the total substitution effect, highlighting cost savings from biosimilar medicines in 2023. The five medications with the largest impact on cost mitigation together lowered drug costs by 1.1%.
Four of the top contributors are commonly prescribed medications with generics introduced in 2023, including three antidiabetic drugs (sitagliptin, sitagliptin/metformin, and dapagliflozin) and an anticoagulant (apixaban), which together offered 0.7% in savings. Notably, switching to the use of adalimumab biosimilars had the biggest impact, alone responsible for a 0.4% reduction in drug cost growth. Overall, biosimilars contributed nearly one third of the total savings from substitution in 2023 (0.6% of 2.0%).
Biosimilars, which are lower-cost alternatives to originator biologics, offer significant cost-saving opportunities without expected differences in efficacy and safety. By 2023, a total of 14 biologic medicines with available biosimilars were covered by private drug plans. Figure 2.4 shows these biologics and the trend in their drug cost share in private drug plans from 2018 to 2023, broken down by originator and biosimilar types. The height of each bar represents the scale of total drug costs associated with these medicines.
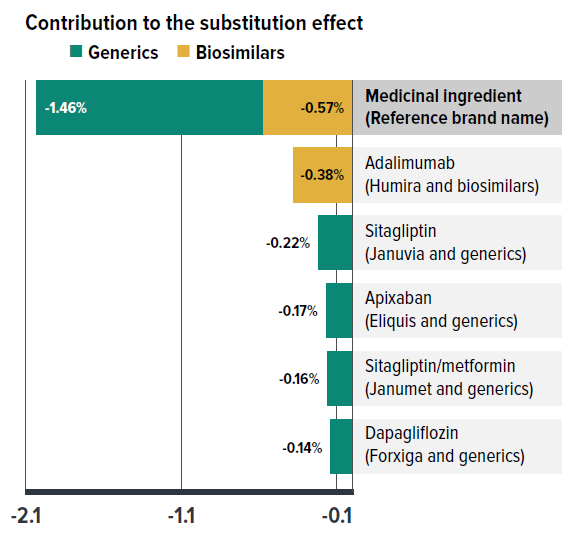
Figure description
| Generics | Biosimilars | |
|---|---|---|
| Contribution to the substitution effect in 2023 | -1.46% | -0.57% |
| Top contributors to the substitution effect in 2023 | ||
| Medicinal ingredient (Reference brand name) | Contribution to the substitution effect (generics) | Contribution to the substitution effect (biosimilars) |
| Adalimumab (Humira and biosimilars) | - | -0.38 |
| Sitagliptin (Januvia and generics) | -0.22 | - |
| Apixaban (Eliquis and generics) | -0.17 | - |
| Sitagliptin/metformin (Janumet and generics) | -0.16 | - |
| Dapagliflozin (Forxiga and generics) | -0.14 | - |
* Shifts from brand-name to generic or biosimilar options.
Data source: IQVIA™ Private Pay Direct Drug Plan Database.
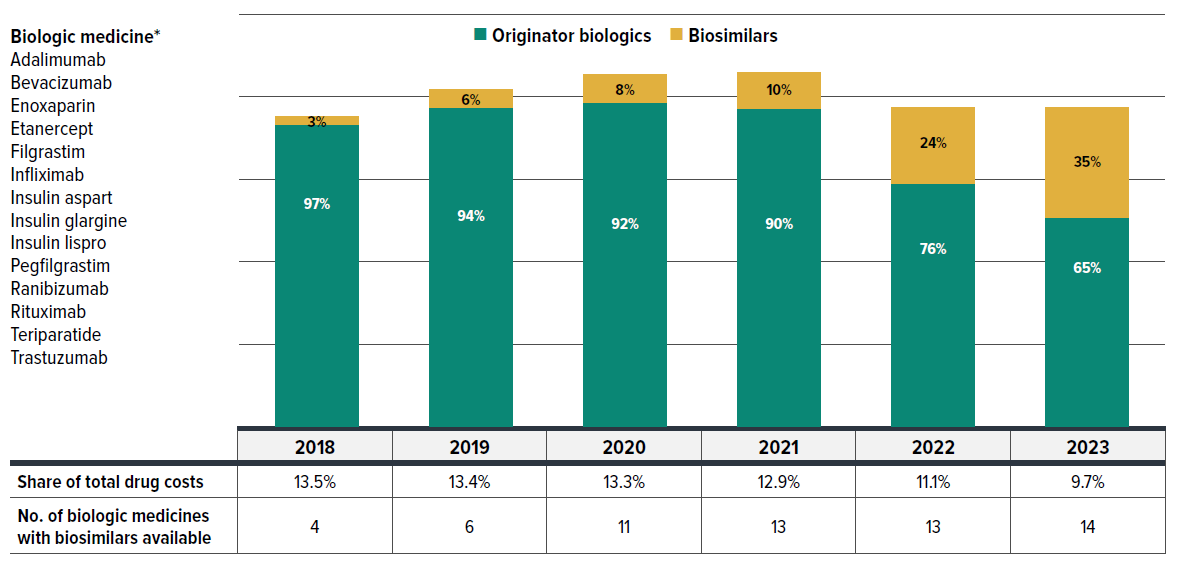
Figure description
Biologic medicines: adalimumab, bevacizumab, enoxaparin, etanercept, filgrastim, infliximab, insulin aspart, insulin glargine, insulin lispro, pegfilgrastim, ranibizumab, rituximab, teriparatide, trastuzumab.
| Drug cost share by year | Originator biologics | Biosimilars |
|---|---|---|
| 2018 | 97% | 3% |
| 2019 | 94% | 6% |
| 2020 | 92% | 8% |
| 2021 | 90% | 10% |
| 2022 | 76% | 24% |
| 2023 | 65% | 35% |
| 2018 | 2019 | 2020 | 2021 | 2022 | 2023 | |
|---|---|---|---|---|---|---|
| Share of total drug costs | 13.5% | 13.4% | 13.3% | 12.9% | 11.1% | 9.7% |
| Number of biologic medicines with biosimilars available | 4 | 6 | 11 | 13 | 13 | 14 |
* Includes the same set of 14 biologics that had at least one biosimilar available in private drug plans by 2023. Biosimilars may have entered at different times in the study period.
Data source: IQVIA™ Private Pay Direct Drug Plan Database.
The number of biologic molecules with biosimilars available in private plans rose from 4 in 2018 to 14 in 2023, reflecting expanded treatment options and the growing availability of biosimilars. Correspondingly, the cost share for biosimilars within this group increased from 3% to 35%. Due to the shrinking share of the higher-cost originator biologics, the overall drug costs for this group declined, with its share of total private drug plan spending dropping from 13.5% to below 10%. The introduction of biosimilars has not only stabilized costs but also led to a reduction in spending for the originator biologics as biosimilar options become available and more widely used.
Recently, a growing number of Canadian payers have initiated policies to encourage switching from originator biologics to biosimilars in order to improve biosimilar uptake. Public drug plans have generally led private plans in biosimilar uptake, largely due to proactive provincial policies. However, the degree of biosimilar adoption has varied significantly nationwide, namely due to the timing of provincial biosimilar switching policies and differences in public/private drug coverage models across provinces. Figure 2.5 illustrates the biosimilar prescription uptake of three widely-used anti-TNF-α drugs targeted by biosimilars initiatives (adalimumab, infliximab, and etanercept), comparing their uptake in private drug plans and NPDUIS public plans in four select provinces.
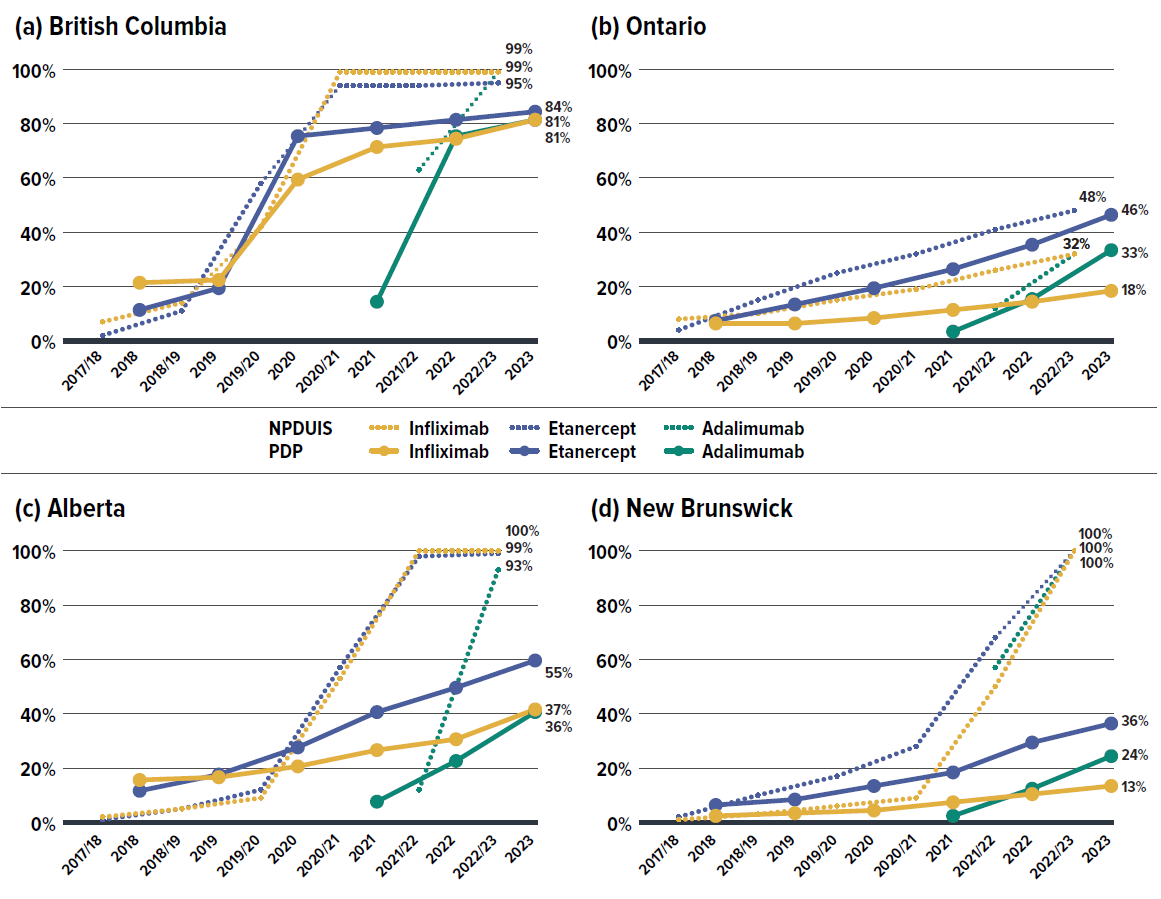
Figure description
| 2017/18 | 2018/19 | 2019/20 | 2020/21 | 2021/22 | 2022/23 | |
|---|---|---|---|---|---|---|
| Infliximab - NPDUIS public drug plans | 7% | 14% | 42% | 99% | 99% | 99% |
| Etanercept - NPDUIS public drug plans | 2% | 11% | 58% | 94% | 94% | 95% |
| Adalimumab - NPDUIS public drug plans | - | - | - | - | 63% | 99% |
| 2018 | 2019 | 2020 | 2021 | 2022 | 2023 | |
| Infliximab - private drug plans | 21% | 22% | 59% | 71% | 74% | 81% |
| Etanercept - private drug plans | 11% | 19% | 75% | 78% | 81% | 84% |
| Adalimumab - private drug plans | - | - | - | 14% | 75% | 81% |
| 2017/18 | 2018/19 | 2019/20 | 2020/21 | 2021/22 | 2022/23 | |
|---|---|---|---|---|---|---|
| Infliximab - NPDUIS public drug plans | 8% | 10% | 15% | 19% | 26% | 32% |
| Etanercept - NPDUIS public drug plans | 4% | 15% | 25% | 32% | 41% | 48% |
| Adalimumab - NPDUIS public drug plans | - | - | - | - | 12% | 32% |
| 2018 | 2019 | 2020 | 2021 | 2022 | 2023 | |
| Infliximab - private drug plans | 6% | 6% | 8% | 11% | 14% | 18% |
| Etanercept - private drug plans | 7% | 13% | 19% | 26% | 35% | 46% |
| Adalimumab - private drug plans | - | - | - | 3% | 15% | 33% |
| 2017/18 | 2018/19 | 2019/20 | 2020/21 | 2021/22 | 2022/23 | |
|---|---|---|---|---|---|---|
| Infliximab - NPDUIS public drug plans | 2% | 5% | 9% | 53% | 100% | 100% |
| Etanercept - NPDUIS public drug plans | 1% | 5% | 12% | 57% | 98% | 99% |
| Adalimumab - NPDUIS public drug plans | - | - | - | - | 12% | 93% |
| 2018 | 2019 | 2020 | 2021 | 2022 | 2023 | |
| Infliximab - private drug plans | 11% | 12% | 16% | 22% | 26% | 37% |
| Etanercept - private drug plans | 7% | 13% | 23% | 36% | 45% | 55% |
| Adalimumab - private drug plans | - | - | - | 3% | 18% | 36% |
| 2017/18 | 2018/19 | 2019/20 | 2020/21 | 2021/22 | 2022/23 | |
|---|---|---|---|---|---|---|
| Infliximab - NPDUIS public drug plans | 1% | 3% | 6% | 9% | 50% | 100% |
| Etanercept - NPDUIS public drug plans | 2% | 10% | 17% | 28% | 68% | 100% |
| Adalimumab - NPDUIS public drug plans | - | - | - | - | 57% | 100% |
| 2018 | 2019 | 2020 | 2021 | 2022 | 2023 | |
| Infliximab - private drug plans | 2% | 3% | 4% | 7% | 10% | 13% |
| Etanercept - private drug plans | 6% | 8% | 13% | 18% | 29% | 36% |
| Adalimumab - private drug plans | - | - | - | 2% | 12% | 24% |
Data source: IQVIA™ Private Pay Direct Drug Plan Database.
The provinces selected for Figure 2.5 include British Columbia, Alberta, and New Brunswick, which were early adopters of biosimilars initiatives within their respective public plans. In comparison, Ontario (Canada’s largest province) did not introduce a biosimilar switching policy until March 2023, making it a representative province without a switching policy for most of the study period.
Public drug plans in British Columbia, Alberta, and New Brunswick saw a substantial uptake of biosimilars, capturing 93% to 100% of their respective markets by March 2023. In contrast, private drug plans in these provinces lagged, particularly in Alberta and New Brunswick, where biosimilar uptake was less than half the levels seen in their public plans, even with data extended through the end of 2023. These uptake gaps can be attributed to the fragmented nature of public/private plan coverage approaches and different levels of competition within the private insurance markets.
British Columbia stands out due to unique administration and integration of BC Fair PharmaCare with private drug claims. Private payers aligned proactively with the BC Biosimilars Initiative, resulting in private plans’ biosimilar uptake exceeding 80% by 2023, greatly outpacing private payers in other provinces.
In Ontario, where the mandatory biosimilar switching policy was introduced within the public plan only at the end of fiscal 2022/23, biosimilar uptake was just slightly higher than that observed in private plans.
With the ongoing implementation and potential expansion of biosimilar switching initiatives across Canada, biosimilar uptake is expected to accelerate, leading to greater cost savings in both public and private plans.
Drug-mix effect
Shifts in use between lower- and higher-cost drugs pushed overall cost levels for private drug plans up by 5%–9% annually. In 2023, this effect contributed 9.2% to the 14.1% growth of drug costs.
Figure 2.6 reports the 10 medicines that made the greatest contribution to the drug-mix effect in 2023, together accounting for a 6.7% upward push on overall drug costs. Leading this list is the antidiabetic drug, semaglutide (Ozempic), which alone contributed 3.2% to the growth in drug costs in its sixth year on the market. The fixed-dose combination medicine flexacaftor/tezacaftor/ivacaftor (Trikafta), for the treatment of cystic fibrosis, ranked second due to its high annual treatment cost of over $150,000, despite being used by only 0.1 per 1,000 claimants.
Eight of the top contributors were high-cost drugs with average annual treatment costs ranging from $11,751 to $151,995, including six immunosuppressants, one treatment for cystic fibrosis, and one dermatological treatment. The remaining two drugs had relatively low annual treatment costs but were widely used by approximately 30 per 1,000 claimants.
Four of the top contributors had been on the market for over 15 years by 2023. Among these, two anti-TNF-α products, adalimumab and infliximab, already have biosimilars available, suggesting limited uptake of their cheaper alternatives.
The share of total drug costs for each of the top contributors is reported in the table accompanying Figure 2.6. Note that this value differs from the contribution to the drug-mix effect, which measures the growth (increase or decrease in costs over time) rather than the costs themselves.
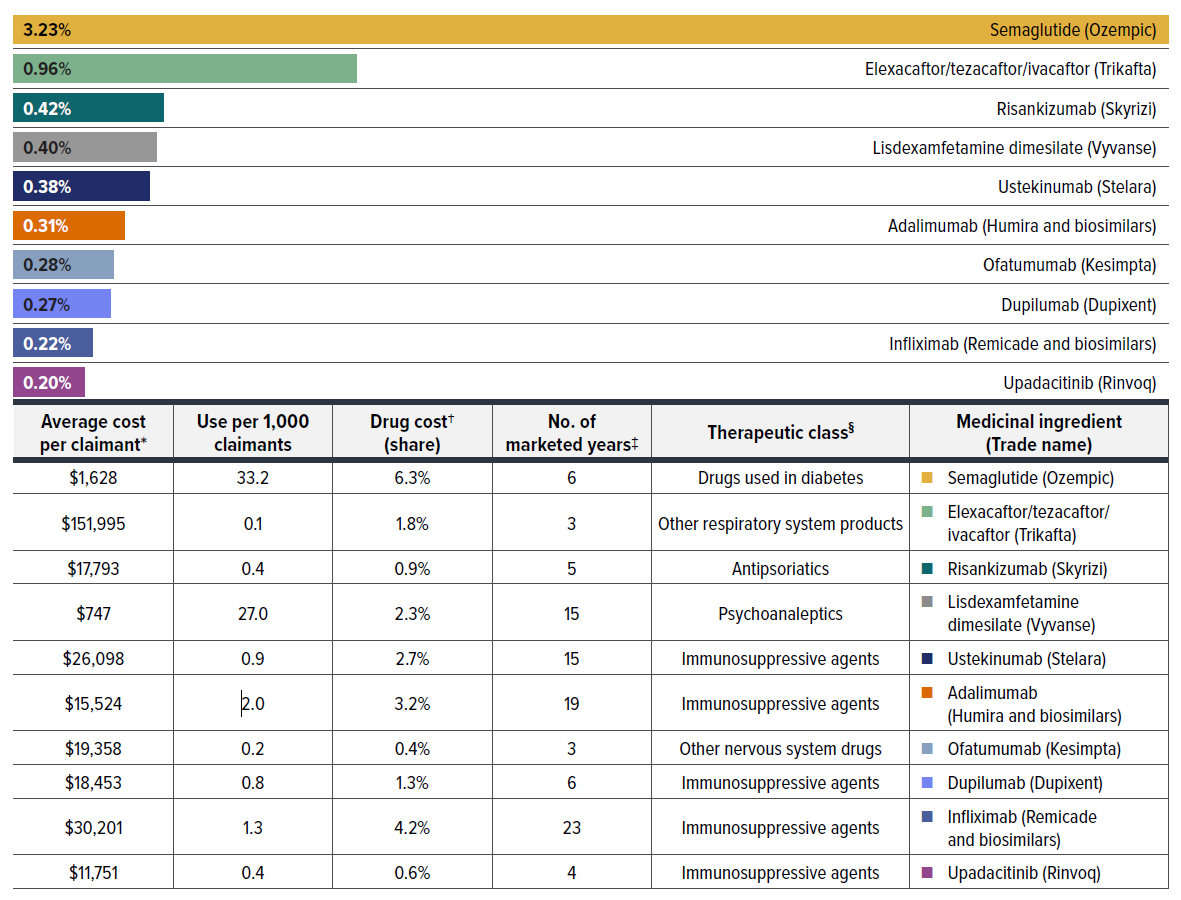
Figure description
| Medicinal ingredient | Therapeutic class§ | Contribution to the drug-mix effect | Average cost per claimant† | Use per 1,000 claimants | Drug cost† (share) | Number of marketed years‡ |
|---|---|---|---|---|---|---|
| Semaglutide (Ozempic) | Drugs used in diabetes | 3.23% | $1,628 | 33.2 | 6.3% | 6 |
| Elexacaftor/tezacaftor/ivacaftor (Trikafta) | Other respiratory system products | 0.96% | $151,995 | 0.1 | 1.8% | 3 |
| Risankizumab (Skyrizi) | Antipsoriatics | 0.42% | $17,793 | 0.4 | 0.9% | 5 |
| Lisdexamfetamine dimesilate (Vyvanse) | Psychoanaleptics | 0.40% | $747 | 27.0 | 2.3% | 15 |
| Ustekinumab (Stelara) | Immunosuppressive agents | 0.38% | $26,098 | 0.9 | 2.7% | 15 |
| Adalimumab (Humira and biosimilars) | Immunosuppressive agents | 0.31% | $15,524 | 2 | 3.2% | 19 |
| Ofatumumab (Kesimpta) | Other nervous system drugs | 0.28% | $19,358 | 0.2 | 0.4% | 3 |
| Dupilumab (Dupixent) | Immunosuppressive agents | 0.27% | $18,453 | 0.8 | 1.3% | 6 |
| Infliximab (Remicade and biosimilars) | Immunosuppressive agents | 0.22% | $30,201 | 1.3 | 4.2% | 23 |
| Upadacitinib (Rinvoq) | Immunosuppressive agents | 0.20% | $11,751 | 0.4 | 0.6% | 4 |
* The average cost per claimant may not represent the cost of a complete year of treatment.
† The drug costs do not reflect any rebates, price discounts or confidential agreements.
‡ The number of years since the drug was authorized for market by Health Canada, as of 2023.
§ The therapeutic class is based on ATC level 2. Jurisdictions that have special programs for ophthalmological drugs are not captured in the results.
Data source: IQVIA™ Private Pay Direct Drug Plan Database.
A growing number of high-cost drugs have been reimbursed by private drug plans in recent years, often targeting relatively small patient populations. The number of medicines costing over $10,000 per patient annually increased significantly from 190 in 2018 to 279 in 2023. Similarly, the number of drugs costing over $25,000 annually surged from 122 to 181 during the same period. These high-cost drugs respectively accounted for 28.7% and 13.0% of the total private drug plan costs in 2018. By 2023, their respective shares increased to 33.1% and 15.6%. Despite the growth in these categories, drugs over $10,000 were used by only 1.5% of claimants, and drugs over $25,000 were used by a mere 0.4%.
Although all high-cost drug categories have shown sustained growth, the steepest rise was in the highest cost band—drugs costing over $100,000 annually. The number of these drugs grew from 28 in 2018 to 46 in 2023, with their share of total drug costs more than doubling from 1.6% to 3.5%.
Figure 2.7 reports on trends in the market for high-cost drugs from 2018 to 2023 by average annual drug cost per claimant determined at the medicinal ingredient level: $10,000–$25,000; $25,000–$50,000; $50,000–$100,000; and $100,000 or more.
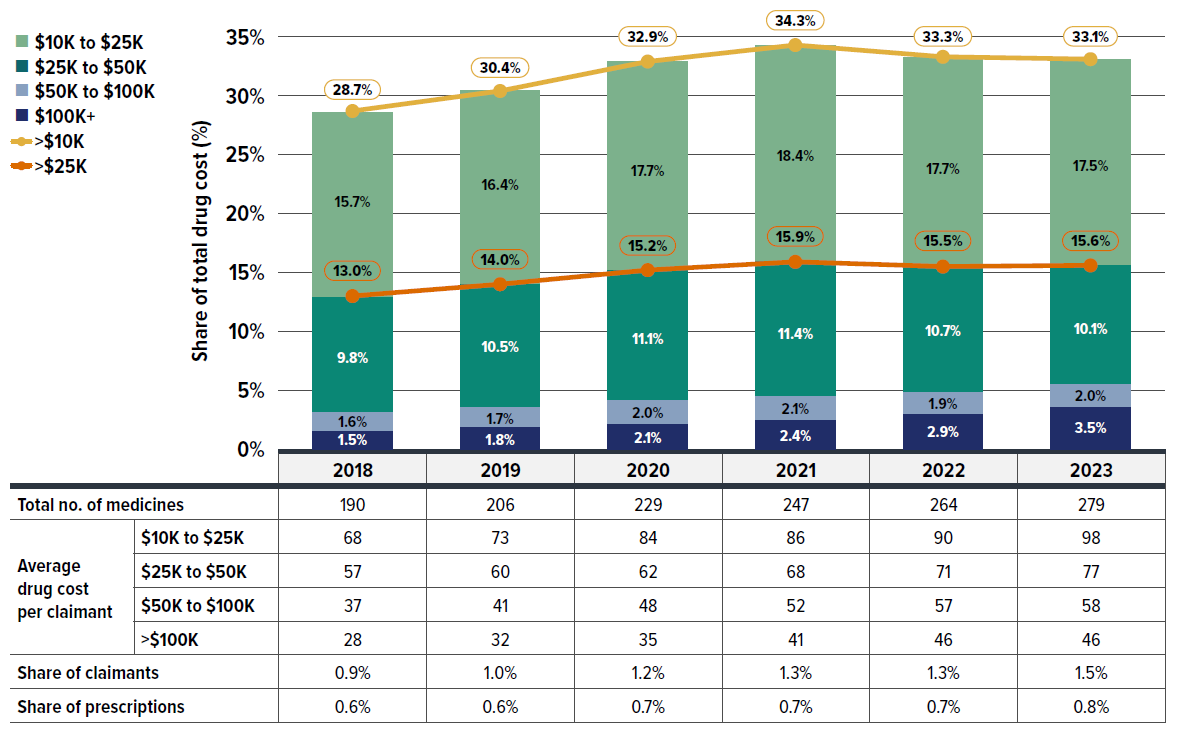
Figure description
| Cost share of high-cost drugs, by cost category | Over $100,000 | $50,000 to $100,000 | $25,000 to $50,000 | $10,000 to $25,000 | Over $25,000 | Over $10,000 |
|---|---|---|---|---|---|---|
| 2018 | 1.5% | 1.6% | 9.8% | 15.7% | 13.0% | 28.7% |
| 2019 | 1.8% | 1.7% | 10.5% | 16.4% | 14.0% | 30.4% |
| 2020 | 2.1% | 2.0% | 11.1% | 17.7% | 15.2% | 32.9% |
| 2021 | 2.4% | 2.1% | 11.4% | 18.4% | 15.9% | 34.3% |
| 2022 | 2.9% | 1.9% | 10.7% | 17.7% | 15.5% | 33.3% |
| 2023 | 3.5% | 2.0% | 10.1% | 17.5% | 15.6% | 33.1% |
| 2018 | 2019 | 2020 | 2021 | 2022 | 2023 | |
|---|---|---|---|---|---|---|
| Total number of medicines | 190 | 206 | 229 | 247 | 264 | 279 |
| Average drug cost per claimant: $10,000 to $25,000 |
68 | 73 | 84 | 86 | 90 | 98 |
| Average drug cost per claimant: $25,000 to $50,000 |
57 | 60 | 62 | 68 | 71 | 77 |
| Average drug cost per claimant: $50,000 to $100,000 |
37 | 41 | 48 | 52 | 57 | 58 |
| Average drug cost per claimant: Over $100,000 |
28 | 32 | 35 | 41 | 46 | 46 |
| Share of claimants | 0.90% | 1.00% | 1.20% | 1.30% | 1.30% | 1.50% |
| Share of prescriptions | 0.60% | 0.60% | 0.70% | 0.70% | 0.70% | 0.80% |
Note: The reported drug costs do not reflect any rebates, price discounts or confidential agreements.
* Average annual drug cost per claimant exceeding $10,000. The average cost per claimant may not represent the cost of a complete year of treatment.
Data source: IQVIA™ Private Pay Direct Drug Plan Database.
The data reveals that a relatively small share of claimants is responsible for a large portion of drug costs in private drug plans, with their contribution to the growth in average annual cost per claimant being even more disproportionate. The table below Figure 2.8 shows that the top 5% costly claimants accounted for an increasing share of total drug costs, rising from 56% in 2018 to 59% in 2023, while the cost share of lower-cost claimants either stagnated or declined.
Figure 2.8 also shows that the average annual cost per claimant rose by 28.6% ($181), from $637 in 2018 to $818 in 2023. Despite representing the same population size as other groups, the top 5% costly claimants alone contributed 19.3% ($123) to the overall 28.6% increase. Similarly, the top 30% cost share-ranked claimants were responsible for 27.4% ($174) of the overall 28.6% increase in cost per claimant. In contrast, the remaining 70% of claimants contributed only 1.2% ($7) to the growth.
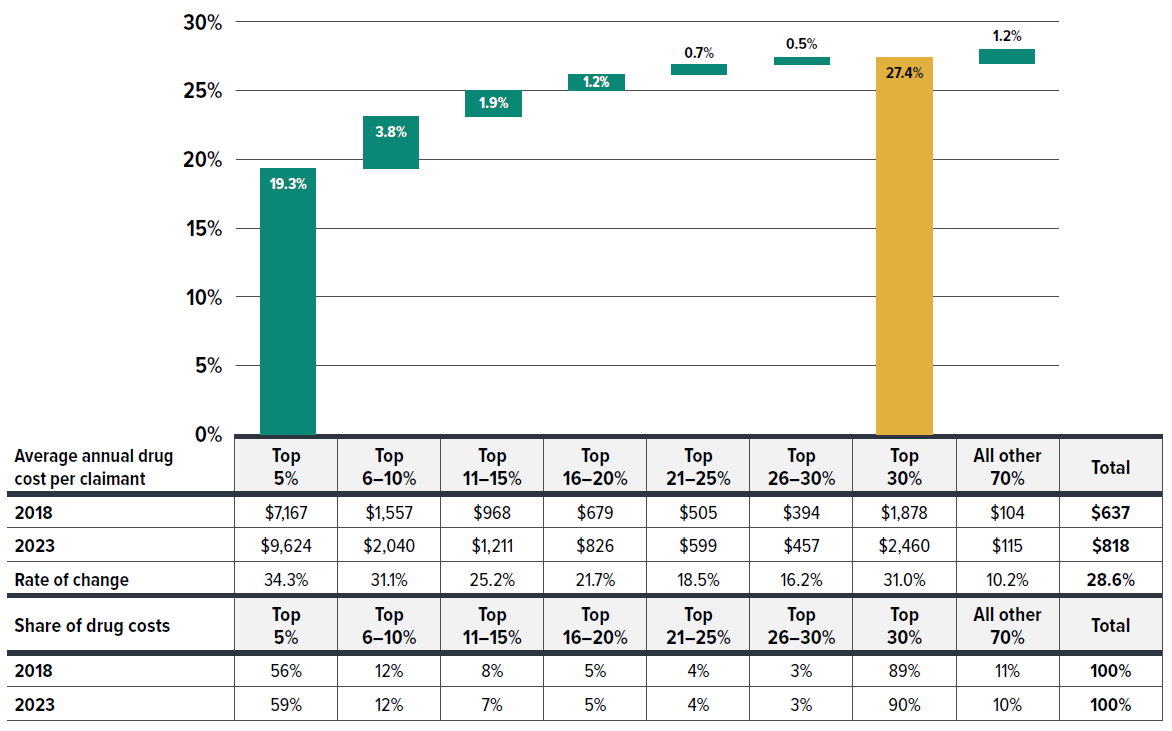
Figure description
| Claimant group by average annual drug cost per claimant | Contribution to the growth in total cost per claimant |
|---|---|
| Top 5% | 19.3% |
| Top 6-10% | 3.8% |
| Top 11-15% | 1.9% |
| Top 16-20% | 1.2% |
| Top 21-25% | 0.7% |
| Top 26-30% | 0.5% |
| Top 30% | 27.4% |
| All other 70% | 1.2% |
| Average annual drug cost per claimant | Top 5% | Top 6-10% | Top 11-15% | Top 16-20% | Top 21-25% | Top 26-30% | Top 30% | All other 70% | Total |
|---|---|---|---|---|---|---|---|---|---|
| 2018 | $7,167 | $1,557 | $968 | $679 | $505 | $394 | $1,878 | $104 | $637 |
| 2023 | $9,624 | $2,040 | $1,211 | $826 | $599 | $457 | $2,460 | $115 | $818 |
| Rate of change | 34.30% | 31.10% | 25.20% | 21.70% | 18.50% | 16.20% | 31.00% | 10.20% | 28.60% |
| Share of drug costs | Top 5% | Top 6-10% | Top 11-15% | Top 16-20% | Top 21-25% | Top 26-30% | Top 30% | All other 70% | Total |
|---|---|---|---|---|---|---|---|---|---|
| 2018 | 56% | 12% | 8% | 5% | 4% | 3% | 89% | 11% | 100% |
| 2023 | 59% | 12% | 7% | 5% | 4% | 3% | 90% | 10% | 100% |
* Cost concentration by every 5% of claimants based on their share of total drug costs per year, without tracking the same claimants across consecutive years.
Data source: IQVIA™ Private Pay Direct Drug Plan Database.
Figure 2.9 categorizes claimants into five cost tiers based on their average annual drug costs: less than $5,000; $5,000–$10,000; $10,000–$20,000; $20,000–$50,000; and $50,000 or more. While roughly 97%–98% claimants incurred less than $5,000 annually, their shares of total drug costs in private plans declined from 58% in 2018 to 52% in 2023. Moreover, their contribution to the rise in average cost per claimant was disproportionately low, accounting for just 30% (8.7% out of 28.6%) of the increase from 2018 to 2023. In contrast, claimants with annual costs over $5,000, though representing less than 3% of total claimants, were responsible for nearly 70% (19.8% out of 28.6%) of the increase. Remarkably, claimants with annual treatment cost exceeding $50,000—comprising only 0.1% of claimants—contributed 5.1% to the overall 28.6% growth in cost per claimant.
Figure 2.9 shows that the drug costs associated with higher-cost claimants grew at a faster rate than that for lower-cost claimants. As a result, overall drug costs are becoming more concentrated toward higher-cost claimants.
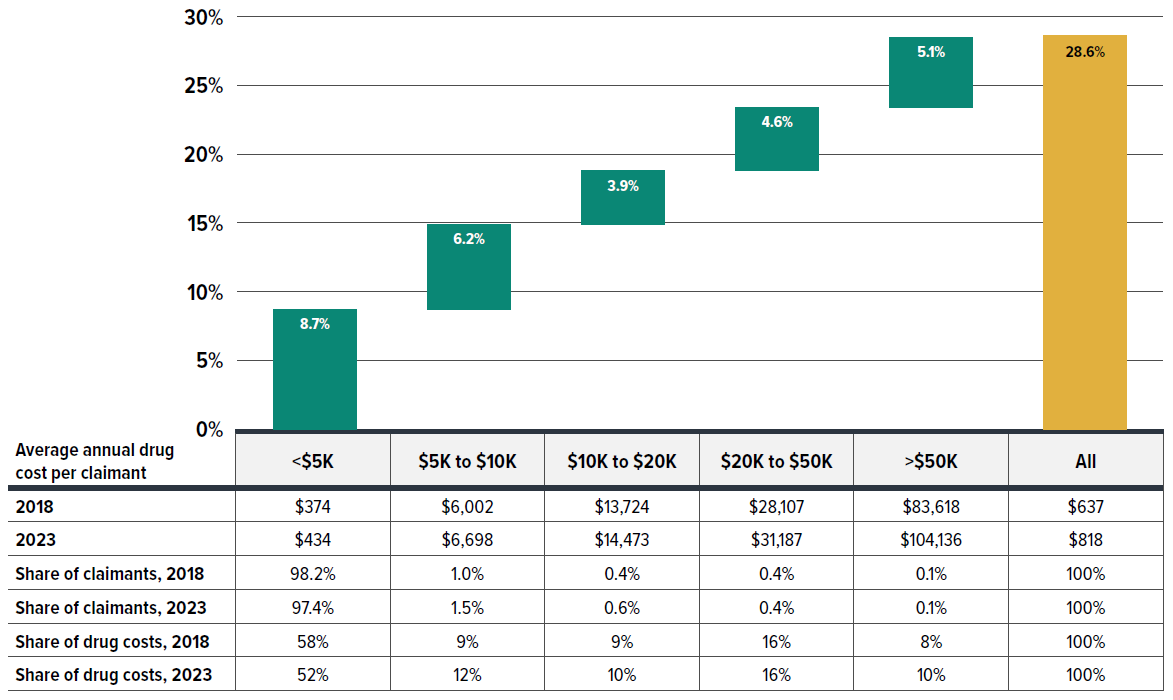
Figure description
| Annual treatment cost category | Contribution to the growth in total cost per claimant |
|---|---|
| Under $5,000 | 8.7% |
| $5,000 to $10,000 | 6.2% |
| $10,000 to $20,000 | 3.9% |
| $20,000 to $50,000 | 4.6% |
| Over $50,000 | 5.1% |
| All | 28.6% |
| Average annual drug cost per claimant by annual treatment cost category | Under $5,000 | $5,000 to $10,000 | $10,000 to $20,000 | $20,000 to $50,000 | Over $50,000 | All |
|---|---|---|---|---|---|---|
| 2018 | $374 | $6,002 | $13,724 | $28,107 | $83,618 | $637 |
| 2023 | $434 | $6,698 | $14,473 | $31,187 | $104,136 | $818 |
| Share of claimants, 2018 | 98.20% | 1.00% | 0.40% | 0.40% | 0.10% | 100% |
| Share of claimants, 2023 | 97.40% | 1.50% | 0.60% | 0.40% | 0.10% | 100% |
| Share of drug costs, 2018 | 58% | 9% | 9% | 16% | 8% | 100% |
| Share of drug costs, 2023 | 52% | 12% | 10% | 16% | 10% | 100% |
* Claimants were categorized based on their average prescription cost per year, without tracking the same claimants across consecutive years.
Data source: IQVIA™ Private Pay Direct Drug Plan Database.
An analysis by therapeutic area (Figure 2.10) shows that between 2018 and 2023, five therapeutic classes related to oncology and chronic diseases increasingly dominated drug costs in private plans, with their combined share rising from 71% to 74%.
Antineoplastic and immunomodulating agents, consisting of newer, higher-cost biologic and immunologic treatments, remained at the top of the list, with their cost share increasing from 20.6% to 21.4% over the 2018–2023 period. This reflects an ongoing shift towards greater use of immunomodulating drugs and outpatient-suitable oral oncology medicines.Footnote X The alimentary tract and metabolism medicines grew in cost share from 15.4% to 19.0% by 2023, overtaking nervous system medicines to hold the second-largest share. This was primarily driven by new antidiabetics, such as the GLP-1 receptor agonist semaglutide (Ozempic).
Respiratory system medicines also saw a rise in share from 7.9% to 8.8%, moving from fifth to fourth place over the same period, largely due to the introduction of the cystic fibrosis therapy elexacaftor/tezacaftor/ ivacaftor (Trikafta). Nervous system and cardiovascular system medicines, typically including lower-cost treatments used by a larger number of claimants, saw steady or slightly declining cost shares in recent years, mainly due to significant increases in the higher-cost therapeutic areas mentioned previously.
For a detailed annual breakdown of drug costs trends by therapeutic class from 2018 to 2023, see Appendix A.
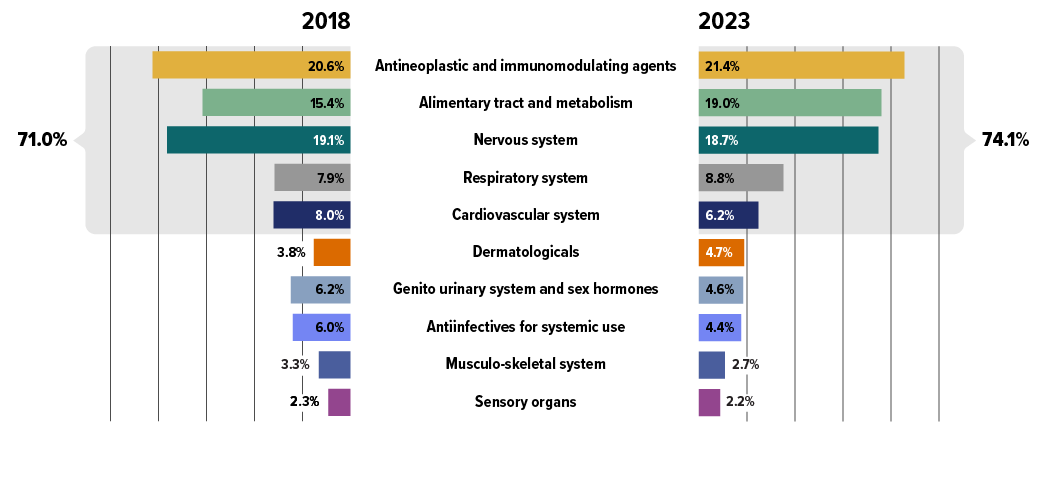
Figure description
| Top 10 therapeutic classes | Share of total drug costs, 2018 | Share of total drug costs, top 5 therapeutic classes, 2018 | Share of total drug costs, 2023 | Share of total drug costs, top 5 therapeutic classes, 2023 |
|---|---|---|---|---|
| Antineoplastic and immunomodulating agents | 20.6% | 71.0% | 21.4% | 74.1% |
| Alimentary tract and metabolism | 15.4% | 19.0% | ||
| Nervous system | 19.1% | 18.7% | ||
| Respiratory system | 7.9% | 8.8% | ||
| Cardiovascular system | 8.0% | 6.2% | ||
| Dermatologicals | 3.8% | 4.7% | ||
| Genito urinary system and sex hormones | 6.2% | 4.6% | ||
| Antiinfectives for systemic use | 6.0% | 4.4% | ||
| Musculo-skeletal system | 3.3% | 2.7% | ||
| Sensory organs | 2.3% | 2.2% |
* Anatomical Therapeutic Chemical (ATC) classification system maintained by the World Health Organization.
Data source: IQVIA™ Private Pay Direct Drug Plan Database.
Section 3: Private Drug Plan Management
Private drug plans typically reimbursed larger prescription sizes, averaging a 37-day supply per claim, compared to the 25-day average in NPDUIS public drug plans in 2023. This led to private plan claimants making less than half the annual claims and occurring less than half the annual drug costs compared to public plan beneficiaries. The share and amount of dispensing costs is also lower in private plans.
By 2023, private drug plans reimbursed the majority (84%) of recently-approved new active substances (NAS). This broader drug coverage contributed to higher average prescription costs for private plan claimants compared to public plan beneficiaries.
In terms of plan sponsor size, small plans (fewer than 50 claimants) constituted the majority (68%) of plan sponsors in 2023. Though only 8% of plan sponsors were classified as large plans (1000+ claimants), they represented 90% of total claimants and 89% of total costs, highlighting the significant impact of large plan sponsors in the private drug plan landscape.
Quick Reference: Section 3
Private drug plan management and sustainability involve balancing rising costs of prescription medications and access to necessary treatments, while optimizing plan members’ experience.
This section provides an in-depth analysis of private drug plan management, utilizing drug claim data to focus on key utilization and cost metrics. The analysis includes comparisons between private drug plans (PDP) and NPDUIS public plans and examines reimbursement rates for New Active Substances (NAS) as well as trends in high-cost beneficiaries. Special attention is given to variations in plan sponsor size, ranging from small to large employers, and their impact on utilization patterns and cost growth. Given the complexity and variety of plan designs, broader indicators such as plan eligibility, coverage structures, annual or lifetime maximums and employer contributions are not covered in depth here.
While drug claims represent a significant component of private drug benefit plans, it is important to recognize that broader cost containment strategies also influence long-term private plan sustainability. Strategic tools such as mandatory generic substitution, prior authorization, formulary-based plans, step/tier therapy, preferred pharmacy networks, support programs for complex conditions, risk management mechanisms like high-cost claimant pooling, and Product Listing Agreements (PLAs) are becoming increasingly relevant in the private sector. Due to the complexity and diversity of management strategies across different insurers and plan sponsors, this study does not assess these mechanisms in detail.
Private drug plans versus NPDUIS public drug plans
Alongside demographic and disease profile differences between populations covered under private and public drug plans, prescription size was a significant factor driving variations in average prescription cost per patient. The total prescription cost comprises both the drug and dispensing costs, and encouraging a longer day’s supply can lead to larger average prescription sizes while reducing dispensing frequency for the same volume of drugs per patient, thus lowering overall prescription costs. Dispensing smaller quantities, which may reduce wastage and improve compliance, is more commonly observed in public drug plans serving a large senior population. However, the drug wastage aspect could not be assessed with current data.
Figure 3.1 compares the average prescription size and utilization patterns in private drug plans and NPDUIS public drug plans. To ensure accurate comparisons, the relevant metrics include claims standardized to a 30-day prescription size.
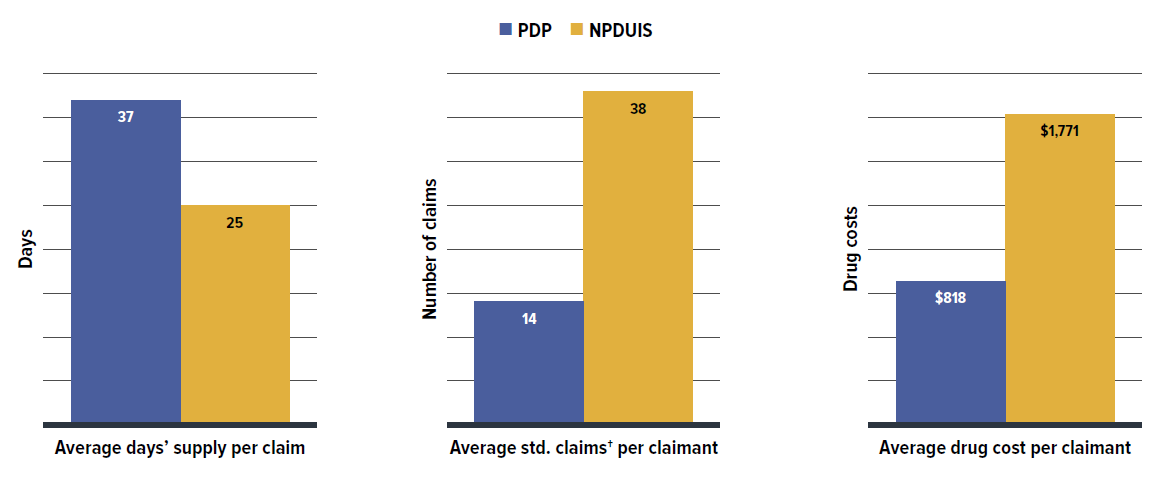
Figure description
| Private drug plans | NPDUIS public drug plans | |
|---|---|---|
| Average days’ supply per claim | 37 | 25 |
| Average standard claims per claimant | 14 | 38 |
| Average drug cost per claimant | $818 | $1,771 |
* Based on the most recent available data, private drug plan (PDP) data were reported by calendar year through 2023, while NPDUIS public drug plan data were aggregated for the fiscal year 2022/23.
† The number of claims was converted to a standard 30-day prescription size for more accurate comparisons between the two plan types.
Data source: IQVIA™ Private Pay Direct Drug Plan Database; National Prescription Drug Utilization Information System Database, Canadian Institute for Health Information.
In 2023, private drug plans typically reimbursed larger prescription sizes, averaging a 37-day supply per claim, compared to the 25-day supply per claim in public drug plans, resulting in less frequent dispensing of larger quantities in private drug plans. Consequently, claimants in private plans made significantly fewer claims per year than active beneficiaries in public plans, with 14 annual claims in private plans versus 38 claims in public plans for a standardized 30-day prescription. As a result of being dispensed fewer standard 30-day prescriptions annually, claimants in private drug plans incurred less than half the annual drug costs compared to beneficiaries in public plans, averaging $818 per claimant in private plans versus $1,771 per beneficiary in NPDUIS public plans.
To better align with NPDUIS public plan data (which does not include Quebec), an analysis excluding private plans in Quebec is presented in Appendix B, further supporting the findings in Figure 3.1.
Private plans, with their less frequent dispensing tied to longer days’ supply, had a proportionately lower share and amount of dispensing costs than NPDUIS public plans (Figure 3.2). This suggests that reducing dispensing frequency by appropriately extending day’s supply can be a cost-mitigation option, generating savings from reduced dispensing fees. In contrast, public plans, represented by a larger senior population, require more frequent drug dispensing and monitoring, which likely contribute to the relatively smaller prescription sizes observed in public plans.
Figure 3.2 breaks down the average prescription cost per claim from two perspectives: cost-sharing and pharmaceutical pricing, comparing private drug plans and NPDUIS public plans.
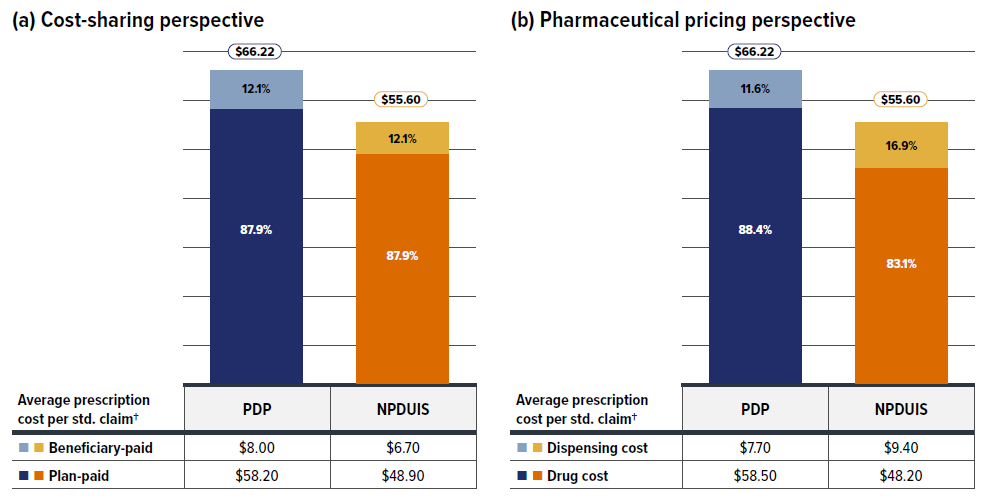
Figure description
| Private drug plans | NPDUIS public drug plans | |
|---|---|---|
| Average prescription cost per standard claim† | $66.22 | $55.60 |
| Beneficiary-paid amount | $8.00 | $6.70 |
| Beneficiary-paid share | 12.1% | 12.1% |
| Plan-paid amount | $58.20 | $48.90 |
| Plan-paid share | 87.9% | 87.9% |
| Private drug plans | NPDUIS public drug plans | |
|---|---|---|
| Average prescription cost per standard claim† | $66.22 | $55.60 |
| Dispensing cost | $7.70 | $9.40 |
| Dispensing cost share | 11.6% | 16.9% |
| Drug cost | $58.50 | $48.20 |
| Drug cost share | 88.4% | 83.1% |
* Based on the most recent available data, private drug plan (PDP) data were reported by calendar year through 2023, while NPDUIS public drug plan data were aggregated for the fiscal year 2022/23.
† The number of claims was converted to a standard 30-day prescription size for more accurate comparisons between the two plan types.
Data source: IQVIA™ Private Pay Direct Drug Plan Database; National Prescription Drug Utilization Information System Database, Canadian Institute for Health Information.
The average prescription cost per standard 30-day claim was approximately $10 higher in private drug plans than in NPDUIS public plans. From a cost-sharing perspective, private insurers typically covered 88% of the total prescription cost, with claimants responsible for the remaining 12%. Although this cost-sharing split was similar in public plans, the total amounts were lower and the cost-sharing proportion varied across jurisdictions.
Despite the higher prescription cost per claim in private plans, the average dispensing cost per claim was about $1.7 lower than in public plans. Drug costs thus made up a greater proportion of total prescription costs in private plans (88% versus 83% in public plans). The higher average drug cost per claim in private drug plans results from a more open formulary covering a broader range of drugs, including more branded medications and newer, more expensive treatments.
Reimbursement rate
Private drug plans in Canada are generally comprehensive in their coverage, reimbursing most prescription drugs. Although formulary-based plans exist, the majority maintain open access to a wide range of medications, including newly launched branded and innovative treatments. Figure 3.3 reports the reimbursement rates for new active substances (NAS) that received their first market approval from Health Canada between 2017 and 2022, along with their share of overall drug costs in private drug plans as of 2023.
The cohort of NAS approved from 2017 to 2022 was tracked through 2023, allowing at least a one-year window post-approval to assess reimbursement status. The data reveal that the percentage of NAS reimbursed in private drug plans ranged from 97% for those approved in 2017, to 79% and 80% for 2021 and 2022 approvals, respectively. This variation reflects several factors, including the number of years on the market and the therapeutic areas targeted by the new medicines. Overall, 84% (168) of the NAS approved during the 2017–2022 period were reimbursed by private drug plans by 2023. Typically, NAS received coverage within one year of market approval, with approximately 80% of these drugs reimbursed by at least some private plans, though coverage may differ among plan sponsors.
It is worth mentioning that public drug plans had a significantly lower reimbursement rate for the same cohort, with 55% (109) of these NAS listed in at least one provincial drug plan, including Quebec, by 2023. The difference can be attributed to the distinct pathways for drug coverage in the public and private sectors. Private drug plans manage their own listing and reimbursement decisions, often adding new drugs for coverage directly and rapidly. By contrast, publicly funded programs use common systems and often follow a lengthier reimbursement pathway, involving health technology assessment (HTA) recommendations, working collectively through the pan-Canadian Pharmaceutical Alliance (pCPA) pricing negotiations, and final provincial or territorial decisions to add a drug to their formulary. As a result, public plans tend to have lower reimbursement rates for NAS within the same observation timeframe compared to private plans. Directly comparing reimbursement statistics without a well-defined study framework and a thorough understanding of these distinct pathways could lead to misinterpretation. Consequently, this study avoids direct comparison. For deeper insights into public formularies and their complexities, refer to the PMPRB report series Alignment Among Public Formularies in Canada.
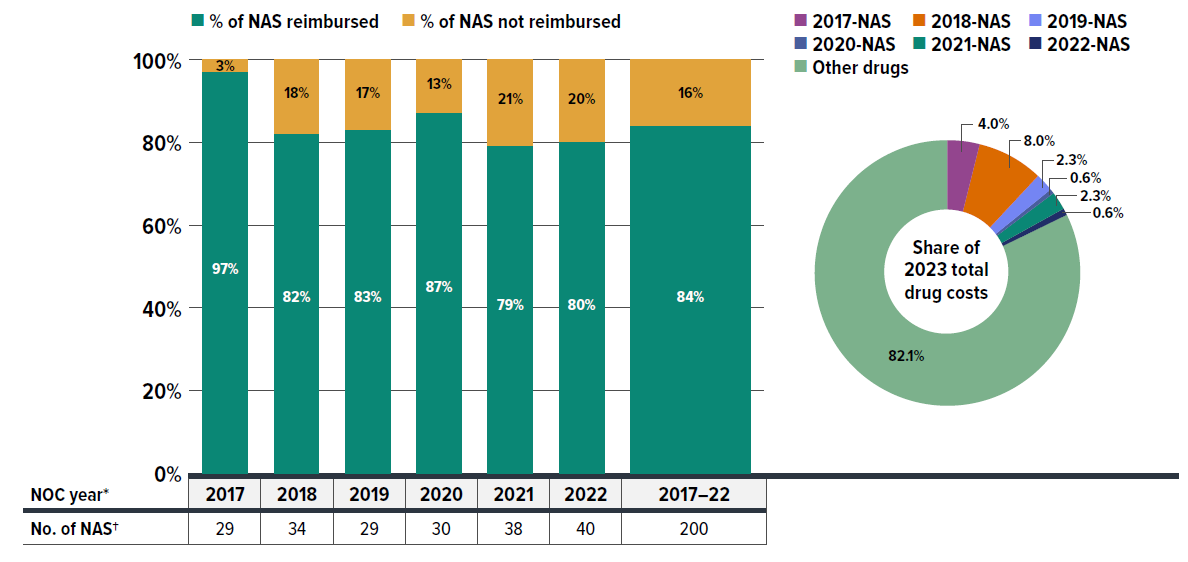
Figure description
| Notice of Compliance year | 2017 | 2018 | 2019 | 2020 | 2021 | 2022 | 2017 to 22 |
|---|---|---|---|---|---|---|---|
| Number of new active substance prescription drugs | 29 | 34 | 29 | 30 | 38 | 40 | 200 |
| Rate of new active substance prescription drugs reimbursed | 97% | 82% | 83% | 87% | 79% | 80% | 84% |
| Rate of new active substance prescription drugs not reimbursed | 3% | 18% | 17% | 13% | 21% | 20% | 16% |
| Notice of Compliance year | 2017 | 2018 | 2019 | 2020 | 2021 | 2022 | Other drugs |
|---|---|---|---|---|---|---|---|
| Share of 2023 total drug costs for new active substance prescription drugs, by Notice of Compliance year | 4.0% | 8.0% | 2.3% | 0.6% | 2.3% | 0.6% | 82.1% |
Note: The listing was considered if any reimbursement was observed in the private drug plan claim data for a drug product, with no differentiation among indications.
* The year in which the new active substance (NAS) medicines first received their market approval (by Notice of Compliance (NOC)) from Health Canada.
† The cohort of medicines analyzed focused on community use prescription drugs, non-prescription pharmaceuticals (i.e., radiopharmaceuticals) and drugs administered primarily in hospital settings were excluded.
Data source: IQVIA™ Private Pay Direct Drug Plan Database; Health Canada databases.
Notably, 16% (32) of NAS approved during this period were not reimbursed by any private drug plans, often because they were associated with therapeutic areas primarily covered under publicly funded programs, such as HIV/AIDS treatments or new take-home oncology therapies.
Despite representing only 7% of all medicinal ingredients reimbursed by private drug plans in 2023, the 2017–2022 NAS cohort accounted for 18% of total drug costs that year. For further insight into the composition of drugs reimbursed by private drug plans, please refer to Appendix D, which lists the top 50 best-selling medicines (most utilized molecules/ strengths/forms) in 2023. Notably, 72% of the cost of the top-selling drugs (29% of the cost of all drugs), were brand-only products without available generic or biosimilar alternatives.
High-cost beneficiaries
Building on the discussion about broader drug coverage in private drug plans and the resulting higher average prescription costs, it is also key to understand the trend in the out-of-pocket expenses for active beneficiaries. Given rising drug costs, this is important for better assessing the overall sustainability of these plans.
Figures 3.4 and 3.5 explore these dynamics by examining the portion of prescription costs paid by beneficiaries in relation to their total annual cost levels, with a particular focus on high-cost claimants, and comparing private drug plans with NPDUIS public plans.
Figure 3.4 shows the changes in the beneficiary-paid share of private drug plan expenditures between 2018 and 2023, broken down by five beneficiary annual cost tiers: less than $5,000; $5,000–$10,000; $10,000– $20,000; $20,000–$50,000; and $50,000 or more.
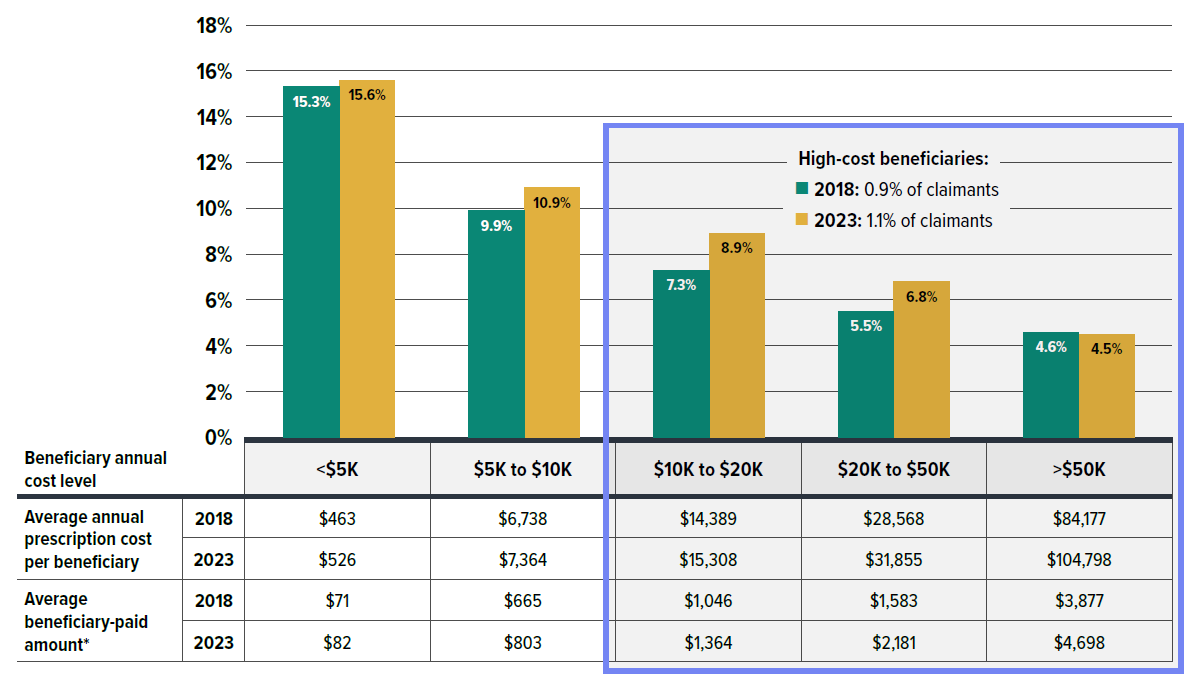
Figure description
High-cost beneficiaries in 2018: 0.9% of claimants
High-cost beneficiaries in 2023: 1.1% of claimants
| Beneficiary annual cost level | Under $5,000 | $5,000 to $9,999 | $10,000 to $19,999 | $20,000 to $49,999 | Over $50,000 |
|---|---|---|---|---|---|
| Average annual prescription cost per beneficiary: 2018 | $463 | $6,738 | $14,389 | $28,568 | $84,177 |
| Average annual prescription cost per beneficiary: 2023 | $526 | $7,364 | $15,308 | $31,855 | $104,798 |
| Average beneficiary-paid amount*: 2018 | $71 | $665 | $1,046 | $1,583 | $3,877 |
| Average beneficiary-paid amount*: 2023 | $82 | $803 | $1,364 | $2,181 | $4,698 |
* As the reported drug costs do not reflect any rebates, price discounts or confidential agreements, the amounts paid by active beneficiaries may be overestimated due to inflated co-payments and deductibles applied prior to any rebates being processed.
Data source: IQVIA™ Private Pay Direct Drug Plan Database.
In a given year, as the average annual cost categories increased, the portion of prescription costs paid by beneficiaries generally decreased. However, beneficiaries ended up paying more due to the higher total prescription costs. For example, the highest-cost beneficiaries (over $50,000 annually) paid the lowest portion of their prescription costs and saw a slight reduction between 2018 and 2023, but their absolute out-of-pocket amount rose by $821, reaching nearly $4,700 in 2023, reflecting the rising drug costs.
For beneficiaries with annual costs over $10,000, beneficiary-paid out-of-pocket expensesFootnote XI rose from $1,467 in 2018 to $1,922 in 2023, an increase of $455. The proportion of these high-cost beneficiaries also grew from 0.9% to 1.1% over the same period.
Figure 3.5 compares private drug plans to NPDUIS public plans across these same beneficiary annual cost categories.
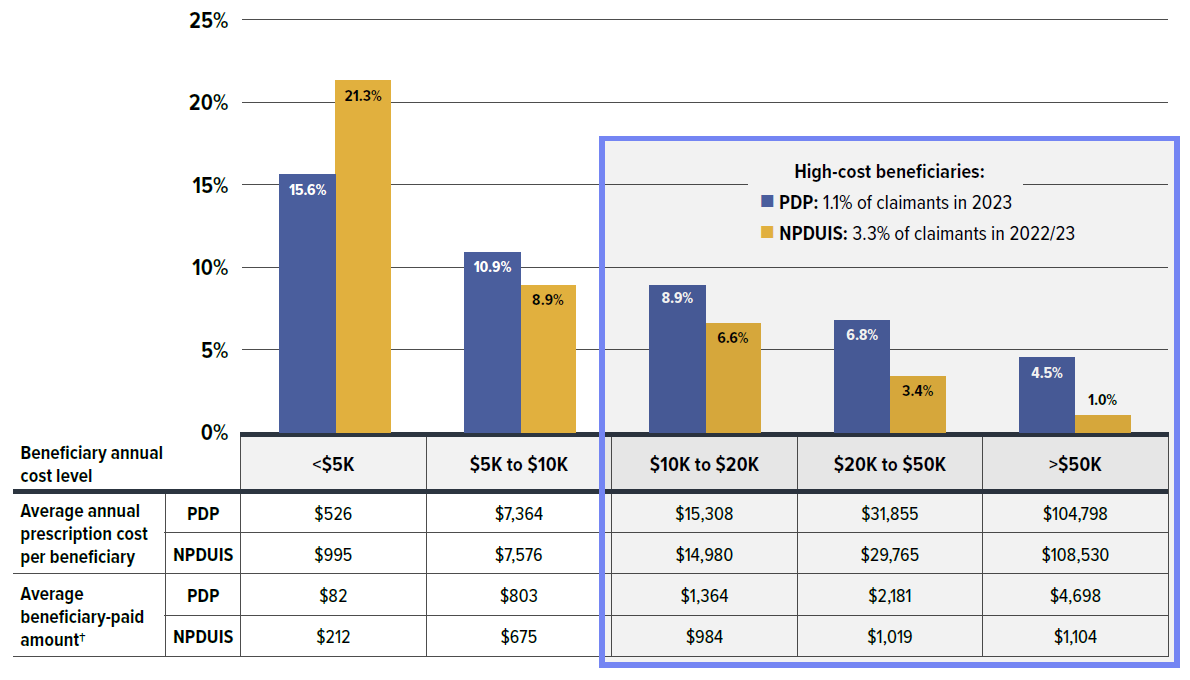
Figure description
High-cost beneficiaries: 1.1% of private drug plan claimants in 2023
High-cost beneficiaries: 3.3% of NPDUIS public drug plan claimants in 2022/23
| Beneficiary annual cost level | Under $5,000 | $5,000 to $9,999 | $10,000 to $19,999 | $20,000 to $49,999 | Over $50,000 |
|---|---|---|---|---|---|
| Average beneficiary-paid amount†: PDP | $526 | $7,364 | $15,308 | $31,855 | $104,798 |
| Average beneficiary-paid amount†: NPDUIS | $995 | $7,576 | $14,980 | $29,765 | $108,530 |
| Average beneficiary-paid amount†: PDP | $82 | $803 | $1,364 | $2,181 | $4,698 |
| Average beneficiary-paid amount†: NPDUIS | $212 | $675 | $984 | $1,019 | $1,104 |
* Based on the most recent available data, private drug plan (PDP) data were reported by calendar year through 2023, while NPDUIS public drug plan data were aggregated for the fiscal year 2022/23.
† As the reported drug costs do not reflect any rebates, price discounts or confidential agreements, the amounts paid by active beneficiaries may be overestimated due to inflated co-payments and deductibles applied prior to any rebates being processed.
Data source: IQVIA™ Private Pay Direct Drug Plan Database.
Despite the similar trend observed in both private and public plans, where the beneficiary-paid share of prescription costs decreased but out-of-pocket expenses increased as annual spending rose, significant differences exist between the two plan types. The proportion of beneficiaries with annual costs exceeding $10,000 was three times higher in NPDUIS public plans (3.3%) compared to private drug plans (1.1%).
Moreover, claimants in private drug plans paid a larger portion of their prescription costs in the higher-cost tiers (above $5,000 annually), with the gap widening at higher cost levels. Particularly notable for those with annual costs exceeding $50,000, private plan beneficiaries paid four times more out-of-pocket than their counterparts in public plans (4.5% vs. 1.0%), amounting to a difference of nearly $3,600.
These differences are likely influenced by several factors, including plan design, patient disease profiles, and the fact that the NPDUIS public plan data under analysis only included beneficiaries who met their deductible and received reimbursement.
Plan sponsor size
Although this report does not directly assess risk management mechanisms like claimant pooling, understanding how plan sponsor size affects cost distribution provides insights to support plan modernization for affordability and sustainability.
Figures 3.6 and 3.7 present the distribution of private drug plans by sponsor size in 2023 and the changes in plan numbers from 2018 to 2023. In 2023, small plan sponsors (fewer than 50 claimants) made up the majority of plan sponsors at 68%, followed by plans with 100–499 claimants (13%), 50–99 claimants (8%), and 500–999 claimants (3%). Large plans with more than 1,000 claimants accounted for just 8% of all plans but were responsible for 90% of total claimants and 89% of total drug costs (Figure 3.6).
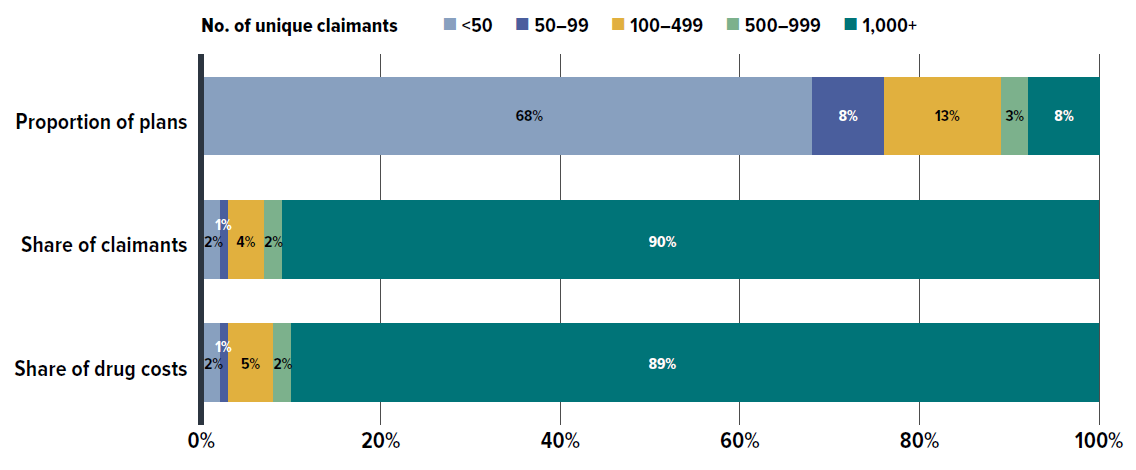
Figure description
| Number of unique claimants | Under 50 | 50 to 99 | 100 to 499 | 500 to 999 | Over 1,000 |
|---|---|---|---|---|---|
| Proportion of plans | 68% | 8% | 13% | 3% | 8% |
| Share of claimants | 2% | 1% | 4% | 2% | 90% |
| Share of drug costs | 2% | 1% | 5% | 2% | 89% |
* Drug plan sponsor size is defined based on the number of unique claimants in a given year.
Data source: IQVIA™ Private Pay Direct Drug Plan Database.
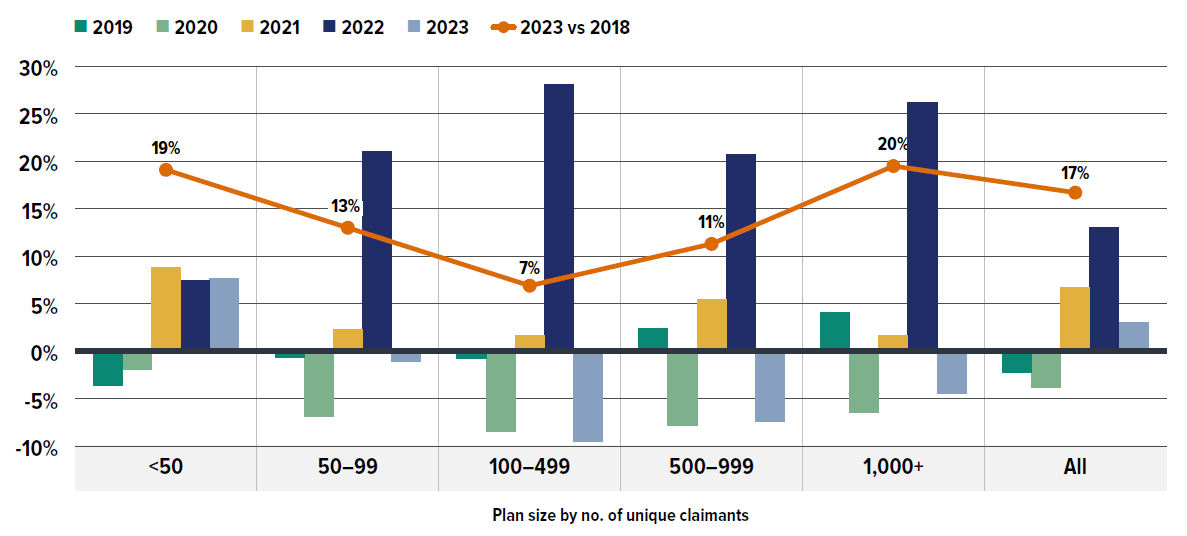
Figure description
| Plan size by number of unique claimants | Rate of change in number of drug plans, 2019 | Rate of change in number of drug plans, 2020 | Rate of change in number of drug plans, 2021 | Rate of change in number of drug plans, 2022 | Rate of change in number of drug plans, 2023 | Rate of change in number of drug plans, 2023 vs. 2018 |
|---|---|---|---|---|---|---|
| Under 50 | -3.6% | -1.9% | 8.8% | 7.5% | 7.7% | 19% |
| 50 to 99 | -0.7% | -6.9% | 2.3% | 21.0% | -1.1% | 13% |
| 100 to 499 | -0.8% | -8.5% | 1.7% | 28.1% | -9.5% | 7% |
| 500 to 999 | 2.4% | -7.8% | 5.4% | 20.7% | -7.4% | 11% |
| Over 1,000 | 4.1% | -6.4% | 1.7% | 26.2% | -4.4% | 20% |
| All | -2.2% | -3.8% | 6.7% | 13.0% | 3.0% | 17% |
* Drug plan sponsor size is defined based on the number of unique claimants in a given year.
Data source: IQVIA™ Private Pay Direct Drug Plan Database.
As shown in Figure 3.7, trends in plan numbers by size fluctuated in recent years. Small plans (fewer than 50 claimants) declined from 2018 to 2020 but grew consistently from 2021 to 2023. All larger plans experienced declines in 2020, rebounded over the following two years, and then declined again in 2023. These patterns may be tied to plan design changes, such as Ontario’s OHIP+ in 2018 and 2019, and the impact of the COVID-19 pandemic. Over the six-year period shown, the total number of plans went up by 17%, with the fastest growth seen in small (<50 claimants) and large (>1,000 claimants) plans, which increased by 19% and 20%, respectively.
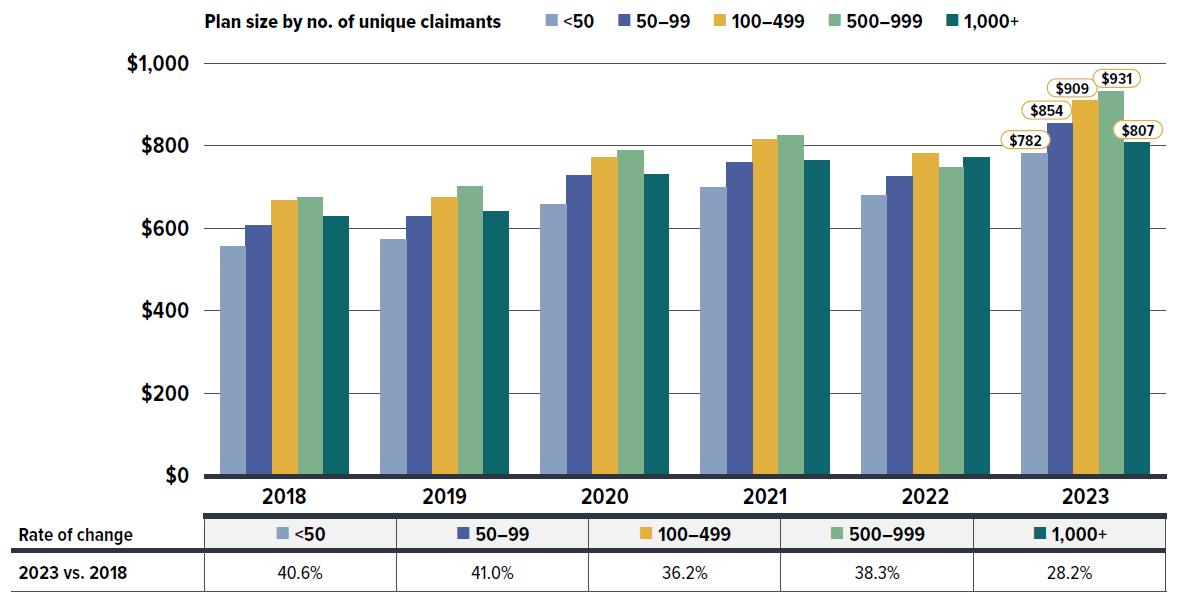
Figure description
| Plan size by number of unique claimants | Under 50 | 50 to 99 | 100 to 499 | 500 to 999 | Over 1,000 |
|---|---|---|---|---|---|
| Average annual drug cost per claimant, 2018 | $556 | $606 | $668 | $673 | $629 |
| Average annual drug cost per claimant, 2019 | $572 | $627 | $674 | $701 | $641 |
| Average annual drug cost per claimant, 2020 | $657 | $727 | $771 | $788 | $729 |
| Average annual drug cost per claimant, 2021 | $699 | $758 | $816 | $824 | $765 |
| Average annual drug cost per claimant, 2022 | $680 | $724 | $782 | $746 | $772 |
| Average annual drug cost per claimant, 2023 | $782 | $854 | $909 | $931 | $807 |
| Rate of change, 2023 versus 2018 | 40.6% | 41.0% | 36.2% | 38.3% | 28.2% |
* Drug plan sponsor size is defined based on the number of unique claimants in a given year.
Data source: IQVIA™ Private Pay Direct Drug Plan Database.
Figure 3.8 shows the average drug cost per claimant across different plan sizes from 2018 to 2023. While costs per claimant rose across all plan sizes, smaller plans (<100 claimants) experienced the highest rate of growth at approximately 41%. Interestingly, medium-sized plans (100–499 and 500–999 claimants) had the highest average annual drug costs per claimant by 2023, at $909 and $931, respectively. In contrast, both small (<50 claimants) and large (>1,000 claimants) plans had at least $100 lower average annual costs per claimant. Appendix C offers preliminary insights into how high-cost drug use may relate to plan sponsor sizes.
Without delving into specifics around coverage structures, premiums, or other insurance charges such as pooling fees, these variations by plan size suggest that small plan sponsors may offer less comprehensive coverage to manage costs due to their smaller insurance pools. Conversely, large plans, with more diverse patient profiles, may better distribute costs per claimant across a larger base, even while covering a greater number of high-cost drugs. Medium-sized plans lack the pooling advantage of large plans while also providing broader coverage than smaller plans, which may result in higher costs per claimant.
Appendix A: Annual Drug Cost Trends by Therapeutic Class
To further explore the shifting treatment landscape in the Canadian private drug plan market, Figure A1 presents an annual breakdown of drug cost distribution by therapeutic class, as well as the associated scale of drug cost changes from 2018 to 2023.
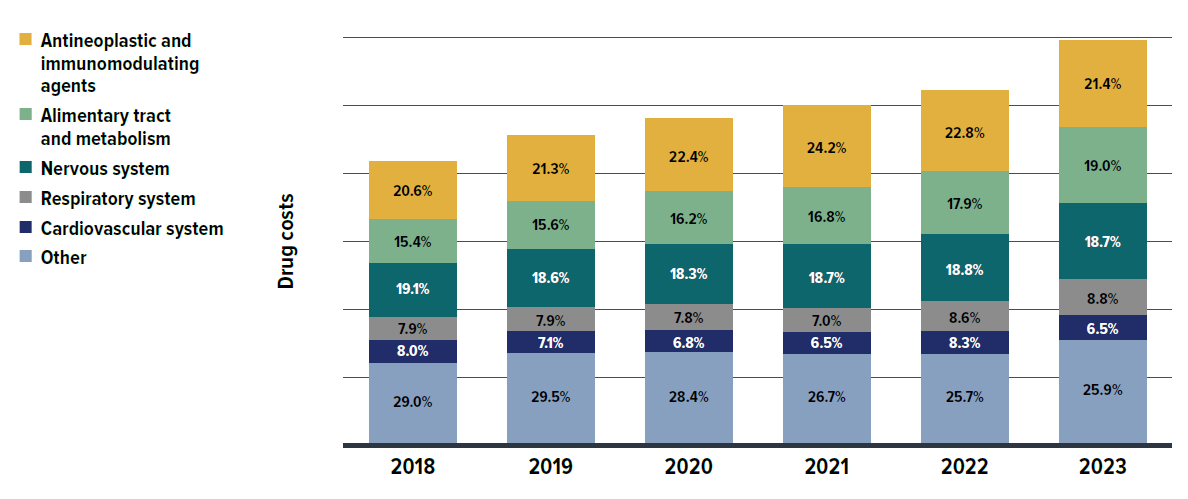
Figure description
| Anatomical Therapeutic Chemical classification | 2018 | 2019 | 2020 | 2021 | 2022 | 2023 |
|---|---|---|---|---|---|---|
| Antineoplastic and immunomodulating agents | 20.6% | 21.3% | 22.4% | 24.2% | 22.8% | 21.4% |
| Alimentary tract and metabolism | 15.4% | 15.6% | 16.2% | 16.8% | 17.9% | 19.0% |
| Nervous system | 19.1% | 18.6% | 18.3% | 18.7% | 18.8% | 18.7% |
| Respiratory system | 7.9% | 7.9% | 7.8% | 7.0% | 8.6% | 8.8% |
| Cardiovascular system | 8.0% | 7.1% | 6.8% | 6.5% | 6.3% | 6.2% |
| Other | 29.0% | 29.5% | 28.4% | 26.7% | 25.7% | 25.9% |
* Anatomical Therapeutic Chemical (ATC) classification system maintained by the World Health Organization.
Data source: IQVIA™ Private Pay Direct Drug Plan Database.
Appendix B: Utilization Comparison: Private Drug Plans (Excluding Quebec) versus NPDUIS Public Drug Plans
To align with NPDUIS public plan data, which does not include Quebec, Figure B1 presents a utilization comparison of private plans with Quebec removed. The results further support the patterns observed in Figure 3.1, showing that private plans generally have fewer claims but longer days’ supply per claim, as well as lower costs per claimant compared to NPDUIS public plans.
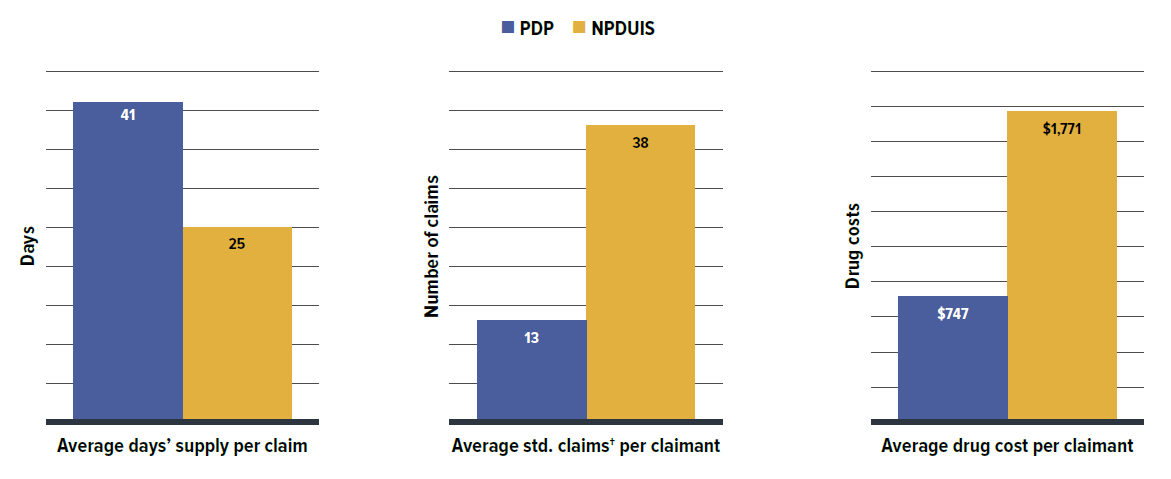
Figure description
| Private drug plans | NPDUIS public drug plans | |
|---|---|---|
| Average days’ supply per claim | 41 | 25 |
| Average standard claims per claimant | 13 | 38 |
| Average drug cost per claimant | $747 | $1,771 |
* Based on the most recent available data, private drug plan (PDP) data were reported by calendar year through 2023, while NPDUIS public drug plan data were aggregated for the fiscal year 2022/23.
† The number of claims was converted to a standard 30-day prescription size for more accurate comparisons between the two plan types.
Data source: IQVIA™ Private Pay Direct Drug Plan Database; National Prescription Drug Utilization Information System Database, Canadian Institute for Health Information.
Appendix C: Plan Sponsor Size and High-Cost Drug Use
Figure C1 presents the cost share of high-cost drugs by plan sponsor size in private drug plans for 2023, along with the number of high-cost drugs reimbursed by each size of plans. It shows that the largest-sized sponsors (over 1,000 claimants) reimbursed nearly all high-cost drugs identified in Figure 2.7, likely reflecting the broader range of patient conditions covered by these plans. Interestingly, their contribution to high-cost drug spending proportionally aligns with their share of overall drug costs, as seen in Figure 3.6 This suggests that a larger claimant pool may increase access to high-cost drugs without significantly adding extra cost burden to the overall drug costs of all claimants.
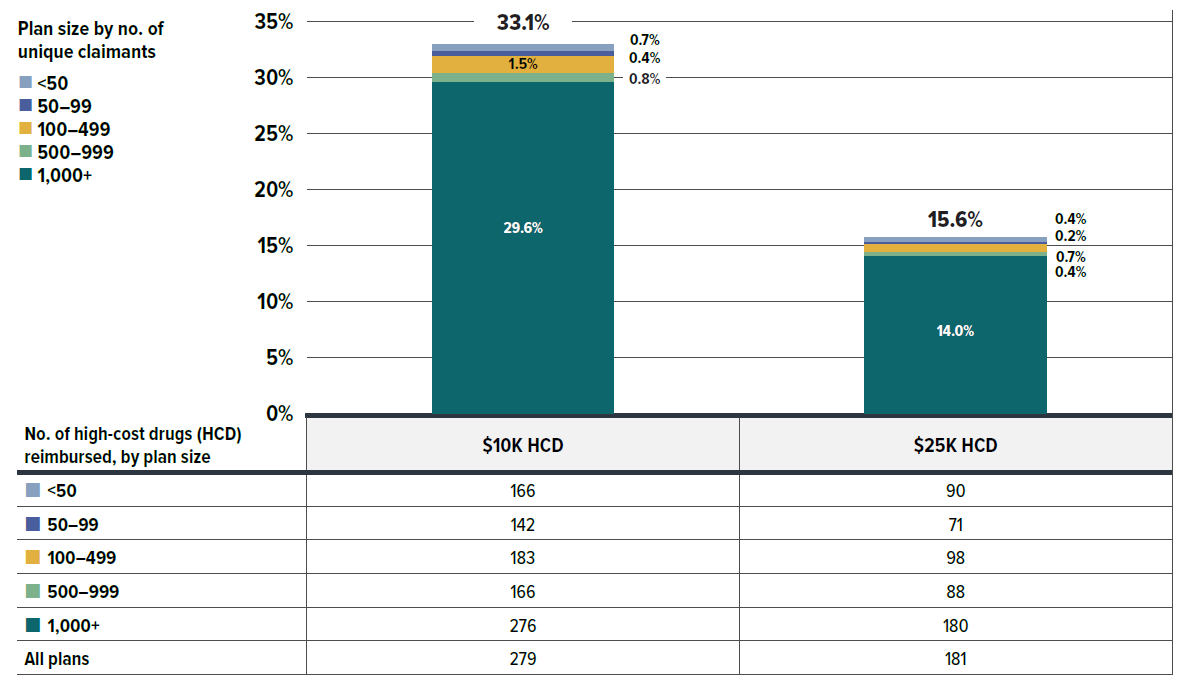
Figure description
| Plan size by number of claimants | Over 1,000 | 500 to 999 | 100 to 499 | 50 to 99 | Under 50 | All plans |
|---|---|---|---|---|---|---|
| Cost share of high-cost drugs over $10,000 | 29.6% | 0.8% | 1.5% | 0.4% | 0.7% | 33% |
| Cost share of high-cost drugs over $25,000 | 14.0% | 0.4% | 0.7% | 0.2% | 0.4% | 16% |
| Cost share of drugs under $10,000 | 89.3% | 2.5% | 4.5% | 1.3% | 2.4% | - |
| Cost share of drugs under $25,000 | 59.7% | 1.7% | 3.0% | 0.9% | 1.6% | - |
| Cost share of all drugs | 75.3% | 2.1% | 3.8% | 1.1% | 2.0% | - |
| Number of high-cost drugs reimbursed, by plan size (number of unique claimants) | High-cost drugs over $10,000 | High-cost drugs over $25,000 |
|---|---|---|
| Under 50 | 166 | 90 |
| 50 to 99 | 142 | 71 |
| 100 to 499 | 183 | 98 |
| 500 to 999 | 166 | 88 |
| Over 1,000 | 276 | 180 |
| All plans | 279 | 181 |
* Drug plan sponsor size is defined based on the number of unique claimants in a given year.
Data source: IQVIA™ Private Pay Direct Drug Plan Database.
Appendix D: 50 Top-Selling Medicines (Most Utilized Molecule/Strength/Form) by Drug Cost Share, Private Drug Plans, 2023 (%)
| Rank | Medicinal ingredient (strength) | Brand- or biologic-only medicine | Use per 1,000 claimants* | Cost share of all medicines |
|---|---|---|---|---|
| 1 | Semaglutide (1.34 mg/mL) | Yes | 45.0 | 6.1% |
| 2 | Infliximab (100 mg) | – | 1.4 | 4.2% |
| 3 | Adalimumab (40 mg/0.8 mL) | – | 2.0 | 3.0% |
| 4 | Ustekinumab (90 mg/mL) | Yes | 0.8 | 2.5% |
| 5 | Elexacaftor/tezacaftor/ivacaftor and ivacaftor (100 mg/50 mg/75 mg/100 mg) | Yes | 0.1 | 1.6% |
| 6 | Dupilumab (150 mg/mL) | Yes | 0.8 | 1.3% |
| 7 | Budesonide/formoterol (200 mg/6 mg) | Yes | 31.5 | 1.1% |
| 8 | Vedolizumab (300 mg) | Yes | 0.5 | 1.0% |
| 9 | Liraglutide (6 mg/mL) | Yes | 4.0 | 0.8% |
| 10 | Ocrelizumab (30 mg/mL) | Yes | 0.3 | 0.8% |
| 11 | Botulinum toxin A (100 U) | Yes | 3.5 | 0.7% |
| 12 | Risankizumab (150 mg/mL) | Yes | 0.4 | 0.7% |
| 13 | Aflibercept (2 mg/0.05 mL) | Yes | 0.7 | 0.7% |
| 14 | Golimumab (50 mg/0.5 mL) | Yes | 0.4 | 0.7% |
| 15 | Guselkumab (100 mg/mL) | Yes | 0.4 | 0.7% |
| 16 | Empagliflozin (25 mg) | Yes | 8.0 | 0.7% |
| 17 | Secukinumab (150 mg/mL) | Yes | 0.4 | 0.6% |
| 18 | Esomeprazole magnesium (40 mg) | – | 16.0 | 0.6% |
| 19 | Etanercept (50 mg/mL) | – | 0.5 | 0.6% |
| 20 | Dexlansoprazole (60 mg) | Yes | 14.6 | 0.5% |
| 21 | Lisdexamfetamine dimesilate (40 mg) | Yes | 8.0 | 0.5% |
| 22 | Lisdexamfetamine dimesilate (30 mg) | Yes | 10.1 | 0.5% |
| 23 | Empagliflozin (10 mg) | Yes | 6.9 | 0.5% |
| 24 | Upadacitinib (15 mg) | Yes | 0.4 | 0.5% |
| 25 | Escitalopram oxalate (10 mg) | – | 35.0 | 0.5% |
| 26 | Omalizumab (150 mg/mL) | Yes | 0.4 | 0.5% |
| 27 | Varicella zoster (50 mcg/0.5 mL) | Yes | 17.6 | 0.5% |
| 28 | Ofatumumab (20 mg/0.4 mL) | Yes | 0.2 | 0.4% |
| 29 | Methylphenidate HCL (54 mg) | – | 5.5 | 0.4% |
| 30 | Methylphenidate HCL (36 mg) | – | 8.0 | 0.4% |
| 31 | Rivaroxaban (20 mg) | – | 4.9 | 0.4% |
| 32 | Efinaconazole (10%) | Yes | 15.7 | 0.4% |
| 33 | Certolizumab pegol (200 mg/mL) | Yes | 0.3 | 0.4% |
| 34 | Ixekizumab (80 mg/mL) | Yes | 0.2 | 0.4% |
| 35 | Progesterone (100 mg) | – | 15.4 | 0.4% |
| 36 | Lisdexamfetamine dimesilate (50 mg) | Yes | 4.5 | 0.4% |
| 37 | Pantoprazole sodium (40 mg) | – | 58.0 | 0.3% |
| 38 | Bictegravir/emtricitabine/tenofovir alafenamide (50 mg/200 mg/25 mg) | Yes | 0.3 | 0.3% |
| 39 | Emtricitabine/tenofovir alafenamide (200 mg/25 mg) | Yes | 0.5 | 0.3% |
| 40 | Eculizumab (10 mg/mL) | Yes | 0.01 | 0.3% |
| 41 | Lisdexamfetamine dimesilate (20 mg) | Yes | 9.1 | 0.3% |
| 42 | Insulin glargine (100 U/mL) | Yes | 5.9 | 0.3% |
| 43 | Omalizumab (150 mg) | Yes | 0.2 | 0.3% |
| 44 | Insulin aspart (100 U/mL) | – | 6.7 | 0.3% |
| 45 | Epinephrine HCL (0.3 mg) | Yes | 14.5 | 0.3% |
| 46 | Escitalopram oxalate (20 mg) | – | 20.0 | 0.3% |
| 47 | Mepolizumab (100 mg/mL) | Yes | 0.1 | 0.3% |
| 48 | Mesalamine (1,200 mg) | Yes | 1.9 | 0.3% |
| 49 | Insulin degludec (200 U/mL) | Yes | 2.3 | 0.3% |
| 50 | Vortioxetine (10 mg) | Yes | 4.5 | 0.3% |
| Brand- or biologic-only medicines share of top 50 | 71.6% | |||
| Top 50 share of all medicines | 40.3% | |||
* The rate of use per 1,000 claimants for the listed top medicines may differ slightly from Figure 2.6 for the same medicinal ingredient, as Appendix D presents data at the ingredient/strength/form level, while Figure 2.6 is merged to the chemical ingredient level.
Data source: IQVIA™ Private Pay Direct Drug Plan Database.