
CompassRx, 9th Edition
Annual Public Drug Plan Expenditure Report, 2021/22
ISSN 2369-0518
Cat. No. H79-6E-PDF
December 2023
PDF - 1.2 MB
Table of Contents
- Executive Summary
- Key Findings
- Introduction
- Methods
- Limitations
- Analyses
- 1. Trends in Prescription Drug Expenditures, 2016/17 to 2021/22
- 2. The Drivers of Drug Costs, 2020/21 to 2021/22
- 3. The Drivers of Dispensing Costs, 2020/21 to 2021/22
- References
- Appendix A: Drug Reviews and Approvals
- Appendix B: Distribution of Patients on Biosimilar Initiative Medicines by Jurisdiction, 2021/22
- Appendix C: Biosimilar Switching Initiatives by Canadian Public Payers
- Appendix D: 50 Top-Selling Medicines (Most Utilized Molecule/Strength/Form) by Drug Cost, NPDUIS Public Drug Plans, 2021/22 ($million)
- Appendix E: Top 50 Patented Medicines by Drug Cost, NPDUIS Public Drug Plans, 2021/22 ($million)
- Appendix F: Top 50 Multi-Source Generic Drugs by Drug Cost, NPDUIS Public Drug Plans, 2021/22 ($million)
- Appendix G: Top 50 Single-Source Non-Patented Medicines by Drug Cost, NPDUIS Public Drug Plans, 2021/22 ($thousand)
- Appendix H: Top 50 Manufacturers by Drug Cost, NPDUIS Public Drug Plans, 2021/22 ($million)
About CompassRx
CompassRx is an annual Patented Medicine Prices Review Board (PMPRB) publication that explores trends in prescription drug expenditures in Canadian public drug plans. It focuses on the pressures that contribute to the annual change in drug and dispensing costs, including the switch in use between lower- and higher-priced drugs and changes in the beneficiary population, drug prices, and the volume of drugs used, as well as other key factors.
About the PMPRB
The Patented Medicine Prices Review Board (PMPRB) is an independent quasi-judicial body established by Parliament in 1987. The PMPRB has a dual regulatory and reporting mandate: to ensure that prices at which patentees sell their patented medicines in Canada are not excessive; and to report on pharmaceutical trends of all medicines and on research and development spending by patentees.
The NPDUIS Initiative
The National Prescription Drug Utilization Information System (NPDUIS) is a research initiative established by federal, provincial, and territorial Ministers of Health in September 2001. It is a partnership between the PMPRB and the Canadian Institute for Health Information (CIHI).
Pursuant to section 90 of the Patent Act, the PMPRB has the mandate to conduct analysis that provides decision makers with critical information and intelligence on price, utilization, and cost trends so that Canada’s healthcare system has more comprehensive and accurate information on how medicines are being used and on sources of cost pressures.
The specific research priorities and methodologies for NPDUIS are established with the guidance of the NPDUIS Advisory Committee and reflect the priorities of the participating jurisdictions, as identified in the NPDUIS Research Agenda. The Advisory Committee is composed of representatives from public drug plans in British Columbia, Alberta, Saskatchewan, Manitoba, Ontario, New Brunswick, Nova Scotia, Prince Edward Island, Newfoundland and Labrador, Yukon, the Non-Insured Health Benefits (NIHB) Program, and Health Canada. It also includes observers from CIHI, the Canadian Agency for Drugs and Technologies in Health (CADTH), the Ministère de la Santé et des Services sociaux du Québec (MSSS), and the pan-Canadian Pharmaceutical Alliance (pCPA) Office.
Acknowledgements
This report was prepared by the Patented Medicine Prices Review Board (PMPRB) as part of the National Prescription Drug Utilization Information System (NPDUIS) initiative.
The PMPRB wishes to acknowledge the members of the NPDUIS Advisory Committee for their expert oversight and guidance in the preparation of this report. Please note that the statements and findings for this report do not necessarily reflect those of the members or their organizations.
Appreciation goes to Yvonne Zhang for leading this project, and to Tanya Potashnik, Kevin Pothier and Brian O’Shea for their oversight in the development of the report. The PMPRB also wishes to acknowledge the contribution of the analytical staff Lokanadha Cheruvu, and editorial staff Shirin Paynter.
Disclaimer
NPDUIS operates independently of the regulatory activities of the Board of the PMPRB. The research priorities, data, statements, and opinions expressed or reflected in NPDUIS reports do not represent the position of the PMPRB with respect to any regulatory matter. NPDUIS reports do not contain information that is confidential or privileged under sections 87 and 88 of the Patent Act, and the mention of a medicine in an NPDUIS report is not and should not be understood as an admission or denial that the medicine is subject to filings under sections 80, 81, or 82 of the Patent Act or that its price is or is not excessive under section 85 of the Patent Act.
Although based in part on data provided by the Canadian Institute for Health Information (CIHI), the statements, findings, conclusions, views, and opinions expressed in this report are exclusively those of the PMPRB and are not attributable to CIHI.
Contact Information
Patented Medicine Prices Review Board
Standard Life Centre
Box L40
333 Laurier Avenue West Suite 1400
Ottawa, ON K1P 1C1
Tel.: 1-877-861-2350
TTY 613-288-9654
Email: PMPRB.Information-Renseignements.CEPMB@pmprb-cepmb.gc.ca
Suggested Citation
Patented Medicine Prices Review Board. (2023). CompassRx, 9th edition: Annual Public Drug Plan Expenditure Report, 2021/22. Ottawa: PMPRB.
Executive Summary
Prescription drug expenditures for the NPDUIS public drug plans increased considerably by 6.8% in 2021/22, a faster pace than the 3.0% annual change to the Consumer Price Index (CPI) in Health and Personal CareFootnote I, with varying rates of change in its two main components: drug costs (which saw an increase of 8.4%) and dispensing costs (which saw an increase of 0.1%). The overall growth in prescription drug expenditures continued to be primarily driven by notable increases in the use of newer and higher-cost drugs.
The PMPRB’s CompassRx report monitors and analyzes the cost pressures driving changes in prescription drug expenditures in Canadian public drug plans. This ninth edition of CompassRx provides insight into the factors driving growth in drug and dispensing costs in 2021/22, as well as a retrospective review of recent trends in public drug plan costs and utilization.
The main data source for this report is the National Prescription Drug Utilization Information System (NPDUIS) Database at the Canadian Institute for Health Information (CIHI), which includes data for the following jurisdictions: British Columbia, Alberta, Saskatchewan, Manitoba, Ontario, New Brunswick, Nova Scotia, Prince Edward Island, Newfoundland and Labrador, Yukon, and the Non-Insured Health Benefits Program.
The findings from this report will inform policy discussions and aid decision makers in anticipating and responding to evolving cost pressures.
Key Findings
The key findings cover the three areas of analysis in CompassRx (see Analyses): the trends in prescription drug expenditures; the drivers of drug costs; and the drivers of dispensing costs.
Prescription drug expenditures
Prescription drug expenditures for the NPDUIS public drug plans grew by 6.8% in 2021/22, following a 4.2% increase in 2020/21.
- Between 2016/17 and 2021/22, the total prescription drug expenditures for Canada’s public drug plans rose by $3.1 billion, for a compound annual growth rate of 4.9%.
- Drug costs, which represent 83% of prescription drug expenditures, grew by 8.4% from 2020/21 to 2021/22, while dispensing costs, which account for the remaining 17% of expenditures, grew by 0.1%.
- The NPDUIS public drug plans paid an average of 88% of the total $13.2 billion in prescription costs for 290 million prescriptions dispensed to 6.2 million active beneficiaries in 2021/22.
- The overall NPDUIS public plan beneficiary population increased by 3.6% from 2020/21 to 2021/22. Approximately 214 thousand more Canadians filled a prescription for reimbursement to public drug plans than in 2020/21—the first year of the COVID-19 pandemic.
Drug costs
Drug cost growth for the NPDUIS public plans in 2021/22 was primarily driven by a sustained increase in the use of higher-cost drugs and limited cost-saving measures.
- The increased use of higher-cost drugs continued to be the most pronounced driver in 2021/22, pushing costs upward by 8.1%, while the impact from the declined use of direct acting antivirals (DAAs) was negligible.
- The patented market segment, which accounted for 52.3% of public plan drug costs in 2021/22, grew modestly by 0.5%, with a considerable 10.0% rise in costs for medicines exceeding $10,000 in annual treatment costs.
- More than 60% of the total drug costs in 2021/22 were attributable to just 7.5% of public drug plan beneficiaries. High-cost drugs, which were used by 3% of beneficiaries, accounted for 36.8% of costs.
- In a reversal of the trends reported for 2020/21, a rebound in the number of active beneficiaries resulted in a 2.5% demographic push effect in 2021/22, while the reduced number of claims per patient caused a 0.2% pull-down volume effect.
- In 2021/22, price change had a small (0.3%) pull-down effect, while the substitution effect gained strength, pulling drug costs down by 1.7%.
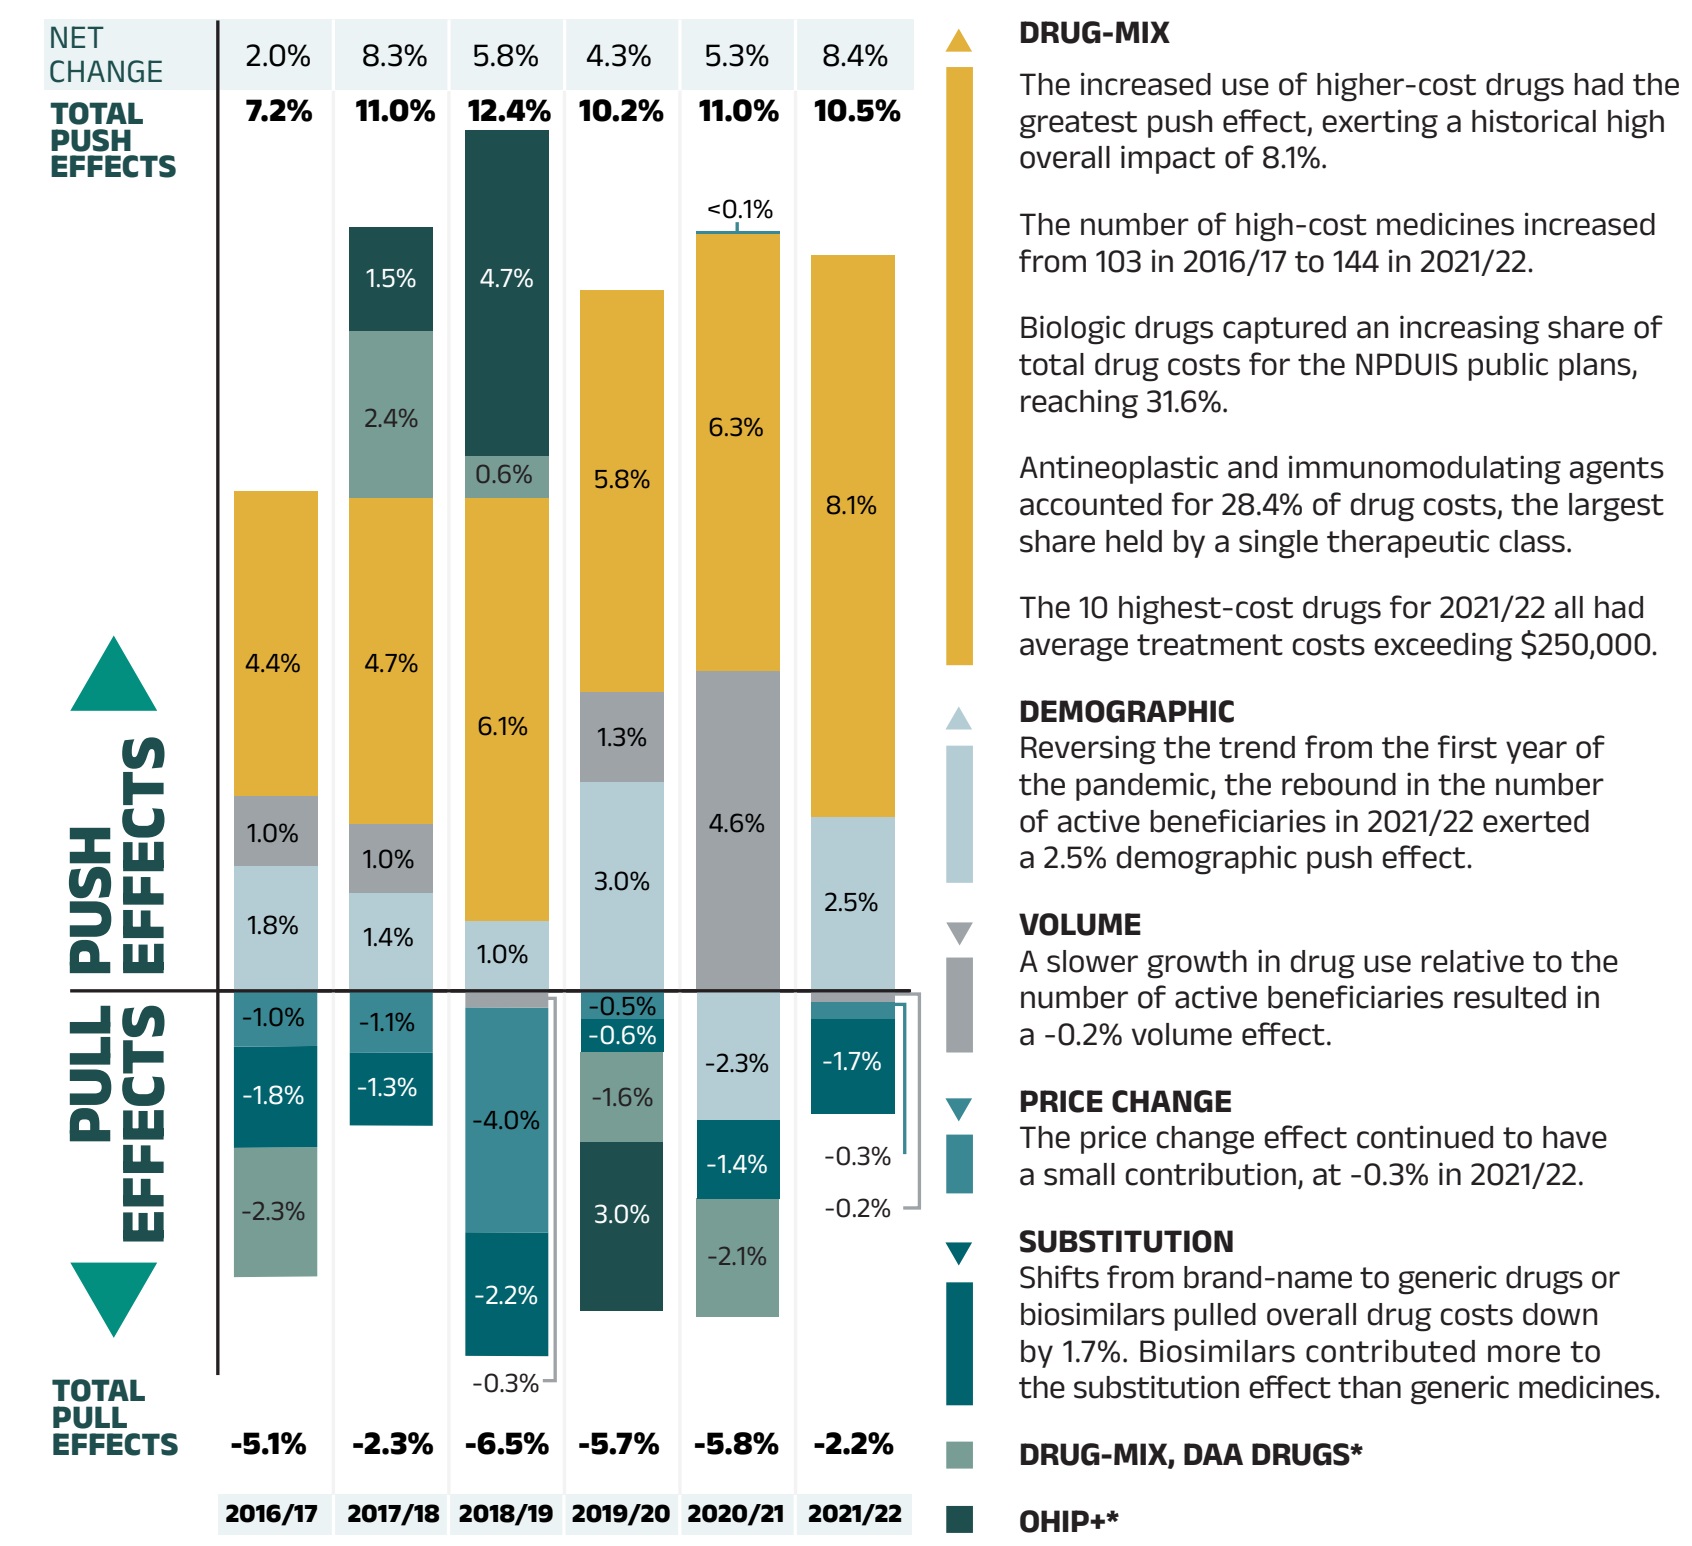
Figure – Text version
| 2016/17 | 2017/18 | 2018/19 | 2019/20 | 2020/21 | 2021/22 | |
|---|---|---|---|---|---|---|
OHIP+ |
- |
1.5% |
4.7% |
-3.0% |
- |
- |
Drug-mix, direct-acting antiviral (DAA) drugs |
-2.3% |
2.4% |
0.6% |
-1.6% |
- |
- |
Drug-mix |
4.4% |
4.7% |
6.1% |
5.8% |
6.3% |
8.1% |
Volume |
1.0% |
1.0% |
-0.3% |
1.3% |
4.6% |
-0.2% |
Demographic |
1.8% |
1.4% |
1.0% |
3.0% |
-2.3% |
2.5% |
Price change |
-1.0% |
-1.1% |
-4.0% |
-0.5% |
-2.1% |
-1.7% |
Substitution |
-1.8% |
-1.3% |
-2.2% |
-0.6% |
-1.4% |
0.3% |
Total push effects |
7.2% |
11.0% |
12.4% |
10.2% |
11.0% |
10.5% |
Total pull effects |
-5.1% |
-2.3% |
-6.5% |
-5.7% |
-5.8% |
-2.2% |
Net change |
2.0% |
8.3% |
5.8% |
4.3% |
5.3% |
8.4% |
| Drug-mix | |
|---|---|
Demographic |
Reversing the trend from the first year of the pandemic, the rebound in the number of active beneficiaries in 2021/22 exerted a 2.5% demographic push effect. |
Volume |
A slower growth in drug use relative to the number of active beneficiaries resulted in a -0.2% volume effect. |
Price change |
The price change effect continued to have a small contribution, at -0.3% in 2021/22. |
Substitution |
Shifts from brand-name to generic drugs or biosimilars pulled overall drug costs down by 1.7%. Biosimilars contributed more to the substitution effect than generic medicines. |
Note: This analysis is based on publicly available pricing information. It does not reflect confidential drug price discounts negotiated by the pan-Canadian Pharmaceutical Alliance on behalf of the public plans.
Data from the NIHB Program is not included in 2020/21 and 2021/22.
Values may not add to totals due to rounding and the cross effect.
* Not reported since 2020/21 (see Methods).
Data source: National Prescription Drug Utilization Information System Database, Canadian Institute for Health Information.
Dispensing costs
Dispensing costs in the NPDUIS public plans increased at a much slower rate than drug costs in 2021/22, with a modest (0.1%) rebound from the negative growth in 2020/21.
- The growth in dispensing costs was 0.1% (or $1.7 million) in 2021/22, a modest rebound from the -0.2% rate of change in 2020/21, though results varied among individual plans.
- In a reversal of the 2020/21 trend, an increase in the number of active beneficiaries was responsible for the largest annual contribution to dispensing growth in 2021/22, pushing costs up by 3.2%.
- In contrast, larger prescription sizes resulting from lifting the temporary COVID-19 pandemic-related dispensing frequency policies pulled costs down by a sizable 2.3% in 2021/22.
- The decrease in the volume of drugs dispensed to patients and the higher overall average dispensing fee per prescription changed costs by -1.0% and 0.4%, respectively.
Introduction
Canadian public drug plan expenditures represent a significant portion of the overall healthcare budget. The Canadian Institute for Health Information (CIHI) reported that the total cost of prescription drugs in Canada was $36.8 billion in 2021, with the largest component financed by the public drug plans (44%Footnote II) and the remainder paid by private plans or out of pocket by households and individuals.Reference 1
This edition of the report focuses on the 2021/22 fiscal year, with a retrospective look at recent trends. The results of this study will aid stakeholders in anticipating and responding to the evolving cost pressures that affect Canada’s public drug plans.
The analysis focuses on the public drug plans participating in the National Prescription Drug Utilization Information System (NPDUIS) initiative, which includes all provincial public plans (with the exception of Quebec), Yukon, and the Non-Insured Health Benefits (NIHB) Program. These plans account for approximately one third of the total annual spending on prescription drugs in Canada.
Each public drug plan reimburses eligible beneficiaries according to its own specific plan design and implements policies related to the reimbursement of drug prices and dispensing fees. Summaries of the plan designs and policies are available on the PMPRB website.
Health Canada, the PMPRB, and the Canadian Agency for Drugs and Technologies in Health (CADTH) are responsible for drug approvals, price reviews, and health technology assessments, respectively. Details of the 2021/22 approvals and reviews are provided in Appendix A of this report.
Methods
The main data source for this report is the National Prescription Drug Utilization Information System (NPDUIS) Database, developed by the Canadian Institute for Health Information (CIHI). This database houses pan-Canadian information on public drug programs, including claims-level data collected from the plans that participate in the NPDUIS initiative. Data is reported on a fiscal year basis.
Results are presented for the following public drug plans: British Columbia, Alberta, Saskatchewan, Manitoba, Ontario, New Brunswick, Nova Scotia, Prince Edward Island, Newfoundland and Labrador, Yukon, and the Non-Insured Health Benefits (NIHB) Program.
The analysis focuses exclusively on data for beneficiaries that met their deductible and received public reimbursement. Results reported for Saskatchewan and Manitoba include the accepted prescription drug expenditures for individuals who are eligible for coverage but have not submitted an application and, therefore, do not have a defined deductible.
In British Columbia, active beneficiaries who received public reimbursement in 2021/22 solely due to the use of COVID-19 Rapid Antigen Tests under the exceptional Plan Z (Assurance) Footnote III coverage, and their associated claims, were excluded from the analysis. The inclusion of such beneficiaries who may not typically qualify for public reimbursement for regular drug use could skew the data. Future editions of the CompassRx report will assess the dynamics of Plan Z and adjust the inclusion criteria accordingly.
Long-term care (LTC) sub-plans may not have a typical dispensing frequency due to the more specialized needs of their patients. The LTC sub-plan prescriptions were only separated out from the dispensing costs analysis in Ontario due to a notable influence from their size.
The data from the NIHB Program was not available; therefore, it was not included in the results for 2020/21 and 2021/22. It is worth noting that the impact of NIHB data on the overall growth trends among NPDUIS public drug plans would be minimal (approximately 0.1%).
From 2015/16 to 2020/21, direct acting antiviral (DAA) drugs for hepatitis C were presented separately to highlight their continued impact on expenditures. However, given their diminishing impact on public plan spending, the effect of DAAs is no longer shown separately from the overall drug-mix effect as of this edition. For historical data, please consult previous editions of CompassRx.
Ontario’s OHIP+ program was previously treated as a separate factor, known as the OHIP+ effect in the cost driver analysis, capturing the overall impact of the plan design changes from 2017/18 to 2019/20. As the program has stabilized, starting from the 2020/21 edition, CompassRx no longer reports the OHIP+ effect separately. For historical data, please consult previous editions.
To offer more insight into the use of medicines and the sources of cost pressures, a list of the 50 top-selling medicines (most utilized molecules/strengths/forms) by drug cost in the NPDUIS public drug plans is provided in Appendix D.
The analysis of drug and dispensing cost drivers follows the methodological approach detailed in the PMPRB’s The Drivers of Prescription Drug Expenditures: A Methodological Report.Reference 2 Drug costs include any associated markups. Analyses of the average prescription size, as well as pricing, are limited to oral solids to avoid data reporting inconsistencies that may exist in the days’ supply and unit reporting of other formulations. Anatomical Therapeutic Chemical (ATC) levels reported here are based on CIHI NPDUIS data and reflect the ATC classification system maintained by the World Health Organization Collaborating Centre for Drug Statistics Methodology. Vaccines and pharmacy services are not represented in this report.
The methodological approach used in CompassRx is reviewed on an annual basis and updated as needed to respond to changes in the pharmaceutical landscape and data access. Thus, the scope of the report and the data analyzed may vary slightly from year to year. New changes to the methodology are detailed in the Methods and Limitations sections of each edition.
A glossary of terms for NPDUIS studies is available on the PMPRB website.Limitations
Drug expenditure and utilization levels vary widely among the jurisdictions and cross comparisons of the results are limited by differences in the plan designs and policies of the individual public drug plans, as well as the demographic and disease profiles of the beneficiary populations.
For example, public drug plans in British Columbia, Saskatchewan, and Manitoba provide universal income-based coverage, while other provincial public drug plans offer specific programs for seniors, income assistance recipients, and other select patient groups. The NIHB provides universal care to its entire population. As Yukon is a small jurisdiction, any plan design changes will result in more significant fluctuations in their rates of growth.
The NPDUIS Database includes available sub-plan data specific to particular jurisdictions, such as Alberta, Nova Scotia, and Prince Edward Island. This further limits the comparability of results across plans. A comprehensive summary of the sub-plans available in the database, along with their eligibility criteria, is available on the PMPRB website.
Drug claims for beneficiaries in Ontario who also have coverage through the NIHB are primarily reimbursed by the Ontario Drug Benefit program, with any remaining drug costs covered by the NIHB. Therefore, claims reported for the NIHB include those coordinated with the Ontario Drug Benefit program.
Totals for the NPDUIS public drug plans are heavily skewed toward Ontario due to its population size.
High-cost medicines are defined as having an annual treatment cost greater than $10,000. If medicines reach this threshold in any given year, they are included in the count for all other years. Thus, the number and composition of high-cost medicines in any given year may vary depending on the time of analysis.
The number of oncology medicines and other high-cost medicines covered by public plans may be underestimated, as some are reimbursed through specialized programs, such as cancer care, that are not captured in the data.
The reported drug costs are the amounts accepted toward reimbursement by the public plans, which may not reflect the amounts paid by the plan/program and do not reflect off-invoice price rebates or price reductions resulting from confidential product listing agreements.
The prescription drug expenditure data for the public drug plans reported in this study represents only one segment of the Canadian pharmaceutical market, and hence the findings should not be extrapolated to the overall market.
This edition of the CompassRx reports on data up to and including the 2021/22 fiscal year. Any plan changes or other developments that have taken place since then will be captured in future editions.
Analyses
The components that make up prescription drug expenditures can be expressed from two perspectives: cost-sharing and pharmaceutical.
From a cost-sharing perspective, the expenditures reported in this study represent the total amount accepted for reimbursement by the NPDUIS public drug plans. These amounts reflect both the plan-paid and beneficiary-paid portions of the prescription costs, such as co-payments and deductibles.
From a pharmaceutical pricing perspective, the cost of a prescription drug plan in this section is measured by the total of two components: the cost of the prescription drugs (including associated markups) and the cost for dispensing the prescription drugs, represented here by this formula:
Prescription Drug Expenditures = Drug Costs + Dispensing Costs
The following sections detail each component of this formula by analyzing data trends and adding greater context in the form of Brief Insights.
1. Trends in Prescription Drug Expenditures, 2016/17 to 2021/22
Prescription drug expenditures for public plans increased by 6.8% in 2021/22, the second-highest rate of change since 2016/17. High-cost patented medicines continued to be the most significant contributor to the growth in public plan drug costs, offset in part by cost savings from generic and biosimilar substitution.
Brief Insights: Drug Plan Designs
The expenditure and utilization levels reported in this study depend on the specific plan design and policies of each jurisdiction, as well as the demographic and disease profiles of the beneficiary population. This affects the comparability of results across plans.
Supplementary reference documents providing information on individual public drug plan designs, policies governing markups and dispensing fees, and a glossary of terms are available on the PMPRB website.
There were no notable changes in public plan designs in 2021/22.
Prescription Drug Expenditures
Prescription Drug Expenditures = Drug Costs (83%) + Dispensing Costs (17%)
Between 2016/17 and 2021/22, annual prescription drug expenditures for the public drug plans grew at a compound annual growth rate of 4.9%, rising from $10.7 billion to $13.2 billion, with $0.8 billion of this growth seen over the last year (Figure 1.1).
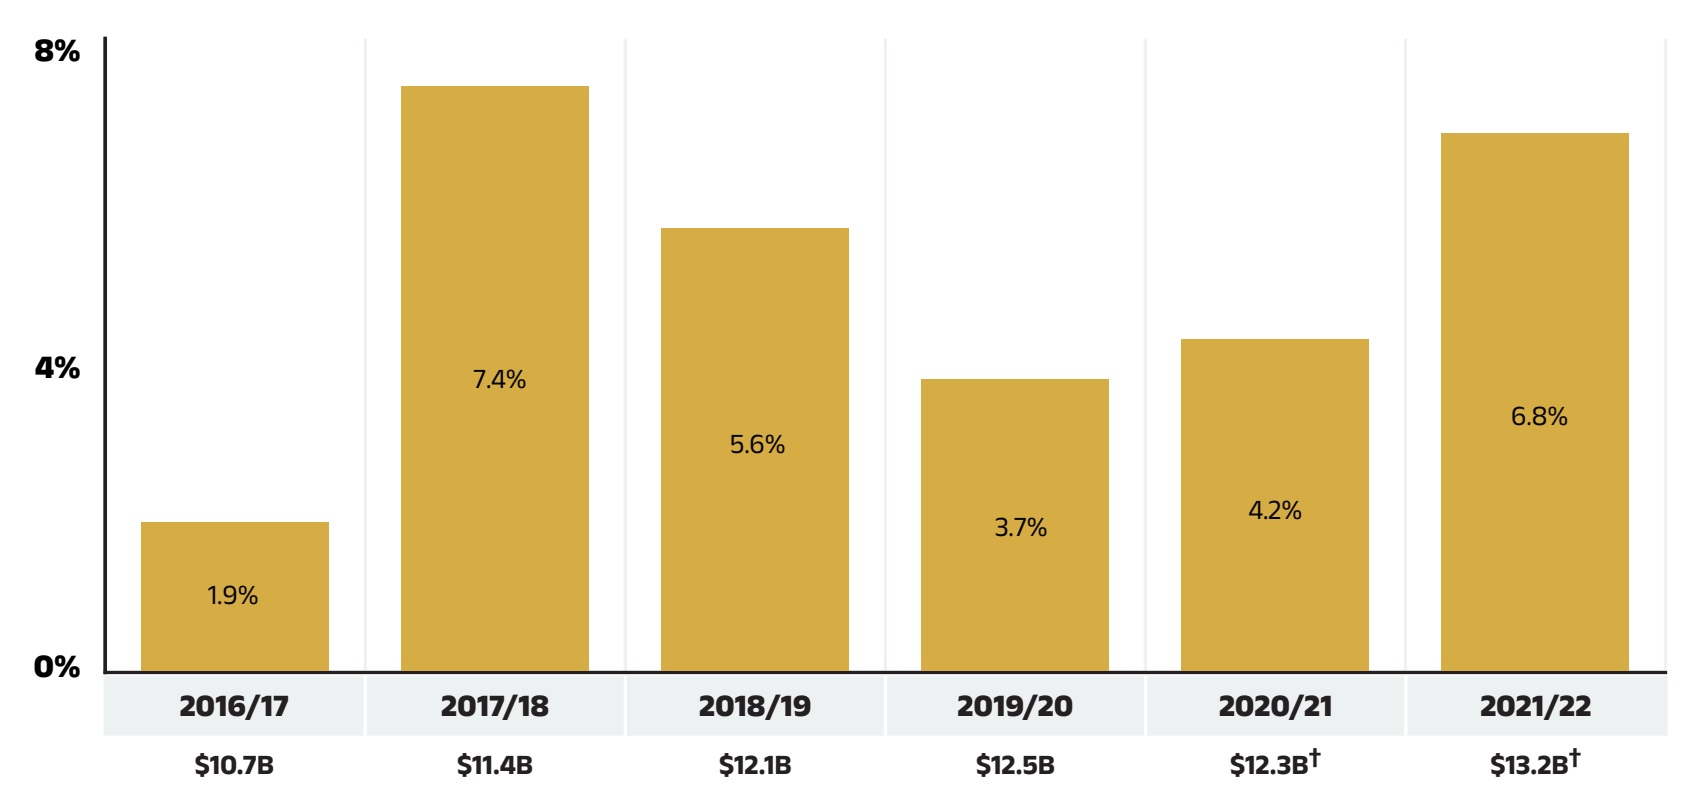
Figure 1.1 – Text version
| 2016/17 | 2017/18 | 2018/19 | 2019/20 | 2020/21 | 2021/22 | |
|---|---|---|---|---|---|---|
Rate of change |
1.9% |
7.4% |
5.6% |
3.7% |
4.2% |
6.8% |
Prescription drug expenditure (billions of dollars) |
$10.7B |
$11.4B |
$12.1B |
$12.5B |
$12.3B |
$13.2B |
Note: This analysis only includes data for beneficiaries that met their deductible and received public reimbursement.
* British Columbia, Alberta, Saskatchewan, Manitoba, Ontario, New Brunswick, Nova Scotia, Prince Edward Island, Newfoundland and Labrador, Yukon, and the Non-Insured Health Benefits Program.
†As of 2020/21, the total prescription drug expenditures, the annual rates of change and the CAGR were calculated without data from the NIHB program. The impact of NIHB data on the rate of change would be minimal (approximately 0.1%).
Data source: National Prescription Drug Utilization Information System Database, Canadian Institute for Health Information.
The overall growth in expenditures in 2021/22 consists of a 8.4% growth in drug costs (with associated markups) and a 0.1% increase in dispensing costs. Due to the disparity in their rates of growth, the drug cost component continued to capture a significantly greater share of overall expenditures (83%), while the dispensing costs share dropped to a new low (17%) (Figure 1.2).
These amounts reflect both the plan-paid portions of prescription costs and beneficiary-paid portions, such as co-payments and deductibles.
Beneficiary Share of Prescription Drug Expenditures
Prescription Drug Expenditures = Plan-paid (88%) + Beneficiary-paid (12%)
In 2021/22, in line with historical trends, public plans paid an average of 88% (Figure 1.2) of the total expenditures for prescription drugs that were eligible for reimbursement, with the remainder paid by the beneficiaries either out of pocket or through a third-party private insurer. The beneficiary-paid share varied across jurisdictions, ranging from 9% (New Brunswick) to 34% (Prince Edward Island).
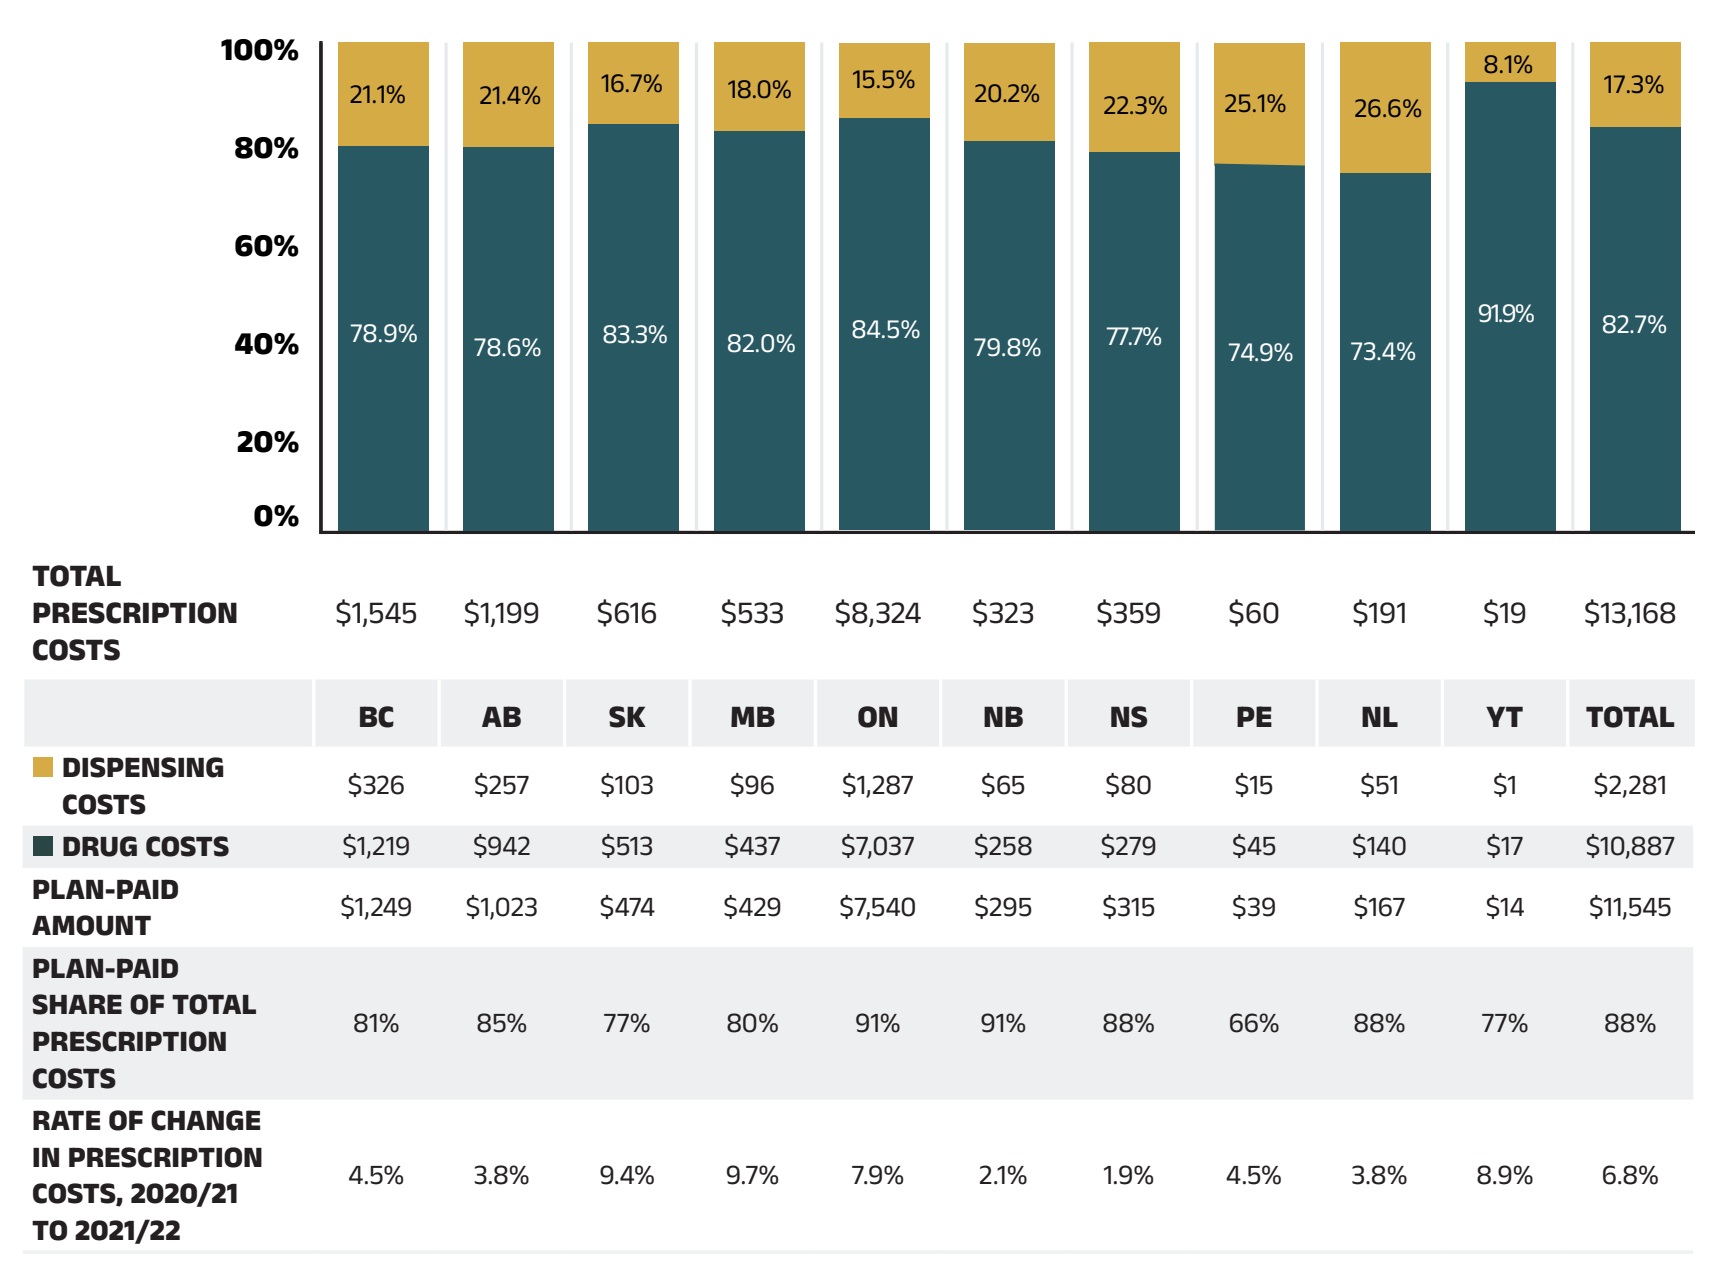
Figure 1.2 – Text version
| British Columbia | Alberta | Saskatchewan | Manitoba | Ontario | New Brunswick | Nova Scotia | Prince Edward Island | Newfoundland and Labrador | Yukon | Total | |
|---|---|---|---|---|---|---|---|---|---|---|---|
Total prescription cost (millions of dollars) |
$1,545 |
$1,199 |
$616 |
$533 |
$8,324 |
$323 |
$359 |
$60 |
$191 |
$19 |
$13,168 |
Dispensing cost share |
21.1% |
21.4% |
16.7% |
18.0% |
15.5% |
20.2% |
22.3% |
25.1% |
26.6% |
8.1% |
17.3% |
Drug cost share |
78.9% |
78.6% |
83.3% |
82.0% |
84.5% |
79.8% |
77.7% |
74.9% |
73.4% |
91.9% |
82.7% |
Dispensing costs (millions of dollars) |
$326 |
$257 |
$103 |
$96 |
$1287 |
$65 |
$80 |
$15 |
$51 |
$1 |
$2,281 |
Drug costs (millions of dollars) |
$1,219 |
$942 |
$513 |
$437 |
$7,037 |
$258 |
$279 |
$45 |
$140 |
$17 |
$10,887 |
Plan-paid amount (millions of dollars) |
$1,249 |
$1,023 |
$474 |
$429 |
$7,540 |
$295 |
$315 |
$39 |
$167 |
$14 |
$11,545 |
Plan-paid share of total prescription cost |
81% |
85% |
77% |
80% |
91% |
91% |
88% |
66% |
88% |
77% |
88% |
Rate of change in prescription costs, 2020/21 to 2021/22 |
4.5% |
3.8% |
9.4% |
9.7% |
7.9% |
2.1% |
1.9% |
4.5% |
3.8% |
8.9% |
6.8% |
Note: This analysis only includes data for beneficiaries that met their deductible and received public reimbursement. Markup amounts are captured in the drug costs. Values may not add to totals due to rounding.
Data source: National Prescription Drug Utilization Information System Database, Canadian Institute for Health Information.
The annual growth in prescription expenditures is a function of increases in the number of active beneficiaries and their drug costs. The COVID-19 pandemic caused sharp swings in the overall NPDUIS public plan beneficiary population over the past two years. In 2020/21, there was an unprecedented decline of 366,000 active beneficiaries, but a rebound of 214,000 active beneficiaries was observed in 2021/22, bringing the total number back to over 6 million. During this period, 6.2 million active beneficiaries filled 290 million prescriptions that were accepted towards a deductible or paid for (in full or in part) by the NPDUIS public drug plans. In 2021/22, seniors consistently made up the largest proportion (64%) of total active beneficiaries, though this share varied greatly across jurisdictions because of differences in plan design, eligibility, and demographics (Figure 1.3).
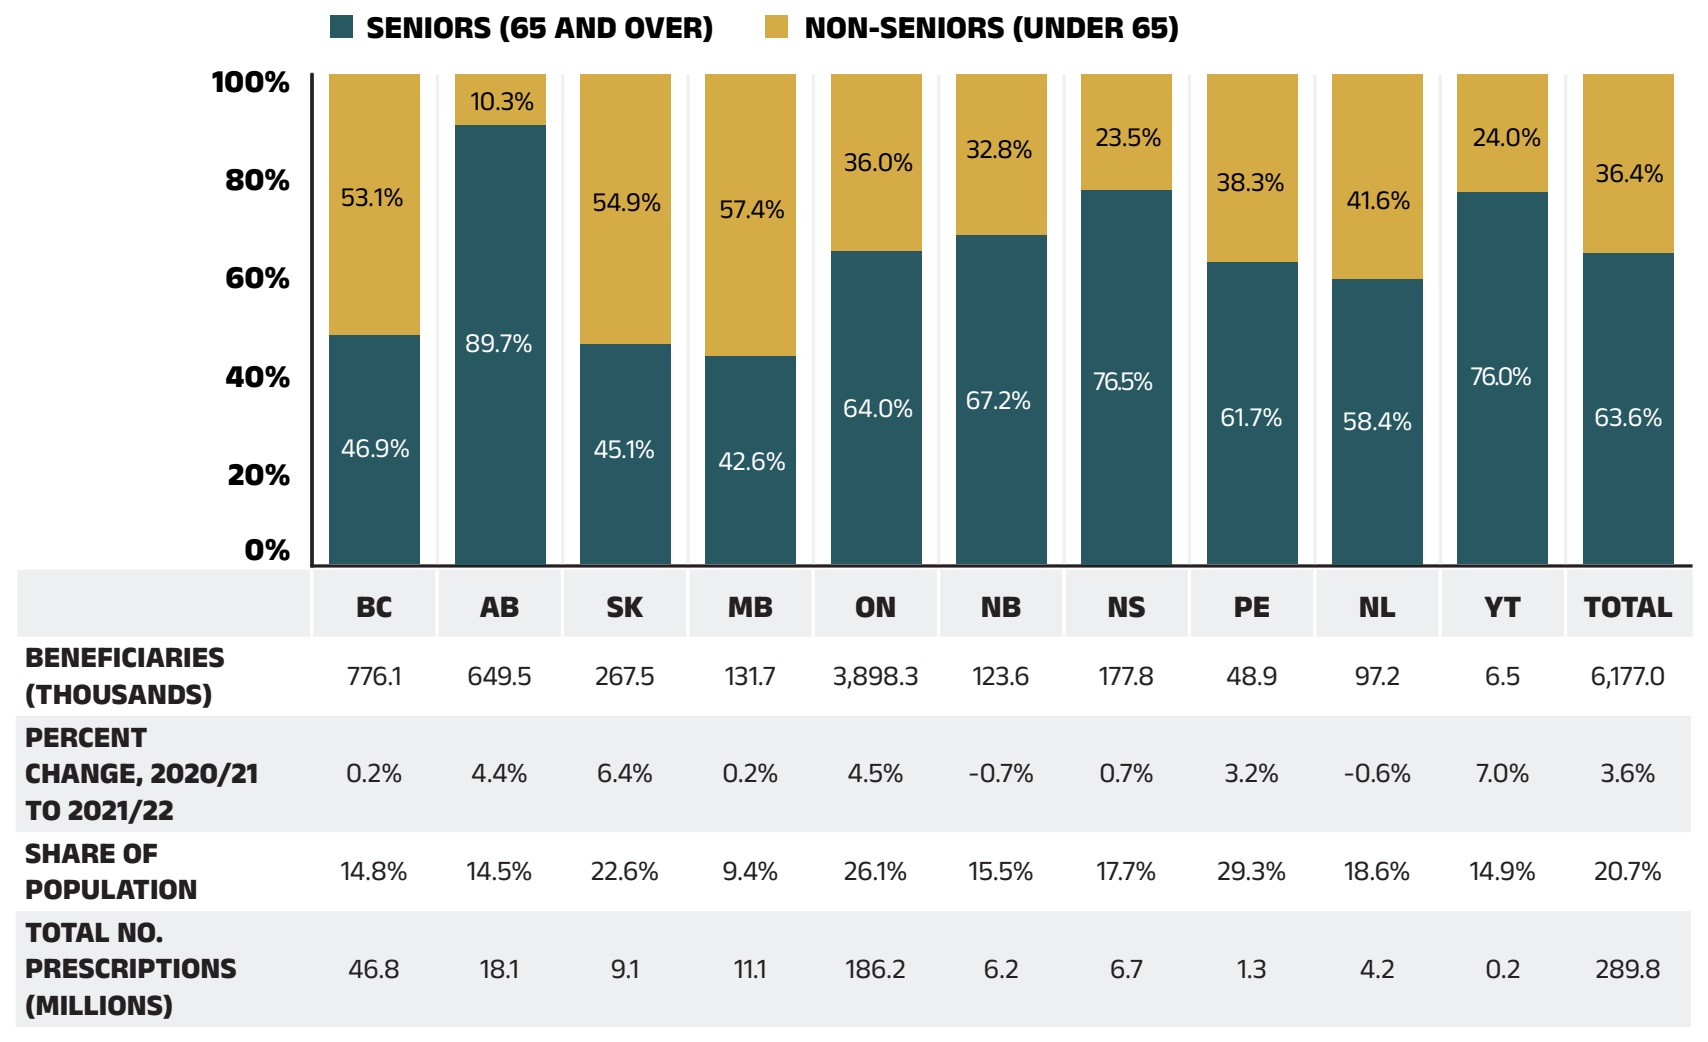
Figure 1.3 – Text version
| British Columbia | Alberta | Saskatchewan | Manitoba | Ontario | New Brunswick | Nova Scotia | Prince Edward Island | Newfoundland and Labrador | Yukon | Total | |
|---|---|---|---|---|---|---|---|---|---|---|---|
Seniors (65 and over) |
46.9% |
89.7% |
45.1% |
42.6% |
64.0% |
67.2% |
76.5% |
61.7% |
58.4% |
76.0% |
63.6% |
Non - seniors (under 65) |
53.1% |
10.3% |
54.9% |
57.4% |
36.0% |
32.8% |
23.5% |
38.3% |
41.6% |
24.0% |
36.4% |
Beneficiaries (thousands) |
776.1 |
649.5 |
267.5 |
131.7 |
3,898.3 |
123.6 |
177.8 |
48.9 |
97.2 |
6.5 |
6,177.0 |
Percent change, 2020/21 to 2021/22 |
0.2% |
4.4% |
6.4% |
0.2% |
4.5% |
-0.7% |
0.7% |
3.2% |
-0.6% |
7.0% |
3.6% |
Share of population |
14.8% |
14.5% |
22.6% |
9.4% |
26.1% |
15.5% |
17.7% |
29.3% |
18.6% |
14.9% |
20.7% |
Total no. prescriptions (millions) |
46.8 |
18.1 |
9.1 |
11.1 |
186.2 |
6.2 |
6.7 |
1.3 |
4.2 |
0.2 |
289.8 |
Note: This analysis only includes data for beneficiaries that met their deductible and received public reimbursement. Not all the sub-plan data for the jurisdictions is reported to NPDUIS, which may impact the distribution of senior and non-senior shares.
Data source: National Prescription Drug Utilization Information System Database, Canadian Institute for Health Information; Statistics Canada, Table: 17-10-0009-01 (formerly CANSIM 051-0005).
Drug Costs of Prescription Drug Expenditures
Prescription Drug Expenditures = Drug Costs (83%) + Dispensing Costs (17%)
Drug costs, including average reported markups of about 5%Reference IV, represent the largest component of prescription drug expenditures and have the greatest influence on overall trends. Following an increase of 5.3% in 2020/21, drug costs rose by a notable rate of 8.4% in 2021/22. The average rate of change over the last three years was 5.9% across the public plans.
Figure 1.4 reports the annual rate of change in drug costs for each NPDUIS drug plan from 2019/20 to 2021/22. Drug costs increased in all plans in 2021/22, though the rates of change varied across jurisdictions, ranging from 3.1% in New Brunswick to 11.2% in Manitoba.
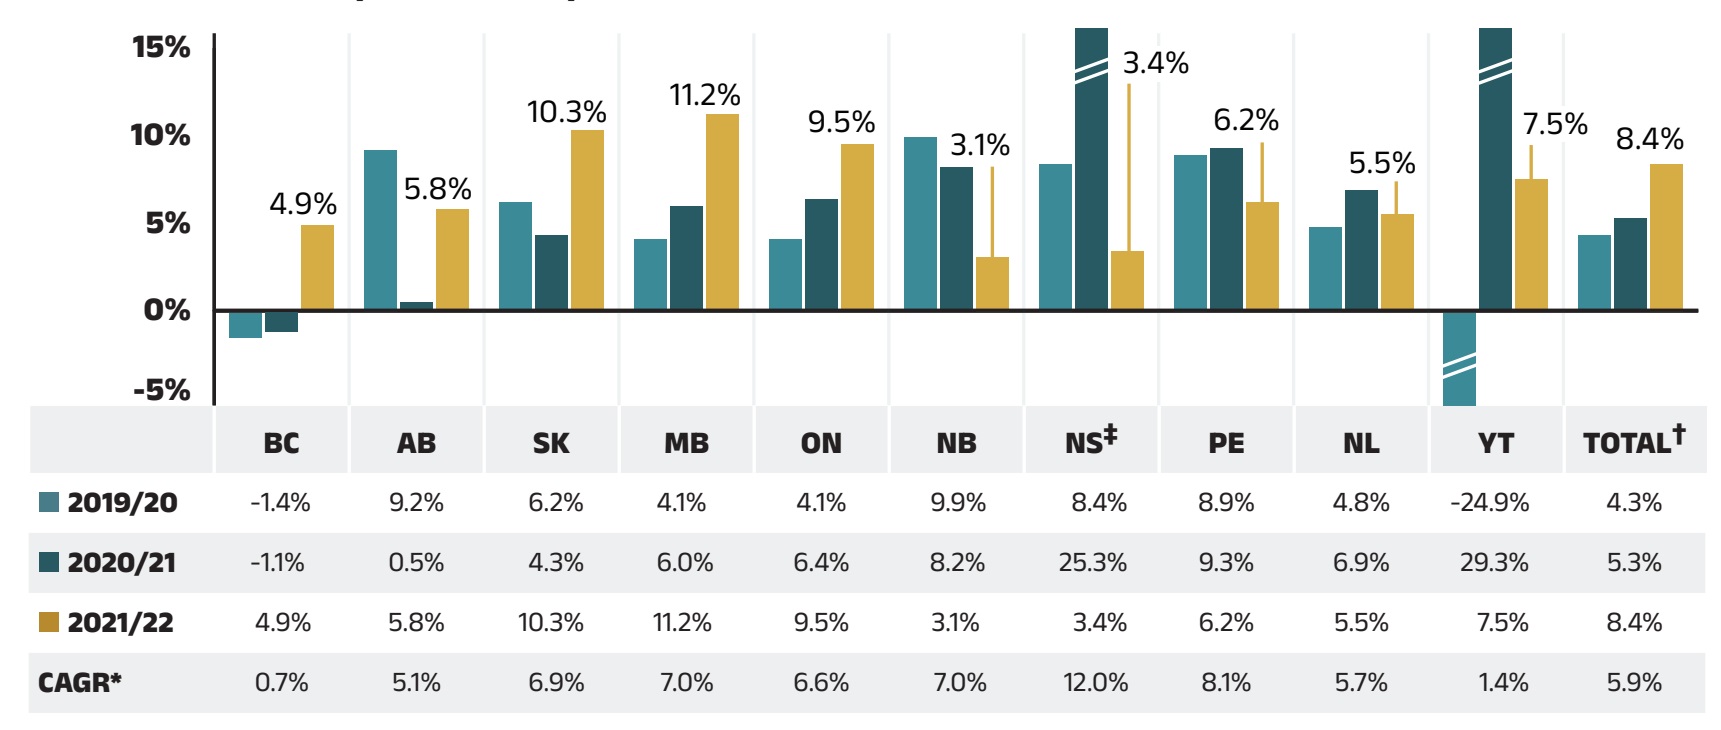
Figure 1.4 – Text version
| British Columbia | Alberta | Saskatchewan | Manitoba | Ontario | New Brunswick | Nova Scotia | Prince Edward Island | Newfoundland and Labrador | Yukon | Total | |
|---|---|---|---|---|---|---|---|---|---|---|---|
2019/20 |
-1.4% |
9.2% |
6.2% |
4.1% |
4.1% |
9.9% |
8.4% |
8.9% |
4.8% |
-24.9% |
4.3% |
2020/21 |
-1.1% |
0.5% |
4.3% |
6.0% |
6.4% |
8.2% |
25.3% |
9.3% |
6.9% |
29.3% |
5.3% |
2021/22 |
4.9% |
5.8% |
10.3% |
11.2% |
9.5% |
3.1% |
3.4% |
6.2% |
5.5% |
7.5% |
8.4% |
Compound annual growth rate |
0.7% |
5.1% |
6.9% |
7.0% |
6.6% |
7.0% |
12.0% |
8.1% |
5.7% |
1.4% |
5.9% |
Note: This analysis only includes data for beneficiaries that met their deductible and received public reimbursement.
* Compound annual growth rate.
† As of 2020/21, the total prescription drug expenditures, the annual rates of change and the CAGR were calculated without data from the NIHB program. The impact of NIHB data on the rate of change would be minimal (approximately 0.1%).
‡ In Nova Scotia, Community Services Pharmacare Benefits (Plan F) data was not previously submitted to the CIHI NPDUIS database but has been submitted since 2020/21. This addition resulted in a large, one-time increase in the beneficiary population and their drug use in 2020/21.
Data source: National Prescription Drug Utilization Information System Database, Canadian Institute for Health Information.
Figure 1.5 breaks down the annual rate of change in drug costs from 2020/21 to 2021/22 by market segment (table) and gives the corresponding market share in 2021/22 for each segment (pie chart). These results provide a snapshot of how the distribution of sales across market segments has shifted over the last year. As the market status of a medicine is dynamic, the medicines contributing to any one segment may differ from year to year.
Patented medicines represent the largest segment of the market, capturing 52.3% of public plan drug costs in 2021/22. Since 2020/21, some of the top-selling patented medicines in Canada have shifted from the patented market segment to either the single-source or multi-source non-patented segments. For instance, the antidiabetic medicine semaglutide (Ozempic) was responsible for $255 million (2.3%) in annual drug costs among public plans in 2021/22 but no longer reported sales to the Patented Medicine Prices Review Board (PMPRB)Reference V. Despite this pull, the patented market segment still increased modestly by 0.5%, driven mainly by the use of high-cost medicines—those with an average annual cost per beneficiary greater than $10,000, which grew by a considerable 10.0%. The impact of direct-acting antivirals (DAAs) for hepatitis C on spending growth has dwindled to less than 0.1%, and therefore is no longer shown separately.
In contrast to a decline in the previous year, the single-source non-patented market increased substantially by 57.9% in 2021/22, as a handful of commonly-used medicines changed patent status. Apart from the influence of semaglutide (Ozempic), two drugs for obstructive airway diseases, namely formoterol and budesonide (Symbicort) and tiotropium bromide (Spiriva), moved from the non-biologic patented market to the single-source non-patented market over the course of 2020/21, to become the top medicines in the segment in 2021/22 with over $155 million in combined sales (see Appendix G).
Costs for multi-source non-patented medicines, which include generics and their reference brand-name drugs as well as biosimilars and their originator biologics, increased by 8.9% in 2021/22, now accounting for 30.4% of drug costs. This segment can be broken down into two distinct sub-segments: multi-source generic medicines made up 17.5% ($1,901 million) of drug costs in 2021/22 and grew by 9.7%, while the remaining medicines, consisting mainly of off-patent biologics and biosimilars, experienced a relatively slower growth at a rate of 7.8% to reach 12.9% ($1,404 million) of drug costs. Multi-source non-patented biologics are an important group of medicines to monitor in future years as biosimilars gain traction in the public plans.
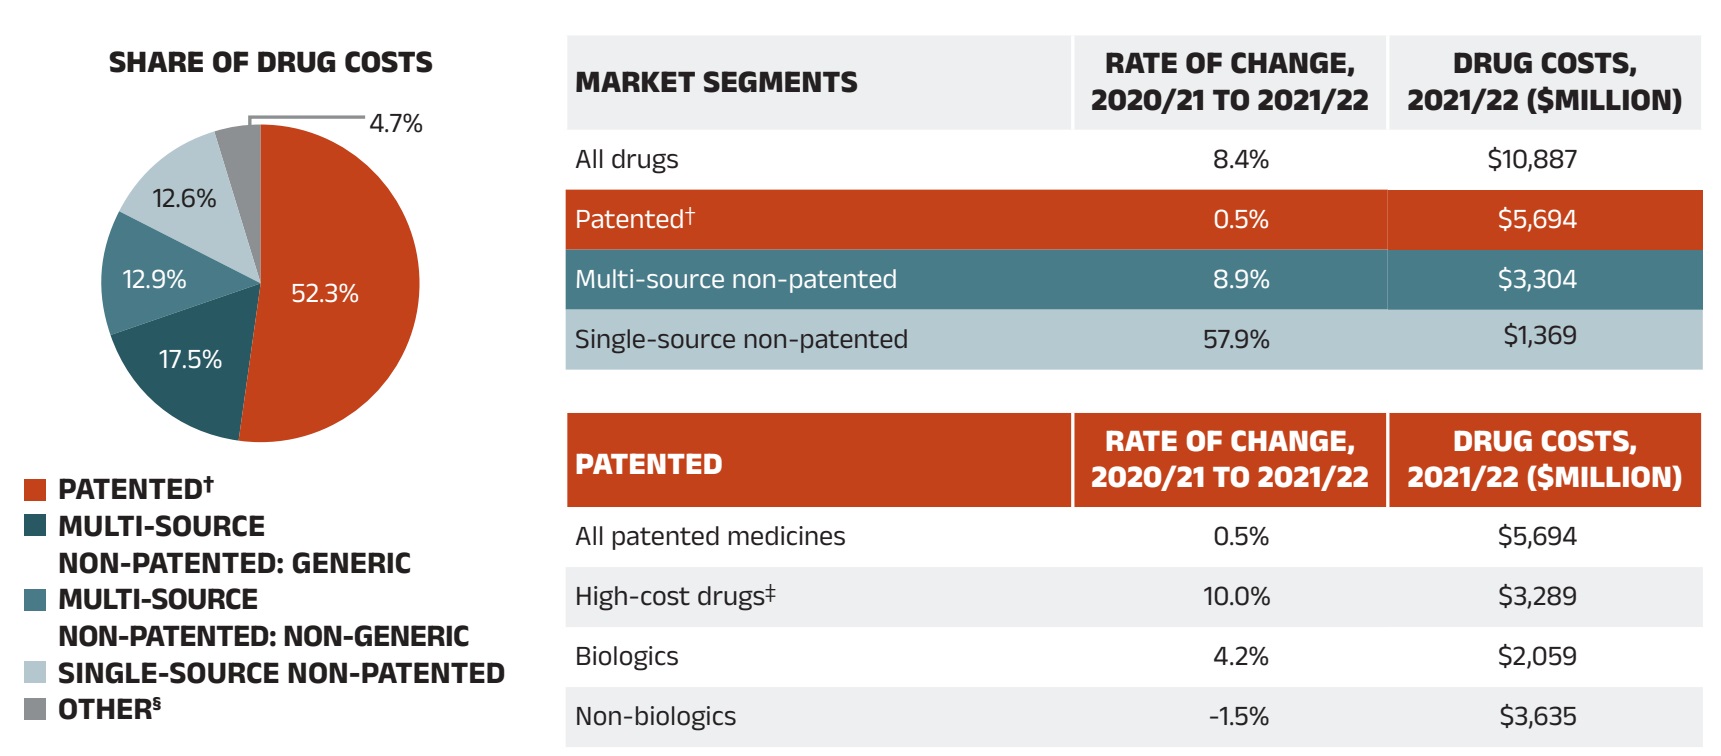
Figure 1.5 – Text version
Pie chart: Share of drug costs
Patented |
52.3% |
Multi-source non-patented: generic |
17.5% |
Multi-source non-patented: non-generic |
12.9% |
Single-source non-patented |
12.6% |
Other |
4.7% |
Table: Market segments
| Market Segment | Rate of change, 2020/21 to 2021/22 | Drug costs, 2021/22 |
|---|---|---|
All drugs |
8.4% |
$10,887M |
Patented |
0.5% |
$5,694M |
Multi-source non-patented |
8.9% |
$3,304M |
Single-source non-patented |
57.9% |
$1,369M |
Table: Patented medicines
| Patented segment | Rate of change, 2020/21 to 2021/22 | Drug costs, 2021/22 |
|---|---|---|
All patented medicines |
0.5% |
$5,694M |
High-cost drugs |
10.0% |
$3,289M |
Biologics |
4.2% |
$2,059M |
Non-biologics |
-1.5% |
$3,635M |
Note: This analysis only includes data for beneficiaries that met their deductible and received public reimbursement.
A glossary of terms with information on each of the market segments is available on the PMPRB website.
* British Columbia, Alberta, Saskatchewan, Manitoba, Ontario, New Brunswick, Nova Scotia, Prince Edward Island, Newfoundland and Labrador, and Yukon.
† The patented medicines market segment includes all medicines that had patent protection in the period of study, whether or not the patent expired during that period. As such, the rate of growth does not reflect the loss of patent exclusivity for medicines over the course of the fiscal year.
‡ High-cost drugs have an average annual treatment cost greater than $10,000 and include both biologics and non-biologics.
§ This market segment includes devices, compounded drugs, and other products that are reimbursed by public drug plans but do not have a Health Canada assigned Drug Identification Number (DIN).
Data source: National Prescription Drug Utilization Information System Database, Canadian Institute for Health Information.
Dispensing Costs of Prescription Drug Expenditures
Prescription Drug Expenditures = Drug Costs (83%) + Dispensing Costs (17%)
Dispensing costs make up an important part of prescription drug expenditures. Overall, dispensing costs in the NPDUIS public plans grew marginally by 0.1% in 2021/22 ―a modest rebound from the negative growth in 2020/21―for a compound annual growth rate of 0.2% over the last three years. Figure 1.6 reports the annual rate of change in dispensing costs for each NPDUIS drug plan from 2019/20 to 2021/22. Jurisdictional variations may be due to changes in dispensing fee policies and plan designs, as well as changes in the number of prescriptions and their size, among other factors.
Brief Insights: Dispensing Fees and Policies
The temporary changes to policies on dispensing frequency implemented during the COVID-19 pandemic were lifted in 2020/21. The impact of these changes is reflected in Section 3, “The Drivers of Dispensing Costs”.
Many public plans increased dispensing fees in 2021/22; notably, Yukon increased the maximum dispensing fee from $8.75 to $11.
A summary of dispensing fee policies for each of the public drug plans is available on the PMPRB website.
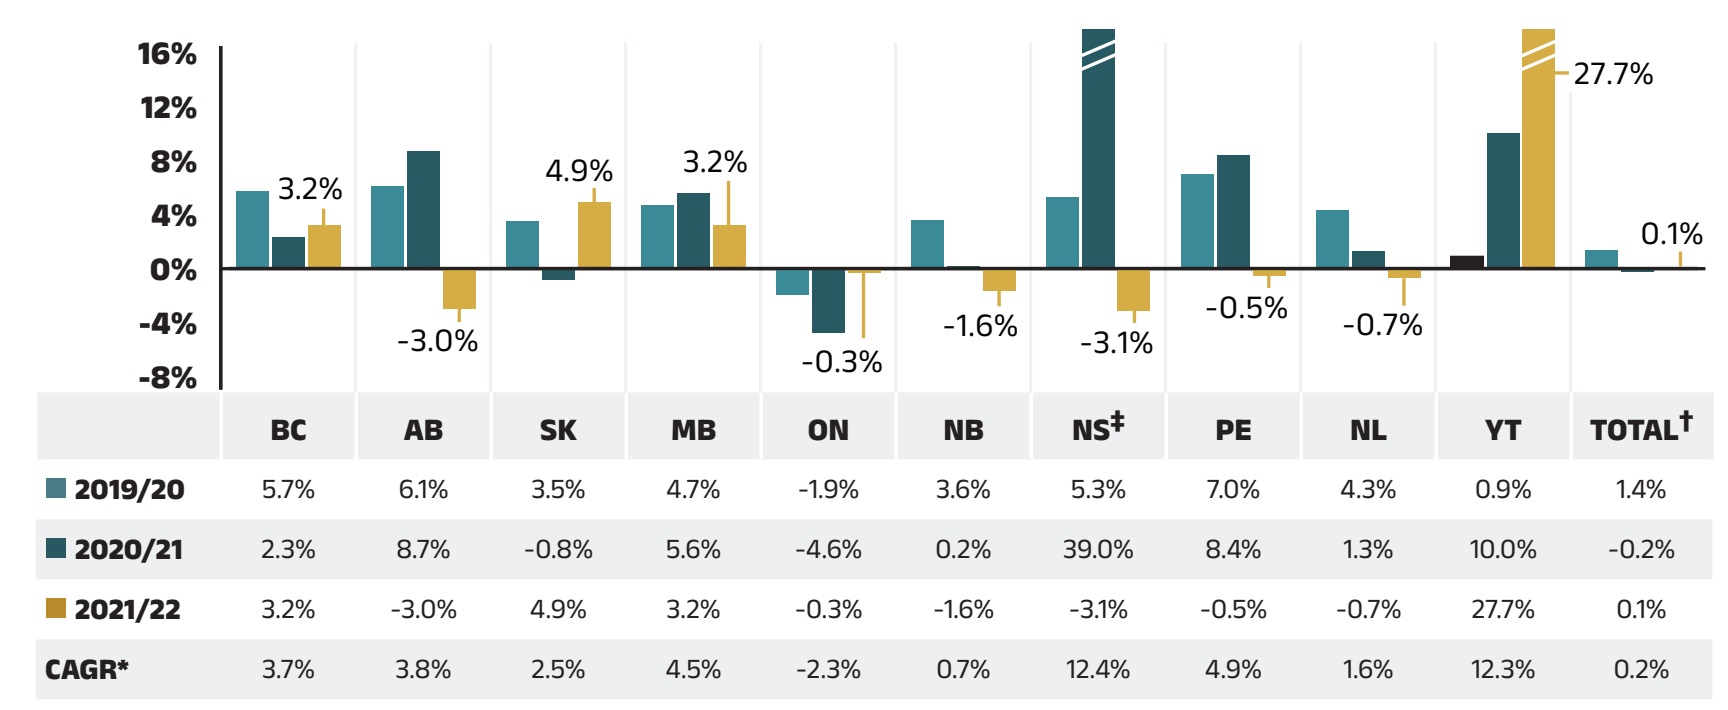
Figure 1.6 – Text version
| British Columbia | Alberta | Saskatchewan | Manitoba | Ontario | New Brunswick | Nova Scotia | Prince Edward Island | Newfoundland and Labrador | Yukon | Total | |
|---|---|---|---|---|---|---|---|---|---|---|---|
2019/20
|
5.7% |
6.1%
|
3.5% |
4.7% |
-1.9%
|
3.6% |
5.3% |
7.0% |
4.3% |
0.9% |
1.4% |
2020/21
|
2.3% |
8.7% |
-0.8% |
5.6% |
-4.6% |
0.2% |
39.0% |
8.4% |
1.3% |
10.0% |
-0.2% |
2021/22
|
3.2%
|
-3.0
|
4.9%
|
3.2%
|
-0.3%
|
-1.6%
|
-3.1%
|
-0.5%
|
-0.7%
|
27.7%
|
0.1%
|
Compound annual growth rate |
3.7% |
3.8% |
2.5% |
4.5% |
-2.3% |
0.7% |
12.4% |
4.9% |
1.6% |
12.3% |
0.2% |
Note: This analysis only includes data for beneficiaries that met their deductible and received public reimbursement.
* Compound annual growth rate.
† As of 2020/21, the total prescription drug expenditures, the annual rates of change and the CAGR were calculated without data from the NIHB program. The impact of NIHB data on the rate of change would be minimal (approximately 0.1%).
‡ In Nova Scotia, Community Services Pharmacare Benefits (Plan F) data was not previously submitted to the CIHI NPDUIS database but has been submitted since 2020/21. This addition resulted in a large, one-time increase in the beneficiary population and their drug use in 2020/21.
Data source: National Prescription Drug Utilization Information System Database, Canadian Institute for Health Information.
Compared to drug costs, dispensing costs have grown at slower and at times negative rates over the last three years. Their share of overall prescription drug expenditures has steadily declined, from 19.7% in 2019/20 to 17.3% in 2021/22.
Figure 1.7 shows the trend in the dispensing cost share of total prescription expenditures for each NPDUIS drug plan from 2019/20 to 2021/22.
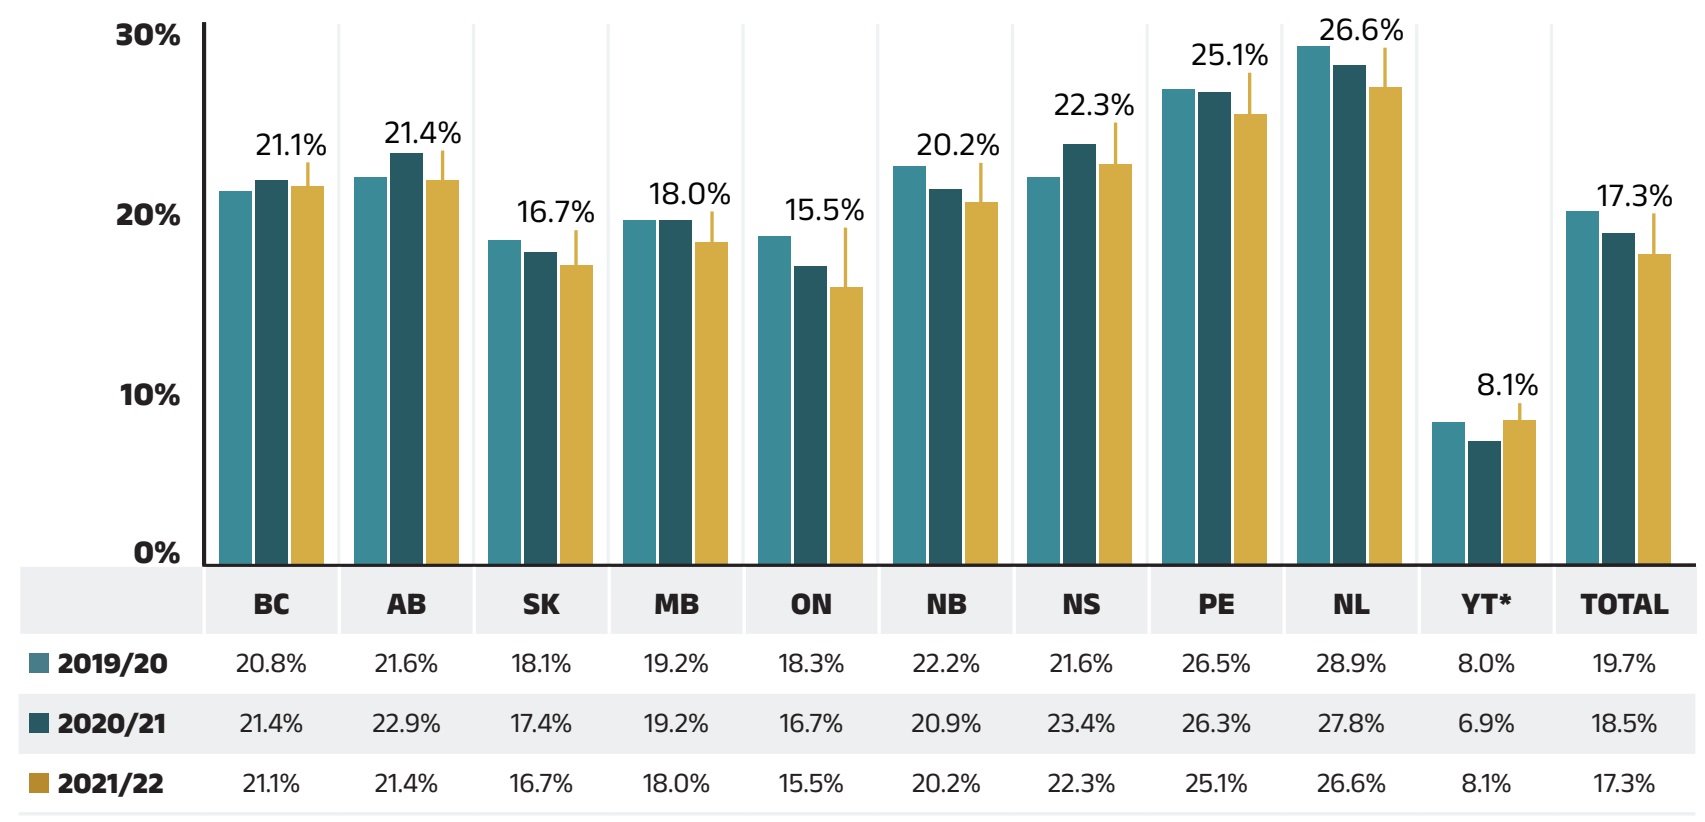
Figure 1.7 – Text version
| British Columbia | Alberta | Saskatchewan | Manitoba | Ontario | New Brunswick | Nova Scotia | Prince Edward Island | Newfoundland and Labrador | Yukon | Total | |
|---|---|---|---|---|---|---|---|---|---|---|---|
|
2019/20 |
20.8% |
21.6% |
18.1% |
19.2% |
18.3% |
22.2% |
21.6% |
26.5% |
28.9% |
8.0% |
19.7% |
2020/21 |
21.4% |
22.9% |
17.4% |
19.2% |
16.7% |
20.9% |
23.4% |
26.3% |
27.8% |
6.9% |
18.5% |
2021/22 |
21.1% |
21.4% |
16.7% |
18.0% |
15.5% |
20.2% |
22.3% |
25.1% |
26.6% |
8.1% |
17.3% |
Note: This analysis only includes data for beneficiaries that met their deductible and received public reimbursement.
* Yukon allows for markups of up to 30%; as such, dispensing costs account for a smaller share of their total expenditures.
Data source: National Prescription Drug Utilization Information System Database, Canadian Institute for Health Information.
2. The Drivers of Drug Costs, 2020/21 to 2021/22
Drug cost increases in the NPDUIS public plans in 2021/22 were primarily driven by a continued rise in the use of higher-cost medicines. The sustained pressure from the drug-mix effect reached a historical high, with steady yet limited cost savings from the price and substitution effects. In a reversal from 2020/21, the demographic effect pushed spending up by 2.5%, due to an increased number of active beneficiaries. This was partially offset by a -0.2% volume effect, reflecting slower growth in drug use compared to the increase in beneficiaries. This dynamic resulted in an overall increase of 8.4%.
In this section, a comprehensive cost driver analysis is used to determine how much public plan drug costs would have changed between 2020/21 and 2021/22 if only one factor (e.g., the price of drugs) was considered while all the others remained the same.Reference VI
Changes in drug costs are driven by a number of push and pull effects. The net effect of these opposing forces yields the overall rate of change.
Price change effect: Changes in the prices of both brand-name and generic drugs, determined at the molecule, strength, and form level.
Substitution effect: Shifts from brand-name to generic drugs, as well as shifts to biosimilar use.
Demographic effect: Changes in the number of active beneficiaries, as well as shifts in the distribution of age or gender.
Volume effect: Changes in the number of prescriptions dispensed to patients, the average number of units of a drug dispensed per prescription, and/or shifts in the use of various strengths or forms of a medicine.
Drug-mix effect: Shifts in use between lower- and higher-cost drugs, including those entering, exiting, or remaining in the market during the time period analyzed.
Figure 2.1 provides insight into the pressures driving the rates of change in drug costs from 2016/17 to 2021/22.
Typically, changes in the patient population and the volume of drugs prescribed result in a slight to moderate increase of drug costs. In the years before the COVID-19 pandemic, this increase was between 1% and 3% for the demographic effect, and remained stable at 1% for the volume effect. However, the pandemic significantly altered these dynamics over the past two years. In contrast to the 2.3% downward demographic pull effect in the first year of pandemic, the rebound in the number of active beneficiaries in 2021/22 led to a 2.5% demographic push effect. Additionally, a modest 0.2% volume pull-down effect was observed due to a slightly reduced number of claims per patient, indicating a reversal in these effects compared to 2020/21.
The most pronounced upward push on costs can be attributed to the use of higher-cost medicines, which maintained an average of 6.1% between 2018/19 and 2020/21. In 2021/22, the drug-mix effect exerted a historically high 8.1% upward pressure on drug costs in the NPDUIS public plans, while the use of DAA drugs for hepatitis C made up a negligible portion (below -0.1%) of this effect.
Counterbalancing these upward cost pressures, generic and biosimilar substitution and price reductions generally exert a downward pull on costs. The magnitude of these effects can vary from year to year depending on the timing of generic and biosimilar market entries and the implementation of relevant policies or initiatives. In 2021/22, the influence of the price change effect was relatively steady at -0.3%, while the substitution effect was stronger, pulling drug costs down by 1.7%. Over the past three years, the combined rate of these two effects has ranged between -1% and -2%.

Figure 2.1 – Text version
| 2016/17 | 2017/18 | 2018/19 | 2019/20 | 2020/21 | 2021/22 | |
|---|---|---|---|---|---|---|
OHIP+ |
– |
1.5% |
4.7% |
-3.0% |
8.4% |
-- |
Drug-mix, direct-acting antiviral (DAA) drugs |
-2.3% |
2.4% |
0.6% |
-1.6% |
-2.1% |
-- |
Drug-mix, other drugs |
4.4% |
4.7% |
6.1% |
5.8% |
6.3% |
8.1% |
Volume |
1.2% |
1.0% |
1.0% |
1.3% |
4.3% |
-- |
Demographic |
1.8% |
1.4% |
1.0% |
3.0% |
-2.0% |
2.5% |
Price change |
-1.0% |
-1.1% |
-4.0% |
-0.5% |
<0.1% |
-0.2% |
Substitution |
-1.8% |
-1.3% |
-2.2% |
-0.6% |
-1.4% |
-0.3% |
Total push effect |
7.2% |
11.0% |
12.4% |
10.2% |
10.7% |
10.5% |
Total pull effect |
-5.1% |
-2.3% |
-6.5% |
-5.7% |
-5.4% |
-2.2% |
Net change |
2.0% |
8.3% |
5.8% |
4.3% |
5.3% |
8.4% |
Note: This analysis is based on publicly available pricing information. It does not reflect confidential price discounts negotiated by the pCPA on behalf of the public plans.
Values may not add to totals due to rounding and the cross effect.
* British Columbia, Alberta, Saskatchewan, Manitoba, Ontario, New Brunswick, Nova Scotia, Prince Edward Island, Newfoundland and Labrador, Yukon, and the Non-Insured Health Benefits Program. As of 2020/21, results do not include the NIHB program.
† Drug-mix, DAA drugs effect for 2021/22 is minor (-0.1%) and folded into Drug-mix, other drug effect.
Data source: National Prescription Drug Utilization Information System Database, Canadian Institute for Health Information.
The overall 8.4% increase in drug costs in 2021/22 represents an absolute growth of $842 million, with varying rates of growth among the public drug plans ranging from approximately 3% to 11% (Figure 2.2). These variations were mainly due to differences in the magnitude of the opposing factors. Jurisdictions with higher overall growth rates included Manitoba (11.2%), Saskatchewan (10.3%), and Ontario (9.5%).
The increased use of higher-cost drugs had the greatest push effect, with an overall impact of 8.1% ($809 million) ranging from 3.5% to 11.0% across jurisdictions. The use of DAA drugs for hepatitis C had a negligible effect, below -0.1% (-$8 million), which was incorporated into the drug-mix effect.
Differences in the drug-mix effect across public drug plans may be related to plan designs, formulary listing decisions, or the disease profiles of the population, among other factors.
The demographic effect boosted drug costs in the NPDUIS public plans by 2.5% ($247 million) in 2021/22, returned to its pre-pandemic 1% to 3% contribution to growth. This increase in the active beneficiary population may be due to the rebound of active beneficiaries submitting claims for reimbursement in public plans after the initial wave of the COVID-19 pandemic, growth in the overall population of a jurisdiction, an increase in the number of Canadians eligible for senior coverage (65+), and/or plan design changes that expanded coverage to new populations or patient groups.
Despite the increased number of active beneficiaries, the volume effect had a relatively modest impact on growth in 2021/22. The average number of prescriptions dispensed per patient decreased slightly, pulling overall drug costs down by a marginal 0.2% or $20 million. The magnitude of this effect varied significantly across public plans, as the impact of the number of prescriptions dispensed per patient varied from an important push driver in British Columbia (4.2%) to a pull factor in Nova Scotia (-2.2%).
The price change effect (-0.3% or -$26 million) continued to have the smallest contribution and was relatively uniform across jurisdictions. The cost savings effects of generic and biosimilar substitution (‑1.7% or -$171 million) has grown stronger than the price change effect. The substitution effect was more pronounced in New Brunswick (-4.1%), Alberta (-3.9%), and British Columbia (-3.7%), as a result of the introduction of biosimilar switching initiatives.
The key effects for 2021/22—price change, substitution, and drug-mix—are explored in more detail in the rest of this section.
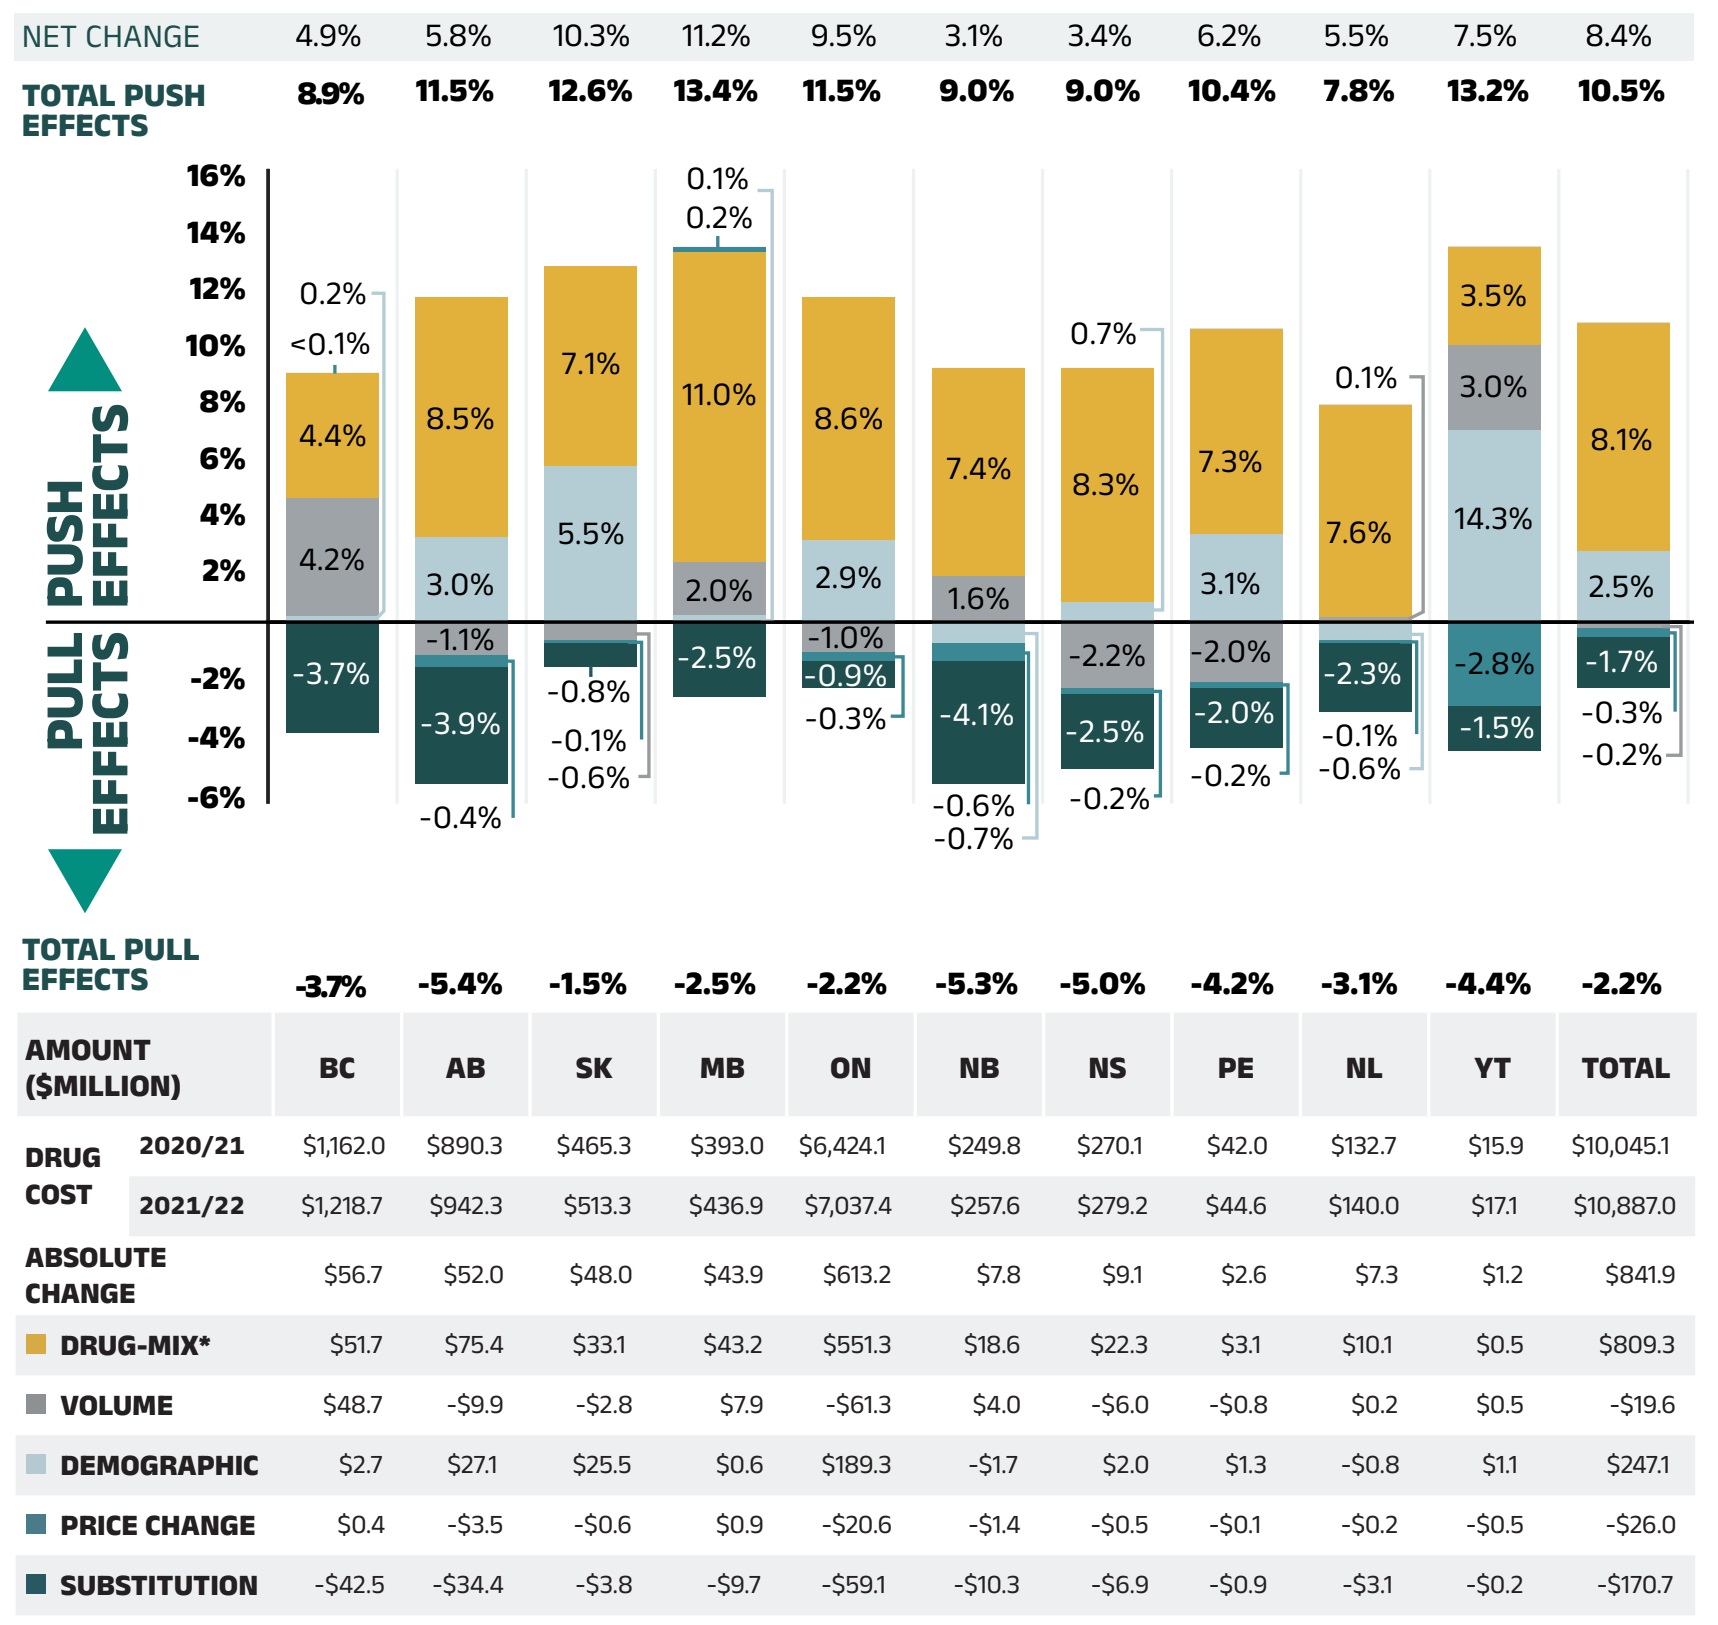
Figure 2.2 – Text version
| British Columbia | Alberta | Saskatchewan | Manitoba | Ontario | New Brunswick | Nova Scotia | Prince Edward Island | Newfoundland and Labrador | Yukon | Total | |
|---|---|---|---|---|---|---|---|---|---|---|---|
Demographic |
0.2% |
-3.0% |
5.5% |
0.4% |
2.9% |
0.7% |
0.7% |
3.3% |
-0.6% |
14.3% |
2.5% |
Volume |
4.2% |
-1.1% |
0.6% |
2.0% |
-1.0% |
1.6% |
2.2% |
2.2% |
5.3% |
18.0% |
4.3% |
Drug-Mix, Other Drugs |
4.8% |
3.2% |
7.8% |
8.1% |
6.8% |
10.5% |
4.6% |
4.8% |
3.9% |
0.6% |
6.3% |
Price Change |
-0.1% |
-1.1% |
0.1% |
0.2% |
0.3% |
0.1% |
-0.8% |
-0.1% |
0.4% |
-0.8% |
0.0% |
Substitution |
-3.7% |
-3.9% |
-0.8% |
-2.5% |
-0.9% |
-1.3% |
-1.4% |
-0.8% |
-0.8% |
-2.0% |
-1.4% |
Drug-Mix, DAA Drugs |
-5.1% |
-1.5% |
-2.4% |
-1.3% |
-1.8% |
-0.9% |
0.7% |
0.0% |
0.4% |
-5.7% |
-2.1% |
Total push effect |
8.9% |
11.5% |
12.6% |
13.4% |
11.5% |
9.0% |
9.0% |
10.4% |
7.8% |
13.2% |
10.5% |
Total pull effect |
-3.7% |
-5.4% |
-1.5% |
-2.5% |
-2.2% |
-5.3% |
-5.0% |
-4.2% |
-3.1% |
-4.4% |
-2.2% |
Net change |
4.9% |
5.8% |
10.3% |
11.2% |
9.5% |
3.1% |
3.4% |
6.2% |
5.5% |
7.5% |
8.4% |
| British Columbia | Alberta | Saskatchewan | Manitoba | Ontario | New Brunswick | Nova Scotia | Prince Edward Island | Newfoundland and Labrador | Yukon | Total | |
|---|---|---|---|---|---|---|---|---|---|---|---|
Drug cost 2020/21 |
$1,162.0 |
$890.3 |
$465.3 |
$393.0 |
$6,424.1 |
$249.8 |
$270.1 |
$42.0 |
$132.7 |
$15.9 |
$10,045.1 |
Drug cost 2020/21 |
$1,218.7 |
$942.3 |
$513.3 |
$436.9 |
$7,037.4 |
$257.6 |
$279.2 |
$44.6 |
$140.0 |
$17.1 |
$10,887.0 |
Absolute change |
$56.7 |
$52.0 |
$48.0 |
$43.9 |
$613.2 |
$7.8 |
$9.1 |
$2.6 |
$7.3 |
$1.2 |
$841.9 |
Drug-mix, direct-acting antiviral (DAA) drugs |
-$60.20 |
-$13.00 |
-$10.90 |
-$4.70 |
-$106.90 |
-$2.10 |
$1.40 |
$0.00 |
$0.50 |
-$0.70 |
-$196.60 |
Drug-mix, other drugs |
$51.7 |
$75.4 |
$33.1 |
$43.2 |
$551.3 |
$18.6 |
$22.3 |
$3.1 |
$10.1 |
$0.5 |
$809.3 |
Volume |
$48.7 |
-$9.9 |
-$2.8 |
$7.9 |
-$61.3 |
$4.0 |
-$6.0 |
-$0.8 |
$0.2 |
$0.5 |
-$19.6 |
Demographic |
-$51.20 |
-$35.00 |
-$9.60 |
-$6.70 |
-$152.20 |
$23.10 |
$45.40 |
$1.30 |
-$3.40 |
$1.80 |
-$186.60 |
Price change |
-$1.50 |
-$9.80 |
$0.40 |
$0.90 |
$15.40 |
$0.10 |
-$1.80 |
$0.00 |
$0.50 |
-$0.10 |
$4.00 |
Substitution |
-$40.10 |
-$34.10 |
-$3.50 |
-$5.10 |
-$38.90 |
-$3.00 |
-$3.10 |
-$0.30 |
-$1.00 |
-$0.20 |
-$129.20 |
Note: This analysis is based on publicly available pricing information. It does not reflect confidential drug price discounts negotiated by the pCPA on behalf of the public plans. Values may not add to totals due to rounding and the cross effect.
* Drug-mix, DAA drugs effect for 2021/22 is minor and folded into Drug-mix effect.
Data source: National Prescription Drug Utilization Information System Database, Canadian Institute for Health Information.
Price Change Effect
This effect captures changes in the prices of both brand-name and generic medicines. Following the significant one-time drop in generic prices resulting from the implementation of the pan-Canadian Generic Price Initiative in April 2018, its influence has diminished. In 2021/22, changes in drug prices played a minor role in the growth of drug costs, pulling the overall cost levels down by 0.3% ($26 million).
An analysis by market segment suggests that the reduction in the average unit costs reimbursed in the multi-source non-patented category saw little change. The average unit costs of patented medicines remained stable, while the costs of single-source non-patented medicines increased at a steady pace.
Figure 2.3 reports the trends in average unit costs from 2016/17 to 2021/22 by market segment for (a) patented medicines; (b) multi-source generic medicines; and (c) single-source non-patented medicines, along with their corresponding 2021/22 market shares. The results are presented as an index, with the base year (2016/17) set to one and subsequent years reported relative to this value. The findings are a cost-weighted average of changes in the reimbursed unit costs for individual medicines. The analysis was restricted to oral solid formulations to ensure unit consistency.
From 2016/17 to 2021/22, the prices of patented medicines were stable, increasing by a modest average of 2%, while prices of single-source non-patented medicines increased by an average of 14%. Despite the significant rise in prices, the impact of this segment was limited due to its small size: single-source non-patented medicines make up just 12.6% of the market, while patented medicines represent a 52.3% share. The multi-source generics market shows a similar trend across all NPDUIS public drug plans that is tied to the various waves of generic price agreements. Following recent pricing initiatives, average unit costs declined by an average of 5% from 2016/17 to 2017/18, before a more substantive 19% drop in 2018/19. Since then, they have remained steady without any further decrease from 2019/20 to 2021/22. As a result, the average multi-source generic unit cost across all jurisdictions in 2021/22 was approximately three quarters of the 2016/17 average.
Brief Insights: pCPA Initiatives
Through the pan-Canadian Pharmaceutical Alliance (pCPA), the provinces, territories, and federal government have been working collectively to achieve greater value for generic and brand-name medicines for Canada’s publicly funded drug programs.
Generic medicines:
Between April 1, 2015, and April 1, 2016, the prices of 18 commonly used generic medicines were reduced to 18% of their brand-name reference products. In addition, a one-year bridging period was initiated on April 1, 2017, which further reduced the prices of six of the molecules to 15% of the brand reference price.
As of April 1, 2018, a five-year joint agreement between the pCPA and the Canadian Generic Pharmaceutical Association (CGPA) reduced the prices of 67 of the most prescribed generic medicines in Canada by 25% to 40%, resulting in overall discounts of up to 90% off the price of their brand-name equivalents.
Effective April 1, 2022, the Historical Products Policy developed by pCPA and CGPA addresses concerns regarding assessments for generic products whose brand reference product has been cancelled post market.
Brand-name medicines:
As of June 30, 2023, 625 joint negotiations or product listing agreements (PLAs) for brand-name drugs had been completed by the pCPA, with another 35 negotiations underway. The impact of the confidential drug prices negotiated is not reflected in this analysis.
For more details, see the overview of generic pricing policies and pCPA initiatives available on the PMPRB website.

Figure 2.3 – Text version
(a) Patented medicines
Expenditure share: 52.3%
Prescription share: 7.4%
| 2016/17 | 2017/18 | 2018/19 | 2019/20 | 2020/21 | 2021/22 | |
|---|---|---|---|---|---|---|
British Columbia |
1.00 |
0.98 |
0.99 |
0.99 |
0.99 |
0.99 |
Alberta |
1.00 |
0.94 |
0.97 |
0.99 |
1.06 |
1.06 |
Saskatchewan |
1.00 |
1.00 |
1.01 |
1.01 |
1.02 |
1.02 |
Manitoba |
1.00 |
1.01 |
1.01 |
1.01 |
1.03 |
1.05 |
Ontario |
1.00 |
1.00 |
1.01 |
1.02 |
1.02 |
1.03 |
New Brunswick |
1.00 |
1.00 |
1.01 |
0.96 |
0.95 |
0.95 |
Nova Scotia |
1.00 |
1.00 |
1.01 |
1.01 |
1.02 |
1.02 |
Prince Edward Island |
1.00 |
1.00 |
1.01 |
1.01 |
1.01 |
1.01 |
Newfoundland and Labrador |
1.00 |
1.02 |
1.03 |
1.04 |
1.04 |
1.05 |
Total for drug plans captured |
1.00 |
1.00 |
1.01 |
1.01 |
1.02 |
1.02 |
(b) Multi-source generic medicines
Expenditure share: 17.5%
Prescription share: 72.7%
| 2016/17 | 2017/18 | 2018/19 | 2019/20 | 2020/21 | 2021/22 | |
|---|---|---|---|---|---|---|
British Columbia |
1.00 |
0.96 |
0.77 |
0.76 |
0.77 |
0.78 |
Alberta |
1.00 |
0.92 |
0.75 |
0.74 |
0.72 |
0.71 |
Saskatchewan |
1.00 |
0.94 |
0.78 |
0.76 |
0.76 |
0.76 |
Manitoba |
1.00 |
0.96 |
0.79 |
0.79 |
0.78 |
0.78 |
Ontario |
1.00 |
0.96 |
0.76 |
0.75 |
0.76 |
0.77 |
New Brunswick |
1.00 |
0.97 |
0.76 |
0.75 |
0.76 |
0.75 |
Nova Scotia |
1.00 |
0.96 |
0.75 |
0.74 |
0.74 |
0.74 |
Prince Edward Island |
1.00 |
0.96 |
0.77 |
0.76 |
0.77 |
0.77 |
Newfoundland and Labrador |
1.00 |
0.99 |
0.79 |
0.78 |
0.79 |
0.79 |
Total for drug plans captured |
1.00 |
0.95 |
0.77 |
0.76 |
0.76 |
0.76 |
(c) Single-source non-patented medicines
Expenditure share: 12.6%
Prescription share: 3.3%
| 2016/17 | 2017/18 | 2018/19 | 2019/20 | 2020/21 | 2021/22 | |
|---|---|---|---|---|---|---|
British Columbia |
1.00 |
1.02 |
1.06 |
1.10 |
1.12 |
1.15 |
Alberta |
1.00 |
1.10 |
1.14 |
1.20 |
1.21 |
1.24 |
Saskatchewan |
1.00 |
1.02 |
1.02 |
1.06 |
1.08 |
1.10 |
Manitoba |
1.00 |
1.02 |
1.03 |
1.05 |
1.08 |
1.11 |
Ontario |
1.00 |
1.04 |
1.06 |
1.08 |
1.09 |
1.14 |
New Brunswick |
1.00 |
1.02 |
1.03 |
1.01 |
1.00 |
1.03 |
Nova Scotia |
1.00 |
1.02 |
1.04 |
1.07 |
1.08 |
1.10 |
Prince Edward Island |
1.00 |
1.02 |
1.05 |
1.08 |
1.10 |
1.14 |
Newfoundland and Labrador |
1.00 |
1.02 |
1.05 |
1.09 |
1.11 |
1.15 |
Total for drug plans captured |
1.00 |
1.04 |
1.06 |
1.09 |
1.10 |
1.14 |
Note: This analysis only includes data for beneficiaries that met their deductible and received public reimbursement.
Yukon is not reported due to data limitations. As of 2020/21, national results do not include the NIHB program.
The findings are a cost-weighted average of changes in the reimbursed unit costs for individual medicines. The analysis was limited to data for oral solid formulations. The remaining share of prescriptions and expenditures includes devices, compounded drugs, and other products that are reimbursed by public drug plans but do not have a Health Canada assigned Drug Identification Number (DIN).
* Total results for the drugs plans captured in this figure.
Data source: National Prescription Drug Utilization Information System Database, Canadian Institute for Health Information.
Substitution Effect
Shifts from brand-name to generic or biosimilar medicines pulled overall drug costs down by 1.7% in 2021/22, translating to savings of $171 million for the NPDUIS public plans. The top three generic contributors to the substitution effect, which included two immunosuppressants (lenalidomide and pirfenidone), and a drug affecting bone structure and mineralization (risedronic acid), offered merely -0.4% in savings. Biosimilars contributed significantly more to the substitution effect than generics and were responsible for more than half of the savings from substitution in 2021/22. Cost savings were led by biosimilars for three immunosuppressants: -0.4% for adalimumab (Amgevita/Hadlima/Hulio/Hyrimoz/Idacio), -0.3% for infliximab (Avsola/Inflectra/Renflexis), and -0.1% for etanercept (Brenzys/Erelzi).
The share of prescriptions for multi-source non-patented medicines in public plans increased to 87.8% in 2021/22, a significant rise over 83.6% in 2016/17, while their corresponding share of total drug costs changed little over the same time period, from 29.6% to 30.4%. This six-year trend reflects the implementation of generic pricing policies, as well as the genericization of a number of commonly used medicines that lost patent protection in recent years. Multi-source generics alone accounted for 72.7% (Figure 2.3 (b)) of prescriptions and 17.5% (as shown in Figure 1.5) of drug costs on 2021/22.
Patented medicines accounted for a decreasing share of prescriptions in 2021/22, dropping from 10.8% to 7.4% since 2016/17. Their share of total public plan drug costs also fell to 52.3% as a result of changes to the patent status of a few top-selling medicines, which moved over to the single-source non-patented market segment. Despite the loss of patent for a few significant medicines, this segment has held steady above 50% as a result of the increased use of high-cost drugs such as biologics and oral oncology medicines and the introduction of new high-use drugs such as antidiabetics.
Figure 2.4 reports the 2016/17 to 2021/22 trends in market shares by market segment: patented, multi-source non-patented, and single-source non-patented medicines.
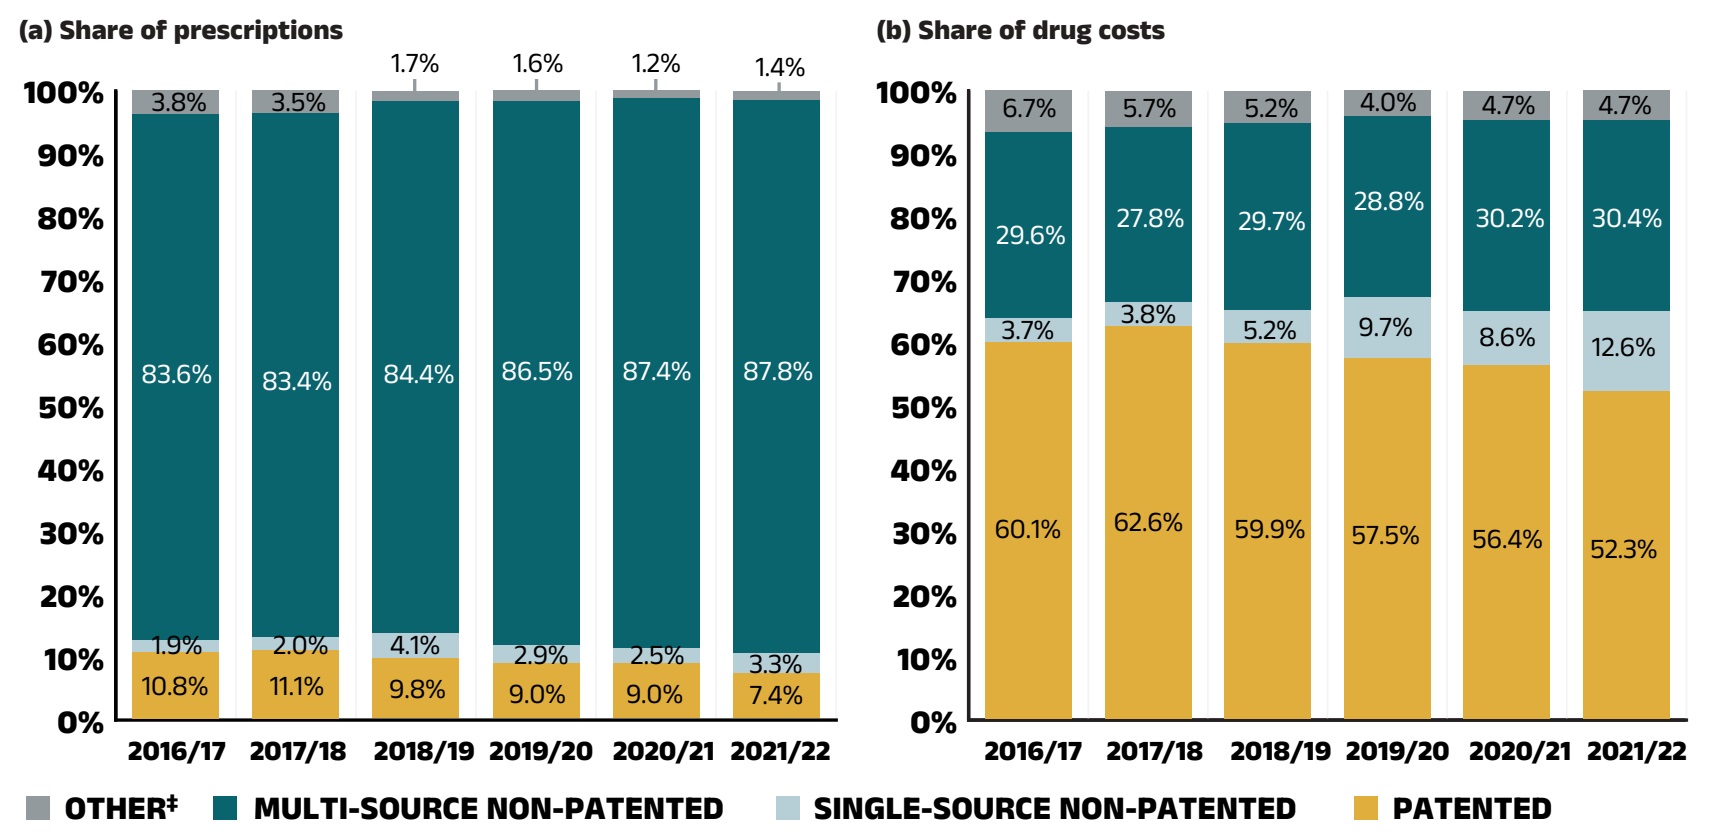
Figure 2.4 – Text version
(a) Share of prescriptions
| Market segment | 2016/17 | 2017/18 | 2018/19 | 2019/20 | 2020/21 | 2021/22 |
|---|---|---|---|---|---|---|
Patented |
10.8% |
11.1% |
9.8% |
9.0% |
9.0% |
7.4% |
Single-source non-patented |
1.9% |
2.0% |
4.1% |
2.9% |
2.5% |
3.3% |
Multi-source non-patented |
83.6% |
83.4% |
84.4% |
86.5% |
87.4% |
87.8% |
Other |
3.8% |
3.5% |
1.7% |
1.6% |
1.2% |
1.4% |
(b) Share of drug costs
| Market segment | 2016/17 | 2017/18 | 2018/19 | 2019/20 | 2020/21 | 2021/22 |
|---|---|---|---|---|---|---|
Patented |
60.1% |
62.6% |
59.9% |
57.5% |
56.4% |
52.3% |
Single-source non-patented |
3.7% |
3.8% |
5.2% |
9.7% |
8.6% |
12.6% |
Multi-source non-patented |
29.6% |
27.8% |
29.7% |
28.8% |
30.2% |
30.4% |
Other |
6.7% |
5.7% |
5.2% |
4.0% |
4.7% |
4.7% |
Note: This analysis only includes data for beneficiaries that met their deductible and received public reimbursement.
* British Columbia, Alberta, Saskatchewan, Manitoba, Ontario, New Brunswick, Nova Scotia, Prince Edward Island, Newfoundland and Labrador, Yukon, and the Non-Insured Health Benefits Program. As of 2020/21, results do not include the NIHB program.
‡ This market segment includes devices, compounded drugs, and other products that are reimbursed by public drug plans but do not have a Health Canada assigned Drug Identification Number (DIN).
Data source: National Prescription Drug Utilization Information System Database, Canadian Institute for Health Information.
Brief Insights: Biosimilars
In April 2016, the pCPA issued the First Principles for Subsequent Entry Biologics to guide negotiations and inform expectations for biologics and biosimilars. This was followed by the creation of the Biologics Policy Directions in September 2018 to further guide and define the process by which biologic and biosimilar products are negotiated and considered for reimbursement by Canada’s public drug plans.
Additionally, the pCPA recently partnered with Cancer Care Ontario on a joint oncology biosimilars initiative, the pan-Canadian Oncology Biosimilars Initiative (pCOBI), that recognizes the unique considerations in the implementation of oncology biosimilars. As of June 2019, biosimilars are no longer subjected to CADTH review and are instead filed directly with the jurisdictions and the pCPA. The pCPA subsequently engaged the Canadian Agency for Drugs and Technologies in Health (CADTH) to conduct an extensive stakeholder consultation and engagement exercise on the implementation and expanded use of biosimilars in Canada. A final summary report from the consultation was released in February 2020.
Many Canadian payers, including public plans in British Columbia, Alberta, Saskatchewan, Ontario, Quebec, New Brunswick, and Nova Scotia, have recently undertaken or announced initiatives to prompt switching to available biosimilars and to encourage biosimilar uptake. For more information, see Appendix C: Biosimilar Switching Initiatives by Canadian Public Payers.
A biosimilar drug, or biosimilar, is a biologic drug that is very similar to but less expensive than its originator biologic drug. Although biosimilars are not identical to their originator biologics, there are no expected differences in efficacy and safety between a biosimilar and the originator biologic drug.Reference VII The biosimilars market is a relatively complex space—compared to traditional generic drug markets, the savings from biosimilars have been limited by slower initial uptake.
Table 2.1 provides an overview of the biosimilars recently approved in Canada. Inflectra, which was approved in Canada in 2014 and marketed publicly in 2016, was one of the first biosimilars available on the Canadian market and has one of the highest list price discounts. Inflectra, followed by Renflexis (approved in 2017), are both indicated for most of the same autoimmune inflammatory diseases as their originator infliximab product Remicade. Despite having list prices set at approximately half that of Remicade, their initial market uptake was slow. Over the last three years, public drug plans in British Columbia, Alberta, and New Brunswick have undertaken initiatives to encourage switching from biologics to biosimilars. The uptake of biosimilars targeted by switching initiatives has increased substantially: by 2021/22, the combined uptake of Inflectra, Renflexis and Avsola captured 52.0% of infliximab prescriptions.
Brenzys and Erelzi, biosimilars of another anti-TNF-α drug etanercept (Enbrel), were approved for market in Canada in 2016 and 2017, respectively. Their list prices were approximately two thirds of the price of their originator biologic. By 2021/22, as targets of biosimilar switching initiatives, these biosimilars captured 62.6% of etanercept prescriptions.
Truxima, Riximyo, and Ruxience, recent biosimilars approved in 2019 and 2020 for the monoclonal antibody medicine rituximab (Rituxan), were also targeted by biosimilar switching initiatives. Two years after they were first available in the NPDUIS public plans, these biosimilars captured 74.9% of rituximab prescriptions.
Several biosimilars (Amgevita, Hadlima, Hulio, Hyrimoz, and Idacio) of another key anti-TNF-α drug adalimumab (Humira), became available in the NPDUIS public plans as recently as 2021. These biosimilars, priced at 60% of the list price of the originator biologic, were also targeted by biosimilar switching initiatives. As a result, they had achieved a sizable uptake by 2021/22, capturing 27.6% of adalimumab prescriptions.
Biosimilars used to treat an acute indication often have a significantly higher rate of uptake than those used for chronic indications. Grastofil, Nivestym, and the recently approved Lapelga, Fulphila, Ziextenzo, and Nyvepria, biosimilars of the white blood cell stimulators filgrastim (Neupogen) and pegfilgrastim (Neulasta), respectively, had the highest uptake in the public plans, at 94.5% and almost 100% in 2021/22, despite the latter having been available in NPDUIS plans for two years (Table 2.1). Their discount from the originator biologic list price ranged from 25% to 45%.
Biosimilars used in the management of diabetes included Basaglar, a biosimilar of insulin glargine (Lantus), Admelog, a biosimilar of insulin lispro (Humalog), and Trurapi, a biosimilar of insulin aspart (NovoRapid). These biosimilars have experienced relatively gradual uptake in the NPDUIS public plans. Basaglar captured 38.4% share of the prescriptions, while Admelog and Trurapi achieved 4.8% and 0.9% uptake, respectively. Their 25% to 26.5% discount from the originator biologic list price places them at the lower end of cost savings offered by biosimilars.
In the past year, several biosimilars were newly available in the NPDUIS public plans, including blood thinners, bone health treatments, and cancer treatments. Teva-Teriparatide (a biosimilar of teriparatide (Forteo)) and Inclunox/HP, Noromby/HP, and Redesca/HP (biosimilars of enoxaparin (Lovenox)), achieved sizable uptakes of 59.1% and 17.2% of their respective markets in the public plans. Mvasi, a biosimilar of the oncologyReference VIII medicine bevacizumab (Avastin), only captured a 1.2% share of the bevacizumab market in 2021/22. These biosimilars’ discounts from their originator biologic’s list price ranged from 15% to 25.7%.
Table 2.1 Biosimilars recently approved in Canada, NPDUIS public drug plans*, 2021/22
| Originator biologic | Biosimilar | ||||||
|---|---|---|---|---|---|---|---|
| Medicinal ingredient (trade name) | Drug cost, $million (share) | Trade name | Market approval | First reimbursement | Price discount† from reference biologic | Share of prescriptions for medicinal ingredient | Share of prescriptions |
Infliximab (Remicade) |
$221.5 (2.0%) |
Inflectra |
15-Jan-14 |
Q1 2016 |
46.8% |
39.3% |
52.0% |
Renflexis |
01-Dec-17 |
Q3 2018 |
50.1% |
12.5% |
|||
Avsola |
12-Mar-20 |
Q4 2020 |
50.1% |
0.1% |
|||
Etanercept (Enbrel) |
$66.7 (0.6%) |
Brenzys |
31-Aug-16 |
Q3 2017 |
33.7% |
31.3% |
62.6% |
Erelzi |
06-Apr-17 |
Q4 2017 |
37.2% |
31.3% |
|||
Rituximab (Rituxan) |
$10.2 (0.1%) |
Riximyo |
28-Apr-20 |
Q3 2020 |
37.0% |
25.4% |
74.9% |
Ruxience |
04-May-20 |
Q3 2020 |
35.0% |
42.1% |
|||
Truxima |
04-Apr-19 |
Q1 2020 |
30.0% |
7.5% |
|||
Adalimumab (Humira) |
$302.4 (2.8%) |
Hadlima / Hadlima Pushtouch |
08-May-18 |
Q1 2021 |
40.0% |
6.9% |
27.6% |
Amgevita |
04-Nov-20 |
Q2 2021 |
40.0% |
7.2% |
|||
Hulio |
24-Nov-20 |
Q2 2021 |
40.0% |
4.5% |
|||
Hyrimoz |
04-Nov-20 |
Q2 2021 |
40.0% |
5.5% |
|||
Idacio |
30-Oct-20 |
Q2 2021 |
40.0% |
3.5% |
|||
Insulin glargine (Lantus) |
$63.6 (0.6%) |
Basaglar |
01-Sep-15 |
Q3 2017 |
25.0% |
37.8% |
37.8% |
Insulin lispro (Humalog) |
$38.9 (0.4%) |
Admelog |
16-Nov-17 |
Q4 2020 |
25.0% |
4.8% |
4.8% |
Insulin aspart (NovoRapid) |
$43.6 (0.4%) |
Trurapi |
15-Oct-20 |
Q3 2021 |
26.5% |
0.9% |
0.9% |
Filgrastim (Neupogen) |
$2.7 (<0.1%) |
Grastofil |
07-Dec-15 |
Q4 2016 |
25.0% |
94.1% |
94.5% |
Nivestym |
16-Apr-20 |
Q3 2020 |
25.0% |
0.4% |
|||
Pegfilgrastim (Neulasta) |
<$0.1 (<0.1%) |
Lapelga |
05-Apr-18 |
Q2 2019 |
25.0%‡ |
98.4% |
99.9% |
Fulphila |
24-Dec-18 |
Q1 2020 |
36.1% |
0.9% |
|||
Ziextenzo |
21-Apr-20 |
Q3 2020 |
43.1% |
0.6% |
|||
Nyvepria |
28-Oct-20 |
Q2 2021 |
45.1% |
0.1% |
|||
Bevacizumab (Avastin) |
$0.5 (<0.1%) |
Mvasi |
30-Apr-18 |
Q2 2020 |
25.7%‡ |
1.2% |
1.2% |
Teriparatide (Forteo) |
$0.2 (<0.1%) |
Teva Teriparatide |
06-Aug-19 |
Q3 2020 |
15.0% |
59.1% |
59.1% |
Enoxaparin (Lovenox) |
$7.0 (0.1%) |
Inclunox / Inclunox HP |
05-Nov-20 |
Q2 2021 |
25.0% |
8.1% |
17.2% |
Noromby / Noromby HP |
14-Oct-20 |
Q2 2021 |
20.0% |
0.3% |
|||
Redesca / Redesca HP |
07-Dec-20 |
Q2 2021 |
19.7% |
8.8% |
|||
Note: This analysis is based on publicly available pricing information. It does not reflect confidential price discounts negotiated by the pCPA on behalf of the public plans.
* British Columbia, Alberta, Saskatchewan, Manitoba, Ontario, New Brunswick, Nova Scotia, Prince Edward Island, Newfoundland and Labrador, and Yukon.
† Based on Ontario Drug Benefit formulary listing price at the time of the biosimilar entry. This price may change over time; for example, the list price for Brenzys was recently lowered to match Erelzi. The price discounts do not reflect confidential rebates from negotiations.
‡ Based on the values reported in CADTH’s Biosimilar Summary Dossier for Pegfilgrastim (Lapelga) and in CADTH’s Biosimilar Summary Dossier for Bevacizumab (Mvasi), respectively. The price discounts do not reflect confidential rebates from negotiations.
Data source: National Prescription Drug Utilization Information System Database, Canadian Institute for Health Information.
To explore the accessibility of biosimilars and their impact in mitigating cost pressures in public drug plans, Figure 2.5 shows the availability of biosimilars and their share of drug costs in the biologics market of NPDUIS public drug plans since their introduction in 2015/16. The total drug costs for biologics significantly increased from $1,978 million in 2015/16 to $3,432 million in 2021/22. The number of distinct biologic molecules with available biosimilars reimbursed in public drug plans also jumped from 1 in 2015/16 to 12 in 2021/22, reflecting expanded treatment options and growing availability of biosimilars in the market.
The share of drug costs attributed to biologic medicines with available biosimilars fluctuated between 17.9% in 2015/16 and 37.6% in 2020/21, before slightly declining to 32.9% in 2021/22, showing the influence of recent biosimilar policy initiatives.
The biosimilar share of overall biologic drug costs has consistently increased, from less than 0.1% in 2015/16 to 11.1% in 2021/22. Despite a considerable growth in drug costs ($386 million or 12.6%) in the overall biologics market from 2020/21 to 2021/22, the introduction of new biosimilars and ongoing initiatives to improve biosimilar uptake have helped stabilize spending on biologic medicines with available biosimilars.
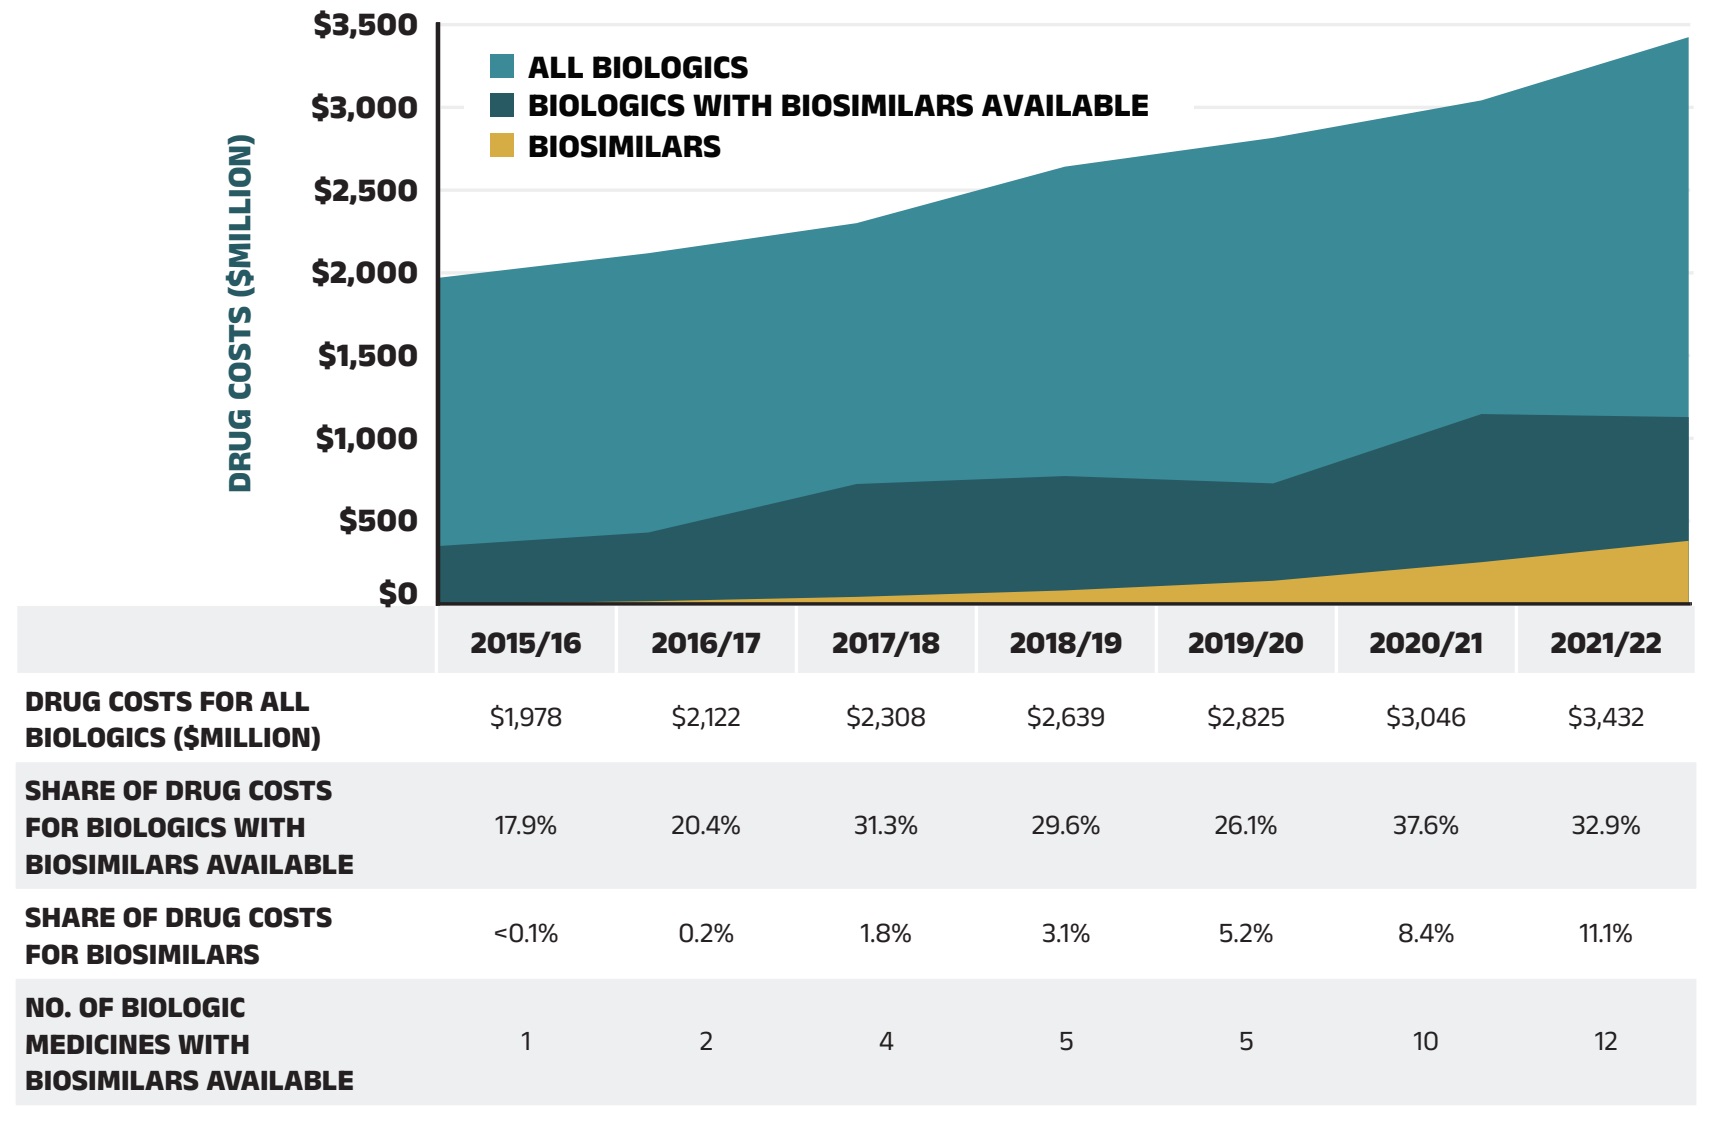
Figure 2.5 – Text version
| 2015/16 | 2016/17 | 2017/18 | 2018/19 | 2019/20 | 2020/21 | 2021/22 | |
|---|---|---|---|---|---|---|---|
Drug costs for all biologics |
$1,978M |
$2,122M |
$2,308M |
$2,639M |
$2,825M |
$3,046M |
$3,432M |
Share of drug costs for biologics with biosimilars available |
17.9% |
20.4% |
31.3% |
29.6% |
26.1% |
37.6% |
32.9% |
Share of drug costs for biosimilars |
<0.1% |
0.2% |
1.8% |
3.1% |
5.2% |
8.4% |
11.1% |
No. of biologic medicines with biosimilars available |
1 |
2 |
4 |
5 |
5 |
10 |
12 |
* British Columbia, Alberta, Saskatchewan, Manitoba, Ontario, New Brunswick, Nova Scotia, Prince Edward Island, Newfoundland and Labrador, and Yukon.
Data source: National Prescription Drug Utilization Information System Database, Canadian Institute for Health Information.
For more information on the market distribution of biosimilars and their originator biologics in each of the NPDUIS public drug plans, see Appendix B. Future editions of CompassRx will continue to follow the impact of biosimilar policy initiatives.
Drug-Mix Effect
Shifts in use between lower- and higher-cost drugs pushed overall cost levels for the NPDUIS drug plans up by 8.1% ($809 million) in 2021/22 (including the negligible impact of the use of DAA drugs for hepatitis C).
Spotlight on new antidiabetic drugs
In Canada’s public drug plans, the class of alimentary tract and metabolism medicines, primarily consisting of drugs to treat diabetes, has held the second-highest (Figure 2.11) share of costs since 2018/19, growing from 12.4% to 15.4% in 2021/22. This is largely due to the introduction of new antidiabetic drugs. The three new-generation/non-insulin drug subclasses were the key drivers: glucagon-like peptide 1 (GLP-1) agonists, dipeptidyl peptidase (DPP-4) inhibitors, and sodium glucose cotransporter 2 (SGLT-2) inhibitors.
Spending on these new antidiabetic drugs in the NPDUIS public plans increased substantially from $193 million in 2016/17 to $701 million in 2021/22, at a compound annual growth rate of 30%. This increase has significantly outpaced growth both in the overall drug market and within the class of drugs used in diabetes, resulting in an increased market share for new antidiabetic drugs. From 2016/17 to 2021/22, this share went from 2.4% to 6.4% in the overall drug market, and from 30.2% to 55.3% within the antidiabetic class.
One notable drug in this category is semaglutide (Ozempic), a GLP-1 receptor agonist used in the management of type 2 diabetes. Ever since its introduction to the Canadian market in 2018, Ozempic has captured the attention of public plans. By 2019/20, less than two years after receiving market authorization from Health Canada, Ozempic ranked third in the list of top contributors to the drug-mix effect within NPDUIS public plans. The drug’s utilization has continued to increase considerably—it topped the list of high-impact drugs for the following two consecutive years. In 2021/22, semaglutide (Ozempic) alone contributed 1.2% (Figure 2.6) to the 8.4% growth in drug costs of the public drug plans and held a 2.3% market share.
The number of active beneficiaries using semaglutide (Ozempic) rose by nearly six figures over a two-year period. From 40,576 active beneficiaries in 2019/20, this number swelled to 139,397 in 2021/22, resulting in a corresponding growth of $221 million in overall drug costs.
As the prevalence of diabetes is expected to increase in coming years, and generic competition for new generation/non-insulin drugs is still a few years away, the cost impact of these drugs is expected to continue and will be monitored through this publication. For more detailed insights and trends, please refer to the Market Intelligence Report: Antidiabetic Drugs, 2012-2021 available on the PMPRB website.
It is important to note that payers may have already obtained cost savings through confidential prices and rebates, which are not reflected in the available data.Figure 2.6 reports the 10 medicines that made the greatest contribution to the drug-mix effect in 2021/22, together accounting for an upward push of 4.1% on overall drug costs. Two medicines made their first appearance on this list in 2021/22: elexacaftor/tezacaftor/ivacaftor (Trikafta) and sacubitril/valsartan (Entresto). These medicines received their respective market authorizations from Health Canada only one and six years prior.
Two antidiabetics—semaglutide (Ozempic) and empagliflozin (Jardiance)—ranked first and fourth, respectively, on the list of high-impact drugs, with a 1.5% contribution to the growth in drug costs. Five of the other top contributors were high-cost drugs with average annual treatment costs ranging from $11,128 to $89,054, including one for the treatment of cystic fibrosis (CF), one oral oncology product, two immunosuppressants and one antiviral. The three remaining medicines were either high-use drugs or had relatively low annual treatment costs.
Four medicines that made the top 10 contributors list in the 2020/21 report were left out in 2021/22. Osimertinib (Tagrisso), benralizumab (Fasenra), insulin degludec (Tresiba), and biosimilar pegfilgratim continued to have a sizable impact on the drug-mix effect and remained among the top 30 contributors in 2020/21.
The share of total drug costs for each of the top contributors is reported in the table accompanying Figure 2.6. Note that this value differs from the contribution to the drug-mix effect, which measures the growth (increase or decrease in costs over time) rather than the costs themselves.

Figure 2.6 – Text version
| Average cost per beneficiary | Total number of beneficiaries | Drug cost, in millions of dollars and as a percent share | Number of marketed years | Therapeutic class | Medicinal ingredient (trade name) | Contribution to the drug-mix effect |
|---|---|---|---|---|---|---|
$1,829 |
139,397 |
$255 (2.3%) |
4 |
Drugs used in diabetes |
Semaglutide (Ozempic) |
1.20% |
$9,180 |
44,496 |
$408.5 (3.8%) |
8 |
Ophthalmologicals |
Aflibercept (Eylea) |
0.64% |
$89,054 |
710 |
$63.2 (0.6%) |
1 |
Other respiratory system products |
Elexacaftor/tezacaftor/ivacaftor (Trikafta) |
0.63% |
$826 |
206,509 |
$170.5 (1.6%) |
7 |
Drugs used in diabetes |
Empagliflozin (Jardiance) |
0.33% |
$17,918 |
3,210 |
$57.5 (0.5%) |
3 |
Immunosuppressants |
Risankizumab (Skyrizi) |
0.29% |
$975 |
250,037 |
$243.8 (2.2%) |
10 |
Antithrombotic agents |
Apixaban (Eliquis) |
0.22% |
$46,066 |
2,040 |
$94 (0.9%) |
6 |
Antineoplastic agents |
Palbociclib (Ibrance) |
0.22% |
$26,178 |
2,417 |
$63.3 (0.6%) |
5 |
Immunosuppressants |
Ocrelizumab (Ocrevus) |
0.20% |
$2,244 |
33,811 |
$75.9 (0.7%) |
6 |
Agents acting on the renin-angiotensin system |
Sacubitril/valsartan (Entresto) |
0.19% |
$11,128 |
4,945 |
$55 (0.5%) |
4 |
Antivirals for systemic use |
Bictegravir/emtricitabine/tenofovir alafenamide (Biktarvy) |
0.18% |
Note: This analysis only includes data for beneficiaries that met their deductible and received public reimbursement.
* British Columbia, Alberta, Saskatchewan, Manitoba, Ontario, New Brunswick, Nova Scotia, Prince Edward Island, Newfoundland and Labrador, and Yukon.
† The average cost per beneficiary may not represent the cost of a complete year of treatment.
†† All of the top contributors to the push effect are associated with product listing agreements (PLAs) from pCPA negotiations for one or multiple indications; however, reported drug costs do not reflect price reductions resulting from confidential PLAs.
‡ The number of years since the drug was authorized for market by Health Canada, as of 2021/22.
§ The therapeutic class is based on ATC level 2. Jurisdictions that have special programs for ophthalmological drugs are not captured in the results.
Data source: National Prescription Drug Utilization Information System Database, Canadian Institute for Health Information.
A growing number of high-cost drugs have been reimbursed by NPDUIS public plans in recent years, often targeting relatively small patient populations. The number of medicines with an average annual cost per beneficiary exceeding $10,000 increased significantly from 103 in 2016/17 to 144 in 2021/22. These drugs, which accounted for 27.9% of the overall NPDUIS drug costs in 2016/17, made up 36.8% of costs in 2021/22, while representing only a very small percentage of active beneficiaries (3.0%).
Although there has been a sustained growth in the drug cost share of all high-cost drugs in recent years, the steepest increase has been among those in the highest cost band ($50,000+). Figure 2.7 reports on trends in the market for high-cost drugs from 2016/17 to 2021/22 by average annual drug cost per active beneficiary determined at the medicinal ingredient level: $10,000–$20,000; $20,000–$50,000; and $50,000 or more.
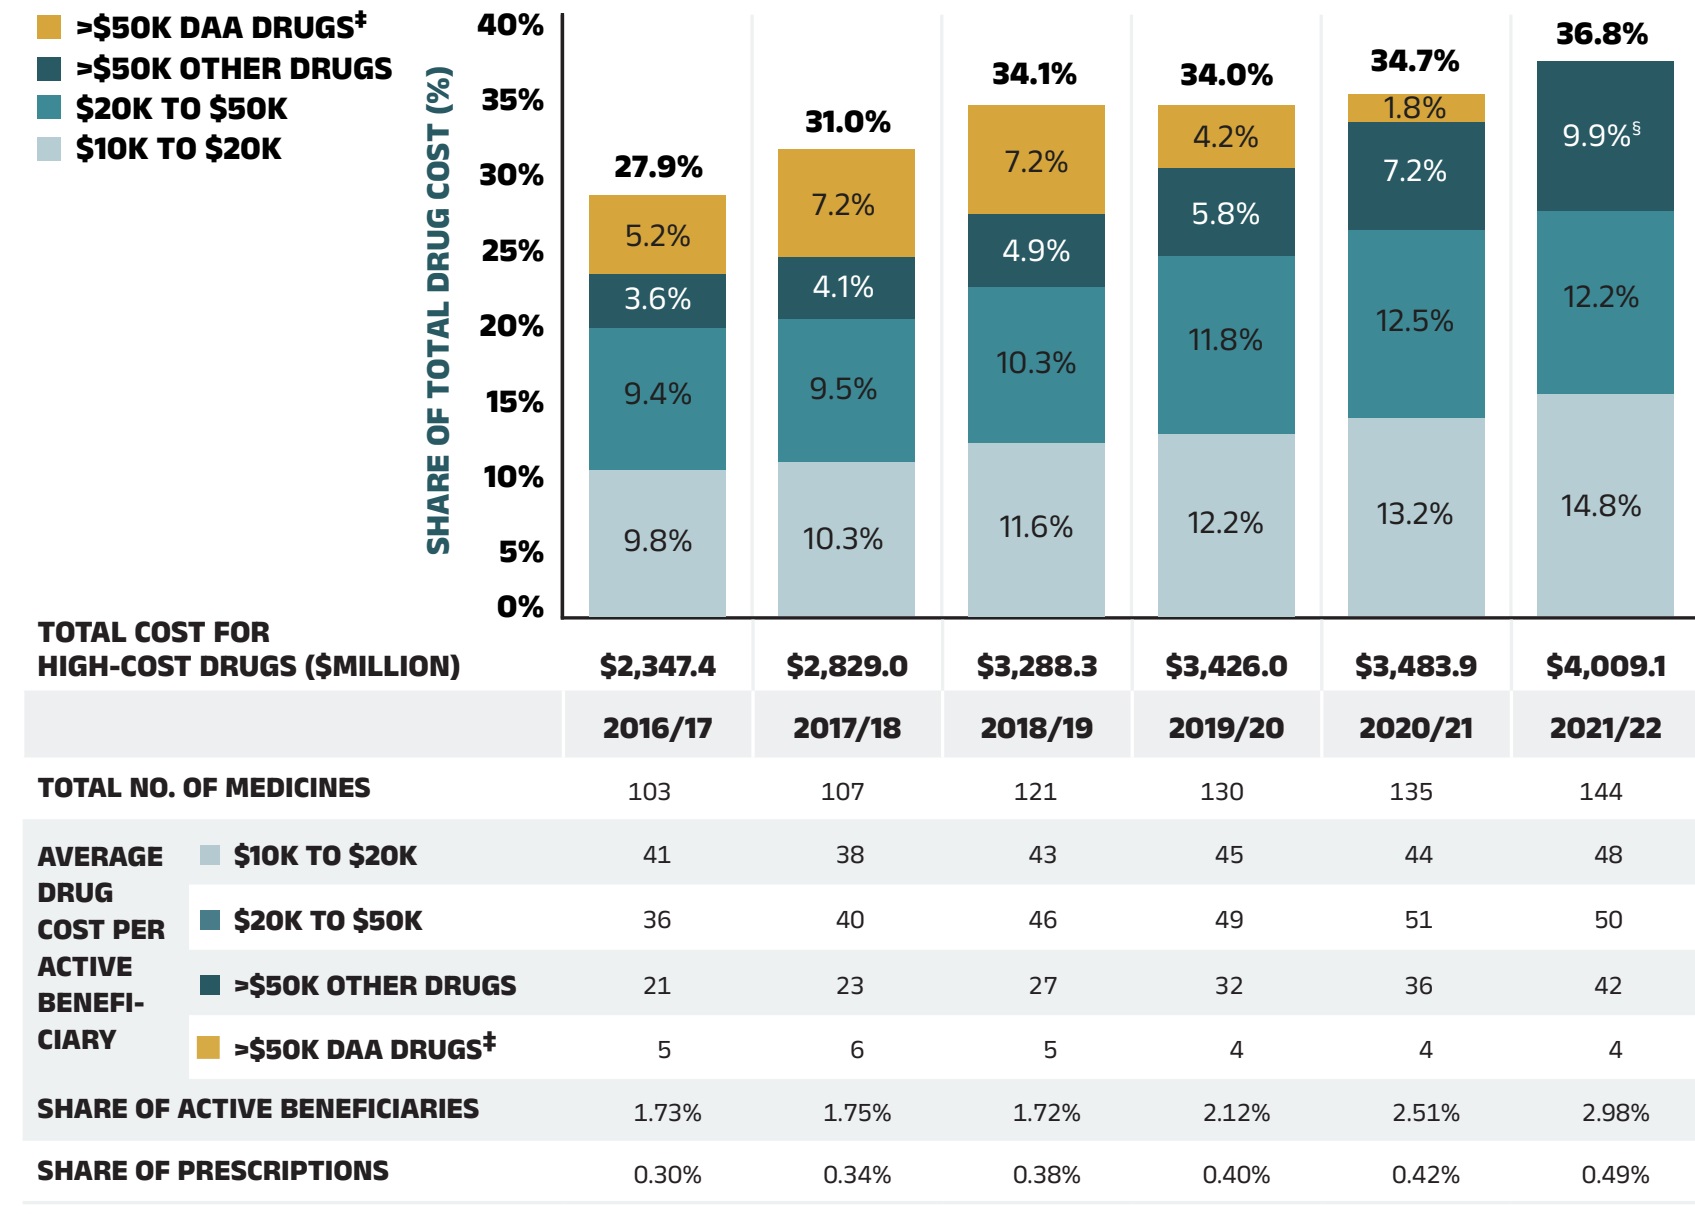
Figure 2.7 – Text version
| 2016/17 | 2017/18 | 2018/19 | 2019/20 | 2020/21 | 2021/22 | |
|---|---|---|---|---|---|---|
Total number of medicines |
103 |
107 |
121 |
130 |
135 |
144 |
Total drug cost for all high-cost drugs, in millions of dollars |
$2,347.4 |
$2,829.0 |
$3,288.3 |
$3,426.0 |
$3,483.9 |
$4,009.1 |
Average cost per active beneficiary of $10,000‒20,000: share of total drug cost |
9.8% |
10.3% |
11.6% |
12.2% |
13.2% |
14.8% |
Average cost per active beneficiary of $10,000‒20,000: number of medicines |
41 |
38 |
43 |
45 |
44 |
48 |
Average cost per active beneficiary of $20,000–$50,000: share of total drug cost |
9.4% |
9.5% |
10.3% |
11.8% |
12.5% |
12.2% |
Average cost per active beneficiary of $20,000–$50,000: number of medicines |
36 |
40 |
46 |
49 |
51 |
50 |
Average cost per active beneficiary of greater than $50,000: share of total drug cost for other drugs |
3.6% |
4.1% |
4.9% |
5.8% |
7.2% |
9.9% |
Average cost per active beneficiary of greater than $50,000: number of medicines for other drugs |
21 |
23 |
27 |
32 |
36 |
42 |
Average cost per active beneficiary of greater than $50,000: share of total drug cost for direct-acting antiviral drugs |
5.2% |
7.2% |
7.2% |
4.2% |
1.8% |
- |
Average cost per active beneficiary of greater than $50,000: number of medicines for direct-acting antiviral drugs |
5 |
6 |
5 |
4 |
4 |
4 |
High-cost drugs – share of total drug cost |
27.9% |
31.0% |
34.1% |
34.0% |
34.7% |
36.8% |
High-cost drugs – share of active beneficiaries |
1.73% |
1.75% |
1.72% |
2.12% |
2.51% |
2.98% |
High-cost drugs – share of total prescriptions |
0.30% |
0.34% |
0.38% |
0.40% |
0.42% |
0.49% |
Note: This analysis only includes data for beneficiaries that met their deductible and received public reimbursement. These results may be underestimated, as some high-cost drugs are reimbursed through special public drug plan programs that are not captured in the NPDUIS data. The methodology for this analysis was revised for the 2018/19 report; as such, historical results may not match those reported in previous editions.
* Average annual drug costs per active beneficiary exceeding $10,000.
† British Columbia, Alberta, Saskatchewan, Manitoba, Ontario, New Brunswick, Nova Scotia, Prince Edward Island, Newfoundland and Labrador, Yukon, and the Non-Insured Health Benefits Program. As of 2020/21, results do not include the NIHB program.
‡ Direct-acting antiviral (DAA) drugs used in the treatment of hepatitis C.
§ 2021/22 result includes >$50K DAA drugs cost share (1.5%)
Data source: National Prescription Drug Utilization Information System Database, Canadian Institute for Health Information.
Figure 2.8 provides a more detailed breakdown of the share of high-cost drugs by jurisdiction in 2021/22. High-cost drugs account for a greater share of costs in income- and premium-based programs; for example, they make up approximately half of the total drug costs for public plans in Manitoba (60.2%) and in Saskatchewan (44.7%). These types of programs require beneficiaries to be responsible for a portion of prescription costs, either as a percentage of income or a premium. As such, plan spending is more heavily skewed toward beneficiaries with higher overall costs, and therefore high-cost drugs.
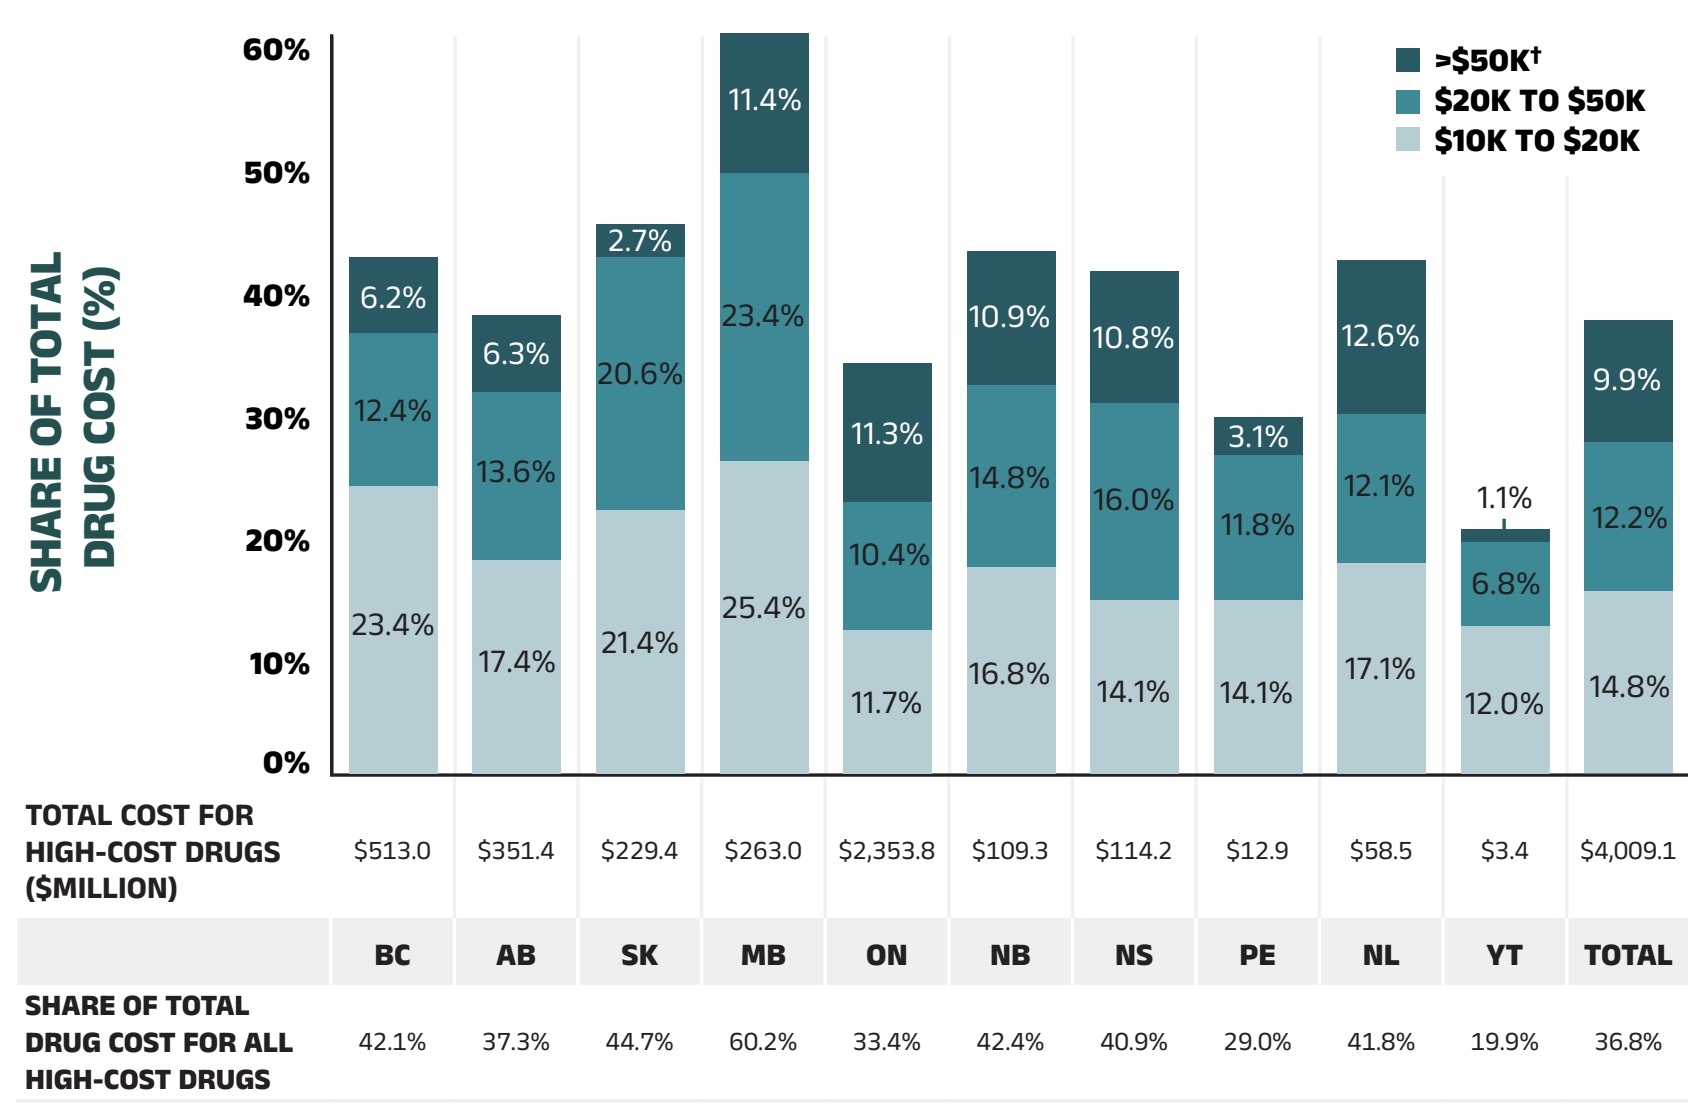
Figure 2.8 – Text version
| British Columbia | Alberta | Saskatchewan | Manitoba | Ontario | New Brunswick | Nova Scotia | Prince Edward Island | Newfoundland and Labrador | Yukon | Total | |
|---|---|---|---|---|---|---|---|---|---|---|---|
Total drug cost for all high-cost drugs, in millions of dollars |
$513.0 |
$351.4 |
$229.4 |
$263.0 |
$2,353.8 |
$109.3 |
$114.2 |
$12.9 |
$58.5 |
$3.4 |
$4,009.1 |
Average cost per beneficiary of $10,000‒20,000: share of total drug cost |
23.4% |
17.4% |
21.4% |
25.4% |
11.7% |
16.8% |
14.1% |
14.1% |
17.1% |
12.0% |
14.8% |
Average cost per beneficiary of $20,000–$50,000: share of total drug cost |
12.4% |
13.6% |
20.6% |
23.4% |
10.4% |
14.8% |
16.0% |
11.8% |
12.1% |
6.8% |
12.2% |
Average cost per beneficiary of greater than $50,000: share of total drug cost for other drugs |
6.2% |
6.3% |
2.7% |
11.4% |
11.3% |
10.9% |
10.8% |
3.1% |
12.6% |
1.1% |
9.9% |
Share of total drug cost for all high-cost drugs |
42.1% |
37.3% |
44.7% |
60.2% |
33.4% |
42.4% |
40.9% |
29.0% |
41.8% |
19.9% |
36.8% |
Note: This analysis only includes data for beneficiaries that met their deductible and received public reimbursement. These results may be underestimated, as some high-cost drugs are reimbursed through special public drug plan programs that are not captured in the NPDUIS data.
* Average annual drug costs per active beneficiary exceeding $10,000.
† 2021/22 results include >$50K Direct-acting antiviral (DAA) drugs cost share ranging from 0.3% (MB) to 3.4% (BC).
Data source: National Prescription Drug Utilization Information System Database, Canadian Institute for Health Information.
NPDUIS public plans have paid the majority of drug costs for the relatively small number of high-cost beneficiaries that accounted for more than 60% of total drug costs in 2021/22. As shown in Figure 1.2, NPDUIS public plans paid an average of 87% of total prescription costs in 2021/22, while the remaining 13% was paid by the beneficiaries either out of pocket or through a private insurer. To understand to what extent the plan-paid and beneficiary-paid portions of prescription costs are associated with the beneficiary’s total annual drug costs, Figure 2.9 provides a breakdown of the plan-paid share of NPDUIS drug plan expenditures by average beneficiary annual drug cost level in 2021/22. Beneficiaries are grouped into five cost tiers: less than $5,000; $5,000–$10,000; $10,000–$20,000; $20,000–$50,000; and $50,000 or more.
The figure shows that plans paid a larger portion of prescription costs for higher-cost beneficiaries. In 2021/22, the 7.5% of beneficiaries that had annual drug costs over $5,000 accounted for 61% of overall drug costs for the public plans. For beneficiaries in the highest cost band—those with annual costs over $50,000—the plan-paid share of costs ranged from 97% to nearly 100%.
There were considerable jurisdictional differences in plan-paid shares due to variations in plan design, eligibility, and other factors.
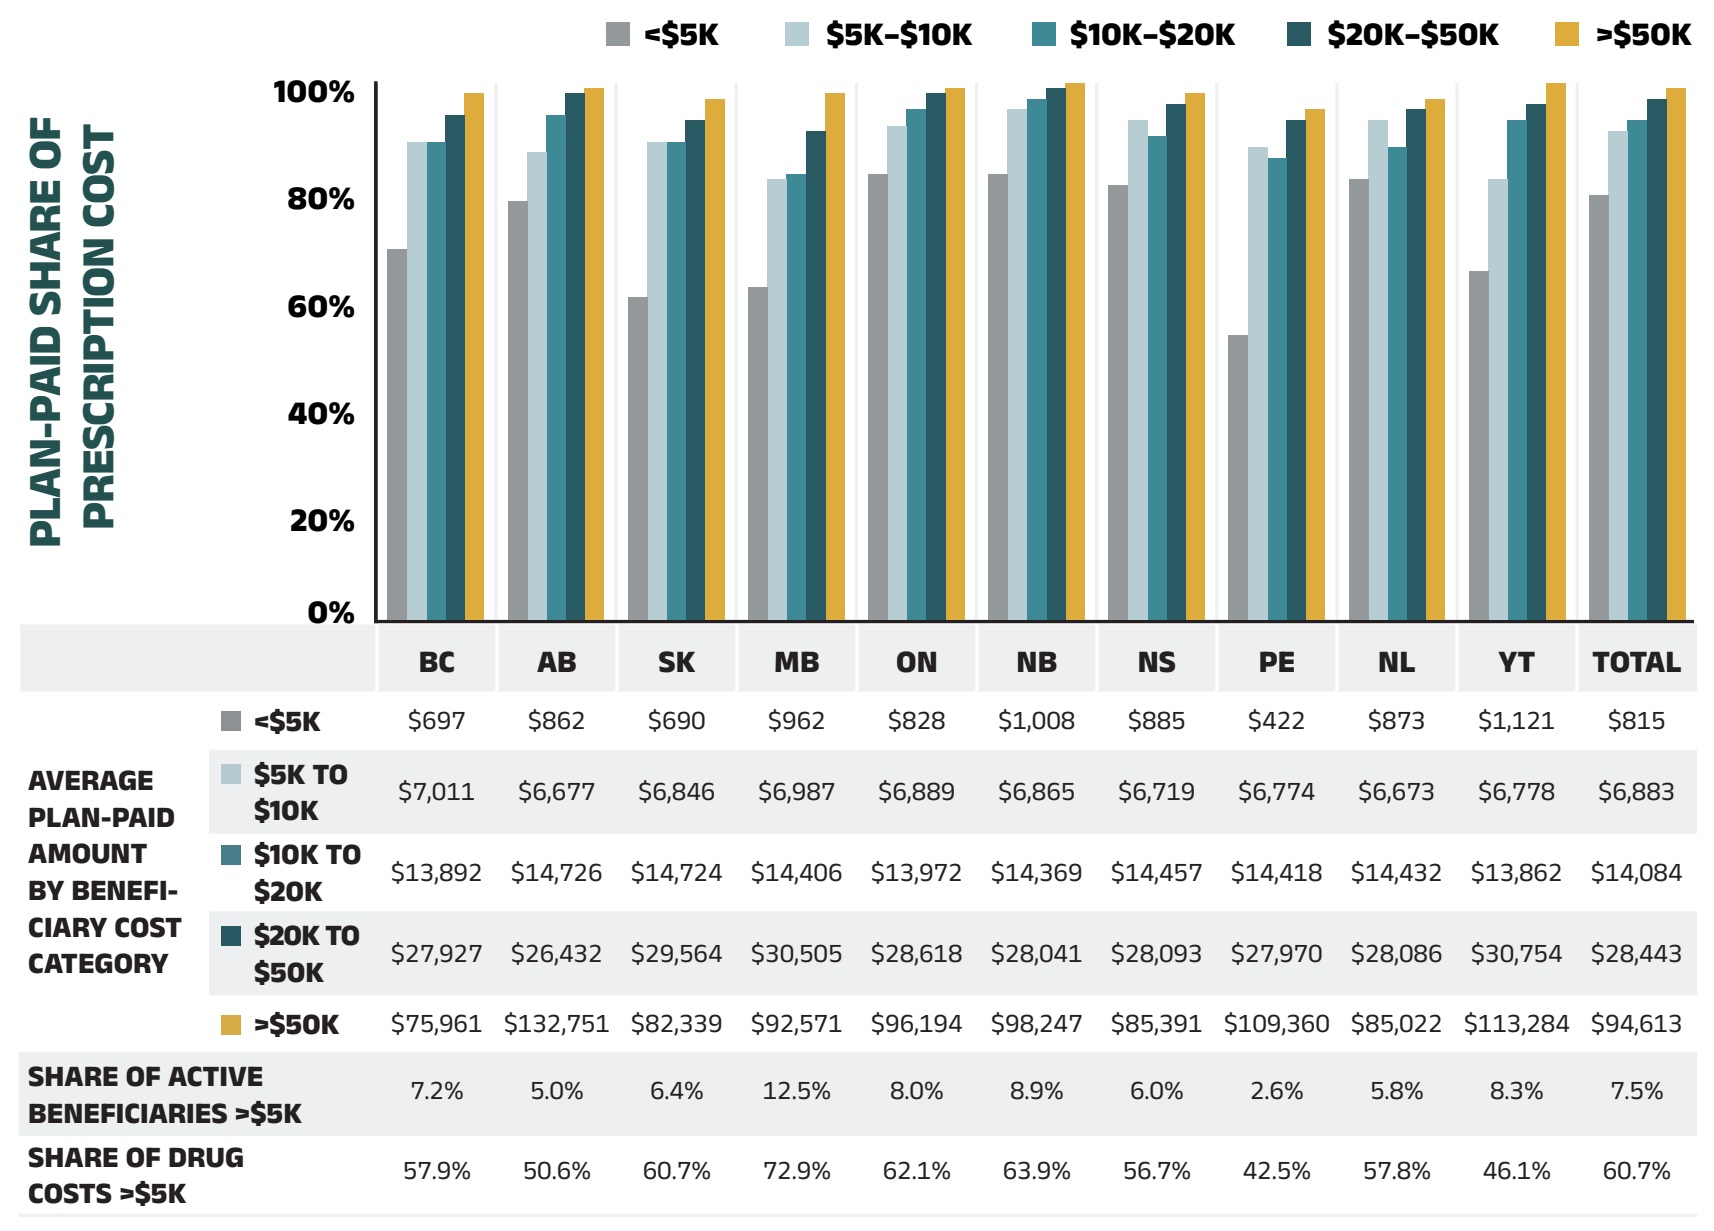
Figure 2.9 – Text version
| Average beneficiary annual drug cost | British Columbia | Alberta | Saskatchewan | Manitoba | Ontario | New Brunswick | Nova Scotia | Prince Edward Island | Newfoundland and Labrador | Yukon | Total | |
|---|---|---|---|---|---|---|---|---|---|---|---|---|
Plan-paid share of prescription cost |
Less than $5,000 |
69% |
78% |
60% |
62% |
83% |
83% |
81% |
53% |
82% |
65% |
79% |
$5,000–$10,000 |
89% |
87% |
89% |
82% |
92% |
95% |
93% |
88% |
93% |
82% |
91% |
|
$10,000–$20,000 |
89% |
94% |
89% |
83% |
95% |
97% |
90% |
86% |
88% |
93% |
93% |
|
$20,000–$50,000 |
94% |
98% |
93% |
91% |
98% |
99% |
96% |
93% |
95% |
96% |
97% |
|
Greater than $50,000 |
98% |
99% |
97% |
98% |
99% |
100% |
98% |
95% |
97% |
100% |
99% |
| Average beneficiary annual drug cost | British Columbia | Alberta | Saskatchewan | Manitoba | Ontario | New Brunswick | Nova Scotia | Prince Edward Island | Newfoundland and Labrador | Yukon | Total | |
|---|---|---|---|---|---|---|---|---|---|---|---|---|
Average plan-paid amount |
Less than $5,000 |
$697 |
$862 |
$690 |
$962 |
$828 |
$1,008 |
$885 |
$422 |
$873 |
$1,121 |
$815 |
$5,000–$10,000 |
$7,011 |
$6,677 |
$6,846 |
$6,987 |
$6,889 |
$6,865 |
$6,719 |
$6,774 |
$6,673 |
$6,778 |
$6,883 |
|
$10,000–$20,000 |
$13,892 |
$14,726 |
$14,724 |
$14,406 |
$13,972 |
$14,369 |
$14,457 |
$14,418 |
$14,432 |
$13,862 |
$14,084 |
|
$20,000–$50,000 |
$27,927 |
$26,432 |
$29,564 |
$30,505 |
$28,618 |
$28,041 |
$28,093 |
$27,970 |
$28,086 |
$30,754 |
$28,443 |
|
Greater than $50,000 |
$75,961 |
$132,751 |
$82,339 |
$92,571 |
$96,194 |
$98,247 |
$85,391 |
$109,360 |
$85,022 |
$113,284 |
$94,613 |
|
Share of active beneficiaries |
Greater than $5,000 |
7.2% |
5.0% |
6.4% |
12.5% |
8.0% |
8.9% |
6.0% |
2.6% |
5.8% |
8.3% |
7.5% |
Share of drug costs over $5,000 |
57.9% |
50.6% |
60.7% |
72.9% |
62.1% |
63.9% |
56.7% |
42.5% |
57.8% |
46.1% |
60.7% |
*Beneficiaries were categorized based on the amount that a drug program paid per year.
Data source: National Prescription Drug Utilization Information System Database, Canadian Institute for Health Information.
Table 2.2 reports the 10 highest-cost drugs reimbursed by the NPDUIS public plans in 2021/22 ranked by their average annual drug cost per active beneficiary. All 10 drugs were indicated to treat rare diseases and had treatment costs exceeding $250,000. Note that although Table 2.2 presents the overall results for all NPDUIS public drug plans, there are significant variations at the individual plan level.
Table 2.2 Top 10 drugs with the highest average annual drug cost per active beneficiary, NPDUIS public drug plans*, 2021/22
| Medicinal ingredient (Trade name) | Therapeutic class, ATC level 2 | Average drug cost per beneficiary† | No. of marketed years‡ |
|---|---|---|---|
Onasemnogene abeparvovec (Zolgensma) |
Other drugs for disorders of the musculo-skeletal system |
$3,085,122 |
1 |
Cerliponase alfa (Brineura) |
Other alimentary tract and metabolism products |
$837,647 |
3 |
Elosulfase alfa (Vimizim) |
Other alimentary tract and metabolism products |
$604,506 |
8 |
Alglucosidase alfa (Myozyme) |
Other alimentary tract and metabolism products |
$533,878 |
16 |
Eculizumab (Soliris) |
Immunosuppressants |
$458,310 |
13 |
Patisiran (Onpattro) |
Other nervous system drugs |
$350,827 |
3 |
Nusinersen (Spinraza) |
Other drugs for disorders of the musculo-skeletal system |
$348,908 |
5 |
Inotersen (Tegsedi) |
Other nervous system drugs |
$275,851 |
3 |
Velaglucerase alfa (Vpriv) |
Other alimentary tract and metabolism products |
$267,262 |
12 |
Migalastat (Galafold) |
Other alimentary tract and metabolism products |
$250,269 |
5 |
Note: This analysis only includes data for beneficiaries that met their deductible and received public reimbursement. This list of drugs does not include high-cost drugs reimbursed through special programs, which are not captured in the NPDUIS data.
* British Columbia, Alberta, Saskatchewan, Manitoba, Ontario, New Brunswick, Nova Scotia, Prince Edward Island, Newfoundland and Labrador, and Yukon.
† Represents the total drug cost divided by the total number of beneficiaries and, thus, may include beneficiaries with incomplete treatment costs.
‡ The number of years since the drug was authorized for market by Health Canada, as of 2021/22.
Data source: National Prescription Drug Utilization Information System Database, Canadian Institute for Health Information.
Over the past few years, biologic medicines have captured an increasing share of the total drug costs for the NPDUIS public plans. In 2021/22, the biologics market share grew by 12.6% to reach 31.6% ($3.4 billion) of total drug costs. The top four biologic medicines—aflibercept (Eylea), adalimumab (Humira and biosimilars), infliximab (Remicade and biosimilars), and semaglutide (Ozempic)—were responsible for 12.7% of total NPDUIS drug costs. While the top ten biologic medicines accounted for nearly 20% of the overall NPDUIS drug costs in 2021/22, they represented less than 10% of active beneficiaries.
Figure 2.10 reports on trends in the biologic share of total drug costs for the NPDUIS public drug plans, along with the growth in drug costs for this market segment and the current list of top 10 biologic medicines.
Saskatchewan and Manitoba had the highest levels of biologics-related costs relative to total drug costs in 2021/22 (43.3% and 41.0%, respectively), while Manitoba and Ontario had the highest rates of growth (17.9% and 16.7%, respectively). Variations among plans may be driven by differing plan designs, eligibility for reimbursement, the disease profiles of the population, and the size of the plan, among other considerations.
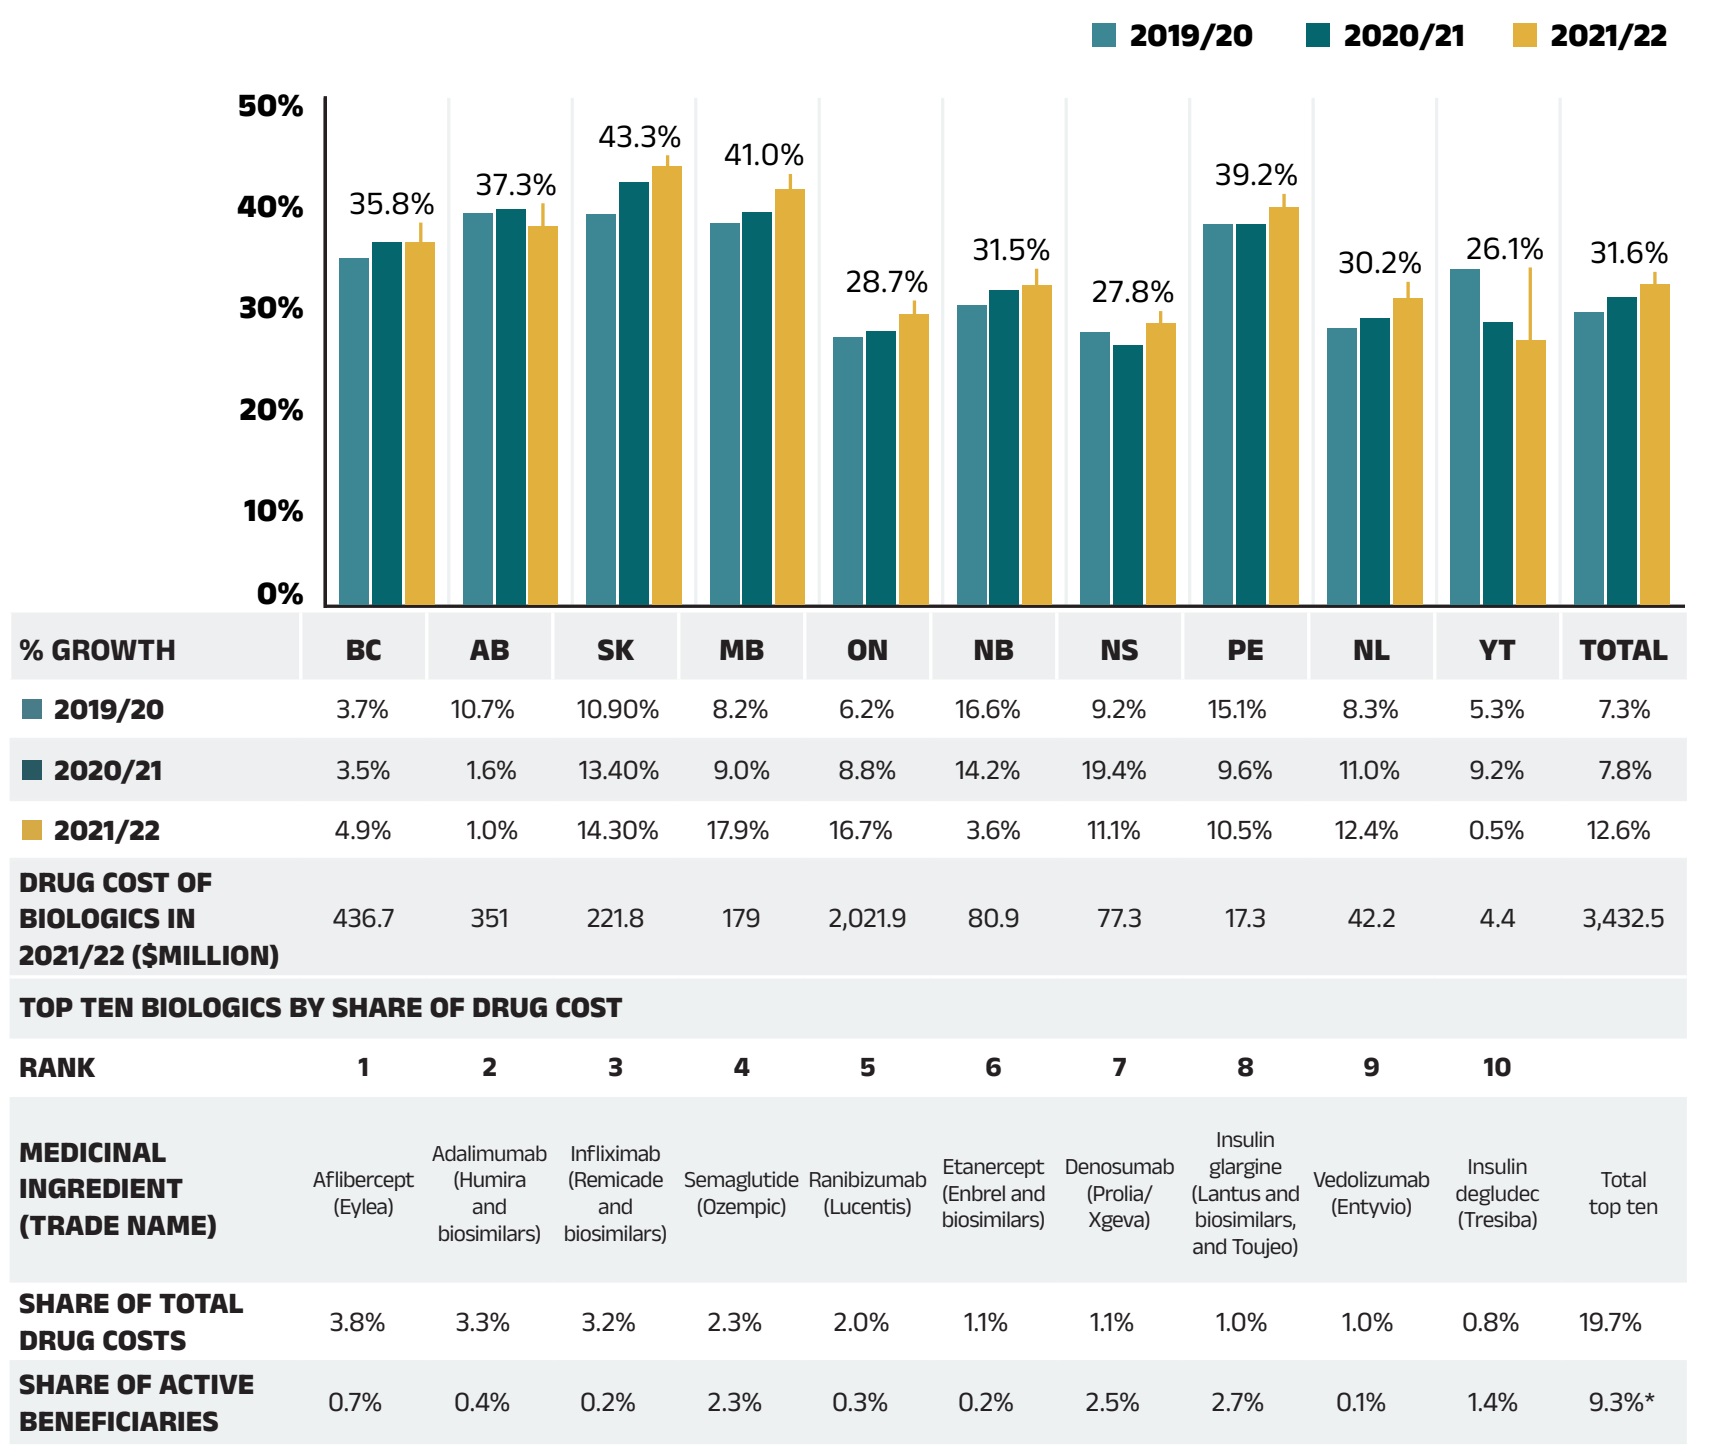
Figure 2.10 – Text version
| British Columbia | Alberta | Saskatchewan | Manitoba | Ontario | New Brunswick | Nova Scotia | Prince Edward Island | Newfoundland and Labrador | Yukon | Total | |
|---|---|---|---|---|---|---|---|---|---|---|---|
Biologic share of total drug costs per year |
|||||||||||
2019/20 |
34.2% |
38.6% |
38.5% |
37.6% |
26.4% |
29.5% |
26.9% |
37.5% |
27.3% |
33.1% |
28.9% |
2020/21 |
35.8% |
39.0% |
41.7% |
38.7% |
27.0% |
31.0% |
25.6% |
37.5% |
28.3% |
27.9% |
30.3% |
2021/22 |
35.8% |
37.3% |
43.3% |
41.0% |
28.7% |
31.5% |
27.8% |
39.2% |
30.2% |
26.1% |
31.6% |
Percent growth |
|||||||||||
2019/20 |
3.7% |
10.7% |
10.9% |
8.2% |
6.2% |
16.6% |
9.2% |
15.1% |
8.3% |
5.3% |
7.3% |
2020/21 |
3.5% |
1.6% |
13.4% |
9.0% |
8.8% |
14.2% |
19.4% |
9.6% |
11.0% |
9.2% |
7.8% |
2021/22 |
4.9% |
1.0% |
14.3% |
17.9% |
16.7% |
3.6% |
11.1% |
10.5% |
12.4% |
0.5% |
12.6% |
Drug cost of biologics in 2021/22, in millions of dollars |
436.7 |
351.0 |
221.8 |
179.0 |
2,021.9 |
80.9 |
77.3 |
17.3 |
42.2 |
4.4 |
3,432.5 |
Top 10 biologics by share of drug cost
| Rank | 1 | 2 | 3 | 4 | 5 | 6 | 7 | 8 | 9 | 10 |
Total top 10 |
|---|---|---|---|---|---|---|---|---|---|---|---|
Medicinal ingredient (trade name) |
Aflibercept (Eylea) |
Adalimumab (Humira and biosimilars) |
Infliximab (Remicade and biosimilars) |
Semaglutide (Ozempic) |
Ranibizumab (Lucentis) |
Etanercept (Enbrel and biosimilars) |
Denosumab (Prolia) |
Insulin glargine (Lantus and biosimilars) |
Vedolizumab (Entyvio) |
Insulin degludec (Tresiba) |
|
Share of total drug cost |
3.8% |
3.3% |
3.2% |
2.3% |
2.0% |
1.1% |
1.1% |
1.0% |
1.0% |
0.8% |
19.7% |
Share of active beneficiaries |
0.7% |
0.4% |
0.2% |
2.3% |
0.3% |
0.2% |
2.5% |
2.7% |
0.1% |
1.4% |
9.3% |
Note: This analysis only includes data for beneficiaries that met their deductible and received public reimbursement.
*For a given year, each active beneficiary who used any of the top biologics was only counted once; therefore, the share of total active beneficiaries may be lower than the sum of each biologic medicine’s share of active beneficiaries.
Data source: National Prescription Drug Utilization Information System Database, Canadian Institute for Health Information.
An analysis by therapeutic area shows that over two thirds of the total drug costs in 2021/22 were concentrated in just five classes. Antineoplastic and immunomodulating agents topped the list of therapeutic classes, the same as in 2016/17; however, they represented a significantly higher share of the total costs (having increased from 21.8% in 2016/17 to 28.4% in 2021/22). This reflects a further shift towards oral oncology medicines and a higher use of immunomodulating drugs. Alimentary tract and metabolism medicines held the second-highest share of costs (15.4%), due in part to new antidiabetics. Nervous system medicines, which include relatively low-cost drugs used by a large number of active beneficiaries, represented a lower share of costs (11.0%) in 2021/22, primarily due to significant increases in other therapeutic areas. The cost share of anti-infectives for systemic use was largely shaped by the changes in the use of DAA drugs for the treatment of hepatitis C from 2016/17 to 2021/22.
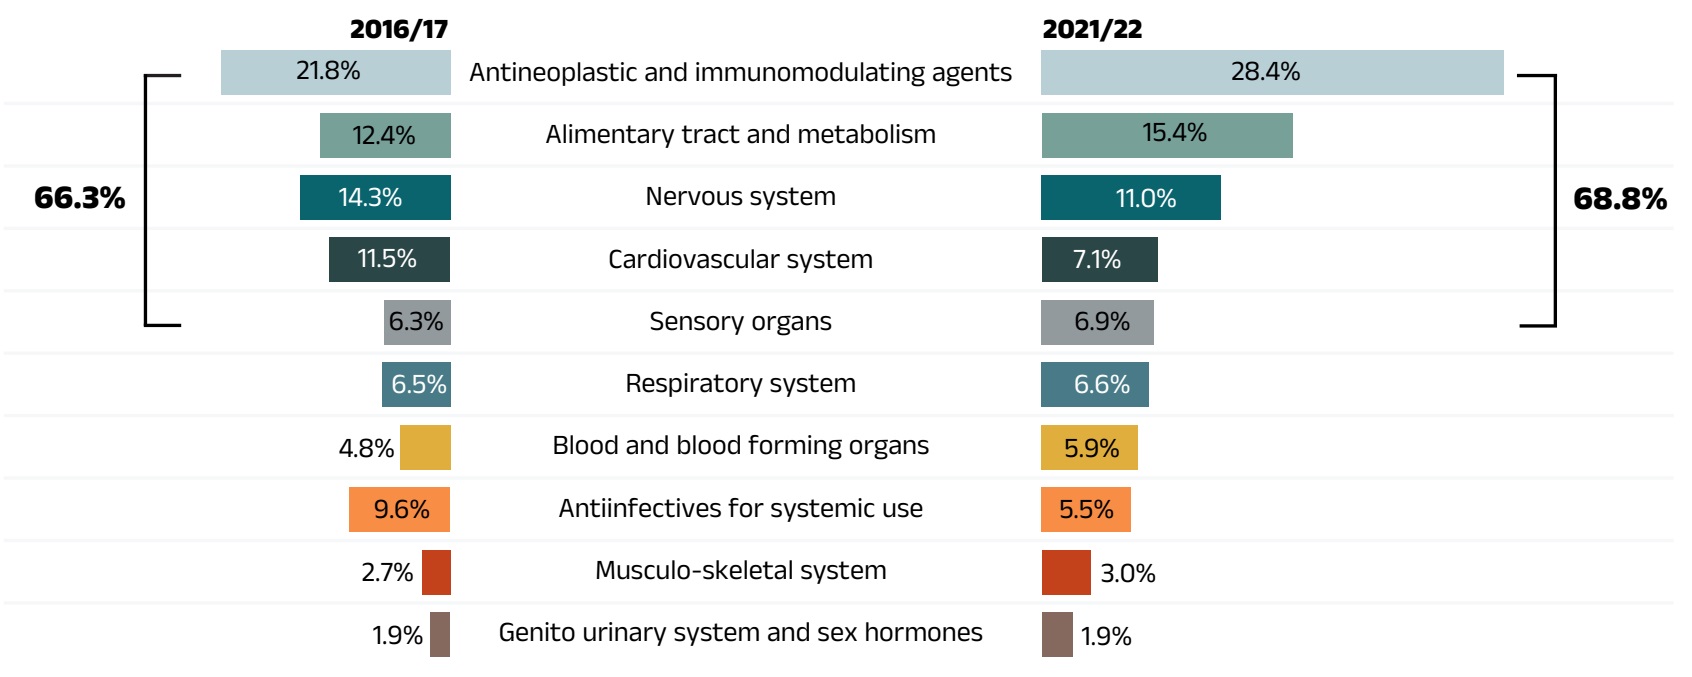
Figure 2.11 – Text version
| Top 10 therapeutic classes | 2016/17 | 2021/22 |
|---|---|---|
Antineoplastic and immunomodulating agents |
21.8% |
28.4% |
Alimentary tract and metabolism |
12.4% |
15.4% |
Nervous system |
14.3% |
11.0% |
Cardiovascular system |
11.5% |
7.1% |
Sensory organs |
6.3% |
6.9% |
Respiratory system |
6.5% |
6.6% |
Blood and blood forming organs |
4.8% |
5.9% |
Antiinfectives for systemic use |
9.6% |
5.5% |
Musculo-skeletal system |
2.7% |
3.0% |
Genito urinary system and sex hormones |
1.9% |
1.9% |
Note: This analysis only includes data for beneficiaries that met their deductible and received public reimbursement.
* Anatomical Therapeutic Chemical (AT C) classification system maintained by the World Health Organization.
† British Columbia, Alberta, Saskatchewan, Manitoba, Ontario, New Brunswick, Nova Scotia, Prince Edward Island, Newfoundland and Labrador, Yukon, and the Non-Insured Health Benefits Program. Results for 2021/22 do not include the NIHB program.
Data source: National Prescription Drug Utilization Information System Database, Canadian Institute for Health Information.
3. The Drivers of Dispensing Costs, 2020/21 to 2021/22
The marginally positive rate of change in dispensing costs in 2021/22 was decidedly lower than the growth in drug costs, continuing the trend of slower growth observed over the last few years. Upward cost pressures from a rebound in the number of active beneficiaries and a slightly higher average dispensing fee per prescription over 2021/22 were largely offset by a decreased quantity of drugs dispensed per patient and a sizable downward pull from greater prescription sizes, due in part to the lifting of temporary COVID-19 pandemic policies on dispensing frequency. This pattern was effectively the reverse of 2020/21 trends.
Like drug costs, changes in dispensing costs are driven by a number of push and pull effects. The net effect of these opposing forces yields the overall rate of change.
Demographic effect: Changes in the number of active beneficiaries, as well as shifts in the age or gender distribution.
Drug volume effect: Changes in the number of units dispensed to patients.
Fee effect: Changes in the average dispensing fee per prescription.
Prescription size effect: Changes in the number of units dispensed per prescription.
In this section, a comprehensive cost driver analysis is used to determine how much public plan dispensing costs would have changed between 2020/21 and 2021/22 if only one factor (e.g., the average dispensing fee) was considered while all the others remained the same.Reference IX
Long-term care (LTC) prescriptions in Ontario have been excluded from the dispensing costs analysis since 2017/18, as their dispensing patterns and funding model may differ from those of the general beneficiary population. Typically, LTC prescriptions contribute less than 0.1% to growth and are therefore not presented in the cost drivers figure. However, there was an exception during the periods of 2019/20 and 2020/21 when LTC prescriptions were presented as a separate factor. This was done to reflect the overall impact of the introduction of a capitation funding model to the LTC sub-program in January 2020.
Dispensing costs in the NPDUIS public plans increased slightly by 0.1% or $1.7 million in 2021/22, maintaining the total at $2.3 billion, and signaling a return to the positive growth trend observed before the COVID-19 pandemic.
Figure 3.1 provides insight into the pressures driving changes in dispensing costs from 2016/17 to 2021/22. The demographic push effect, contrary to the COVID-19 pandemic-led pull-down force in 2020/21, was responsible for the largest annual contribution to dispensing growth in 2021/22, pushing costs up by 3.2%. In contrast, the prescription size effect reversed course from a 3.4% upward push in 2020/21 to a pull down of 2.3% in 2021/22, following the lifting of temporary policies on dispensing frequency introduced in many provinces during the COVID-19 pandemic. The changes in the average dispensing fee per prescription increased dispensing costs by 0.4% in 2021/22, while a decreased quantity of drugs dispensed per patient pulled costs down by 1.0%.
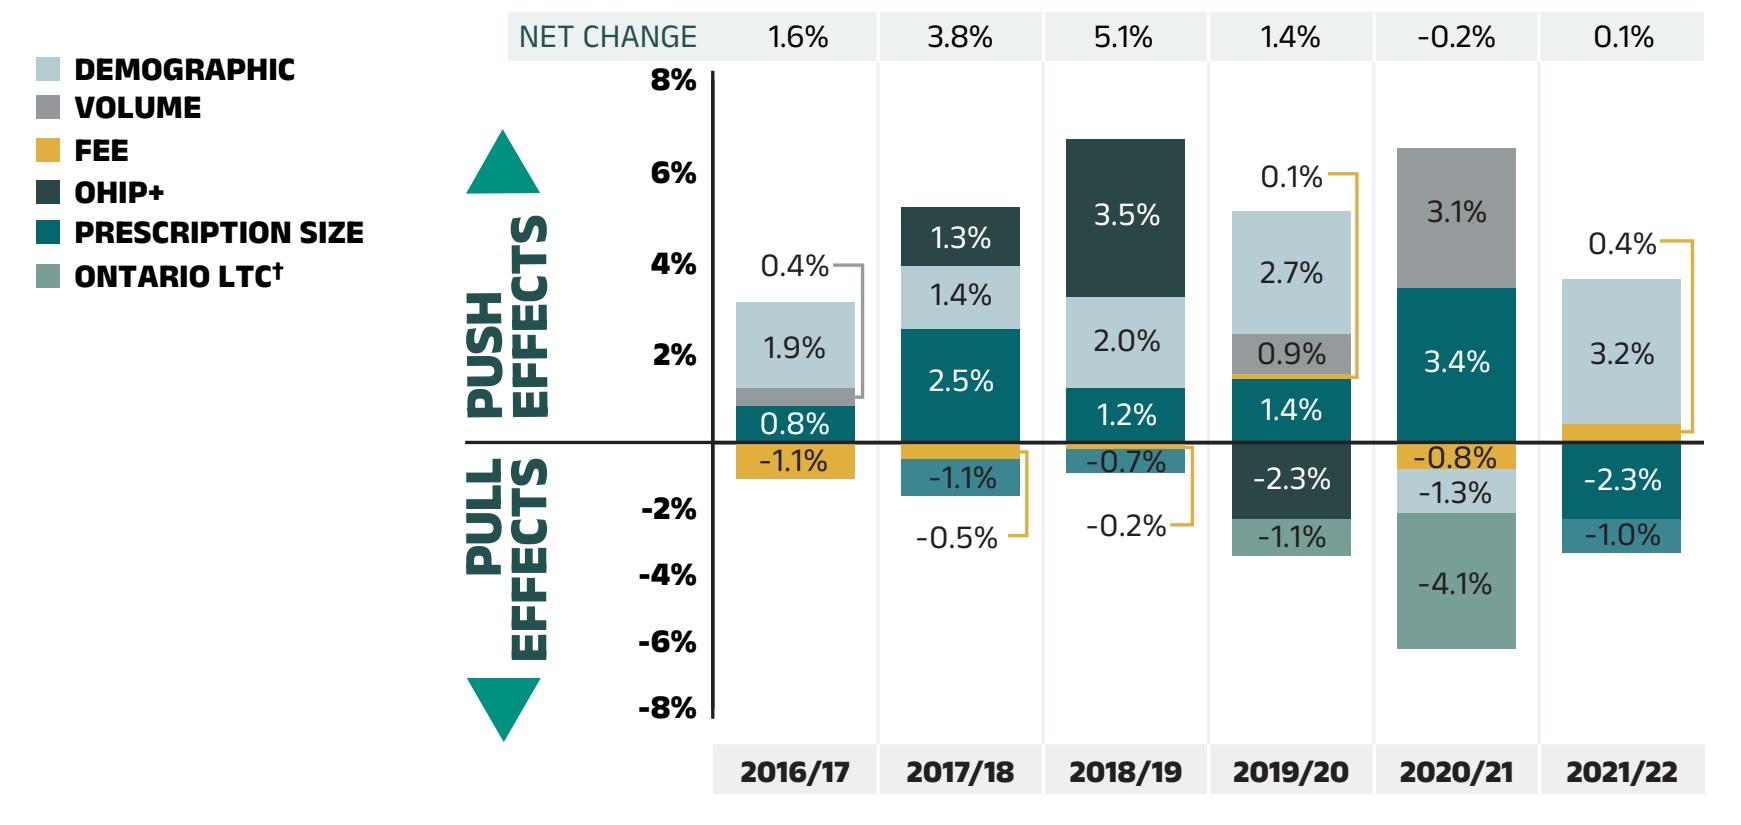
Figure 3.1 – Text version
| 2016/17 | 2017/18 | 2018/19 | 2019/20 | 2020/21 | 2021/22 | |
|---|---|---|---|---|---|---|
Demographic |
1.9% |
1.4% |
2.0% |
2.7% |
-1.3% |
3.2% |
Volume |
0.4% |
-1.1% |
-0.7% |
0.9% |
3.1% |
-1.0% |
Fee |
-1.1% |
-0.5% |
-0.2% |
0.1% |
-0.8% |
0.4% |
Prescription size |
0.8% |
2.5% |
1.2% |
1.4% |
3.4% |
-2.3% |
OHIP+ |
– |
1.3% |
3.5% |
-2.3% |
– |
– |
Ontario Long Term Care |
– |
<0.1% |
<0.1% |
-1.1% |
-4.1% |
<0.1% |
Net Change |
1.6% |
3.8% |
5.1% |
1.4% |
-0.2% |
0.1% |
Note: Values may not add to totals due to rounding and the cross effect.
* British Columbia, Alberta, Saskatchewan, Manitoba, Ontario, New Brunswick, Nova Scotia, Prince Edward Island, Newfoundland and Labrador, Yukon, and the Non-Insured Health Benefits Program. As of 2020/21, results do not include the NIHB program.
† Long-term care (LTC) prescriptions in Ontario have been excluded from the dispensing costs analysis since 2017/18, as their dispensing patterns and funding model may differ from those of the general beneficiary population. Typically, LTC prescriptions contribute less than 0.1% to the overall growth in dispensing costs across all NPDUIS public plans. However, there was an exception during the periods of 2019/20 and 2020/21 when LTC prescriptions were presented as a separate factor. This was done to reflect the overall impact of the introduction of a capitation funding model to the LTC sub-program in January 2020.
Data source: National Prescription Drug Utilization Information System Database, Canadian Institute for Health Information.
The overall rate of change in dispensing costs varied widely among individual plans, from a high of 27.7% in Yukon to a low of -3.1% in Nova Scotia (Figure 3.2). The high growth in Yukon was driven by the significant increase in the average dispensing fee per prescription from 2020/21 to 2021/22. In Nova Scotia, the decrease in dispensing costs was due to the sizable negative prescription size effect and volume effect. In other jurisdictions, the overall growth in dispensing costs was more moderate.
Long-term care (LTC) prescriptions were separated out from Ontario results in this cost driver analysis. The implementation of a LTC capitation funding model had a significant impact during 2019/20 and 2020/21. However, the program has now stabilized and has a negligible contribution to the rate of change in Ontario dispensing costs. As a result, LTC prescriptions are not displayed for 2021/22 in Figure 3.2.
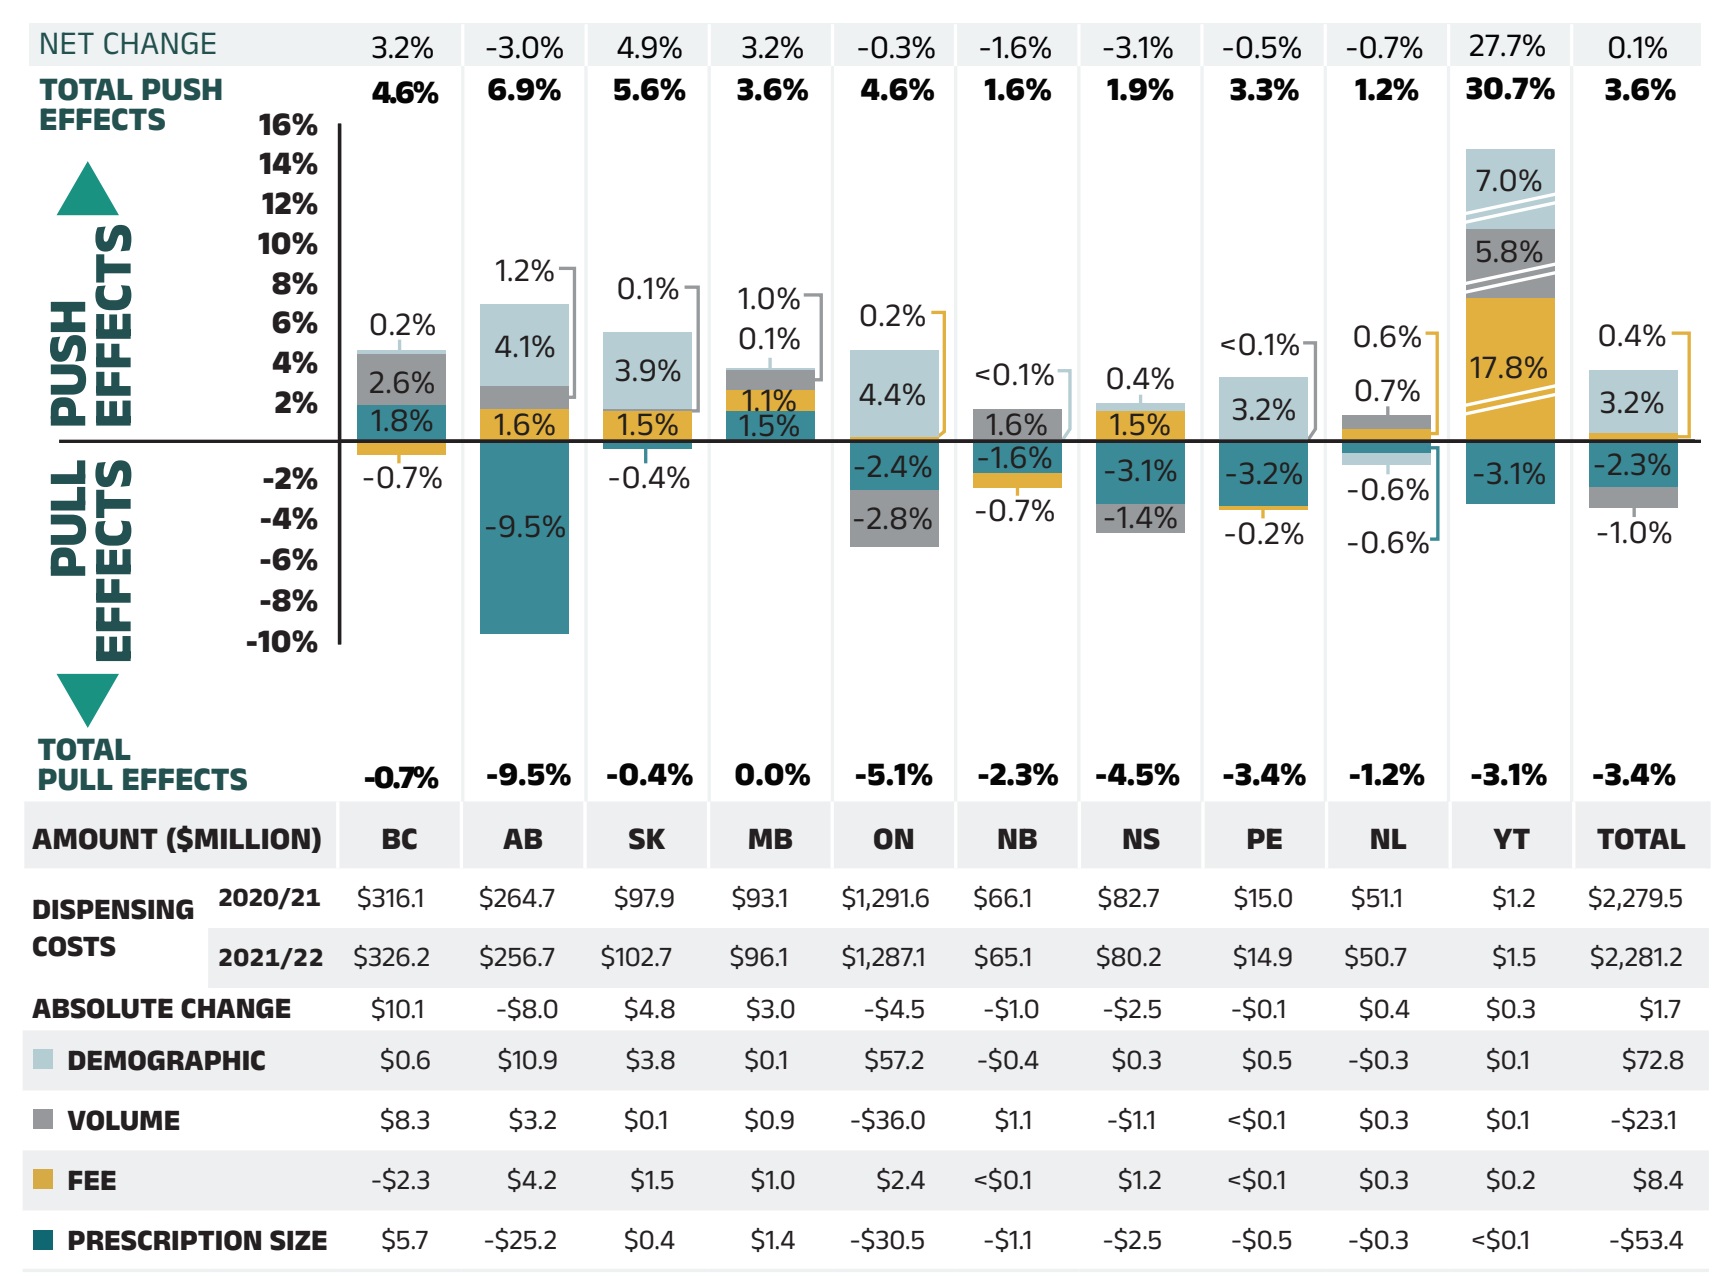
Figure 3.2 – Text version
| British Columbia | Alberta | Saskatchewan | Manitoba | Ontario | New Brunswick | Nova Scotia | Prince Edward Island | Newfoundland and Labrador | Yukon | Total | |
|---|---|---|---|---|---|---|---|---|---|---|---|
Demographic |
0.2% |
-2.6% |
-2.2% |
-0.7% |
-1.4% |
10.1% |
23.0% |
3.3% |
-3.0% |
15.7% |
-0.8% |
Volume |
2.6% |
2.7% |
1.2% |
1.6% |
2.6% |
-7.1% |
6.9% |
2.2% |
4.3% |
-3.5% |
2.6% |
Fee |
1.8% |
-1.0% |
0.4% |
4.1% |
-1.3% |
0.2% |
1.7% |
1.1% |
-1.9% |
-11.5% |
-0.8% |
Prescription size |
-0.7% |
10.3% |
0.6% |
-0.1% |
3.2% |
-2.2% |
6.7% |
2.6% |
1.1% |
17.3% |
3.4% |
Total push effect |
4.6% |
6.9% |
5.6% |
3.6% |
4.6% |
1.6% |
1.9% |
3.3% |
1.2% |
30.7% |
3.6% |
Total pull effect |
-0.7% |
-9.5% |
-0.4% |
0.0% |
-5.1% |
-2.3% |
-4.5% |
-3.4% |
-1.2% |
-3.1% |
-3.4% |
Net change |
3.2% |
-3.0% |
4.9% |
3.2% |
-0.3% |
-1.6% |
-3.1% |
-0.5% |
-0.7% |
27.7% |
0.1% |
| British Columbia | Alberta | Saskatchewan | Manitoba | Ontario | New Brunswick | Nova Scotia | Prince Edward Island | Newfoundland and Labrador | Yukon | Total | |
|---|---|---|---|---|---|---|---|---|---|---|---|
Dispensing costs, 2020/21 |
$316.1 |
$264.7 |
$97.9 |
$93.1 |
$1,291.6 |
$66.1 |
$82.7 |
$15.0 |
$51.1 |
$1.2 |
$2,279.5 |
Dispensing costs, 2021/22 |
$326.2 |
$256.7 |
$102.7 |
$96.1 |
$1,287.1 |
$65.1 |
$80.2 |
$14.9 |
$50.7 |
$1.5 |
$2,281.2 |
Absolute change |
$10.1 |
-$8.0 |
$4.8 |
$3.0 |
-$4.5 |
-$1.0 |
-$2.5 |
-$0.1 |
-$0.4 |
$0.3 |
$1.7 |
Demographic |
$0.6 |
$10.9 |
$3.8 |
$0.1 |
$57.2 |
-$0.4 |
$0.3 |
$0.5 |
-$0.3 |
$0.1 |
$72.8 |
Volume |
$8.3 |
$3.2 |
$0.1 |
$0.9 |
-$36.0 |
$1.1 |
-$1.1 |
<$0.1 |
$0.3 |
$0.1 |
-$23.1 |
Fee |
-$2.3 |
$4.2 |
$1.5 |
$1.0 |
$2.4 |
<$0.1 |
$1.2 |
<$0.1 |
$0.3 |
$0.2 |
$8.4 |
Prescription size |
$5.7 |
-$25.2 |
-$0.4 |
$1.4 |
-$30.5 |
-$1.1 |
-$2.5 |
-$0.5 |
-$0.3 |
<$0.1 |
-$53.4 |
Note: Values may not add to totals due to rounding and the cross effect.
*In Ontario, the long-term care (LTC) prescriptions were excluded from the dispensing costs as their dispensing patterns and funding model may differ from those of the general beneficiary population. The LTC sub-program contributed less than 0.1% to the total change in dispensing costs for all NPDUIS public plans.
Data source: National Prescription Drug Utilization Information System Database, Canadian Institute for Health Information.
The contribution of fee per prescription, is directly related to the reimbursement policies of each public drug plan.
In 2021/22, most NPDUIS drug plans had increases in the average dispensing fee per prescription ranging from 0.2% to 17.8%. British Columbia, New Brunswick and Prince Edward Island had modest decreases. Over the past five years, Yukon and Nova Scotia have had a relatively high growth in fees, with compound annual growth rates of 3.4% and 1.4%, respectively.
Table 3.1 reports the average dispensing fee per prescription from 2016/17 to 2021/22, along with the rate of growth between 2020/21 and 2021/22 and the compound annual growth rate for the entire period. The results are an average across all prescriptions and include a range of dispensing fees. An overview of the dispensing fee policies of the NPDUIS public drug plans is available on the PMPRB website.
Table 3.1 Average dispensing fee per prescription, NPDUIS public drug plans, 2016/17 to 2021/22
| Jurisdiction | 2016/17 | 2017/18 | 2018/19 | 2019/20 | 2020/21 | 2021/22 | Growth rate, 2020/21 to 2021/22 | CAGR*, 2016/17 to 2021/22 |
|---|---|---|---|---|---|---|---|---|
British Columbia |
$7.26 |
$7.18 |
$7.13 |
$7.10 |
$7.03 |
$6.97 |
-0.7% |
-0.8% |
Alberta |
$14.33 |
$14.45 |
$14.18 |
$14.11 |
$13.96 |
$14.18 |
1.6% |
-0.2% |
Saskatchewan |
$10.97 |
$10.92 |
$10.92 |
$11.04 |
$11.09 |
$11.25 |
1.5% |
0.5% |
Manitoba |
$9.48 |
$8.82 |
$8.19 |
$8.24 |
$8.58 |
$8.68 |
1.1% |
-1.7% |
Ontario† |
$7.59 |
$7.55 |
$7.58 |
$7.58 |
$7.52 |
$7.53 |
0.2% |
-0.1% |
New Brunswick |
$10.54 |
$10.48 |
$10.43 |
$10.48 |
$10.50 |
$10.50 |
-0.0% |
-0.1% |
Nova Scotia |
$11.25 |
$11.32 |
$11.48 |
$11.67 |
$11.87 |
$12.05 |
1.5% |
1.4% |
Prince Edward Island |
$11.03 |
$11.23 |
$11.38 |
$11.42 |
$11.54 |
$11.52 |
-0.2% |
0.9% |
Newfoundland and Labrador |
$12.39 |
$12.38 |
$12.41 |
$12.37 |
$12.14 |
$12.20 |
0.6% |
-0.3% |
Yukon |
$5.80 |
$5.81 |
$5.76 |
$7.16 |
$5.83 |
$6.87 |
17.8% |
3.4% |
NIHB |
$8.92 |
$8.97 |
$9.02 |
$9.17 |
- |
- |
- |
- |
Note: This analysis only includes data for beneficiaries that met their deductible and received public reimbursement.
* Compound annual growth rate.
† Ontario long-term care (LTC) sub-plan prescriptions were excluded from this analysis as their dispensing patterns and funding model may differ from those of the general beneficiary population.
The addition of Ontario’s OHIP+ program, implemented in the last quarter of 2017/18, is no longer separated from the analysis as of 2020/21 since the plan redesign has stabilized.
Data source: National Prescription Drug Utilization Information System Database, Canadian Institute for Health Information.
Various plans have specific policies in place related to dispensing frequency policy and compensation. The average dispensing fee per prescription is also related to prescription size: plans with lower average dispensing fees generally reimburse prescriptions with shorter days’ supply and vice versa. Manitoba, Ontario, and British Columbia, which had some of the lowest dispensing fees in 2021/22, generally reimbursed prescriptions with relatively small average sizes. Increases in the average days’ supply per prescription can exert downward pressure on dispensing costs, as fewer prescriptions are required to dispense the same volume of drugs, while decreases in average days' supply have the reverse effect.
The results for the average days’ supply per prescription suggest that prescription size was either stable or increased in most public drug plans from 2020/21 to 2021/22, due in part to the lifting of temporary COVID-19 pandemic policies on days’ supply limits for prescription drugs in many provinces. Alberta and Prince Edward Island had the largest proportional increases in average prescription size, at 11.6% and 4.7%, respectively.
Figure 3.3 shows the trend in average days’ supply per prescription from 2016/17 to 2021/22. The results represent the average across all prescriptions for oral solid formulations and encompass brand-name and generic medicines for both acute and maintenance therapies.
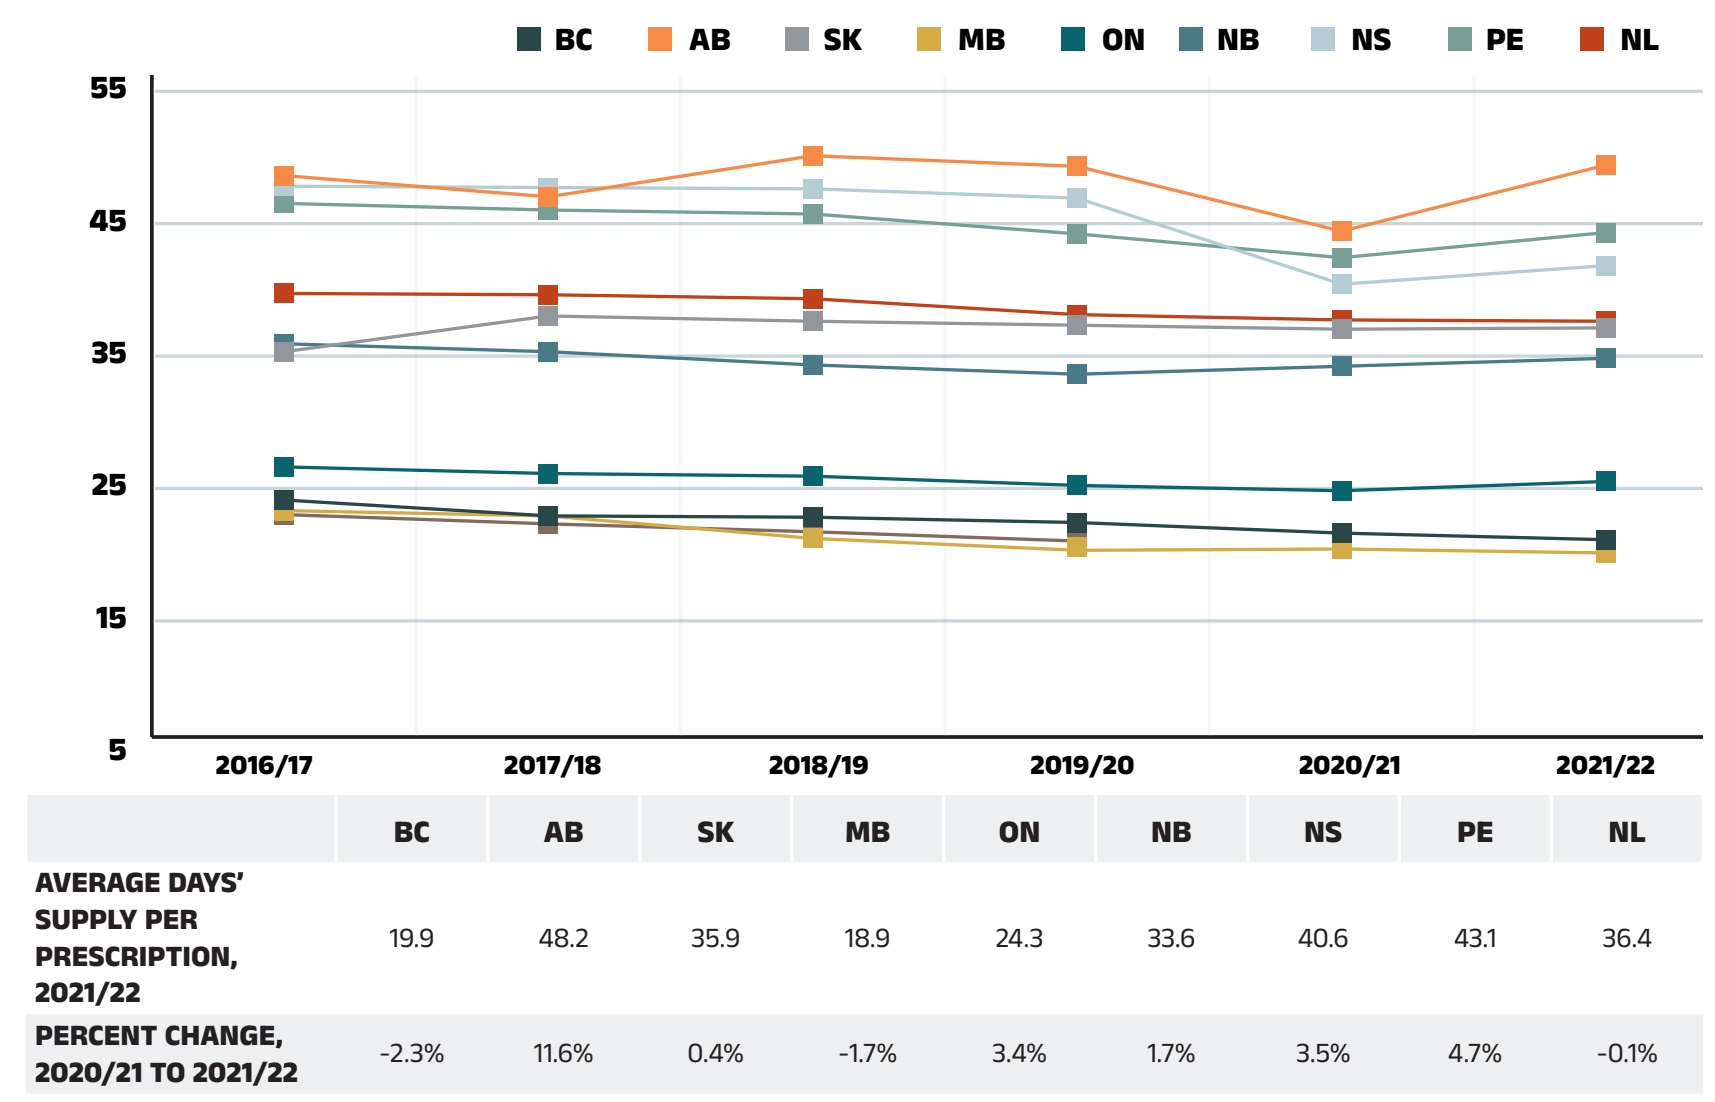
Figure 3.3 – Text version
| 2016/17 | 2017/18 | 2018/19 | 2019/20 | 2020/21 | 2021/22 | Percent change, 2020/21 to 2021/22 | |
|---|---|---|---|---|---|---|---|
British Columbia |
22.9 |
21.7 |
21.6 |
21.2 |
20.4 |
19.9 |
-2.3% |
Alberta |
47.4 |
45.8 |
48.9 |
48.1 |
43.2 |
48.2 |
11.6% |
Saskatchewan |
34.1 |
36.8 |
36.4 |
36.1 |
35.8 |
35.9 |
0.4% |
Manitoba |
22.1 |
21.7 |
20.0 |
19.1 |
19.2 |
18.9 |
-1.7% |
Ontario |
25.4 |
24.9 |
24.7 |
24.0 |
23.6 |
24.3 |
3.4% |
New Brunswick |
34.7 |
34.1 |
33.1 |
32.4 |
33.0 |
33.6 |
1.7% |
Nova Scotia |
46.6 |
46.5 |
46.4 |
45.7 |
39.2 |
40.6 |
3.5% |
Prince Edward Island |
45.3 |
44.8 |
44.5 |
43.0 |
41.2 |
43.1 |
4.7% |
Newfoundland and Labrador |
38.5 |
38.4 |
38.1 |
36.9 |
36.5 |
36.4 |
-0.1% |
Note: This analysis only includes data for beneficiaries that met their deductible and received public reimbursement.
The analysis was limited to data for oral solid formulations. Yukon is not reported due to data limitations.
Data source: National Prescription Drug Utilization Information System Database, Canadian Institute for Health Information.
Although the average days’ supply and dispensing fee per prescription are useful measures for comparison, the roster of medicines covered by each plan also factors into the average dispensing cost. Comparing the dispensing costs for the same suite of medicines can provide greater insight into the differences between plans.
Figure 3.4 compares the dispensing costs across jurisdictions for the generic medicines reduced to 10% (previously 18%) of their brand-name reference price through the 2018 pCPA–CGPA agreement. Dispensing costs for one million tablets of each medicine are given for two fiscal years: 2016/17 and 2021/22. These medicines collectively accounted for 19.5% and 21.2% of the total NPDUIS public drug plan dispensing costs in 2016/17 and 2021/22, respectively.
Dispensing costs for the select medicines were stable or increased between 2016/17 and 2021/22 in most provinces, although the size of the changes varied considerably. The highest rates of increase were observed in British Columbia and Prince Edward Island, while Alberta and New Brunswick experienced moderate decreases. In four NPDUIS public plans—British Columbia, Saskatchewan, Manitoba, and Newfoundland and Labrador—dispensing costs for one million tablets exceeded $200,000 in 2021/22.
While the same drugs were studied across all plans, the disease profile of the beneficiary populations and the type of therapy for which the drugs were prescribed (acute or maintenance) influenced the average days’ supply and, hence, the overall dispensing costs for each jurisdiction.
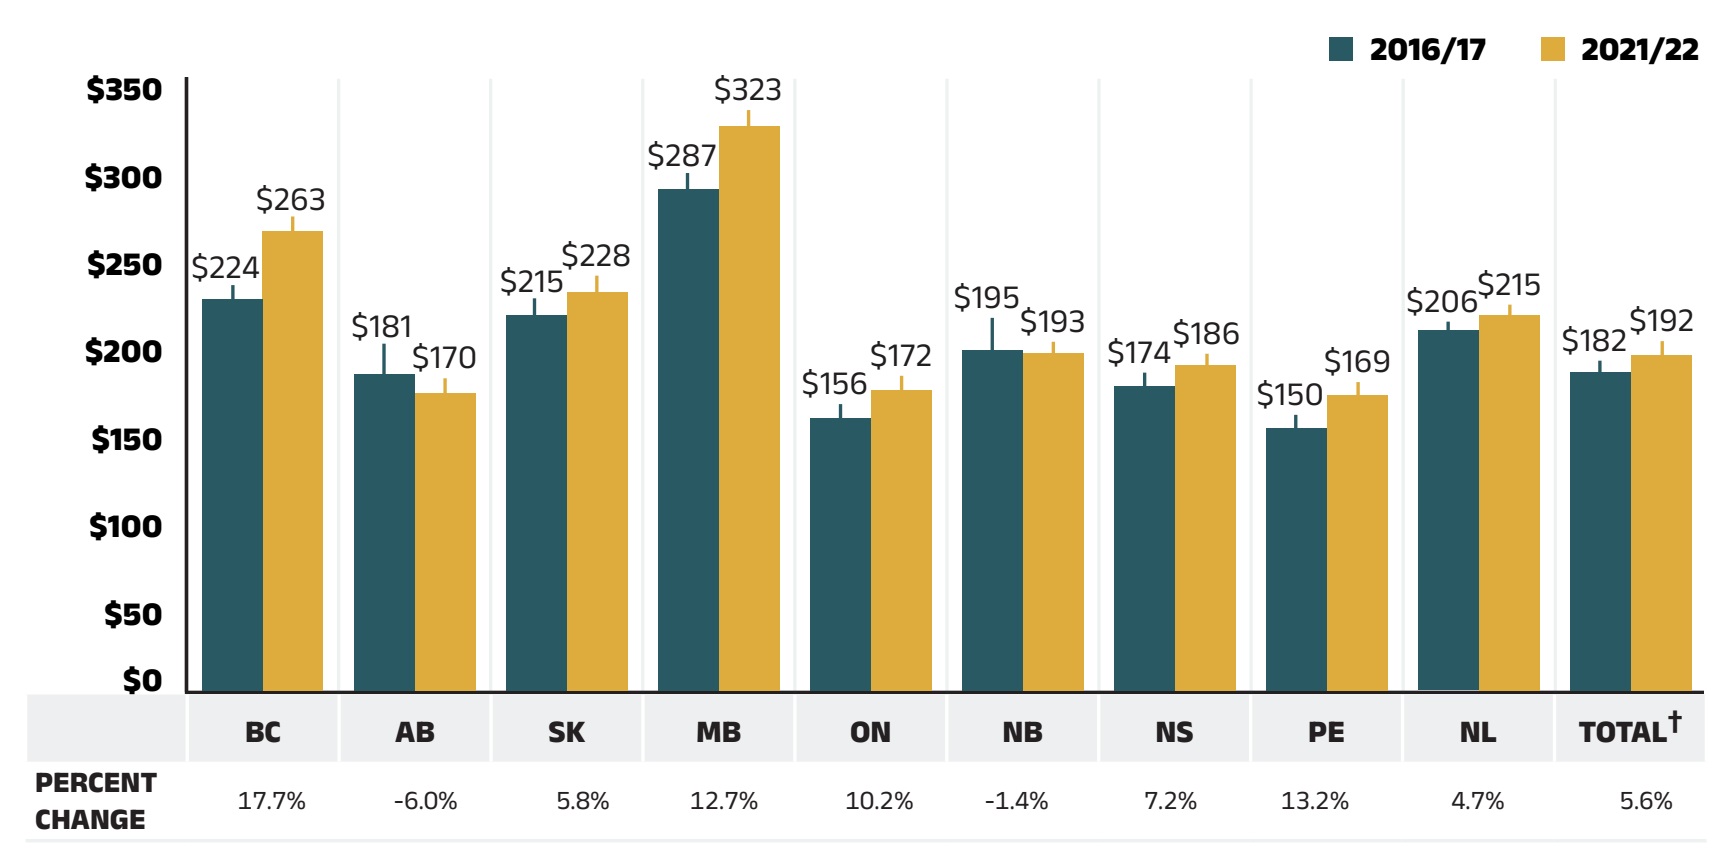
Figure 3.4 – Text version
| British Columbia | Alberta | Saskatchewan | Manitoba | Ontario | New Brunswick | Nova Scotia | Prince Edward Island | Newfoundland and Labrador | Total | |
|---|---|---|---|---|---|---|---|---|---|---|
2016/17 |
$224 |
$181 |
$215 |
$287 |
$156 |
$195 |
$174 |
$150 |
$206 |
$182 |
2021/22 |
$263 |
$170 |
$228 |
$323 |
$172 |
$193 |
$186 |
$169 |
$215 |
$192 |
Percent change |
17.7% |
-6.0% |
5.8% |
12.7% |
10.2% |
-1.4% |
7.2% |
13.2% |
4.7% |
5.6% |
Note: Long-term care homes were excluded from this analysis, as they may not have a typical dispensing frequency due to the more specialized needs of their patients. The following sub-plans were not included in the analysis: BC: Permanent Residents of Licensed Residential Care Facilities; MB: Personal Home Care/Nursing Homes; NB: Individuals in Licensed Residential Facilities, Nursing Home Residents; ON: Long Term Care, Home Care and Homes for Special Care. Yukon is not reported due to data limitations.
* Subject to the pCPA–CGPA agreement that reduced the prices of these medicines to 10% of their brand-name reference price: atorvastatin, ramipril, venlafaxine, amlodipine, omeprazole, rabeprazole, rosuvastatin, pantoprazole, citalopram, simvastatin, clopidogrel, gabapentin, metformin, olanzapine, olanzapine ODT, donepezil, ezetimibe, quetiapine, ranitidine, and zopiclone.
† Total results for the drug plans captured in this figure.
Data source: National Prescription Drug Utilization Information System Database, Canadian Institute for Health Information.
Appendix A: Drug Reviews and Approvals
In Canada, Health Canada, the Patented Medicine Prices Review Board (PMPRB), and the Canadian Agency for Drugs and Technologies in Health (CADTH) are responsible for drug approvals, price reviews, and health technology assessments, respectively. This appendix provides an overview of recent trends in drug reviews and approvals.Reference X
Health Canada
Health Canada grants the authority to market a drug in Canada by issuing a Notice of Compliance (NOC) once it has met the regulatory requirements for safety, efficacy, and quality. In 2021, Health Canada issued NOCs for 43 new active substances: 19 biologics and 24 small molecule pharmaceuticals.
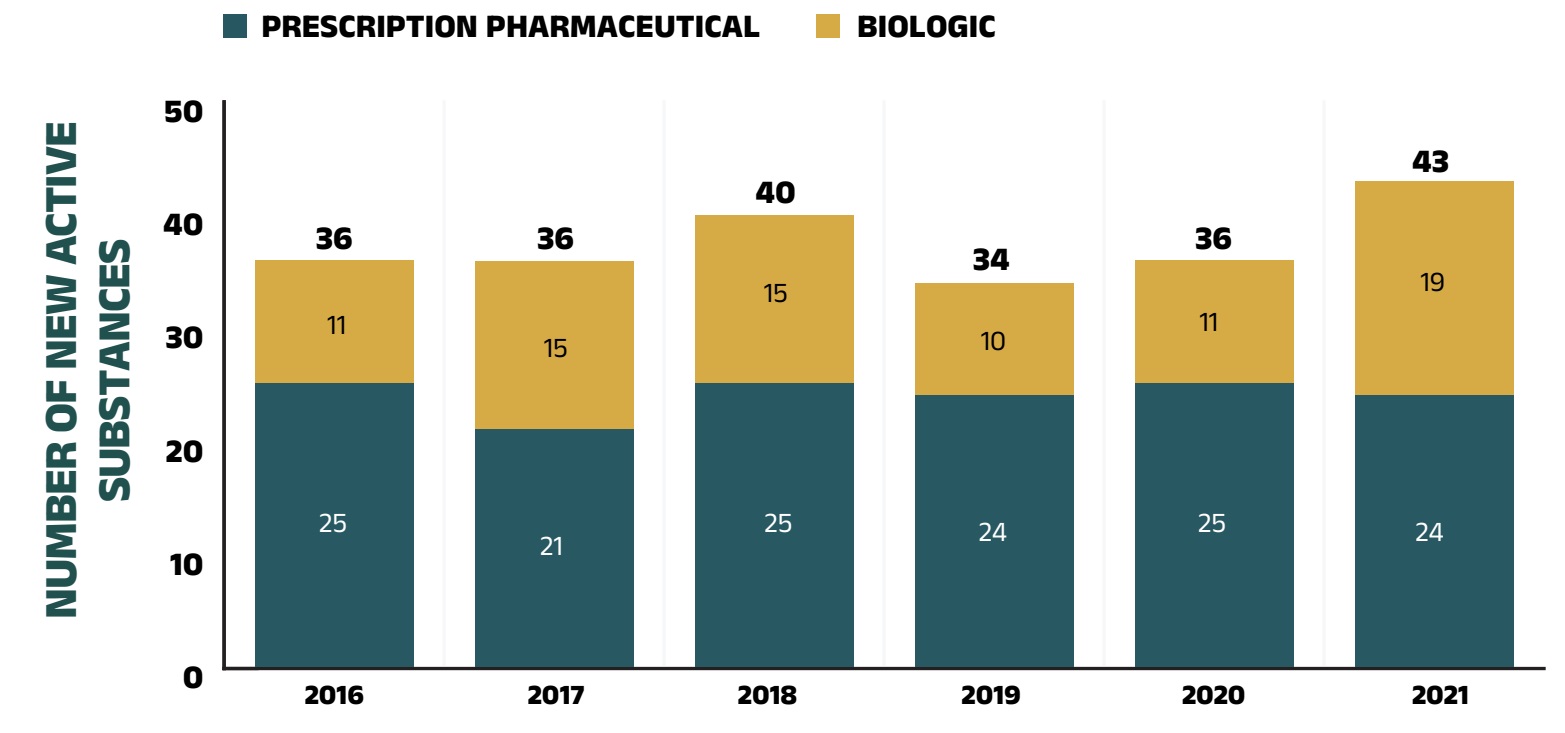
Figure A1 – Text version
| Prescription pharmaceutical | Biologic | Total | |
|---|---|---|---|
2016 |
25 |
11 |
36 |
2017 |
21 |
15 |
36 |
2018 |
25 |
15 |
40 |
2019 |
24 |
10 |
34 |
2020 |
25 |
11 |
36 |
2021 |
24 |
19 |
43 |
Note: “Prescription pharmaceutical” and “biologic” are terms used to define product types when submitting a Notice of Compliance (NOC) to Health Canada.
The methodology for this analysis was revised to identify new medicines at the medicinal ingredient level; as such, historical results may not fully match those reported in previous editions.
Data source: Notice of Compliance Database, Health Canada.
Patented Medicine Prices Review Board
The PMPRB reviews the factory-gate prices of patented medicines sold in Canada and ensures that they are not excessive. As part of the current price review process, the PMPRB’s Human Drug Advisory Panel (HDAP) evaluates each new medicine and assigns a recommended level of therapeutic improvement.
The PMPRB completed scientific reviews for 153 of the 225 medicines approved by Heath Canada between 2016 and 2021. Over this six-year period, only 7% were classified in the Substantial Improvement or Breakthrough categories. More than three quarters of the medicines reviewed demonstrated Slight or No Improvement over existing therapies, while 16% were classified in the Moderate Improvement category (Figure A2).

Figure A2 – Text version
| Breakthrough | Substantial Improvement | Moderate Improvement | Slight or No Improvement | Other | Total | |
|---|---|---|---|---|---|---|
2016 |
1 |
0 |
7 |
25 |
3 |
36 |
2017 |
3 |
1 |
8 |
22 |
2 |
36 |
2018 |
1 |
0 |
4 |
31 |
4 |
40 |
2019 |
1 |
1 |
3 |
14 |
15 |
34 |
2020 |
2 |
1 |
2 |
17 |
14 |
36 |
2021 |
0 |
0 |
0 |
9 |
34 |
43 |
* The year of reporting reflects the year in which the Notice of Compliance was issued (Figure A1) rather than the year that the PMPRB conducted its price review.
† New medicines not reported to the PMPRB as of the 2021 Annual Report.
Data source: Notice of Compliance Database, Health Canada; Patented Medicine Prices Review Board (PMPRB).
Canadian Agency for Drugs and Technologies in Health
CADTH’s Reimbursement Reviews consolidated its previous multiple-pathway product review processes (e.g., the pan-Canadian Oncology Drug Review and the Common Drug Review programs) into one pathway as of October 2020. CADTH provides reimbursement recommendations and advice to Canada’s publicly funded drug plans (except for Quebec) based on an evaluation of the clinical, economic, and patient evidence of drugs marketed in Canada. The jurisdictions take these recommendations under advisement when making formulary listing decisions and in price negotiations.
Figure A3 summarizes the CADTH recommendations for fiscal years 2016/17 to 2021/22.Reference XI The total number of Reimbursement Review recommendations, including both former the Common Drug Review (CDR) and the pan-Canadian Oncology Drug Review (pCODR) programs, has varied from year to year, with a high of 75 in 2021/22. In 2021/22, 75 recommendations were issued: 62 medicines were recommended as “reimburse with clinical criteria and/or conditions”, while 13 received a “do not reimburse” recommendation.
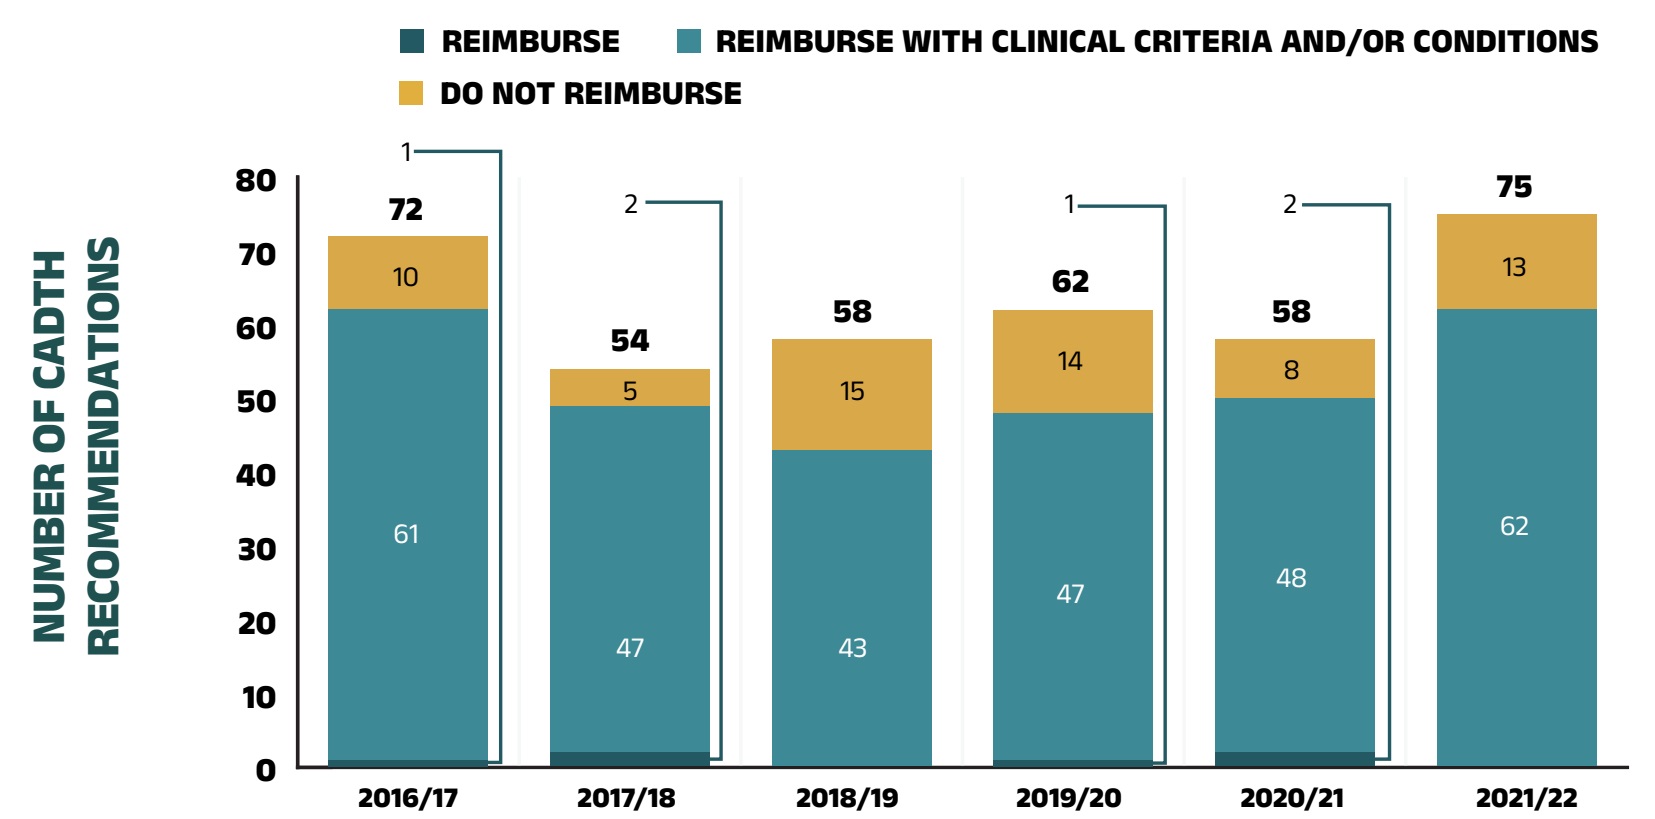
Figure A3 – Text version
| Reimburse | Reimburse with clinical criteria and/or conditions | Do not reimburse | Total | |
|---|---|---|---|---|
2016/17 |
1 |
61 |
10 |
72 |
2017/18 |
2 |
47 |
5 |
54 |
2018/19 |
0 |
43 |
15 |
58 |
2019/20 |
1 |
47 |
14 |
62 |
2020/21 |
2 |
48 |
8 |
58 |
2021/22 |
0 |
62 |
13 |
75 |
Note: Drugs may have multiple recommendations if they are reviewed for more than one indication. CADTH currently uses three possible recommendation categories to guide the reimbursement decisions of participating jurisdictions. For this analysis, “Reimburse with clinical criteria and/or conditions” includes recommendations completed prior to May 2016 for “List with clinical criteria and/or conditions,” “List in a similar manner to other drugs in class,” and “Do not list at submitted price”. “Reimburse” is equivalent to the previous “List” category, and likewise, “Do not reimburse” corresponds to “Do not list”.
Data source: CADTH Reimbursement Review Reports.
Appendix B: Distribution of Patients on Biosimilar Initiative Medicines by Jurisdiction, 2021/22
Recently, numerous Canadian public payers have announced or undertaken initiatives to increase biosimilar uptake (see Appendix C). In 2019, British Columbia became the first Canadian province to initiate a switch to biosimilar medicines for patients covered under the PharmaCare program. By the end of fiscal year 2021/22, British Columbia had launched four phases of its non-medical switching policy. Alberta also implemented a switching policy in January 2021, followed by New Brunswick in April 2021. These initiatives require originator biologic patients on Remicade (infliximab), Enbrel (etanercept), Lantus (insulin glargine, 100 IU/mL), Rituxan (rituximab), Humira (Adalimumab), Humalog (insulin lispro) and Lovenox (enoxaparin) for select indications to switch to biosimilar alternatives.
To monitor the uptake of biosimilars and explore the impact of switching policies in the public drug plans, Figures B1 to B4 present the distribution of public plan patients on the above-mentioned biologics targeted by the switching initiatives in each NPDUIS jurisdiction with available data. Future editions of this report will continue to monitor the impact of these initiatives as they take effect.
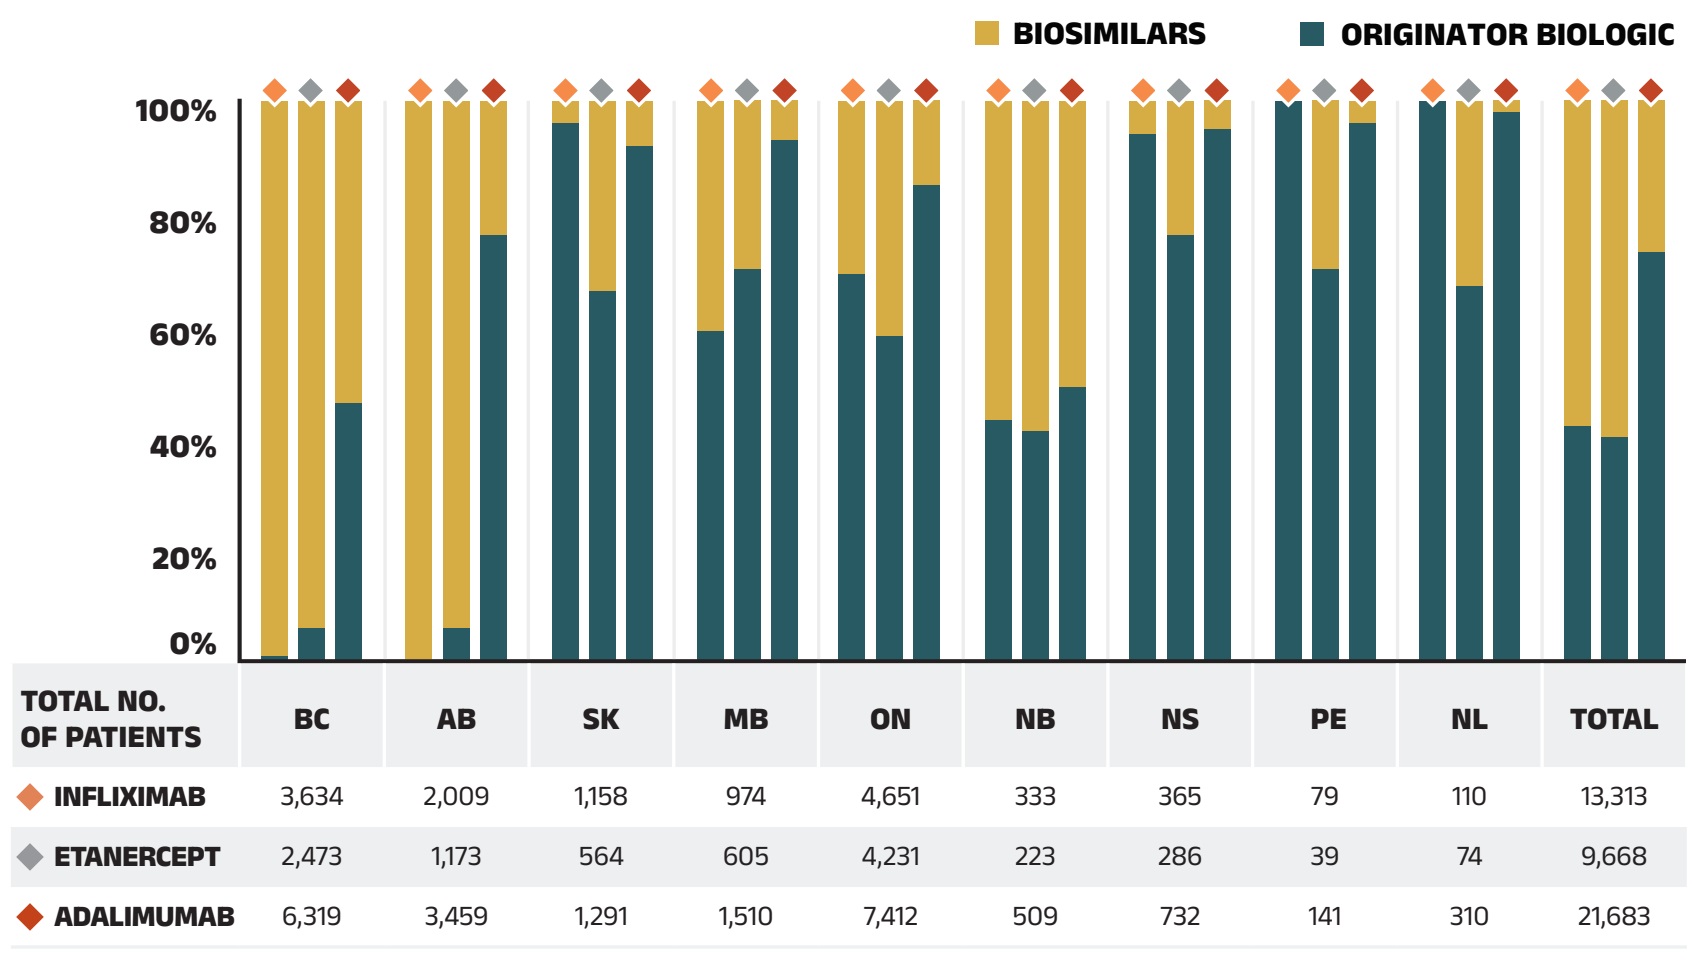
Figure B1 – Text version
| British Columbia | Alberta | Saskatchewan | Manitoba | Ontario | New Brunswick | Nova Scotia | Prince Edward Island | Newfoundland and Labrador | Total | |
|---|---|---|---|---|---|---|---|---|---|---|
Infliximab |
||||||||||
Infliximab (originator biologic) |
1% |
0% |
96% |
59% |
69% |
43% |
94% |
100% |
0% |
42% |
Infliximab (biosimilars) |
99% |
100% |
4% |
41% |
31% |
57% |
6% |
0% |
100% |
58% |
Total number of patients on infliximab |
3,634 |
2,009 |
1,158 |
974 |
4,651 |
333 |
365 |
79 |
110 |
13,313 |
Etanercept |
||||||||||
Etanercept (originator biologic) |
6% |
6% |
66% |
70% |
58% |
41% |
76% |
70% |
67% |
40% |
Etanercept (biosimilars) |
94% |
94% |
34% |
30% |
42% |
59% |
24% |
30% |
33% |
60% |
Total number of patients: on etanercept |
2,473 |
1,173 |
564 |
605 |
4,231 |
223 |
286 |
39 |
74 |
9,668 |
Adalimumab |
||||||||||
Adalimumab (originator biologic) |
46% |
76% |
92% |
93% |
85% |
49% |
95% |
96% |
98% |
73% |
Adalimumab (biosimilars) |
54% |
24% |
8% |
7% |
15% |
51% |
5% |
4% |
2% |
27% |
Total number of patients: on adalimumab |
6,319 |
3,459 |
1,291 |
1,510 |
7,412 |
509 |
732 |
141 |
310 |
21,683 |
Note: Results do not distinguish between indications.
Results for Yukon are not reported due to data limitations.
Totals may not add to 100% due to rounding.
Data source: National Prescription Drug Utilization Information System Database, Canadian Institute for Health Information.
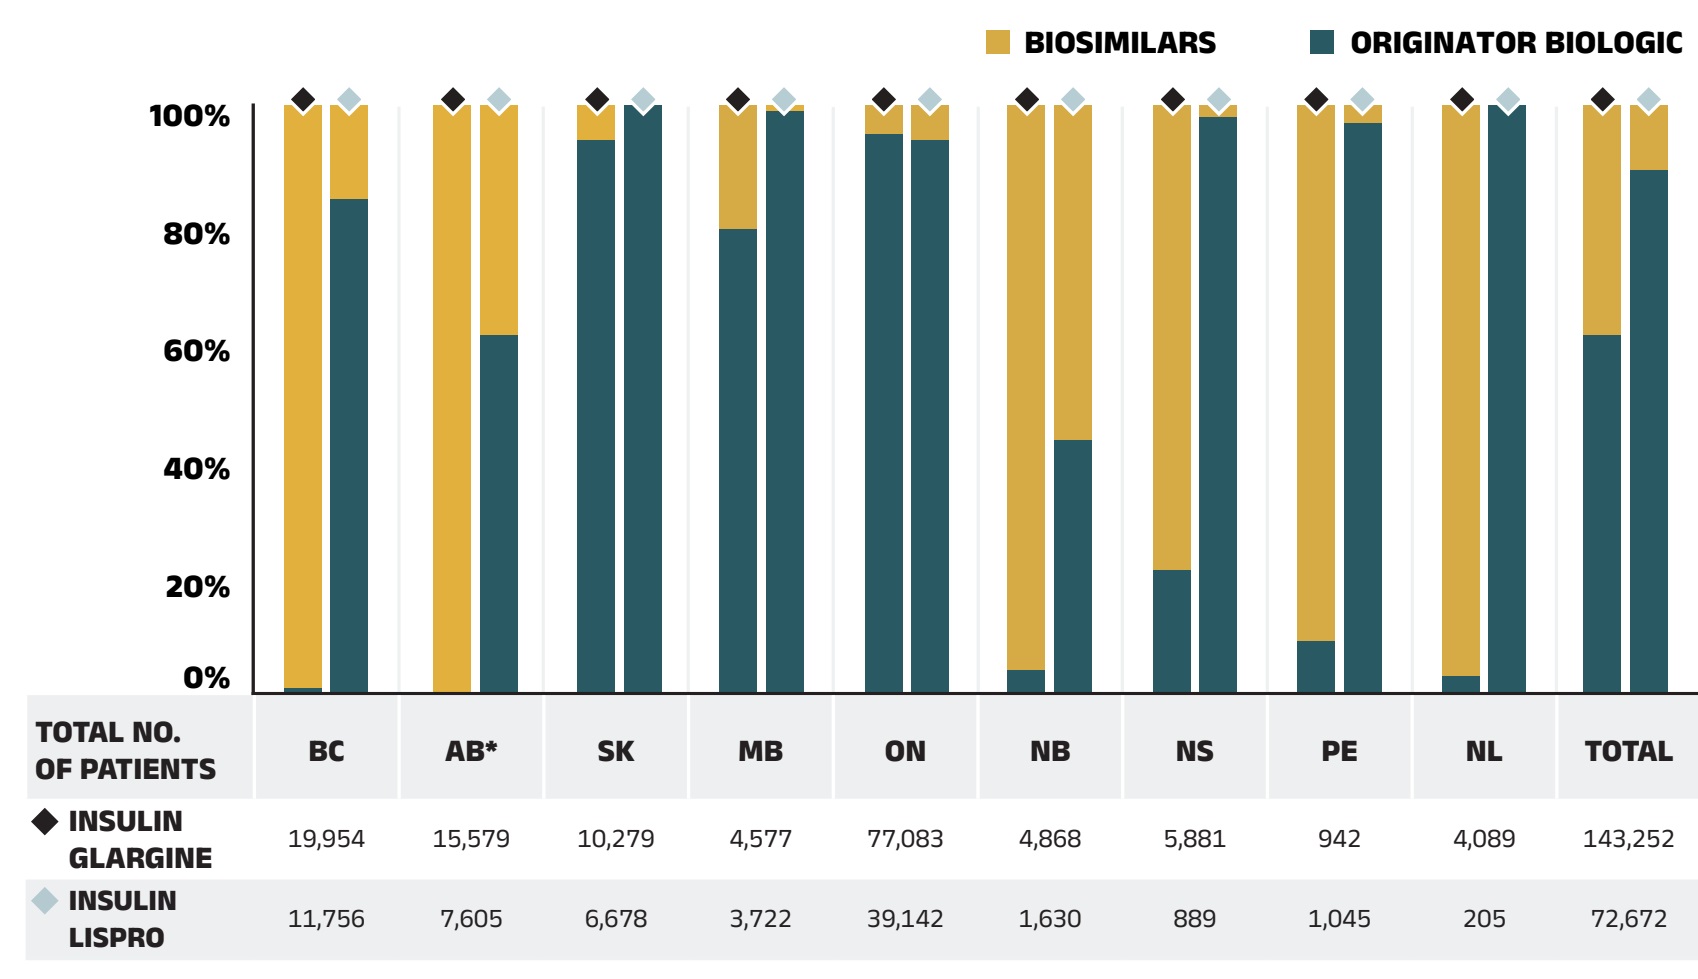
Figure B2 – Text version
| British Columbia | Alberta | Saskatchewan | Manitoba | Ontario | New Brunswick | Nova Scotia | Prince Edward Island | Newfoundland and Labrador | Total | |
|---|---|---|---|---|---|---|---|---|---|---|
Insulin glargine |
||||||||||
Insulin glargine (originator biologic) |
99% |
100% |
39% |
79% |
95% |
4% |
21% |
9% |
3% |
61% |
Insulin glargine (biosimilars) |
1% |
- |
94% |
21% |
5% |
|
79% |
91% |
97% |
39% |
Total number of patients on insulin glargine |
19,954 |
15,579 |
10,279 |
4,577 |
77,083 |
4,868 |
5,881 |
942 |
4,089 |
143,252 |
Insulin lispro |
||||||||||
Insulin lispro (originator biologic) |
84% |
61% |
100% |
99% |
94% |
43% |
98% |
97% |
100% |
89% |
Insulin lispro (biosimilars) |
16% |
39% |
- |
1% |
6% |
57% |
2% |
3% |
- |
11% |
Total number of patients on insulin lispro |
11,756 |
7,605 |
6,678 |
3,722 |
39,142 |
1,630 |
889 |
1,045 |
205 |
72,672 |
Note: Results for Yukon are not reported due to data limitations.
Totals may not add to 100% due to rounding.
* For comparison purposes, this analysis only considers patients using the 100 IU/mL strength of insulin glargine; those using 300 IU/mL or a multi-strength 100 IU/mL + 300 IU/mL were excluded.
Data source: National Prescription Drug Utilization Information System Database, Canadian Institute for Health Information.
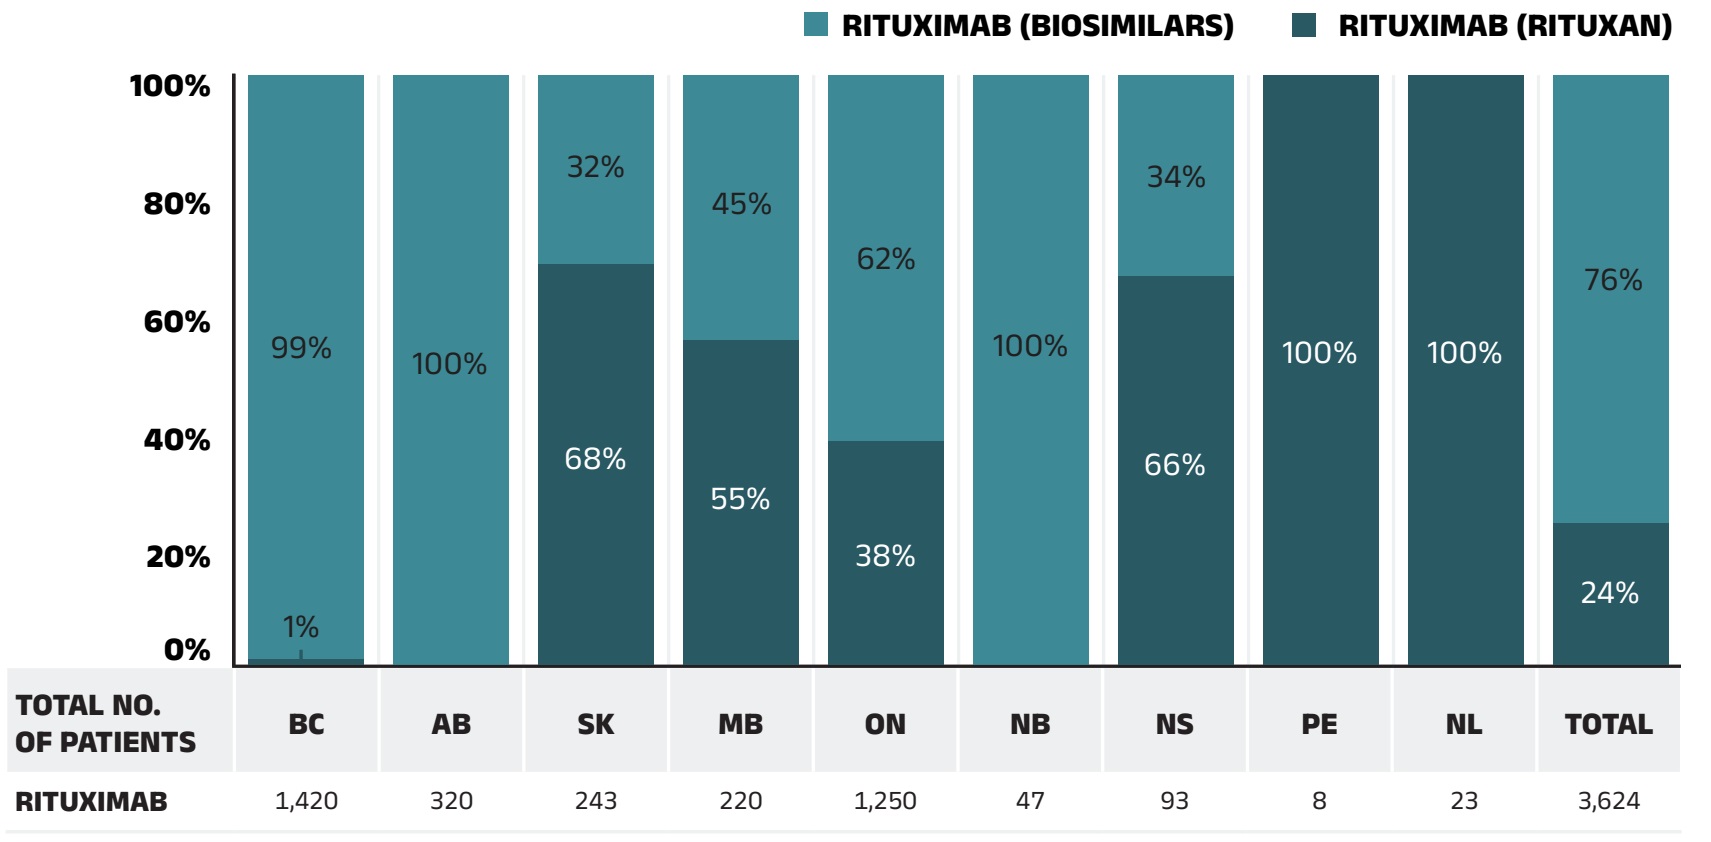
Figure B3 – Text version
| British Columbia | Alberta | Saskatchewan | Manitoba | Ontario | New Brunswick | Nova Scotia | Prince Edward Island | Newfoundland and Labrador | Total | |
|---|---|---|---|---|---|---|---|---|---|---|
Rituximab (Rituxan) |
1% |
0% |
68% |
55% |
38% |
0% |
66% |
100% |
100% |
24% |
Rituximab (biosimilars) |
99% |
100% |
32% |
45% |
62% |
100% |
34% |
0% |
0% |
76% |
Total number of patients on rituximab |
1,420 |
320 |
243 |
220 |
1,250 |
47 |
93 |
8 |
23 |
3,624 |
Note: Results do not distinguish between indications.
Results for Yukon are not reported due to data limitations.
Totals may not add to 100% due to rounding.
Data source: National Prescription Drug Utilization Information System Database, Canadian Institute for Health Information.
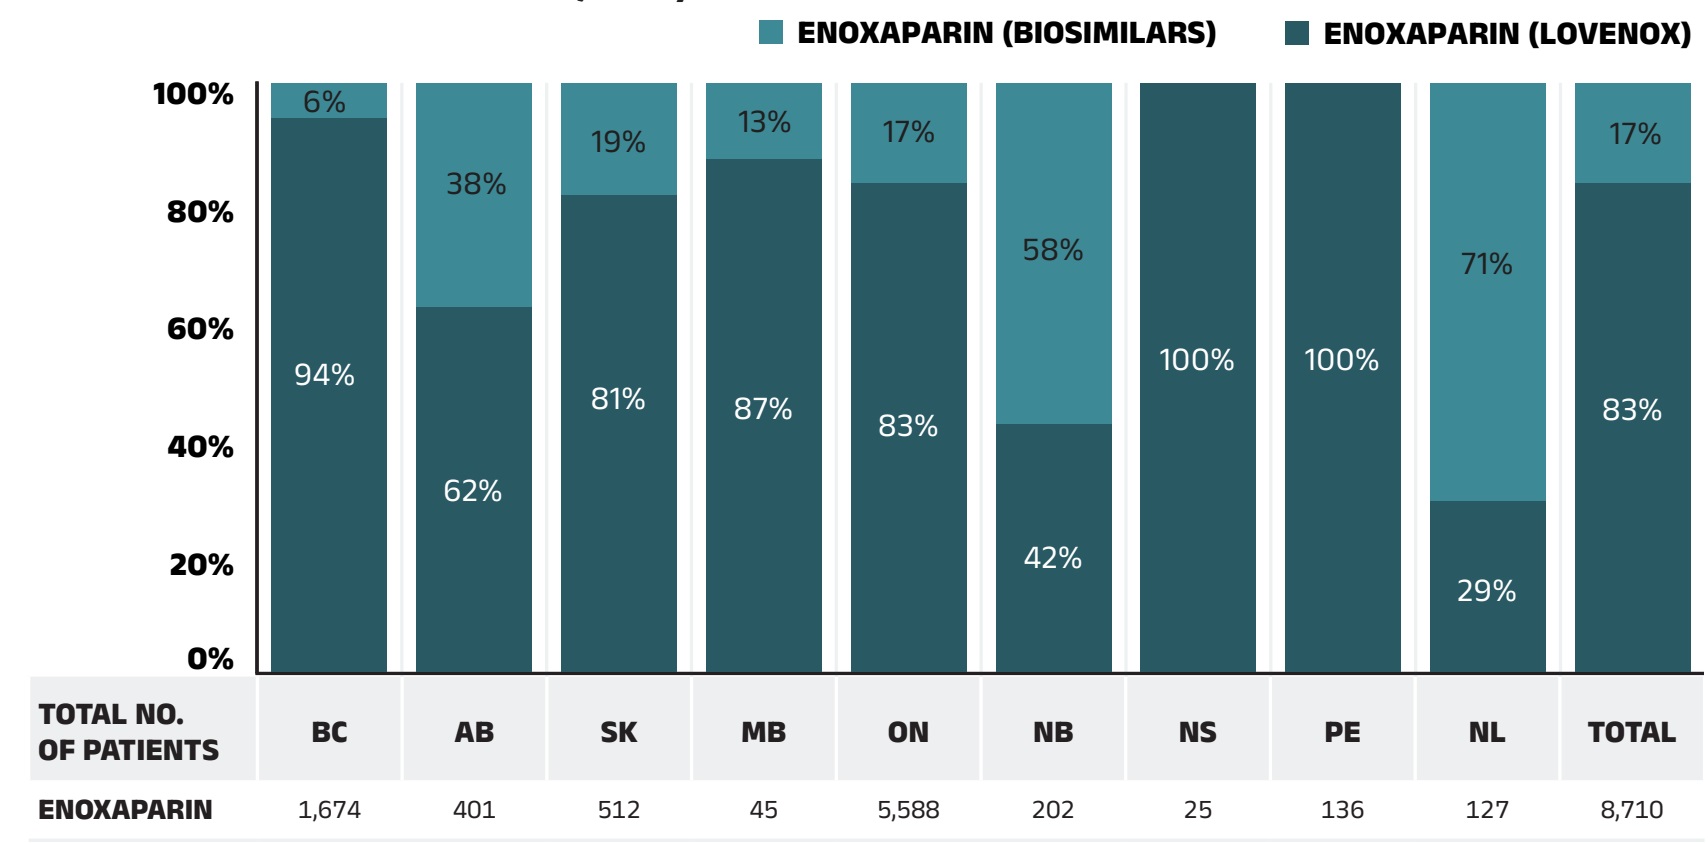
Figure B4 – Text version
| British Columbia | Alberta | Saskatchewan | Manitoba | Ontario | New Brunswick | Nova Scotia | Prince Edward Island | Newfoundland and Labrador | Total | |
|---|---|---|---|---|---|---|---|---|---|---|
Enoxaparin (Lovenox) |
94% |
62% |
81% |
87% |
83% |
42% |
100% |
100% |
29% |
83% |
Enoxaparin (biosimilars) |
6% |
38% |
19% |
13% |
17% |
58% |
0% |
0% |
71% |
17% |
Total number of patients on enoxaparin |
1,674 |
401 |
512 |
45 |
5,588 |
202 |
25 |
136 |
127 |
8,710 |
Note: Results for Yukon are not reported due to data limitations.
Totals may not add to 100% due to rounding.
Data source: National Prescription Drug Utilization Information System Database, Canadian Institute for Health Information.
Appendix C: Biosimilar Switching Initiatives by Canadian Public Payers
Given the high cost of biologics in Canada, biosimilars offer the potential for important savings. Recently, Canadian public payers have announced or undertaken a number of initiatives to increase biosimilar uptake, which are outlined in the table below.
| Initiative | |
|---|---|
British Columbia* |
In May 2019, British Columbia became the first Canadian province to initiate a switch to biosimilar medicines for patients covered under the PharmaCare program. Under the Phase 1 & 2 policy initiatives, patients using Enbrel, Remicade, and Lantus for specific indications are required to switch to the biosimilar. The switching policy expanded to Phase 3 & 4 in 2020 and 2021 to include Rituxan and Humira. |
Alberta* |
Effective January 2021, Alberta announced that all patients taking Enbrel, Remicade, Lantus, Neupogen, Neulasta, Rituxan, and Copaxone for indications ranging from rheumatoid arthritis to diabetes and multiple sclerosis are required to switch to the biosimilar. This policy has since been expanded to include Humira, Lovenox, and Humalog |
Saskatchewan |
Effective October 2022, Saskatchewan started to implement mandatory biosimilar switching. The policy affects medications including Humira, Lovenox, Enbrel, Neupogen, Copaxone, Remicade, Rituxan, NovoRapid, and Lantus. The list will be expanded as more biosimilars for reference biologics become available. |
New Brunswick* |
The New Brunswick Department of Health launched a biosimilars initiative in 2021 which involves switching patients to biosimilars for drugs including Humira, Enbrel, Remicade, Lantus, Humalog, Rituxan, Copaxone, and Lovenox. This policy has since been expanded to include NovoRapid. |
Ontario |
Ontario announced a biosimilar switching policy starting on March 31, 2023. This policy affects the following biologics: Copaxone, Enbrel, Humira, Lantus, NovoRapid, Remicade, and Rituxan. This list will be expanded as more biosimilars for originator biologics become available. |
Quebec |
Effective July 2021, the Quebec government announced a non-medical switching policy to require patients covered by the Quebec public drug plan who are treated with biologics drugs to switch to biosimilar versions where available and on an ongoing basis. |
Nova Scotia |
Effective February 2022, Nova Scotia initiated a non-medical biosimilar switching policy. Medications that require switching to biosimilars include: Humira, Enbrel, Remicade, Lantus, Humalog, NovoRapid, and Rituxan. The policy will apply to other medications on the formulary as new biosimilar medications are approved. |
Northwest Territories |
Effective December 2021, the government of the Northwest Territories launched the Biosimilars Initiative, under which individuals on originator biologics must switch to a biosimilar to maintain public coverage. |
MB, PE, NL, YT, NIHB |
Biosimilar switching strategies are being planned. |
* Biosimilar switching initiatives active or introduced during the timeframe of this report.
Note: Biosimilar switching policies are implemented at the decision of individual jurisdictions and payers. Lists of biologic drugs that are switched to biosimilar versions are expanded on an ongoing basis. Therefore, the information provided in this edition's Appendix C may not represent the latest announcements or current status of such initiatives.
Appendix D: 50 Top-Selling Medicines (Most Utilized Molecule/Strength/Form) by Drug Cost, NPDUIS Public Drug Plans, 2021/22 ($million)
| Rank | Medicinal ingredient (strength) | Brand- or biologic-only medicine | Total | BC | AB | SK | MB | ON | NB | NS | PE | NL | YT |
|---|---|---|---|---|---|---|---|---|---|---|---|---|---|
1 |
Aflibercept (2 mg/0.05 mL) |
Yes |
$408.45 |
- |
$11.16 |
$6.47 |
- |
$379.29 |
$8.67 |
- |
$1.56 |
$0.66 |
$0.64 |
2 |
Infliximab (100 mg) |
$348.97 |
$56.21 |
$34.29 |
$48.63 |
$37.44 |
$149.73 |
$7.33 |
$9.76 |
$2.19 |
$2.94 |
$0.45 |
|
3 |
Adalimumab (50 mg/mL) |
$287.76 |
$10.53 |
$54.79 |
$30.88 |
$36.42 |
$125.12 |
$6.95 |
$13.97 |
$2.42 |
$5.83 |
$0.83 |
|
4 |
Ranibizumab (10 mg/mL) |
Yes |
$222.41 |
- |
$4.81 |
$0.88 |
- |
$203.63 |
$9.08 |
- |
$0.84 |
$3.17 |
- |
5 |
Apixaban (5 mg) |
Yes |
$218.34 |
$19.93 |
$20.57 |
$7.50 |
$3.27 |
$162.40 |
$1.92 |
$1.90 |
$0.28 |
$0.30 |
$0.26 |
6 |
Glucose monitoring systems - continuous and flash systems |
$203.07 |
$7.03 |
$0.01 |
$0.67 |
$0.36 |
$194.90 |
- |
- |
- |
- |
$0.11 |
|
7 |
Ibrutinib (140 mg) |
Yes |
$148.31 |
- |
- |
- |
$5.45 |
$127.36 |
$3.45 |
$7.38 |
$0.36 |
$4.14 |
$0.16 |
8 |
Sofosbuvir/velpatasvir (400/100 mg) |
Yes |
$143.14 |
$43.24 |
$10.22 |
$4.27 |
$1.42 |
$76.89 |
$1.56 |
$2.16 |
- |
$3.25 |
$0.12 |
9 |
Test strips |
$136.67 |
$19.58 |
$12.14 |
$8.17 |
$5.95 |
$77.12 |
- |
$8.28 |
$1.17 |
$4.23 |
$0.03 |
|
10 |
Sitagliptin/metformin (50/1000 mg) |
Yes |
$132.75 |
$0.00 |
$9.45 |
$1.26 |
$0.22 |
$120.40 |
$1.17 |
$0.23 |
$0.01 |
$0.01 |
- |
11 |
Semaglutide (1 mg/act) |
Yes |
$132.26 |
$9.63 |
$18.07 |
$2.27 |
$0.96 |
$97.67 |
$1.22 |
$1.58 |
$0.69 |
$0.08 |
$0.08 |
12 |
Etanercept (50 mg/mL) |
$122.83 |
$24.36 |
$11.19 |
$8.55 |
$10.76 |
$58.96 |
$2.78 |
$4.46 |
$0.57 |
$1.04 |
$0.17 |
|
13 |
Semaglutide (1.34 mg/mL) |
Yes |
$122.70 |
$6.44 |
$10.39 |
$2.57 |
$1.82 |
$96.59 |
$1.54 |
$2.22 |
$0.78 |
$0.18 |
$0.17 |
14 |
Glecaprevir/pibrentasvir (100/40 mg) |
Yes |
$115.93 |
$24.21 |
$5.10 |
$6.88 |
$6.64 |
$68.07 |
$1.28 |
$2.06 |
- |
$1.64 |
$0.05 |
15 |
Denosumab (60 mg/mL) |
Yes |
$111.68 |
$1.63 |
$4.16 |
$1.92 |
$0.39 |
$102.95 |
$0.21 |
$0.30 |
$0.06 |
$0.03 |
$0.02 |
16 |
Vedolizumab (300 mg) |
Yes |
$107.54 |
$44.51 |
$14.48 |
$15.63 |
$9.46 |
$15.90 |
$3.48 |
$2.66 |
$0.34 |
$1.06 |
$0.03 |
17 |
Rivaroxaban (20 mg) |
Yes |
$101.21 |
$10.95 |
$13.62 |
$5.59 |
$2.56 |
$62.83 |
$2.41 |
$2.29 |
$0.34 |
$0.60 |
<$0.01 |
18 |
Insulin glargine (100 U/mL) |
$95.21 |
$14.05 |
$7.84 |
$8.19 |
$3.35 |
$51.70 |
$3.01 |
$4.02 |
$0.50 |
$2.37 |
$0.18 |
|
19 |
Paliperidone (100 mg/mL) |
Yes |
$94.04 |
$20.32 |
$1.45 |
$4.75 |
$2.99 |
$57.86 |
$3.61 |
$2.26 |
$0.22 |
$0.56 |
$0.04 |
20 |
Empagliflozin (10 mg) |
Yes |
$87.21 |
$4.52 |
$7.90 |
$1.82 |
$1.20 |
$69.51 |
$0.77 |
$1.13 |
$0.17 |
$0.16 |
$0.02 |
21 |
Lenalidomide (10 mg) |
$86.94 |
- |
- |
- |
$6.26 |
$72.49 |
$2.86 |
$3.14 |
$0.23 |
$1.86 |
$0.09 |
|
22 |
Budesonide/formoterol (200/6 mcg/act) |
Yes |
$85.52 |
$8.01 |
$11.77 |
$2.83 |
$2.39 |
$55.86 |
$1.30 |
$2.49 |
$0.19 |
$0.61 |
$0.08 |
23 |
Empagliflozin (25 mg) |
Yes |
$83.34 |
$10.09 |
$9.06 |
$3.03 |
$1.57 |
$56.63 |
$1.54 |
$1.12 |
$0.18 |
$0.09 |
$0.04 |
24 |
Sitagliptin (100 mg) |
Yes |
$80.96 |
$0.01 |
$6.91 |
$2.21 |
$1.26 |
$67.78 |
$2.04 |
$0.64 |
$0.04 |
$0.07 |
<$0.01 |
25 |
Osimertinib (80 mg) |
Yes |
$76.80 |
- |
- |
- |
$3.70 |
$68.35 |
$1.55 |
$1.97 |
$0.17 |
$1.05 |
- |
26 |
Adalimumab (40 mg/0.8 mL) |
$76.19 |
$76.19 |
- |
- |
- |
- |
- |
- |
- |
- |
- |
|
27 |
Ustekinumab (90 mg/mL) |
Yes |
$71.99 |
$8.74 |
$11.81 |
$18.13 |
$4.01 |
$22.35 |
$3.17 |
$2.66 |
$0.32 |
$0.79 |
- |
28 |
Golimumab (100 mg/mL) |
Yes |
$70.92 |
$13.17 |
$12.18 |
$9.55 |
$5.01 |
$21.01 |
$4.50 |
$2.99 |
$0.37 |
$2.04 |
$0.10 |
29 |
Lenalidomide (5 mg) |
$65.45 |
- |
- |
- |
$1.33 |
$61.70 |
$0.86 |
$1.30 |
$0.07 |
$0.17 |
$0.01 |
|
30 |
Ocrelizumab (30 mg/mL) |
Yes |
$63.27 |
$2.34 |
$19.65 |
$10.81 |
$8.74 |
$17.31 |
$1.58 |
$1.71 |
- |
$0.74 |
$0.39 |
31 |
Elexacaftor/tezacaftor/ivacaftor (100/50/75 mg) |
Yes |
$63.23 |
$8.42 |
$12.73 |
$4.62 |
$4.78 |
$28.85 |
$1.43 |
- |
- |
$2.32 |
$0.08 |
32 |
Linagliptin (5 mg) |
Yes |
$59.72 |
$6.60 |
$4.04 |
$1.00 |
$0.69 |
$46.60 |
$0.71 |
$0.05 |
$0.02 |
$0.01 |
- |
33 |
Pantoprazole (40 mg) |
$59.58 |
$4.00 |
$9.25 |
$2.45 |
$0.78 |
$38.07 |
$2.80 |
$1.13 |
$0.51 |
$0.54 |
$0.05 |
|
34 |
Insulin degludec (200 U/mL) |
Yes |
$58.14 |
$0.00 |
$8.95 |
$2.98 |
$1.67 |
$35.08 |
$2.43 |
$4.12 |
$1.52 |
$1.39 |
<$0.01 |
35 |
Rizankizumab (90 mg/mL) |
Yes |
$57.52 |
$6.49 |
$9.95 |
$2.65 |
$4.88 |
$26.74 |
$2.19 |
$1.50 |
$0.21 |
$2.91 |
- |
36 |
Bictegravir/emtricitabine/tenofovir alafenamide (50/200/25 mg) |
Yes |
$55.03 |
- |
- |
$5.48 |
$2.65 |
$44.35 |
$2.11 |
- |
- |
$0.43 |
- |
37 |
Tofacitinib (5 mg) |
Yes |
$54.05 |
$13.33 |
$4.24 |
$2.23 |
$2.63 |
$27.59 |
$0.91 |
$2.27 |
$0.17 |
$0.53 |
$0.15 |
38 |
Eculizumab (10 mg/mL) |
Yes |
$53.27 |
- |
$6.95 |
$0.19 |
$2.21 |
$42.89 |
$0.55 |
- |
$0.47 |
- |
- |
39 |
Pegfilgrastim (6 mg/0.6 mL) |
$50.14 |
- |
$2.01 |
- |
- |
$46.18 |
$0.77 |
$0.81 |
$0.03 |
$0.34 |
- |
|
40 |
Botulinum toxin (100 U) |
Yes |
$48.70 |
$6.65 |
$9.15 |
$1.37 |
$1.36 |
$28.44 |
$0.36 |
$1.32 |
- |
- |
$0.05 |
41 |
Abacavir/dolutegravir/lamivudine (600/50/300 mg) |
Yes |
$46.38 |
- |
- |
$1.51 |
$2.99 |
$40.38 |
$1.08 |
- |
- |
$0.26 |
$0.17 |
42 |
Omalizumab (150mg) |
Yes |
$45.47 |
$0.90 |
$8.60 |
$2.81 |
$2.24 |
$28.80 |
$0.46 |
$1.23 |
$0.02 |
$0.39 |
$0.02 |
43 |
Secukinumab (150 mg/mL) |
Yes |
$44.09 |
$19.39 |
$6.82 |
$4.38 |
$5.79 |
$3.69 |
$0.88 |
$1.16 |
$0.08 |
$1.77 |
$0.13 |
44 |
Nintedanib (150 mg) |
Yes |
$43.97 |
$5.64 |
$6.39 |
$1.02 |
$2.61 |
$24.35 |
$1.45 |
$1.49 |
$0.43 |
$0.51 |
$0.06 |
45 |
Enzalutamide (40 mg) |
Yes |
$42.51 |
- |
- |
- |
$3.58 |
$33.38 |
$1.55 |
$2.35 |
$0.46 |
$1.14 |
$0.04 |
46 |
Fluticasone furoate/umeclidinium bromide/vilanterol (100/62.5/25 mcg/act ) |
Yes |
$42.35 |
$4.29 |
$5.29 |
$2.82 |
$1.12 |
$24.97 |
$1.14 |
$1.68 |
$0.44 |
$0.58 |
$0.02 |
47 |
Palbociclib (125 mg) |
Yes |
$40.40 |
- |
- |
- |
$2.59 |
$32.39 |
$2.19 |
$1.76 |
$0.33 |
$1.15 |
- |
48 |
Aripiprazole (400 mg) |
Yes |
$40.35 |
$11.04 |
$0.51 |
$2.06 |
$0.69 |
$23.61 |
$1.28 |
$0.89 |
$0.09 |
$0.17 |
$0.02 |
49 |
Insulin Aspart (100 U/mL) |
$38.78 |
$3.80 |
$3.63 |
$0.80 |
$1.22 |
$23.55 |
$0.91 |
$1.89 |
$0.56 |
$2.39 |
$0.03 |
|
50 |
Fats/carbohydrates/proteins/minerals/vitamins, comb. |
$38.28 |
$0.05 |
- |
- |
$0.02 |
$38.20 |
- |
<$0.01 |
- |
- |
$0.01 |
|
Brand- or biologic-only medicines share of top 50 |
68.3% |
59.0% |
67.9% |
57.0% |
50.4% |
72.3% |
73.1% |
55.0% |
57.5% |
61.6% |
60.1% |
||
Total for top 50 |
$5,083.77 |
$526.27 |
$421.53 |
$251.82 |
$209.46 |
$3,380.48 |
$105.03 |
$108.33 |
$19.41 |
$56.53 |
$4.91 |
||
|
Top 50 share of all medicines |
47% |
43% |
45% |
49% |
48% |
48% |
41% |
39% |
44% |
40% |
29% |
||
Data source: National Prescription Drug Utilization Information System Database, Canadian Institute for Health Information.
Appendix E: Top 50 Patented Medicines by Drug Cost, NPDUIS Public Drug Plans, 2021/22 ($million)
| Rank | Medicinal ingredient (trade name) | Manufacturer | Total | BC | AB | SK | MB | ON | NB | NS | PE | NL | YT |
|---|---|---|---|---|---|---|---|---|---|---|---|---|---|
1 |
Aflibercept (Eylea) |
Bayer Inc. |
$408.45 |
- |
$11.16 |
$6.47 |
- |
$379.29 |
$8.67 |
- |
$1.56 |
$0.66 |
$0.64 |
2 |
Adalimumab (Humira) |
AbbVie Corporation |
$302.36 |
$42.62 |
$50.73 |
$30.30 |
$35.75 |
$116.25 |
$3.89 |
$13.86 |
$2.41 |
$5.77 |
$0.79 |
3 |
Apixaban (Eliquis) |
Bristol-Myers Squibb Canada |
$243.78 |
$28.86 |
$29.49 |
$10.53 |
$5.06 |
$162.86 |
$3.07 |
$2.69 |
$0.45 |
$0.43 |
$0.34 |
4 |
Lenalidomide (Revlimid) |
Celgene Inc. |
$188.11 |
- |
- |
- |
$9.35 |
$163.95 |
$4.51 |
$6.31 |
$0.48 |
$3.33 |
$0.19 |
5 |
Empagliflozin (Jardiance) |
Boehringer Ingelheim |
$170.55 |
$14.61 |
$16.97 |
$4.85 |
$2.77 |
$126.13 |
$2.31 |
$2.24 |
$0.35 |
$0.26 |
$0.06 |
6 |
Ibrutinib (Imbruvica) |
Janssen Inc. |
$148.31 |
- |
- |
- |
$5.45 |
$127.36 |
$3.45 |
$7.38 |
$0.36 |
$4.14 |
$0.16 |
7 |
Rivaroxaban (Xarelto) |
Bayer Inc. |
$146.21 |
$15.08 |
$18.29 |
$7.84 |
$3.96 |
$93.13 |
$3.46 |
$3.07 |
$0.48 |
$0.88 |
$0.01 |
8 |
Sofosbuvir/velpatasvir (Epclusa) |
Gilead Sciences Canada Inc. |
$143.14 |
$43.24 |
$10.22 |
$4.27 |
$1.42 |
$76.89 |
$1.56 |
$2.16 |
- |
$3.25 |
$0.12 |
9 |
Glecaprevir/pibrentasvir (Mavyret) |
AbbVie Corporation |
$115.93 |
$24.21 |
$5.10 |
$6.88 |
$6.64 |
$68.07 |
$1.28 |
$2.06 |
- |
$1.64 |
$0.05 |
10 |
Sitagliptin/metformin hydrochloride (Janumet) |
Merck Canada Inc. |
$112.92 |
<$0.01 |
$7.98 |
$1.09 |
$0.12 |
$102.48 |
$1.00 |
$0.22 |
$0.01 |
$0.01 |
- |
11 |
Denosumab (Prolia) |
Amgen Canada Inc. |
$111.68 |
$1.63 |
$4.16 |
$1.92 |
$0.39 |
$102.95 |
$0.21 |
$0.30 |
$0.06 |
$0.03 |
$0.02 |
12 |
Sitagliptin (Januvia) |
Merck Canada Inc. |
$108.44 |
$0.01 |
$9.57 |
$2.45 |
$1.57 |
$91.21 |
$2.70 |
$0.78 |
$0.06 |
$0.09 |
<$0.01 |
13 |
Vedolizumab (Entyvio) |
Takeda Canada Inc. |
$107.79 |
$44.51 |
$14.48 |
$15.74 |
$9.56 |
$15.91 |
$3.50 |
$2.66 |
$0.34 |
$1.06 |
$0.03 |
14 |
Paliperidone (Invega Sustenna) |
Janssen Inc. |
$94.04 |
$20.32 |
$1.45 |
$4.75 |
$2.99 |
$57.86 |
$3.61 |
$2.26 |
$0.22 |
$0.56 |
$0.04 |
15 |
Palbociclib (Ibrance) |
Pfizer Canada ULC |
$93.98 |
- |
- |
- |
$5.05 |
$78.95 |
$3.47 |
$3.78 |
$0.52 |
$2.20 |
- |
16 |
Golimumab (Simponi) |
Janssen Inc. |
$85.44 |
$17.59 |
$15.47 |
$10.26 |
$5.91 |
$25.01 |
$5.10 |
$3.29 |
$0.46 |
$2.24 |
$0.11 |
17 |
Osimertinib (Tagrisso) |
AstraZeneca Canada Inc. |
$80.81 |
- |
- |
- |
$4.18 |
$71.19 |
$1.62 |
$2.35 |
$0.42 |
$1.05 |
- |
18 |
Sacubitril/valsartan (Entresto) |
Novartis Pharmaceuticals Canada Inc. |
$75.86 |
$9.20 |
$6.65 |
$2.14 |
$0.97 |
$52.84 |
$1.78 |
$1.90 |
$0.10 |
$0.22 |
$0.06 |
19 |
Ustekinumab (Stelara) |
Janssen Inc. |
$72.68 |
$8.74 |
$11.81 |
$18.83 |
$4.01 |
$22.35 |
$3.17 |
$2.66 |
$0.32 |
$0.79 |
- |
20 |
Tofacitinib (Xeljanz) |
Pfizer Canada ULC |
$72.62 |
$14.75 |
$6.29 |
$3.61 |
$3.62 |
$40.09 |
$0.97 |
$2.41 |
$0.18 |
$0.53 |
$0.17 |
21 |
Insulin Glargine (Lantus) |
Sanofi-Aventis Canada Inc. |
$63.61 |
$0.33 |
- |
$7.86 |
$2.93 |
$50.45 |
$0.62 |
$1.23 |
$0.06 |
$0.11 |
$0.03 |
22 |
Ocrelizumab (Ocrevus) |
Hoffmann-La Roche Ltd |
$63.27 |
$2.34 |
$19.65 |
$10.81 |
$8.74 |
$17.31 |
$1.58 |
$1.71 |
- |
$0.74 |
$0.39 |
23 |
Elexacaftor/tezacaftor/ivacaftor (Trikafta) |
Vertex Pharmaceuticals |
$63.23 |
$8.42 |
$12.73 |
$4.62 |
$4.78 |
$28.85 |
$1.43 |
- |
- |
$2.32 |
$0.08 |
24 |
Etanercept (Enbrel) |
Immunex Corporation |
$63.02 |
$1.76 |
$0.31 |
$6.34 |
$8.75 |
$39.83 |
$1.21 |
$3.49 |
$0.46 |
$0.78 |
$0.10 |
25 |
Linagliptin (Trajenta) |
Boehringer Ingelheim |
$59.72 |
$6.60 |
$4.04 |
$1.00 |
$0.69 |
$46.60 |
$0.71 |
$0.05 |
$0.02 |
$0.01 |
- |
26 |
Risankizumab (Skyrizi) |
AbbVie Corporation |
$57.52 |
$6.49 |
$9.95 |
$2.65 |
$4.88 |
$26.74 |
$2.19 |
$1.50 |
$0.21 |
$2.91 |
- |
27 |
Nintedanib (Ofev) |
Boehringer Ingelheim |
$57.01 |
$7.16 |
$8.11 |
$1.46 |
$3.26 |
$31.79 |
$1.68 |
$2.07 |
$0.77 |
$0.64 |
$0.06 |
28 |
Canagliflozin (Invokana) |
Janssen Inc. |
$55.53 |
- |
$5.70 |
$1.53 |
$0.83 |
$47.05 |
$0.36 |
$0.03 |
$0.01 |
$0.02 |
<$0.01 |
29 |
Bictegravir/emtricitabine/tenofovir alafenamide (Biktarvy) |
Gilead Sciences Canada Inc. |
$55.08 |
- |
- |
$5.48 |
$2.65 |
$44.35 |
$2.11 |
- |
- |
$0.43 |
$0.05 |
30 |
Aripiprazole (Abilify Maintena) |
Otsuka Pharmaceutical Co Ltd |
$54.20 |
$15.83 |
$0.82 |
$2.75 |
$0.82 |
$30.72 |
$1.62 |
$1.28 |
$0.11 |
$0.22 |
$0.02 |
31 |
Fluticasone furoate/vilanterol (Breo Ellipta) |
GlaxoSmithKline Inc. |
$53.53 |
$5.39 |
$6.02 |
$1.92 |
$1.87 |
$35.22 |
$1.28 |
$0.98 |
$0.30 |
$0.50 |
$0.05 |
32 |
Eculizumab (Soliris) |
Alexion Pharma GmbH |
$53.27 |
- |
$6.95 |
$0.19 |
$2.21 |
$42.89 |
$0.55 |
- |
$0.47 |
- |
- |
33 |
Sitagliptin/metformin hydrochloride (Janumet XR) |
Merck Canada Inc. |
$50.03 |
- |
$2.97 |
$0.27 |
$0.11 |
$46.31 |
$0.32 |
$0.04 |
<$0.01 |
<$0.01 |
- |
34 |
Ruxolitinib (Jakavi) |
Novartis Pharmaceuticals Canada Inc. |
$47.31 |
- |
- |
- |
$3.24 |
$39.83 |
$1.94 |
$1.76 |
- |
$0.55 |
- |
35 |
Omalizumab (Xolair) |
Novartis Pharmaceuticals Canada Inc. |
$46.55 |
$1.86 |
$8.60 |
$2.81 |
$2.24 |
$28.92 |
$0.46 |
$1.23 |
$0.02 |
$0.39 |
$0.02 |
36 |
Abacavir/dolutegravir/lamivudine (Triumeq) |
ViiV Healthcare ULC |
$46.38 |
- |
- |
$1.51 |
$2.99 |
$40.38 |
$1.08 |
- |
- |
$0.26 |
$0.18 |
37 |
Dapagliflozin (Forxiga) |
AstraZeneca Canada Inc. |
$44.41 |
$0.06 |
$5.71 |
$1.22 |
$1.30 |
$35.53 |
$0.53 |
$0.05 |
$0.01 |
<$0.01 |
<$0.01 |
38 |
Dimethyl fumarate (Tecfidera) |
Biogen Canada Inc. |
$44.31 |
$9.64 |
$8.94 |
$5.80 |
$3.41 |
$12.41 |
$1.49 |
$1.42 |
$0.12 |
$1.01 |
$0.09 |
39 |
Secukinumab (Cosentyx) |
Novartis Pharmaceuticals Canada Inc. |
$44.09 |
$19.39 |
$6.82 |
$4.38 |
$5.79 |
$3.69 |
$0.88 |
$1.16 |
$0.08 |
$1.77 |
$0.13 |
40 |
OnabotulinumtoxinA (Botox) |
Allergan Inc. |
$43.38 |
$6.06 |
$8.86 |
$1.36 |
$1.23 |
$24.26 |
$0.35 |
$1.23 |
- |
- |
$0.05 |
41 |
Lisdexamfetamine dimesylate (Vyvanse) |
Takeda Canada Inc. |
$43.16 |
$3.53 |
$3.04 |
$2.96 |
$2.46 |
$29.78 |
$0.52 |
$0.58 |
$0.09 |
$0.14 |
$0.07 |
42 |
Abatacept (Orencia) |
Bristol-Myers Squibb Canada |
$42.89 |
$13.36 |
$7.14 |
$2.74 |
$1.96 |
$14.55 |
$0.86 |
$1.42 |
$0.30 |
$0.52 |
$0.05 |
43 |
Tocilizumab (Actemra) |
Hoffmann-La Roche Ltd |
$42.57 |
$8.58 |
$6.83 |
$3.08 |
$2.43 |
$19.72 |
$0.54 |
$0.89 |
$0.04 |
$0.35 |
$0.09 |
44 |
Enzalutamide (Xtandi) |
Astellas Pharma Canada Inc. |
$42.51 |
- |
- |
- |
$3.58 |
$33.38 |
$1.55 |
$2.35 |
$0.46 |
$1.14 |
$0.04 |
45 |
Fluticasone furoate/umeclidinium/vilanterol (Trelegy Ellipta) |
GlaxoSmithKline Inc. |
$42.35 |
$4.29 |
$5.29 |
$2.82 |
$1.12 |
$24.97 |
$1.14 |
$1.68 |
$0.44 |
$0.58 |
$0.02 |
46 |
Mirabegron (Myrbetriq) |
Astellas Pharma Canada Inc. |
$41.69 |
$0.02 |
$3.94 |
$0.96 |
$1.13 |
$33.98 |
$0.68 |
$0.75 |
$0.07 |
$0.13 |
$0.01 |
47 |
Ixekizumab (Taltz) |
Eli Lilly Canada Inc. |
$37.73 |
$9.75 |
$3.58 |
$3.35 |
$4.34 |
$13.59 |
$1.18 |
$1.16 |
$0.07 |
$0.67 |
$0.04 |
48 |
Benralizumab (Fasenra) |
AstraZeneca Canada Inc. |
$37.07 |
$4.70 |
$5.69 |
$1.25 |
$0.90 |
$21.87 |
$1.21 |
$0.96 |
$0.14 |
$0.31 |
$0.03 |
49 |
Evolocumab (Repatha) |
Amgen Canada Inc. |
$34.99 |
$4.70 |
$1.15 |
$0.34 |
$0.22 |
$28.27 |
$0.12 |
$0.17 |
- |
$0.01 |
$0.01 |
50 |
Bimatoprost (Lumigan) |
Allergan Inc. |
$32.43 |
$2.41 |
$1.82 |
$1.02 |
$0.65 |
$24.36 |
$0.64 |
$0.85 |
$0.28 |
$0.39 |
$0.01 |
Total |
$4,345.93 |
$428.03 |
$374.48 |
$214.41 |
$190.31 |
$2,892.37 |
$90.17 |
$92.44 |
$13.29 |
$46.03 |
$4.39 |
||
Share of all patented medicines |
76% |
75% |
79% |
81% |
73% |
77% |
75% |
77% |
80% |
74% |
71% |
||
Data source: National Prescription Drug Utilization Information System Database, Canadian Institute for Health Information.
Appendix F: Top 50 Multi-Source Generic Drugs by Drug Cost, NPDUIS Public Drug Plans, 2021/22 ($million)
| Rank | Medicinal ingredient | Total | BC | AB | SK | MB | ON | NB | NS | PE | NL | YT |
|---|---|---|---|---|---|---|---|---|---|---|---|---|
1 |
Atorvastatin |
$63.66 |
$7.46 |
$7.85 |
$2.23 |
$1.41 |
$40.09 |
$1.33 |
$1.88 |
$0.42 |
$0.87 |
$0.13 |
2 |
Rosuvastatin |
$59.68 |
$4.75 |
$7.28 |
$2.32 |
$0.78 |
$39.38 |
$1.45 |
$2.12 |
$0.45 |
$1.12 |
$0.04 |
3 |
Pantoprazole |
$57.79 |
$3.82 |
$9.13 |
$2.51 |
$0.78 |
$36.50 |
$2.79 |
$1.16 |
$0.52 |
$0.54 |
$0.05 |
4 |
Amlodipine |
$46.23 |
$5.32 |
$5.66 |
$1.72 |
$1.00 |
$29.30 |
$0.94 |
$1.41 |
$0.36 |
$0.45 |
$0.07 |
5 |
Pregabalin |
$38.57 |
$0.11 |
$2.27 |
$1.83 |
$0.72 |
$31.52 |
$0.90 |
$0.80 |
$0.18 |
$0.17 |
$0.06 |
6 |
Duloxetine |
$38.54 |
$0.95 |
$4.62 |
$1.90 |
$1.12 |
$29.13 |
$0.39 |
$0.33 |
$0.02 |
$0.02 |
$0.06 |
7 |
Buprenorphine combinations |
$32.75 |
$7.45 |
$3.17 |
$1.35 |
$0.33 |
$18.44 |
$0.47 |
$0.81 |
$0.15 |
$0.53 |
$0.06 |
8 |
Candesartan |
$31.43 |
$2.62 |
$1.62 |
$0.05 |
$1.45 |
$23.06 |
$0.96 |
$1.32 |
$0.01 |
$0.35 |
$0.01 |
9 |
Escitalopram |
$25.41 |
$4.57 |
$2.34 |
$0.64 |
$0.35 |
$16.48 |
$0.29 |
$0.45 |
$0.08 |
$0.19 |
$0.02 |
10 |
Clozapine |
$23.68 |
$8.99 |
$0.81 |
$0.51 |
$0.69 |
$11.63 |
$0.36 |
$0.42 |
$0.07 |
$0.16 |
$0.05 |
11 |
Perindopril and diuretics |
$23.42 |
- |
- |
- |
$0.51 |
$22.10 |
$0.32 |
$0.41 |
$0.01 |
$0.05 |
$0.03 |
12 |
Quetiapine |
$23.13 |
$3.55 |
- |
- |
$1.41 |
$15.12 |
$0.89 |
$1.46 |
$0.11 |
$0.60 |
- |
13 |
Gabapentin |
$23.11 |
$5.30 |
$3.00 |
$1.08 |
$1.17 |
$10.61 |
$0.92 |
$0.73 |
$0.17 |
$0.10 |
$0.03 |
14 |
Sertraline |
$22.28 |
$4.09 |
$1.13 |
$0.85 |
$0.80 |
$11.62 |
$0.75 |
$1.15 |
$0.37 |
$1.50 |
$0.01 |
15 |
Nabilone |
$21.73 |
$4.41 |
$3.70 |
$0.96 |
$0.41 |
$10.59 |
$0.51 |
$0.55 |
$0.16 |
$0.40 |
$0.04 |
16 |
Ramipril |
$21.71 |
$4.27 |
$0.41 |
$0.33 |
$0.90 |
$14.99 |
$0.40 |
$0.31 |
$0.03 |
$0.05 |
$0.02 |
17 |
Perindopril |
$21.31 |
$0.50 |
$1.62 |
$1.41 |
$1.00 |
$13.56 |
$0.92 |
$1.28 |
$0.28 |
$0.72 |
$0.02 |
18 |
Olanzapine |
$19.77 |
$2.68 |
$1.10 |
$0.14 |
$0.10 |
$15.57 |
$0.12 |
$0.05 |
<$0.01 |
$0.01 |
$0.01 |
19 |
Aripiprazole |
$19.65 |
$3.07 |
$0.77 |
$1.13 |
$0.83 |
$11.58 |
$0.78 |
$0.70 |
$0.18 |
$0.60 |
$0.01 |
20 |
Lansoprazole |
$18.95 |
$0.30 |
$1.57 |
$0.27 |
$0.08 |
$16.03 |
$0.21 |
$0.36 |
$0.04 |
$0.09 |
<$0.01 |
21 |
Hydromorphone |
$17.63 |
$4.35 |
$1.21 |
$1.04 |
$0.51 |
$9.06 |
$0.53 |
$0.61 |
$0.13 |
$0.17 |
$0.02 |
22 |
Valproic acid |
$17.13 |
$4.53 |
$1.38 |
$0.58 |
$0.37 |
$8.83 |
$0.63 |
$0.51 |
$0.13 |
$0.15 |
$0.02 |
23 |
Levodopa and decarboxylase inhibitor |
$17.08 |
$1.71 |
$2.12 |
$0.67 |
$0.47 |
$11.03 |
$0.28 |
$0.45 |
$0.09 |
$0.23 |
$0.02 |
24 |
Fluoxetine |
$16.77 |
$3.32 |
$0.44 |
$1.02 |
$0.43 |
$9.03 |
$0.18 |
$1.50 |
$0.06 |
$0.78 |
$0.01 |
25 |
Tamsulosin |
$16.12 |
$2.03 |
$1.95 |
$0.81 |
$0.49 |
$9.39 |
$0.38 |
$0.43 |
$0.17 |
$0.38 |
$0.08 |
26 |
Salmeterol and fluticasone |
$16.07 |
$1.67 |
$0.84 |
$1.25 |
$0.66 |
$9.88 |
$0.67 |
$0.67 |
$0.05 |
$0.36 |
$0.01 |
27 |
Metoprolol |
$15.77 |
$2.19 |
$1.99 |
$0.99 |
$0.50 |
$8.49 |
$0.42 |
$0.65 |
$0.16 |
$0.34 |
$0.04 |
28 |
Metformin |
$15.68 |
$1.98 |
$0.58 |
$0.67 |
$0.82 |
$9.74 |
$0.86 |
$0.69 |
$0.11 |
$0.23 |
$0.01 |
29 |
Diltiazem |
$15.63 |
$2.07 |
$1.42 |
$0.58 |
$0.37 |
$9.72 |
$0.43 |
$0.56 |
$0.09 |
$0.37 |
$0.01 |
30 |
Methotrexate |
$15.28 |
$1.94 |
$0.68 |
- |
$0.45 |
$11.04 |
$0.45 |
$0.28 |
$0.09 |
$0.34 |
<$0.01 |
31 |
Salbutamol |
$15.19 |
$2.09 |
$0.95 |
$1.03 |
$0.32 |
$10.36 |
$0.19 |
$0.19 |
$0.01 |
$0.06 |
$0.01 |
32 |
Rabeprazole |
$15.01 |
$1.41 |
$2.40 |
$1.25 |
$0.77 |
$6.58 |
$0.58 |
$1.05 |
$0.20 |
$0.76 |
$0.02 |
33 |
Risperidone |
$14.65 |
$2.31 |
$0.73 |
$0.62 |
$0.23 |
$8.06 |
$0.81 |
$0.81 |
$0.13 |
$0.92 |
$0.03 |
34 |
Mycophenolic acid |
$14.59 |
$0.61 |
$1.64 |
$0.77 |
$0.19 |
$10.00 |
$0.53 |
$0.53 |
$0.05 |
$0.26 |
$0.01 |
35 |
Clopidogrel |
$13.79 |
$1.52 |
$1.37 |
$0.89 |
$0.61 |
$7.50 |
$0.62 |
$0.67 |
$0.13 |
$0.48 |
$0.02 |
36 |
Mirtazapine |
$13.47 |
$1.60 |
$2.42 |
$0.47 |
$0.43 |
$7.82 |
$0.16 |
$0.39 |
$0.09 |
$0.09 |
$0.01 |
37 |
Fentanyl |
$13.14 |
$2.04 |
$0.93 |
$0.33 |
$0.12 |
$8.97 |
$0.26 |
$0.29 |
$0.03 |
$0.17 |
<$0.01 |
38 |
Timolol combinations |
$13.03 |
$1.76 |
$1.01 |
$0.40 |
$1.08 |
$6.36 |
$0.67 |
$1.04 |
$0.16 |
$0.47 |
$0.06 |
39 |
Epinephrine |
$12.96 |
$1.25 |
$0.65 |
$0.64 |
$0.51 |
$7.90 |
$0.61 |
$0.76 |
$0.15 |
$0.47 |
$0.03 |
40 |
Omeprazole |
$12.87 |
$0.21 |
- |
- |
$0.92 |
$11.06 |
$0.28 |
$0.30 |
$0.03 |
$0.07 |
- |
41 |
Levetiracetam |
$12.54 |
$1.98 |
$1.21 |
$0.73 |
$0.57 |
$6.93 |
$0.30 |
$0.45 |
$0.09 |
$0.26 |
$0.02 |
42 |
Gliclazide |
$12.25 |
$0.63 |
$0.30 |
$0.98 |
$0.46 |
$6.98 |
$0.99 |
$1.03 |
$0.11 |
$0.77 |
<$0.01 |
43 |
Oxycodone and paracetamol |
$12.10 |
$0.58 |
$1.11 |
$1.19 |
$0.78 |
$7.05 |
$0.39 |
$0.49 |
$0.11 |
$0.39 |
$0.02 |
44 |
Ondansetron |
$11.33 |
$1.34 |
$0.42 |
$0.87 |
$0.73 |
$6.37 |
$0.64 |
$0.48 |
$0.11 |
$0.36 |
$0.01 |
45 |
Ezetimibe |
$11.33 |
$0.08 |
$1.54 |
$0.80 |
$0.28 |
$7.34 |
$0.53 |
$0.47 |
$0.05 |
$0.23 |
$0.01 |
46 |
Tenofovir disoproxil |
$11.05 |
$2.30 |
$1.96 |
$0.63 |
$0.37 |
$4.70 |
$0.33 |
$0.41 |
$0.09 |
$0.24 |
$0.03 |
47 |
Risedronic acid |
$11.03 |
$0.15 |
$0.61 |
$0.48 |
$0.62 |
$8.02 |
$0.29 |
$0.45 |
$0.05 |
$0.34 |
$0.01 |
48 |
Irbesartan |
$10.35 |
$0.34 |
$1.87 |
$0.52 |
$0.85 |
$6.00 |
$0.20 |
$0.28 |
$0.05 |
$0.22 |
$0.02 |
49 |
Venlafaxine |
$9.33 |
$2.83 |
$0.57 |
$1.91 |
$2.72 |
- |
$0.64 |
- |
$0.04 |
$0.60 |
$0.02 |
50 |
Methadone |
$9.04 |
$0.13 |
$1.76 |
$0.62 |
$0.34 |
$5.17 |
$0.36 |
$0.39 |
$0.07 |
$0.17 |
$0.03 |
Total |
$1,045.01 |
$125.15 |
$94.12 |
$43.99 |
$33.78 |
$656.68 |
$29.88 |
$34.51 |
$6.43 |
$19.20 |
$1.27 |
|
Share of all multi-source generic medicines |
55% |
55% |
54% |
54% |
51% |
58% |
58% |
56% |
56% |
53% |
52% |
|
Data source: National Prescription Drug Utilization Information System Database, Canadian Institute for Health Information.
Appendix G: Top 50 Single-Source Non-Patented Medicines by Drug Cost, NPDUIS Public Drug Plans, 2021/22 ($thousand)
| Rank | Medicinal ingredient (trade name) | Manufacturer | Total | BC | AB | SK | MB | ON | NB | NS | PE | NL | YT |
|---|---|---|---|---|---|---|---|---|---|---|---|---|---|
1 |
Semaglutide (Ozempic) |
Novo Nordisk Canada Inc. |
$254,956 |
$16,076 |
$28,455 |
$4,843 |
$2,786 |
$194,258 |
$2,757 |
$3,794 |
$1,468 |
$267 |
$251 |
2 |
Ranibizumab (Lucentis) |
Novartis Pharmaceuticals Canada Inc. |
$222,406 |
- |
$4,807 |
$882 |
- |
$203,630 |
$9,078 |
- |
$840 |
$3,170 |
- |
3 |
Budesonide/formoterol fumarate dihydrate (Symbicort) |
AstraZeneca Canada Inc. |
$88,431 |
$8,149 |
$11,948 |
$2,893 |
$2,494 |
$58,198 |
$1,336 |
$2,517 |
$194 |
$621 |
$82 |
4 |
Insulin degludec (Tresiba) |
Novo Nordisk Canada Inc. |
$85,688 |
$3 |
$13,098 |
$4,448 |
$2,272 |
$51,950 |
$3,387 |
$5,775 |
$2,235 |
$2,513 |
$7 |
5 |
Tiotropium (Spiriva) |
Boehringer Ingelheim |
$66,165 |
$5,989 |
$9,288 |
$2,655 |
$1,335 |
$42,988 |
$1,339 |
$1,798 |
$203 |
$423 |
$146 |
6 |
Mepolizumab (Nucala) |
GlaxoSmithKline Inc. |
$41,286 |
$7,363 |
$6,550 |
$1,946 |
$2,209 |
$20,347 |
$1,500 |
$1,023 |
$94 |
$243 |
$12 |
7 |
Teriflunomide (Aubagio) |
Sanofi Genzyme, a division of Sanofi-Aventis Canada Inc. |
$34,958 |
$7,116 |
$3,053 |
$2,886 |
$1,202 |
$15,760 |
$1,906 |
$1,983 |
$368 |
$638 |
$47 |
8 |
Goserelin (Zoladex LA) |
TerSera Therapeutics, LLC |
$28,446 |
- |
- |
$6 |
$15 |
$25,377 |
$782 |
$1,504 |
$221 |
$450 |
$90 |
9 |
Dalteparin sodium (Fragmin) |
Pfizer Canada ULC |
$21,474 |
$4,005 |
$633 |
$325 |
$1,516 |
$13,291 |
$412 |
$1,241 |
$15 |
- |
$36 |
10 |
Mometasone furoate/ formoterol fumarate dihydrate (Zenhale) |
Organon Canada Inc. |
$20,354 |
$1,153 |
- |
$282 |
$250 |
$17,793 |
$649 |
$162 |
$39 |
$25 |
$2 |
11 |
Ciclesonide (Omnaris) |
Covis Pharma GmbH |
$16,228 |
- |
- |
$118 |
- |
$16,107 |
- |
- |
- |
- |
$3 |
12 |
Darbepoetin alfa (Aranesp HSA-Free) |
Amgen Canada Inc. |
$15,918 |
- |
$8,141 |
$849 |
$29 |
$4,616 |
$1,242 |
- |
- |
$1,028 |
$12 |
13 |
Insulin detemir (Levemir Penfill) |
Novo Nordisk Canada Inc. |
$15,335 |
$2,189 |
$2,353 |
$517 |
$114 |
$9,390 |
$151 |
$504 |
$16 |
$88 |
$13 |
14 |
Tafamidis meglumine (Vyndaqel) |
Pfizer Canada ULC |
$13,071 |
- |
$4,685 |
$161 |
$1,300 |
$6,643 |
$209 |
- |
- |
$74 |
- |
15 |
Tinzaparin sodium (Innohep) |
Leo Pharma Inc. |
$12,526 |
$497 |
$5,884 |
$1,297 |
- |
$4,842 |
- |
$5 |
- |
- |
- |
16 |
Insulin lispro/insulin lispro protamine suspension (Humalog Mix) |
Eli Lilly Canada Inc. |
$11,993 |
$819 |
$487 |
$2 |
$414 |
$10,069 |
$97 |
- |
$72 |
$28 |
$5 |
17 |
Fusidic acid (Fucidin) |
Leo Pharma Inc. |
$10,436 |
$613 |
$523 |
$243 |
$198 |
$8,354 |
$121 |
$222 |
$22 |
$140 |
$1 |
18 |
Treprostinil (Remodulin) |
United Therapeutics Corporation |
$9,279 |
$1,956 |
- |
$68 |
$480 |
$5,882 |
$894 |
- |
- |
- |
- |
19 |
Ciclesonide (Alvesco) |
Covis Pharma GmbH |
$8,976 |
$1,132 |
$1,193 |
$284 |
$141 |
$5,108 |
$402 |
$366 |
$210 |
$134 |
$5 |
20 |
Edaravone (Radicava) |
Mitsubishi Tanabe Pharma Corporation |
$8,121 |
$1,301 |
$1,867 |
- |
- |
$4,047 |
$372 |
$535 |
- |
- |
- |
21 |
Tacrolimus (Protopic) |
Leo pharma Inc. |
$8,085 |
$146 |
$151 |
$98 |
$105 |
$7,531 |
$27 |
$20 |
$4 |
$3 |
- |
22 |
Levonorgestrel (Mirena) |
Bayer Inc. |
$8,006 |
$1,784 |
$239 |
$487 |
$310 |
$4,791 |
$122 |
$127 |
$13 |
$134 |
- |
23 |
Dornase alfa (Pulmozyme) |
Hoffmann-La Roche Limited |
$6,473 |
$2,210 |
- |
$797 |
$308 |
$2,562 |
$285 |
- |
- |
$283 |
$28 |
24 |
Insulin aspart/insulin aspart protamine (Novomix) |
Novo Nordisk Canada Inc. |
$5,080 |
$233 |
- |
- |
- |
$4,846 |
- |
- |
- |
- |
$1 |
25 |
Sirolimus (Rapamune) |
Pfizer Canada ULC |
$4,570 |
$158 |
- |
$583 |
$278 |
$3,322 |
$180 |
$4 |
- |
$7 |
$38 |
26 |
Terbinafine hydrochloride (Lamisil) |
Novartis Pharmaceuticals Canada Inc. |
$4,456 |
- |
$323 |
$118 |
$5 |
$3,822 |
$53 |
$77 |
- |
$55 |
$3 |
27 |
Conjugated estrogens (Premarin Vaginal) |
Pfizer Canada ULC |
$4,390 |
$731 |
$753 |
$291 |
$99 |
$2,133 |
$132 |
$113 |
$31 |
$98 |
$9 |
28 |
Glycerol phenylbutyrate (Ravicti) |
Horizon Therapeutics Ireland DAC |
$4,150 |
$491 |
$112 |
$413 |
- |
$2,829 |
$158 |
$146 |
- |
- |
- |
29 |
Pegvisomant (Somavert) |
Pfizer Canada ULC |
$4,131 |
$1,122 |
- |
- |
$176 |
$2,833 |
- |
- |
- |
- |
- |
30 |
Aprepitant (Emend Tri-Pack) |
Merck Canada Inc. |
$3,722 |
$607 |
$477 |
- |
$334 |
$2,151 |
$89 |
$30 |
$22 |
- |
$11 |
31 |
Atovaquone (Mepron) |
GlaxoSmithKline Inc. |
$3,703 |
$64 |
$869 |
$63 |
$93 |
$2,565 |
$25 |
- |
- |
$14 |
$8 |
32 |
Inotersen (Tegsedi) |
Akcea Therapeutics, Inc. |
$3,326 |
- |
$464 |
- |
$689 |
$2,173 |
- |
- |
- |
- |
- |
33 |
Degarelix (Firmagon) |
Ferring Inc. |
$3,319 |
- |
- |
- |
- |
$3,009 |
$104 |
$168 |
$6 |
$26 |
$6 |
34 |
Idursulfase (Elaprase) |
Takeda Canada Inc. |
$3,230 |
- |
- |
- |
- |
$3,230 |
- |
- |
- |
- |
- |
35 |
Deferiprone (Ferriprox) |
Chiesi Canada corp. |
$3,218 |
$841 |
$213 |
- |
- |
$1,995 |
$99 |
$70 |
- |
- |
- |
36 |
Pentosan polysulfate sodium (Elmiron) |
Janssen Inc. |
$3,198 |
$1,343 |
$315 |
$110 |
$148 |
$378 |
$260 |
$514 |
$24 |
$107 |
- |
37 |
Flupentixol decanoate (Fluanxol Depot) |
Lundbeck Canada Inc. |
$3,091 |
$385 |
$81 |
$195 |
$125 |
$2,030 |
$63 |
$157 |
$1 |
$51 |
$3 |
38 |
Pentoxifylline (Pentoxifylline SR) |
Aa pharma Inc. |
$2,974 |
$360 |
$325 |
$92 |
$37 |
$1,999 |
$37 |
$34 |
$14 |
$75 |
$2 |
39 |
Carbidopa/levodopa/entacapone (Stalevo) |
Sandoz Canada Inc. |
$2,967 |
$25 |
$271 |
$127 |
- |
$2,425 |
$21 |
$83 |
$12 |
$2 |
- |
40 |
Pimecrolimus (Elidel) |
Bausch Health, Canada Inc. |
$2,824 |
$13 |
- |
$28 |
$10 |
$2,774 |
- |
- |
- |
- |
- |
41 |
Methylprednisolone (Solu-Medrol) |
Pfizer Canada ULC |
$2,604 |
$26 |
$168 |
$97 |
$9 |
$2,037 |
$44 |
$80 |
$84 |
$56 |
$3 |
42 |
Vitamin A/vitamin B12/vitamin D (Multi) |
Sandoz Canada Inc. |
$2,273 |
- |
- |
- |
- |
$2,273 |
- |
- |
- |
- |
- |
43 |
Dexamethasone/tobramycin (Tobradex) |
Novartis Pharmaceuticals Canada Inc. |
$2,219 |
$272 |
$296 |
$167 |
$18 |
$1,295 |
$41 |
$67 |
$5 |
$55 |
$2 |
44 |
Zuclopenthixol decanoate (Clopixol Depot) |
Lundbeck Canada Inc. |
$2,217 |
$652 |
$50 |
$253 |
$53 |
$985 |
$79 |
$81 |
<$0.1 |
$62 |
$1 |
45 |
Alfacalcidol (One Alpha) |
Cheplapharm Arzneimittel GmbH |
$2,109 |
$578 |
$75 |
$156 |
$7 |
$1,116 |
$54 |
$96 |
$0.5 |
$26 |
$1 |
46 |
Icatibant (Firazyr) |
Takeda Canada Inc. |
$2,082 |
$244 |
$125 |
$331 |
$523 |
$786 |
- |
$29 |
- |
$44 |
- |
47 |
Amantadine hydrochloride (pdp-Amantadine Hydrochloride) |
Pendopharm, a division of Pharmascience Inc. |
$1,942 |
$301 |
$190 |
$302 |
$56 |
$933 |
$52 |
$60 |
$13 |
$32 |
$4 |
48 |
Diphenoxylate hydrochloride/atropine sulfate (Lomotil) |
Pfizer Canada ULC |
$1,877 |
$122 |
$342 |
$94 |
$18 |
$1,129 |
$42 |
$54 |
$7 |
$67 |
$2 |
49 |
Megestrol acetate (Megestrol) |
AA Pharma Inc. |
$1,767 |
$144 |
$19 |
$5 |
$288 |
$1,027 |
$147 |
$97 |
$4 |
$35 |
- |
50 |
Fluorouracil (Efudex) |
Bausch Health, Canada Inc. |
$1,710 |
$142 |
$232 |
$54 |
$20 |
$1,169 |
$29 |
$41 |
$12 |
$8 |
$2 |
Total |
$1,091,760 |
$71,354 |
$109,056 |
$29,565 |
$20,465 |
$790,797 |
$28,776 |
$23,578 |
$6,249 |
$11,083 |
$837 |
||
Share of all single-source non-patented medicines |
80% |
84% |
81% |
76% |
75% |
81% |
63% |
65% |
94% |
86% |
18% |
||
Data source: National Prescription Drug Utilization Information System Database, Canadian Institute for Health Information.
Appendix H: Top 50 Manufacturers by Drug Cost, NPDUIS Public Drug Plans, 2021/22 ($million)
| Rank | Company | Total | BC | AB | SK | MB | ON | NB | NS | PE | NL | YT |
|---|---|---|---|---|---|---|---|---|---|---|---|---|
1 |
Janssen Inc. |
$854.85 |
$71.84 |
$36.58 |
$99.50 |
$54.55 |
$524.10 |
$23.00 |
$28.85 |
$3.75 |
$11.86 |
$0.82 |
2 |
Novartis Pharmaceuticals Canada Inc. |
$592.89 |
$37.32 |
$39.81 |
$13.54 |
$19.14 |
$444.14 |
$18.91 |
$10.56 |
$1.22 |
$7.93 |
$0.32 |
3 |
Bayer Inc. |
$591.73 |
$18.88 |
$30.72 |
$16.70 |
$6.81 |
$495.62 |
$13.04 |
$4.12 |
$2.18 |
$2.98 |
$0.67 |
4 |
AbbVie Corporation |
$543.19 |
$77.10 |
$79.16 |
$40.46 |
$51.64 |
$252.61 |
$8.50 |
$18.65 |
$2.75 |
$11.35 |
$0.98 |
5 |
Apotex Inc. |
$439.65 |
$44.32 |
$28.44 |
$13.38 |
$12.50 |
$310.52 |
$11.58 |
$10.11 |
$1.89 |
$6.39 |
$0.53 |
6 |
Boehringer Ingelheim |
$438.15 |
$46.49 |
$46.64 |
$13.11 |
$9.97 |
$301.30 |
$7.71 |
$8.61 |
$1.68 |
$2.31 |
$0.32 |
7 |
Novo Nordisk Canada Inc. |
$434.96 |
$25.57 |
$54.39 |
$11.73 |
$7.42 |
$301.68 |
$8.16 |
$14.50 |
$4.58 |
$6.54 |
$0.40 |
8 |
AstraZeneca Canada Inc. |
$336.40 |
$19.29 |
$32.13 |
$7.81 |
$12.44 |
$248.43 |
$5.39 |
$7.29 |
$0.87 |
$2.57 |
$0.18 |
9 |
Merck Canada Inc. |
$291.57 |
$1.77 |
$21.31 |
$4.31 |
$2.74 |
$255.27 |
$4.48 |
$1.44 |
$0.10 |
$0.13 |
$0.04 |
10 |
Bristol-Myers Squibb Canada |
$289.20 |
$42.32 |
$36.73 |
$13.30 |
$7.05 |
$179.63 |
$3.94 |
$4.13 |
$0.76 |
$0.96 |
$0.39 |
11 |
Pfizer Canada ULC |
$279.85 |
$29.50 |
$17.37 |
$7.16 |
$16.20 |
$186.75 |
$7.41 |
$9.96 |
$1.07 |
$4.13 |
$0.30 |
12 |
Sandoz Canada Inc. |
$279.30 |
$53.79 |
$33.58 |
$12.44 |
$7.49 |
$150.50 |
$6.95 |
$8.37 |
$1.30 |
$4.46 |
$0.42 |
13 |
Gilead Sciences Canada Inc. |
$260.70 |
$46.52 |
$11.52 |
$13.04 |
$6.78 |
$170.36 |
$5.31 |
$2.44 |
- |
$4.32 |
$0.40 |
14 |
Teva Canada Limited |
$256.01 |
$35.01 |
$21.33 |
$12.70 |
$12.09 |
$149.46 |
$8.39 |
$9.12 |
$1.43 |
$6.06 |
$0.41 |
15 |
Sanis Health Inc. |
$253.24 |
$20.71 |
$22.86 |
$9.05 |
$6.87 |
$173.43 |
$7.44 |
$7.45 |
$1.22 |
$3.74 |
$0.46 |
16 |
GlaxoSmithKline Inc. |
$253.16 |
$33.49 |
$29.85 |
$11.81 |
$9.78 |
$148.90 |
$7.65 |
$7.09 |
$1.26 |
$3.08 |
$0.24 |
17 |
Pharmascience Inc. |
$248.82 |
$33.22 |
$22.81 |
$12.77 |
$8.69 |
$149.14 |
$5.62 |
$8.58 |
$1.52 |
$6.28 |
$0.20 |
18 |
Celgene Inc. |
$214.44 |
$0.01 |
- |
- |
$10.37 |
$186.00 |
$5.05 |
$7.34 |
$0.74 |
$4.75 |
$0.19 |
19 |
Takeda Canada Inc. |
$210.69 |
$53.00 |
$26.98 |
$22.80 |
$17.94 |
$78.00 |
$4.60 |
$3.78 |
$1.24 |
$2.23 |
$0.12 |
20 |
Amgen Canada Inc. |
$191.06 |
$19.08 |
$14.93 |
$3.42 |
$1.19 |
$146.99 |
$3.25 |
$0.76 |
$0.06 |
$1.29 |
$0.08 |
21 |
Sivem Pharmaceuticals ULC |
$177.72 |
$18.06 |
$28.31 |
$7.51 |
$8.13 |
$94.96 |
$5.35 |
$9.74 |
$2.62 |
$3.02 |
$0.02 |
22 |
Hoffmann-La Roche Ltd |
$172.91 |
$16.04 |
$31.01 |
$17.84 |
$17.05 |
$78.24 |
$3.63 |
$4.91 |
$0.44 |
$3.06 |
$0.70 |
23 |
Eli Lilly Canada Inc. |
$135.79 |
$35.82 |
$15.87 |
$10.06 |
$8.66 |
$48.77 |
$5.00 |
$5.62 |
$1.16 |
$4.53 |
$0.31 |
24 |
Sanofi-Aventis Canada Inc. |
$123.99 |
$3.33 |
$3.52 |
$10.89 |
$4.98 |
$95.60 |
$2.03 |
$2.55 |
$0.23 |
$0.82 |
$0.03 |
25 |
Astellas Pharma Canada Inc. |
$123.45 |
$0.04 |
$3.95 |
$3.12 |
$7.97 |
$99.61 |
$3.34 |
$3.52 |
$0.53 |
$1.28 |
$0.08 |
26 |
Celltrion Healthcare Co., Ltd |
$100.69 |
$38.68 |
$29.11 |
$1.16 |
$7.82 |
$21.90 |
$1.64 |
$0.21 |
$0.02 |
$0.09 |
$0.06 |
27 |
Mylan Pharmaceuticals ULC |
$96.84 |
$14.18 |
$10.81 |
$4.80 |
$5.67 |
$50.47 |
$4.04 |
$3.44 |
$0.81 |
$2.48 |
$0.15 |
28 |
Biogen Canada Inc. |
$94.47 |
$17.86 |
$18.76 |
$6.78 |
$9.65 |
$33.93 |
$3.08 |
$2.45 |
$0.21 |
$1.45 |
$0.30 |
29 |
Allergan Inc. |
$86.09 |
$9.98 |
$1.21 |
$2.91 |
$2.17 |
$65.24 |
$1.27 |
$2.41 |
$0.35 |
$0.56 |
<$0.01 |
30 |
Vertex Pharmaceuticals |
$77.95 |
$8.42 |
$15.95 |
$5.73 |
$5.05 |
$37.36 |
$1.98 |
$0.54 |
- |
$2.52 |
$0.41 |
31 |
Samsung Bioepis Co., Ltd |
$72.84 |
$38.35 |
$9.77 |
$1.83 |
$2.19 |
$15.21 |
$4.71 |
$0.46 |
$0.11 |
$0.18 |
$0.03 |
32 |
Purdue Pharma |
$69.77 |
$5.89 |
$7.19 |
$4.62 |
$3.11 |
$43.61 |
$2.22 |
$2.45 |
$0.15 |
$0.48 |
$0.05 |
33 |
Otsuka Pharmaceutical Co., Ltd |
$66.83 |
$17.10 |
$1.92 |
$2.90 |
$1.17 |
$40.41 |
$1.68 |
$1.30 |
$0.11 |
$0.22 |
$0.02 |
34 |
Immunex Corporation |
$66.71 |
$2.07 |
$0.42 |
$6.63 |
$8.95 |
$42.14 |
$1.22 |
$3.88 |
$0.46 |
$0.82 |
$0.11 |
35 |
AA Pharma Inc. |
$66.71 |
$15.13 |
$6.38 |
$4.10 |
$2.71 |
$30.73 |
$2.27 |
$2.86 |
$0.47 |
$1.97 |
$0.08 |
36 |
ViiV Healthcare ULC |
$64.96 |
- |
- |
$2.44 |
$4.00 |
$56.44 |
$1.51 |
- |
- |
$0.40 |
$0.18 |
37 |
Alexion Pharma GmbH |
$57.58 |
- |
$9.52 |
$0.19 |
$2.21 |
$44.53 |
$0.55 |
$0.09 |
$0.47 |
- |
- |
38 |
Sanofi Genzyme, a division of Sanofi-Aventis Canada Inc. |
$55.19 |
$8.06 |
$3.35 |
$3.52 |
$3.24 |
$31.67 |
$2.00 |
$2.26 |
$0.41 |
$0.64 |
$0.05 |
39 |
BGP Pharma ULC |
$53.85 |
$13.89 |
$6.42 |
$1.93 |
$1.38 |
$26.17 |
$1.42 |
$1.85 |
$0.26 |
$0.48 |
$0.06 |
40 |
Auro Pharma Inc. |
$49.90 |
$8.74 |
$5.19 |
$2.21 |
$1.43 |
$29.26 |
$0.77 |
$1.47 |
$0.21 |
$0.52 |
$0.09 |
41 |
Taro Pharmaceuticals Inc. |
$48.30 |
$4.70 |
$3.49 |
$2.07 |
$1.98 |
$32.23 |
$1.06 |
$1.66 |
$0.30 |
$0.78 |
$0.04 |
42 |
Bausch Health, Canada Inc. |
$47.63 |
$3.51 |
$5.25 |
$1.63 |
$0.96 |
$33.19 |
$1.22 |
$1.03 |
$0.17 |
$0.67 |
$0.02 |
43 |
Leo Pharma Inc. |
$44.00 |
$2.52 |
$7.87 |
$2.46 |
$0.49 |
$29.37 |
$0.42 |
$0.37 |
$0.06 |
$0.42 |
$0.02 |
44 |
UCB Canada Inc. |
$41.80 |
$10.54 |
$4.15 |
$2.71 |
$1.22 |
$19.99 |
$0.60 |
$1.79 |
$0.26 |
$0.41 |
$0.13 |
45 |
JAMP Pharma Corporation |
$40.18 |
$5.02 |
$5.25 |
$2.06 |
$1.22 |
$23.53 |
$1.19 |
$0.98 |
$0.22 |
$0.69 |
$0.03 |
46 |
Organon Canada Inc. |
$36.26 |
$3.21 |
$2.84 |
$0.92 |
$0.46 |
$26.24 |
$1.32 |
$0.64 |
$0.13 |
$0.46 |
$0.03 |
47 |
Marcan Pharmaceuticals Inc. |
$32.91 |
$3.57 |
$3.21 |
$1.82 |
$1.01 |
$20.06 |
$0.64 |
$1.54 |
$0.17 |
$0.82 |
$0.07 |
48 |
Ipsen Biopharmaceuticals Canada Inc. |
$29.24 |
$0.13 |
$1.08 |
$0.12 |
$2.77 |
$21.12 |
$1.27 |
$1.90 |
- |
$0.79 |
$0.06 |
49 |
TerSera Therapeutics, LLC |
$28.45 |
- |
- |
$0.01 |
$0.02 |
$25.38 |
$0.78 |
$1.50 |
$0.22 |
$0.45 |
$0.09 |
50 |
Sun Pharma Canada Inc. |
$28.38 |
$4.14 |
$3.03 |
$1.13 |
$0.59 |
$17.47 |
$0.70 |
$0.72 |
$0.12 |
$0.44 |
$0.05 |
Total |
$9,451.25 |
$1,018.19 |
$851.95 |
$455.11 |
$399.94 |
$6,087.67 |
$225.33 |
$237.27 |
$40.27 |
$124.79 |
$10.71 |
|
Data source: National Prescription Drug Utilization Information System Database, Canadian Institute for Health Information.