
Biologics in Canada. Part 1: Market Trends, 2018
May 2020
ISBN 978-0-660-34594-9
Cat. no.: H82-50/1-2020E-PDF
Table of Contents
Acknowledgements
This report was prepared by the Patented Medicine Prices Review Board (PMPRB) as part of the National Prescription Drug Utilization Information System (NPDUIS) initiative.
The PMPRB wishes to acknowledge and thank the members of the NPDUIS Advisory Committee for their expert oversight and guidance in the preparation of this chartbook. Please note that the statements, findings, and conclusions do not necessarily reflect those of the members or their organizations.
Appreciation goes to Jared Berger for leading this project, as well as to Jeffrey Menzies, Elena Lungu, and Tanya Potashnik and for their oversight in its development. The PMPRB also wishes to acknowledge Nevzeta Bosnic for providing direction in the development of the analysis; Patrick McConnell, Blake Wladyka, and Jun Yu for their contribution to the analysis; and the editorial staff Carol McKinley, Sarah Parker, and Shirin Paynter.
Disclaimer
NPDUIS operates independently of the regulatory activities of the Board of the PMPRB. The research priorities, data, statements, and opinions expressed or reflected in NPDUIS reports do not represent the position of the PMPRB with respect to any regulatory matter. NPDUIS reports do not contain information that is confidential or privileged under sections 87 and 88 of the Patent Act, and the mention of a medicine in a NPDUIS report is not and should not be understood as an admission or denial that the medicine is subject to filings under sections 80, 81, or 82 of the Patent Act or that its price is or is not excessive under section 85 of the Patent Act.
Although this information is based in part on data obtained from the NPDUIS Database of the Canadian Institute for Health Information (CIHI) and under license from IQVIA’s MIDAS® Database, Payer Insights database, and Private Pay Direct Drug Plan database, the statements, findings, conclusions, views, and opinions expressed in this report are exclusively those of the PMPRB and are not attributable to CIHI or IQVIA.
Contact Information
Patented Medicine Prices Review Board
Standard Life Centre
Box L40
333 Laurier Avenue West
Suite 1400
Ottawa, ON K1P 1C1
Tel.: 1-877-861-2350
TTY 613-288-9654
Email: PMPRB.Information-Renseignements.CEPMB@pmprb-cepmb.gc.ca
Introduction
Biologic medicines are an important segment of the global pharmaceutical market. In Canada, sales of biologics reached $7.7 billion in 2018, placing Canada among the top-ranked countries in the Organisation for Economic Co-operation and Development (OECD) in terms of per capita spending.
Given the high use and cost of biologics in Canada, biosimilars offer an opportunity for significant cost savings. However, despite being on the market for over a decade, the savings from biosimilars have yet to be fully realized.
This analysis examines the market dynamics of biologics in Canada and compares Canadian and international trends in sales, pricing, and biosimilar uptake.
This overview of the biologic space sets the stage for the second publication in this two-part chartbook series. Biologics in Canada. Part 2: Biosimilar Savings, 2018 uses recent Canadian and international trends to expose the current and future cost savings that could be realized through increasing the uptake and/or lowering the prices of biosimilars in Canada.
Background
Biologics are a class of medicines formed from living organisms or from their cells using advanced biotechnology processes. They are typically larger and more complex than chemically produced pharmaceutical drugs. In Canada, biologic drugs are listed in Schedule D of the Food and Drugs Act.
Health Canada defines a biosimilar as a biologic drug that is highly similar to a biologic drug that was already authorized for sale. There are no expected clinically meaningful differences in efficacy and safety between a biosimilar and the originator or reference biologic.
Biologics are a high-growth segment of the pharmaceutical market. Sales of biologic medicines in Canada have tripled over the last decade, increasing by 14.6% in the last year alone. Canadian approved biologics also demonstrated a strong growth internationally, with median OECD sales for these medicines almost doubling over the same time period.
The first biosimilar was introduced in Canada in 2009. By 2018, a total of nine biologic medicines had one or more biosimilars approved for sale in Canada, offering the promise of lower prices and market competition. However, biosimilar sales only amounted to $146 million in 2018 or 1.9% of the $7.7 billion biologic market.
This is a complex market space, and while there has been a successful uptake of biosimilars in many other countries, Canada has lagged behind. One clear example of this is the billion dollar Canadian market for infliximab. In 2018, the originator biologic, Remicade, still accounted for the vast majority of infliximab sales although biosimilars had been available for a number of years.
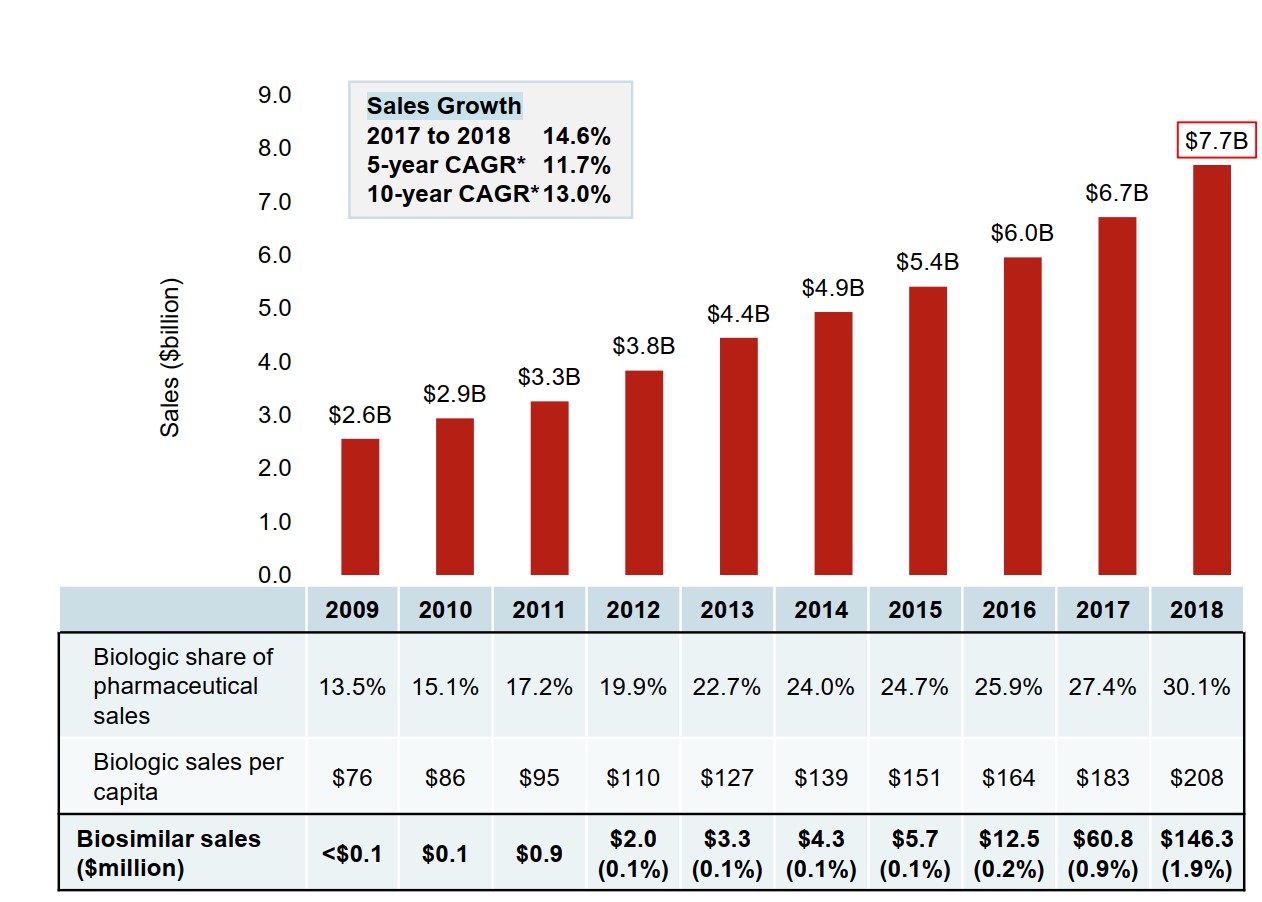
Figure description
A bar graph depicts the sales growth of biologic medicines in Canada, with annual sales reported in billions of dollars for each year from 2009 to 2018. Below, a table reports the share of biologic sales as a percentage of the total prescription pharmaceutical market for each year, as well as the annual biologic sales per capita. Sales for biosimilars are given in millions of dollars from 2009 to 2018, and as a share of biologic sales from 2012 to 2018. The growth rate in sales from 2017 to 2018 (14.6%) as well as the 5-year (11.7%) and 10-year (13.0%) compound annual growth rates are also given.
| 2009 | 2010 | 2011 | 2012 | 2013 | 2014 | 2015 | 2016 | 2017 | 2018 | |
|---|---|---|---|---|---|---|---|---|---|---|
| Canadian sales in billions of dollars | $2.6 | $2.9 | $3.3 | $3.8 | $4.4 | $4.9 | $5.4 | $6.0 | $6.7 | $7.7 |
| Biologic share of pharmaceutical sales | 13.5% | 15.1% | 17.2% | 19.9% | 22.7% | 24.0% | 24.7% | 25.9% | 27.4% | 30.1% |
| Biologic sales per capita | $76 | $86 | $95 | $110 | $127 | $139 | $151 | $164 | $183 | $208 |
| Biosimilar sales in millions of dollars | <$0.1 | $0.1 | $0.9 | $2.0 | $3.3 | $4.3 | $5.7 | $12.5 | $60.8 | $146.3 |
| Biosimilar sales as a share of all biologic sales | – | – | – | 0.1% | 0.1% | 0.1% | 0.1% | 0.2% | 0.9% | 1.9% |
Note: Includes all prescription biologics and insulin biologics sold in Canada as of 2018.
* CAGR, compound annual growth rate.
Data source: IQVIA MIDAS® Database, prescription retail and hospital markets, 2018. All rights reserved.
Methods and Limitations
This analysis focuses on biologic medicines with sales in the Canadian market as of 2018.
(1) List of Medicines
Biologic medicines were selected for analysis based on the following criteria:
- Biologic (Schedule D) as per Health Canada’s Drug Product Database (DPD) and
- Prescription biologic (Schedule- Prescription) as per Health Canada’s DPD
All insulin biologics were included in the analysis, regardless of whether they required a prescription in Canada.
(2) International Analysis
Biologics containing the same medicinal ingredients as those identified in the List of Medicines were included in the international analysis.
The international markets examined include the Organisation for Economic Co-operation and Development (OECD) members, with a focus on the seven countries the PMPRB currently considers in reviewing the prices of patented medicines (PMPRB7): France, Germany, Italy, Sweden, Switzerland, the United Kingdom, and the United States.
(3) Canadian Market Analysis
The results reported for the private and public drug plans in Canada reflect the biologics selected for this study. This selection may vary from other PMPRB reports.
Drug costs reported are the amounts accepted toward reimbursement and do not reflect off-invoice price rebates or price reductions resulting from confidential product listing agreements.
Exclusions: To improve consistency in the analysis of international comparisons, certain therapeutic classes, such as sera and immunoglobulins and diagnostic agents were excluded from the sample analyzed.
1. International Sales and Price Comparison
Biologic medicines account for a significant share of global pharmaceutical sales.
This section reports on the market dynamics of biologics approved in Canada, exploring domestic and international trends for these medicines.
The results primarily reflect the sales and use of originator biologics, as they make up almost the entire Canadian market.
Biologic medicines account for almost one third of the total pharmaceutical sales in Canada
The biologic medicines approved in Canada also made up a large share of pharmaceutical sales in international markets. The median OECD sales share of these medicines was 26.5% in 2018, slightly lower than in Canada, which ranked fourth among the OECD countries.
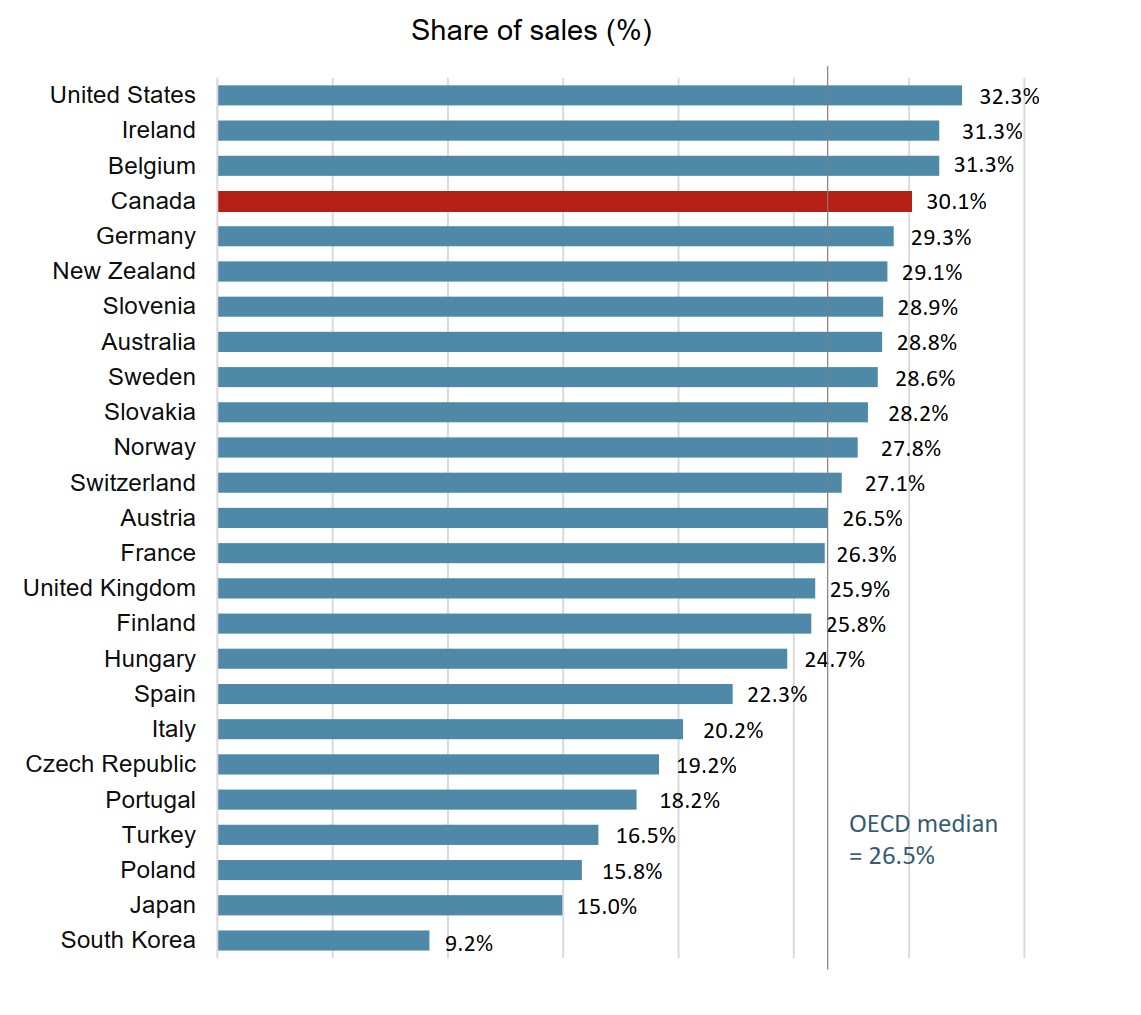
Figure description
A bar graph gives the biologic share of total pharmaceutical sales in 2018 for each country in the Organisation for Economic Co-operation and Development. The median for all countries listed was 26.5%.
| Country | Biologic share of sales |
|---|---|
| United States | 32.3% |
| Ireland | 31.3% |
| Belgium | 31.3% |
| Canada | 30.1% |
| Germany | 29.3% |
| New Zealand | 29.1% |
| Slovenia | 28.9% |
| Australia | 28.8% |
| Sweden | 28.6% |
| Slovakia | 28.2% |
| Norway | 27.8% |
| Switzerland | 27.1% |
| Austria | 26.5% |
| France | 26.3% |
| United Kingdom | 25.9% |
| Finland | 25.8% |
| Hungary | 24.7% |
| Spain | 22.3% |
| Italy | 20.2% |
| Czech Republic | 19.2% |
| Portugal | 18.2% |
| Turkey | 16.5% |
| Poland | 15.8% |
| Japan | 15.0% |
| South Korea | 9.2% |
Note: The analysis includes all prescription biologics and insulin biologics sold in Canada as of 2018.
Countries with limited sales data were excluded from this analysis.
Data source: IQVIA MIDAS® Database, prescription retail and hospital markets, 2018. All rights reserved.
Canada spends more on biologics per capita than almost all other industrialized countries
Canadians spent an average of $208 per person on biologic medicines in 2018. This represented the third highest per capita sales among the OECD countries, well above the international median of $135.
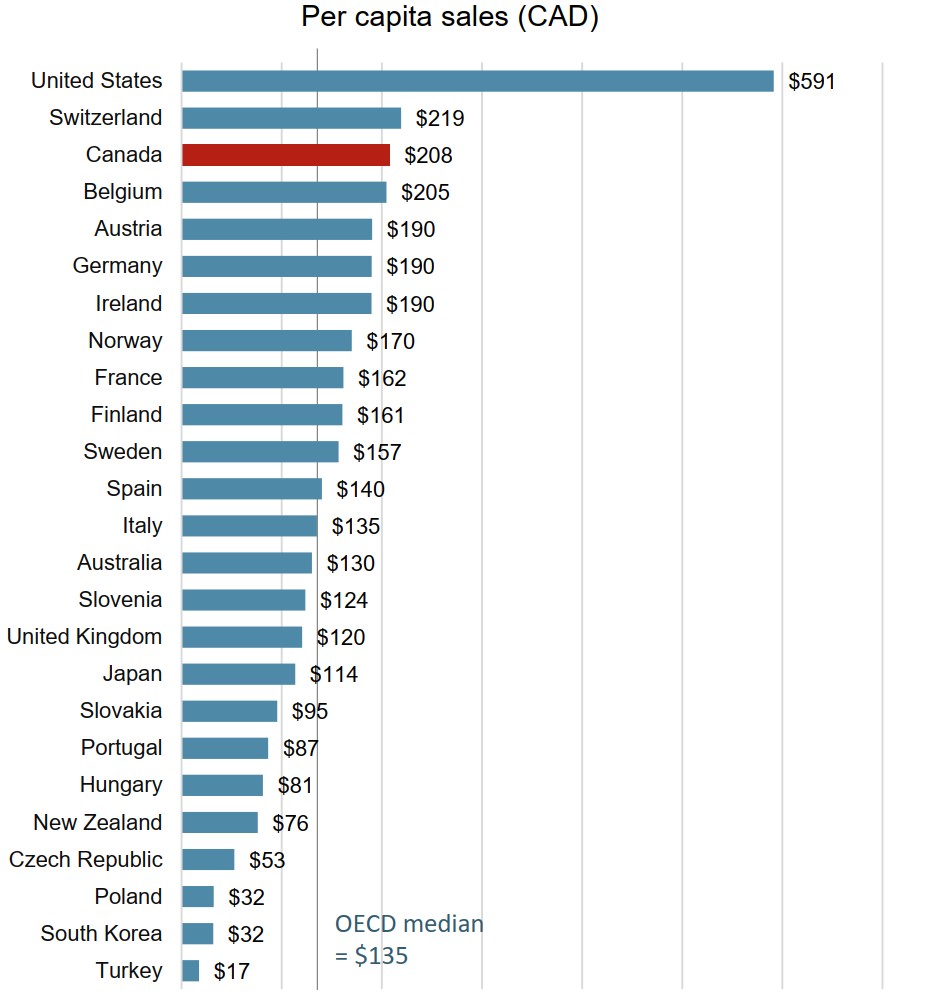
Figure description
A bar graph gives the sales per capita for biologic medicines in 2018 for each country in the Organisation for Economic Co-operation and Development. The median biologic sales per capita for all countries listed was $135.
| Country | Biologic sales per capita |
|---|---|
| United States | $591 |
| Switzerland | $219 |
| Canada | $208 |
| Belgium | $205 |
| Austria | $190 |
| Germany | $190 |
| Ireland | $190 |
| Norway | $170 |
| France | $162 |
| Finland | $161 |
| Sweden | $157 |
| Spain | $140 |
| Italy | $135 |
| Australia | $130 |
| Slovenia | $124 |
| United Kingdom | $120 |
| Japan | $114 |
| Slovakia | $95 |
| Portugal | $87 |
| Hungary | $81 |
| New Zealand | $76 |
| Czech Republic | $53 |
| Poland | $32 |
| South Korea | $32 |
| Turkey | $17 |
Note: The analysis includes all prescription biologics and insulin biologics sold in Canada as of 2018.
Countries with limited sales data were excluded from this analysis.
Data source: IQVIA MIDAS® Database, prescription retail and hospital markets, 2018. All rights reserved.
Canadian prices for originator biologics are among the highest in the OECD
The average price of originator biologics in Canada was the fourth highest in the OECD in 2018. While average US prices were considerably higher than those of any other country, the international median price was 16% lower than the Canadian level.
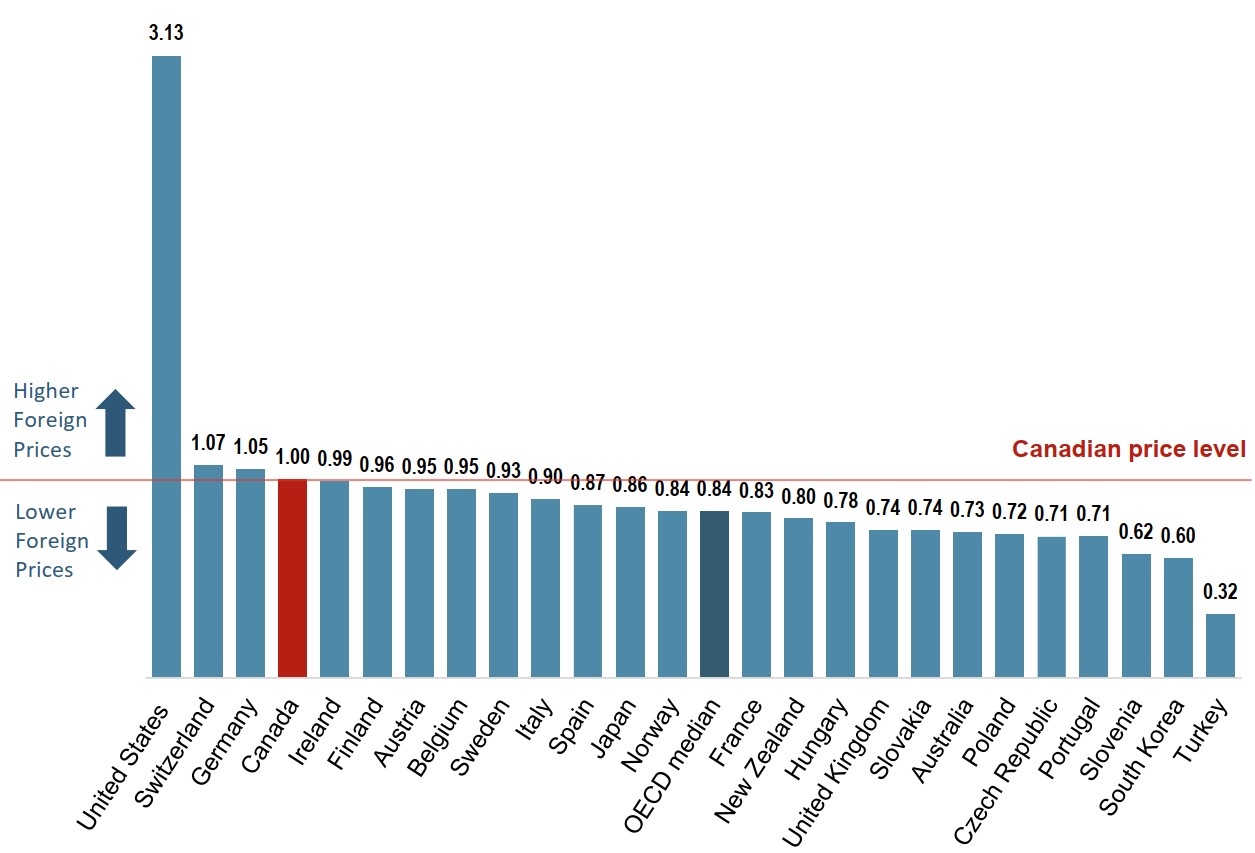
Figure description
A bar graph gives average bilateral foreign-to-Canadian price ratios for the originator biologic medicines available in Canada for the Organisation for Economic Co-operation and Development countries in 2018. The median for all countries listed was 0.84.
| Country | Share |
|---|---|
| United States | 3.13 |
| Switzerland | 1.07 |
| Germany | 1.05 |
| Canada | 1.00 |
| Ireland | 0.99 |
| Finland | 0.96 |
| Austria | 0.95 |
| Belgium | 0.95 |
| Sweden | 0.93 |
| Italy | 0.90 |
| Spain | 0.87 |
| Japan | 0.86 |
| Norway | 0.84 |
| France | 0.83 |
| New Zealand | 0.80 |
| Hungary | 0.78 |
| United Kingdom | 0.74 |
| Slovakia | 0.74 |
| Australia | 0.73 |
| Poland | 0.72 |
| Czech Republic | 0.71 |
| Portugal | 0.71 |
| Slovenia | 0.62 |
| South Korea | 0.60 |
| Turkey | 0.32 |
Note: The analysis includes all originator prescription biologics and insulin biologics sold in Canada as of 2018.
Countries with limited sales data were excluded from this analysis.
For details on how foreign-to-Canadian price ratios are calculated, see the reference documents section of the Analytical Studies page on the PMPRB website.
Data source: IQVIA MIDAS® Database, prescription retail and hospital markets, 2018. All rights reserved.
2. Biologic Market in Canada
Biologics are specialty medicines that generally have high treatment costs. This section explores the cost of these medicines to public and private payers in Canada.
The analysis of public payers focuses on the jurisdictions participating in the NPDUIS initiative: all of the provincial public plans (with the exception of Quebec), Yukon, and the Non-Insured Health Benefits (NIHB) Program. These plans together account for approximately one third of the total annual spending on prescription drugs in Canada.
Note that plan designs, reimbursement policies, and reporting practices, as well as variations in the demographic and disease profiles of the beneficiary populations, vary widely across jurisdictions and limit comparability of the results.
The 10 top-selling originator biologics account for over half of all biologic sales in Canada
In Canada, the sales of originator biologics are highly concentrated, with the 10 top-selling medicines accounting for 55% of biologic sales or 17% of the total pharmaceutical market in 2018.
Table 2.1 Market share for the 10 top-selling originator biologics in Canada, 2018
| Originator biologic (medicine) | Sales ($million) | Share of biologic sales | Share of pharmaceutical sales |
|---|---|---|---|
| Remicade (infliximab) | $1,081 | 14.1% | 4.2% |
| Humira (adalimumab) | $800 | 10.4% | 3.1% |
| Eylea (aflibercept) | $493 | 6.4% | 1.9% |
| Stelara (ustekinumab) | $338 | 4.4% | 1.3% |
| Lucentis (ranibizumab) | $317 | 4.1% | 1.2% |
| Enbrel (etanercept) | $291 | 3.8% | 1.1% |
| Lantus (insulin glargine) | $273 | 3.5% | 1.1% |
| Rituxan (rituximab) | $266 | 3.5% | 1.0% |
| Keytruda (pembrolizumab) | $202 | 2.6% | 0.8% |
| Herceptin (trastuzumab) | $186 | 2.4% | 0.7% |
| Total | $5,534 | 55.2% | 16.6% |
Note: Sales are reported at the trade name level and include all indications.
Data source: IQVIA MIDAS® Database, prescription retail and hospital markets, 2018. All rights reserved.
High-cost medicines account for 70% of biologic spending in Canada
Biologic medicines with average annual costs exceeding $10,000 made up $5.4 billion of the $7.7 billion in biologic sales in 2018.
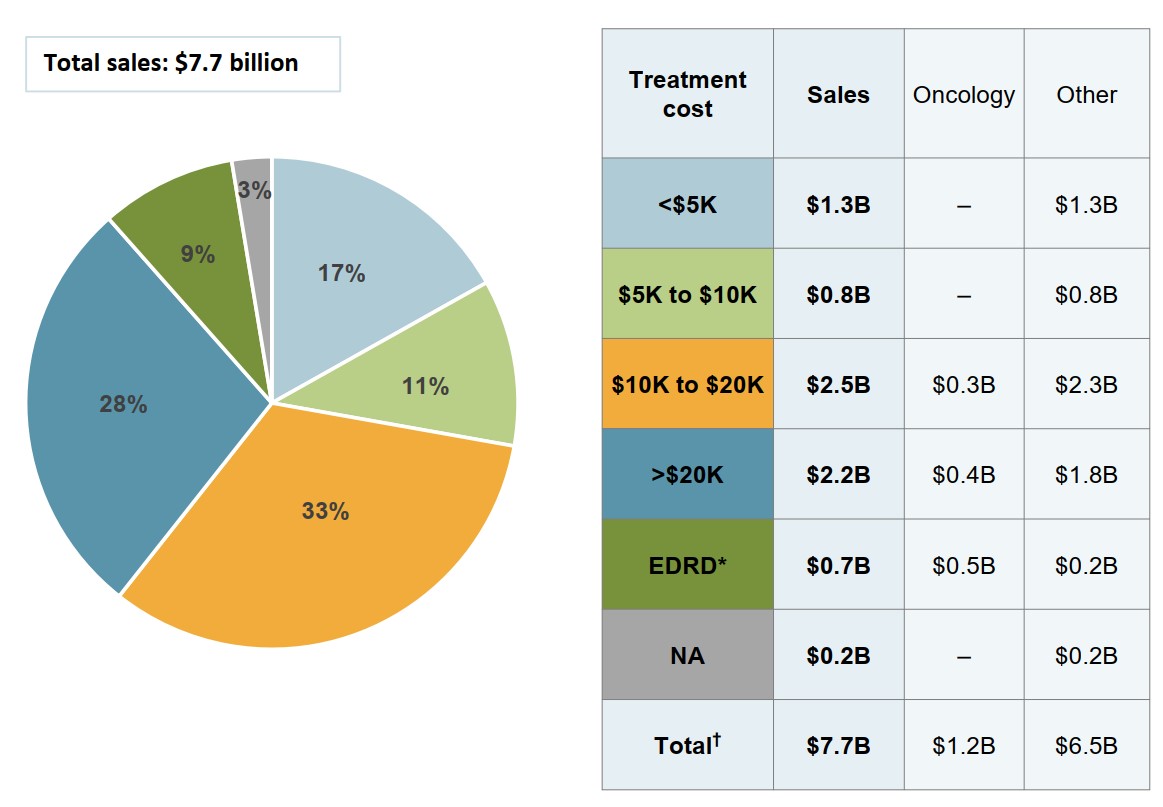
Figure description
A pie chart gives the distribution of Canadian biologic sales in 2018 by annual treatment cost. Treatment costs are divided into the following categories: less than $5,000; $5,000 to $10,000; $10,000 to $20,000; greater than $20,000; and expensive drugs for rare diseases, which are defined as medicines having an orphan designation from the US Food and Drug Administration or the European Medicines Agency and an annual treatment cost greater than $100,000 for non-oncology medicines or $7,500 per 28-day course of treatment for oncology medicines. A share is also given for medicines without available treatment costs. Total sales were $7.7 billion.
Treatment cost |
Share of sales |
| Less than $5,000 | 17% |
| $5,000 to $10,000 | 11% |
| $10,000 to $20,000 | 33% |
| Greater than $20,000 | 28% |
| Expensive drugs for rare diseases | 9% |
| No treatment cost available | 3% |
An accompanying table gives the sales of medicines in each range of treatment costs, in billions of dollars, as well as the distribution of these sales by oncology and non-oncology medicines.
| Treatment cost | Total sales, in billions of dollars | Oncology sales, in billions of dollars | Non-oncology sales, in billions of dollars |
|---|---|---|---|
| Less than $5,000 | $1.3 | – | $1.3 |
| $5,000 to $10,000 | $0.8 | – | $0.8 |
| $10,000 to $20,000 | $2.5 | $0.3 | $2.3 |
| Greater than $20,000 | $2.2 | $0.4 | $1.8 |
| Expensive drugs for rare diseases | $0.7 | $0.5 | $0.2 |
| No treatment cost available | $0.2 | – | $0.2 |
| Total | $7.7 | $1.2 | $6.5 |
Note: Annual treatment costs are based on average annual per beneficiary costs for public and private plans.
* Expensive drugs for rare diseases (EDRDs) are defined as medicines having an FDA or EMA orphan designation and an annual treatment cost greater than $100,000 for non-oncology medicines or $7,500 per 28-day course of treatment for oncology medicines.
† Values may not add to totals due to rounding.
Data sources: National Prescription Drug Utilization Information System Database, Canadian Institute for Health Information; IQVIA Private Pay Direct Drug Plan Database, 2018; IQVIA MIDAS® Database, prescription retail and hospital markets, 2018 (all rights reserved).
Biologics make up an important market segment for both public and private payers in Canada
Spending on biologic medicines made up 27.3% of the drug costs for both public and private plans with data reported in 2018.
The retail market for biologics in Canada is almost equally split between public and private payers. The variation across jurisdictions is influenced by individual plan designs.
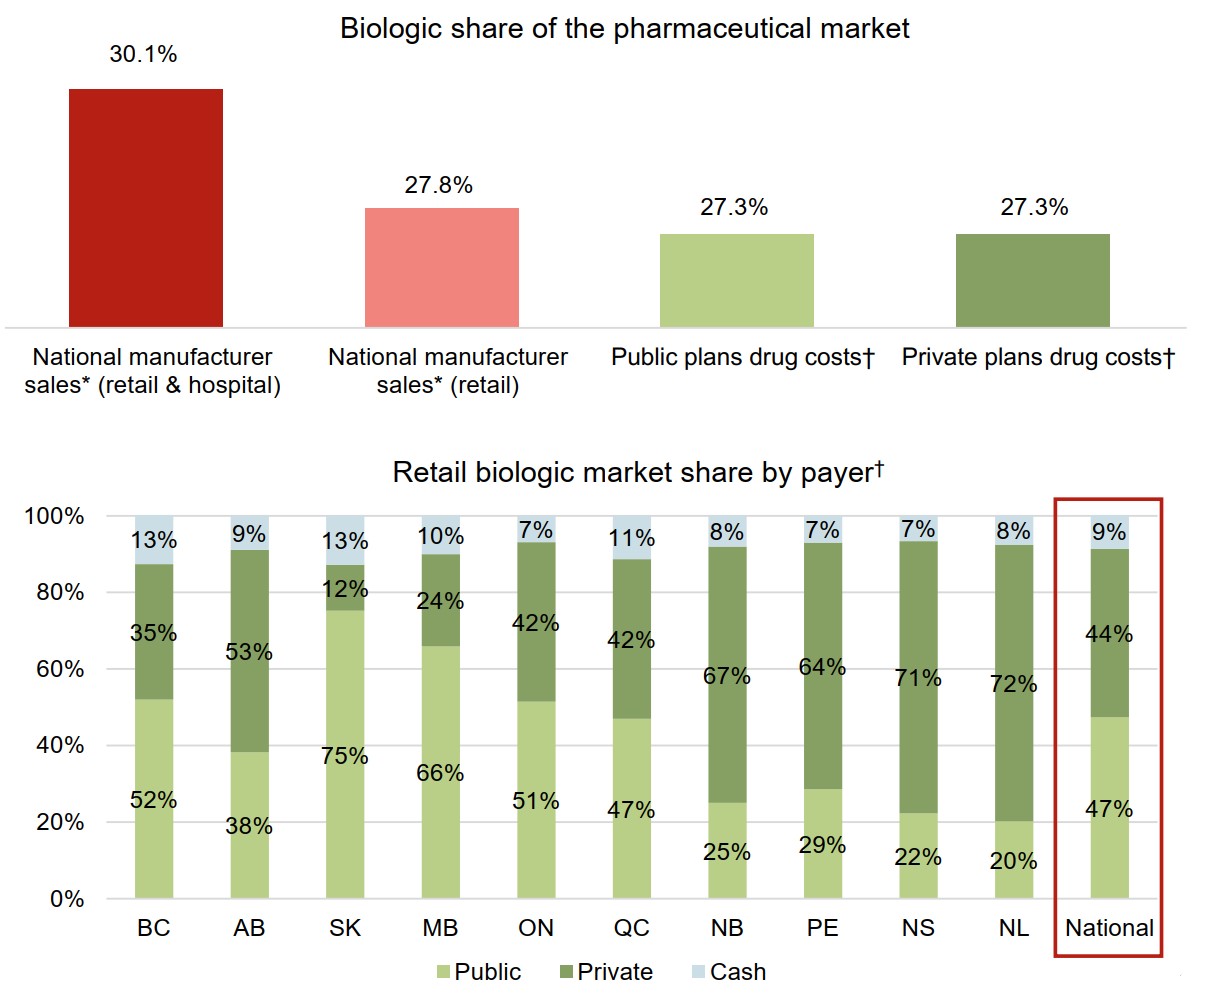
Figure description
Two bar graphs illustrate the distribution of the Canadian biologic medicine market by payer in 2018. The first gives the biologic medicine share of pharmaceutical sales or costs for each payer, while the second presents the distribution of the retail market across the provinces by payer (public, private, or cash).
a) Biologic share of the pharmaceutical market
| Payer | Market share |
|---|---|
| National manufacturer sales (retail and hospital) | 30.1% |
| National manufacturer sales (retail) | 27.8% |
| Public plans drug costs | 27.3% |
| Private plans drug costs | 27.3% |
b) Retail biologic market share by payer
| British Columbia | Alberta | Saskatchewan | Manitoba | Ontario | Quebec | New Brunswick | Prince Edward Island | Nova Scotia | Newfoundland and Labrador | National | |
|---|---|---|---|---|---|---|---|---|---|---|---|
| Public | 52% | 38% | 75% | 66% | 51% | 47% | 25% | 29% | 22% | 20% | 47% |
| Private | 35% | 53% | 12% | 24% | 42% | 42% | 67% | 64% | 71% | 72% | 44% |
| Cash | 13% | 9% | 13% | 10% | 7% | 11% | 8% | 7% | 7% | 8% | 9% |
* At manufacturer price levels.
† Drug costs include markups but exclude dispensing costs.
Data source:
National: IQVIA MIDAS® Database, prescription retail and hospital markets, 2018. All rights reserved.
Public plans: National Prescription Drug Utilization Information System Database, Canadian Institute for Health Information.
Private plans: IQVIA Private Pay Direct Drug Plan Database, 2018.
Market share by payer: IQVIA Payer Insights Database, 2018.
Biologics account for a disproportionately high share of drug plan costs compared to their share of claims
Although biologic medicines represented 27% of the total drug costs for Canadian public and private plans in 2018, their share of claims was much lower, at 1.5% and 1.9%, respectively. This is due, in part, to the high cost of biologics relative to other types of medicines. Also, because they are delivered by infusion or injection, many biologics may not be dispensed as frequently as other medicines.
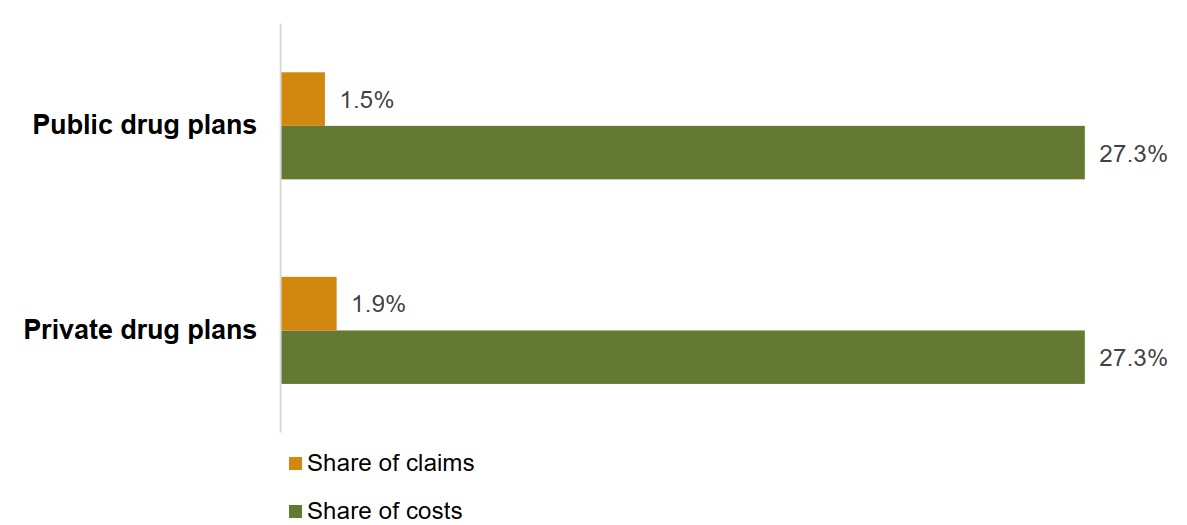
Figure description
A bar graph compares the share of claims and share of costs represented by biologic medicines in Canadian public and private drug plans for 2018.
| Share of costs | Share of claims | |
|---|---|---|
| Private drug plans | 27.3% | 1.9% |
| Public drug plans | 27.3% | 1.5% |
Note: Drug costs include markups but exclude dispensing costs.
Data source:
Public plans: National Prescription Drug Utilization Information System Database, Canadian Institute for Health Information.
Private plans: IQVIA Private Pay Direct Drug Plan Database, 2018.
There is a marked variation in the biologic share of costs and claims across Canadian public and private drug plans
The variation among provinces is influenced, in part, by the types of public drug program offered in each jurisdiction and the medicines that they cover.
The biologic share of drug costs in the private market in each province is likely impacted by their coverage in the public drug programs.
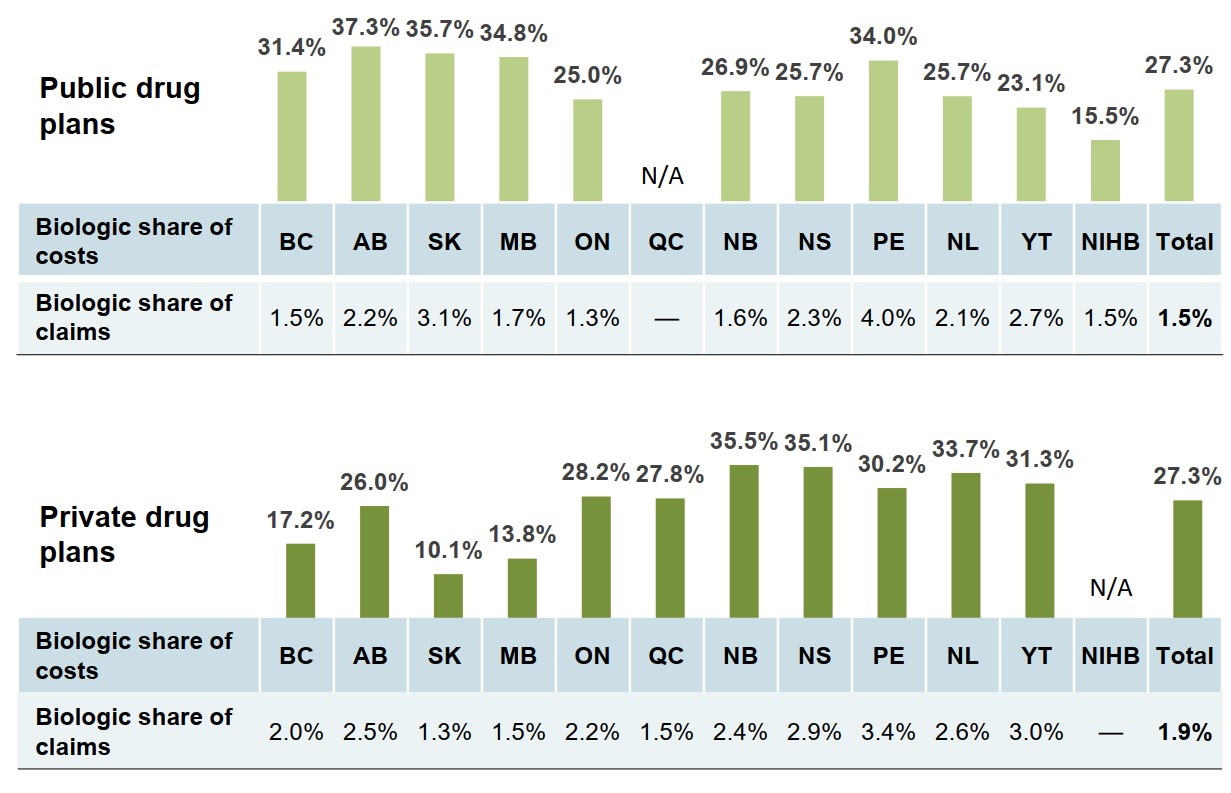
Figure description
Two bar graphs give the 2018 biologic share of total costs by jurisdiction for Canadian public and private drug plans. A table below each graph gives the biologic share of total claims for each jurisdiction.
a) Public drug plans
| Biologic share of costs | Biologic share of claims | |
|---|---|---|
| British Columbia | 31.4% | 1.5% |
| Alberta | 37.3% | 2.2% |
| Saskatchewan | 35.7% | 3.1% |
| Manitoba | 34.8% | 1.7% |
| Ontario | 25.0% | 1.3% |
| Quebec | – | – |
| New Brunswick | 26.9% | 1.6% |
| Nova Scotia | 25.7% | 2.3% |
| Prince Edward Island | 34.0% | 4.0% |
| Newfoundland and Labrador | 25.7% | 2.1% |
| Yukon | 23.1% | 2.7% |
| Non-Insured Health Benefits | 15.5% | 1.5% |
| Total | 27.3% | 1.5% |
b) Private drug plans
| Biologic share of costs | Biologic share of claims | |
|---|---|---|
| British Columbia | 17.2% | 2.0% |
| Alberta | 26.0% | 2.5% |
| Saskatchewan | 10.1% | 1.3% |
| Manitoba | 13.8% | 1.5% |
| Ontario | 28.2% | 2.2% |
| Quebec | 27.8% | 1.5% |
| New Brunswick | 35.5% | 2.4% |
| Nova Scotia | 35.1% | 2.9% |
| Prince Edward Island | 30.2% | 3.4% |
| Newfoundland and Labrador | 33.7% | 2.6% |
| Yukon | 31.3% | 3.0% |
| Non-Insured Health Benefits | – | – |
| Total | 27.3% | 1.9% |
Data source:
Public plans: National Prescription Drug Utilization Information System Database, Canadian Institute for Health Information.
Private plans: IQVIA Private Pay Direct Drug Plan Database, 2018.
3. Biosimilar Uptake and Pricing
An increasing number of biosimilars have entered the market in recent years. While European countries have experienced some success in terms of early market entry, price discounts, and uptake, Canada has lagged behind.
This section explores some of the differences between Canadian and international markets in terms of the number of biosimilar approvals, as well as uptake and pricing, based on publicly available information. It also looks more closely at the uptake of individual biosimilar medicines available in Canada.
The time between the approval and first sales of biosimilars medicines in a market is influenced by a variety of factors including the length of the remaining patent protection for the originator biologic and any relevant patent litigation, as well as the manufacturer's decision to launch a biosimilar and the timing of that decision.
An increasing number of biosimilars have received market approval in recent years
As of the end of 2018, biosimilars for 15 distinct biologic medicines were approved by the European Medicines Agency (EMA), the US Food and Drug Administration (FDA), or Health Canada, with the majority introduced to the market within the last four years.
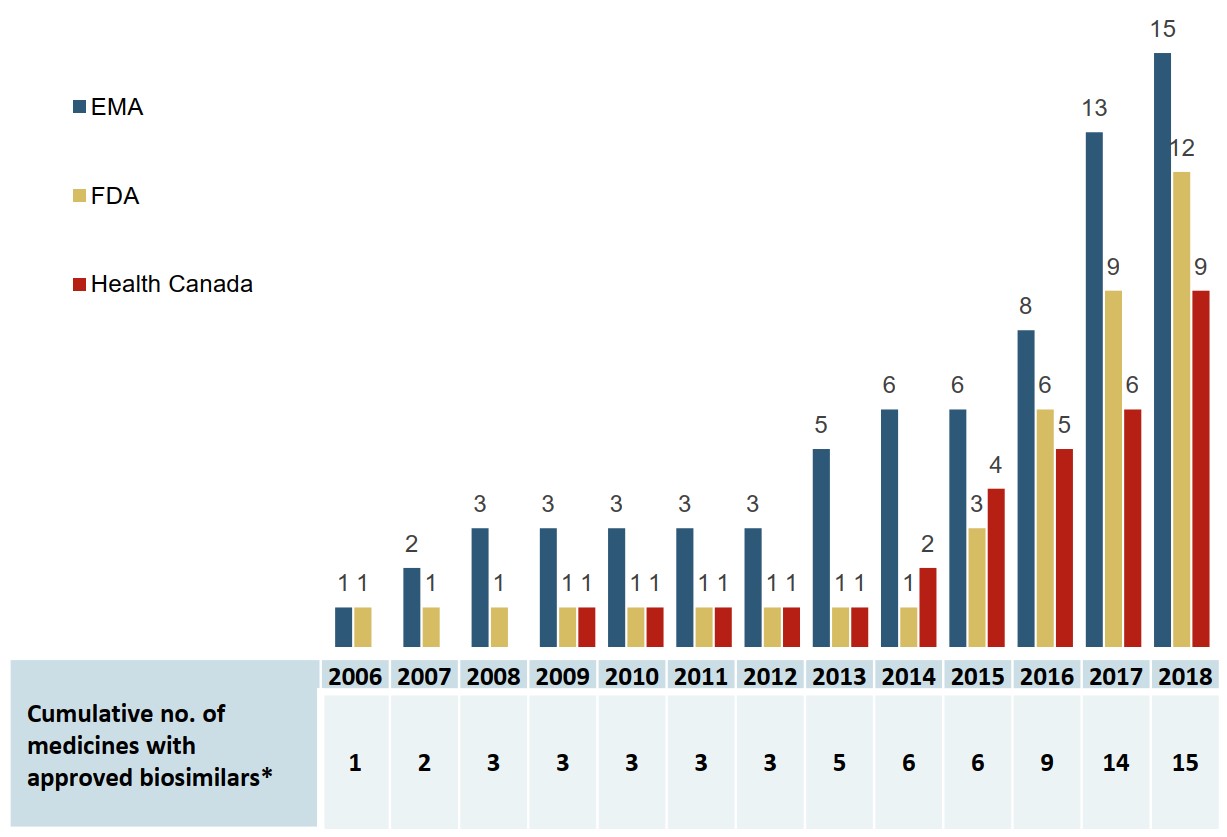
Figure description
A bar graph gives the cumulative number of medicines with biosimilars approved from 2006 to 2018 by each of three regulatory agencies: the Food and Drug Administration in the United States, the European Medicines Agency, and Health Canada. A table below gives the total cumulative number of medicines with approved biosimilars across all three jurisdictions.
| 2006 | 2007 | 2008 | 2009 | 2010 | 2011 | 2012 | 2013 | 2014 | 2015 | 2016 | 2017 | 2018 | |
|---|---|---|---|---|---|---|---|---|---|---|---|---|---|
| European Medicines Agency | 1 | 2 | 3 | 3 | 3 | 3 | 3 | 5 | 6 | 6 | 8 | 13 | 15 |
| US Food and Drug Administration | 1 | 1 | 1 | 1 | 1 | 1 | 1 | 1 | 1 | 3 | 6 | 9 | 12 |
| Health Canada | - | - | - | 1 | 1 | 1 | 1 | 1 | 2 | 4 | 5 | 6 | 9 |
| Cumulative number of medicines with approved biosimilars | 1 | 2 | 3 | 3 | 3 | 3 | 3 | 5 | 6 | 6 | 9 | 14 | 15 |
* All available trade names are counted as one biosimilar medicine (e.g., multiple biosimilar trade names referencing the same originator biologic).
Data source: US Food and Drug Administration (FDA), European Medicines Agency (EMA), and Health Canada databases.
Canada lags behind Europe in the number of biosimilars approved and marketed
By the end of 2018, Health Canada had approved biosimilars for 9 of the 15 biologic medicines, and 5 of these had recorded sales in Canada. By comparison, biosimilars for all 15 medicines were approved in Europe, and there were recorded sales for all but 2.
In 2019, biosimilars for trastuzumab and rituximab were approved by Health Canada and recorded first sales. In addition, first sales were recorded for three other biosimilar medicines: bevacizumab, insulin lispro, and pegfilgrastim.
Table 3.1 Initial biosimilar approvals and market availability in Europe, the US, and Canada as of Q4-2018
| Medicine (originator biologic) | Europe | United States | Canada | |||
|---|---|---|---|---|---|---|
| Approval | First sales | Approval | First sales | Approval | First sales | |
| Infliximab (Remicade) | Sept-13 | Q4-2013 | Apr-16 | Q4-2016 | Jan-14 | Q1-2015 |
| Adalimumab (Humira) | Mar-17 | Q4-2018 | Sept-16 | – | May-18 | – |
| Etanercept (Enbrel) | Jan-16 | Q1-2016 | Aug-16 | – | Aug-16 | Q4-2016 |
| Trastuzumab (Herceptin) | Nov-17 | Q2-2018 | Dec-17 | – | – | – |
| Insulin glargine (Lantus) | Sept-14 | Q2-2015 | Dec-15* | Q4-2016 | Sept-15 | Q1-2016 |
| Rituximab (MabThera/Rituxan) | Feb-17 | Q2-2017 | Nov-18 | – | – | – |
| Filgrastim (Neupogen) | Sept-08 | Q4-2008 | Mar-15 | Q3-2015 | Dec-15 | Q2-2016 |
| Bevacizumab (Avastin) | Jan-18 | – | Sept-17 | – | Apr-18 | – |
| Epoetin alfa (Eprex/Erypo) | Aug-07 | Q4-2007 | May-18 | Q3-2018 | – | – |
| Insulin lispro (Humalog) | Jul-17 | Q4-2017 | Dec-17* | Q1-2018 | Nov-17 | – |
| Enoxaparin† (Clexane/Lovenox) |
Sept-16 | Q1-2017 | N/A | N/A | – | – |
| Pegfilgrastim (Neulasta) | Sept-18 | Q4-2018 | Jun-18 | Q3-2018 | Apr-18 | – |
| Somatropin (Genotropin) | Apr-06 | Q2-2006 | May-06* | Q1-2007 | Apr-09 | Q3-2009 |
| Teriparatide (Forsteo/Forteo) | Jan-17 | – | * | – | – | – |
| Follitropin alfa (GONAL-f) | Sept-13 | Q2-2014 | – | – | – | – |
| Total | 15 | 13 | 12 | 7 | 9 | 5 |
* Approved or will be approved via 505(b)(2) pathway in the United States.
† Lovenox was not approved under a Biologic License Application in the US. While generic versions of the originator medicine have been approved under the FDA’s Abbreviated New Drug Application, they are not reflected in this analysis.
Data source: US Food and Drug Administration (FDA), European Medicines Agency (EMA), and Health Canada databases. IQVIA MIDAS® Database, prescription retail and hospital markets, 2018. All rights reserved.
The prices of some biosimilars are markedly higher in Canada
Despite offering comparable discounts, prices of four of the five biosimilars sold in Canada were higher than in international markets in 2018. This was likely due to the variation in the prevailing originator prices.
For example, although Canada had a greater biosimilar discount for insulin glargine, the average price level in the OECD was 23% lower than the price in Canada in the last quarter of 2018.
Table 3.2 Prices and discount rates of biosimilars with sales as of Q4-2018
| Medicine | Biosimilar price in Canada (CAD) | Foreign-to-Canadian price ratios | Biosimilar discount relative to price† of originator biologic | |||
|---|---|---|---|---|---|---|
| PMPRB7* | OECD | Canada | Median PMPRB7* | Median OECD | ||
| Infliximab | $535.95 | 1.09 | 0.83 | 45.8% | 33.2% | 35.5% |
| Adalimumab | – | – | – | – | 26.4% | 34.9% |
| Etanercept | $259.68 | 0.91 | 0.82 | 34.3% | 31.1% | 30.8% |
| Insulin glargine | $14.31 | 0.84 | 0.77 | 23.6% | 16.6% | 20.3% |
| Rituximab | – | – | – | – | 27.5% | 28.5% |
| Trastuzumab | – | – | – | – | 25.9% | 29.5% |
| Filgrastim | $166.41 | 0.61 | 0.37 | 21.0% | 36.4% | 51.4% |
| Epoetin alfa | – | – | – | – | 34.6% | 35.9% |
| Insulin lispro | – | – | – | – | 17.3% | 21.8% |
| Enoxaparin | – | – | – | – | 22.9% | 22.9% |
| Pegfilgrastim | – | – | – | – | – | 28.0% |
| Somatropin | $262.42 | 1.70 | 1.01 | ‡ | 28.8% | 37.6% |
| Follitropin alfa | – | – | – | – | 16.9% | 20.5% |
| Sales-weighted average | 0.85 | 0.61 | 30.0% | 26.0% | 30.7% | |
Note: Prices and discounts are reported as sales-weighted averages of all available forms and strengths.
* France, Germany, Italy, Sweden, Switzerland, the United Kingdom, and the United States.
† The median discounts were calculated based on the price of the biosimilar as of Q4-2018 and the originator in the quarter before biosimilar introduction.
‡ Could not be calculated due to data limitations.
Data source: IQVIA MIDAS® Database, prescription retail and hospital markets, Q4-2018. All rights reserved.
Biosimilar uptake in Canada is relatively modest compared to other OECD markets
At the end of 2018, only the somatropin biosimilar had outpaced international uptake. Even after considering the time of launch, the uptake of infliximab, etanercept, and insulin glargine biosimilars in Canada lagged behind other countries.
Filgrastim, with a biosimilar uptake of 71.5%, was much closer to the international norms. This medicine, which is prescribed for acute indications, is predominantly prescribed to treatment-naïve patients, which may account for its higher uptake.
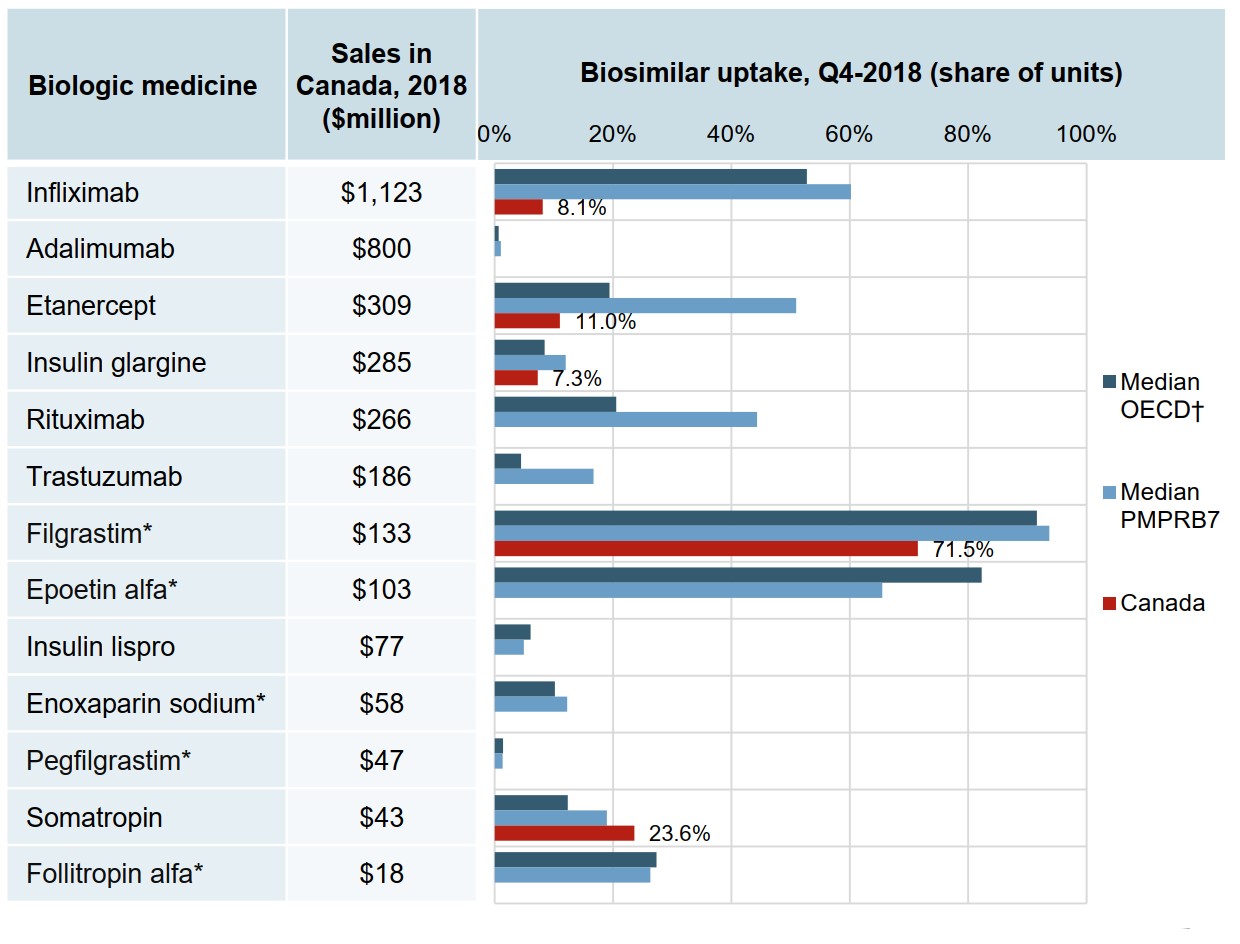
Figure description
A bar graph reports the biosimilar uptake, in share of units, for Canada, the PMPRB7, and the Organisation for Economic Co-operation and Development as of the fourth quarter of 2018. The graph compares the uptake for biologic medicines with biosimilar availability in Canada. Total 2018 Canadian sales for each medicine are also given.
| Biologic medicine | Sales in Canada, 2018, in millions of dollars | Biosimilar uptake, Q4-2018, share of units | ||
|---|---|---|---|---|
| Median OECD | Median PMPRB7 | Canada | ||
| Infliximab | $1,123 | 52.7% | 60.2% | 8.1% |
| Adalimumab | $800 | 0.7% | 1.0% | 0.0% |
| Etanercept | $309 | 19.4% | 50.9% | 11.0% |
| Insulin glargine | $285 | 8.4% | 12.0% | 7.3% |
| Rituximab | $266 | 20.5% | 44.3% | 0.0% |
| Trastuzumab | $186 | 4.5% | 16.7% | 0.0% |
| Filgrastim* | $133 | 91.6% | 93.7% | 71.5% |
| Epoetin alfa* | $103 | 82.3% | 65.5% | 0.0% |
| Insulin lispro | $77 | 6.1% | 4.9% | 0.0% |
| Enoxaparin sodium* | $58 | 10.2% | 12.3% | 0.0% |
| Pegfilgrastim* | $47 | 1.4% | 1.3% | 0.0% |
| Somatropin | $43 | 12.4% | 19.0% | 23.6% |
| Follitropin alfa* | $18 | 27.3% | 26.3% | 0.0% |
* Generally used to treat acute conditions.
† Canada is excluded from the median OECD value.
Data source: IQVIA MIDAS® Database, prescription retail and hospital markets, 2018. All rights reserved.
Factors that may influence biosimilar uptake in Canada
| Factor | Description |
|---|---|
Interchangeability |
In Canada, as in most countries, biosimilars are not interchangeable with the reference biologic
|
Payer policies |
Most Canadian public payers have implemented policies of reimbursing the biosimilar for naïve patients – with limited impact, as nothing prevents the physician from prescribing a different brand-name medicine |
Switching |
Switching from an ongoing biologic treatment to an approved biosimilar has not been encouraged in Canada until recently
|
Maintaining market share |
Strategies/initiatives undertaken by the manufacturer of the originator biologic that may limit the uptake of biosimilars:
|
4. Infliximab Case Study
Infliximab was one of the first biologic medicines with biosimilar sales in Canada.
Although the biosimilar Inflectra was first sold in Canada in 2015, its uptake has been limited, and by the end of 2018 the originator biologic Remicade still maintained a significant market share. This analysis examines the relative use and costs of Remicade and Inflectra in Canadian public drug plans within the context of their therapeutic class of disease-modifying antirheumatic drugs (DMARDs).
This section also compares the overall Canadian experience with the policy-driven uptake of infliximab biosimilars in international markets. These policies include switching, which is a physician-driven decision to exchange one medicine for another during the course of treatment, and substitution, which is the practice of dispensing an alternate medicine at the pharmacy level without consulting the prescriber.
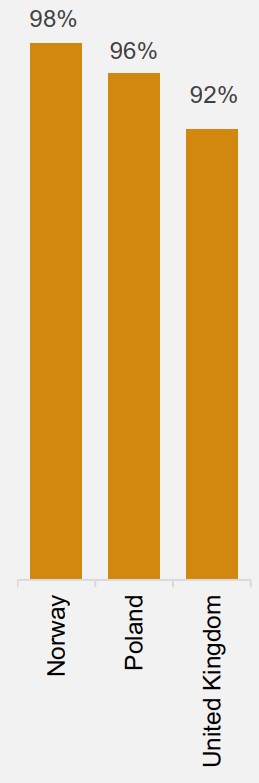
Canada lags well behind other OECD countries in terms of infliximab biosimilar uptake
The uptake of Inflectra in Canada was only 8% in 2018, well below the OECD median of 46% for infliximab biosimilars.
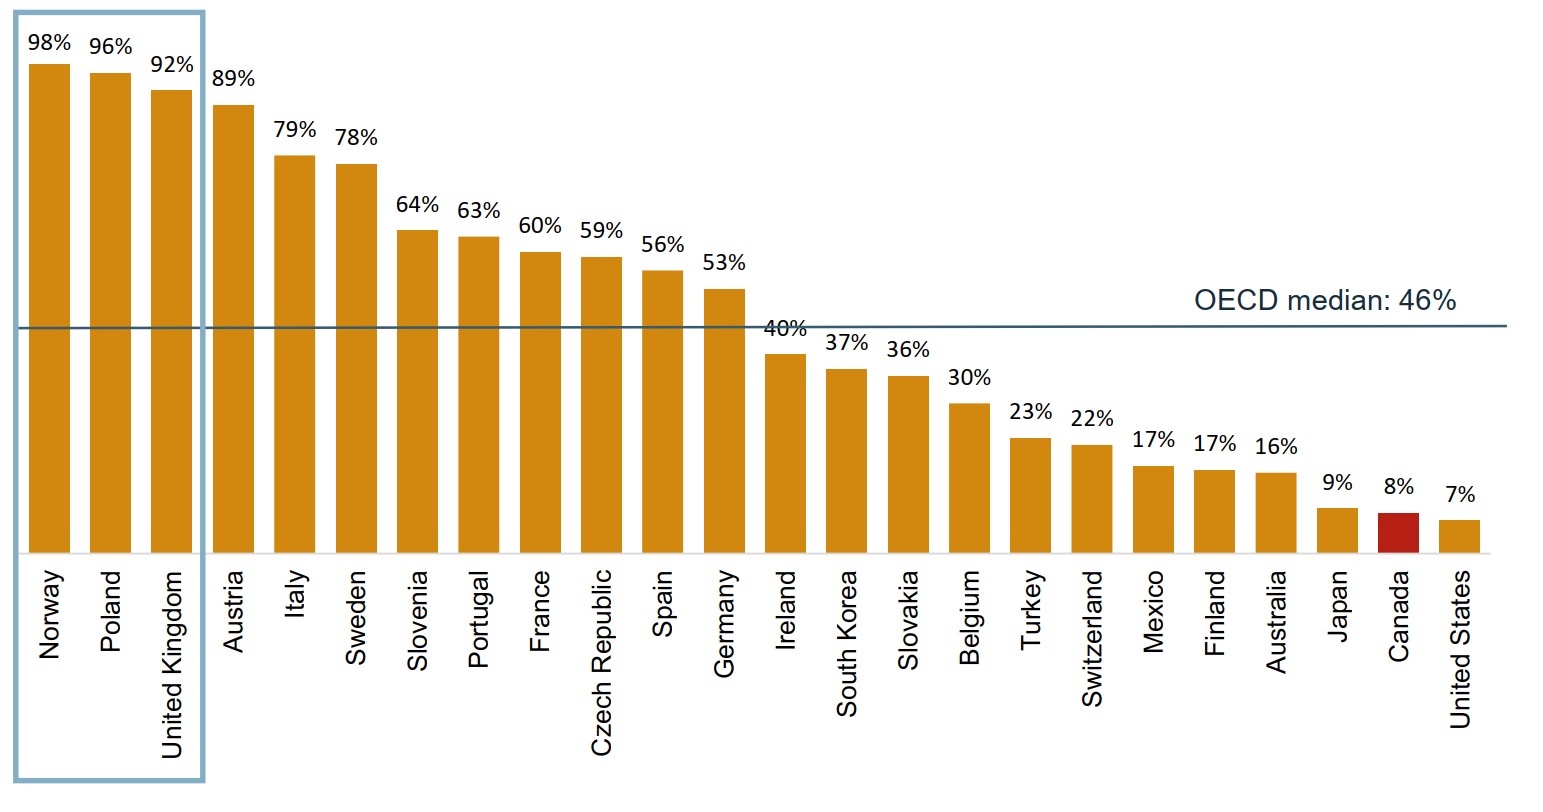
Figure description
A bar graph gives the uptake for infliximab biosimilars for each country in the Organisation for Economic Co-operation and Development as a share of all infliximab units sold in the fourth quarter of 2018. Countries with limited sales data were excluded from this analysis. The median for all countries listed was 46%.
| Country | Share of units |
|---|---|
| Norway | 98% |
| Poland | 96% |
| United Kingdom | 92% |
| Austria | 89% |
| Italy | 79% |
| Sweden | 78% |
| Slovenia | 64% |
| Portugal | 63% |
| France | 60% |
| Czech Republic | 59% |
| Spain | 56% |
| Germany | 53% |
| Ireland | 40% |
| South Korea | 37% |
| Slovakia | 36% |
| Belgium | 30% |
| Turkey | 23% |
| Switzerland | 22% |
| Mexico | 17% |
| Finland | 17% |
| Australia | 16% |
| Japan | 9% |
| Canada | 8% |
| United States | 7% |
Note: Countries with limited data were excluded from the analysis.
Data source: IQVIA MIDAS® Database, prescription retail and hospital markets, Q4-2018. All rights reserved.
International success in biosimilar uptake is driven by high-impact policies and initiatives
The uptake of infliximab biosimilars in Norway, Poland, and the United Kingdom exceeded 90% in 2018, well above the OECD median.
| Norway | National single-winner tender – Physicians are required to prescribe the cheapest
medicine (hospital use and some outpatient use products). |
| Poland | Substitution – Biosimilar substitution is allowed. Tendering – Patients are required to use the tender winning medicine. Initiation – Therapy-naïve patients with IBD should be initiated on the biosimilar. Switching – The Ministry of Health “takes the view that any exchange within the scope of drugs containing infliximab at any level of therapy is permissible.”* |
| United Kingdom | Initiation – The treatment should be initiated with the cheapest available biologic medicine. Switching – Pilot switching programmes from Remicade to biosimilars of infliximab were found to be highly acceptable to patients and clinicians. Guidance – The National Health Service in England recommended that 9 out of 10 new patients should be initiated on the best value medicine within 3 months of a biosimilar launch, and at least 80% of existing patients should be switched to the best value biologic within 12 months. |
Figure description
- Norway – 98% biosimilar share of units
- Poland – 96% biosimilar share of units
- United Kingdom – 92% biosimilar share of units
* Medicines for Europe, Biosimilar Medicines Sector Group. 2019. Positioning statements on physician-led switching for biosimilar medicines. Brussels, Belgium.
Data source:
For graph: IQVIA MIDAS® Database, prescription retail and hospital markets, Q4-2018. All rights reserved.
For table: International Policies on the Appropriate Use of Biosimilar Drugs, CADTH.
Additional references consulted for biosimilar policies and initiatives in Poland and the United Kingdom:
Moorkens E, Vulto AG, Huys I, et al. 2017. Policies for biosimilar uptake in Europe: An overview. PLoS ONE. 12(12): e0190147.
Braun J, Kudrin A. 2016. Switching to biosimilar infliximab (CT-P13): Evidence of clinical safety, effectiveness and impact on public health. Biologicals. 44(4): 257-266.
Rémuzat C, Kapuśniak A, Caban A, et al. 2017. Supply-side and demand-side policies for biosimilars: an overview in 10 European member states. Journal of Market Access and Health Policy. 5(1).
National Health Service (NHS) England. 2018. NHS set to save £150 million by switching to new versions of most costly drug.
Only a small number of patients using Remicade switch to the biosimilar
Patients already established on treatments make up most of the biologic DMARD market.
While infliximab continued to account for 30% of the biologic DMARD patients and 45% of the drug costs for Canadian public plans in 2017/18, Inflectra only represented 1% of patients and 0.6% of costs.
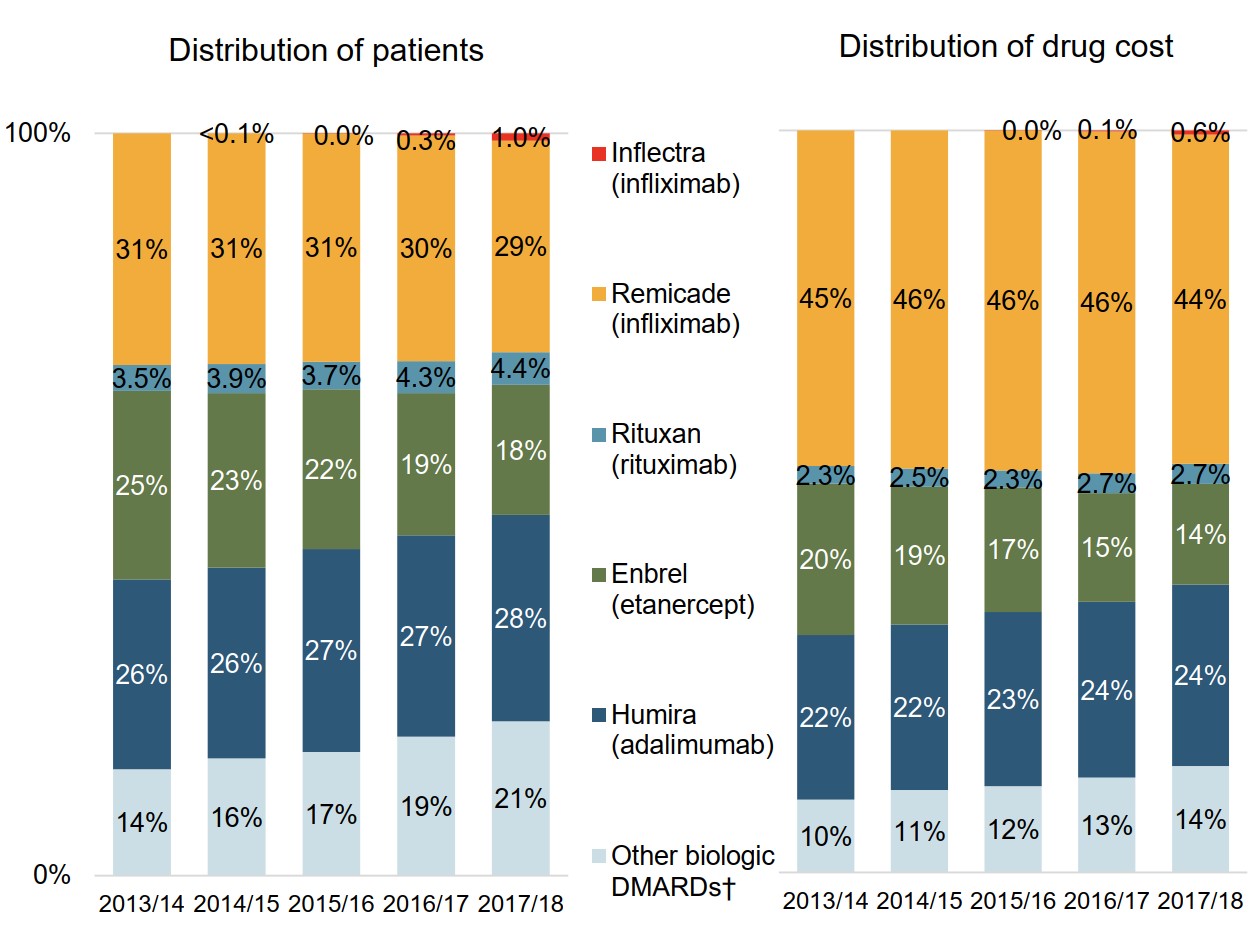
Figure description
Two stacked bar graphs present trends in the market distribution for biologic disease-modifying antirheumatic drugs in Canadian public drug plans from 2013/14 to 2017/18. The first graph shows the distribution of established patients on a biologic disease-modifying antirheumatic by drug, while the second gives the distribution of drug costs.
| 2013/14 | 2014/15 | 2015/16 | 2016/17 | 2017/18 | |
|---|---|---|---|---|---|
| Inflectra (infliximab): distribution of patients | – | <0.1% | 0.0% | 0.3% | 1.0% |
| Inflectra (infliximab): drug cost distribution | – | – | 0.0% | 0.1% | 0.6% |
| Remicade (infliximab): distribution of patients | 31% | 31% | 31% | 30% | 29% |
| Remicade (infliximab): drug cost distribution | 45% | 46% | 46% | 46% | 44% |
| Rituxan (rituximab): distribution of patients | 3.5% | 3.9% | 3.7% | 4.3% | 4.4% |
| Rituxan (rituximab): drug cost distribution | 2.3% | 2.5% | 2.3% | 2.7% | 2.7% |
| Enbrel (etanercept): distribution of patients | 25% | 23% | 22% | 19% | 18% |
| Enbrel (etanercept): drug cost distribution | 20% | 19% | 17% | 15% | 14% |
| Humira (adalimumab): distribution of patients | 26% | 26% | 27% | 27% | 28% |
| Humira (adalimumab): drug cost distribution | 22% | 22% | 23% | 24% | 24% |
| Other biologic DMARDs: distribution of patients | 14% | 16% | 17% | 19% | 21% |
| Other biologic DMARDs: drug cost distribution | 10% | 11% | 12% | 13% | 14% |
Note: Results apply to Canadian public drug plans participating in the NPDUIS initiative.
* Disease-modifying antirheumatic drugs are commonly used in the treatment of rheumatoid arthritis as well as other inflammatory conditions such as plaque psoriasis and inflammatory bowel disease.
† Includes Simponi, Orencia, Actemra, and Cimzia.
Data source: National Prescription Drug Utilization Information System Database, Canadian Institute for Health Information.
Switching patients to biosimilars could result in significant savings
Patients using biologic DMARDs made up less than 1% of the eligible beneficiaries in public plans in fiscal year 2017/18, but accounted for over 10% of all drug costs.
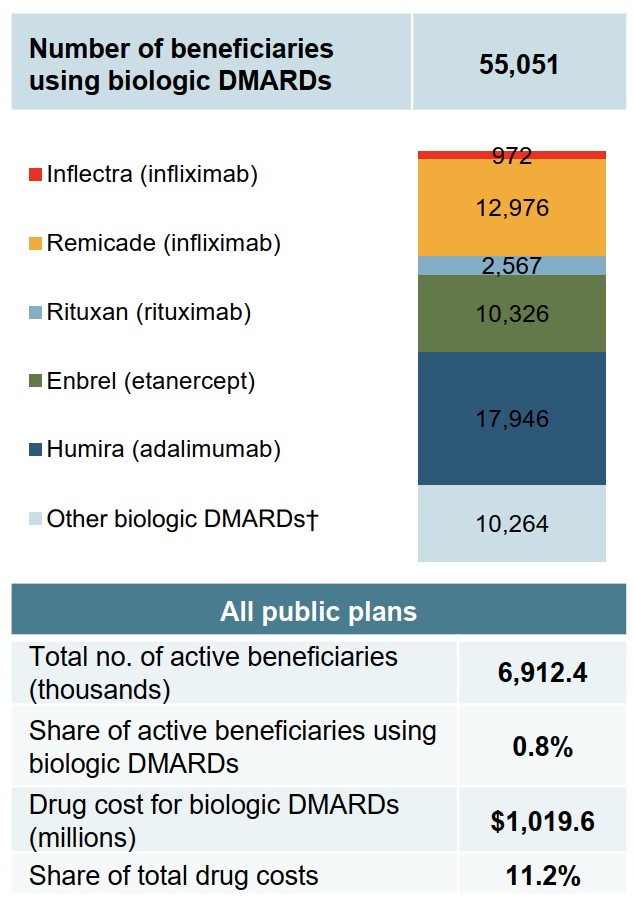
Figure description
A bar graph shows the number of beneficiaries in Canadian public drug plans that were using a biologic disease-modifying antirheumatic drug in 2017/18.
| Drug | Number of beneficiaries |
|---|---|
| Inflectra (infliximab) | 972 |
| Remicade (infliximab) | 12,976 |
| Rituxan (rituximab) | 2,567 |
| Enbrel (etanercept) | 10,326 |
| Humira (adalimumab) | 17,946 |
| Other biologic DMARDs | 10,264 |
| Total | 55,051 |
A summary table presents the total number of active beneficiaries across all public plans (6,912,400), the share of active beneficiaries using a biologic disease-modifying antirheumatic drug (0.8%), the total drug cost for biologic disease-modifying antirheumatic drugs ($1,019.6 million), and their share of total drug costs (11.2%).
Note: Results apply to Canadian public drug plans participating in the NPDUIS initiative.
* Disease-modifying antirheumatic drugs are commonly used in the treatment of rheumatoid arthritis as well as other inflammatory conditions such as plaque psoriasis and inflammatory bowel disease.
† Includes Simponi, Orencia, Actemra, and Cimzia.
Data source: National Prescription Drug Utilization Information System Database, Canadian Institute for Health Information.
Biosimilar Initiatives in Canada
Given the high cost of biologics in Canada, biosimilars offer the potential for important savings. Recently, Canadian payers have undertaken a number of initiatives to increase biosimilar uptake, which are outlined in the table below.
The second part in the Biologics in Canada chartbook series will explore the potential for increased biosimilar savings in more detail.
| Payer | Initiative | |
|---|---|---|
Public payers |
Quebec |
Quebec only reimburses the lowest priced version of infliximab. |
Manitoba |
New patients are required to try two Tier 1 medicines before being reimbursed for a Tier 2 medicine; Tier 1 biologic medicines have been determined to be the most cost-effective. |
|
British Columbia |
In 2019, British Columbia became the first Canadian province to initiate a switch to biosimilar medicines for patients covered under the PharmaCare program. Under the policy, patients using Enbrel, Remicade, and Lantus for specific indications are required to switch to the biosimilar. |
|
Alberta |
Alberta announced that all patients taking Enbrel, Remicade, Lantus, Neupogen, Neulasta, and Copaxone for indications ranging from rheumatoid arthritis to diabetes and multiple sclerosis will be required to switch to the biosimilar. |
|
Private payers |
Green Shield Canada (GSC) initiated a pilot program in 2018. The program targeted patients taking Remicade and Enbrel for three rheumatic conditions and reduced reimbursement to the biosimilar price. Under the program, the patient could switch to the biosimilar or remain on the biologic and pay the cost difference. Since then, GSC has opened its biosimilar transition program to any sponsor who wishes to take part. |
|